| Georgia | 001-07434 | 58-1167100 | ||||||||||||
| (State or other jurisdiction | (Commission | (IRS Employer | ||||||||||||
| of incorporation) | File Number) | Identification No.) | ||||||||||||
| 1932 Wynnton Road | Columbus | Georgia | 31999 | |||||||||||
| (Address of principal executive offices) | (Zip Code) | |||||||||||||
| ☐ | Written communications pursuant to Rule 425 under the Securities Act (17 CFR 230.425) | |||||||
| ☐ | Soliciting material pursuant to Rule 14a-12 under the Exchange Act (17 CFR 240.14a-12) | |||||||
| ☐ | Pre-commencement communications pursuant to Rule 14d-2(b) under the Exchange Act (17 CFR 240.14d-2(b)) | |||||||
| ☐ | Pre-commencement communications pursuant to Rule 13e-4(c) under the Exchange Act (17 CFR 240.13e-4(c)) | |||||||
| Title of each class | Trading Symbol(s) | Name of each exchange on which registered | ||||||||||||
| Common Stock, $.10 Par Value | AFL | New York Stock Exchange | ||||||||||||
| Exhibit Number | Exhibit Title or Description | |||||||||||||
Press release of Aflac Incorporated dated August 1, 2022 |
||||||||||||||
Financial Analyst Briefing Supplement for Second Quarter 2022 |
||||||||||||||
| Transcript of comments in video presentation by Max Brodén, Executive Vice President and Chief Financial Officer of Aflac Incorporated. | ||||||||||||||
| Slides referenced in video presentation by Max Brodén, Executive Vice President and Chief Financial Officer of Aflac Incorporated. | ||||||||||||||
| 104 | Cover Page Interactive Data File (the cover page XBRL tags are embedded within the Inline XBRL document) |
|||||||||||||
| Aflac Incorporated | ||||||||||||||
| August 1, 2022 | /s/ June Howard | |||||||||||||
| (June Howard) | ||||||||||||||
| Senior Vice President, Financial Services | ||||||||||||||
| Chief Accounting Officer | ||||||||||||||

| AFLAC INCORPORATED AND SUBSIDIARIES CONDENSED INCOME STATEMENT | ||||||||||||||||||||
| (UNAUDITED – IN MILLIONS, EXCEPT FOR SHARE AND PER-SHARE AMOUNTS) | ||||||||||||||||||||
| THREE MONTHS ENDED JUNE 30, | 2022 | 2021 | % Change | |||||||||||||||||
| Total revenues | $ | 5,400 | $ | 5,564 | (2.9) | % | ||||||||||||||
| Benefits and claims, net | 2,298 | 2,653 | (13.4) | |||||||||||||||||
| Total acquisition and operating expenses | 1,401 | 1,538 | (8.9) | |||||||||||||||||
| Earnings before income taxes | 1,701 | 1,373 | 23.9 | |||||||||||||||||
| Income taxes | 313 | 268 | ||||||||||||||||||
| Net earnings | $ | 1,388 | $ | 1,105 | 25.6 | % | ||||||||||||||
| Net earnings per share – basic | $ | 2.17 | $ | 1.63 | 33.1 | % | ||||||||||||||
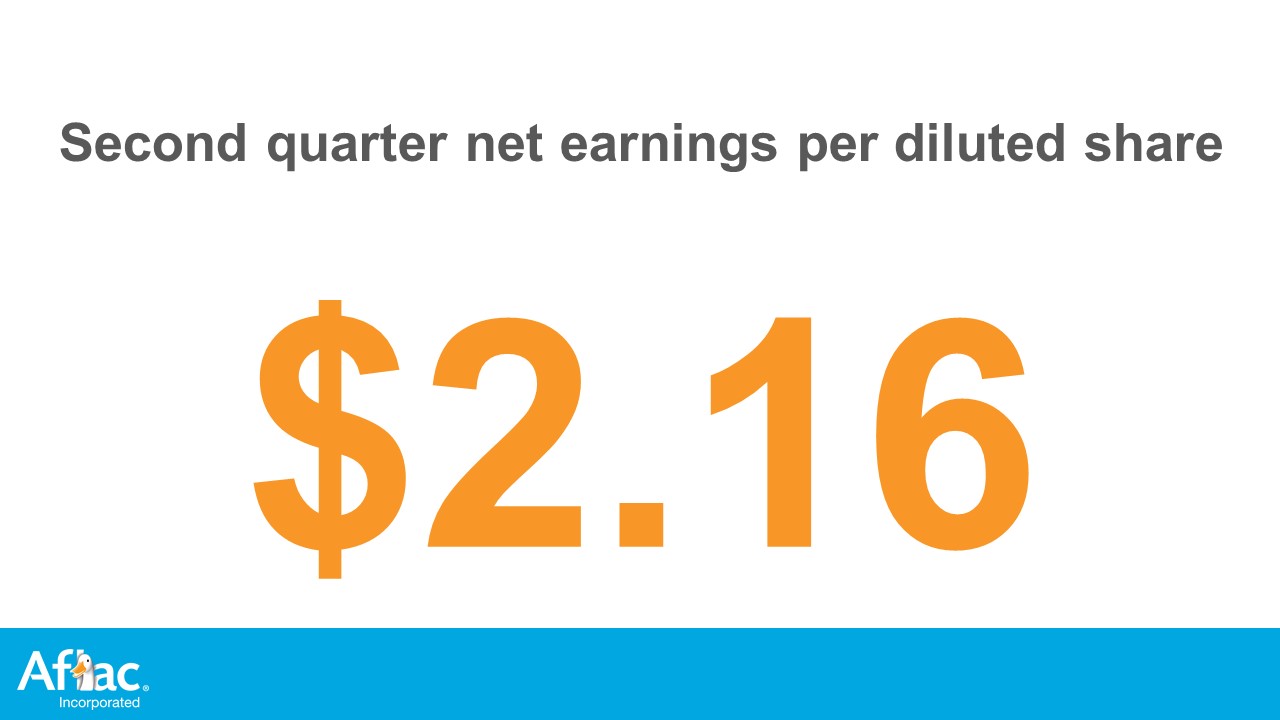
| Net earnings per share – diluted | 2.16 | 1.62 | 33.3 | |||||||||||||||||
| Shares used to compute earnings per share (000): | ||||||||||||||||||||
| Basic | 640,707 | 678,050 | (5.5) | % | ||||||||||||||||
| Diluted | 643,243 | 680,920 | (5.5) | |||||||||||||||||
| Dividends paid per share | $ | 0.40 | $ | 0.33 | 21.2 | % | ||||||||||||||
| AFLAC INCORPORATED AND SUBSIDIARIES CONDENSED INCOME STATEMENT | ||||||||||||||||||||
| (UNAUDITED – IN MILLIONS, EXCEPT FOR SHARE AND PER-SHARE AMOUNTS) | ||||||||||||||||||||
| SIX MONTHS ENDED JUNE 30, | 2022 | 2021 | % Change | |||||||||||||||||
| Total revenues | $ | 10,672 | $ | 11,433 | (6.7) | % | ||||||||||||||
| Benefits and claims, net | 4,785 | 5,387 | (11.2) | |||||||||||||||||
| Total acquisition and operating expenses | 2,910 | 3,069 | (5.2) | |||||||||||||||||
| Earnings before income taxes | 2,977 | 2,977 | — | |||||||||||||||||
| Income taxes | 557 | 579 | ||||||||||||||||||
| Net earnings | $ | 2,420 | $ | 2,398 | 0.9 | % | ||||||||||||||
| Net earnings per share – basic | $ | 3.75 | $ | 3.51 | 6.8 | % | ||||||||||||||
| Net earnings per share – diluted | 3.73 | 3.49 | 6.9 | |||||||||||||||||
| Shares used to compute earnings per share (000): | ||||||||||||||||||||
| Basic | 645,205 | 683,464 | (5.6) | % | ||||||||||||||||
| Diluted | 648,010 | 686,400 | (5.6) | |||||||||||||||||
| Dividends paid per share | $ | 0.80 | $ | 0.66 | 21.2 | % | ||||||||||||||
| AFLAC INCORPORATED AND SUBSIDIARIES CONDENSED BALANCE SHEET | ||||||||||||||||||||
| (UNAUDITED – IN MILLIONS, EXCEPT FOR SHARE AMOUNTS) | ||||||||||||||||||||
| JUNE 30, | 2022 | 2021 | % Change | |||||||||||||||||
| Assets: | ||||||||||||||||||||
| Total investments and cash | $ | 121,415 | $ | 146,709 | (17.2) | % | ||||||||||||||
| Deferred policy acquisition costs | 8,458 | 9,810 | (13.8) | |||||||||||||||||
| Other assets | 5,756 | 4,973 | 15.7 | |||||||||||||||||
| Total assets | $ | 135,629 | $ | 161,492 | (16.0) | % | ||||||||||||||
| Liabilities and shareholders’ equity: | ||||||||||||||||||||
| Policy liabilities | $ | 90,618 | $ | 108,286 | (16.3) | % | ||||||||||||||
| Notes payable and lease obligations | 7,416 | 8,121 | (8.7) | |||||||||||||||||
| Other liabilities | 11,208 | 11,350 | (1.3) | |||||||||||||||||
| Shareholders’ equity | 26,387 | 33,735 | (21.8) | |||||||||||||||||
| Total liabilities and shareholders’ equity | $ | 135,629 | $ | 161,492 | (16.0) | % | ||||||||||||||
| Shares outstanding at end of period (000) | 634,526 | 671,990 | (5.6) | % | ||||||||||||||||
| RECONCILIATION OF NET EARNINGS TO ADJUSTED EARNINGS | ||||||||||||||||||||
| (UNAUDITED – IN MILLIONS, EXCEPT FOR PER-SHARE AMOUNTS) | ||||||||||||||||||||
| THREE MONTHS ENDED JUNE 30, | 2022 | 2021 | % Change | |||||||||||||||||
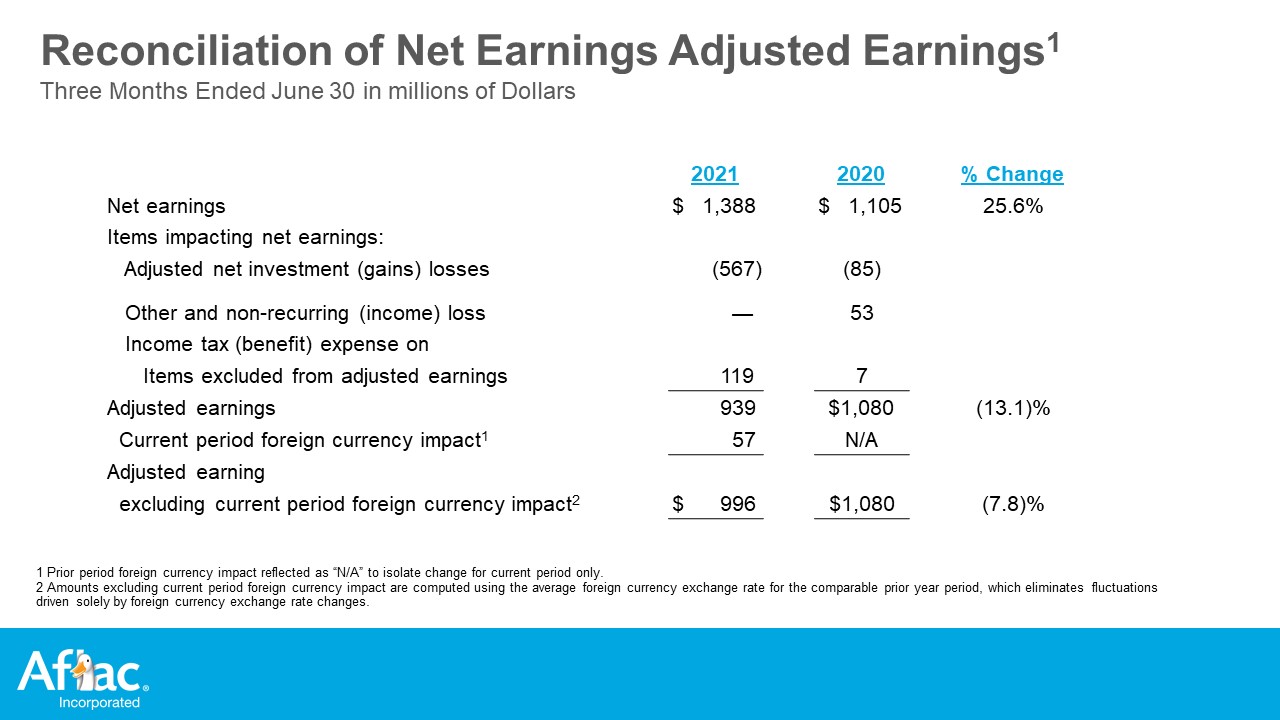
| Net earnings | $ | 1,388 | $ | 1,105 | 25.6 | % | ||||||||||||||
| Items impacting net earnings: | ||||||||||||||||||||
| Adjusted net investment (gains) losses | (567) | (85) | ||||||||||||||||||
Other and non-recurring (income) loss |
— | 53 | ||||||||||||||||||
Income tax (benefit) expense on items excluded from adjusted earnings |
119 | 7 | ||||||||||||||||||
| Adjusted earnings | 939 | 1,080 | (13.1) | % | ||||||||||||||||
Current period foreign currency impact 1 |
57 | N/A | ||||||||||||||||||
Adjusted earnings excluding current period foreign currency impact 2 |
$ | 996 | $ | 1,080 | (7.8) | % | ||||||||||||||
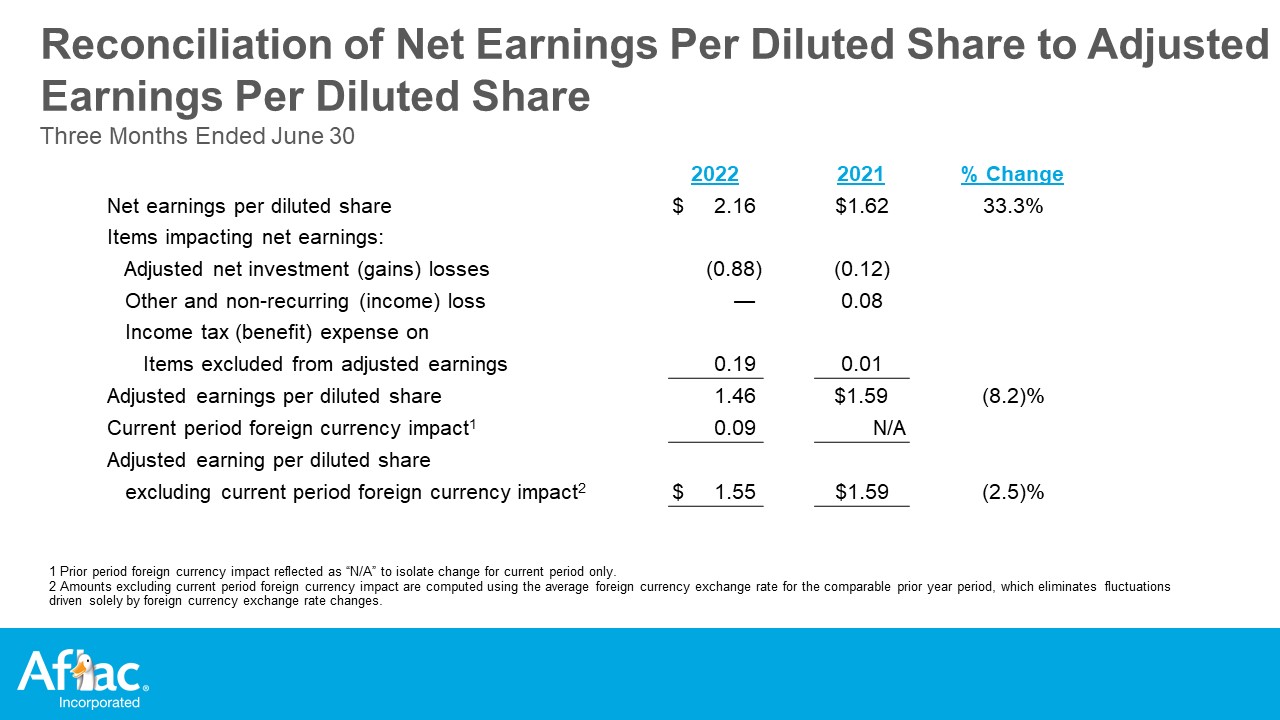
| Net earnings per diluted share | $ | 2.16 | $ | 1.62 | 33.3 | % | ||||||||||||||
| Items impacting net earnings: | ||||||||||||||||||||
| Adjusted net investment (gains) losses | (0.88) | (0.12) | ||||||||||||||||||
Other and non-recurring (income) loss |
— | 0.08 | ||||||||||||||||||
Income tax (benefit) expense on items excluded from adjusted earnings |
0.19 | 0.01 | ||||||||||||||||||
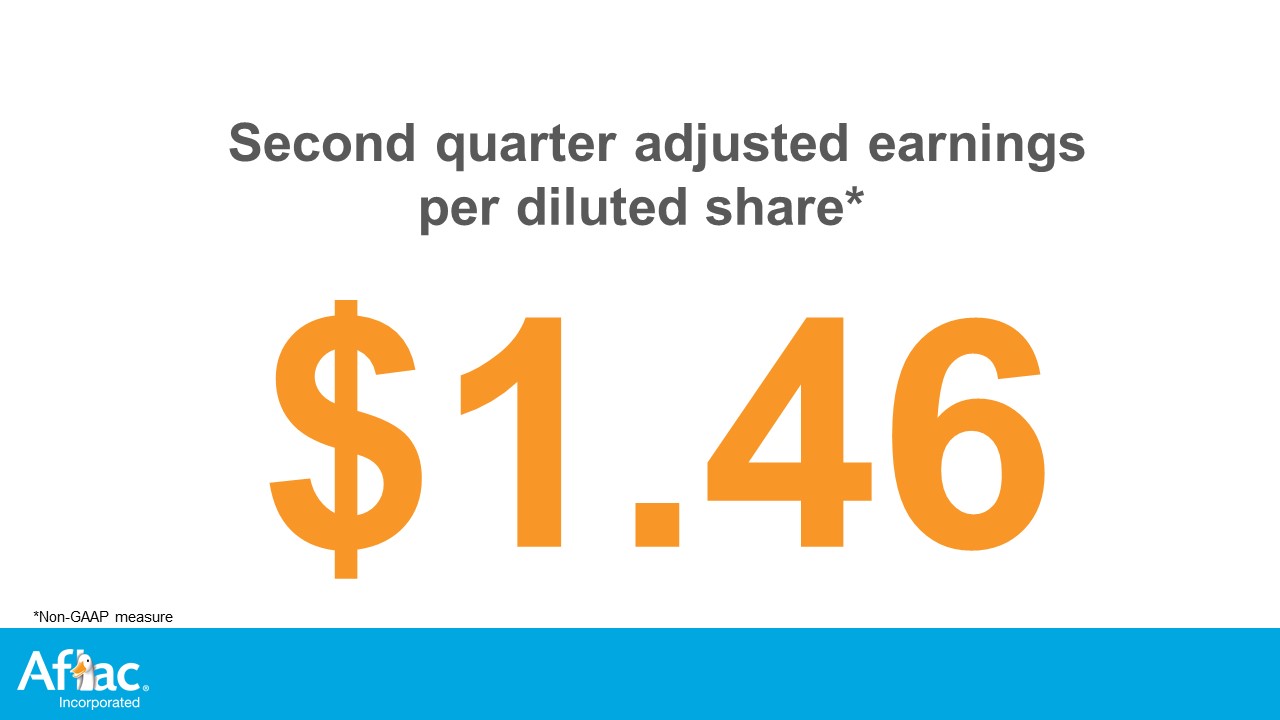
| Adjusted earnings per diluted share | 1.46 | 1.59 | (8.2) | % | ||||||||||||||||
Current period foreign currency impact 1 |
0.09 | N/A | ||||||||||||||||||
Adjusted earnings per diluted share excluding current period foreign currency impact 2 |
$ | 1.55 | $ | 1.59 | (2.5) | % | ||||||||||||||
| RECONCILIATION OF NET EARNINGS TO ADJUSTED EARNINGS | ||||||||||||||||||||
| (UNAUDITED – IN MILLIONS, EXCEPT FOR PER-SHARE AMOUNTS) | ||||||||||||||||||||
| SIX MONTHS ENDED JUNE 30, | 2022 | 2021 | % Change | |||||||||||||||||
| Net earnings | $ | 2,420 | $ | 2,398 | 0.9 | % | ||||||||||||||
| Items impacting net earnings: | ||||||||||||||||||||
| Adjusted net investment (gains) losses | (701) | (388) | ||||||||||||||||||
Other and non-recurring (income) loss |
— | 59 | ||||||||||||||||||
Income tax (benefit) expense on items excluded from adjusted earnings |
147 | 69 | ||||||||||||||||||
| Adjusted earnings | 1,866 | 2,138 | (12.7) | % | ||||||||||||||||
Current period foreign currency impact 1 |
94 | N/A | ||||||||||||||||||
Adjusted earnings excluding current period foreign currency impact 2 |
$ | 1,960 | $ | 2,138 | (8.3) | % | ||||||||||||||
| Net earnings per diluted share | $ | 3.73 | $ | 3.49 | 6.9 | % | ||||||||||||||
| Items impacting net earnings: | ||||||||||||||||||||
| Adjusted net investment (gains) losses | (1.08) | (0.57) | ||||||||||||||||||
Other and non-recurring (income) loss |
— | 0.09 | ||||||||||||||||||
Income tax (benefit) expense on items excluded from adjusted earnings |
0.23 | 0.10 | ||||||||||||||||||
| Adjusted earnings per diluted share | 2.88 | 3.11 | (7.4) | % | ||||||||||||||||
Current period foreign currency impact 1 |
0.15 | N/A | ||||||||||||||||||
Adjusted earnings per diluted share excluding current period foreign currency impact 2 |
$ | 3.02 | $ | 3.11 | (2.9) | % | ||||||||||||||
| RECONCILIATION OF NET INVESTMENT (GAINS) LOSSES TO ADJUSTED NET INVESTMENT (GAINS) LOSSES | ||||||||||||||||||||
| (UNAUDITED – IN MILLIONS) | ||||||||||||||||||||
| THREE MONTHS ENDED JUNE 30, | 2022 | 2021 | % Change | |||||||||||||||||
| Net investment (gains) losses | $ | (564) | $ | (89) | 533.7 | % | ||||||||||||||
| Items impacting net investment (gains) losses: | ||||||||||||||||||||
| Amortized hedge costs | (30) | (17) | ||||||||||||||||||
| Amortized hedge income | 14 | 16 | ||||||||||||||||||
|
Net interest cash flows from derivatives associated
with certain investment strategies
|
(1) | (9) | ||||||||||||||||||
|
Interest rate component of the change in fair value of foreign
currency swaps on notes payable1
|
12 | 14 | ||||||||||||||||||
| Adjusted net investment (gains) losses | $ | (567) | $ | (85) | 567.1 | % | ||||||||||||||
| RECONCILIATION OF NET INVESTMENT INCOME TO ADJUSTED NET INVESTMENT INCOME | ||||||||||||||||||||
| (UNAUDITED – IN MILLIONS) | ||||||||||||||||||||
| THREE MONTHS ENDED JUNE 30, | 2022 | 2021 | % Change | |||||||||||||||||
| Net investment income | $ | 937 | $ | 993 | (5.6) | % | ||||||||||||||
| Items impacting net investment income: | ||||||||||||||||||||
| Amortized hedge costs | (30) | (17) | ||||||||||||||||||
| Amortized hedge income | 14 | 16 | ||||||||||||||||||
|
Net interest cash flows from derivatives associated
with certain investment strategies
|
(1) | (9) | ||||||||||||||||||
| Adjusted net investment income | $ | 920 | $ | 983 | (6.4) | % | ||||||||||||||
| RECONCILIATION OF NET INVESTMENT (GAINS) LOSSES TO ADJUSTED NET INVESTMENT (GAINS) LOSSES | ||||||||||||||||||||
| (UNAUDITED – IN MILLIONS) | ||||||||||||||||||||
| SIX MONTHS ENDED JUNE 30, | 2022 | 2021 | % Change | |||||||||||||||||
| Net investment (gains) losses | $ | (686) | $ | (396) | 73.2 | % | ||||||||||||||
| Items impacting net investment (gains) losses: | ||||||||||||||||||||
| Amortized hedge costs | (55) | (36) | ||||||||||||||||||
| Amortized hedge income | 25 | 33 | ||||||||||||||||||
|
Net interest cash flows from derivatives associated
with certain investment strategies
|
(10) | (17) | ||||||||||||||||||
|
Interest rate component of the change in fair value of foreign
currency swaps on notes payable1
|
25 | 27 | ||||||||||||||||||
| Adjusted net investment (gains) losses | $ | (701) | $ | (388) | 80.7 | % | ||||||||||||||
| RECONCILIATION OF NET INVESTMENT INCOME TO ADJUSTED NET INVESTMENT INCOME | ||||||||||||||||||||
| (UNAUDITED – IN MILLIONS) | ||||||||||||||||||||
| SIX MONTHS ENDED JUNE 30, | 2022 | 2021 | % Change | |||||||||||||||||
| Net investment income | $ | 1,840 | $ | 1,918 | (4.1) | % | ||||||||||||||
| Items impacting net investment income: | ||||||||||||||||||||
| Amortized hedge costs | (55) | (36) | ||||||||||||||||||
| Amortized hedge income | 25 | 33 | ||||||||||||||||||
|
Net interest cash flows from derivatives associated
with certain investment strategies
|
(10) | (17) | ||||||||||||||||||
| Adjusted net investment income | $ | 1,800 | $ | 1,898 | (5.2) | % | ||||||||||||||
RECONCILIATION OF U.S. GAAP BOOK VALUE TO ADJUSTED BOOK VALUE | ||||||||||||||||||||
| (UNAUDITED - IN MILLIONS, EXCEPT FOR SHARE AND PER-SHARE AMOUNTS) | ||||||||||||||||||||
| JUNE 30, | 2022 | 2021 | % Change | |||||||||||||||||
| U.S. GAAP book value | $ | 26,387 | $ | 33,735 | ||||||||||||||||
| Less: | ||||||||||||||||||||
Unrealized foreign currency translation gains (losses) |
(3,289) | (1,661) | ||||||||||||||||||
Unrealized gains (losses) on securities and derivatives |
2,901 | 9,959 | ||||||||||||||||||
Pension liability adjustment |
(160) | (279) | ||||||||||||||||||
Total AOCI |
(548) | 8,019 | ||||||||||||||||||
| Adjusted book value | $ | 26,935 | $ | 25,716 | ||||||||||||||||
| Add: | ||||||||||||||||||||
Unrealized foreign currency translation gains (losses) |
(3,289) | (1,661) | ||||||||||||||||||
| Adjusted book value including unrealized foreign currency translation gains (losses) | $ | 23,646 | $ | 24,055 | ||||||||||||||||
| Number of outstanding shares at end of period (000) | 634,526 | 671,990 | ||||||||||||||||||
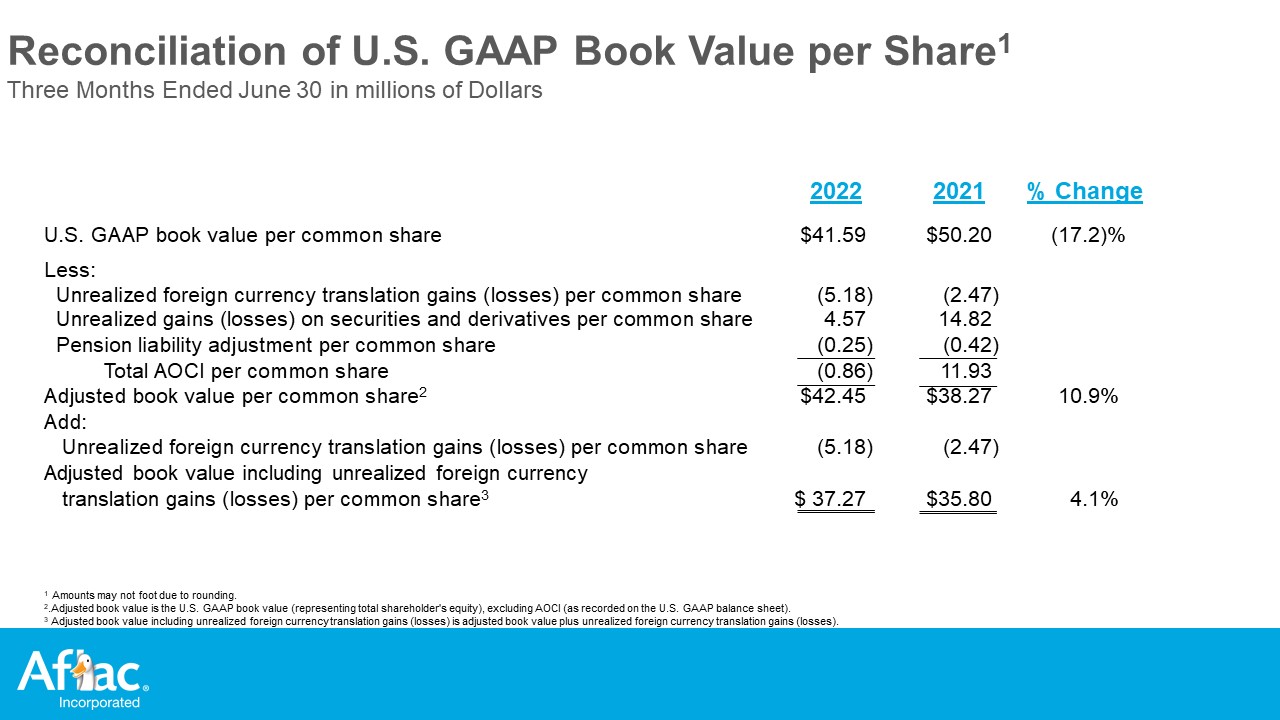
| U.S. GAAP book value per common share | $ | 41.59 | $ | 50.20 | (17.2) | % | ||||||||||||||
| Less: | ||||||||||||||||||||
Unrealized foreign currency translation gains (losses) per common share |
(5.18) | (2.47) | ||||||||||||||||||
Unrealized gains (losses) on securities and derivatives per common share |
4.57 | 14.82 | ||||||||||||||||||
Pension liability adjustment per common share |
(0.25) | (0.42) | ||||||||||||||||||
Total AOCI per common share |
(0.86) | 11.93 | ||||||||||||||||||
| Adjusted book value per common share | $ | 42.45 | $ | 38.27 | 10.9 | % | ||||||||||||||
| Add: | ||||||||||||||||||||
Unrealized foreign currency translation gains (losses) per common share |
(5.18) | (2.47) | ||||||||||||||||||
| Adjusted book value including unrealized foreign currency translation gains (losses) per common share | $ | 37.27 | $ | 35.80 | 4.1 | % | ||||||||||||||
RECONCILIATION OF U.S. GAAP RETURN ON EQUITY (ROE) TO ADJUSTED ROE | ||||||||||||||
| (EXCLUDING IMPACT OF FOREIGN CURRENCY) | ||||||||||||||
| THREE MONTHS ENDED JUNE 30, | 2022 | 2021 | ||||||||||||
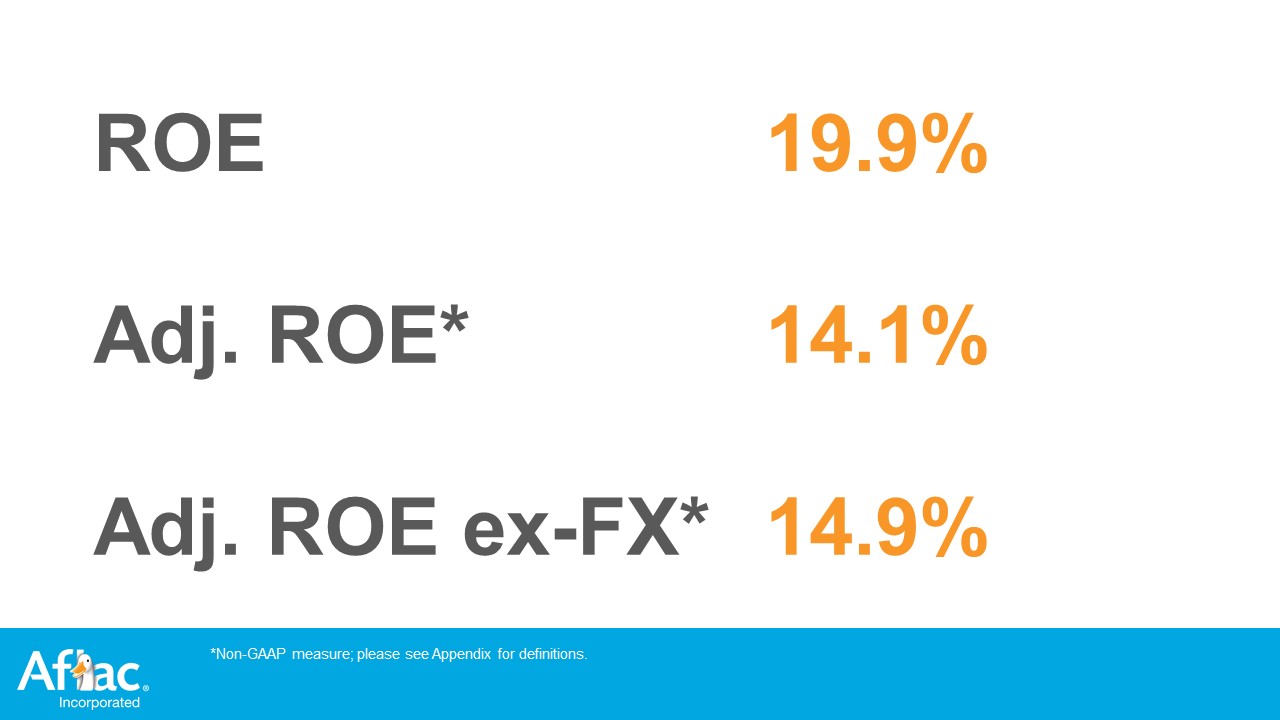
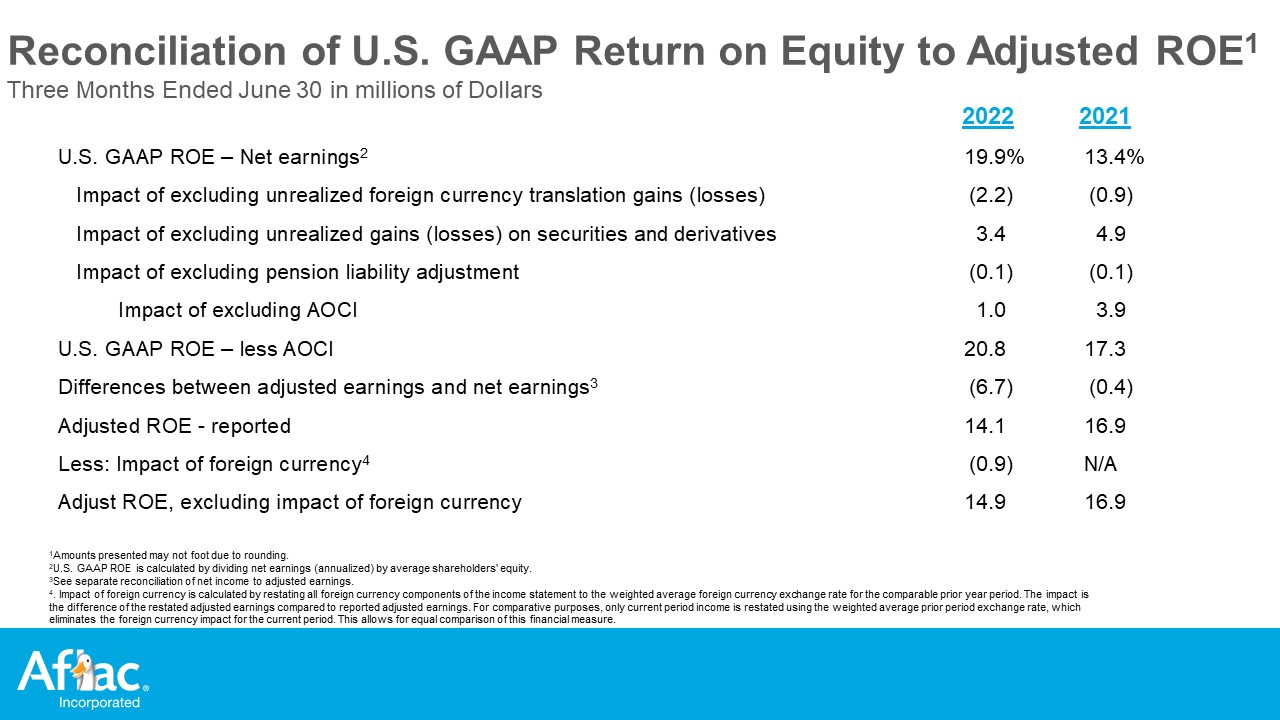
U.S. GAAP ROE - Net earnings1 |
19.9 | % | 13.4 | % | ||||||||||
Impact of excluding unrealized foreign currency translation gains (losses) |
(2.2) | (0.9) | ||||||||||||
Impact of excluding unrealized gains (losses) on securities and derivatives |
3.4 | 4.9 | ||||||||||||
Impact of excluding pension liability adjustment |
(0.1) | (0.1) | ||||||||||||
Impact of excluding AOCI |
1.0 | 3.9 | ||||||||||||
| U.S. GAAP ROE - less AOCI | 20.8 | 17.3 | ||||||||||||
Differences between adjusted earnings and net earnings2 |
(6.7) | (0.4) | ||||||||||||
| Adjusted ROE - reported | 14.1 | 16.9 | ||||||||||||
Less: Impact of foreign currency3 |
(0.9) | N/A | ||||||||||||
| Adjusted ROE, excluding impact of foreign currency | 14.9 | 16.9 | ||||||||||||
RECONCILIATION OF U.S. GAAP RETURN ON EQUITY (ROE) TO ADJUSTED ROE | ||||||||||||||
| (EXCLUDING IMPACT OF FOREIGN CURRENCY) | ||||||||||||||
| SIX MONTHS ENDED JUNE 30, | 2022 | 2021 | ||||||||||||
U.S. GAAP ROE - Net earnings1 |
16.2 | % | 14.3 | % | ||||||||||
Impact of excluding unrealized foreign currency translation gains (losses) |
(1.6) | (0.8) | ||||||||||||
Impact of excluding unrealized gains (losses) on securities and derivatives |
3.8 | 5.7 | ||||||||||||
Impact of excluding pension liability adjustment |
(0.1) | (0.2) | ||||||||||||
Impact of excluding AOCI |
2.1 | 4.8 | ||||||||||||
| U.S. GAAP ROE - less AOCI | 18.3 | 19.1 | ||||||||||||
Differences between adjusted earnings and net earnings2 |
(4.2) | (2.1) | ||||||||||||
| Adjusted ROE - reported | 14.1 | 17.0 | ||||||||||||
Less: Impact of foreign currency3 |
(0.7) | N/A | ||||||||||||
| Adjusted ROE, excluding impact of foreign currency | 14.8 | 17.0 | ||||||||||||
EFFECT OF FOREIGN CURRENCY ON ADJUSTED RESULTS1 | ||||||||||||||
| (SELECTED PERCENTAGE CHANGES, UNAUDITED) | ||||||||||||||
| THREE MONTHS ENDED JUNE 30, 2022 | Including Currency Changes |
Excluding
Currency
Changes2
|
||||||||||||
Net earned premiums3 |
(13.3) | % | (3.4) | % | ||||||||||
Adjusted net investment income4 |
(6.4) | % | (1.4) | |||||||||||
| Total benefits and expenses | (10.6) | (0.4) | ||||||||||||
| Adjusted earnings | (13.1) | (7.8) | ||||||||||||
| Adjusted earnings per diluted share | (8.2) | (2.5) | ||||||||||||
EFFECT OF FOREIGN CURRENCY ON ADJUSTED RESULTS1 | ||||||||||||||
| (SELECTED PERCENTAGE CHANGES, UNAUDITED) | ||||||||||||||
| SIX MONTHS ENDED JUNE 30, 2022 | Including Currency Changes |
Excluding
Currency
Changes2
|
||||||||||||
Net earned premiums3 |
(11.1) | % | (3.3) | % | ||||||||||
Adjusted net investment income4 |
(5.2) | % | (1.1) | |||||||||||
| Total benefits and expenses | (8.4) | (0.3) | ||||||||||||
| Adjusted earnings | (12.7) | (8.3) | ||||||||||||
| Adjusted earnings per diluted share | (7.4) | (2.9) | ||||||||||||

| Aflac Incorporated | Page | |||||||||||||||||||
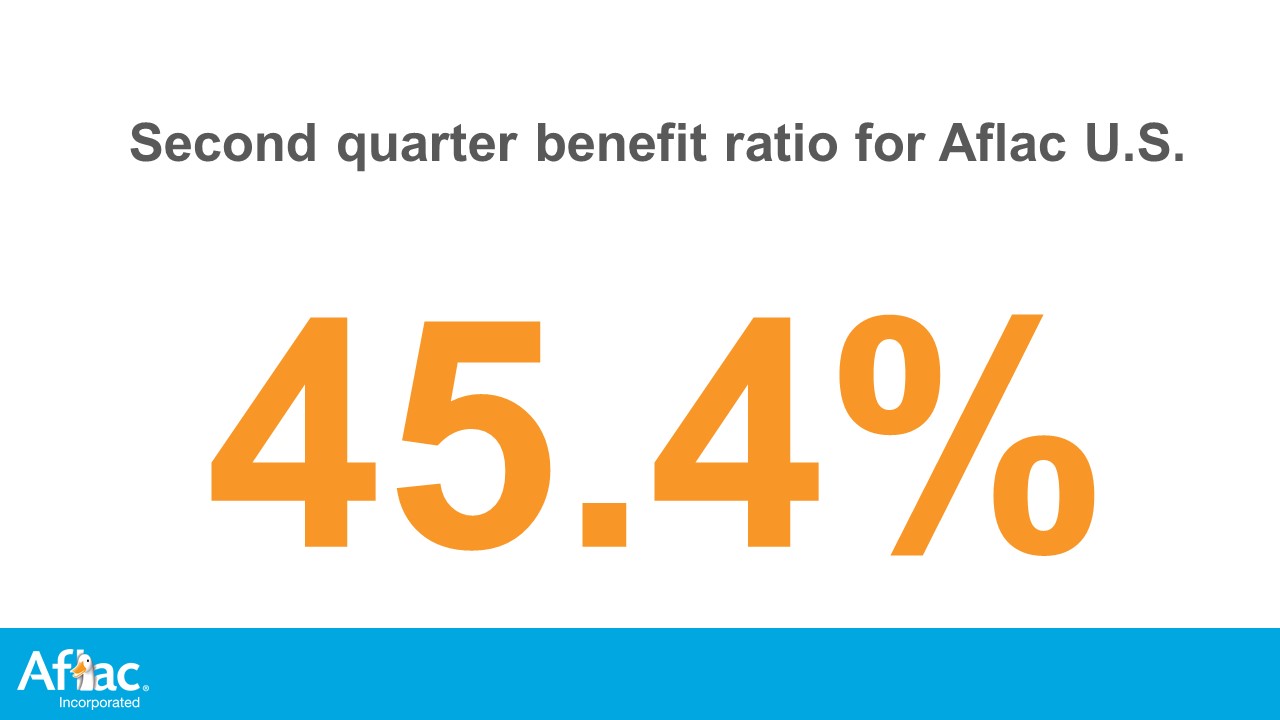
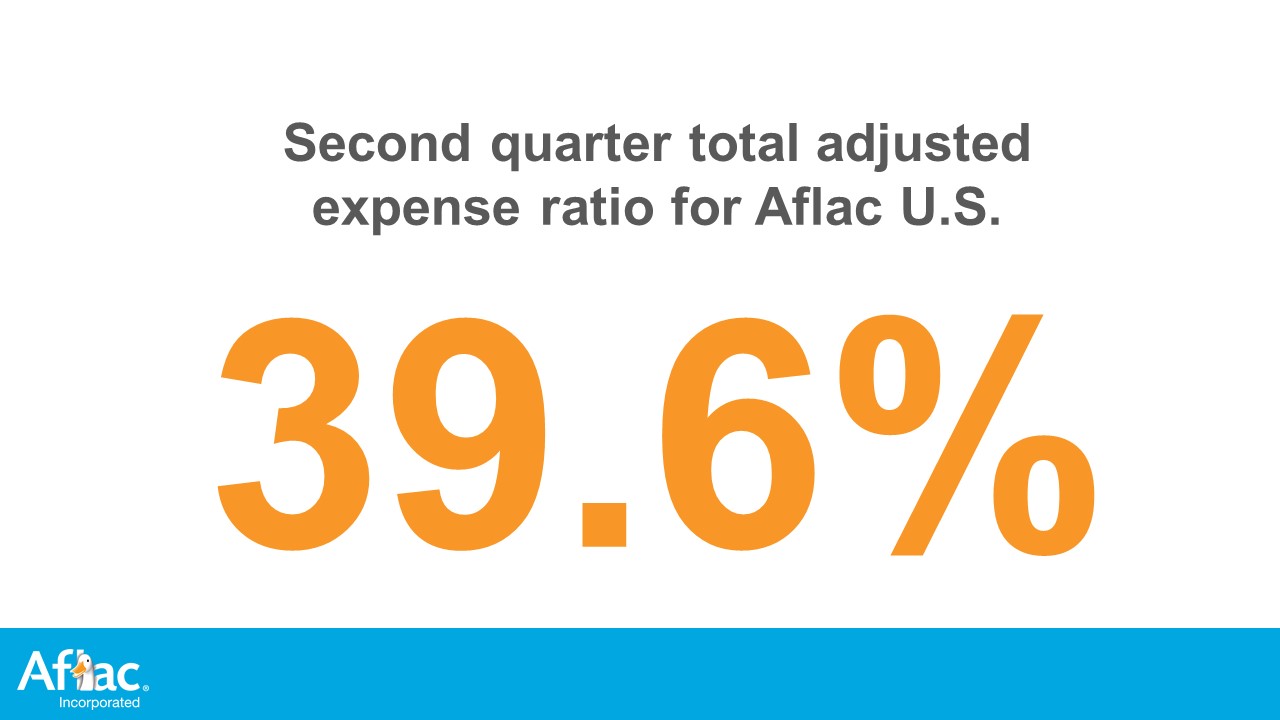
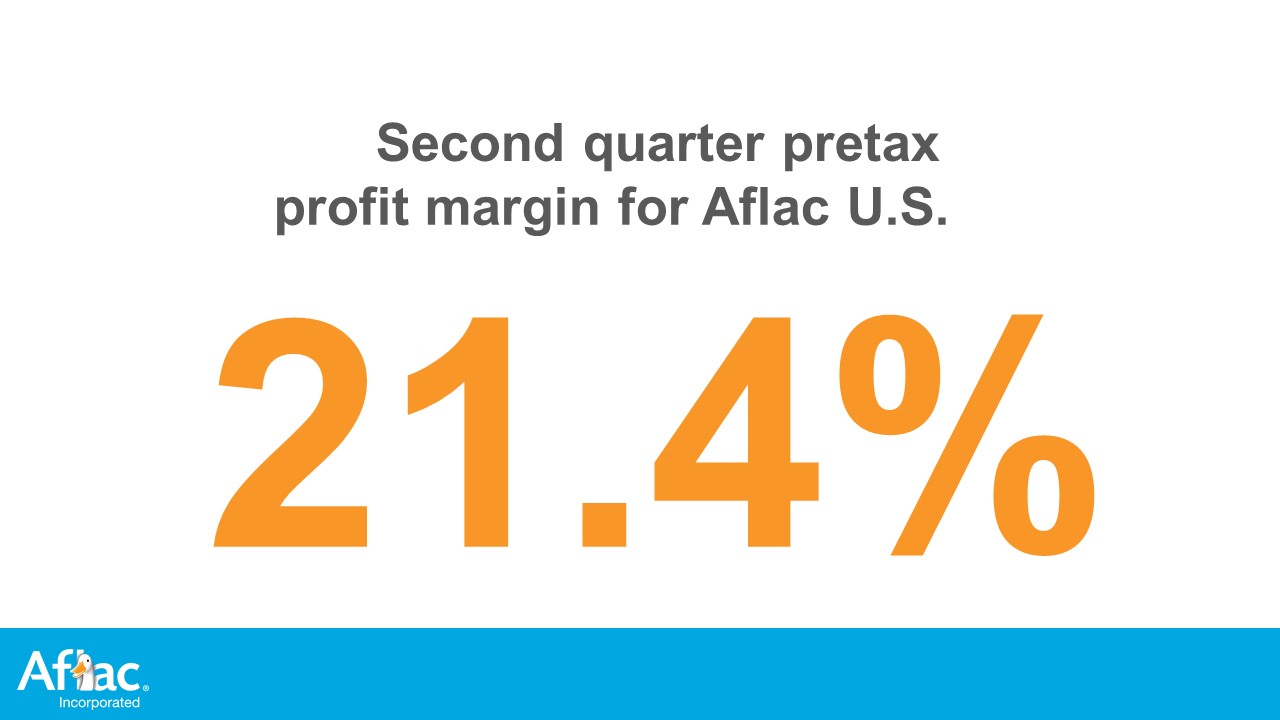
| Aflac U.S. | ||||||||||||||||||||
| Aflac Japan | ||||||||||||||||||||
| Corporate and Other | ||||||||||||||||||||
| Non-U.S. GAAP Financial Measures | ||||||||||||||||||||
| Aflac Incorporated and Subsidiaries | ||||||||||||||||||||||||||||||||||||||||||||||||||||||||||||||||||||||||||||||||
| Share Data | ||||||||||||||||||||||||||||||||||||||||||||||||||||||||||||||||||||||||||||||||
| (In Thousands) | ||||||||||||||||||||||||||||||||||||||||||||||||||||||||||||||||||||||||||||||||
| Beginning | Shares Issued | Shares Purchased | Ending | QTD Weighted Avg. Shares | YTD Weighted Avg. Shares | |||||||||||||||||||||||||||||||||||||||||||||||||||||||||||||||||||||||||||
| Shares | Stk. Bon. | Stk. Opt. | Treas. | Misc. | Shares | Avg. | Dilutive | Avg. | Avg. | Dilutive | Avg. | |||||||||||||||||||||||||||||||||||||||||||||||||||||||||||||||||||||
| Period | Outstanding | & DRP | & Misc. | Shares | Purch.(1) |
Outstanding | Shares | Shares | Diluted | Shares | Shares | Diluted | ||||||||||||||||||||||||||||||||||||||||||||||||||||||||||||||||||||
| 2020 | 1 | 726,793 | 468 | 1,613 | 9,984 | 508 | 718,382 | 724,366 | 3,146 | 727,512 | 724,366 | 3,146 | 727,512 | |||||||||||||||||||||||||||||||||||||||||||||||||||||||||||||||||||
| 2 | 718,382 | 648 | 100 | 5,209 | 13 | 713,908 | 717,889 | 1,875 | 719,764 | 721,128 | 2,510 | 723,638 | ||||||||||||||||||||||||||||||||||||||||||||||||||||||||||||||||||||
| 3 | 713,908 | 468 | 134 | 10,916 | 20 | 703,574 | 711,698 | 2,095 | 713,793 | 717,962 | 2,372 | 720,333 | ||||||||||||||||||||||||||||||||||||||||||||||||||||||||||||||||||||
| 4 | 703,574 | 437 | 235 | 11,791 | 1 | 692,454 | 701,016 | 2,843 | 703,859 | 713,702 | 2,490 | 716,192 | ||||||||||||||||||||||||||||||||||||||||||||||||||||||||||||||||||||
| 2021 | 1 | 692,454 | 387 | 1,684 | 13,440 | 378 | 680,707 | 688,938 | 3,002 | 691,940 | 688,938 | 3,002 | 691,940 | |||||||||||||||||||||||||||||||||||||||||||||||||||||||||||||||||||
| 2 | 680,707 | 330 | 130 | 9,174 | 3 | 671,990 | 678,050 | 2,871 | 680,921 | 683,464 | 2,936 | 686,400 | ||||||||||||||||||||||||||||||||||||||||||||||||||||||||||||||||||||
| 3 | 671,990 | 250 | 188 | 9,572 | 39 | 662,817 | 668,762 | 3,163 | 671,925 | 678,509 | 3,012 | 681,521 | ||||||||||||||||||||||||||||||||||||||||||||||||||||||||||||||||||||
| 4 | 662,817 | 249 | 224 | 11,140 | 18 | 652,132 | 659,100 | 3,412 | 662,512 | 673,617 | 3,112 | 676,729 | ||||||||||||||||||||||||||||||||||||||||||||||||||||||||||||||||||||
| 2022 | 1 | 652,132 | 259 | 1,308 | 8,007 | 343 | 645,349 | 649,753 | 3,074 | 652,827 | 649,753 | 3,074 | 652,827 | |||||||||||||||||||||||||||||||||||||||||||||||||||||||||||||||||||
| 2 | 645,349 | 269 | 101 | 11,185 | 8 | 634,526 | 640,707 | 2,536 | 643,243 | 645,205 | 2,805 | 648,010 | ||||||||||||||||||||||||||||||||||||||||||||||||||||||||||||||||||||
| Aflac Incorporated and Subsidiaries | |||||||||||||||||||||||||||||||||||||||||||||||||||||||||||||||||||||||||||||||||||||||||||||||||||||||||||
| Summary of Adjusted Results by Business Segment | |||||||||||||||||||||||||||||||||||||||||||||||||||||||||||||||||||||||||||||||||||||||||||||||||||||||||||
| (In Millions, except per-share data and where noted) | |||||||||||||||||||||||||||||||||||||||||||||||||||||||||||||||||||||||||||||||||||||||||||||||||||||||||||
| Years Ended December 31, | 3 Months Ended June 30, | 6 Months Ended June 30, | |||||||||||||||||||||||||||||||||||||||||||||||||||||||||||||||||||||||||||||||||||||||||||||||||||||||||
| % | % | ||||||||||||||||||||||||||||||||||||||||||||||||||||||||||||||||||||||||||||||||||||||||||||||||||||||||||
| 2017 | 2018 | 2019 | 2020 | 2021 | 2021 | 2022 | Change | 2021 | 2022 | Change | |||||||||||||||||||||||||||||||||||||||||||||||||||||||||||||||||||||||||||||||||||||||||||||||||
| Aflac Japan | $ | 3,054 | $ | 3,208 | $ | 3,261 | $ | 3,263 | $ | 3,754 | $ | 1,004 | $ | 860 | (14.3) | $ | 1,891 | $ | 1,722 | (8.9) | |||||||||||||||||||||||||||||||||||||||||||||||||||||||||||||||||||||||||||||||||||||||
| Aflac U.S. | 1,245 | 1,285 | 1,272 | 1,268 | 1,478 | 413 | 349 | (15.5) | 859 | 674 | (21.5) | ||||||||||||||||||||||||||||||||||||||||||||||||||||||||||||||||||||||||||||||||||||||||||||||||
Corporate and other (1) |
(214) | (139) | (72) | (115) | (298) | (76) | (75) | (102) | (120) | ||||||||||||||||||||||||||||||||||||||||||||||||||||||||||||||||||||||||||||||||||||||||||||||||||
| Pretax adjusted earnings | 4,086 | 4,354 | 4,461 | 4,416 | 4,934 | 1,341 | 1,134 | (15.4) | 2,648 | 2,276 | (14.0) | ||||||||||||||||||||||||||||||||||||||||||||||||||||||||||||||||||||||||||||||||||||||||||||||||
Income taxes (1) |
1,370 | 1,129 | 1,147 | 864 | 915 | 262 | 194 | (26.0) | 510 | 409 | (19.8) | ||||||||||||||||||||||||||||||||||||||||||||||||||||||||||||||||||||||||||||||||||||||||||||||||
Adjusted earnings (2) |
2,716 | 3,226 | 3,314 | 3,552 | 4,019 | 1,080 | 939 | (13.1) | 2,138 | 1,866 | (12.7) | ||||||||||||||||||||||||||||||||||||||||||||||||||||||||||||||||||||||||||||||||||||||||||||||||
| Reconciling items: | |||||||||||||||||||||||||||||||||||||||||||||||||||||||||||||||||||||||||||||||||||||||||||||||||||||||||||
| Adjusted net investment gains (losses) | — | (297) | (15) | (229) | 462 | 85 | 567 | 388 | 701 | ||||||||||||||||||||||||||||||||||||||||||||||||||||||||||||||||||||||||||||||||||||||||||||||||||
Other and non-recurring income (loss) (3) |
(69) | (75) | (1) | (28) | (73) | (53) | — | (59) | — | ||||||||||||||||||||||||||||||||||||||||||||||||||||||||||||||||||||||||||||||||||||||||||||||||||
| Income tax benefit (expense) on items excluded from adjusted earnings | 24 | 83 | 3 | 72 | (83) | (7) | (119) | (69) | (147) | ||||||||||||||||||||||||||||||||||||||||||||||||||||||||||||||||||||||||||||||||||||||||||||||||||
Tax reform adjustment (4) |
1,933 | (18) | 4 | — | — | — | — | — | — | ||||||||||||||||||||||||||||||||||||||||||||||||||||||||||||||||||||||||||||||||||||||||||||||||||
Tax valuation allowance release (5) |
— | — | — | 1,411 | — | — | — | — | — | ||||||||||||||||||||||||||||||||||||||||||||||||||||||||||||||||||||||||||||||||||||||||||||||||||
| Net earnings | $ | 4,604 | $ | 2,920 | $ | 3,304 | $ | 4,778 | $ | 4,325 | $ | 1,105 | $ | 1,388 | 25.6 | $ | 2,398 | $ | 2,420 | .9 | |||||||||||||||||||||||||||||||||||||||||||||||||||||||||||||||||||||||||||||||||||||||
| Effective Tax rate | (14.6) | % | 26.7 | % | 25.7 | % | (14.9) | % | 18.7 | % | 19.5 | % | 18.4 | % | 19.4 | % | 18.7 | % | |||||||||||||||||||||||||||||||||||||||||||||||||||||||||||||||||||||||||||||||||||||||||
| Earnings per share of common stock: | |||||||||||||||||||||||||||||||||||||||||||||||||||||||||||||||||||||||||||||||||||||||||||||||||||||||||||
| Net earnings (basic) | $ | 5.81 | $ | 3.79 | $ | 4.45 | $ | 6.69 | $ | 6.42 | $ | 1.63 | $ | 2.17 | 33.1 | $ | 3.51 | $ | 3.75 | 6.8 | |||||||||||||||||||||||||||||||||||||||||||||||||||||||||||||||||||||||||||||||||||||||
| Net earnings (diluted) | 5.77 | 3.77 | 4.43 | 6.67 | 6.39 | 1.62 | 2.16 | 33.3 | 3.49 | 3.73 | 6.9 | ||||||||||||||||||||||||||||||||||||||||||||||||||||||||||||||||||||||||||||||||||||||||||||||||
Adjusted earnings (basic) (2) |
$ | 3.43 | $ | 4.20 | $ | 4.46 | $ | 4.98 | $ | 5.97 | $ | 1.59 | $ | 1.47 | (7.5) | $ | 3.13 | $ | 2.89 | (7.7) | |||||||||||||||||||||||||||||||||||||||||||||||||||||||||||||||||||||||||||||||||||||||
Adjusted earnings (diluted) (2) |
3.40 | 4.16 | 4.44 | 4.96 | 5.94 | 1.59 | 1.46 | (8.2) | 3.11 | 2.88 | (7.4) | ||||||||||||||||||||||||||||||||||||||||||||||||||||||||||||||||||||||||||||||||||||||||||||||||
(1) The change in value of federal historic rehabilitation and solar investments in partnerships of $31 and $30 for the three-month periods and $42 and $30 for the six-month periods ended June 30, 2022, and 2021, respectively is included as a reduction to net investment income. Tax credits on these investments of $28 and $12 for the three-month period and $44 and $25 for the six-month periods ended June 30, 2022, and 2021, respectively, have been recorded as an income tax benefit in the consolidated statement of earnings. |
|||||||||||||||||||||||||||||||||||||||||||||||||||||||||||||||||||||||||||||||||||||||||||||||||||||||||||
(2) See non-U.S. GAAP financial measures for definition of adjusted earnings. |
|||||||||||||||||||||||||||||||||||||||||||||||||||||||||||||||||||||||||||||||||||||||||||||||||||||||||||
(3) Foreign currency gains and losses for all periods have been reclassified from Other and non-recurring income (loss) to Net investment gains and losses. |
|||||||||||||||||||||||||||||||||||||||||||||||||||||||||||||||||||||||||||||||||||||||||||||||||||||||||||
(4) The impact of Tax Reform was adjusted in 2018 for return-to-provision adjustments, various amended returns filed by the Company, and final true-ups of deferred tax liabilities. Further impacts were recorded in 2019 as a result of additional guidance released by the IRS. |
|||||||||||||||||||||||||||||||||||||||||||||||||||||||||||||||||||||||||||||||||||||||||||||||||||||||||||
(5) Tax benefit recognized in 2020 represents the release of valuation allowances on deferred tax benefits related to foreign tax credits. |
|||||||||||||||||||||||||||||||||||||||||||||||||||||||||||||||||||||||||||||||||||||||||||||||||||||||||||
| Aflac Incorporated and Subsidiaries | ||||||||||||||||||||||||||||||||||||||||||||||||||||||||||||||||||||||||||||||||||||||||||||||||||||||||
| Consolidated Statements of Earnings - U.S. GAAP | ||||||||||||||||||||||||||||||||||||||||||||||||||||||||||||||||||||||||||||||||||||||||||||||||||||||||
| (In Millions, except per-share data) | ||||||||||||||||||||||||||||||||||||||||||||||||||||||||||||||||||||||||||||||||||||||||||||||||||||||||
| Years Ended December 31, | 3 Months Ended June 30, | 6 Months Ended June 30, | ||||||||||||||||||||||||||||||||||||||||||||||||||||||||||||||||||||||||||||||||||||||||||||||||||||||
| % | % | |||||||||||||||||||||||||||||||||||||||||||||||||||||||||||||||||||||||||||||||||||||||||||||||||||||||
| 2017 | 2018 | 2019 | 2020 | 2021 | 2021 | 2022 | Change | 2021 | 2022 | Change | ||||||||||||||||||||||||||||||||||||||||||||||||||||||||||||||||||||||||||||||||||||||||||||||
| Revenues: | ||||||||||||||||||||||||||||||||||||||||||||||||||||||||||||||||||||||||||||||||||||||||||||||||||||||||
| Net earned premiums | ||||||||||||||||||||||||||||||||||||||||||||||||||||||||||||||||||||||||||||||||||||||||||||||||||||||||
| Gross premiums | $ | 18,875 | $ | 19,018 | $ | 19,122 | $ | 18,955 | $ | 17,857 | $ | 4,490 | $ | 3,877 | $ | 9,141 | $ | 8,091 | ||||||||||||||||||||||||||||||||||||||||||||||||||||||||||||||||||||||||||||||||||||||
| Assumed (ceded) | (345) | (341) | (342) | (333) | (210) | (49) | (27) | (108) | (63) | |||||||||||||||||||||||||||||||||||||||||||||||||||||||||||||||||||||||||||||||||||||||||||||||
| Total net earned premiums | 18,531 | 18,677 | 18,780 | 18,622 | 17,647 | 4,441 | 3,849 | (13.3) | 9,034 | 8,028 | (11.1) | |||||||||||||||||||||||||||||||||||||||||||||||||||||||||||||||||||||||||||||||||||||||||||||
| Net investment income | 3,220 | 3,442 | 3,578 | 3,638 | 3,818 | 993 | 937 | (5.6) | 1,918 | 1,840 | (4.1) | |||||||||||||||||||||||||||||||||||||||||||||||||||||||||||||||||||||||||||||||||||||||||||||
Net investment gains (losses) (1) |
(151) | (430) | (135) | (270) | 468 | 89 | 564 | 396 | 686 | |||||||||||||||||||||||||||||||||||||||||||||||||||||||||||||||||||||||||||||||||||||||||||||||
Other income (1) |
67 | 69 | 84 | 157 | 173 | 41 | 50 | 85 | 118 | |||||||||||||||||||||||||||||||||||||||||||||||||||||||||||||||||||||||||||||||||||||||||||||||
| Total revenues | 21,667 | 21,758 | 22,307 | 22,147 | 22,106 | 5,564 | 5,400 | (2.9) | 11,433 | 10,672 | (6.7) | |||||||||||||||||||||||||||||||||||||||||||||||||||||||||||||||||||||||||||||||||||||||||||||
| Benefits and Expenses: | ||||||||||||||||||||||||||||||||||||||||||||||||||||||||||||||||||||||||||||||||||||||||||||||||||||||||
| Benefits and claims, net | ||||||||||||||||||||||||||||||||||||||||||||||||||||||||||||||||||||||||||||||||||||||||||||||||||||||||
| Incurred claims -direct | 8,853 | 9,121 | 9,279 | 9,364 | 8,947 | 2,167 | 1,994 | 4,562 | 4,336 | |||||||||||||||||||||||||||||||||||||||||||||||||||||||||||||||||||||||||||||||||||||||||||||||
| Incurred claims -assumed (ceded) | (446) | (421) | (372) | (296) | (148) | (37) | (18) | (81) | (42) | |||||||||||||||||||||||||||||||||||||||||||||||||||||||||||||||||||||||||||||||||||||||||||||||
Increase in FPB (2)-direct |
3,628 | 3,167 | 2,952 | 2,707 | 1,759 | 518 | 318 | 897 | 482 | |||||||||||||||||||||||||||||||||||||||||||||||||||||||||||||||||||||||||||||||||||||||||||||||
Increase in FPB (2)-assumed (ceded) |
146 | 133 | 83 | 21 | 18 | 5 | 4 | 9 | 9 | |||||||||||||||||||||||||||||||||||||||||||||||||||||||||||||||||||||||||||||||||||||||||||||||
| Total net benefits and claims | 12,181 | 12,000 | 11,942 | 11,796 | 10,576 | 2,653 | 2,298 | (13.4) | 5,387 | 4,785 | (11.2) | |||||||||||||||||||||||||||||||||||||||||||||||||||||||||||||||||||||||||||||||||||||||||||||
| Acquisition and operating expenses: | ||||||||||||||||||||||||||||||||||||||||||||||||||||||||||||||||||||||||||||||||||||||||||||||||||||||||
Amortization of DAC (3) |
1,132 | 1,245 | 1,282 | 1,214 | 1,170 | 280 | 268 | 592 | 590 | |||||||||||||||||||||||||||||||||||||||||||||||||||||||||||||||||||||||||||||||||||||||||||||||
| Insurance commissions | 1,316 | 1,320 | 1,321 | 1,316 | 1,256 | 315 | 279 | 641 | 579 | |||||||||||||||||||||||||||||||||||||||||||||||||||||||||||||||||||||||||||||||||||||||||||||||
| Insurance expenses | 2,780 | 2,988 | 3,089 | 3,420 | 3,544 | 881 | 799 | 1,712 | 1,629 | |||||||||||||||||||||||||||||||||||||||||||||||||||||||||||||||||||||||||||||||||||||||||||||||
| Interest expense | 240 | 222 | 228 | 242 | 238 | 62 | 55 | 124 | 112 | |||||||||||||||||||||||||||||||||||||||||||||||||||||||||||||||||||||||||||||||||||||||||||||||
| Other expenses | — | — | — | — | — | — | — | — | — | |||||||||||||||||||||||||||||||||||||||||||||||||||||||||||||||||||||||||||||||||||||||||||||||
| Total acquisition and operating expenses | 5,468 | 5,775 | 5,920 | 6,192 | 6,208 | 1,538 | 1,401 | (8.9) | 3,069 | 2,910 | (5.2) | |||||||||||||||||||||||||||||||||||||||||||||||||||||||||||||||||||||||||||||||||||||||||||||
| Total benefits and expenses | 17,649 | 17,775 | 17,862 | 17,988 | 16,784 | 4,191 | 3,699 | (11.7) | 8,456 | 7,695 | (9.0) | |||||||||||||||||||||||||||||||||||||||||||||||||||||||||||||||||||||||||||||||||||||||||||||
| Pretax earnings | 4,018 | 3,983 | 4,445 | 4,159 | 5,322 | 1,373 | 1,701 | 2,977 | 2,977 | |||||||||||||||||||||||||||||||||||||||||||||||||||||||||||||||||||||||||||||||||||||||||||||||
| Income tax expense (benefit) | (586) | 1,063 | 1,141 | (619) | 997 | 268 | 313 | 579 | 557 | |||||||||||||||||||||||||||||||||||||||||||||||||||||||||||||||||||||||||||||||||||||||||||||||
| Net earnings | $ | 4,604 | $ | 2,920 | $ | 3,304 | $ | 4,778 | $ | 4,325 | $ | 1,105 | $ | 1,388 | 25.6 | $ | 2,398 | $ | 2,420 | .9 | ||||||||||||||||||||||||||||||||||||||||||||||||||||||||||||||||||||||||||||||||||||
(1) Foreign currency gains and losses for all periods have been reclassified from Other income to Net investment gains and losses for consistency with current period presentation. |
||||||||||||||||||||||||||||||||||||||||||||||||||||||||||||||||||||||||||||||||||||||||||||||||||||||||
(2) Future policy benefits |
||||||||||||||||||||||||||||||||||||||||||||||||||||||||||||||||||||||||||||||||||||||||||||||||||||||||
(3) Deferred acquisition costs |
||||||||||||||||||||||||||||||||||||||||||||||||||||||||||||||||||||||||||||||||||||||||||||||||||||||||
| Aflac Incorporated and Subsidiaries | ||||||||||||||||||||||||||||||||||||||||||||||||||||||||||||||||||||||||||||||||
| Analysis of Net Earnings and Net Earnings Per Diluted Share | ||||||||||||||||||||||||||||||||||||||||||||||||||||||||||||||||||||||||||||||||
| (In Millions, except for per-share data) | ||||||||||||||||||||||||||||||||||||||||||||||||||||||||||||||||||||||||||||||||
| Other and | Foreign | |||||||||||||||||||||||||||||||||||||||||||||||||||||||||||||||||||||||||||||||
| Net | Other and Non- | Foreign | Net | Net | Non-Recurring | Currency | ||||||||||||||||||||||||||||||||||||||||||||||||||||||||||||||||||||||||||
| Net | Investment | Recurring | Currency | Earnings | Investment | Items | Impact | |||||||||||||||||||||||||||||||||||||||||||||||||||||||||||||||||||||||||
| Period | Earnings | Gains (Losses) (1) |
Items (1)(3)(4) |
Impact (2) |
Per Share | Gains (Losses) (1) |
Per Share (1)(3)(4) |
Per Share (2) |
||||||||||||||||||||||||||||||||||||||||||||||||||||||||||||||||||||||||
| 2017 | 4,604 | — | 1,888 | (41) | 5.77 | — | 2.37 | (.05) | ||||||||||||||||||||||||||||||||||||||||||||||||||||||||||||||||||||||||
| 2018 | 2,920 | (230) | (76) | 28 | 3.77 | (.30) | (.09) | .04 | ||||||||||||||||||||||||||||||||||||||||||||||||||||||||||||||||||||||||
| 2019 | 3,304 | (13) | 3 | 15 | 4.43 | (.02) | .01 | .02 | ||||||||||||||||||||||||||||||||||||||||||||||||||||||||||||||||||||||||
| 2020 | 4,778 | (181) | 1,407 | 31 | 6.67 | (.25) | 1.96 | .04 | ||||||||||||||||||||||||||||||||||||||||||||||||||||||||||||||||||||||||
| 2021 | 4,325 | 365 | (59) | (38) | 6.39 | .54 | (.09) | (.06) | ||||||||||||||||||||||||||||||||||||||||||||||||||||||||||||||||||||||||
| 2020 | 1 | 566 | (322) | 5 | 9 | .78 | (.44) | .01 | .01 | |||||||||||||||||||||||||||||||||||||||||||||||||||||||||||||||||||||||
| 2 | 805 | (116) | — | 5 | 1.12 | (.16) | — | .01 | ||||||||||||||||||||||||||||||||||||||||||||||||||||||||||||||||||||||||
| 3 | 2,456 | 45 | 1,418 | 3 | 3.44 | .06 | 1.99 | — | ||||||||||||||||||||||||||||||||||||||||||||||||||||||||||||||||||||||||
| 4 | 951 | 212 | (15) | 14 | 1.35 | .30 | (.02) | .02 | ||||||||||||||||||||||||||||||||||||||||||||||||||||||||||||||||||||||||
| 2021 | 1 | 1,293 | 240 | (5) | 13 | 1.87 | .35 | (.01) | .02 | |||||||||||||||||||||||||||||||||||||||||||||||||||||||||||||||||||||||
| 2 | 1,105 | 67 | (42) | (6) | 1.62 | .10 | (.06) | (.01) | ||||||||||||||||||||||||||||||||||||||||||||||||||||||||||||||||||||||||
| 3 | 888 | (136) | (7) | (14) | 1.32 | (.20) | (.01) | (.02) | ||||||||||||||||||||||||||||||||||||||||||||||||||||||||||||||||||||||||
| 4 | 1,039 | 194 | (5) | (30) | 1.57 | .29 | (.01) | (.05) | ||||||||||||||||||||||||||||||||||||||||||||||||||||||||||||||||||||||||
| 2022 | 1 | 1,032 | 106 | (1) | (37) | 1.58 | .16 | — | (.06) | |||||||||||||||||||||||||||||||||||||||||||||||||||||||||||||||||||||||
| 2 | 1,388 | 448 | — | (57) | 2.16 | .70 | — | (.09) | ||||||||||||||||||||||||||||||||||||||||||||||||||||||||||||||||||||||||
(1) Items are presented net of tax. |
||||||||||||||||||||||||||||||||||||||||||||||||||||||||||||||||||||||||||||||||
(2) See non-U.S. GAAP financial measures for definition of adjusted earnings excluding current period foreign currency impact |
||||||||||||||||||||||||||||||||||||||||||||||||||||||||||||||||||||||||||||||||
(3) Foreign currency gains and losses and amortized hedge costs/income for all periods have been reclassified from Other income to Net investment gains and losses for consistency with current period presentation. |
||||||||||||||||||||||||||||||||||||||||||||||||||||||||||||||||||||||||||||||||
(4 )Tax benefit recognized in the third quarter of 2020 represents the release of valuation allowances on deferred tax benefits related to foreign tax credits. |
||||||||||||||||||||||||||||||||||||||||||||||||||||||||||||||||||||||||||||||||
| Aflac Incorporated and Subsidiaries | |||||||||||||||||||||||||||||||||||||||||||||||||||||||||||||||||||||||||||||
| Consolidated Balance Sheets | |||||||||||||||||||||||||||||||||||||||||||||||||||||||||||||||||||||||||||||
| (In Millions, except per-share data) | |||||||||||||||||||||||||||||||||||||||||||||||||||||||||||||||||||||||||||||
| December 31, | June 30, | ||||||||||||||||||||||||||||||||||||||||||||||||||||||||||||||||||||||||||||
| Assets: | 2017 | 2018 | 2019 | 2020 | 2021 | 2021 | 2022 | ||||||||||||||||||||||||||||||||||||||||||||||||||||||||||||||||||||||
| Investments and cash: | |||||||||||||||||||||||||||||||||||||||||||||||||||||||||||||||||||||||||||||
| Securities available for sale: | |||||||||||||||||||||||||||||||||||||||||||||||||||||||||||||||||||||||||||||
| Fixed maturity securities available for sale, at fair value | $ | 78,804 | $ | 78,429 | $ | 86,950 | $ | 101,286 | $ | 94,206 | $ | 97,791 | $ | 75,611 | |||||||||||||||||||||||||||||||||||||||||||||||||||||||||||||||
| Fixed maturity securities available for sale - consolidated variable interest entities, at fair value | 5,509 | 4,466 | 4,312 | 4,596 | 4,490 | 4,493 | 3,820 | ||||||||||||||||||||||||||||||||||||||||||||||||||||||||||||||||||||||
| Fixed maturity securities held to maturity, at amortized cost, net of allowance for credit losses | 31,430 | 30,318 | 30,085 | 24,464 | 22,000 | 22,891 | 18,507 | ||||||||||||||||||||||||||||||||||||||||||||||||||||||||||||||||||||||
| Equity securities, at fair value | 1,023 | 987 | 802 | 1,283 | 1,603 | 1,475 | 1,149 | ||||||||||||||||||||||||||||||||||||||||||||||||||||||||||||||||||||||
| Commercial mortgage and other loans, net of allowance for credit losses | 3,002 | 6,919 | 9,569 | 10,554 | 11,786 | 11,332 | 13,053 | ||||||||||||||||||||||||||||||||||||||||||||||||||||||||||||||||||||||
| Other investments | 400 | 787 | 1,477 | 2,429 | 3,842 | 3,258 | 4,102 | ||||||||||||||||||||||||||||||||||||||||||||||||||||||||||||||||||||||
| Cash and cash equivalents | 3,491 | 4,337 | 4,896 | 5,141 | 5,051 | 5,469 | 5,173 | ||||||||||||||||||||||||||||||||||||||||||||||||||||||||||||||||||||||
| Total investments and cash | 123,659 | 126,243 | 138,091 | 149,753 | 142,978 | 146,709 | 121,415 | ||||||||||||||||||||||||||||||||||||||||||||||||||||||||||||||||||||||
| Receivables, net of allowance for credit losses | 827 | 851 | 828 | 796 | 693 | 788 | 687 | ||||||||||||||||||||||||||||||||||||||||||||||||||||||||||||||||||||||
| Accrued investment income | 769 | 773 | 772 | 780 | 737 | 761 | 714 | ||||||||||||||||||||||||||||||||||||||||||||||||||||||||||||||||||||||
| Deferred policy acquisition costs | 9,505 | 9,875 | 10,128 | 10,441 | 9,525 | 9,810 | 8,458 | ||||||||||||||||||||||||||||||||||||||||||||||||||||||||||||||||||||||
| Property and equipment, net | 434 | 443 | 581 | 601 | 538 | 563 | 512 | ||||||||||||||||||||||||||||||||||||||||||||||||||||||||||||||||||||||
Other assets, net of allowance for credit losses (1) |
2,023 | 2,221 | 2,368 | 2,715 | 3,071 | 2,861 | 3,843 | ||||||||||||||||||||||||||||||||||||||||||||||||||||||||||||||||||||||
| Total assets | $ | 137,217 | $ | 140,406 | $ | 152,768 | $ | 165,086 | $ | 157,542 | $ | 161,492 | $ | 135,629 | |||||||||||||||||||||||||||||||||||||||||||||||||||||||||||||||
| Liabilities and Shareholders' Equity: | |||||||||||||||||||||||||||||||||||||||||||||||||||||||||||||||||||||||||||||
| Liabilities: | |||||||||||||||||||||||||||||||||||||||||||||||||||||||||||||||||||||||||||||
| Total policy liabilities | $ | 99,147 | $ | 103,188 | $ | 106,554 | $ | 114,391 | $ | 105,072 | $ | 108,286 | $ | 90,618 | |||||||||||||||||||||||||||||||||||||||||||||||||||||||||||||||
| Notes payable | 5,289 | 5,778 | 6,569 | 7,899 | 7,956 | 8,121 | 7,416 | ||||||||||||||||||||||||||||||||||||||||||||||||||||||||||||||||||||||
| Income taxes, primarily deferred | 4,745 | 4,020 | 5,370 | 4,661 | 4,339 | 4,451 | 2,275 | ||||||||||||||||||||||||||||||||||||||||||||||||||||||||||||||||||||||
| Other liabilities | 3,438 | 3,958 | 5,316 | 4,576 | 6,922 | 6,899 | 8,933 | ||||||||||||||||||||||||||||||||||||||||||||||||||||||||||||||||||||||
| Total liabilities | 112,619 | 116,944 | 123,809 | 131,527 | 124,289 | 127,757 | 109,242 | ||||||||||||||||||||||||||||||||||||||||||||||||||||||||||||||||||||||
| Shareholders' equity: | |||||||||||||||||||||||||||||||||||||||||||||||||||||||||||||||||||||||||||||
| Common stock | 135 | 135 | 135 | 135 | 135 | 135 | 135 | ||||||||||||||||||||||||||||||||||||||||||||||||||||||||||||||||||||||
| Additional paid-in capital | 2,052 | 2,177 | 2,313 | 2,410 | 2,529 | 2,465 | 2,589 | ||||||||||||||||||||||||||||||||||||||||||||||||||||||||||||||||||||||
| Retained earnings | 29,895 | 31,788 | 34,291 | 37,984 | 41,381 | 40,162 | 43,547 | ||||||||||||||||||||||||||||||||||||||||||||||||||||||||||||||||||||||
| Accumulated other comprehensive income (loss): | |||||||||||||||||||||||||||||||||||||||||||||||||||||||||||||||||||||||||||||
| Unrealized foreign currency translation gains (losses) | (1,750) | (1,847) | (1,623) | (1,109) | (2,013) | (1,661) | (3,289) | ||||||||||||||||||||||||||||||||||||||||||||||||||||||||||||||||||||||
| Unrealized gains (losses) on fixed maturity securities | 5,964 | 4,234 | 8,548 | 10,361 | 9,602 | 9,992 | 2,930 | ||||||||||||||||||||||||||||||||||||||||||||||||||||||||||||||||||||||
| Unrealized gains (losses) on derivatives | (23) | (24) | (33) | (34) | (30) | (33) | (29) | ||||||||||||||||||||||||||||||||||||||||||||||||||||||||||||||||||||||
| Pension liability adjustment | (163) | (212) | (277) | (284) | (166) | (279) | (160) | ||||||||||||||||||||||||||||||||||||||||||||||||||||||||||||||||||||||
| Treasury stock | (11,512) | (12,789) | (14,395) | (15,904) | (18,185) | (17,046) | (19,336) | ||||||||||||||||||||||||||||||||||||||||||||||||||||||||||||||||||||||
| Total shareholders' equity | 24,598 | 23,462 | 28,959 | 33,559 | 33,253 | 33,735 | 26,387 | ||||||||||||||||||||||||||||||||||||||||||||||||||||||||||||||||||||||
| Total liabilities & shareholders' equity | $ | 137,217 | $ | 140,406 | $ | 152,768 | $ | 165,086 | $ | 157,542 | $ | 161,492 | $ | 135,629 | |||||||||||||||||||||||||||||||||||||||||||||||||||||||||||||||
| Aflac Incorporated and Subsidiaries | |||||||||||||||||||||||||||||||||||||||||||||||||||||||||||||||||||||||||||||||||||
| Quarterly Financial Results | |||||||||||||||||||||||||||||||||||||||||||||||||||||||||||||||||||||||||||||||||||
| (Dollars In Millions, except per-share data) | |||||||||||||||||||||||||||||||||||||||||||||||||||||||||||||||||||||||||||||||||||
| Total | |||||||||||||||||||||||||||||||||||||||||||||||||||||||||||||||||||||||||||||||||||
| Net | Net | Benefits | Acquisitions | Total | Net EPS | Adj. EPS (1) |
|||||||||||||||||||||||||||||||||||||||||||||||||||||||||||||||||||||||||||||
| Earned | Inv. | Total | & | & | Pretax | Net | Adjusted | ||||||||||||||||||||||||||||||||||||||||||||||||||||||||||||||||||||||||||||
| Period | Premiums | Income | Revenues | Claims | Adj. Exp. | Earn. | Earn. | Earn. (1) |
Basic | Dil. | Basic | Dil. | |||||||||||||||||||||||||||||||||||||||||||||||||||||||||||||||||||||||
| 2017 | 18,531 | 3,220 | 21,667 | 12,181 | 5,468 | 4,018 | 4,604 | 2,716 | 5.81 | 5.77 | 3.43 | 3.40 | |||||||||||||||||||||||||||||||||||||||||||||||||||||||||||||||||||||||
| 2018 | 18,677 | 3,442 | 21,758 | 12,000 | 5,775 | 3,983 | 2,920 | 3,226 | 3.79 | 3.77 | 4.20 | 4.16 | |||||||||||||||||||||||||||||||||||||||||||||||||||||||||||||||||||||||
| 2019 | 18,780 | 3,578 | 22,307 | 11,942 | 5,920 | 4,445 | 3,304 | 3,314 | 4.45 | 4.43 | 4.46 | 4.44 | |||||||||||||||||||||||||||||||||||||||||||||||||||||||||||||||||||||||
| 2020 | 18,622 | 3,638 | 22,147 | 11,796 | 6,192 | 4,159 | 4,778 | 3,552 | 6.69 | 6.67 | 4.98 | 4.96 | |||||||||||||||||||||||||||||||||||||||||||||||||||||||||||||||||||||||
| 2021 | 17,647 | 3,818 | 22,106 | 10,576 | 6,208 | 5,322 | 4,325 | 4,019 | 6.42 | 6.39 | 5.97 | 5.94 | |||||||||||||||||||||||||||||||||||||||||||||||||||||||||||||||||||||||
| 2020 | 1 | 4,681 | 904 | 5,162 | 2,939 | 1,503 | 720 | 566 | 882 | .78 | .78 | 1.22 | 1.21 | ||||||||||||||||||||||||||||||||||||||||||||||||||||||||||||||||||||||
| 2 | 4,664 | 870 | 5,407 | 2,897 | 1,440 | 1,070 | 805 | 921 | 1.12 | 1.12 | 1.28 | 1.28 | |||||||||||||||||||||||||||||||||||||||||||||||||||||||||||||||||||||||
| 3 | 4,623 | 896 | 5,665 | 2,985 | 1,527 | 1,153 | 2,456 | 994 | 3.45 | 3.44 | 1.40 | 1.39 | |||||||||||||||||||||||||||||||||||||||||||||||||||||||||||||||||||||||
| 4 | 4,653 | 968 | 5,913 | 2,974 | 1,723 | 1,216 | 951 | 755 | 1.36 | 1.35 | 1.08 | 1.07 | |||||||||||||||||||||||||||||||||||||||||||||||||||||||||||||||||||||||
| 2021 | 1 | 4,593 | 925 | 5,869 | 2,735 | 1,531 | 1,603 | 1,293 | 1,058 | 1.88 | 1.87 | 1.54 | 1.53 | ||||||||||||||||||||||||||||||||||||||||||||||||||||||||||||||||||||||
| 2 | 4,441 | 993 | 5,564 | 2,653 | 1,538 | 1,373 | 1,105 | 1,080 | 1.63 | 1.62 | 1.59 | 1.59 | |||||||||||||||||||||||||||||||||||||||||||||||||||||||||||||||||||||||
| 3 | 4,372 | 991 | 5,237 | 2,609 | 1,515 | 1,113 | 888 | 1,031 | 1.33 | 1.32 | 1.54 | 1.53 | |||||||||||||||||||||||||||||||||||||||||||||||||||||||||||||||||||||||
| 4 | 4,242 | 910 | 5,433 | 2,581 | 1,619 | 1,233 | 1,039 | 850 | 1.58 | 1.57 | 1.29 | 1.28 | |||||||||||||||||||||||||||||||||||||||||||||||||||||||||||||||||||||||
| 2022 | 1 | 4,178 | 903 | 5,272 | 2,487 | 1,509 | 1,276 | 1,032 | 927 | 1.59 | 1.58 | 1.43 | 1.42 | ||||||||||||||||||||||||||||||||||||||||||||||||||||||||||||||||||||||
| 2 | 3,849 | 937 | 5,400 | 2,298 | 1,401 | 1,701 | 1,388 | 939 | 2.17 | 2.16 | 1.47 | 1.46 | |||||||||||||||||||||||||||||||||||||||||||||||||||||||||||||||||||||||
| Aflac Incorporated and Subsidiaries | |||||||||||||||||||||||||||||||||||||||||||||||
| Quarterly Book Value Per Share | |||||||||||||||||||||||||||||||||||||||||||||||
| (Dollars In Millions, except per-share data) | |||||||||||||||||||||||||||||||||||||||||||||||
| Adjusted BV | |||||||||||||||||||||||||||||||||||||||||||||||
| Adjusted BV | Per Share Incl | ||||||||||||||||||||||||||||||||||||||||||||||
| Equity | AOCI | Adjusted BV | Per Share Incl | Foreign Currency | |||||||||||||||||||||||||||||||||||||||||||
| BV Per | BV Per | Adjusted BV | Per Share | Foreign Currency | Translation G/(L) | ||||||||||||||||||||||||||||||||||||||||||
| Period | Share | Share | Per Share (1) |
% Change | Translation G/(L)(1) |
% Change | |||||||||||||||||||||||||||||||||||||||||
| 2017 | 31.50 | 5.16 | 26.34 | 19.7% | 24.10 | 23.3% | |||||||||||||||||||||||||||||||||||||||||
| 2018 | 31.06 | 2.85 | 28.22 | 7.1% | 25.77 | 6.9% | |||||||||||||||||||||||||||||||||||||||||
| 2019 | 39.84 | 9.10 | 30.74 | 8.9% | 28.51 | 10.6% | |||||||||||||||||||||||||||||||||||||||||
| 2020 | 48.46 | 12.90 | 35.56 | 15.7% | 33.96 | 19.1% | |||||||||||||||||||||||||||||||||||||||||
| 2021 | 50.99 | 11.34 | 39.65 | 11.5% | 36.57 | 7.7% | |||||||||||||||||||||||||||||||||||||||||
| 2020 | 1 | 36.75 | 5.83 | 30.92 | 7.0% | 28.77 | 8.9% | ||||||||||||||||||||||||||||||||||||||||
| 2 | 41.21 | 9.45 | 31.75 | 7.5% | 29.70 | 7.7% | |||||||||||||||||||||||||||||||||||||||||
| 3 | 46.16 | 11.25 | 34.91 | 15.7% | 33.08 | 17.4% | |||||||||||||||||||||||||||||||||||||||||
| 4 | 48.46 | 12.90 | 35.56 | 15.7% | 33.96 | 19.1% | |||||||||||||||||||||||||||||||||||||||||
| 2021 | 1 | 47.16 | 10.00 | 37.16 | 20.2% | 34.70 | 20.6% | ||||||||||||||||||||||||||||||||||||||||
| 2 | 50.20 | 11.93 | 38.27 | 20.5% | 35.80 | 20.5% | |||||||||||||||||||||||||||||||||||||||||
| 3 | 50.62 | 11.56 | 39.06 | 11.9% | 36.41 | 10.1% | |||||||||||||||||||||||||||||||||||||||||
| 4 | 50.99 | 11.34 | 39.65 | 11.5% | 36.57 | 7.7% | |||||||||||||||||||||||||||||||||||||||||
| 2022 | 1 | 45.75 | 4.82 | 40.93 | 10.1% | 37.08 | 6.9% | ||||||||||||||||||||||||||||||||||||||||
| 2 | 41.59 | (0.86) | 42.45 | 10.9% | 37.27 | 4.1% | |||||||||||||||||||||||||||||||||||||||||
| Aflac Incorporated and Subsidiaries | |||||||||||||||||||||||||||||||||||||||||||||||||||||||||||||||||||||||||||||||||||
| Return on Equity | |||||||||||||||||||||||||||||||||||||||||||||||||||||||||||||||||||||||||||||||||||
| Year ended December 31, | 3 months ended June 30, | 6 months ended June 30, | |||||||||||||||||||||||||||||||||||||||||||||||||||||||||||||||||||||||||||||||||
| 2017 | 2018 | 2019 | 2020 | 2021 | 2021 | 2022 | 2021 | 2022 | |||||||||||||||||||||||||||||||||||||||||||||||||||||||||||||||||||||||||||
U.S. GAAP ROE (1) - Net earnings |
20.4 | % | 12.2 | % | 12.6 | % | 15.3 | % | 12.9 | % | 13.4 | % | 19.9 | % | 14.3 | % | 16.2 | % | |||||||||||||||||||||||||||||||||||||||||||||||||||||||||||||||||
| Impact of excluding unrealized foreign currency translation gains (losses) | (2.0) | (1.0) | (1.0) | (0.9) | (0.8) | (0.9) | (2.2) | (0.8) | (1.6) | ||||||||||||||||||||||||||||||||||||||||||||||||||||||||||||||||||||||||||
| Impact of excluding unrealized gains (losses) on securities and derivatives | 5.8 | 3.0 | 3.6 | 6.2 | 5.1 | 4.9 | 3.4 | 5.7 | 3.8 | ||||||||||||||||||||||||||||||||||||||||||||||||||||||||||||||||||||||||||
| Impact of excluding pension liability adjustment | (0.2) | (0.1) | (0.1) | (0.2) | (0.1) | (0.1) | (0.1) | (0.2) | (0.1) | ||||||||||||||||||||||||||||||||||||||||||||||||||||||||||||||||||||||||||
| Impact of excluding AOCI | 3.6 | 1.8 | 2.5 | 5.1 | 4.2 | 3.9 | 1.0 | 4.8 | 2.1 | ||||||||||||||||||||||||||||||||||||||||||||||||||||||||||||||||||||||||||
| U.S. GAAP ROE - less AOCI | 24.0 | 13.9 | 15.1 | 20.3 | 17.1 | 17.3 | 20.8 | 19.1 | 18.3 | ||||||||||||||||||||||||||||||||||||||||||||||||||||||||||||||||||||||||||
Differences between adjusted earnings and net earnings (2) |
(9.8) | 1.5 | 0.0 | (5.2) | (1.2) | (0.4) | (6.7) | (2.1) | (4.2) | ||||||||||||||||||||||||||||||||||||||||||||||||||||||||||||||||||||||||||
Adjusted ROE - reported (3) |
14.2 | 15.4 | 15.2 | 15.1 | 15.9 | 16.9 | 14.1 | 17.0 | 14.1 | ||||||||||||||||||||||||||||||||||||||||||||||||||||||||||||||||||||||||||
(1) |
U.S. GAAP ROE is calculated by dividing net earnings (annualized) by average shareholders' equity. | ||||||||||||||||||||||||||||||||||||||||||||||||||||||||||||||||||||||||||||||||||
(2) |
See separate reconciliation of net income to adjusted earnings. | ||||||||||||||||||||||||||||||||||||||||||||||||||||||||||||||||||||||||||||||||||
(3) |
See non-U.S. GAAP financial measures for definition of adjusted return on equity |
||||||||||||||||||||||||||||||||||||||||||||||||||||||||||||||||||||||||||||||||||
| Aflac Incorporated and Subsidiaries | |||||||||||||||||||||||||||||||||||||||||||||||||||||||||||
Adjusted Earnings Per Share Excluding Current Period Foreign Currency Impact (1) |
|||||||||||||||||||||||||||||||||||||||||||||||||||||||||||
| (Diluted Basis) | |||||||||||||||||||||||||||||||||||||||||||||||||||||||||||
| Change | |||||||||||||||||||||||||||||||||||||||||||||||||||||||||||
| QTD | YTD | Excluding | Excluding | ||||||||||||||||||||||||||||||||||||||||||||||||||||||||
| Foreign | Foreign | Foreign | Foreign | ||||||||||||||||||||||||||||||||||||||||||||||||||||||||
| Adjusted | Currency | Currency | Currency | Currency | |||||||||||||||||||||||||||||||||||||||||||||||||||||||
| Period | EPS(1) |
Growth | Impact(1) |
Impact(1) |
Impact(1) |
Impact | |||||||||||||||||||||||||||||||||||||||||||||||||||||
| 2017 | $ | 3.40 | 4.6 | % | N/A | (.05) | $ | 3.45 | 6.2 | % | |||||||||||||||||||||||||||||||||||||||||||||||||
| 2018 | $ | 4.16 | 22.4 | % | N/A | .04 | $ | 4.13 | 21.5 | % | |||||||||||||||||||||||||||||||||||||||||||||||||
| 2019 | $ | 4.44 | 6.7 | % | N/A | .02 | $ | 4.42 | 6.3 | % | |||||||||||||||||||||||||||||||||||||||||||||||||
| 2020 | $ | 4.96 | 11.7 | % | N/A | .04 | $ | 4.92 | 10.8 | % | |||||||||||||||||||||||||||||||||||||||||||||||||
| 2021 | $ | 5.94 | 19.8 | % | N/A | (.06) | $ | 6.00 | 21.0 | % | |||||||||||||||||||||||||||||||||||||||||||||||||
| 2020 | 1 | $ | 1.21 | 8.0 | % | .01 | .01 | $ | 1.20 | 7.1 | % | ||||||||||||||||||||||||||||||||||||||||||||||||
| 2 | 1.28 | 13.3 | .01 | .02 | 1.27 | 12.4 | |||||||||||||||||||||||||||||||||||||||||||||||||||||
| 3 | 1.39 | 19.8 | — | .02 | 1.39 | 19.8 | |||||||||||||||||||||||||||||||||||||||||||||||||||||
| 4 | 1.07 | 3.9 | .02 | .04 | 1.05 | 1.9 | |||||||||||||||||||||||||||||||||||||||||||||||||||||
| $ | 4.96 | 11.7 | % | $ | 4.92 | 10.8 | % | ||||||||||||||||||||||||||||||||||||||||||||||||||||
| 2021 | 1 | $ | 1.53 | 26.4 | % | .02 | .02 | $ | 1.51 | 24.8 | % | ||||||||||||||||||||||||||||||||||||||||||||||||
| 2 | 1.59 | 24.2 | (.01) | .01 | 1.59 | 24.2 | |||||||||||||||||||||||||||||||||||||||||||||||||||||
| 3 | 1.53 | 10.1 | (.02) | (.01) | 1.56 | 12.2 | |||||||||||||||||||||||||||||||||||||||||||||||||||||
| 4 | 1.28 | 19.6 | (.05) | (.06) | 1.33 | 24.3 | |||||||||||||||||||||||||||||||||||||||||||||||||||||
| $ | 5.94 | 19.8 | % | $ | 6.00 | 21.0 | % | ||||||||||||||||||||||||||||||||||||||||||||||||||||
| 2022 | 1 | $ | 1.42 | (7.2) | % | (.06) | (.06) | $ | 1.48 | (3.3) | % | ||||||||||||||||||||||||||||||||||||||||||||||||
| 2 | 1.46 | (8.2) | (.09) | — | 1.55 | (2.5) | |||||||||||||||||||||||||||||||||||||||||||||||||||||
| $ | 2.88 | (7.4) | % | $ | 3.02 | (2.9) | % | ||||||||||||||||||||||||||||||||||||||||||||||||||||
(1) See non-U.S.GAAP financial measures for definition of adjusted earnings and adjusted earnings excluding current period foreign currency impact |
|||||||||||||||||||||||||||||||||||||||||||||||||||||||||||
| Aflac Incorporated and Subsidiaries | |||||||||||||||||||||||||||||||||||||||||||||||||||||||||||||||||||||||||||||||||||||||||
| Composition of Invested Assets | |||||||||||||||||||||||||||||||||||||||||||||||||||||||||||||||||||||||||||||||||||||||||
| (In Millions) | |||||||||||||||||||||||||||||||||||||||||||||||||||||||||||||||||||||||||||||||||||||||||
| December 31, | June 30, | ||||||||||||||||||||||||||||||||||||||||||||||||||||||||||||||||||||||||||||||||||||||||
| 2017 | 2018 | 2019 | 2020 | 2021 | 2021 | 2022 | |||||||||||||||||||||||||||||||||||||||||||||||||||||||||||||||||||||||||||||||||||
Fixed Maturity Securities(1) |
$ | 106,562 | $ | 107,174 | $ | 109,456 | $ | 116,056 | $ | 107,369 | $ | 111,353 | $ | 93,053 | |||||||||||||||||||||||||||||||||||||||||||||||||||||||||||||||||||||||||||
Commercial mortgage and other loans, net of allowance for credit losses (1) |
|||||||||||||||||||||||||||||||||||||||||||||||||||||||||||||||||||||||||||||||||||||||||
| Transitional Real Estate (floating rate) | 1,235 | 4,378 | 5,450 | 5,231 | 5,246 | 5,216 | 6,059 | ||||||||||||||||||||||||||||||||||||||||||||||||||||||||||||||||||||||||||||||||||
| Middle Market Loans (floating rate) | 859 | 1,478 | 2,412 | 3,635 | 4,601 | 4,262 | 4,979 | ||||||||||||||||||||||||||||||||||||||||||||||||||||||||||||||||||||||||||||||||||
| Commercial Mortgage Loans | 908 | 1,063 | 1,707 | 1,688 | 1,874 | 1,850 | 1,798 | ||||||||||||||||||||||||||||||||||||||||||||||||||||||||||||||||||||||||||||||||||
Total Commercial mortgage and other loans, net of allowance for credit losses(1) |
3,002 | 6,919 | 9,569 | 10,554 | 11,721 | 11,328 | 12,836 | ||||||||||||||||||||||||||||||||||||||||||||||||||||||||||||||||||||||||||||||||||
| Equity Securities, at FV through net earnings | 846 | 987 | 802 | 1,283 | 1,603 | 1,475 | 1,149 | ||||||||||||||||||||||||||||||||||||||||||||||||||||||||||||||||||||||||||||||||||
Alternatives(2) |
113 | 370 | 551 | 919 | 1,703 | 1,227 | 2,008 | ||||||||||||||||||||||||||||||||||||||||||||||||||||||||||||||||||||||||||||||||||
| Total Portfolio | $ | 110,523 | $ | 115,450 | $ | 120,378 | $ | 128,812 | $ | 122,396 | $ | 125,383 | $ | 109,046 | |||||||||||||||||||||||||||||||||||||||||||||||||||||||||||||||||||||||||||
| Unrealized Gains (Losses) on Invested Assets | |||||||||||||||||||||||||||||||||||||||||||||||||||||||||||||||||||||||||||||||||||||||||
| (In Millions) | |||||||||||||||||||||||||||||||||||||||||||||||||||||||||||||||||||||||||||||||||||||||||
| December 31, | June 30, | ||||||||||||||||||||||||||||||||||||||||||||||||||||||||||||||||||||||||||||||||||||||||
| 2017 | 2018 | 2019 | 2020 | 2021 | 2021 | 2022 | |||||||||||||||||||||||||||||||||||||||||||||||||||||||||||||||||||||||||||||||||||
| Fixed Maturity Securities | |||||||||||||||||||||||||||||||||||||||||||||||||||||||||||||||||||||||||||||||||||||||||
| Available For Sale - Gross Gains | $ | 9,985 | $ | 7,733 | $ | 12,266 | $ | 14,771 | $ | 13,566 | $ | 14,071 | $ | 7,326 | |||||||||||||||||||||||||||||||||||||||||||||||||||||||||||||||||||||||||||
| Available For Sale - Gross Losses | (804) | (1,694) | (375) | (481) | (239) | (249) | (2,441) | ||||||||||||||||||||||||||||||||||||||||||||||||||||||||||||||||||||||||||||||||||
| Total Available For Sale | 9,181 | 6,039 | 11,891 | 14,290 | 13,327 | 13,822 | 4,885 | ||||||||||||||||||||||||||||||||||||||||||||||||||||||||||||||||||||||||||||||||||
| Held to Maturity - Gross Gains | 6,651 | 6,470 | 7,519 | 5,935 | 4,869 | 5,263 | 3,025 | ||||||||||||||||||||||||||||||||||||||||||||||||||||||||||||||||||||||||||||||||||
| Held to Maturity - Gross Losses | (9) | (66) | (10) | — | — | — | — | ||||||||||||||||||||||||||||||||||||||||||||||||||||||||||||||||||||||||||||||||||
| Total Held to Maturity | $ | 6,642 | $ | 6,404 | $ | 7,509 | $ | 5,935 | $ | 4,869 | $ | 5,263 | $ | 3,025 | |||||||||||||||||||||||||||||||||||||||||||||||||||||||||||||||||||||||||||
| Credit Ratings on Fixed Maturities | |||||||||||||||||||||||||||||||||||||||||||||||||||||||||||||||||||||||||||||||||||||||||
| (At Amortized Cost) | |||||||||||||||||||||||||||||||||||||||||||||||||||||||||||||||||||||||||||||||||||||||||
| December 31, | |||||||||||||||||||||||||||||||||||||||||||||||||||||||||||||||||||||||||||||||||||||||||
| June 30, | |||||||||||||||||||||||||||||||||||||||||||||||||||||||||||||||||||||||||||||||||||||||||
| Credit Rating | 2017 | 2018 | 2019 | 2020 | 2021 | 2021 | 2022 | ||||||||||||||||||||||||||||||||||||||||||||||||||||||||||||||||||||||||||||||||||
| AAA | 1.0 | % | 1.0 | % | 1.1 | % | 1.0 | % | 1.0 | % | 1.0 | % | 1.5 | % | |||||||||||||||||||||||||||||||||||||||||||||||||||||||||||||||||||||||||||
| AA | 3.9 | 3.9 | 4.3 | 4.5 | 5.1 | 5.0 | 5.4 | ||||||||||||||||||||||||||||||||||||||||||||||||||||||||||||||||||||||||||||||||||
| A | 65.8 | 67.9 | 68.6 | 69.3 | 68.9 | 68.6 | 67.8 | ||||||||||||||||||||||||||||||||||||||||||||||||||||||||||||||||||||||||||||||||||
| BBB | 24.0 | 23.2 | 23.1 | 21.9 | 22.5 | 22.2 | 23.0 | ||||||||||||||||||||||||||||||||||||||||||||||||||||||||||||||||||||||||||||||||||
| BB or Lower | 5.3 | 4.0 | 2.9 | 3.3 | 2.5 | 3.2 | 2.3 | ||||||||||||||||||||||||||||||||||||||||||||||||||||||||||||||||||||||||||||||||||
| 100.0 | % | 100.0 | % | 100.0 | % | 100.0 | % | 100.0 | % | 100.0 | % | 100.0 | % | ||||||||||||||||||||||||||||||||||||||||||||||||||||||||||||||||||||||||||||
|
(1) Presented at amortized cost, net of reserves beginning in 2020
|
|||||||||||||||||||||||||||||||||||||||||||||||||||||||||||||||||||||||||||||||||||||||||
(2) Presented at carrying value; includes asset classes such as private equity and real estate managed by Global Investments; excludes Corporate driven activity |
|||||||||||||||||||||||||||||||||||||||||||||||||||||||||||||||||||||||||||||||||||||||||
| Aflac Incorporated and Subsidiaries | |||||||||||||||||||||||||||||||||||||||||||||||||||||||||||||||||
| Supplemental Investment Data by Segment | |||||||||||||||||||||||||||||||||||||||||||||||||||||||||||||||||
| 3 Months Ended | 6 Months Ended | ||||||||||||||||||||||||||||||||||||||||||||||||||||||||||||||||
| December 31, | June 30, | June 30, | |||||||||||||||||||||||||||||||||||||||||||||||||||||||||||||||
| 2017 | 2018 | 2019 | 2020 | 2021 | 2021 | 2022 | 2021 | 2022 | |||||||||||||||||||||||||||||||||||||||||||||||||||||||||
| Aflac Japan: | |||||||||||||||||||||||||||||||||||||||||||||||||||||||||||||||||
Invested assets (in millions)(1) |
¥ | 11,017,560 | ¥ | 11,442,444 | ¥ | 11,784,586 | ¥ | 11,936,087 | ¥ | 12,405,531 | ¥ | 12,315,861 | ¥ | 12,788,885 | ¥ | 12,315,861 | ¥ | 12,788,885 | |||||||||||||||||||||||||||||||||||||||||||||||
Return on average invested assets(2) |
2.31 | % | 2.33 | % | 2.33 | % | 2.38 | % | 2.72 | % | 2.83 | % | 2.97 | % | 2.65 | % | 2.75 | % | |||||||||||||||||||||||||||||||||||||||||||||||
Portfolio book yield at end of period(3) |
2.56 | % | 2.61 | % | 2.64 | % | 2.59 | % | 2.60 | % | 2.61 | % | 2.74 | % | 2.61 | % | 2.74 | % | |||||||||||||||||||||||||||||||||||||||||||||||
Total purchases for period (in millions)(3) |
¥ | 1,078,586 | ¥ | 1,298,376 | ¥ | 1,003,885 | ¥ | 714,124 | ¥ | 952,038 | ¥ | 184,717 | ¥ | 335,615 | ¥ | 524,107 | ¥ | 492,313 | |||||||||||||||||||||||||||||||||||||||||||||||
New money yield(3)(4) |
1.98 | % | 3.06 | % | 3.83 | % | 3.75 | % | 3.50 | % | 4.05 | % | 3.59 | % | 3.18 | % | 3.69 | % | |||||||||||||||||||||||||||||||||||||||||||||||
| Aflac U.S.: | |||||||||||||||||||||||||||||||||||||||||||||||||||||||||||||||||
Invested assets (in millions)(1) |
$ | 13,764 | $ | 13,798 | $ | 14,036 | $ | 14,848 | $ | 15,841 | $ | 15,452 | $ | 16,209 | $ | 15,452 | $ | 16,209 | |||||||||||||||||||||||||||||||||||||||||||||||
Return on average invested assets(2) |
5.07 | % | 5.16 | % | 5.70 | % | 4.90 | % | 4.87 | % | 4.94 | % | 4.79 | % | 4.83 | % | 4.79 | % | |||||||||||||||||||||||||||||||||||||||||||||||
Portfolio book yield at end of period(3) |
5.52 | % | 5.55 | % | 5.40 | % | 5.18 | % | 4.94 | % | 5.07 | % | 5.01 | % | 5.07 | % | 5.01 | % | |||||||||||||||||||||||||||||||||||||||||||||||
Total purchases for period (in millions)(3) |
$ | 1,434 | $ | 2,155 | $ | 1,835 | $ | 1,050 | $ | 2,130 | $ | 544 | $ | 466 | $ | 919 | $ | 988 | |||||||||||||||||||||||||||||||||||||||||||||||
New money yield(3)(4) |
4.49 | % | 4.55 | % | 4.51 | % | 3.04 | % | 3.41 | % | 3.63 | % | 4.10 | % | 3.47 | % | 4.37 | % | |||||||||||||||||||||||||||||||||||||||||||||||
Hedge Costs/Income Metrics (5)(6) |
|||||||||||||||||||||||||||||||||||||||||||||||||||||||||||||||||
| 3 Months Ended | 6 Months Ended | ||||||||||||||||||||||||||||||||||||||||||||||||||||||||||||||||
| December 31, | June 30, | June 30, | |||||||||||||||||||||||||||||||||||||||||||||||||||||||||||||||
| 2017 | 2018 | 2019 | 2020 | 2021 | 2021 | 2022 | 2021 | 2022 | |||||||||||||||||||||||||||||||||||||||||||||||||||||||||
| Aflac Japan: | |||||||||||||||||||||||||||||||||||||||||||||||||||||||||||||||||
FX hedged notional at end of period (in billions)(7) |
$ | 9.3 | $ | 9.9 | $ | 8.8 | $ | 6.0 | $ | 6.4 | $ | 6.4 | $ | 4.5 | $ | 6.4 | $ | 4.5 | |||||||||||||||||||||||||||||||||||||||||||||||
Weighted average remaining tenor (in months)(8) |
27.7 | 21.4 | 8.5 | 13.0 | 2.6 | 6.6 | 6.8 | 6.6 | 6.8 | ||||||||||||||||||||||||||||||||||||||||||||||||||||||||
| Amortized hedge costs for period (in millions) | $ | (228) | $ | (236) | $ | (257) | $ | (206) | $ | (76) | $ | (17) | $ | (30) | $ | (36) | $ | (55) | |||||||||||||||||||||||||||||||||||||||||||||||
| Corporate and Other (Parent Company): | |||||||||||||||||||||||||||||||||||||||||||||||||||||||||||||||||
FX hedged notional at end of period (in billions)(7) |
$ | — | $ | 2.5 | $ | 4.9 | $ | 5.0 | $ | 5.0 | $ | 5.0 | $ | 5.0 | $ | 5.0 | $ | 5.0 | |||||||||||||||||||||||||||||||||||||||||||||||
Weighted average remaining tenor (in months)(8) |
— | 16.1 | 13.7 | 12.1 | 11.5 | 12.6 | 13.0 | 12.6 | 13.0 | ||||||||||||||||||||||||||||||||||||||||||||||||||||||||
| Amortized hedge income (costs) for period (in millions) | $ | — | $ | 36 | $ | 89 | $ | 97 | $ | 57 | $ | 16 | $ | 14 | $ | 33 | $ | 25 | |||||||||||||||||||||||||||||||||||||||||||||||
(1) Invested assets, including cash and short term investments, are stated at amortized cost; except for equities, which are at fair value. |
|||||||||||||||||||||||||||||||||||||||||||||||||||||||||||||||||
(2) Net of investment expenses and amortized hedge costs, year-to-date number reflected on a quarterly average basis |
|||||||||||||||||||||||||||||||||||||||||||||||||||||||||||||||||
(3) Includes fixed maturity securities, commercial mortgage and other loans, equity securities, and excludes alternative investments in limited partnerships |
|||||||||||||||||||||||||||||||||||||||||||||||||||||||||||||||||
(4) Reported on a gross yield basis; excludes investment expenses, external management fees, and amortized hedge costs |
|||||||||||||||||||||||||||||||||||||||||||||||||||||||||||||||||
(5) See non-U.S. GAAP financial measures for definition of amortized hedge costs/income. Further, the metrics in this table are split to show the hedging of the market value of a portion of the USD investments in Japan Segment’s "USD Program" in the "Japan Segment Portfolio Allocation by Currency" table on page 13 of this supplement as well as the corporate hedging activities at Aflac Inc. |
|||||||||||||||||||||||||||||||||||||||||||||||||||||||||||||||||
(6) Aflac Japan and the Parent Company utilize foreign currency forwards and options to hedge foreign currency exchange rate risk. The hedge cost/income on the table above reflects our FX forward protection of the hedged USD portfolio, and hedge costs on one sided options used as caps, and on tail-risk put options. The table does not include the notional amount and weighted average remaining tenor for these options. At June 30, 2022, Aflac Japan caps and put options notional amount was $13.5 billion with a weighted average remaining tenor of 4.9 months. At June 30, 2022, the Parent Company caps notional amount was $2.0 billion with a weighted average remaining tenor of 7.9 months. |
|||||||||||||||||||||||||||||||||||||||||||||||||||||||||||||||||
(7) Notional is reported net of any offsetting positions within Aflac Japan or the Parent Company, respectively. |
|||||||||||||||||||||||||||||||||||||||||||||||||||||||||||||||||
(8) Tenor based on period reporting date to settlement date |
|||||||||||||||||||||||||||||||||||||||||||||||||||||||||||||||||
| Aflac Incorporated and Subsidiaries | ||||||||||||||||||||||||||||||||||||||||||||||||||||||||||||||||||||||||||
Japan Segment Portfolio Allocation by Currency (1) |
||||||||||||||||||||||||||||||||||||||||||||||||||||||||||||||||||||||||||
| (Dollars In Millions, U.S. GAAP Basis) | ||||||||||||||||||||||||||||||||||||||||||||||||||||||||||||||||||||||||||
| December 31, 2021 | June 30, 2022 | |||||||||||||||||||||||||||||||||||||||||||||||||||||||||||||||||||||||||
Amortized Cost (2) |
Fair Value |
Amortized Cost (2) |
Fair Value |
|||||||||||||||||||||||||||||||||||||||||||||||||||||||||||||||||||||||
| JGB | $ | 50,186 | $ | 57,862 | $ | 41,620 | $ | 45,262 | ||||||||||||||||||||||||||||||||||||||||||||||||||||||||||||||||||
| Other | 23,661 | 27,684 | 20,309 | 21,840 | ||||||||||||||||||||||||||||||||||||||||||||||||||||||||||||||||||||||
| Total yen denominated | 73,847 | 85,546 | 61,929 | 67,102 | ||||||||||||||||||||||||||||||||||||||||||||||||||||||||||||||||||||||
| USD Program | 28,913 | 31,946 | 27,286 | 29,399 | ||||||||||||||||||||||||||||||||||||||||||||||||||||||||||||||||||||||
| Other | 2,236 | 3,328 | 2,137 | 2,915 | ||||||||||||||||||||||||||||||||||||||||||||||||||||||||||||||||||||||
| US dollar denominated | 31,149 | 35,274 | 29,423 | 32,314 | ||||||||||||||||||||||||||||||||||||||||||||||||||||||||||||||||||||||
| Total | $ | 104,996 | $ | 120,820 | $ | 91,352 | $ | 99,416 | ||||||||||||||||||||||||||||||||||||||||||||||||||||||||||||||||||
| Distribution of Consolidated Fixed Maturities by Sector | ||||||||||||||||||||||||||||||||||||||||||||||||||||||||||||||||||||||||||
| June 30, 2022 | ||||||||||||||||||||||||||||||||||||||||||||||||||||||||||||||||||||||||||
| (In millions) | Amortized Cost (2) |
% of Total |
||||||||||||||||||||||||||||||||||||||||||||||||||||||||||||||||||||||||
| Government and agencies | $ | 42,836 | 46.0 | % | ||||||||||||||||||||||||||||||||||||||||||||||||||||||||||||||||||||||
| Municipalities | 2,557 | 2.7 | ||||||||||||||||||||||||||||||||||||||||||||||||||||||||||||||||||||||||
| Mortgage- and asset-backed securities | 1,915 | 2.1 | ||||||||||||||||||||||||||||||||||||||||||||||||||||||||||||||||||||||||
| Public utilities | 7,348 | 7.9 | ||||||||||||||||||||||||||||||||||||||||||||||||||||||||||||||||||||||||
| Electric | 5,966 | 6.4 | ||||||||||||||||||||||||||||||||||||||||||||||||||||||||||||||||||||||||
| Natural Gas | 242 | .3 | ||||||||||||||||||||||||||||||||||||||||||||||||||||||||||||||||||||||||
| Other | 554 | .6 | ||||||||||||||||||||||||||||||||||||||||||||||||||||||||||||||||||||||||
| Utility/Energy | 586 | .6 | ||||||||||||||||||||||||||||||||||||||||||||||||||||||||||||||||||||||||
| Sovereign and Supranational | 1,267 | 1.4 | ||||||||||||||||||||||||||||||||||||||||||||||||||||||||||||||||||||||||
| Banks/financial institutions | 9,172 | 9.8 | ||||||||||||||||||||||||||||||||||||||||||||||||||||||||||||||||||||||||
| Banking | 5,422 | 5.8 | ||||||||||||||||||||||||||||||||||||||||||||||||||||||||||||||||||||||||
| Insurance | 1,757 | 1.9 | ||||||||||||||||||||||||||||||||||||||||||||||||||||||||||||||||||||||||
| Other | 1,993 | 2.1 | ||||||||||||||||||||||||||||||||||||||||||||||||||||||||||||||||||||||||
| Other corporate | 27,958 | 30.1 | ||||||||||||||||||||||||||||||||||||||||||||||||||||||||||||||||||||||||
| Basic Industry | 2,448 | 2.6 | ||||||||||||||||||||||||||||||||||||||||||||||||||||||||||||||||||||||||
| Capital Goods | 3,172 | 3.4 | ||||||||||||||||||||||||||||||||||||||||||||||||||||||||||||||||||||||||
| Communications | 2,830 | 3.0 | ||||||||||||||||||||||||||||||||||||||||||||||||||||||||||||||||||||||||
| Consumer Cyclical | 2,371 | 2.5 | ||||||||||||||||||||||||||||||||||||||||||||||||||||||||||||||||||||||||
| Consumer Non-Cyclical | 6,224 | 6.8 | ||||||||||||||||||||||||||||||||||||||||||||||||||||||||||||||||||||||||
| Energy | 2,749 | 3.0 | ||||||||||||||||||||||||||||||||||||||||||||||||||||||||||||||||||||||||
| Other | 1,312 | 1.4 | ||||||||||||||||||||||||||||||||||||||||||||||||||||||||||||||||||||||||
| Technology | 3,722 | 4.0 | ||||||||||||||||||||||||||||||||||||||||||||||||||||||||||||||||||||||||
| Transportation | 3,130 | 3.4 | ||||||||||||||||||||||||||||||||||||||||||||||||||||||||||||||||||||||||
| Total fixed maturity securities | $ | 93,053 | 100.0 | % | ||||||||||||||||||||||||||||||||||||||||||||||||||||||||||||||||||||||
(1) The entire U.S. segment investment portfolio is U.S. dollar denominated. |
||||||||||||||||||||||||||||||||||||||||||||||||||||||||||||||||||||||||||
(2) Net of reserves |
||||||||||||||||||||||||||||||||||||||||||||||||||||||||||||||||||||||||||
| Aflac Incorporated and Subsidiaries | |||||||||||||||||||||||||||||||||||||||||||||||||||||||||||||||||||||||||||||||||||||||||||||||||||||||||||||||||
| Long-Term Debt Data | |||||||||||||||||||||||||||||||||||||||||||||||||||||||||||||||||||||||||||||||||||||||||||||||||||||||||||||||||
| Adjusted Leverage Ratios | |||||||||||||||||||||||||||||||||||||||||||||||||||||||||||||||||||||||||||||||||||||||||||||||||||||||||||||||||
| (In Millions) | |||||||||||||||||||||||||||||||||||||||||||||||||||||||||||||||||||||||||||||||||||||||||||||||||||||||||||||||||
| December 31, | June 30, | ||||||||||||||||||||||||||||||||||||||||||||||||||||||||||||||||||||||||||||||||||||||||||||||||||||||||||||||||
| 2017 | 2018 | 2019 | 2020 | 2021 | 2021 | 2022 | |||||||||||||||||||||||||||||||||||||||||||||||||||||||||||||||||||||||||||||||||||||||||||||||||||||||||||
| Notes payable | $ | 5,289 | $ | 5,778 | $ | 6,569 | $ | 7,899 | $ | 7,956 | $ | 8,121 | $ | 7,416 | |||||||||||||||||||||||||||||||||||||||||||||||||||||||||||||||||||||||||||||||||||||||||||||||||||
| 50% of subordinated debentures and perpetual bonds | (263) | (268) | (408) | (432) | (389) | (404) | (327) | ||||||||||||||||||||||||||||||||||||||||||||||||||||||||||||||||||||||||||||||||||||||||||||||||||||||||||
| Pre-funding of debt maturities | — | — | (348) | — | — | — | — | ||||||||||||||||||||||||||||||||||||||||||||||||||||||||||||||||||||||||||||||||||||||||||||||||||||||||||
Adjusted debt (1) |
5,026 | 5,510 | 5,814 | 7,467 | 7,568 | 7,717 | 7,089 | ||||||||||||||||||||||||||||||||||||||||||||||||||||||||||||||||||||||||||||||||||||||||||||||||||||||||||
| Total Shareholders' Equity | 24,598 | 23,462 | 28,959 | 33,559 | 33,253 | 33,735 | 26,387 | ||||||||||||||||||||||||||||||||||||||||||||||||||||||||||||||||||||||||||||||||||||||||||||||||||||||||||
| Accumulated other comprehensive (income) loss: | |||||||||||||||||||||||||||||||||||||||||||||||||||||||||||||||||||||||||||||||||||||||||||||||||||||||||||||||||
| Unrealized foreign currency translation (gains) losses | 1,750 | 1,847 | 1,623 | 1,109 | 2,013 | 1,661 | 3,289 | ||||||||||||||||||||||||||||||||||||||||||||||||||||||||||||||||||||||||||||||||||||||||||||||||||||||||||
| Unrealized (gains) losses on fixed maturity securities | (5,964) | (4,234) | (8,548) | (10,361) | (9,602) | (9,992) | (2,930) | ||||||||||||||||||||||||||||||||||||||||||||||||||||||||||||||||||||||||||||||||||||||||||||||||||||||||||
| Unrealized (gains) losses on derivatives | 23 | 24 | 33 | 34 | 30 | 33 | 29 | ||||||||||||||||||||||||||||||||||||||||||||||||||||||||||||||||||||||||||||||||||||||||||||||||||||||||||
| Pension liability adjustment | 163 | 212 | 277 | 284 | 166 | 279 | 160 | ||||||||||||||||||||||||||||||||||||||||||||||||||||||||||||||||||||||||||||||||||||||||||||||||||||||||||
Adjusted book value (1) |
20,570 | 21,311 | 22,344 | 24,625 | 25,860 | 25,716 | 26,935 | ||||||||||||||||||||||||||||||||||||||||||||||||||||||||||||||||||||||||||||||||||||||||||||||||||||||||||
Adjusted capitalization ex-AOCI (1) (2) |
$ | 25,859 | $ | 27,089 | $ | 28,565 | $ | 32,524 | $ | 33,816 | $ | 33,837 | $ | 34,351 | |||||||||||||||||||||||||||||||||||||||||||||||||||||||||||||||||||||||||||||||||||||||||||||||||||
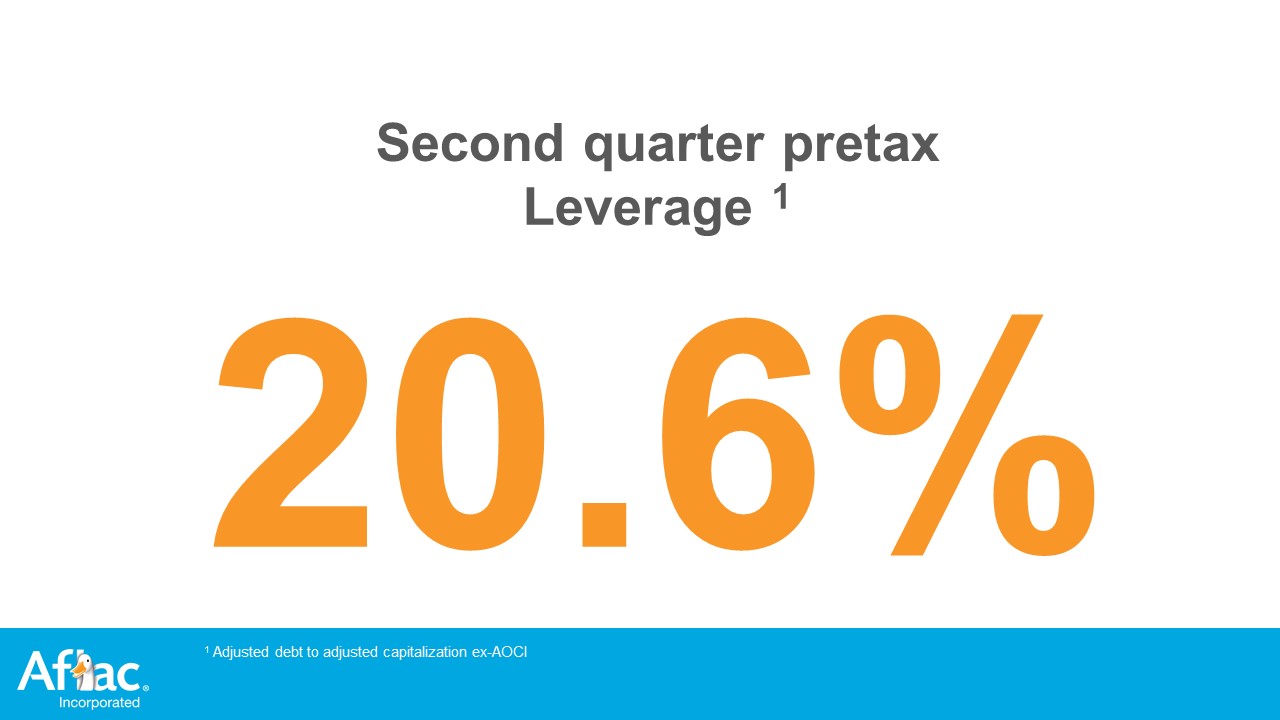
| Adjusted debt to adjusted capitalization ex-AOCI | 19.4 | % | 20.3 | % | 20.4 | % | 23.0 | % | 22.4 | % | 22.8 | % | 20.6 | % | |||||||||||||||||||||||||||||||||||||||||||||||||||||||||||||||||||||||||||||||||||||||||||||||||||
Adjusted capitalization (1) (3) |
$ | 23,946 | $ | 25,030 | $ | 26,665 | $ | 31,131 | $ | 31,637 | $ | 31,897 | $ | 30,902 | |||||||||||||||||||||||||||||||||||||||||||||||||||||||||||||||||||||||||||||||||||||||||||||||||||
| Adjusted debt to adjusted capitalization | 21.0 | % | 22.0 | % | 21.8 | % | 24.0 | % | 23.9 | % | 24.2 | % | 22.9 | % | |||||||||||||||||||||||||||||||||||||||||||||||||||||||||||||||||||||||||||||||||||||||||||||||||||
Debt Maturities(4) | ||||||||||||||||||||||||||||||||||||||||||||||||||||||||||||||||||||||||||||||||||||||||||||||||||||||||||||||
| (In Millions) | ||||||||||||||||||||||||||||||||||||||||||||||||||||||||||||||||||||||||||||||||||||||||||||||||||||||||||||||
| June 30, 2022 | ||||||||||||||||||||||||||||||||||||||||||||||||||||||||||||||||||||||||||||||||||||||||||||||||||||||||||||||
| ≤ 1 year | 1 > 5 years | 5 > 10 years | 10 > 20 years | 20 years + | Total | |||||||||||||||||||||||||||||||||||||||||||||||||||||||||||||||||||||||||||||||||||||||||||||||||||||||||
| Senior Notes | $ | — | $ | 2,466 | $ | 2,026 | $ | 1,086 | $ | 1,096 | $ | 6,674 | ||||||||||||||||||||||||||||||||||||||||||||||||||||||||||||||||||||||||||||||||||||||||||||||||||
| Subordinated debt | — | — | — | — | 658 | 658 | ||||||||||||||||||||||||||||||||||||||||||||||||||||||||||||||||||||||||||||||||||||||||||||||||||||||||
| Total | $ | — | $ | 2,466 | $ | 2,026 | $ | 1,086 | $ | 1,754 | $ | 7,332 | ||||||||||||||||||||||||||||||||||||||||||||||||||||||||||||||||||||||||||||||||||||||||||||||||||
| Insurer Financial Strength Ratings | ||||||||||||||||||||||||||||||||||||||
| AM Best | Moody's | S&P | JCR | R&I | ||||||||||||||||||||||||||||||||||
| U.S. Operating Companies | ||||||||||||||||||||||||||||||||||||||
| Aflac of Columbus | A+ | Aa3 | A+ | AA | AA | |||||||||||||||||||||||||||||||||
| Aflac of New York | A+ | _ | A+ | _ | _ | |||||||||||||||||||||||||||||||||
| Continental American Insurance Company | A+ | _ | _ | _ | _ | |||||||||||||||||||||||||||||||||
| Japan Operating Company | ||||||||||||||||||||||||||||||||||||||
| Aflac Life Insurance Japan Ltd. | A+ | Aa3 | A+ | AA | AA | |||||||||||||||||||||||||||||||||
| Issuer Credit Ratings | ||||||||||||||||||||||||||||||||||||||
| AM Best | Moody's | S&P | JCR | R&I | ||||||||||||||||||||||||||||||||||
| Aflac Incorporated | ||||||||||||||||||||||||||||||||||||||
| Long-term Senior Debt | a | A3 | A- | A+ | A+ | |||||||||||||||||||||||||||||||||
| Junior Subordinated Debt | a- | Baa1 | BBB | _ | A- | |||||||||||||||||||||||||||||||||
| Aflac of Columbus | ||||||||||||||||||||||||||||||||||||||
| Long-term Senior Debt | aa | _ | A+ | AA | _ | |||||||||||||||||||||||||||||||||
| Aflac Life Insurance Japan, Ltd. | ||||||||||||||||||||||||||||||||||||||
| Long-term Senior Debt | aa | _ | A+ | AA | _ | |||||||||||||||||||||||||||||||||
| Subordinated Bonds | _ | _ | _ | AA- | _ | |||||||||||||||||||||||||||||||||
| The outlook for all ratings assigned by A.M. Best, S&P, Moody's, JCR and R&I is stable. | ||||||||||||||||||||||||||||||||||||||
| Aflac U.S. | ||||||||||||||||||||||||||||||||||||||||||||||||||||||||||||||||||||||||||||||||||||||||||||||||||||||||
| Statements of Pretax Adjusted Earnings | ||||||||||||||||||||||||||||||||||||||||||||||||||||||||||||||||||||||||||||||||||||||||||||||||||||||||
| (Before Management Fee) | ||||||||||||||||||||||||||||||||||||||||||||||||||||||||||||||||||||||||||||||||||||||||||||||||||||||||
| (In Millions) | ||||||||||||||||||||||||||||||||||||||||||||||||||||||||||||||||||||||||||||||||||||||||||||||||||||||||
| Years Ended December 31, | 3 Months Ended June 30, | 6 Months Ended June 30, | ||||||||||||||||||||||||||||||||||||||||||||||||||||||||||||||||||||||||||||||||||||||||||||||||||||||
| % | % | |||||||||||||||||||||||||||||||||||||||||||||||||||||||||||||||||||||||||||||||||||||||||||||||||||||||
| 2017 | 2018 | 2019 | 2020 | 2021 | 2021 | 2022 | Change | 2021 | 2022 | Change | ||||||||||||||||||||||||||||||||||||||||||||||||||||||||||||||||||||||||||||||||||||||||||||||
| Revenues: | ||||||||||||||||||||||||||||||||||||||||||||||||||||||||||||||||||||||||||||||||||||||||||||||||||||||||
| Net earned premiums | ||||||||||||||||||||||||||||||||||||||||||||||||||||||||||||||||||||||||||||||||||||||||||||||||||||||||
| Gross premiums | $ | 5,563 | $ | 5,711 | $ | 5,818 | $ | 5,762 | $ | 5,540 | $ | 1,388 | $ | 1,364 | $ | 2,793 | $ | 2,748 | ||||||||||||||||||||||||||||||||||||||||||||||||||||||||||||||||||||||||||||||||||||||
| Assumed (ceded) | — | (3) | (11) | (4) | 73 | 20 | 30 | 37 | 60 | |||||||||||||||||||||||||||||||||||||||||||||||||||||||||||||||||||||||||||||||||||||||||||||||
| Total net earned premiums | 5,563 | 5,708 | 5,808 | 5,758 | 5,614 | 1,408 | 1,394 | (1.0) | 2,830 | 2,807 | (.8) | |||||||||||||||||||||||||||||||||||||||||||||||||||||||||||||||||||||||||||||||||||||||||||||
Adjusted net investment income |
721 | 727 | 720 | 705 | 754 | 189 | 193 | 2.1 | 366 | 377 | 3.0 | |||||||||||||||||||||||||||||||||||||||||||||||||||||||||||||||||||||||||||||||||||||||||||||
| Other income excl. realized foreign | ||||||||||||||||||||||||||||||||||||||||||||||||||||||||||||||||||||||||||||||||||||||||||||||||||||||||
| exchange gains (losses) | 5 | 8 | 22 | 102 | 121 | 30 | 41 | 58 | 83 | |||||||||||||||||||||||||||||||||||||||||||||||||||||||||||||||||||||||||||||||||||||||||||||||
| Total adjusted revenues | 6,289 | 6,443 | 6,550 | 6,565 | 6,489 | 1,627 | 1,628 | .1 | 3,254 | 3,267 | .4 | |||||||||||||||||||||||||||||||||||||||||||||||||||||||||||||||||||||||||||||||||||||||||||||
| Benefits and claims: | ||||||||||||||||||||||||||||||||||||||||||||||||||||||||||||||||||||||||||||||||||||||||||||||||||||||||
| Benefits and claims, net | ||||||||||||||||||||||||||||||||||||||||||||||||||||||||||||||||||||||||||||||||||||||||||||||||||||||||
| Incurred claims -direct | 2,526 | 2,560 | 2,611 | 2,498 | 2,174 | 525 | 566 | 1,018 | 1,157 | |||||||||||||||||||||||||||||||||||||||||||||||||||||||||||||||||||||||||||||||||||||||||||||||
| Incurred claims -assumed (ceded) | (4) | (4) | (5) | (1) | 89 | 22 | 30 | 41 | 67 | |||||||||||||||||||||||||||||||||||||||||||||||||||||||||||||||||||||||||||||||||||||||||||||||
| Increase in FPB -direct | 363 | 331 | 268 | 271 | 187 | 66 | 38 | 112 | 32 | |||||||||||||||||||||||||||||||||||||||||||||||||||||||||||||||||||||||||||||||||||||||||||||||
| Increase in FPB -assumed (ceded) | — | (1) | (2) | (3) | (3) | — | (1) | (1) | (1) | |||||||||||||||||||||||||||||||||||||||||||||||||||||||||||||||||||||||||||||||||||||||||||||||
| Total net benefits and claims | 2,885 | 2,887 | 2,871 | 2,765 | 2,447 | 613 | 633 | 3.3 | 1,169 | 1,255 | 7.4 | |||||||||||||||||||||||||||||||||||||||||||||||||||||||||||||||||||||||||||||||||||||||||||||
| Adjusted expenses: | ||||||||||||||||||||||||||||||||||||||||||||||||||||||||||||||||||||||||||||||||||||||||||||||||||||||||
| Amortization of deferred policy | ||||||||||||||||||||||||||||||||||||||||||||||||||||||||||||||||||||||||||||||||||||||||||||||||||||||||
| acquisition costs | 502 | 534 | 573 | 570 | 517 | 111 | 131 | 18.0 | 250 | 299 | 19.6 | |||||||||||||||||||||||||||||||||||||||||||||||||||||||||||||||||||||||||||||||||||||||||||||
| Insurance commissions | 580 | 585 | 590 | 576 | 550 | 136 | 137 | .7 | 275 | 277 | .7 | |||||||||||||||||||||||||||||||||||||||||||||||||||||||||||||||||||||||||||||||||||||||||||||
| Insurance and other expenses | 1,077 | 1,152 | 1,244 | 1,386 | 1,498 | 354 | 378 | 6.8 | 701 | 762 | 8.7 | |||||||||||||||||||||||||||||||||||||||||||||||||||||||||||||||||||||||||||||||||||||||||||||
| Total adjusted expenses | 2,159 | 2,271 | 2,407 | 2,532 | 2,564 | 601 | 645 | 1,226 | 1,337 | |||||||||||||||||||||||||||||||||||||||||||||||||||||||||||||||||||||||||||||||||||||||||||||||
| Total benefits and adjusted expenses | 5,044 | 5,158 | 5,279 | 5,297 | 5,011 | 1,213 | 1,278 | 5.4 | 2,396 | 2,593 | 8.2 | |||||||||||||||||||||||||||||||||||||||||||||||||||||||||||||||||||||||||||||||||||||||||||||
| Pretax adjusted earnings | $ | 1,245 | $ | 1,285 | $ | 1,272 | $ | 1,268 | $ | 1,478 | $ | 413 | $ | 349 | (15.5) | $ | 859 | $ | 674 | (21.5) | ||||||||||||||||||||||||||||||||||||||||||||||||||||||||||||||||||||||||||||||||||||
| Aflac U.S. | ||||||||||||||||||||||||||||||||||||||||||||||||||||||||||||||||||||||||||
| Balance Sheets | ||||||||||||||||||||||||||||||||||||||||||||||||||||||||||||||||||||||||||
| (In Millions) | ||||||||||||||||||||||||||||||||||||||||||||||||||||||||||||||||||||||||||
| December 31, | June 30, | |||||||||||||||||||||||||||||||||||||||||||||||||||||||||||||||||||||||||
| 2017 | 2018 | 2019 | 2020 | 2021 | 2021 | 2022 | ||||||||||||||||||||||||||||||||||||||||||||||||||||||||||||||||||||
| Assets: | ||||||||||||||||||||||||||||||||||||||||||||||||||||||||||||||||||||||||||
| Investments and cash | $ | 15,488 | $ | 14,518 | $ | 16,141 | $ | 17,949 | $ | 18,324 | $ | 18,184 | $ | 16,058 | ||||||||||||||||||||||||||||||||||||||||||||||||||||||||||||
| Receivables, net of allowance for credit losses | 505 | 568 | 662 | 685 | 595 | 658 | 616 | |||||||||||||||||||||||||||||||||||||||||||||||||||||||||||||||||||
| Accrued investment income | 184 | 178 | 174 | 172 | 169 | 172 | 172 | |||||||||||||||||||||||||||||||||||||||||||||||||||||||||||||||||||
| Deferred policy acquisition costs | 3,355 | 3,491 | 3,544 | 3,450 | 3,292 | 3,309 | 3,238 | |||||||||||||||||||||||||||||||||||||||||||||||||||||||||||||||||||
| Other assets | 361 | 345 | 424 | 608 | 726 | 712 | 744 | |||||||||||||||||||||||||||||||||||||||||||||||||||||||||||||||||||
| Total assets | $ | 19,893 | $ | 19,100 | $ | 20,945 | $ | 22,864 | $ | 23,106 | $ | 23,033 | $ | 20,828 | ||||||||||||||||||||||||||||||||||||||||||||||||||||||||||||
| Liabilities and Shareholders' Equity: | ||||||||||||||||||||||||||||||||||||||||||||||||||||||||||||||||||||||||||
| Future policy benefits | $ | 8,806 | $ | 9,137 | $ | 9,404 | $ | 9,674 | $ | 9,865 | $ | 9,791 | $ | 9,897 | ||||||||||||||||||||||||||||||||||||||||||||||||||||||||||||
| Policy and contract claims | 1,700 | 1,727 | 1,779 | 2,010 | 1,933 | 1,904 | 2,010 | |||||||||||||||||||||||||||||||||||||||||||||||||||||||||||||||||||
| Other policy liabilities | 119 | 116 | 111 | 126 | 119 | 142 | 135 | |||||||||||||||||||||||||||||||||||||||||||||||||||||||||||||||||||
| Deferred income taxes | 982 | (397) | 51 | 235 | 187 | 215 | (425) | |||||||||||||||||||||||||||||||||||||||||||||||||||||||||||||||||||
| Other liabilities | 1,625 | 1,577 | 1,803 | 2,016 | 2,034 | 1,945 | 2,137 | |||||||||||||||||||||||||||||||||||||||||||||||||||||||||||||||||||
| Shareholders' equity | 6,661 | 6,939 | 7,796 | 8,803 | 8,968 | 9,036 | 7,074 | |||||||||||||||||||||||||||||||||||||||||||||||||||||||||||||||||||
| Total liabilities & shareholders' equity | $ | 19,893 | $ | 19,100 | $ | 20,945 | $ | 22,864 | $ | 23,106 | $ | 23,033 | $ | 20,828 | ||||||||||||||||||||||||||||||||||||||||||||||||||||||||||||
| Aflac U.S. | ||||||||||||||||||||||||||||||||||||||||||||||||||||||||||||||||||||||||||||||||||||||||||||||||||||||||||||||||||||
| Quarterly Statements of Pretax Adjusted Earnings and Percentage Changes | ||||||||||||||||||||||||||||||||||||||||||||||||||||||||||||||||||||||||||||||||||||||||||||||||||||||||||||||||||||
| (Restated to conform to current classifications) | ||||||||||||||||||||||||||||||||||||||||||||||||||||||||||||||||||||||||||||||||||||||||||||||||||||||||||||||||||||
| (Dollars In Millions) | ||||||||||||||||||||||||||||||||||||||||||||||||||||||||||||||||||||||||||||||||||||||||||||||||||||||||||||||||||||
| Net | Total | Total | Pretax | |||||||||||||||||||||||||||||||||||||||||||||||||||||||||||||||||||||||||||||||||||||||||||||||||||||||||||||||||
| Earned | % | Adjusted | % | Adjusted | % | Total | % | % | Adjusted | % | Adjusted | % | ||||||||||||||||||||||||||||||||||||||||||||||||||||||||||||||||||||||||||||||||||||||||||||||||||||||||
| Period | Premiums | Change | NII | Change | Revenues | Change | Benefits | Change | Amort. | Change | Expenses | Change | Earn. | Change | ||||||||||||||||||||||||||||||||||||||||||||||||||||||||||||||||||||||||||||||||||||||||||||||||||||||
| 2017 | 5,563 | 2.0 | 721 | 2.6 | 6,289 | 2.0 | 2,885 | .6 | 502 | 1.0 | 2,159 | 3.3 | 1,245 | 3.1 | ||||||||||||||||||||||||||||||||||||||||||||||||||||||||||||||||||||||||||||||||||||||||||||||||||||||
| 2018 | 5,708 | 2.6 | 727 | .8 | 6,443 | 2.4 | 2,887 | .1 | 534 | 6.4 | 2,271 | 5.2 | 1,285 | 3.2 | ||||||||||||||||||||||||||||||||||||||||||||||||||||||||||||||||||||||||||||||||||||||||||||||||||||||
| 2019 | 5,808 | 1.8 | 720 | (1.0) | 6,550 | 1.7 | 2,871 | (.6) | 573 | 7.3 | 2,407 | 6.0 | 1,272 | (1.0) | ||||||||||||||||||||||||||||||||||||||||||||||||||||||||||||||||||||||||||||||||||||||||||||||||||||||
| 2020 | 5,758 | (.9) | 705 | (2.1) | 6,565 | .2 | 2,765 | (3.7) | 570 | (.5) | 2,532 | 5.2 | 1,268 | (.3) | ||||||||||||||||||||||||||||||||||||||||||||||||||||||||||||||||||||||||||||||||||||||||||||||||||||||
| 2021 | 5,614 | (2.5) | 754 | 7.0 | 6,489 | (1.2) | 2,447 | (11.5) | 517 | (9.3) | 2,564 | 1.3 | 1,478 | 16.6 | ||||||||||||||||||||||||||||||||||||||||||||||||||||||||||||||||||||||||||||||||||||||||||||||||||||||
| 2020 | 1 | 1,483 | 1.5 | 177 | — | 1,687 | 2.9 | 713 | (1.1) | 160 | .6 | 648 | 8.7 | 326 | .9 | |||||||||||||||||||||||||||||||||||||||||||||||||||||||||||||||||||||||||||||||||||||||||||||||||||||
| 2 | 1,458 | (.1) | 172 | (4.4) | 1,656 | .9 | 646 | (11.7) | 134 | 2.3 | 584 | 2.3 | 426 | 26.0 | ||||||||||||||||||||||||||||||||||||||||||||||||||||||||||||||||||||||||||||||||||||||||||||||||||||||
| 3 | 1,407 | (2.6) | 175 | (4.4) | 1,606 | (1.5) | 679 | (4.4) | 141 | 1.4 | 597 | 2.1 | 329 | (1.8) | ||||||||||||||||||||||||||||||||||||||||||||||||||||||||||||||||||||||||||||||||||||||||||||||||||||||
| 4 | 1,410 | (2.3) | 182 | 1.1 | 1,617 | (1.3) | 727 | 2.5 | 135 | (6.3) | 703 | 7.5 | 187 | (32.0) | ||||||||||||||||||||||||||||||||||||||||||||||||||||||||||||||||||||||||||||||||||||||||||||||||||||||
| 2021 | 1 | 1,422 | (4.1) | 176 | (.6) | 1,628 | (3.5) | 556 | (22.0) | 139 | (13.1) | 626 | (3.4) | 445 | 36.5 | |||||||||||||||||||||||||||||||||||||||||||||||||||||||||||||||||||||||||||||||||||||||||||||||||||||
| 2 | 1,408 | (3.4) | 189 | 9.9 | 1,627 | (1.8) | 613 | (5.1) | 111 | (17.2) | 601 | 2.9 | 413 | (3.1) | ||||||||||||||||||||||||||||||||||||||||||||||||||||||||||||||||||||||||||||||||||||||||||||||||||||||
| 3 | 1,393 | (1.0) | 191 | 9.1 | 1,616 | .6 | 628 | (7.5) | 123 | (12.8) | 629 | 5.4 | 358 | 8.8 | ||||||||||||||||||||||||||||||||||||||||||||||||||||||||||||||||||||||||||||||||||||||||||||||||||||||
| 4 | 1,391 | (1.3) | 197 | 8.2 | 1,619 | .1 | 649 | (10.7) | 143 | 5.9 | 709 | .9 | 261 | 39.6 | ||||||||||||||||||||||||||||||||||||||||||||||||||||||||||||||||||||||||||||||||||||||||||||||||||||||
| 2022 | 1 | 1,413 | (.6) | 184 | 4.5 | 1,639 | .7 | 622 | 11.9 | 168 | 20.9 | 692 | 10.5 | 325 | (27.0) | |||||||||||||||||||||||||||||||||||||||||||||||||||||||||||||||||||||||||||||||||||||||||||||||||||||
| 2 | 1,394 | (1.0) | 193 | 2.1 | 1,628 | .1 | 633 | 3.3 | 131 | 18.0 | 645 | 7.3 | 349 | (15.5) | ||||||||||||||||||||||||||||||||||||||||||||||||||||||||||||||||||||||||||||||||||||||||||||||||||||||
| Operating Ratios | |||||||||||||||||||||||||||||||||||||||||||||||||||||||||||
| (Before Management Fee) | |||||||||||||||||||||||||||||||||||||||||||||||||||||||||||
| 12-Mo. Rolling | Total Adjusted | Combined | Pretax | ||||||||||||||||||||||||||||||||||||||||||||||||||||||||
| Premium | Tot. Ben./ | Amort./ | Expenses/ | Ratio/ | Profit | ||||||||||||||||||||||||||||||||||||||||||||||||||||||
| Period | Persistency | Premium | Premium | Total Adj. Rev. | Total Adj. Rev. | Margin | |||||||||||||||||||||||||||||||||||||||||||||||||||||
| 2017 | 78.4 | 51.9 | 9.0 | 34.3 | 80.2 | 19.8 | |||||||||||||||||||||||||||||||||||||||||||||||||||||
| 2018 | 78.7 | 50.6 | 9.4 | 35.2 | 80.1 | 19.9 | |||||||||||||||||||||||||||||||||||||||||||||||||||||
| 2019 | 77.7 | 49.4 | 9.9 | 36.7 | 80.6 | 19.4 | |||||||||||||||||||||||||||||||||||||||||||||||||||||
| 2020 | 79.3 | 48.0 | 9.9 | 38.6 | 80.7 | 19.3 | |||||||||||||||||||||||||||||||||||||||||||||||||||||
| 2021 | 79.6 | 43.6 | 9.2 | 39.5 | 77.2 | 22.8 | |||||||||||||||||||||||||||||||||||||||||||||||||||||
| 2022 YTD | 77.9 | 44.7 | 10.7 | 40.9 | 79.4 | 20.6 | |||||||||||||||||||||||||||||||||||||||||||||||||||||
| 2020 | 1 | 77.6 | 48.1 | 10.8 | 38.4 | 80.7 | 19.3 | ||||||||||||||||||||||||||||||||||||||||||||||||||||
| 2 | 78.3 | 44.3 | 9.2 | 35.3 | 74.3 | 25.7 | |||||||||||||||||||||||||||||||||||||||||||||||||||||
| 3 | 78.8 | 48.3 | 10.0 | 37.2 | 79.5 | 20.5 | |||||||||||||||||||||||||||||||||||||||||||||||||||||
| 4 | 79.3 | 51.6 | 9.6 | 43.5 | 88.4 | 11.6 | |||||||||||||||||||||||||||||||||||||||||||||||||||||
| 2021 | 1 | 80.0 | 39.1 | 9.8 | 38.5 | 72.6 | 27.3 | ||||||||||||||||||||||||||||||||||||||||||||||||||||
| 2 | 80.1 | 43.5 | 7.9 | 36.9 | 74.6 | 25.4 | |||||||||||||||||||||||||||||||||||||||||||||||||||||
| 3 | 79.9 | 45.1 | 8.8 | 38.9 | 77.8 | 22.2 | |||||||||||||||||||||||||||||||||||||||||||||||||||||
| 4 | 79.6 | 46.7 | 10.3 | 43.8 | 83.9 | 16.1 | |||||||||||||||||||||||||||||||||||||||||||||||||||||
| 2022 | 1 | 78.5 | 44.0 | 11.9 | 42.2 | 80.2 | 19.8 | ||||||||||||||||||||||||||||||||||||||||||||||||||||
| 2 | 77.9 | 45.4 | 9.4 | 39.6 | 78.5 | 21.4 | |||||||||||||||||||||||||||||||||||||||||||||||||||||
| Aflac U.S. Sales Results | ||||||||||||||||||||||||||||||||||||||||||||||||||
| (Dollars In Millions) | ||||||||||||||||||||||||||||||||||||||||||||||||||
| Annl. | New Annl. | |||||||||||||||||||||||||||||||||||||||||||||||||
| Prem. | % | Prem. | % | |||||||||||||||||||||||||||||||||||||||||||||||
| Period | In Force | Change | Sales | Change | ||||||||||||||||||||||||||||||||||||||||||||||
| 2017 | 6,052 | 2.6 | 1,552 | 4.7 | ||||||||||||||||||||||||||||||||||||||||||||||
| 2018 | 6,231 | 3.0 | 1,601 | 3.2 | ||||||||||||||||||||||||||||||||||||||||||||||
| 2019 | 6,301 | 1.1 | 1,580 | (1.3) | ||||||||||||||||||||||||||||||||||||||||||||||
| 2020 | 6,099 | (3.2) | 1,093 | (30.8) | ||||||||||||||||||||||||||||||||||||||||||||||
| 2021 | 6,003 | (1.6) | 1,278 | 16.9 | ||||||||||||||||||||||||||||||||||||||||||||||
| 2020 | 1 | 6,224 | .7 | 323 | (5.2) | |||||||||||||||||||||||||||||||||||||||||||||
| 2 | 6,079 | (1.7) | 161 | (55.6) | ||||||||||||||||||||||||||||||||||||||||||||||
| 3 | 5,969 | (2.9) | 221 | (35.7) | ||||||||||||||||||||||||||||||||||||||||||||||
| 4 | 6,099 | (3.2) | 388 | (27.2) | ||||||||||||||||||||||||||||||||||||||||||||||
| 2021 | 1 | 6,027 | (3.2) | 251 | (22.1) | |||||||||||||||||||||||||||||||||||||||||||||
| 2 | 5,988 | (1.5) | 264 | 64.1 | ||||||||||||||||||||||||||||||||||||||||||||||
| 3 | 5,929 | (.7) | 299 | 35.0 | ||||||||||||||||||||||||||||||||||||||||||||||
| 4 | 6,003 | (1.6) | 464 | 19.6 | ||||||||||||||||||||||||||||||||||||||||||||||
| 2022 | 1 | 5,942 | (1.4) | 299 | 19.0 | |||||||||||||||||||||||||||||||||||||||||||||
| 2 | 5,926 | (1.0) | 305 | 15.6 | ||||||||||||||||||||||||||||||||||||||||||||||
| Aflac U.S. Product Mix | ||||||||||||||||||||||||||||||||||||||||||||||||||||||||||||||||||||||||||||||||||||||||||||||||||||||||||||||||||||
| (New Annualized Premium Sales, Dollars in Millions) | ||||||||||||||||||||||||||||||||||||||||||||||||||||||||||||||||||||||||||||||||||||||||||||||||||||||||||||||||||||
| % of | % of | % of | Critical | % of | Hospital | % of | Dental/ | % of | ||||||||||||||||||||||||||||||||||||||||||||||||||||||||||||||||||||||||||||||||||||||||||||||||||||||||||||
| Period | Disability | Total | Life | Total | Accident | Total | Care(1) |
Total | Indemnity | Total | Vision | Total | Total | |||||||||||||||||||||||||||||||||||||||||||||||||||||||||||||||||||||||||||||||||||||||||||||||||||||||
| 2017 | 356 | 22.9 | 78 | 5.0 | 456 | 29.4 | 354 | 22.8 | 229 | 14.8 | 79 | 5.1 | 1,552 | |||||||||||||||||||||||||||||||||||||||||||||||||||||||||||||||||||||||||||||||||||||||||||||||||||||||
| 2018 | 363 | 22.7 | 88 | 5.5 | 468 | 29.2 | 354 | 22.1 | 253 | 15.8 | 75 | 4.7 | 1,601 | |||||||||||||||||||||||||||||||||||||||||||||||||||||||||||||||||||||||||||||||||||||||||||||||||||||||
| 2019 | 355 | 22.5 | 97 | 6.1 | 450 | 28.5 | 346 | 21.9 | 263 | 16.6 | 69 | 4.4 | 1,580 | |||||||||||||||||||||||||||||||||||||||||||||||||||||||||||||||||||||||||||||||||||||||||||||||||||||||
| 2020 | 243 | 22.3 | 80 | 7.3 | 285 | 26.1 | 242 | 22.2 | 197 | 18.0 | 45 | 4.1 | 1,093 | |||||||||||||||||||||||||||||||||||||||||||||||||||||||||||||||||||||||||||||||||||||||||||||||||||||||
| 2021 | 296 | 23.1 | 114 | 9.0 | 321 | 25.1 | 273 | 21.3 | 209 | 16.4 | 65 | 5.1 | 1,278 | |||||||||||||||||||||||||||||||||||||||||||||||||||||||||||||||||||||||||||||||||||||||||||||||||||||||
| 2020 | 1 | 73 | 22.6 | 25 | 7.7 | 88 | 27.3 | 68 | 21.1 | 55 | 16.9 | 14 | 4.4 | 323 | ||||||||||||||||||||||||||||||||||||||||||||||||||||||||||||||||||||||||||||||||||||||||||||||||||||||
| 2 | 38 | 23.9 | 14 | 8.6 | 41 | 25.7 | 33 | 20.6 | 28 | 17.1 | 7 | 4.1 | 161 | |||||||||||||||||||||||||||||||||||||||||||||||||||||||||||||||||||||||||||||||||||||||||||||||||||||||
| 3 | 54 | 24.2 | 16 | 7.1 | 58 | 26.4 | 45 | 20.5 | 37 | 16.8 | 11 | 5.0 | 221 | |||||||||||||||||||||||||||||||||||||||||||||||||||||||||||||||||||||||||||||||||||||||||||||||||||||||
| 4 | 79 | 20.4 | 26 | 6.6 | 98 | 25.2 | 95 | 24.5 | 77 | 20.0 | 13 | 3.3 | 388 | |||||||||||||||||||||||||||||||||||||||||||||||||||||||||||||||||||||||||||||||||||||||||||||||||||||||
| 2021 | 1 | 58 | 23.1 | 17 | 6.7 | 66 | 26.3 | 57 | 22.6 | 42 | 16.7 | 11 | 4.6 | 251 | ||||||||||||||||||||||||||||||||||||||||||||||||||||||||||||||||||||||||||||||||||||||||||||||||||||||
| 2 | 60 | 22.7 | 19 | 7.3 | 72 | 27.2 | 56 | 21.0 | 43 | 16.4 | 14 | 5.4 | 264 | |||||||||||||||||||||||||||||||||||||||||||||||||||||||||||||||||||||||||||||||||||||||||||||||||||||||
| 3 | 79 | 26.2 | 27 | 9.2 | 76 | 25.5 | 57 | 19.1 | 45 | 15.1 | 15 | 4.9 | 299 | |||||||||||||||||||||||||||||||||||||||||||||||||||||||||||||||||||||||||||||||||||||||||||||||||||||||
| 4 | 100 | 21.4 | 51 | 11.0 | 107 | 23.1 | 104 | 22.3 | 79 | 17.0 | 24 | 5.2 | 464 | |||||||||||||||||||||||||||||||||||||||||||||||||||||||||||||||||||||||||||||||||||||||||||||||||||||||
| 2022 | 1 | 70 | 23.3 | 24 | 7.9 | 75 | 25.3 | 63 | 21.2 | 50 | 16.7 | 17 | 5.6 | 299 | ||||||||||||||||||||||||||||||||||||||||||||||||||||||||||||||||||||||||||||||||||||||||||||||||||||||
| 2 | 77 | 25.2 | 26 | 8.3 | 75 | 24.6 | 63 | 20.6 | 45 | 14.9 | 19 | 6.4 | 305 | |||||||||||||||||||||||||||||||||||||||||||||||||||||||||||||||||||||||||||||||||||||||||||||||||||||||
| Aflac U.S. Sales Force Data | |||||||||||||||||||||||||||||||||||||||||||||||||||||||||||
| Average | Productivity | ||||||||||||||||||||||||||||||||||||||||||||||||||||||||||
| Weekly | (Production/ | ||||||||||||||||||||||||||||||||||||||||||||||||||||||||||
| Recruited Agents | Producer | Avg. Weekly | |||||||||||||||||||||||||||||||||||||||||||||||||||||||||
| Period | Career | Broker | Total | Equivalents | Producers) | ||||||||||||||||||||||||||||||||||||||||||||||||||||||
| 2017 | 16,817 | 3,073 | 19,890 | 8,808 | 176,183 | ||||||||||||||||||||||||||||||||||||||||||||||||||||||
| 2018 | 15,774 | 3,380 | 19,154 | 8,531 | 187,720 | ||||||||||||||||||||||||||||||||||||||||||||||||||||||
| 2019 | 15,227 | 3,603 | 18,830 | 8,184 | 193,120 | ||||||||||||||||||||||||||||||||||||||||||||||||||||||
| 2020 | 11,826 | 1,861 | 13,687 | 5,918 | 184,706 | ||||||||||||||||||||||||||||||||||||||||||||||||||||||
| 2021 | 10,641 | 5,445 | 16,086 | 5,993 | 213,235 | ||||||||||||||||||||||||||||||||||||||||||||||||||||||
| 2020 | 1 | 3,436 | 494 | 3,930 | 7,411 | 43,517 | |||||||||||||||||||||||||||||||||||||||||||||||||||||
| 2 | 2,190 | 381 | 2,571 | 4,252 | 37,814 | ||||||||||||||||||||||||||||||||||||||||||||||||||||||
| 3 | 3,136 | 486 | 3,622 | 5,485 | 40,367 | ||||||||||||||||||||||||||||||||||||||||||||||||||||||
| 4 | 3,064 | 500 | 3,564 | 6,523 | 59,533 | ||||||||||||||||||||||||||||||||||||||||||||||||||||||
| 2021 | 1 | 2,890 | 1,063 | 3,953 | 5,643 | 44,530 | |||||||||||||||||||||||||||||||||||||||||||||||||||||
| 2 | 2,754 | 1,355 | 4,109 | 5,925 | 44,540 | ||||||||||||||||||||||||||||||||||||||||||||||||||||||
| 3 | 2,502 | 1,615 | 4,117 | 5,926 | 50,448 | ||||||||||||||||||||||||||||||||||||||||||||||||||||||
| 4 | 2,495 | 1,412 | 3,907 | 6,477 | 71,723 | ||||||||||||||||||||||||||||||||||||||||||||||||||||||
| 2022 | 1 | 1,987 | 455 | 2,442 | 6,061 | 49,322 | |||||||||||||||||||||||||||||||||||||||||||||||||||||
| 2 | 2,937 | 391 | 3,328 | 6,067 | 50,264 | ||||||||||||||||||||||||||||||||||||||||||||||||||||||
| Statements of Pretax Adjusted Earnings | ||||||||||||||||||||||||||||||||||||||||||||||||||||||||||||||||||||||||||||||||||||||||||||||||||||||||
| (Before Management Fee) | ||||||||||||||||||||||||||||||||||||||||||||||||||||||||||||||||||||||||||||||||||||||||||||||||||||||||
| (In Millions) | ||||||||||||||||||||||||||||||||||||||||||||||||||||||||||||||||||||||||||||||||||||||||||||||||||||||||
| Years Ended December 31, | 3 Months Ended June 30, | 6 Months Ended June 30, | ||||||||||||||||||||||||||||||||||||||||||||||||||||||||||||||||||||||||||||||||||||||||||||||||||||||
| % | % | |||||||||||||||||||||||||||||||||||||||||||||||||||||||||||||||||||||||||||||||||||||||||||||||||||||||
| 2017 | 2018 | 2019 | 2020 | 2021 | 2021 | 2022 | Change | 2021 | 2022 | Change | ||||||||||||||||||||||||||||||||||||||||||||||||||||||||||||||||||||||||||||||||||||||||||||||
| Revenues: | ||||||||||||||||||||||||||||||||||||||||||||||||||||||||||||||||||||||||||||||||||||||||||||||||||||||||
| Net earned premiums | ||||||||||||||||||||||||||||||||||||||||||||||||||||||||||||||||||||||||||||||||||||||||||||||||||||||||
| Gross premiums | ¥ | 1,493,299 | ¥ | 1,468,894 | ¥ | 1,450,586 | ¥ | 1,409,134 | ¥ | 1,350,945 | ¥ | 339,604 | ¥ | 325,375 | ¥ | 683,309 | ¥ | 654,169 | ||||||||||||||||||||||||||||||||||||||||||||||||||||||||||||||||||||||||||||||||||||||
| Assumed (ceded) | (62,873) | (60,198) | (57,974) | (55,926) | (50,864) | (12,533) | (12,189) | (25,643) | (24,553) | |||||||||||||||||||||||||||||||||||||||||||||||||||||||||||||||||||||||||||||||||||||||||||||||
| Total net earned premiums | 1,430,426 | 1,408,697 | 1,392,612 | 1,353,208 | 1,300,082 | 327,071 | 313,186 | (4.2) | 657,666 | 629,615 | (4.3) | |||||||||||||||||||||||||||||||||||||||||||||||||||||||||||||||||||||||||||||||||||||||||||||
Net investment income (1) |
||||||||||||||||||||||||||||||||||||||||||||||||||||||||||||||||||||||||||||||||||||||||||||||||||||||||
| Yen denominated | 145,114 | 141,575 | 142,473 | 138,397 | 138,513 | 34,511 | 34,154 | (1.0) | 69,241 | 68,973 | (.4) | |||||||||||||||||||||||||||||||||||||||||||||||||||||||||||||||||||||||||||||||||||||||||||||
| US$ denominated | 131,168 | 149,801 | 157,717 | 167,541 | 202,905 | 53,985 | 63,292 | 17.2 | 96,008 | 110,461 | 15.1 | |||||||||||||||||||||||||||||||||||||||||||||||||||||||||||||||||||||||||||||||||||||||||||||
| Net investment income | 276,282 | 291,377 | 300,191 | 305,938 | 341,419 | 88,497 | 97,447 | 10.1 | 165,250 | 179,435 | 8.6 | |||||||||||||||||||||||||||||||||||||||||||||||||||||||||||||||||||||||||||||||||||||||||||||
Amortized hedge costs on foreign investments (2) |
(24,528) | (25,858) | (28,938) | (22,816) | (8,391) | (1,816) | (3,444) | 89.6 | (3,948) | (6,389) | 61.8 | |||||||||||||||||||||||||||||||||||||||||||||||||||||||||||||||||||||||||||||||||||||||||||||
| Adjusted net investment income | 251,754 | 265,519 | 271,253 | 283,122 | 333,028 | 86,681 | 94,004 | 8.4 | 161,302 | 173,046 | 7.3 | |||||||||||||||||||||||||||||||||||||||||||||||||||||||||||||||||||||||||||||||||||||||||||||
| Other income excl. realized foreign | ||||||||||||||||||||||||||||||||||||||||||||||||||||||||||||||||||||||||||||||||||||||||||||||||||||||||
| currency gains (losses) | 4,640 | 4,636 | 4,869 | 4,497 | 4,512 | 1,073 | 1,141 | 2,363 | 2,214 | |||||||||||||||||||||||||||||||||||||||||||||||||||||||||||||||||||||||||||||||||||||||||||||||
| Total adjusted revenues | 1,686,820 | 1,678,852 | 1,668,734 | 1,640,827 | 1,637,621 | 414,825 | 408,331 | (1.6) | 821,331 | 804,876 | (2.0) | |||||||||||||||||||||||||||||||||||||||||||||||||||||||||||||||||||||||||||||||||||||||||||||
| Benefits and claims: | ||||||||||||||||||||||||||||||||||||||||||||||||||||||||||||||||||||||||||||||||||||||||||||||||||||||||
| Benefits and claims, net | ||||||||||||||||||||||||||||||||||||||||||||||||||||||||||||||||||||||||||||||||||||||||||||||||||||||||
| Incurred claims -direct | 710,251 | 724,556 | 727,491 | 734,471 | 743,610 | 180,004 | 185,927 | 381,738 | 389,280 | |||||||||||||||||||||||||||||||||||||||||||||||||||||||||||||||||||||||||||||||||||||||||||||||
| Incurred claims -assumed (ceded) | (55,691) | (51,892) | (45,657) | (37,806) | (31,801) | (7,846) | (8,531) | (15,773) | (16,808) | |||||||||||||||||||||||||||||||||||||||||||||||||||||||||||||||||||||||||||||||||||||||||||||||
| Increase in FPB -direct | 366,376 | 313,343 | 292,444 | 260,200 | 172,525 | 49,460 | 36,178 | 84,532 | 55,847 | |||||||||||||||||||||||||||||||||||||||||||||||||||||||||||||||||||||||||||||||||||||||||||||||
| Increase in FPB -assumed (ceded) | (1,557) | (2,000) | (6,497) | (11,377) | (11,132) | (2,827) | (2,459) | (5,742) | (5,021) | |||||||||||||||||||||||||||||||||||||||||||||||||||||||||||||||||||||||||||||||||||||||||||||||
| Total net benefits and claims | 1,019,378 | 984,007 | 967,782 | 945,487 | 873,202 | 218,791 | 211,115 | (3.5) | 444,756 | 423,298 | (4.8) | |||||||||||||||||||||||||||||||||||||||||||||||||||||||||||||||||||||||||||||||||||||||||||||
| Adjusted expenses: | ||||||||||||||||||||||||||||||||||||||||||||||||||||||||||||||||||||||||||||||||||||||||||||||||||||||||
| Amortization of deferred policy | ||||||||||||||||||||||||||||||||||||||||||||||||||||||||||||||||||||||||||||||||||||||||||||||||||||||||
| acquisition costs | 70,670 | 78,459 | 77,286 | 68,818 | 71,657 | 18,541 | 17,747 | (4.3) | 36,766 | 35,629 | (3.1) | |||||||||||||||||||||||||||||||||||||||||||||||||||||||||||||||||||||||||||||||||||||||||||||
| Insurance commissions | 82,495 | 81,045 | 79,661 | 79,036 | 77,449 | 19,596 | 18,352 | (6.3) | 39,354 | 37,002 | (6.0) | |||||||||||||||||||||||||||||||||||||||||||||||||||||||||||||||||||||||||||||||||||||||||||||
| Insurance and other expenses | 170,636 | 181,139 | 189,203 | 199,606 | 203,169 | 47,951 | 49,404 | 3.0 | 96,701 | 97,080 | .4 | |||||||||||||||||||||||||||||||||||||||||||||||||||||||||||||||||||||||||||||||||||||||||||||
| Total adjusted expenses | 323,801 | 340,643 | 346,150 | 347,460 | 352,275 | 86,088 | 85,502 | 172,820 | 169,711 | |||||||||||||||||||||||||||||||||||||||||||||||||||||||||||||||||||||||||||||||||||||||||||||||
| Total benefits and adjusted expenses | 1,343,180 | 1,324,651 | 1,313,932 | 1,292,947 | 1,225,477 | 304,879 | 296,617 | (2.7) | 617,576 | 593,008 | (4.0) | |||||||||||||||||||||||||||||||||||||||||||||||||||||||||||||||||||||||||||||||||||||||||||||
| Pretax adjusted earnings | ¥ | 343,640 | ¥ | 354,201 | ¥ | 354,802 | ¥ | 347,881 | ¥ | 412,144 | ¥ | 109,947 | ¥ | 111,714 | 1.6 | ¥ | 203,755 | ¥ | 211,868 | 4.0 | ||||||||||||||||||||||||||||||||||||||||||||||||||||||||||||||||||||||||||||||||||||
(1) Includes the net interest cash flows from derivatives associated with certain investment strategies |
||||||||||||||||||||||||||||||||||||||||||||||||||||||||||||||||||||||||||||||||||||||||||||||||||||||||
(2) See non-U.S. GAAP financial measures for the definition of amortized hedge costs/income |
||||||||||||||||||||||||||||||||||||||||||||||||||||||||||||||||||||||||||||||||||||||||||||||||||||||||
| Statements of Pretax Adjusted Earnings | ||||||||||||||||||||||||||||||||||||||||||||||||||||||||||||||||||||||||||||||||||||||||||||||||||||||||
| (Before Management Fee) | ||||||||||||||||||||||||||||||||||||||||||||||||||||||||||||||||||||||||||||||||||||||||||||||||||||||||
| (In Millions) | ||||||||||||||||||||||||||||||||||||||||||||||||||||||||||||||||||||||||||||||||||||||||||||||||||||||||
| Years Ended December 31, | 3 Months Ended June 30, | 6 Months Ended June 30, | ||||||||||||||||||||||||||||||||||||||||||||||||||||||||||||||||||||||||||||||||||||||||||||||||||||||
| % | % | |||||||||||||||||||||||||||||||||||||||||||||||||||||||||||||||||||||||||||||||||||||||||||||||||||||||
| 2017 | 2018 | 2019 | 2020 | 2021 | 2021 | 2022 | Change | 2021 | 2022 | Change | ||||||||||||||||||||||||||||||||||||||||||||||||||||||||||||||||||||||||||||||||||||||||||||||
| Revenues: | ||||||||||||||||||||||||||||||||||||||||||||||||||||||||||||||||||||||||||||||||||||||||||||||||||||||||
| Net earned premiums | ||||||||||||||||||||||||||||||||||||||||||||||||||||||||||||||||||||||||||||||||||||||||||||||||||||||||
| Gross premiums | $ | 13,312 | $ | 13,307 | $ | 13,304 | $ | 13,193 | $ | 12,317 | $ | 3,102 | $ | 2,513 | $ | 6,349 | $ | 5,343 | ||||||||||||||||||||||||||||||||||||||||||||||||||||||||||||||||||||||||||||||||||||||
| Assumed (ceded) | (561) | (546) | (532) | (524) | (463) | (114) | (94) | (238) | (200) | |||||||||||||||||||||||||||||||||||||||||||||||||||||||||||||||||||||||||||||||||||||||||||||||
| Total net earned premiums | 12,752 | 12,762 | 12,772 | 12,670 | 11,853 | 2,987 | 2,419 | (19.0) | 6,111 | 5,143 | (15.8) | |||||||||||||||||||||||||||||||||||||||||||||||||||||||||||||||||||||||||||||||||||||||||||||
Net investment income (1) |
||||||||||||||||||||||||||||||||||||||||||||||||||||||||||||||||||||||||||||||||||||||||||||||||||||||||
| Yen denominated | 1,294 | 1,283 | 1,307 | 1,296 | 1,262 | 315 | 264 | (16.2) | 643 | 563 | (12.4) | |||||||||||||||||||||||||||||||||||||||||||||||||||||||||||||||||||||||||||||||||||||||||||||
| US$ denominated | 1,169 | 1,356 | 1,446 | 1,569 | 1,845 | 493 | 489 | (.8) | 890 | 895 | .6 | |||||||||||||||||||||||||||||||||||||||||||||||||||||||||||||||||||||||||||||||||||||||||||||
| Net investment income | 2,463 | 2,639 | 2,753 | 2,865 | 3,107 | 808 | 752 | (6.9) | 1,533 | 1,458 | (4.9) | |||||||||||||||||||||||||||||||||||||||||||||||||||||||||||||||||||||||||||||||||||||||||||||
|
Amortized hedge costs on foreign investments (2)
|
(228) | (236) | (257) | (206) | (76) | (17) | (30) | 76.5 | (36) | (55) | 52.8 | |||||||||||||||||||||||||||||||||||||||||||||||||||||||||||||||||||||||||||||||||||||||||||||
| Adjusted net investment income | 2,235 | 2,403 | 2,496 | 2,659 | 3,031 | 792 | 723 | (8.7) | 1,497 | 1,402 | (6.3) | |||||||||||||||||||||||||||||||||||||||||||||||||||||||||||||||||||||||||||||||||||||||||||||
| Other income excl. realized foreign | ||||||||||||||||||||||||||||||||||||||||||||||||||||||||||||||||||||||||||||||||||||||||||||||||||||||||
| currency gains (losses) | 41 | 41 | 45 | 42 | 41 | 10 | 9 | 22 | 18 | |||||||||||||||||||||||||||||||||||||||||||||||||||||||||||||||||||||||||||||||||||||||||||||||
| Total adjusted revenues | 15,028 | 15,206 | 15,313 | 15,371 | 14,925 | 3,789 | 3,151 | (16.8) | 7,630 | 6,563 | (14.0) | |||||||||||||||||||||||||||||||||||||||||||||||||||||||||||||||||||||||||||||||||||||||||||||
| Benefits and claims | ||||||||||||||||||||||||||||||||||||||||||||||||||||||||||||||||||||||||||||||||||||||||||||||||||||||||
| Benefits and claims, net | ||||||||||||||||||||||||||||||||||||||||||||||||||||||||||||||||||||||||||||||||||||||||||||||||||||||||
| Incurred claims -direct | 6,332 | 6,566 | 6,671 | 6,875 | 6,783 | 1,644 | 1,435 | 3,549 | 3,185 | |||||||||||||||||||||||||||||||||||||||||||||||||||||||||||||||||||||||||||||||||||||||||||||||
| Incurred claims -assumed (ceded) | (497) | (471) | (419) | (354) | (290) | (72) | (66) | (147) | (137) | |||||||||||||||||||||||||||||||||||||||||||||||||||||||||||||||||||||||||||||||||||||||||||||||
| Increase in FPB -direct | 3,265 | 2,836 | 2,684 | 2,437 | 1,572 | 452 | 280 | 785 | 450 | |||||||||||||||||||||||||||||||||||||||||||||||||||||||||||||||||||||||||||||||||||||||||||||||
| Increase in FPB -assumed (ceded) | (14) | (18) | (60) | (107) | (102) | (26) | (19) | (53) | (41) | |||||||||||||||||||||||||||||||||||||||||||||||||||||||||||||||||||||||||||||||||||||||||||||||
| Total net benefits and claims | 9,087 | 8,913 | 8,877 | 8,851 | 7,963 | 1,998 | 1,630 | (18.4) | 4,134 | 3,457 | (16.4) | |||||||||||||||||||||||||||||||||||||||||||||||||||||||||||||||||||||||||||||||||||||||||||||
| Adjusted expenses: | ||||||||||||||||||||||||||||||||||||||||||||||||||||||||||||||||||||||||||||||||||||||||||||||||||||||||
| Amortization of deferred policy | ||||||||||||||||||||||||||||||||||||||||||||||||||||||||||||||||||||||||||||||||||||||||||||||||||||||||
| acquisition costs | 630 | 710 | 709 | 644 | 653 | 169 | 137 | (18.9) | 341 | 291 | (14.7) | |||||||||||||||||||||||||||||||||||||||||||||||||||||||||||||||||||||||||||||||||||||||||||||
| Insurance commissions | 736 | 735 | 731 | 740 | 706 | 179 | 142 | (20.7) | 366 | 302 | (17.5) | |||||||||||||||||||||||||||||||||||||||||||||||||||||||||||||||||||||||||||||||||||||||||||||
| Insurance and other expenses | 1,521 | 1,640 | 1,734 | 1,873 | 1,849 | 438 | 381 | (13.0) | 898 | 791 | (11.9) | |||||||||||||||||||||||||||||||||||||||||||||||||||||||||||||||||||||||||||||||||||||||||||||
| Total adjusted expenses | 2,887 | 3,085 | 3,174 | 3,257 | 3,208 | 786 | 660 | 1,605 | 1,384 | |||||||||||||||||||||||||||||||||||||||||||||||||||||||||||||||||||||||||||||||||||||||||||||||
| Total benefits and adjusted expenses | 11,974 | 11,998 | 12,051 | 12,108 | 11,171 | 2,785 | 2,290 | (17.8) | 5,739 | 4,841 | (15.6) | |||||||||||||||||||||||||||||||||||||||||||||||||||||||||||||||||||||||||||||||||||||||||||||
| Pretax adjusted earnings | $ | 3,054 | $ | 3,208 | $ | 3,261 | $ | 3,263 | $ | 3,754 | $ | 1,004 | $ | 860 | (14.3) | $ | 1,891 | $ | 1,722 | (8.9) | ||||||||||||||||||||||||||||||||||||||||||||||||||||||||||||||||||||||||||||||||||||
(1) Includes the net interest cash flows from derivatives associated with certain investment strategies |
||||||||||||||||||||||||||||||||||||||||||||||||||||||||||||||||||||||||||||||||||||||||||||||||||||||||
(2) See non-U.S. GAAP financial measures for definition of amortized hedge costs/income |
||||||||||||||||||||||||||||||||||||||||||||||||||||||||||||||||||||||||||||||||||||||||||||||||||||||||
| Balance Sheets | ||||||||||||||||||||||||||||||||||||||||||||||||||||||||||||||||||||
| (In Millions) | ||||||||||||||||||||||||||||||||||||||||||||||||||||||||||||||||||||
| December 31, | June 30, | |||||||||||||||||||||||||||||||||||||||||||||||||||||||||||||||||||
| 2017 | 2018 | 2019 | 2020 | 2021 | 2021 | 2022 | ||||||||||||||||||||||||||||||||||||||||||||||||||||||||||||||
| Assets: | ||||||||||||||||||||||||||||||||||||||||||||||||||||||||||||||||||||
| Investments and cash | ¥ | 11,854,224 | ¥ | 12,031,549 | ¥ | 12,847,994 | ¥ | 13,080,154 | ¥ | 13,645,902 | ¥ | 13,531,551 | ¥ | 13,490,630 | ||||||||||||||||||||||||||||||||||||||||||||||||||||||
| Receivables, net of allowance for credit losses | 37,692 | 37,083 | 28,219 | 20,782 | 22,439 | 24,035 | 24,522 | |||||||||||||||||||||||||||||||||||||||||||||||||||||||||||||
| Accrued investment income | 64,439 | 66,350 | 65,485 | 62,722 | 67,493 | 64,951 | 76,644 | |||||||||||||||||||||||||||||||||||||||||||||||||||||||||||||
| Deferred policy acquisition costs | 695,025 | 708,638 | 721,341 | 723,579 | 716,984 | 718,883 | 713,438 | |||||||||||||||||||||||||||||||||||||||||||||||||||||||||||||
| Other assets | 276,050 | 292,335 | 308,411 | 320,351 | 331,449 | 315,390 | 414,959 | |||||||||||||||||||||||||||||||||||||||||||||||||||||||||||||
| Total assets | ¥ | 12,927,431 | ¥ | 13,135,956 | ¥ | 13,971,450 | ¥ | 14,207,588 | ¥ | 14,784,268 | ¥ | 14,654,809 | ¥ | 14,720,193 | ||||||||||||||||||||||||||||||||||||||||||||||||||||||
| Liabilities and Shareholders' Equity: | ||||||||||||||||||||||||||||||||||||||||||||||||||||||||||||||||||||
| Future policy benefits | ¥ | 8,323,560 | ¥ | 8,637,152 | ¥ | 8,924,868 | ¥ | 9,175,501 | ¥ | 9,336,894 | ¥ | 9,254,325 | ¥ | 9,387,222 | ||||||||||||||||||||||||||||||||||||||||||||||||||||||
| Policy and contract claims | 304,248 | 317,043 | 315,477 | 328,778 | 333,900 | 333,555 | 333,875 | |||||||||||||||||||||||||||||||||||||||||||||||||||||||||||||
| Unearned premiums | 659,977 | 552,419 | 453,133 | 361,010 | 284,045 | 318,231 | 252,214 | |||||||||||||||||||||||||||||||||||||||||||||||||||||||||||||
| Other policyholders' funds | 784,117 | 793,148 | 801,588 | 808,429 | 812,512 | 813,566 | 817,092 | |||||||||||||||||||||||||||||||||||||||||||||||||||||||||||||
| Income taxes (prim. deferred) | 431,949 | 510,528 | 618,901 | 478,969 | 467,877 | 466,294 | 329,722 | |||||||||||||||||||||||||||||||||||||||||||||||||||||||||||||
| Other liabilities | 150,143 | 194,949 | 357,135 | 253,219 | 513,580 | 551,435 | 815,899 | |||||||||||||||||||||||||||||||||||||||||||||||||||||||||||||
| Shareholders' equity | 2,273,438 | 2,130,718 | 2,500,349 | 2,801,682 | 3,035,460 | 2,917,402 | 2,784,170 | |||||||||||||||||||||||||||||||||||||||||||||||||||||||||||||
| Total liabilities & shareholders' equity | ¥ | 12,927,431 | ¥ | 13,135,956 | ¥ | 13,971,450 | ¥ | 14,207,588 | ¥ | 14,784,268 | ¥ | 14,654,809 | ¥ | 14,720,193 | ||||||||||||||||||||||||||||||||||||||||||||||||||||||
| Balance Sheets | ||||||||||||||||||||||||||||||||||||||||||||||||||||||||||||||||||||
| (In Millions) | ||||||||||||||||||||||||||||||||||||||||||||||||||||||||||||||||||||
| December 31, | June 30, | |||||||||||||||||||||||||||||||||||||||||||||||||||||||||||||||||||
| 2017 | 2018 | 2019 | 2020 | 2021 | 2021 | 2022 | ||||||||||||||||||||||||||||||||||||||||||||||||||||||||||||||
| Assets: | ||||||||||||||||||||||||||||||||||||||||||||||||||||||||||||||||||||
| Investments and cash | $ | 104,905 | $ | 108,392 | $ | 117,269 | $ | 126,378 | $ | 118,639 | $ | 122,369 | $ | 98,702 | ||||||||||||||||||||||||||||||||||||||||||||||||||||||
| Receivables, net of allowance for credit losses | 334 | 334 | 258 | 201 | 195 | 217 | 179 | |||||||||||||||||||||||||||||||||||||||||||||||||||||||||||||
| Accrued investment income | 570 | 598 | 598 | 606 | 587 | 587 | 561 | |||||||||||||||||||||||||||||||||||||||||||||||||||||||||||||
| Deferred policy acquisition costs | 6,150 | 6,384 | 6,584 | 6,991 | 6,233 | 6,501 | 5,220 | |||||||||||||||||||||||||||||||||||||||||||||||||||||||||||||
| Other assets | 2,443 | 2,634 | 2,815 | 3,095 | 2,882 | 2,852 | 3,036 | |||||||||||||||||||||||||||||||||||||||||||||||||||||||||||||
| Total assets | $ | 114,402 | $ | 118,342 | $ | 127,523 | $ | 137,271 | $ | 128,536 | $ | 132,527 | $ | 107,698 | ||||||||||||||||||||||||||||||||||||||||||||||||||||||
| Liabilities and Shareholders' Equity: | ||||||||||||||||||||||||||||||||||||||||||||||||||||||||||||||||||||
| Future policy benefits | $ | 73,661 | $ | 77,812 | $ | 81,461 | $ | 88,652 | $ | 81,176 | $ | 83,689 | $ | 68,680 | ||||||||||||||||||||||||||||||||||||||||||||||||||||||
| Policy and contract claims | 2,692 | 2,856 | 2,879 | 3,177 | 2,903 | 3,016 | 2,443 | |||||||||||||||||||||||||||||||||||||||||||||||||||||||||||||
| Unearned premiums | 5,840 | 4,977 | 4,136 | 3,488 | 2,469 | 2,878 | 1,845 | |||||||||||||||||||||||||||||||||||||||||||||||||||||||||||||
| Other policyholders' funds | 6,939 | 7,145 | 7,316 | 7,811 | 7,064 | 7,357 | 5,978 | |||||||||||||||||||||||||||||||||||||||||||||||||||||||||||||
| Income taxes (prim. deferred) | 3,823 | 4,601 | 5,650 | 4,630 | 4,067 | 4,222 | 2,370 | |||||||||||||||||||||||||||||||||||||||||||||||||||||||||||||
| Other liabilities | 1,328 | 1,756 | 3,260 | 2,447 | 4,465 | 4,987 | 5,969 | |||||||||||||||||||||||||||||||||||||||||||||||||||||||||||||
| Shareholders' equity | 20,119 | 19,194 | 22,820 | 27,068 | 26,391 | 26,377 | 20,412 | |||||||||||||||||||||||||||||||||||||||||||||||||||||||||||||
| Total liabilities & shareholders' equity | $ | 114,402 | $ | 118,342 | $ | 127,523 | $ | 137,271 | $ | 128,536 | $ | 132,527 | $ | 107,698 | ||||||||||||||||||||||||||||||||||||||||||||||||||||||
| Quarterly Statements of Pretax Adjusted Earnings and Percentage Changes | ||||||||||||||||||||||||||||||||||||||||||||||||||||||||||||||||||||||||||||||||||||||||||||||||||||||||||||||||||||
| (Yen In Millions) | ||||||||||||||||||||||||||||||||||||||||||||||||||||||||||||||||||||||||||||||||||||||||||||||||||||||||||||||||||||
| Net | Total | Total | Pretax | |||||||||||||||||||||||||||||||||||||||||||||||||||||||||||||||||||||||||||||||||||||||||||||||||||||||||||||||||
| Earned | % | Adjusted | % | Adjusted | % | Total | % | % | Adjusted | % | Adjusted | % | ||||||||||||||||||||||||||||||||||||||||||||||||||||||||||||||||||||||||||||||||||||||||||||||||||||||||
| Period | Premiums | Change | NII | Change | Revenues | Change | Benefits | Change | Amort. | Change | Expense | Change | Earn. | Change | ||||||||||||||||||||||||||||||||||||||||||||||||||||||||||||||||||||||||||||||||||||||||||||||||||||||
| 2017 | 1,430,426 | (2.7) | 251,754 | (2.0) | 1,686,820 | (2.5) | 1,019,378 | (4.5) | 70,670 | 1.2 | 323,801 | .5 | 343,640 | .6 | ||||||||||||||||||||||||||||||||||||||||||||||||||||||||||||||||||||||||||||||||||||||||||||||||||||||
| 2018 | 1,408,697 | (1.5) | 265,519 | 5.5 | 1,678,852 | (.5) | 984,007 | (3.5) | 78,460 | 11.0 | 340,642 | 5.2 | 354,201 | 3.1 | ||||||||||||||||||||||||||||||||||||||||||||||||||||||||||||||||||||||||||||||||||||||||||||||||||||||
| 2019 | 1,392,612 | (1.1) | 271,253 | 2.2 | 1,668,734 | (.6) | 967,782 | (1.6) | 77,286 | (1.5) | 346,150 | 1.6 | 354,802 | .2 | ||||||||||||||||||||||||||||||||||||||||||||||||||||||||||||||||||||||||||||||||||||||||||||||||||||||
| 2020 | 1,353,208 | (2.8) | 283,122 | 4.4 | 1,640,827 | (1.7) | 945,487 | (2.3) | 68,818 | (11.0) | 347,459 | .4 | 347,881 | (2.0) | ||||||||||||||||||||||||||||||||||||||||||||||||||||||||||||||||||||||||||||||||||||||||||||||||||||||
| 2021 | 1,300,082 | (3.9) | 333,028 | 17.6 | 1,637,621 | (.2) | 873,202 | (7.6) | 71,657 | 4.1 | 352,275 | 1.4 | 412,144 | 18.5 | ||||||||||||||||||||||||||||||||||||||||||||||||||||||||||||||||||||||||||||||||||||||||||||||||||||||
| 2020 | 1 | 343,054 | (2.1) | 69,812 | 4.0 | 414,045 | (1.1) | 238,148 | (1.7) | 18,842 | (5.9) | 82,939 | (2.0) | 92,958 | 1.2 | |||||||||||||||||||||||||||||||||||||||||||||||||||||||||||||||||||||||||||||||||||||||||||||||||||||
| 2 | 339,891 | (2.5) | 68,036 | 2.0 | 409,126 | (1.8) | 237,328 | (1.2) | 16,697 | (14.3) | 81,648 | (4.1) | 90,150 | (1.2) | ||||||||||||||||||||||||||||||||||||||||||||||||||||||||||||||||||||||||||||||||||||||||||||||||||||||
| 3 | 336,488 | (3.3) | 70,219 | (.2) | 407,874 | (2.8) | 240,025 | (1.4) | 16,001 | (16.5) | 88,661 | 2.5 | 79,188 | (11.6) | ||||||||||||||||||||||||||||||||||||||||||||||||||||||||||||||||||||||||||||||||||||||||||||||||||||||
| 4 | 333,775 | (3.5) | 75,054 | 11.9 | 409,782 | (1.0) | 229,986 | (4.9) | 17,277 | (7.2) | 94,211 | 4.9 | 85,585 | 4.2 | ||||||||||||||||||||||||||||||||||||||||||||||||||||||||||||||||||||||||||||||||||||||||||||||||||||||
| 2021 | 1 | 330,595 | (3.6) | 74,621 | 6.9 | 406,505 | (1.8) | 225,965 | (5.1) | 18,225 | (3.3) | 86,732 | 4.6 | 93,808 | .9 | |||||||||||||||||||||||||||||||||||||||||||||||||||||||||||||||||||||||||||||||||||||||||||||||||||||
| 2 | 327,071 | (3.8) | 86,681 | 27.4 | 414,825 | 1.4 | 218,791 | (7.8) | 18,541 | 11.0 | 86,088 | 5.4 | 109,947 | 22.0 | ||||||||||||||||||||||||||||||||||||||||||||||||||||||||||||||||||||||||||||||||||||||||||||||||||||||
| 3 | 323,072 | (4.0) | 84,035 | 19.7 | 408,185 | .1 | 213,430 | (11.1) | 17,011 | 6.3 | 87,234 | (1.6) | 107,521 | 35.8 | ||||||||||||||||||||||||||||||||||||||||||||||||||||||||||||||||||||||||||||||||||||||||||||||||||||||
| 4 | 319,344 | (4.3) | 87,690 | 16.8 | 408,105 | (.4) | 215,016 | (6.5) | 17,880 | 3.5 | 92,221 | (2.1) | 100,868 | 17.9 | ||||||||||||||||||||||||||||||||||||||||||||||||||||||||||||||||||||||||||||||||||||||||||||||||||||||
| 2022 | 1 | 316,429 | (4.3) | 79,042 | 5.9 | 396,545 | (2.5) | 212,182 | (6.1) | 17,882 | (1.9) | 84,208 | (2.9) | 100,154 | 6.8 | |||||||||||||||||||||||||||||||||||||||||||||||||||||||||||||||||||||||||||||||||||||||||||||||||||||
| 2 | 313,186 | (4.2) | 94,004 | 8.4 | 408,331 | (1.6) | 211,115 | (3.5) | 17,747 | (4.3) | 85,502 | (.7) | 111,714 | 1.6 | ||||||||||||||||||||||||||||||||||||||||||||||||||||||||||||||||||||||||||||||||||||||||||||||||||||||
| Operating Ratios | ||||||||||||||||||||||||||||||||||||||||||||||||||
| (Before Management Fee) | ||||||||||||||||||||||||||||||||||||||||||||||||||
| 12-Mo. Rolling | Tot. Ben./ | Tot. Adj. | Combined | Pretax | ||||||||||||||||||||||||||||||||||||||||||||||
| Premium | Tot. Ben./ | Premiums | Amort./ | Expenses/ | Ratio/ | Profit | ||||||||||||||||||||||||||||||||||||||||||||
| Period | Persistency(1) |
Premium | (3rd sector) | Premium | Total Adj. Rev. | Total Adj. Rev. | Margin | |||||||||||||||||||||||||||||||||||||||||||
| 2017 | 94.9 | 71.3 | 60.5 | 4.9 | 19.2 | 79.6 | 20.4 | |||||||||||||||||||||||||||||||||||||||||||
| 2018 | 94.1 | 69.9 | 59.2 | 5.6 | 20.3 | 78.9 | 21.1 | |||||||||||||||||||||||||||||||||||||||||||
| 2019 | 94.4 | 69.5 | 59.3 | 5.5 | 20.7 | 78.7 | 21.3 | |||||||||||||||||||||||||||||||||||||||||||
| 2020 | 95.1 | 69.9 | 59.7 | 5.1 | 21.2 | 78.8 | 21.2 | |||||||||||||||||||||||||||||||||||||||||||
| 2021 | 94.3 | 67.2 | 56.6 | 5.5 | 21.5 | 74.8 | 25.2 | |||||||||||||||||||||||||||||||||||||||||||
| 2022 YTD | 94.3 | 67.2 | 56.9 | 5.7 | 21.1 | 73.7 | 26.3 | |||||||||||||||||||||||||||||||||||||||||||
| 2020 | 1 | 94.5 | 69.4 | 59.0 | 5.5 | 20.0 | 77.5 | 22.5 | ||||||||||||||||||||||||||||||||||||||||||
| 2 | 94.8 | 69.8 | 59.6 | 4.9 | 20.0 | 78.0 | 22.0 | |||||||||||||||||||||||||||||||||||||||||||
| 3 | 95.0 | 71.3 | 61.7 | 4.8 | 21.7 | 80.6 | 19.4 | |||||||||||||||||||||||||||||||||||||||||||
| 4 | 95.1 | 68.9 | 58.6 | 5.2 | 23.0 | 79.1 | 20.9 | |||||||||||||||||||||||||||||||||||||||||||
| 2021 | 1 | 95.0 | 68.4 | 58.0 | 5.5 | 21.3 | 76.9 | 23.1 | ||||||||||||||||||||||||||||||||||||||||||
| 2 | 94.7 | 66.9 | 56.5 | 5.7 | 20.8 | 73.5 | 26.5 | |||||||||||||||||||||||||||||||||||||||||||
| 3 | 94.5 | 66.1 | 55.0 | 5.3 | 21.4 | 73.7 | 26.3 | |||||||||||||||||||||||||||||||||||||||||||
| 4 | 94.3 | 67.3 | 57.0 | 5.6 | 22.6 | 75.3 | 24.7 | |||||||||||||||||||||||||||||||||||||||||||
| 2022 | 1 | 94.3 | 67.1 | 56.4 | 5.7 | 21.2 | 74.7 | 25.3 | ||||||||||||||||||||||||||||||||||||||||||
| 2 | 94.3 | 67.4 | 57.5 | 5.7 | 20.9 | 72.6 | 27.4 | |||||||||||||||||||||||||||||||||||||||||||
| Aflac Japan Sales Results | |||||||||||||||||||||||||||||||||||||||||||||||||||||||||||
| (Yen In Millions, unless otherwise noted) | |||||||||||||||||||||||||||||||||||||||||||||||||||||||||||
| Annl. | Third Sector | ||||||||||||||||||||||||||||||||||||||||||||||||||||||||||
| Prem. | New Annl. | Total | |||||||||||||||||||||||||||||||||||||||||||||||||||||||||
| In Force | % | Prem. | % | New Annual. | % | ||||||||||||||||||||||||||||||||||||||||||||||||||||||
| Period | (Billions) | Change | Sales | Change | Premium Sales | Change | |||||||||||||||||||||||||||||||||||||||||||||||||||||
| 2017 | 1,552.2 | (3.4) | 87,417 | 4.1 | 94,851 | (16.6) | |||||||||||||||||||||||||||||||||||||||||||||||||||||
| 2018 | 1,527.1 | (1.6) | 88,813 | 1.6 | 95,894 | 1.1 | |||||||||||||||||||||||||||||||||||||||||||||||||||||
| 2019 | 1,489.3 | (2.5) | 72,836 | (18.0) | 79,697 | (16.9) | |||||||||||||||||||||||||||||||||||||||||||||||||||||
| 2020 | 1,426.5 | (4.2) | 45,110 | (38.1) | 50,852 | (36.2) | |||||||||||||||||||||||||||||||||||||||||||||||||||||
| 2021 | 1,360.0 | (4.7) | 48,977 | 8.6 | 54,764 | 7.7 | |||||||||||||||||||||||||||||||||||||||||||||||||||||
| 2020 | 1 | 1,474.3 | (2.8) | 12,486 | (26.7) | 14,021 | (25.4) | ||||||||||||||||||||||||||||||||||||||||||||||||||||
| 2 | 1,457.7 | (3.4) | 8,656 | (60.9) | 9,827 | (58.8) | |||||||||||||||||||||||||||||||||||||||||||||||||||||
| 3 | 1,441.9 | (.5) | 11,167 | (33.7) | 12,601 | (32.0) | |||||||||||||||||||||||||||||||||||||||||||||||||||||
| 4 | 1,426.5 | (4.2) | 12,801 | (23.8) | 14,404 | (22.2) | |||||||||||||||||||||||||||||||||||||||||||||||||||||
| 2021 | 1 | 1,410.0 | (4.4) | 12,492 | — | 13,998 | (.2) | ||||||||||||||||||||||||||||||||||||||||||||||||||||
| 2 | 1,391.7 | (4.5) | 12,125 | 40.1 | 13,602 | 38.4 | |||||||||||||||||||||||||||||||||||||||||||||||||||||
| 3 | 1,375.0 | (4.6) | 11,275 | 1.0 | 12,605 | — | |||||||||||||||||||||||||||||||||||||||||||||||||||||
| 4 | 1,360.0 | (4.7) | 13,084 | 2.2 | 14,559 | 1.1 | |||||||||||||||||||||||||||||||||||||||||||||||||||||
| 2022 | 1 | 1,345.6 | (4.6) | 10,679 | (19.0) | 11,925 | (14.8) | ||||||||||||||||||||||||||||||||||||||||||||||||||||
| 2 | 1,332.0 | (4.3) | 11,372 | (6.2) | 12,731 | (6.4) | |||||||||||||||||||||||||||||||||||||||||||||||||||||
| Aflac Japan Product Mix | |||||||||||||||||||||||||||||||||||||||||||||||||||||||||||||||||||||||||||||||||||||||||||||||||||||
| (New Annualized Premium Sales, Yen In Billions) | |||||||||||||||||||||||||||||||||||||||||||||||||||||||||||||||||||||||||||||||||||||||||||||||||||||
| % of | % of | Income | % of | Child | % of | % of | Ordinary | % of | % of | ||||||||||||||||||||||||||||||||||||||||||||||||||||||||||||||||||||||||||||||||||||||||||||
| Period | Cancer | Total | Medical | Total | Support | Total | Endowment | Total | WAYS | Total | Life Other | Total | Other | Total | Total | ||||||||||||||||||||||||||||||||||||||||||||||||||||||||||||||||||||||||||||||||||||||
| 2017 | 53.0 | 55.8 | 32.4 | 34.1 | 2.2 | 2.3 | .5 | .5 | .6 | .6 | 5.6 | 6.0 | .6 | .7 | 94.9 | ||||||||||||||||||||||||||||||||||||||||||||||||||||||||||||||||||||||||||||||||||||||
| 2018 | 63.1 | 65.8 | 23.9 | 25.0 | 1.7 | 1.8 | .3 | .3 | .5 | .5 | 5.9 | 6.1 | .5 | .5 | 95.9 | ||||||||||||||||||||||||||||||||||||||||||||||||||||||||||||||||||||||||||||||||||||||
| 2019 | 47.2 | 59.2 | 24.6 | 31.0 | 1.0 | 1.2 | .2 | .2 | .4 | .5 | 5.9 | 7.4 | .4 | .5 | 79.7 | ||||||||||||||||||||||||||||||||||||||||||||||||||||||||||||||||||||||||||||||||||||||
| 2020 | 28.8 | 56.6 | 15.9 | 31.2 | .5 | 1.0 | .2 | .4 | .4 | .7 | 4.8 | 9.5 | .3 | .6 | 50.9 | ||||||||||||||||||||||||||||||||||||||||||||||||||||||||||||||||||||||||||||||||||||||
| 2021 | 27.0 | 49.2 | 20.4 | 37.2 | .3 | .5 | .2 | .3 | .4 | .8 | 4.9 | 9.0 | 1.6 | 3.0 | 54.8 | ||||||||||||||||||||||||||||||||||||||||||||||||||||||||||||||||||||||||||||||||||||||
| 2020 | 1 | 7.8 | 55.5 | 4.5 | 32.4 | .2 | 1.2 | — | .3 | .1 | .6 | 1.3 | 9.3 | .1 | .7 | 14.0 | |||||||||||||||||||||||||||||||||||||||||||||||||||||||||||||||||||||||||||||||||||||
| 2 | 5.4 | 54.7 | 3.2 | 32.5 | .1 | .9 | — | .4 | .1 | .8 | 1.0 | 10.0 | — | .7 | 9.8 | ||||||||||||||||||||||||||||||||||||||||||||||||||||||||||||||||||||||||||||||||||||||
| 3 | 7.0 | 55.7 | 4.0 | 32.0 | .1 | .9 | .1 | .4 | .1 | .8 | 1.2 | 9.6 | .1 | .6 | 12.6 | ||||||||||||||||||||||||||||||||||||||||||||||||||||||||||||||||||||||||||||||||||||||
| 4 | 8.6 | 59.7 | 4.1 | 28.4 | .1 | .8 | .1 | .3 | .1 | .8 | 1.3 | 9.3 | .1 | .7 | 14.4 | ||||||||||||||||||||||||||||||||||||||||||||||||||||||||||||||||||||||||||||||||||||||
| 2021 | 1 | 6.4 | 45.4 | 6.1 | 43.3 | .1 | .6 | — | .3 | .1 | .7 | 1.2 | 8.9 | .1 | .8 | 14.0 | |||||||||||||||||||||||||||||||||||||||||||||||||||||||||||||||||||||||||||||||||||||
| 2 | 6.7 | 48.9 | 5.4 | 39.7 | .1 | .6 | — | .4 | .1 | .8 | 1.2 | 8.9 | .1 | .7 | 13.6 | ||||||||||||||||||||||||||||||||||||||||||||||||||||||||||||||||||||||||||||||||||||||
| 3 | 6.3 | 49.9 | 4.6 | 36.3 | .1 | .5 | — | .3 | .1 | .7 | 1.1 | 9.0 | .4 | 3.3 | 12.6 | ||||||||||||||||||||||||||||||||||||||||||||||||||||||||||||||||||||||||||||||||||||||
| 4 | 7.7 | 52.7 | 4.4 | 29.9 | .1 | .4 | — | .3 | .1 | .8 | 1.2 | 8.6 | 1.1 | 7.3 | 14.6 | ||||||||||||||||||||||||||||||||||||||||||||||||||||||||||||||||||||||||||||||||||||||
| 2022 | 1 | 6.4 | 53.0 | 3.8 | 31.4 | .1 | 1.1 | — | .3 | .1 | .7 | 1.1 | 9.0 | .5 | 4.5 | 11.9 | |||||||||||||||||||||||||||||||||||||||||||||||||||||||||||||||||||||||||||||||||||||
| 2 | 6.8 | 53.4 | 3.8 | 29.9 | .3 | 2.2 | — | .2 | .1 | .8 | 1.2 | 9.2 | .6 | 4.3 | 12.7 | ||||||||||||||||||||||||||||||||||||||||||||||||||||||||||||||||||||||||||||||||||||||
| Aflac Japan Sales Force Data | ||||||||||||||||||||||||||||||||||||||||||||||||||||||||||||||||||||||||||
| Number of Agencies by Type | Sales Contribution by Agency Type | |||||||||||||||||||||||||||||||||||||||||||||||||||||||||||||||||||||||||
| Period | Individual/ Independent Corporate | Affiliated Corporate |
Bank | Total | Individual/ Independent Corporate | Affiliated Corporate |
Bank | Licensed Sales Associates(1) |
Recruited Agencies |
|||||||||||||||||||||||||||||||||||||||||||||||||||||||||||||||||
| 2017 | 9,492 | 1,455 | 374 | 11,321 | 42.8 | 52.0 | 5.2 | 109,197 | 174 | |||||||||||||||||||||||||||||||||||||||||||||||||||||||||||||||||
| 2018 | 8,453 | 1,392 | 371 | 10,216 | 40.1 | 55.3 | 4.6 | 109,482 | 85 | |||||||||||||||||||||||||||||||||||||||||||||||||||||||||||||||||
| 2019 | 7,683 | 1,343 | 367 | 9,393 | 45.7 | 50.0 | 4.3 | 109,265 | 77 | |||||||||||||||||||||||||||||||||||||||||||||||||||||||||||||||||
| 2020 | 7,231 | 1,312 | 361 | 8,904 | 52.3 | 42.6 | 5.1 | 111,886 | 48 | |||||||||||||||||||||||||||||||||||||||||||||||||||||||||||||||||
| 2021 | 6,779 | 1,283 | 360 | 8,422 | 51.1 | 43.7 | 5.2 | 111,854 | 62 | |||||||||||||||||||||||||||||||||||||||||||||||||||||||||||||||||
| 2020 | 1 | 7,537 | 1,332 | 364 | 9,233 | 52.8 | 42.7 | 4.5 | 110,129 | 17 | ||||||||||||||||||||||||||||||||||||||||||||||||||||||||||||||||
| 2 | 7,426 | 1,329 | 364 | 9,119 | 53.8 | 42.8 | 3.4 | 109,850 | 5 | |||||||||||||||||||||||||||||||||||||||||||||||||||||||||||||||||
| 3 | 7,312 | 1,317 | 364 | 8,993 | 51.7 | 41.4 | 6.9 | 111,016 | 19 | |||||||||||||||||||||||||||||||||||||||||||||||||||||||||||||||||
| 4 | 7,231 | 1,312 | 361 | 8,904 | 51.3 | 43.4 | 5.3 | 111,886 | 7 | |||||||||||||||||||||||||||||||||||||||||||||||||||||||||||||||||
| 2021 | 1 | 7,142 | 1,308 | 360 | 8,810 | 54.3 | 40.6 | 5.1 | 112,252 | 13 | ||||||||||||||||||||||||||||||||||||||||||||||||||||||||||||||||
| 2 | 7,055 | 1,305 | 359 | 8,719 | 51.1 | 44.0 | 4.9 | 113,259 | 22 | |||||||||||||||||||||||||||||||||||||||||||||||||||||||||||||||||
| 3 | 6,898 | 1,299 | 360 | 8,557 | 49.9 | 43.8 | 6.3 | 112,100 | 13 | |||||||||||||||||||||||||||||||||||||||||||||||||||||||||||||||||
| 4 | 6,779 | 1,283 | 360 | 8,422 | 49.2 | 46.3 | 4.5 | 111,854 | 14 | |||||||||||||||||||||||||||||||||||||||||||||||||||||||||||||||||
| 2022 | 1 | 6,447 | 1,266 | 360 | 8,073 | 48.9 | 46.5 | 4.6 | 109,873 | 6 | ||||||||||||||||||||||||||||||||||||||||||||||||||||||||||||||||
| 2 | 6,335 | 1,255 | 359 | 7,949 | 48.4 | 48.1 | 3.5 | 110,096 | 12 | |||||||||||||||||||||||||||||||||||||||||||||||||||||||||||||||||
| Yen/Dollar Exchange Rates | |||||||||||||||||||||||||||||
| Yearly | |||||||||||||||||||||||||||||
| Closing | Qtr | Cum | % | ||||||||||||||||||||||||||
| Period | Rate(1) |
Avg | Avg | Change | |||||||||||||||||||||||||
| 2017 | 113.00 | N/A | 112.16 | (3.1) | |||||||||||||||||||||||||
| 2018 | 111.00 | N/A | 110.39 | 1.6 | |||||||||||||||||||||||||
| 2019 | 109.56 | N/A | 109.07 | 1.2 | |||||||||||||||||||||||||
| 2020 | 103.50 | N/A | 106.86 | 2.1 | |||||||||||||||||||||||||
| 2021 | 115.02 | N/A | 109.79 | (2.7) | |||||||||||||||||||||||||
| 2020 | 1 | 108.83 | 108.84 | 108.84 | 1.3 | ||||||||||||||||||||||||
| 2 | 107.74 | 107.65 | 108.25 | 1.7 | |||||||||||||||||||||||||
| 3 | 105.80 | 106.23 | 107.63 | 1.4 | |||||||||||||||||||||||||
| 4 | 103.50 | 104.57 | 106.86 | 2.1 | |||||||||||||||||||||||||
| 2021 | 1 | 110.71 | 105.88 | 105.88 | 2.8 | ||||||||||||||||||||||||
| 2 | 110.58 | 109.48 | 107.79 | .4 | |||||||||||||||||||||||||
| 3 | 111.92 | 110.11 | 108.58 | (.9) | |||||||||||||||||||||||||
| 4 | 115.02 | 113.70 | 109.79 | (2.7) | |||||||||||||||||||||||||
| 2022 | 1 | 122.39 | 116.18 | 116.18 | (8.9) | ||||||||||||||||||||||||
| 2 | 136.68 | 129.39 | 122.79 | (12.2) | |||||||||||||||||||||||||
(1) Closing rate is based on the latest available and published MUFG Bank Ltd. TTM mid-day exchange rate. |
|||||||||||||||||||||||||||||
| Statements of Pretax Adjusted Earnings | ||||||||||||||||||||||||||||||||||||||||||||||||||||||||||||||||||||||||||||||||||||||||||||||||||||||||||||||
| (Before Management Fee) | ||||||||||||||||||||||||||||||||||||||||||||||||||||||||||||||||||||||||||||||||||||||||||||||||||||||||||||||
| (In Millions) | ||||||||||||||||||||||||||||||||||||||||||||||||||||||||||||||||||||||||||||||||||||||||||||||||||||||||||||||
| Years Ended December 31, | 3 Months Ended June 30, | 6 Months Ended June 30, | ||||||||||||||||||||||||||||||||||||||||||||||||||||||||||||||||||||||||||||||||||||||||||||||||||||||||||||
| % | % | |||||||||||||||||||||||||||||||||||||||||||||||||||||||||||||||||||||||||||||||||||||||||||||||||||||||||||||
| 2017 | 2018 | 2019 | 2020 | 2021 | 2021 | 2022 | Change | 2021 | 2022 | Change | ||||||||||||||||||||||||||||||||||||||||||||||||||||||||||||||||||||||||||||||||||||||||||||||||||||
| Revenues: | ||||||||||||||||||||||||||||||||||||||||||||||||||||||||||||||||||||||||||||||||||||||||||||||||||||||||||||||
| Total net earned premiums | $ | 216 | $ | 208 | $ | 200 | $ | 194 | $ | 180 | $ | 45 | $ | 36 | (20.0) | $ | 93 | $ | 77 | (17.2) | ||||||||||||||||||||||||||||||||||||||||||||||||||||||||||||||||||||||||||||||||||||||||||
Net investment income (1) |
35 | 77 | 88 | 80 | (73) | (13) | (9) | (30.8) | 3 | (5) | (266.7) | |||||||||||||||||||||||||||||||||||||||||||||||||||||||||||||||||||||||||||||||||||||||||||||||||||
Amortized hedge income (2) |
— | 36 | 89 | 97 | 57 | 16 | 14 | (12.5) | 33 | 25 | (24.2) | |||||||||||||||||||||||||||||||||||||||||||||||||||||||||||||||||||||||||||||||||||||||||||||||||||
| Adjusted net investment income | 35 | 113 | 177 | 177 | (16) | 3 | 5 | 66.7 | 36 | 20 | (44.4) | |||||||||||||||||||||||||||||||||||||||||||||||||||||||||||||||||||||||||||||||||||||||||||||||||||
| Other income | 21 | 18 | 15 | 13 | 11 | 2 | — | — | 5 | 18 | 260.0 | |||||||||||||||||||||||||||||||||||||||||||||||||||||||||||||||||||||||||||||||||||||||||||||||||||
| Total adjusted revenues | 272 | 339 | 393 | 384 | 175 | 50 | 42 | (16.0) | 133 | 116 | (12.8) | |||||||||||||||||||||||||||||||||||||||||||||||||||||||||||||||||||||||||||||||||||||||||||||||||||
| Benefits and expenses: | ||||||||||||||||||||||||||||||||||||||||||||||||||||||||||||||||||||||||||||||||||||||||||||||||||||||||||||||
| Total net benefits and claims | 209 | 199 | 194 | 180 | 166 | 41 | 34 | (17.1) | 84 | 73 | (13.1) | |||||||||||||||||||||||||||||||||||||||||||||||||||||||||||||||||||||||||||||||||||||||||||||||||||
| Interest expense | 122 | 120 | 133 | 164 | 165 | 43 | 40 | (7.0) | 87 | 80 | (8.0) | |||||||||||||||||||||||||||||||||||||||||||||||||||||||||||||||||||||||||||||||||||||||||||||||||||
| Other adjusted expenses | 154 | 159 | 137 | 155 | 142 | 42 | 44 | 4.8 | 65 | 84 | 29.2 | |||||||||||||||||||||||||||||||||||||||||||||||||||||||||||||||||||||||||||||||||||||||||||||||||||
| Total benefits and adjusted expenses | 486 | 478 | 464 | 499 | 473 | 126 | 117 | (7.1) | 236 | 237 | .4 | |||||||||||||||||||||||||||||||||||||||||||||||||||||||||||||||||||||||||||||||||||||||||||||||||||
| Pretax adjusted earnings | $ | (214) | $ | (139) | $ | (72) | $ | (115) | $ | (298) | $ | (76) | $ | (75) | 1.3 | $ | (102) | $ | (120) | (17.6) | ||||||||||||||||||||||||||||||||||||||||||||||||||||||||||||||||||||||||||||||||||||||||||
| (1) The change in value of federal historic rehabilitation and solar investments in partnerships of $31 and $30 for the three-month periods and $42 and $30 for the six-month periods ended June 30, 2022, and 2021, respectively is included as a reduction to net investment income. Tax credits on these investments of $28 and $12 for the three-month period and $44 and $25 for the six-month periods ended June 30, 2022, and 2021, respectively, have been recorded as an income tax benefit in the consolidated statement of earnings. | ||||||||||||||||||||||||||||||||||||||||||||||||||||||||||||||||||||||||||||||||||||||||||||||||||||||||||||||
(2) See non-U.S. GAAP financial measures for the definition of amortized hedge cost/income |
||||||||||||||||||||||||||||||||||||||||||||||||||||||||||||||||||||||||||||||||||||||||||||||||||||||||||||||
• |
Adjusted book value is the U.S. GAAP book value (representing total shareholders’ equity), less AOCI as recorded on the U.S. GAAP balance sheet. Adjusted book value per common share is adjusted book value at the period end divided by the ending outstanding common shares for the period presented. The Company considers adjusted book value and adjusted book value per common share important as they exclude AOCI, which fluctuates due to market movements that are outside management’s control. The most comparable U.S. GAAP financial measures for adjusted book value and adjusted book value per common share are total book value and total book value per common share, respectively. |
||||
• |
Adjusted book value including unrealized foreign currency translation gains and losses is adjusted book value plus unrealized foreign currency translation gains and losses. Adjusted book value including unrealized foreign currency translation gains and losses per common share is adjusted book value plus unrealized foreign currency translation gains and losses at the period end divided by the ending outstanding common shares for the period presented. The Company considers adjusted book value including unrealized foreign currency translation gains and losses, and its related per share financial measure, important as they exclude certain components of AOCI, which fluctuate due to market movements that are outside management's control; however, it includes the impact of foreign currency as a result of the significance of Aflac’s Japan operation. The most comparable U.S. GAAP financial measures for adjusted book value including unrealized foreign currency translation gains and losses and adjusted book value including unrealized foreign currency translation gains and losses per common share are total book value and total book value per common share, respectively. |
||||
• |
Adjusted book value including unrealized foreign currency translation gains and losses and pension liability adjustment is adjusted book value plus unrealized foreign currency translation gains and losses and pension liability adjustment. The Company considers adjusted book value including unrealized foreign currency translation gains and losses and pension liability adjustment important as it excludes certain components of AOCI, which fluctuates due to market movements that are outside management's control; however, it includes the impact of foreign currency as a result of the significance of Aflac’s Japan operation. The most comparable U.S. GAAP financial measure for adjusted book value including unrealized foreign currency translation gains and losses and pension liability adjustment is total book value.
|
||||
• |
Adjusted debt is the sum of notes payable, as recorded on the U.S. GAAP balance sheet, excluding 50% of subordinated debentures and perpetual bonds and all pre-funding of debt maturities. The Company considers adjusted debt important as it measures outstanding debt consistently with expectations of the Company’s rating agency stakeholders. The most comparable U.S. GAAP financial measure for adjusted debt is notes payable. |
||||
• |
Adjusted debt including 50% of subordinated debentures and perpetual bonds is the sum of notes payable, as recorded on the U.S. GAAP balance sheet, excluding pre-funding of debt maturities. The Company considers adjusted debt including 50% of subordinated debentures and perpetual bonds important as it measures outstanding debt consistently with expectations of the Company’s rating agency stakeholders. The most comparable U.S. GAAP financial measure for adjusted debt including 50% of subordinated debentures and perpetual bonds is notes payable. |
||||
• |
Adjusted earnings are adjusted revenues less benefits and adjusted expenses. Adjusted earnings per share (basic or diluted) are the adjusted earnings for the period divided by the weighted average outstanding shares (basic or diluted) for the period presented. The adjustments to both revenues and expenses account for certain items that cannot be predicted or that are outside management’s control. Adjusted revenues are U.S. GAAP total revenues excluding adjusted net investment gains and losses. Adjusted expenses are U.S. GAAP total acquisition and operating expenses including the impact of interest cash flows from derivatives associated with notes payable but excluding any nonrecurring or other items not associated with the normal course of the Company’s insurance operations and that do not reflect the Company's underlying business performance. Management uses adjusted earnings and adjusted earnings per diluted share to evaluate the financial performance of the Company’s insurance operations on a consolidated basis and believes that a presentation of these financial measures is vitally important to an understanding of the underlying profitability drivers and trends of the Company’s insurance business. The most comparable U.S. GAAP financial measures for adjusted earnings and adjusted earnings per share (basic or diluted) are net earnings and net earnings per share, respectively. |
||||
• |
Adjusted earnings excluding current period foreign currency impact are computed using the average foreign currency exchange rate for the comparable prior-year period, which eliminates fluctuations driven solely by foreign currency exchange rate changes. Adjusted earnings per diluted share excluding current period foreign currency impact is adjusted earnings excluding current period foreign currency impact divided by the weighted average outstanding diluted shares for the period presented. The Company considers adjusted earnings excluding current period foreign currency impact and adjusted earnings per diluted share excluding current period foreign currency impact important because a significant portion of the Company's business is conducted in Japan and foreign exchange rates are outside management’s control; therefore, the Company believes it is important to understand the impact of translating foreign currency (primarily Japanese yen) into U.S. dollars. The most comparable U.S. GAAP financial measures for adjusted earnings excluding current period foreign currency impact and adjusted earnings per diluted share excluding current period foreign currency impact are net earnings and net earnings per share, respectively. |
||||
• |
Amortized hedge costs/income represent costs/income incurred or recognized as a result of using foreign currency derivatives to hedge certain foreign exchange risks in the Company's Japan segment or in Corporate and other. These amortized hedge costs/ income are estimated at the inception of the derivatives based on the specific terms of each contract and are recognized on a straight-line basis over the term of the hedge. The Company believes that amortized hedge costs/income measure the periodic currency risk management costs/income related to hedging certain foreign currency exchange risks and are an important component of net investment income. There is no comparable U.S. GAAP financial measure for amortized hedge costs/ income. |
||||
• |
Adjusted net investment gains and losses are net investment gains and losses adjusted for i) amortized hedge cost/income related to foreign currency exposure management strategies and certain derivative activity, ii) net interest cash flows from foreign currency and interest rate derivatives associated with certain investment strategies, which are both reclassified to net investment income, and iii) the impact of interest cash flows from derivatives associated with notes payable, which is reclassified to interest expense as a component of total adjusted expenses. The Company considers adjusted net investment gains and losses important as it represents the remainder amount that is considered outside management’s control, while excluding the components that are within management’s control and are accordingly reclassified to net investment income and interest expense. The most comparable U.S. GAAP financial measure for adjusted net investment gains and losses is net investment gains and losses. |
||||
• |
Adjusted net investment income is net investment income adjusted for i) amortized hedge cost/income related to foreign currency exposure management strategies and certain derivative activity, and ii) net interest cash flows from foreign currency and interest rate derivatives associated with certain investment strategies, which are reclassified from net investment gains and losses to net investment income. The Company considers adjusted net investment income important because it provides a more comprehensive understanding of the costs and income associated with the Company’s investments and related hedging strategies. The most comparable U.S. GAAP financial measure for adjusted net investment income is net investment income. |
||||
• |
Adjusted return on equity is adjusted earnings divided by average shareholders’ equity, excluding accumulated other comprehensive income (AOCI). Management uses adjusted return on equity to evaluate the financial performance of the Company’s insurance operations on a consolidated basis and believes that a presentation of this financial measure is vitally important to an understanding of the underlying profitability drivers and trends of the Company’s insurance business. The Company considers adjusted return on equity important as it excludes components of AOCI, which fluctuate due to market movements that are outside management's control. The most comparable U.S. GAAP financial measure for adjusted return on equity is return on average equity (ROE) as determined using net earnings and average total shareholders’ equity. |
||||