UNITED STATES
SECURITIES AND EXCHANGE COMMISSION
Washington, D.C. 20549
FORM 8-K
CURRENT REPORT
Pursuant to Section 13 OR 15(d) of The Securities Exchange Act of 1934
Date of Report (Date of earliest event reported): August 11, 2025
HARROW, INC.
(Exact name of registrant as specified in its charter)
| Delaware | 001-35814 | 45-0567010 | ||
|
(State or other jurisdiction of incorporation) |
(Commission File Number) |
(IRS Employer Identification No.) |
| 1A Burton Hills Blvd., Suite 200 | ||
| Nashville, Tennessee | 37215 | |
| (Address of principal executive offices) | (Zip Code) |
Registrant’s telephone number, including area code: (615) 733-4730
| Not Applicable | ||
| (Former Name or Former Address, if Changed Since Last Report) |
Securities registered pursuant to Section 12(b) of the Act:
| Title of each class | Trading Symbol(s) | Name on exchange on which registered | ||
| Common Stock, $0.001 par value per share | HROW | The Nasdaq Stock Market LLC | ||
| 8.625% Senior Notes due 2026 | HROWL | The Nasdaq Stock Market LLC | ||
| 11.875% Senior Notes due 2027 | HROWM | The Nasdaq Stock Market LLC |
Check the appropriate box below if the Form 8-K filing is intended to simultaneously satisfy the filing obligation of the registrant under any of the following provisions:
| ☐ | Written communications pursuant to Rule 425 under the Securities Act (17 CFR 230.425) |
| ☐ | Soliciting material pursuant to Rule 14a-12 under the Exchange Act (17 CFR 240.14a-12) |
| ☐ | Pre-commencement communications pursuant to Rule 14d-2(b) under the Exchange Act (17 CFR 240.14d-2(b)) |
| ☐ | Pre-commencement communications pursuant to Rule 13e-4(c) under the Exchange Act (17 CFR 240.13e-4(c)) |
Indicate by check mark whether the registrant is an emerging growth company as defined in Rule 405 of the Securities Act of 1933 or Rule 12b-2 of the Securities Act of 1934: Emerging growth company ☐
If any emerging growth company, indicate by check mark if the registrant has elected not to use the extended transition period for complying with any new or revised financial accounting standards provided pursuant to Section 13(a) of the Exchange Act. ☐
Item 2.02 Results of Operations and Financial Condition.
On August 11, 2025, Harrow, Inc. (the “Company”) issued a press release and a letter to stockholders announcing its financial results for the period ended June 30, 2025, and an update on recent corporate events. The press release and letter to stockholders are being furnished as Exhibits 99.1 and 99.2, respectively, to this Current Report on Form 8-K.
Item 7.01. Regulation FD Disclosure
Attached as Exhibit 99.3 to this Current Report on Form 8-K is a presentation of the Company that may be used by the management of the Company at investor conferences and at meetings describing the Company.
The information furnished under Items 2.02 and 7.01 of this Current Report on Form 8-K, including Exhibits 99.1, 99.2 and 99.3, shall not be deemed to be “filed” for the purposes of Section 18 of the Securities Exchange Act of 1934, as amended (the “Exchange Act”), or otherwise subject to the liabilities of that Section. The information in Items 2.02 and 7.01, including Exhibits 99.1, 99.2 and 99.3, shall not be deemed incorporated by reference into any filing under the Securities Act of 1933, as amended, or the Exchange Act, except to the extent it is specifically incorporated by reference but regardless of any general incorporation language in such filing.
The information furnished under Items 2.02 and 7.01 of this Current Report on Form 8-K, including Exhibits 99.1, 99.2 and 99.3, shall not be deemed to constitute an admission that such information or exhibit is required to be furnished pursuant to Regulation FD or that such information or exhibit contains material information that is not otherwise publicly available. In addition, the Company does not assume any obligation to update such information or exhibit in the future.
Item 9.01. Financial Statements and Exhibits
| (d) | Exhibits | |
| 99.1 | Press Release issued by Harrow, Inc. on August 11, 2025 | |
| 99.2 | Letter to Stockholders by Harrow, Inc. dated August 11, 2025 | |
| 99.3 | Harrow Corporate Presentation dated August 2025 | |
| 104 | Cover Page Interactive Data File (embedded within the Inline XBRL document) |
SIGNATURES
Pursuant to the requirements of the Securities Exchange Act of 1934, the registrant has duly caused this report to be signed on its behalf by the undersigned hereunto duly authorized.
| HARROW, INC. | ||
| Dated: August 11, 2025 | By: | /s/ Andrew R. Boll |
| Name: | Andrew R. Boll | |
| Title: | Chief Financial Officer | |
Exhibit 99.1

Harrow Announces Second-Quarter 2025 Financial Results
Second-Quarter 2025 and Recent Selected Highlights:
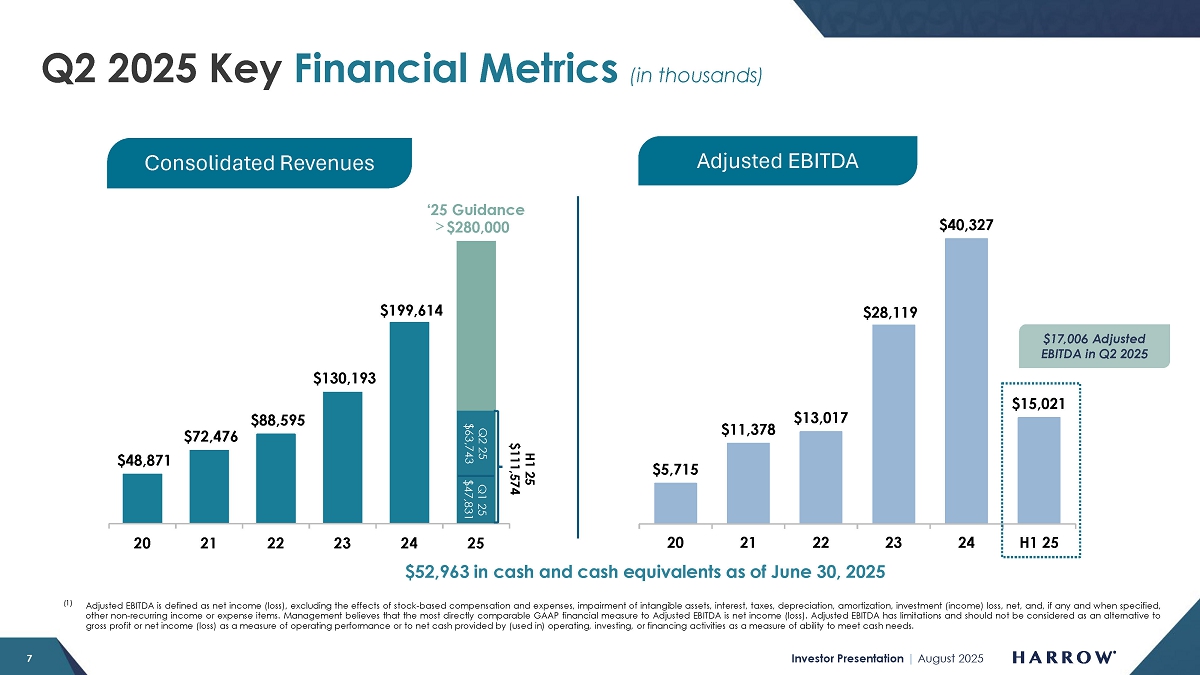
| ● | Total revenues of $63.7 million, a 30% increase over $48.9 million recorded in the prior-year period | |
| ● | GAAP net income of $5.0 million | |
| ● | Adjusted EBITDA of $17.0 million | |
| ● | Cash and cash equivalents of $53.0 million as of June 30, 2025 |
NASHVILLE, Tenn., August 11, 2025 – Harrow (Nasdaq: HROW), a leading provider of ophthalmic disease management solutions in North America, announced results for the second quarter ended June 30, 2025. The Company also posted its second quarter Letter to Stockholders and corporate presentation to the “Investors” section of its website, harrow.com. The Company encourages all Harrow stockholders to review these documents, which provide additional details concerning the historical quarterly period and future expectations for the business.
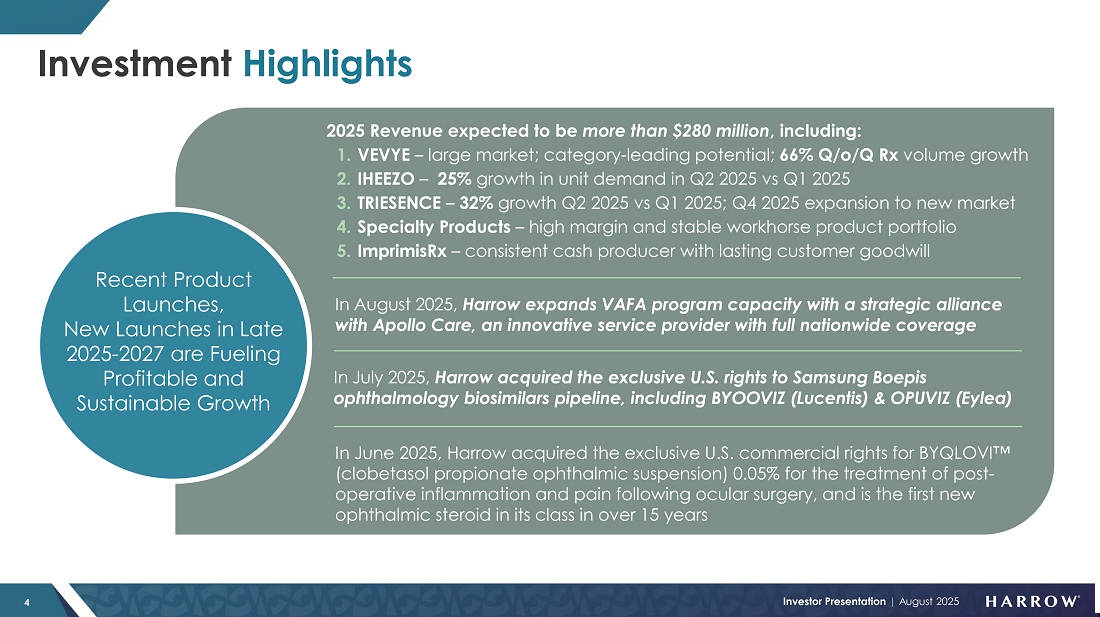
“The second quarter provided a strong financial and operational foundation for the back half of the year,” said Mark L. Baum, Chief Executive Officer of Harrow. “These results have positioned us to strengthen our capital base and are a proof point as to the financial leverage we believe our business has. We remain on track to deliver greater than $280 million in revenue for the year.
“VEVYE® continues to gain commercial momentum, adding nearly 3% in market share in the quarter, with 66% sequential prescription growth, including approximately 50,000 new prescriptions. Now, with an average selling price (ASP) that is stable with an upward bias over the coming quarters, we expect quarterly revenues to begin to expand meaningfully and exceed $100 million for 2025. Our VEVYE® Access for All (VAFA) program, which has significantly improved patient access and reduced barriers to treatment, is currently driving growth in prescription volumes for VEVYE, and we believe the recent expansion of our pharmacy network to include a full nationwide retail network should improve our ASP and further unlock VEVYE’s commercial and financial potential.
“In addition, IHEEZO® has found its growth footing and is expected to deliver record performance through the balance of the year. TRIESENCE® volumes are improving, and with a coming launch in its largest market, ocular inflammation, we expect to finally demonstrate a revenue trajectory consistent with our original acquisition thesis – that TRIESENCE should eventually deliver $100 million in annual revenue. The balance of our branded portfolio, as well as ImprimisRx, our compounding business, are on track and delivering results in line with our 2025 forecast. Together, these results highlight strength, resilience, and growing demand for our ophthalmic disease management solutions.
“In sum, our commercial platform is firing on all cylinders – scaling rapidly and driving strong, growing profitability as demand surges for VEVYE and IHEEZO, and improves the rest of our portfolio. With powerful new revenue streams on deck – including the Samsung biosimilars portfolio, BYQLOVI™, and the expansion of TRIESENCE into its largest potential market – all with minimal incremental cost, we are poised to unlock additional operational leverage and deliver meaningful profitability for Harrow stockholders.”
Business Highlights:
| ● | Apollo Care Strategic Alliance for VAFA |
| ○ | Harrow recently entered into a strategic alliance with Apollo Care, an innovative service provider for patient access and commercial solutions, as Harrow’s second specialty pharmacy partner for the VAFA program. With 500+ pharmacies and full nationwide coverage, Apollo Care’s pharmacy network is broadly contracted with major and small commercial, TRICARE and Medicare plans, positioning it to accelerate VAFA’s expansion while driving broader insurance coverage. |
-MORE-
| Harrow Announces Second Quarter 2025 Financial Results |
| Page |
| August 11, 2025 |
| ● | Samsung Bioepis |
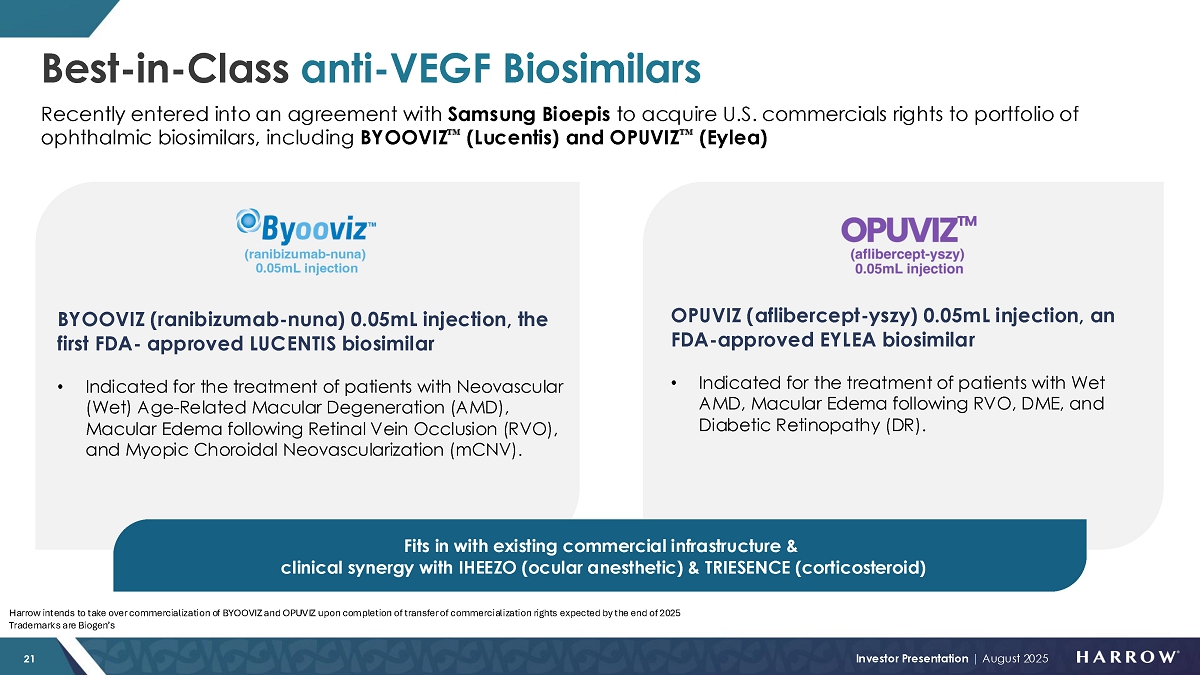
| ○ | In July 2025, Harrow secured the exclusive U.S. commercial rights to the ophthalmology biosimilar portfolio of Samsung Bioepis — BYOOVIZ® (ranibizumab-nuna), an FDA-approved biosimilar referencing LUCENTIS (ranibizumab), and OPUVIZ™ (aflibercept-yszy), an FDA-approved biosimilar referencing EYLEA (aflibercept) — two of the most widely used anti-VEGF therapies for retinal diseases. |
| ● | BYQLOVI Acquisition |
| ○ | In June 2025, Harrow acquired the exclusive U.S. commercial rights for BYQLOVI™ (clobetasol propionate ophthalmic suspension) 0.05%. BYQLOVI was recently approved by the U.S. Food and Drug Administration (FDA) for the treatment of post-operative inflammation and pain following ocular surgery and is the first new ophthalmic steroid in its class in over 15 years. |
Second Quarter 2025 Financial Results:
|
For the Three Months Ended June 30, |
For the Six Months Ended June 30, |
|||||||||||||||
| 2025 | 2024 | 2025 | 2024 | |||||||||||||
| Total revenues | $ | 63,742,000 | $ | 48,939,000 | $ | 111,573,000 | $ | 83,526,000 | ||||||||
| Gross margin | 75 | % | 74 | % | 72 | % | 72 | % | ||||||||
| Core gross margin(1) | 80 | % | 79 | % | 78 | % | 78 | % | ||||||||
| Net income (loss) | 4,995,000 | (6,473,000 | ) | (12,785,000 | ) | (20,038,000 | ) | |||||||||
| Core net income (loss)(1) | 9,227,000 | (2,047,000 | ) | (4,327,000 | ) | (11,836,000 | ) | |||||||||
| Adjusted EBITDA(1) | 17,006,000 | 8,803,000 | 15,021,000 | 9,030,000 | ||||||||||||
| Net income (loss) per share: | ||||||||||||||||
| Basic | 0.14 | (0.18 | ) | (0.35 | ) | (0.56 | ) | |||||||||
| Diluted | 0.13 | (0.18 | ) | (0.35 | ) | (0.56 | ) | |||||||||
| Core net income (loss) per share:(1) | ||||||||||||||||
| Basic | 0.25 | (0.06 | ) | (0.12 | ) | (0.33 | ) | |||||||||
| Diluted | 0.24 | (0.06 | ) | (0.12 | ) | (0.33 | ) | |||||||||
| (1) | Core gross margin, core net income (loss), core basic and diluted net income (loss) per share (collectively, “Core Results”), and Adjusted EBITDA are non-GAAP measures. For additional information, including a reconciliation of such Core Results and Adjusted EBITDA to the most directly comparable measures presented in accordance with GAAP, see the explanation of non-GAAP measures and reconciliation tables at the end of this release. |
Conference Call and Webcast
Participants can access the live webcast of Harrow’s presentation on the “Investors” page of Harrow’s website. A replay of the webcast will be available on the Company’s website for one year.
To participate via telephone, please register in advance using this link. Upon registration, all telephone participants will receive a confirmation email with detailed instructions, including a unique dial-in number and PIN, for accessing the call.
About Harrow
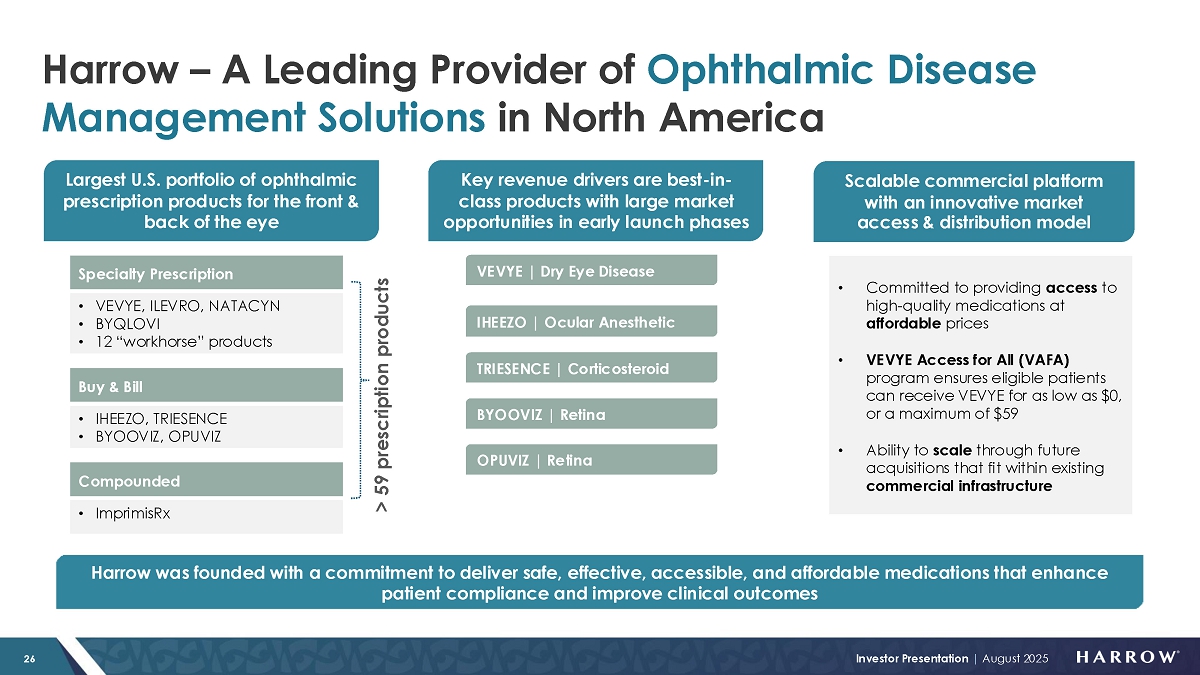
Harrow, Inc. (Nasdaq: HROW) is a leading provider of ophthalmic disease management solutions in North America, offering a comprehensive portfolio of products that address conditions affecting both the front and back of the eye, such as dry eye disease, wet (or neovascular) age-related macular degeneration, cataracts, refractive errors, glaucoma and a range of other ocular surface conditions and retina diseases. Harrow was founded with a commitment to deliver safe, effective, accessible, and affordable medications that enhance patient compliance and improve clinical outcomes. For more information about Harrow, please visit harrow.com.
-MORE-
| Harrow Announces Second Quarter 2025 Financial Results |
| Page |
| August 11, 2025 |
Forward-Looking Statements
This press release contains “forward-looking statements” within the meaning of the U.S. Private Securities Litigation Reform Act of 1995. Any statements in this release that are not historical facts may be considered such “forward—looking statements.” Forward-looking statements are based on management’s current expectations and are subject to risks and uncertainties which may cause results to differ materially and adversely from the statements contained herein. Some of the potential risks and uncertainties that could cause actual results to differ from those predicted include, among others, risks related to: liquidity or results of operations; our ability to successfully implement our business plan, develop and commercialize our products, product candidates and proprietary formulations in a timely manner or at all, identify and acquire additional products, manage our pharmacy operations, refinance and otherwise service our debt, obtain financing necessary to operate our business, recruit and retain qualified personnel, manage any growth we may experience and successfully realize the benefits of our previous acquisitions and any other acquisitions and collaborative arrangements we may pursue; competition from pharmaceutical companies, outsourcing facilities and pharmacies; general economic and business conditions, including inflation and supply chain challenges; regulatory and legal risks and uncertainties related to our pharmacy operations and the pharmacy and pharmaceutical business in general, including the ongoing communications with the U.S. Food and Drug Administration relating to compliance and quality plans at our outsourcing facility in New Jersey; physician interest in and market acceptance of our current and any future formulations and compounding pharmacies generally. These and additional risks and uncertainties are more fully described in Harrow’s filings with the Securities and Exchange Commission (SEC), including its Annual Report on Form 10-K for the year ended December 31, 2024, subsequent Quarterly Reports on Form 10-Q, and other filings with the SEC. Such documents may be read free of charge on the SEC’s web site at sec.gov. Undue reliance should not be placed on forward-looking- statements, which speak only as of the date they are made. Except as required by law, Harrow undertakes no obligation to update any forward-looking- statements to reflect new information, events, or circumstances after the date they are made, or to reflect the occurrence of unanticipated events.
Contact:
Mike Biega, VP of Investor Relations and Communications
mbiega@harrowinc.com
617-913-8890
-MORE-
| Harrow Announces Second Quarter 2025 Financial Results |
| Page |
| August 11, 2025 |
HARROW, INC.
CONDENSED CONSOLIDATED BALANCE SHEETS
| June 30, 2025 | December 31, 2024 | |||||||
| (unaudited) | ||||||||
| ASSETS | ||||||||
| Cash and cash equivalents | $ | 52,963,000 | $ | 47,247,000 | ||||
| All other current assets | 101,927,000 | 142,404,000 | ||||||
| Total current assets | 154,890,000 | 189,651,000 | ||||||
| All other assets | 190,143,000 | 199,320,000 | ||||||
| TOTAL ASSETS | $ | 345,033,000 | $ | 388,971,000 | ||||
| LIABILITIES AND STOCKHOLDERS’ EQUITY | ||||||||
| Current liabilities | $ | 248,884,000 | $ | 91,343,000 | ||||
| Loans payable, net of unamortized debt discount and current portion | 38,484,000 | 219,539,000 | ||||||
| All other liabilities | 8,366,000 | 8,792,000 | ||||||
| TOTAL LIABILITIES | 295,734,000 | 319,674,000 | ||||||
| TOTAL STOCKHOLDERS’ EQUITY | 49,299,000 | 69,297,000 | ||||||
| TOTAL LIABILITIES AND STOCKHOLDERS’ EQUITY | $ | 345,033,000 | $ | 388,971,000 | ||||
HARROW, INC.
UNAUDITED CONDENSED CONSOLIDATED STATEMENTS OF OPERATIONS
|
For the Three Months Ended June 30, |
For
the Six Months Ended |
|||||||||||||||
| 2025 | 2024 | 2025 | 2024 | |||||||||||||
| Total revenues | $ | 63,742,000 | $ | 48,939,000 | $ | 111,573,000 | $ | 83,526,000 | ||||||||
| Cost of sales | 16,230,000 | 12,539,000 | 31,754,000 | 23,092,000 | ||||||||||||
| Gross profit | 47,512,000 | 36,400,000 | 79,819,000 | 60,434,000 | ||||||||||||
| Selling, general and administrative | 33,235,000 | 31,817,000 | 73,748,000 | 60,630,000 | ||||||||||||
| Research and development | 2,868,000 | 3,053,000 | 5,894,000 | 5,202,000 | ||||||||||||
| Total operating expenses | 36,103,000 | 34,870,000 | 79,642,000 | 65,832,000 | ||||||||||||
| Income (loss) from operations | 11,409,000 | 1,530,000 | 177,000 | (5,398,000 | ) | |||||||||||
| Total other expense, net | (6,414,000 | ) | (7,348,000 | ) | (12,962,000 | ) | (13,985,000 | ) | ||||||||
| Income tax expense | - | 655,000 | - | 655,000 | ||||||||||||
| Net income (loss) attributable to Harrow, Inc. | $ | 4,995,000 | $ | (6,473,000 | ) | $ | (12,785,000 | ) | $ | (20,038,000 | ) | |||||
| Net income (loss) per share: | ||||||||||||||||
| Basic | $ | 0.14 | $ | (0.18 | ) | $ | (0.35 | ) | $ | (0.56 | ) | |||||
| Diluted | $ | 0.13 | $ | (0.18 | ) | $ | (0.35 | ) | $ | (0.56 | ) | |||||
HARROW, INC.
UNAUDITED CONDENSED CONSOLIDATED STATEMENTS OF CASH FLOWS
| For the Six Months Ended June 30, |
||||||||
| 2025 | 2024 | |||||||
| Net cash provided by (used in): | ||||||||
| Operating activities | $ | 18,865,000 | $ | (7,374,000 | ) | |||
| Investing activities | (505,000 | ) | 4,993,000 | |||||
| Financing activities | (12,644,000 | ) | (736,000 | ) | ||||
| Net change in cash and cash equivalents | 5,716,000 | (3,117,000 | ) | |||||
| Cash and cash equivalents at beginning of the period | 47,247,000 | 74,085,000 | ||||||
| Cash and cash equivalents at end of the period | $ | 52,963,000 | $ | 70,968,000 | ||||
-MORE-
| Harrow Announces Second Quarter 2025 Financial Results |
| Page |
| August 11, 2025 |
Non-GAAP Financial Measures
In addition to the Company’s results of operations determined in accordance with U.S. generally accepted accounting principles (GAAP), which are presented and discussed above, management also utilizes Adjusted EBITDA and Core Results, unaudited financial measures that are not calculated in accordance with GAAP, to evaluate the Company’s financial results and performance and to plan and forecast future periods. Adjusted EBITDA and Core Results are considered “non-GAAP” financial measures within the meaning of Regulation G promulgated by the SEC. Management believes that these non-GAAP financial measures reflect an additional way of viewing aspects of the Company’s operations that, when viewed with GAAP results, provide a more complete understanding of the Company’s results of operations and the factors and trends affecting its business. Management believes Adjusted EBITDA and Core Results provide meaningful supplemental information regarding the Company’s performance because (i) they allow for greater transparency with respect to key metrics used by management in its financial and operational decision-making; (ii) they exclude the impact of non-cash or, when specified, non-recurring items that are not directly attributable to the Company’s core operating performance and that may obscure trends in the Company’s core operating performance; and (iii) they are used by institutional investors and the analyst community to help analyze the Company’s results. However, Adjusted EBITDA, Core Results, and any other non-GAAP financial measures should be considered as a supplement to, and not as a substitute for, or superior to, the corresponding measures calculated in accordance with GAAP. Further, non-GAAP financial measures used by the Company and the way they are calculated may differ from the non-GAAP financial measures or the calculations of the same non-GAAP financial measures used by other companies, including the Company’s competitors.
Adjusted EBITDA
The Company defines Adjusted EBITDA as net income (loss), excluding the effects of stock-based compensation and expenses, interest, taxes, depreciation, amortization, investment loss, net, and, if any and when specified, other non-recurring income or expense items. Management believes that the most directly comparable GAAP financial measure to Adjusted EBITDA is net income (loss). Adjusted EBITDA has limitations and should not be considered as an alternative to gross profit or net income (loss) as a measure of operating performance or to net cash provided by (used in) operating, investing, or financing activities as a measure of ability to meet cash needs.
The following is a reconciliation of Adjusted EBITDA, a non-GAAP measure, to the most comparable GAAP measure, net income (loss), for the three months and six months ended June 30, 2025 and for the same period in 2024:
HARROW, INC.
RECONCILIATION OF NET LOSS TO ADJUSTED EBITDA
|
For the Three Months Ended June 30, |
For the Six Months Ended June 30, |
|||||||||||||||
| 2025 | 2024 | 2025 | 2024 | |||||||||||||
| GAAP net income (loss) | $ | 4,995,000 | $ | (6,473,000 | ) | $ | (12,785,000 | ) | $ | (20,038,000) | ||||||
| Stock-based compensation and expenses | 875,000 | 4,271,000 | 5,431,000 | 8,440,000 | ||||||||||||
| Interest expense, net | 6,408,000 | 5,471,000 | 12,956,000 | 10,886,000 | ||||||||||||
| Income tax expense | - | 655,000 | - | 655,000 | ||||||||||||
| Depreciation | 496,000 | 453,000 | 961,000 | 885,000 | ||||||||||||
| Amortization of intangible assets | 4,226,000 | 2,549,000 | 8,452,000 | 5,103,000 | ||||||||||||
| Investment loss, net | - | 1,923,000 | - | 3,171,000 | ||||||||||||
| Other expense (income), net | 6,000 | (46,000 | ) | 6,000 | (72,000 | ) | ||||||||||
| Adjusted EBITDA | $ | 17,006,000 | $ | 8,803,000 | $ | 15,021,000 | $ | 9,030,000 | ||||||||
-MORE-
| Harrow Announces Second Quarter 2025 Financial Results |
| Page |
| August 11, 2025 |
Core Results
Harrow Core Results, including core gross margin, core net income (loss), and core basic and diluted income (loss) per share exclude (1) all amortization and impairment charges of intangible assets, excluding software development costs, (2) net gains and losses on investments and equity securities, including equity method gains and losses and equity valued at fair value through profit and loss (FVPL), and preferred stock dividends, and (3) gains/losses on forgiveness of debt. In certain periods, Core Results may also exclude fair value adjustments of financial assets in the form of options to acquire a company carried at FVPL, obligations related to product recalls, certain acquisition-related items, restructuring charges/releases and associated items, related legal items, gains/losses on early extinguishment of debt or debt modifications, impairments of property, plant and equipment and software, as well as income and expense items that management deems exceptional and that are or are expected to accumulate within the year to be over a $100,000 threshold.
The following is a reconciliation of Core Results, non-GAAP measures, to the most comparable GAAP measures for the three months and six months ended June 30, 2025 and 2024:
For the Three Months Ended June 30, 2025 |
||||||||||||||||||||
|
GAAP Results |
Amortization of Certain Intangible Assets |
Investment Gains (Losses) |
Other Items |
Core Results |
||||||||||||||||
| Gross profit | $ | 47,512,000 | $ | 3,780,000 | $ | - | $ | - | $ | 51,292,000 | ||||||||||
| Gross margin | 75 | % | 80 | % | ||||||||||||||||
| Operating income | 11,409,000 | 4,226,000 | - | - | 15,635,000 | |||||||||||||||
| Income before taxes | 4,995,000 | 4,226,000 | - | 6,000 | 9,227,000 | |||||||||||||||
| Taxes | - | - | - | - | - | |||||||||||||||
| Net income | 4,995,000 | 4,226,000 | - | 6,000 | 9,227,000 | |||||||||||||||
| Income per share ($)(1): | ||||||||||||||||||||
| Basic | 0.14 | 0.25 | ||||||||||||||||||
| Diluted | 0.13 | 0.24 | ||||||||||||||||||
| Weighted average number of shares of common stock outstanding: |
||||||||||||||||||||
| Basic | 36,790,306 | 36,790,306 | ||||||||||||||||||
| Diluted | 38,853,855 | 38,853,855 | ||||||||||||||||||
For the Six Months Ended June 30, 2025 |
||||||||||||||||||||
|
GAAP Results |
Amortization of Certain Intangible Assets |
Investment Gains (Losses) |
Other Items |
Core Results |
||||||||||||||||
| Gross profit | $ | 79,819,000 | $ | 7,560,000 | $ | - | $ | - | $ | 87,379,000 | ||||||||||
| Gross margin | 72 | % | 78 | % | ||||||||||||||||
| Operating income | 177,000 | 8,452,000 | - | - | 8,629,000 | |||||||||||||||
| Loss before taxes | (12,785,000 | ) | 8,452,000 | 6,000 | (4,327,000 | ) | ||||||||||||||
| Taxes | - | - | - | - | - | |||||||||||||||
| Net loss | (12,785,000 | ) | 8,452,000 | - | 6,000 | (4,327,000 | ) | |||||||||||||
| Basic and diluted loss per share ($)(1) |
(0.35 | ) | (0.12 | ) | ||||||||||||||||
| Weighted average number of shares of common stock outstanding, basic and diluted |
36,304,787 | 36,304,787 | ||||||||||||||||||
-MORE-
| Harrow Announces Second Quarter 2025 Financial Results |
| Page |
| August 11, 2025 |
For the Three Months Ended June 30, 2024 |
||||||||||||||||||||
|
GAAP Results |
Amortization of Certain Intangible Assets |
Investment Gains (Losses) |
Other Items |
Core Results |
||||||||||||||||
| Gross profit | $ | 36,400,000 | $ | 2,140,000 | $ | - | $ | - | $ | 38,540,000 | ||||||||||
| Gross margin | 74 | % | 79 | % | ||||||||||||||||
| Operating income | 1,530,000 | 2,549,000 | - | - | 4,079,000 | |||||||||||||||
| (Loss) income before taxes | (5,818,000 | ) | 2,549,000 | 1,923,000 | (46,000 | ) | (1,392,000 | ) | ||||||||||||
| Taxes | (655,000 | ) | - | - | - | (655,000 | ) | |||||||||||||
| Net (loss) income | (6,473,000 | ) | 2,549,000 | 1,923,000 | (46,000 | ) | (2,047,000 | ) | ||||||||||||
| Basic and diluted loss per share ($)(1) | (0.18 | ) | (0.06 | ) | ||||||||||||||||
| Weighted average number of shares of common stock outstanding, basic and diluted | 35,618,977 | 35,618,977 | ||||||||||||||||||
For the Six Months Ended June 30, 2024 |
||||||||||||||||||||
|
GAAP Results |
Amortization of Certain Intangible Assets |
Investment Gains (Losses) |
Other Items |
Core Results |
||||||||||||||||
| Gross profit | $ | 60,434,000 | $ | 4,280,000 | $ | - | $ | - | $ | 64,714,000 | ||||||||||
| Gross margin | 72 | % | 78 | % | ||||||||||||||||
| Operating loss | (5,398,000 | ) | 5,103,000 | - | - | (295,000 | ) | |||||||||||||
| (Loss) income before taxes | (19,383,000) | 5,103,000 | 3,171,000 | (72,000 | ) | (11,181,000 | ) | |||||||||||||
| Taxes | (655,000 | ) | - | - | - | (655,000 | ) | |||||||||||||
| Net (loss) income | (20,038,000 | ) | 5,103,000 | 3,171,000 | (72,000 | ) | (11,836,000 | ) | ||||||||||||
| Basic and diluted loss per share ($)(1) | (0.56 | ) | (0.33 | ) | ||||||||||||||||
| Weighted average number of shares of common stock outstanding, basic and diluted | 35,544,312 | 35,544,312 | ||||||||||||||||||
| (1) | Core basic and diluted loss per share is calculated using the weighted-average number of shares of common stock outstanding during the period. Core basic and diluted loss per share also contemplates dilutive shares associated with equity based awards as described in Note 2 and elsewhere in the Consolidated Financial Statements included in the Company’s Quarterly Report on Form 10-Q for the quarter ended June 30, 2025. |
-END-
Exhibit 99.2
Letter to Stockholders
August 11, 2025
Dear Harrow Stockholders:
As we report on the second quarter of 2025, Harrow continues to solidify its position as a leading provider of ophthalmic disease management solutions in North America. Our comprehensive portfolio of trusted ophthalmic products addresses a broad range of eye conditions in both the front and back of the eye – including dry eye disease, wet (or neovascular) age-related macular degeneration (wet AMD), diabetic macular edema, cataracts, refractive errors, glaucoma and a range of other ocular surface conditions, and retinal diseases. Guided by our commitment to providing safe, efficacious, accessible, and affordable medications, we are improving the standard of care by increasing patient compliance and delivering superior clinical outcomes.
Harrow continues to be in growth mode. Today, we reported second quarter 2025 revenues of $63.7 million, a 30% increase over the prior year’s second quarter revenues of $48.9 million, and a sequential increase of 33% from the first quarter 2025 revenues. In addition, during the second quarter of 2025, we were able to showcase the operating leverage in our business, reporting $5.0 million of net income and $17.0 million of Adjusted EBITDA (a non-GAAP measure1).
This summer has been a pivotal period for Harrow, as we added new ophthalmic disease management capabilities through two highly strategic acquisitions:
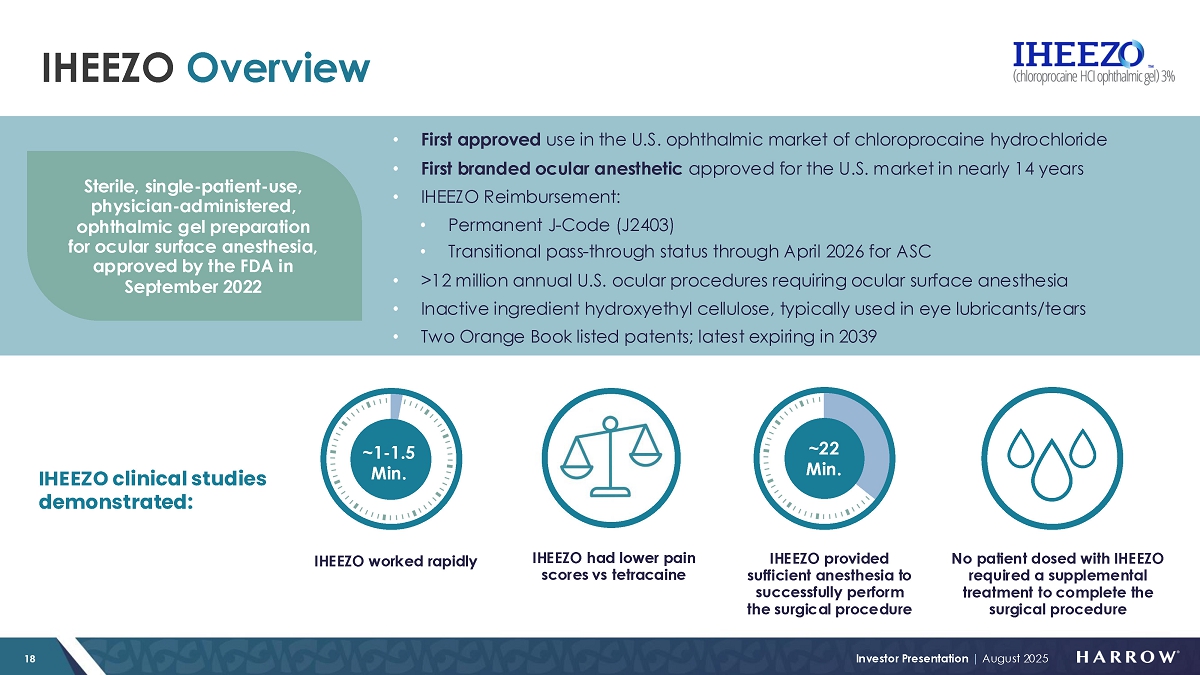
| ● | Samsung Bioepis ophthalmic biosimilars portfolio – To enhance our wet AMD disease management solution, which includes IHEEZO®, a patented low viscosity chloroprocaine gel that is used to anesthetize the eye before an intravitreal injection, we recently secured U.S. rights to BYOOVIZ® (ranibizumab-nuna), an FDA-approved biosimilar referencing LUCENTIS® (ranibizumab), and OPUVIZ™ (aflibercept-yszy), an FDA-approved biosimilar referencing EYLEA® (aflibercept) – two of the most widely prescribed anti-VEGF (or anti vascular endothelial growth factor) therapies for retinal diseases. | |
| ● | BYQLOVI™ (clobetasol propionate ophthalmic suspension) 0.05% – We improved our post-surgical disease management solution by securing U.S. commercial rights from Formosa Pharmaceuticals to BYQLOVI, a clinically differentiated topical steroid option for post-operative ocular inflammation and pain. We expect to begin to realize revenues from this transaction in the first quarter of 2026. |
Andrew and I are thrilled to have closed both deals with only modest initial cash commitments from Harrow. We remain confident in our ability to acquire additional clinically, strategically, and financially compelling products soon, and once again, under attractive terms.
1 A reconciliation of all non-GAAP measures can be found starting on page 12 of this letter.
|
|
Given the challenge of attracting top talent, some Harrow stockholders have recently commented on the impressive backgrounds of several new members of the Harrow Family, particularly those in leadership roles. It is true that since the beginning of the year, we have recruited people with tremendous histories of achievement, including Amir Shojaei, Chief Scientific Officer; Vince Mair, Senior Vice President of Commercial Operations; Arthur Chan, Vice President of Medical Affairs; Chad Brines, Vice President of Specialty Portfolio; Patrick Sullivan, Head of Commercial; Prashanth Annavajjhala, M.D., Chief of Staff to the CEO; Mike Biega, Vice President of Investor Relations and Communications; and most recently, Frank Mullery, Senior Vice President of Operations Strategy. If you are a Harrow stockholder, these are your new partners who will drive sales, scientific credibility, operational visibility, and allow us to continue to build on our growing leadership position in the ophthalmic industry. A key leading indicator of the future success of a business is where the best talent gravitates. If you also believe this, then these recent additions to the Harrow Family bode well for our prospects.
Finally, having recently returned from attending my second American Society of Retina Specialists (ASRS) meeting, I want to express my appreciation to the teams at ImprimisRx, our ophthalmology-focused pharmaceutical compounding business, and Harrow’s retina team. The work these folks have done has led to the creation of a positive buzz about Harrow that simply didn’t exist 12 months ago. I walked away from this meeting with the highest level of confidence I’ve ever had about our future and the likelihood of achieving our objectives in serving the U.S. retina specialist community.
Capital Structure
As I mentioned in last quarter’s Letter to Stockholders, we are in active discussions with our existing lenders and several prospective partners regarding opportunities to refinance or repay a portion of our $222.75 million in outstanding debt.
Andrew and I are highly encouraged by the progress of our discussions with respected financial institutions and the strong interest and engagement we’ve received. We remain firmly committed to pursuing a refinancing path that improves Harrow’s long-term financial foundation. As part of this effort, we’ve identified three key objectives we aim to achieve through a refinancing activity:
| 1) | Lowering our cost of capital, thereby allowing millions of dollars in cash to be deployed to revenue accretive activities instead of interest payments, | |
| 2) | Increasing our financial flexibility by reducing covenants connected to our debt, and | |
| 3) | Improving our ability to pursue and close on opportunities to grow our business for the future. |
We believe our business has greatly improved since we last accessed the debt markets. And, based on our discussions with potential financial partners of merit, perspectives of respected third parties who have analyzed our business, and terms that have been presented to us, I’m highly confident that we will successfully achieve all our objectives. As for timing, we expect to complete this process by the latter part of the third quarter or early in the fourth quarter of this year.
First Annual Investor & Analyst Day
Mike Biega is working on putting together our inaugural Investor & Analyst Day, with the intent of making this an annual event, hosted by Harrow leadership after Labor Day each year. The event will allow our stockholders and analysts to meet members of the Harrow leadership team, see our products, and learn more about how we partner with U.S. eyecare professionals (ECPs) to manage ophthalmic diseases. This year, I’m eager for our new Chief Scientific Officer, Amir Shojaei, to present our product development pipeline – a topic we rarely address but one I believe will interest our stockholders. This year’s event will take place on Friday, September 26, in New York City and will also be webcast live. Please reach out to Mike (mbiega@harrowinc.com) for additional information if you are interested in attending.
|
|
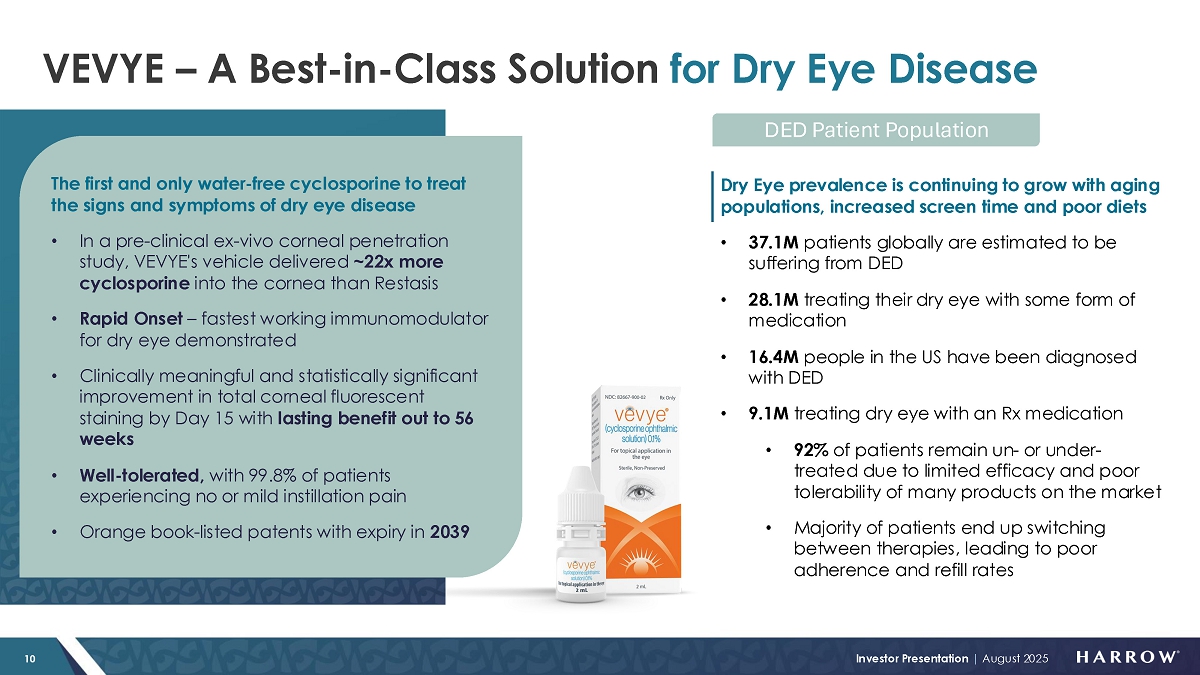
VEVYE
Our flagship dry eye product, VEVYE, continues to exceed our pre-launch expectations in nearly every category – new prescriptions, refill rates, patient satisfaction, and prescriber engagement. Supported by best-in-class clinical data in critical categories, our key commercial metrics are further bolstered by anecdotal feedback from social media posts that stockholders occasionally share with me. It is heartening to see how VEVYE is changing people’s lives, and how the dry eye community seems to be reacting so positively to our generous market access commitment.
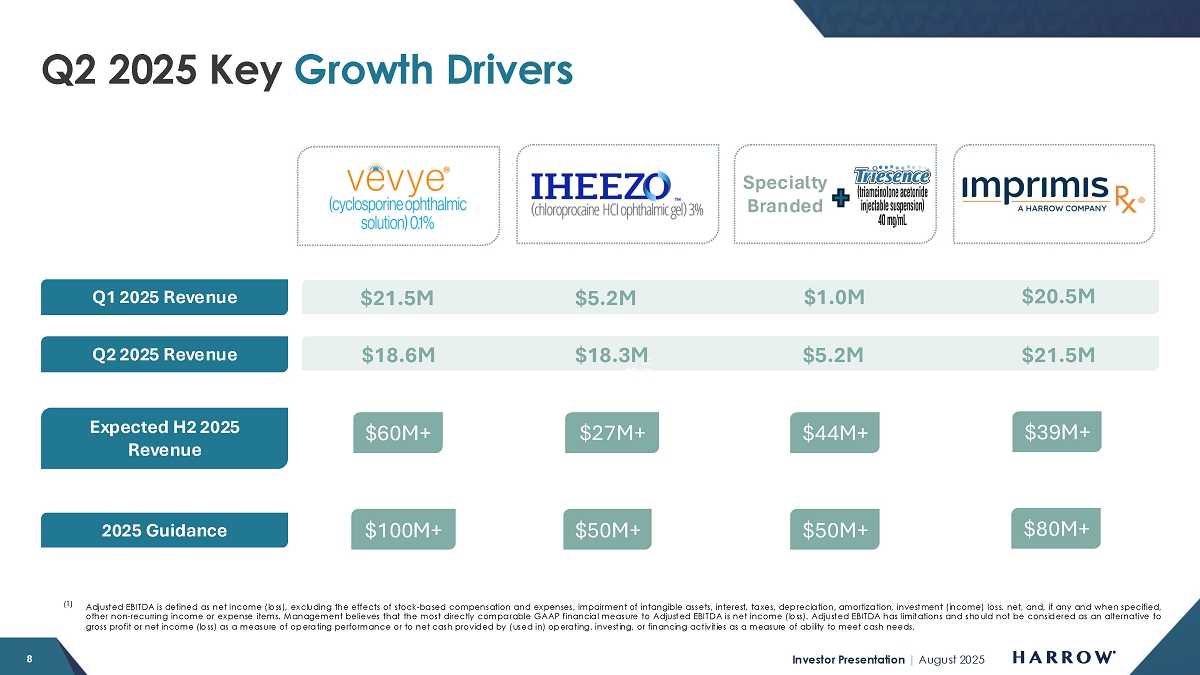
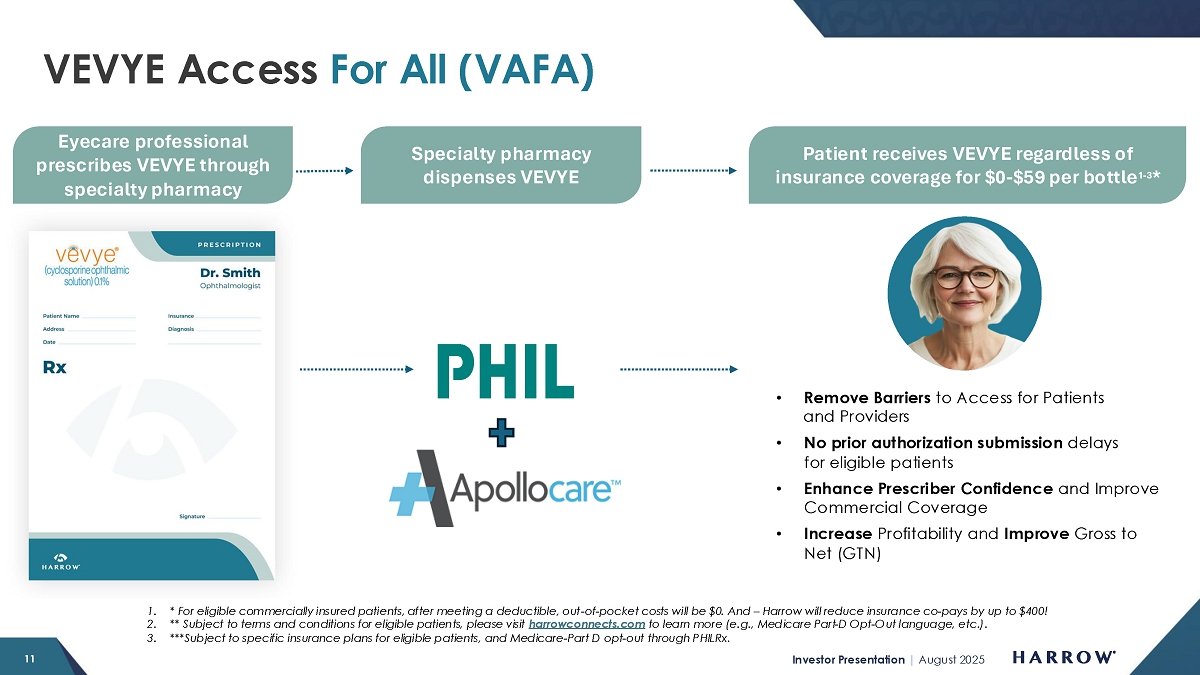
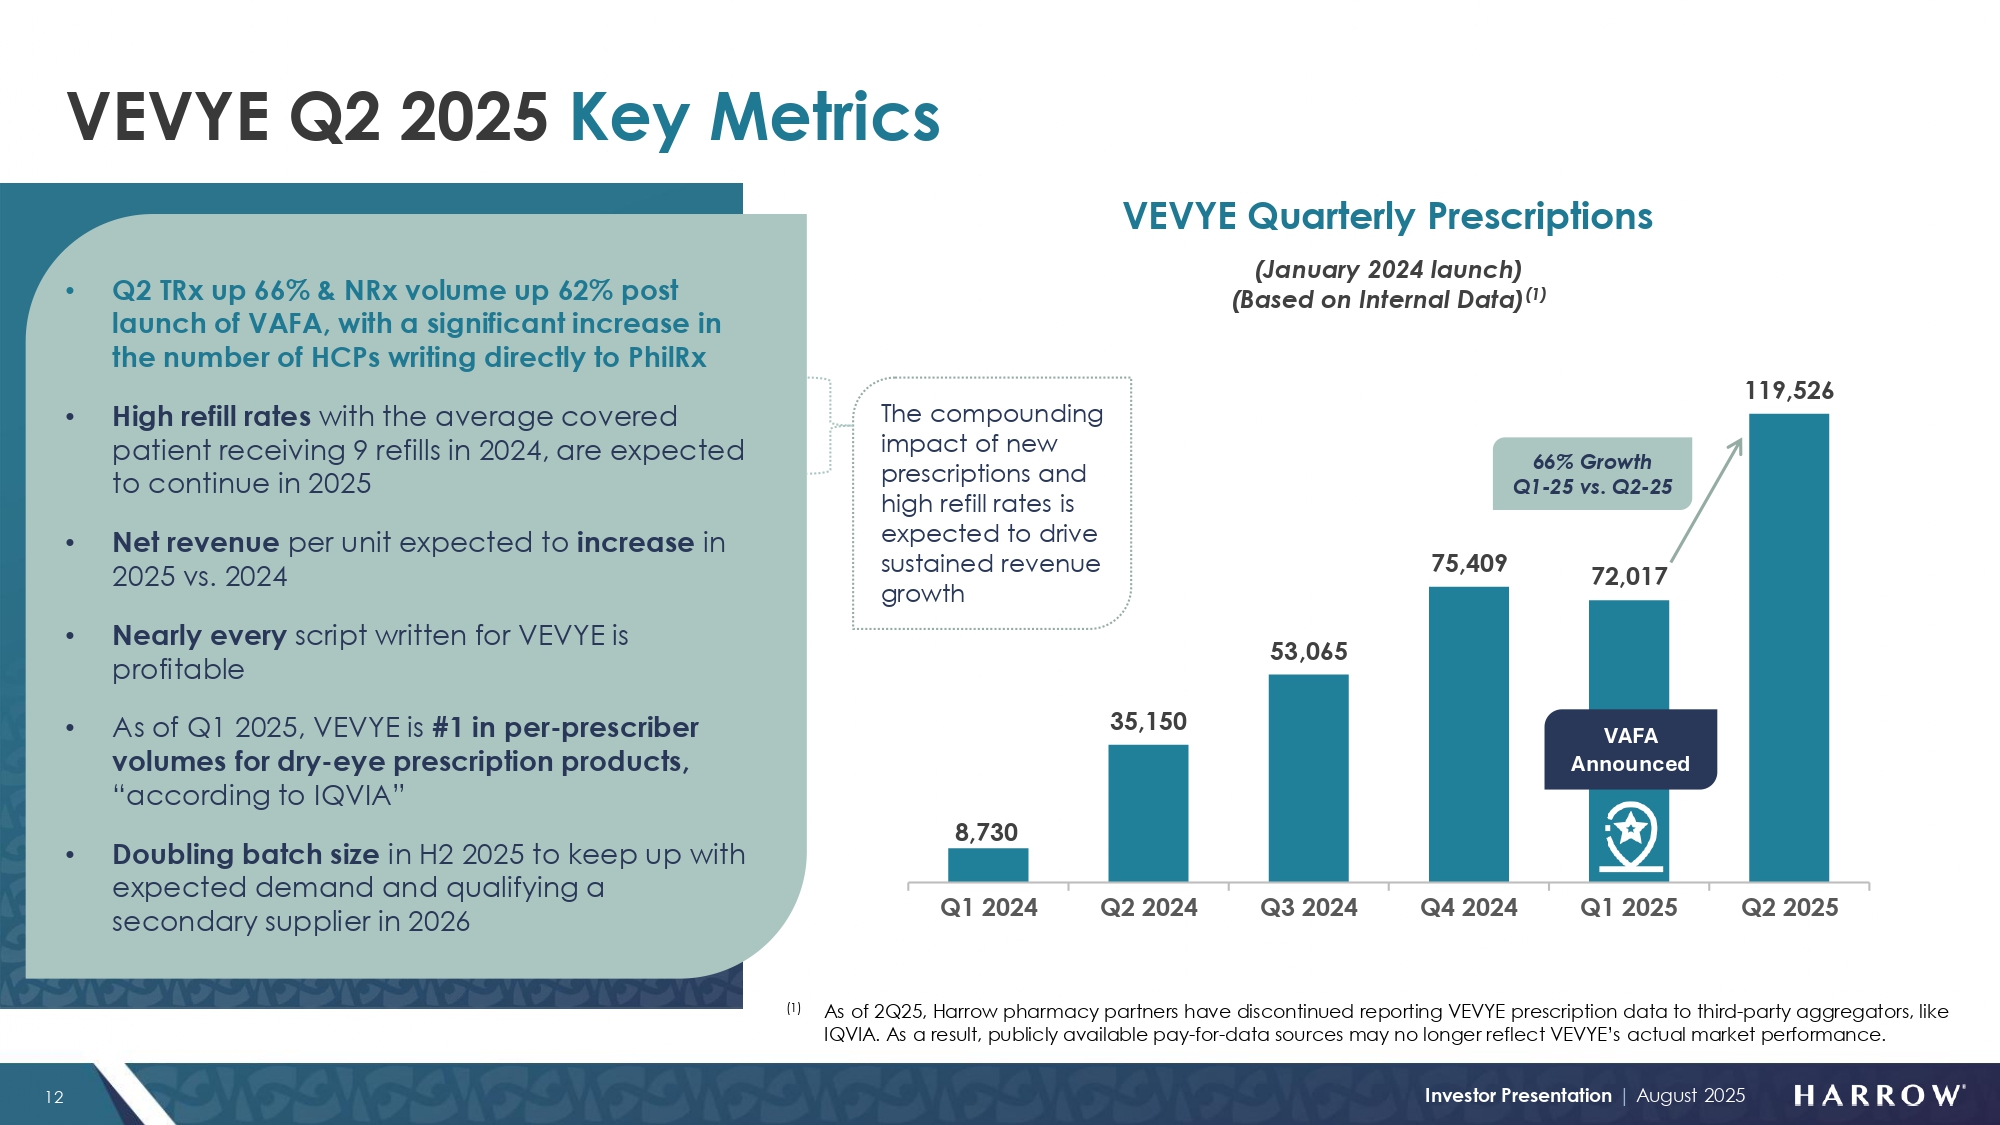
One of the key drivers of our recent success has been our market access program – called VEVYE® Access for All (or VAFA). VAFA was designed to (i) increase access for patients, (ii) lower out-of-pocket costs, and (iii) deliver a reasonable and sustainable profit to Harrow. In terms of increased access, as of the end of June, total prescription (TRx) volumes were up 66% sequentially from Q1 2025, totaling 119,526 units. Of those units, nearly 50,000 units were new prescriptions (NRx). I am proud to say that out-of-pocket expenses for eligible commercially insured patients through PhilRx, our specialty pharmacy partner, have decreased, post-VAFA, by over 95%. And our average selling price (ASP) is squarely in a range that we believe is not only financially attractive to Harrow stockholders but is also likely sustainable. As I forecasted in my last Letter to Stockholders, our ASP in Q1 was an anomaly due to changes in business rules we implemented at the beginning of the year. When ASP normalized in Q2 compared to Q1, due to the change in the ratio of cash-pay to commercial prescriptions from the implementation of VAFA, despite the volume increase, we saw a quarterly revenue reduction relative to Q1 2025. With the traditional summer lull in the rearview mirror and VEVYE NRxs increasing faster than existing patients fall off, VEVYE revenue of $60 million or higher for the balance of the year is in in our sights.
We remain confident that VEVYE’s current ASP levels have stabilized, with a path toward modest improvement over the balance of the year. One reason for our confidence is a recently announced strategic partnership with Apollo Care, an innovative service provider for patient access and commercial solutions with full nationwide coverage. This alliance represents a meaningful expansion of VEVYE’s distribution network and is poised to increase pharmacy access and insurance coverage for patients nationwide. Apollo Care’s pharmacy network is structured to provide broad coverage across both geographies, and plans, with full nationwide coverage. The existing network includes more than 500 pharmacies, and is broadly contracted with major and smaller, commercial, TRICARE, and Medicare plans. With this additional specialty pharmacy coming online, and targeted enhancements to our business rules underway, we are highly confident in the stability of VEVYE’s ASP and see clear potential for sustained, incremental gains in the quarters ahead.
I also want to call out that nearly every VEVYE prescription dispensed is profitable for Harrow – a notable shift from the pre-VAFA period, when that was not always the case. The VAFA program and continual tweaks to our business rules algorithm are causing structural financial improvements to the VEVYE franchise, enhancing the quality of our revenue and our ability to invest in long-term profitability.
Harrow stockholders should be excited about VEVYE’s industry-leading refill rates, with covered patients through PhilRx receiving an average of nine refills in 2024. This strong performance reflects both the meaningful clinical benefits of VEVYE, supported by VAFA and industry-leading patient access. During the second half of 2025, you should begin to see an amplification of the financial impact of the VAFA model and our high refill rates. The compounding effect of rising numbers of new prescriptions and consistently high refill rates, along with a more stable ASP, positions us for sustained revenue growth, with the impact now being felt. Once again, the math for VEVYE looks very good, and likely will, for many years to come.
|
|
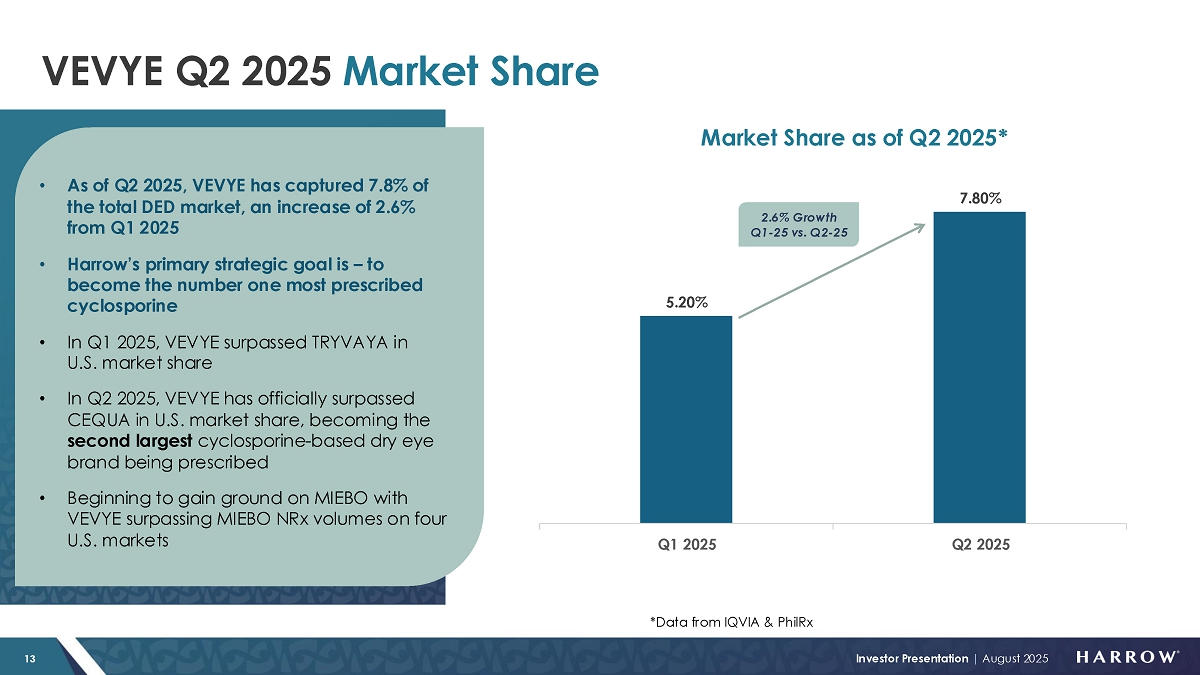
VEVYE’s market penetration is accelerating. By the end of Q2, VEVYE had captured a 7.8% share of the national DED market, a 2.6% gain quarter over quarter. Importantly, according to IQVIA and PhilRx, VEVYE is now the second largest cyclosporine-based dry eye brand being prescribed, a significant milestone validating execution in our primary commercial strategy – to win the cyclosporine-category in dry eye.
Our supply chain team is working hard to keep pace with the increasing demand for VEVYE, ensuring that patients have access to VEVYE without limitation. Thanks to close collaboration with our contract manufacturing organization (CMO), we have their commitment to provide us with additional manufacturing capacity for 2025. We are also revising our forecasts for next year, upsizing our supply, and ensuring we are positioned to meet the growing and sustained demand for new and refill prescriptions for VEVYE. We are also bringing a second VEVYE product site online, which is expected to go live next year.
Frankly, we did not expect VEVYE to be this successful so soon. Considering the modest commercial investments we have made to date, we consider it a great luxury to have the demand levels we have seen for VEVYE, which have exceeded our 2025 forecasts. That said, while we expect continued significant onboarding of new VEVYE customers, which we see each week, we are cautious about growing too much faster for the balance of this year. Once we have achieved an appropriate level of VEVYE safety stock (which we expect to achieve in the coming months), I intend to begin a staged new investment cycle to fuel the next wave of VEVYE growth, which we expect should last through the balance of this decade.
I remain confident that VEVYE is on track to surpass $100 million in annual revenue this year. When we issued our guidance earlier this year, we accounted for the anticipated decline and subsequent stabilization of ASP from Q1 to Q2, expecting VEVYE to generate over $60 million in revenue during the second half of the year. In conclusion, our guidance on VEVYE is reiterated.
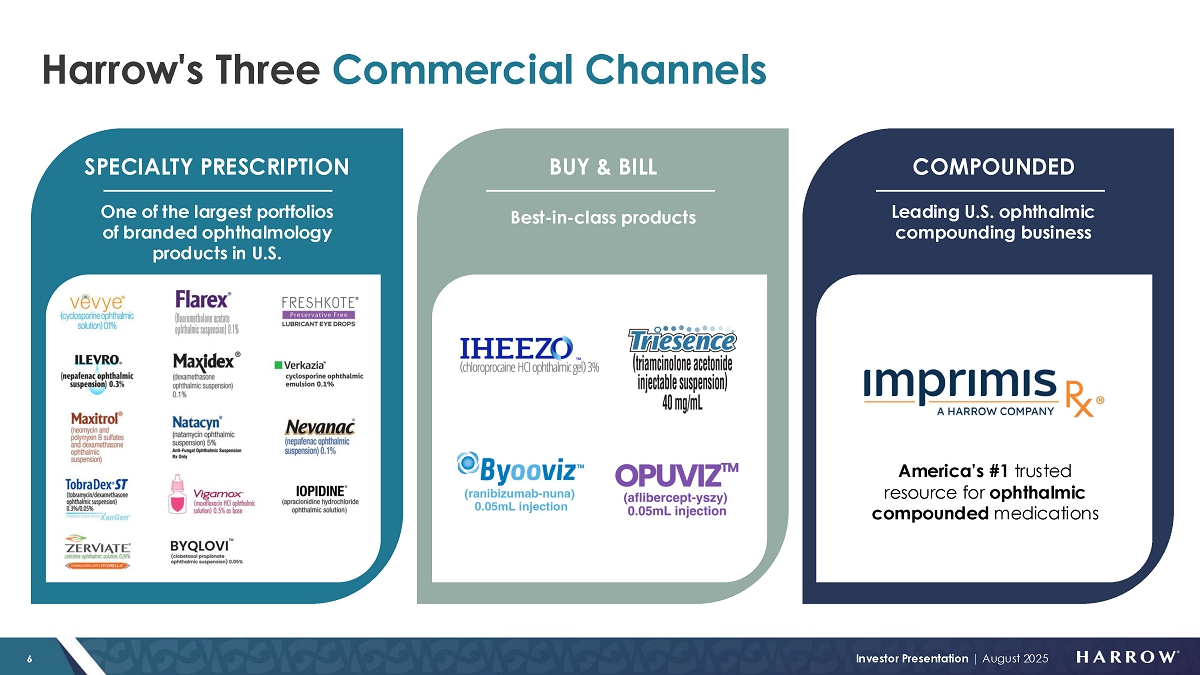
Buy and Bill Products
Our commercial team made excellent progress positioning Harrow’s buy and bill portfolio, including IHEEZO and TRIESENCE® (which will soon include BYOOVIZ and OPUVIZ), by improving market access, enhancing product visibility, and streamlining the ordering process through the following commercial infrastructure initiatives:
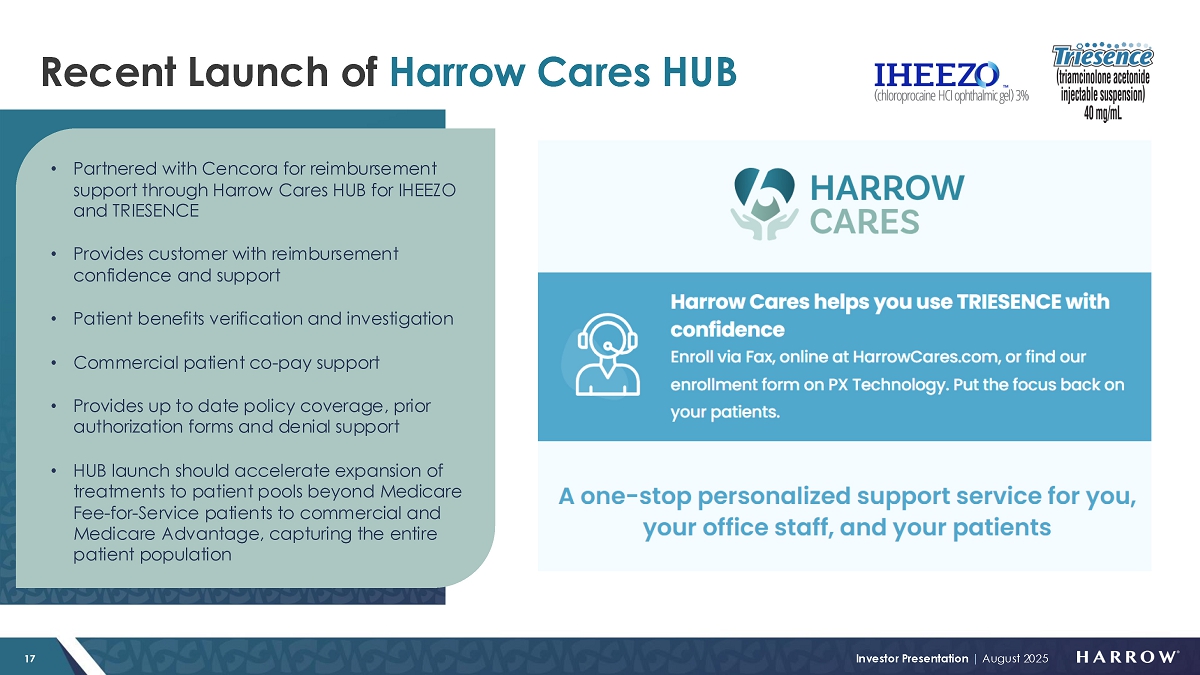
| ● | Harrow Cares™: Launched in January 2025, this program is streamlining patient enrollment, accelerating coverage wins, causing faster therapy initiation, and providing support for physicians, staff, and patients, truly enabling ECPs to confidently integrate IHEEZO and TRIESENCE into their practices. | |
| ● | Group Purchasing Organizations (GPOs): We executed agreements with all four of the major retina-focused GPOs, and now, 100% of the retina market has access to Harrow’s products through their GPO of choice. | |
| ● | Specialty Distribution Network Expansion: We expanded our network of specialty distribution channels, including one that serves one of the largest private equity-owned retina groups in the country and multiple large independent retina practices. |
IHEEZO
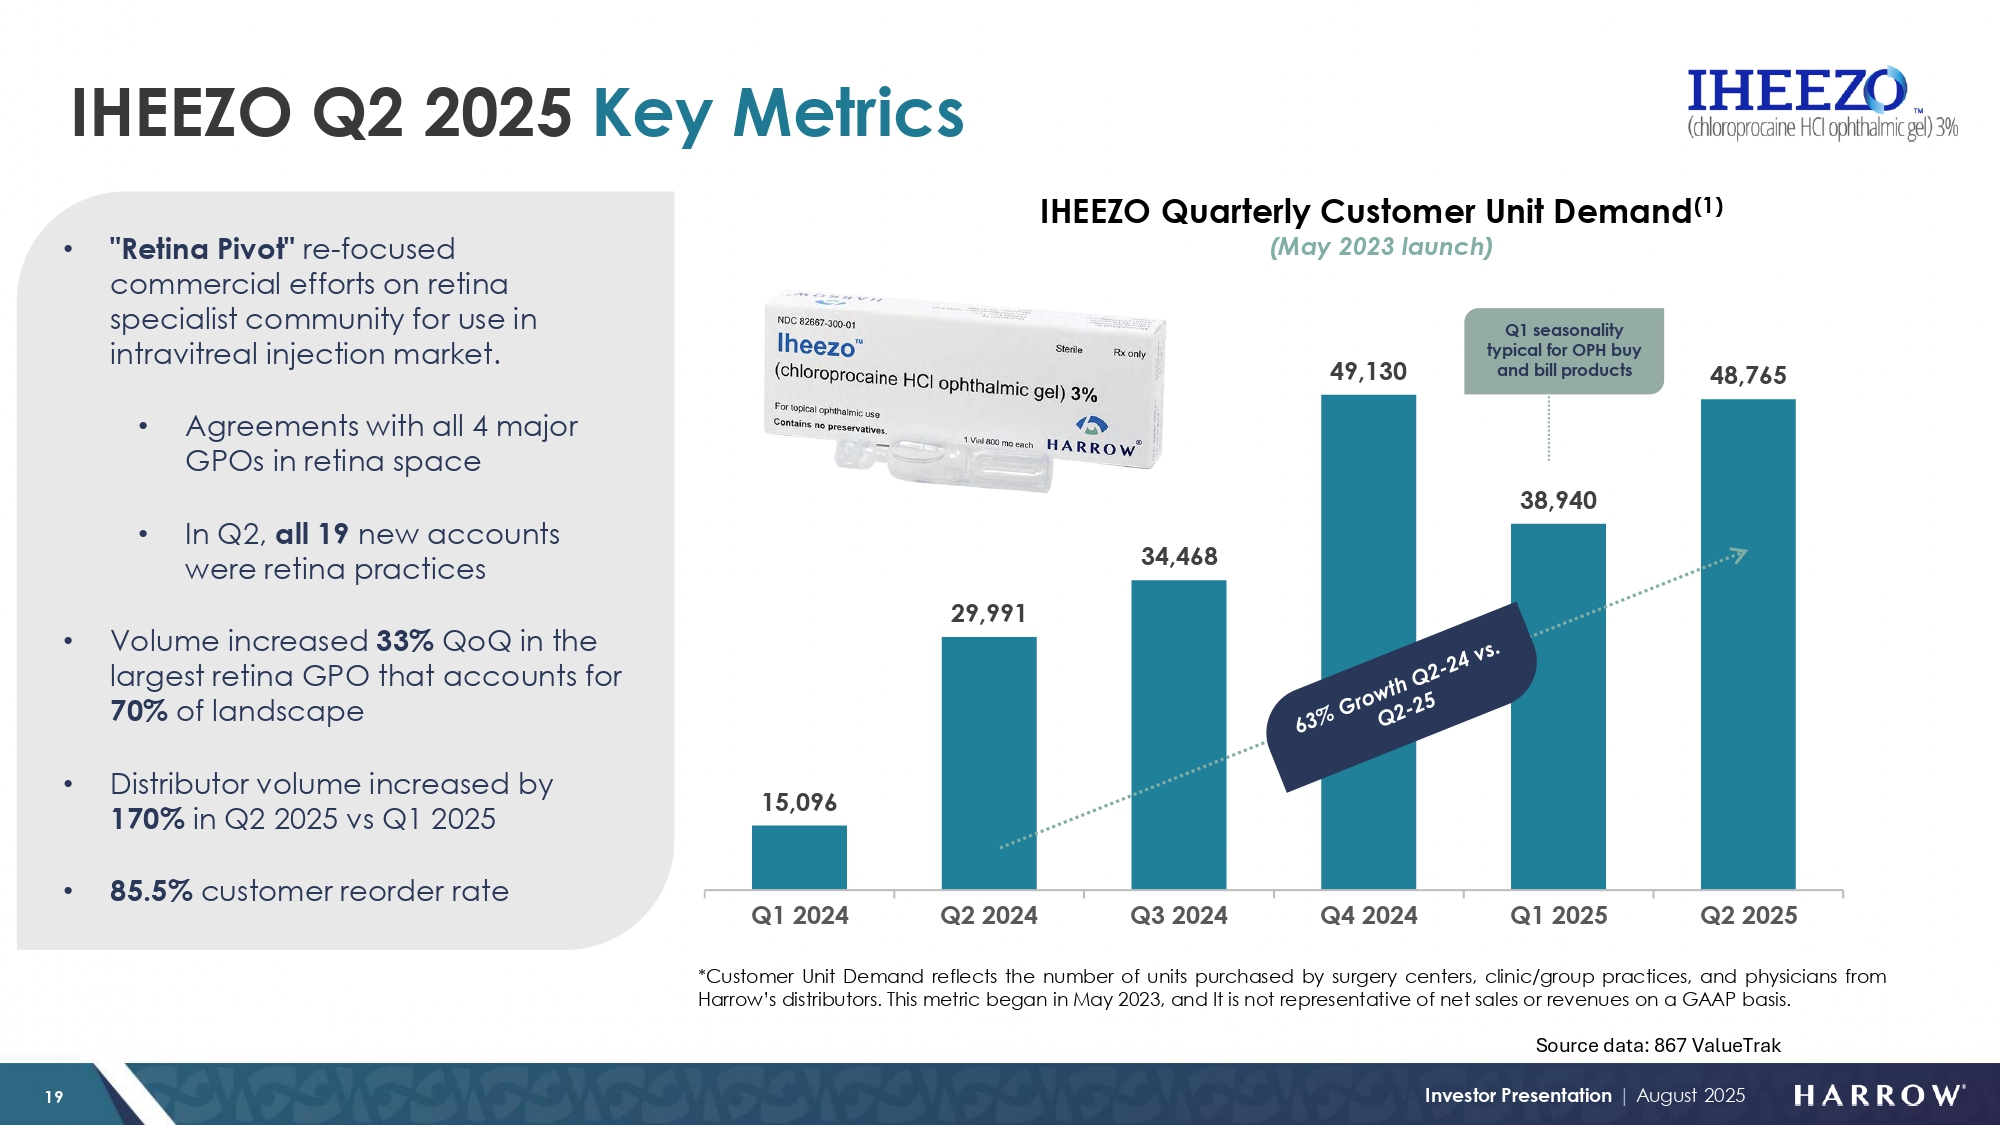
Second quarter IHEEZO revenue rose to $18.3 million, representing a sequential increase of 251% over Q1 2025, and an increase of 62% over Q2 2024. IHEEZO’s growth was buoyed by 19 new accounts in the second quarter and greater density within existing accounts. Second quarter unit demand of 48,765 represents a 63% increase over the second quarter of 2024 and 25% sequentially. Notably, IHEEZO volume grew 33% quarter over quarter within the largest retina GPO, which represents approximately 70% of the retina market. Overall, distributor shipment volume for IHEEZO increased by an impressive 170% in Q2 compared to Q1 2025, underscoring strong and accelerating demand, which I expect to continue in the back half of the year. A fact that Harrow stockholders should also appreciate is that so far in the third quarter, we have not only eclipsed the number of new IHEEZO account starts achieved in the second quarter, but all these new accounts were retina practices. The math looks good for IHEEZO, and shows we are on pace for a record year.
|
|
I also want to highlight that coverage for IHEEZO is quite pervasive at 81% across commercial and government payers. Our data shows that only 3% of IHEEZO claims are classified as “not covered” and that a mere 4% of claims required a prior authorization. Based on this, and the momentum we are seeing, I recently designed IHEEZO for All, a strategy aimed at enhancing IHEEZO use for retina procedures across both existing and new accounts and driving sales in the near term (i.e., through the balance of this year). This, coupled with the tailwinds from ASRS, all four major ophthalmic-focused GPOs on board, and strong clinical synergy between IHEEZO, TRIESENCE, and eventually, our new anti-VEGF products, BYOOVIZ and OPUVIZ — I sense that IHEEZO is entering a new phase of accelerated growth.
TRIESENCE
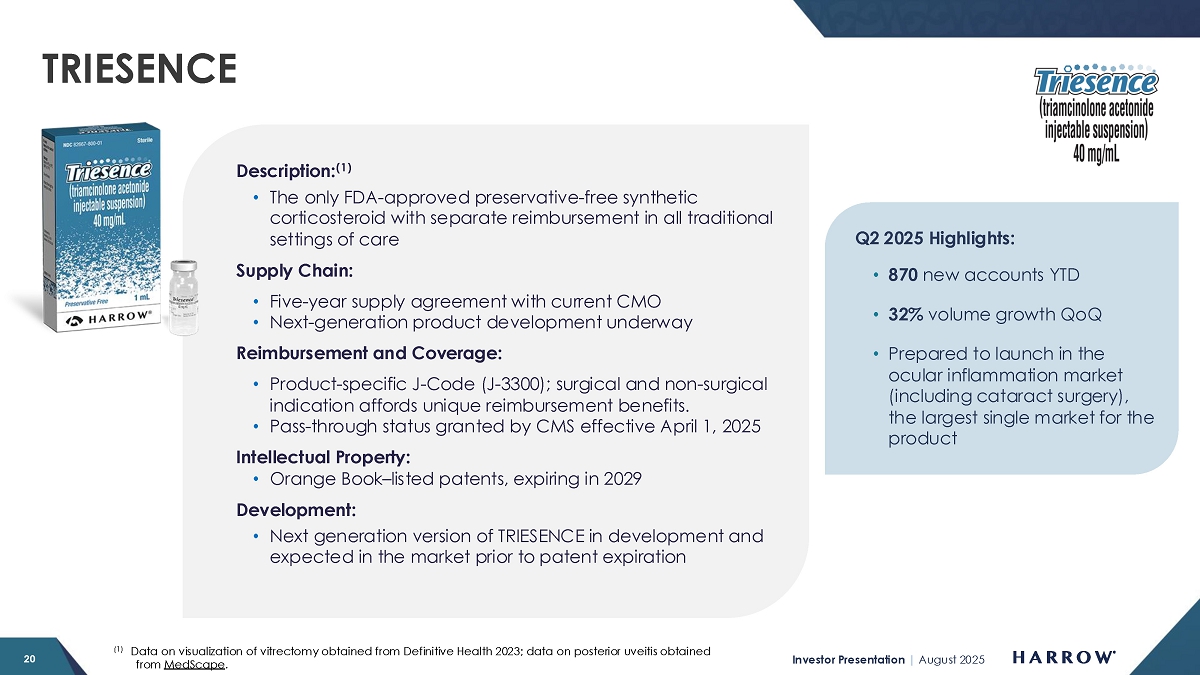
Year-to-date in 2025, TRIESENCE has added 870 new accounts, reflecting rapid adoption and commercial momentum. This doesn’t surprise me, and it is only the tip of the iceberg! There are so many reasons why TRIESENCE should be the number one ophthalmic injectable steroid in the U.S. market. And I believe it soon will be. There is no question that TRIESENCE is gaining traction within the retina community, with accelerating volumes and growing market share. In Q2, TRIESENCE achieved 32% quarter-over-quarter unit growth. That said, currently, only 26% of IHEEZO accounts are also ordering TRIESENCE, highlighting a significant opportunity for our commercial team to expand cross-product adoption.
Aside from the incredible clinical benefit TRIESENCE offers, we are proud to report that TRIESENCE patients’ out-of-pocket co-payments are now the lowest among all intraocular injectable steroid choices, at approximately $37 for government and private payers. In terms of the out-of-pocket cost-per-month of therapy, at the consumer level, TRIESENCE offers the most bang for the buck, by far.
Coverage for TRIESENCE deserves attention. We have achieved 84% coverage, with only 8% of claims requiring prior authorization, and a mere 3% of documented claims were returned as uncovered. The bottom line is that TRIESENCE is broadly labeled, has a history of efficacy, is widely available, and is exceedingly affordable with low patient out-of-pocket costs relative to other alternatives.
While the above data demonstrates that our go-to-market strategy with TRIESENCE is showing signs of momentum, the reality is that the retina market is small relative to the key market for TRIESENCE. Remember, I have been consistent in my belief that TRIESENCE should be a much more significant part of our march towards my main financial goal for Harrow – a $250 million revenue quarter by 2027, a goal that I intend to provide more color on during our Investor & Analyst Day.
Now that we have the necessary buy and bill commercial infrastructure in place, we are ready to move more aggressively into the ocular inflammation market – the largest market opportunity for TRIESENCE and one that we have not marketed into to date. We recently hired Chad Brines to lead our Specialty Brands sales team, which includes TRIESENCE. One of Chad’s chief responsibilities is to launch into the ocular inflammation market, a market he has extensive experience selling into. We are assembling his team now and expect to see his impact in the fourth quarter.
|
|
For the balance of the year, based on feedback from our physician customers and large institutional ASC owners, we believe TRIESENCE unit demand growth should begin to noticeably inflect in the fourth quarter and into 2026, especially as we move more resolutely into the ocular inflammation market.
BYOOVIZ (Biosimilar of LUCENTIS) & OPUVIZ (Biosimilar of EYLEA)
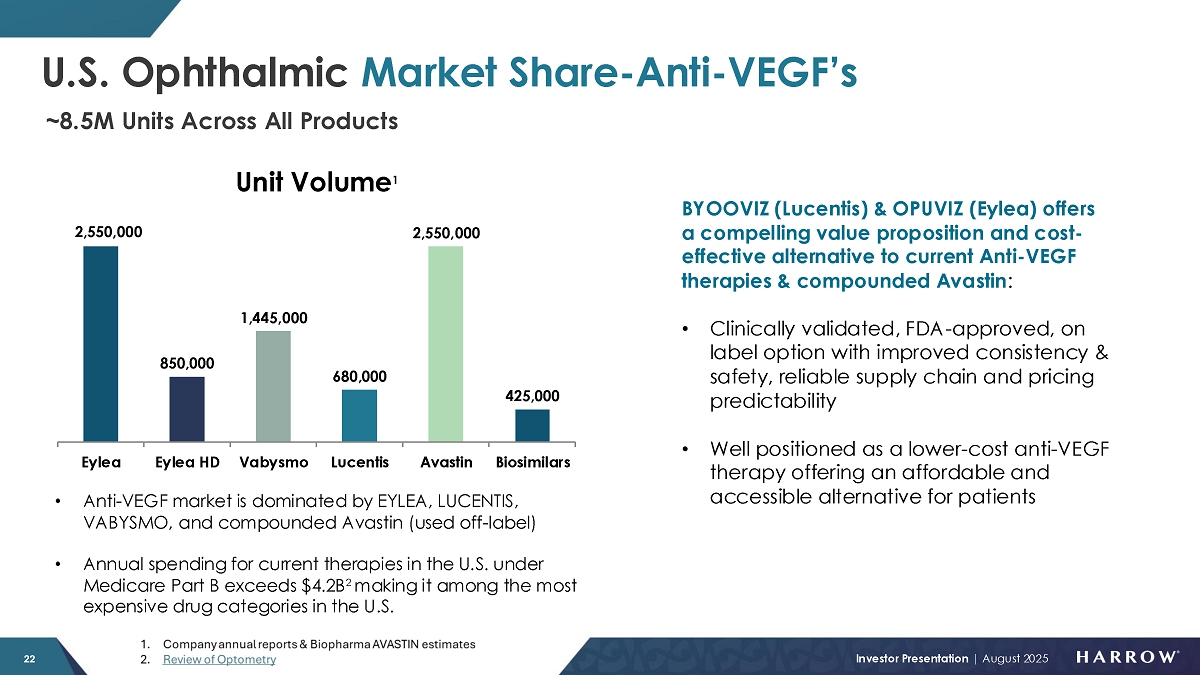
Our August 2024 Retina Pivot included an intention to not only build a world-class retina-focused commercial infrastructure, but to meaningfully compete in the wet age-related neovascular macular degeneration (wet AMD) market, the largest single eyecare market in the U.S. (i.e., each single percentage point of the market is more than $80 million per year).
For years, Andrew and I have been working diligently on the opportunity to add a compelling wet AMD therapeutic. Recently, we finally found the perfect partner in Samsung Bioepis, securing the exclusive U.S. commercial rights to their ophthalmology biosimilar portfolio — BYOOVIZ (ranibizumab-nuna), an FDA-approved biosimilar referencing LUCENTIS (ranibizumab), and OPUVIZ (aflibercept-yszy), an FDA-approved biosimilar referencing EYLEA (aflibercept). Lucentis and Eylea are two of the most widely used anti-VEGF therapies for retinal diseases. We believe strongly that these assets and anti-VEGF products in general will be impactful and highly relevant tools to manage wet AMD for many years to come.
BYOOVIZ and OPUVIZ will integrate seamlessly with our existing commercial infrastructure, and we expect to leverage the experience of our world class team, our creativity, and Harrow’s significant commercial flexibility to compete in the market and deliver potentially large revenue numbers to Harrow stockholders.
As we work through the transfer process of the products’ commercial rights with Samsung, we are actively preparing for the Harrow launch of BYOOVIZ. The combination of the incredible retina experience of the Harrow team with Samsung, especially after Samsung learned so many valuable lessons from the previous launch of BYOOVIZ, gives us a unique opportunity to get our offering optimized and capture a meaningful share in this large market. We look forward to sharing additional details about our unique approach to the commercial launches of these products in the future.
Specialty Branded Products
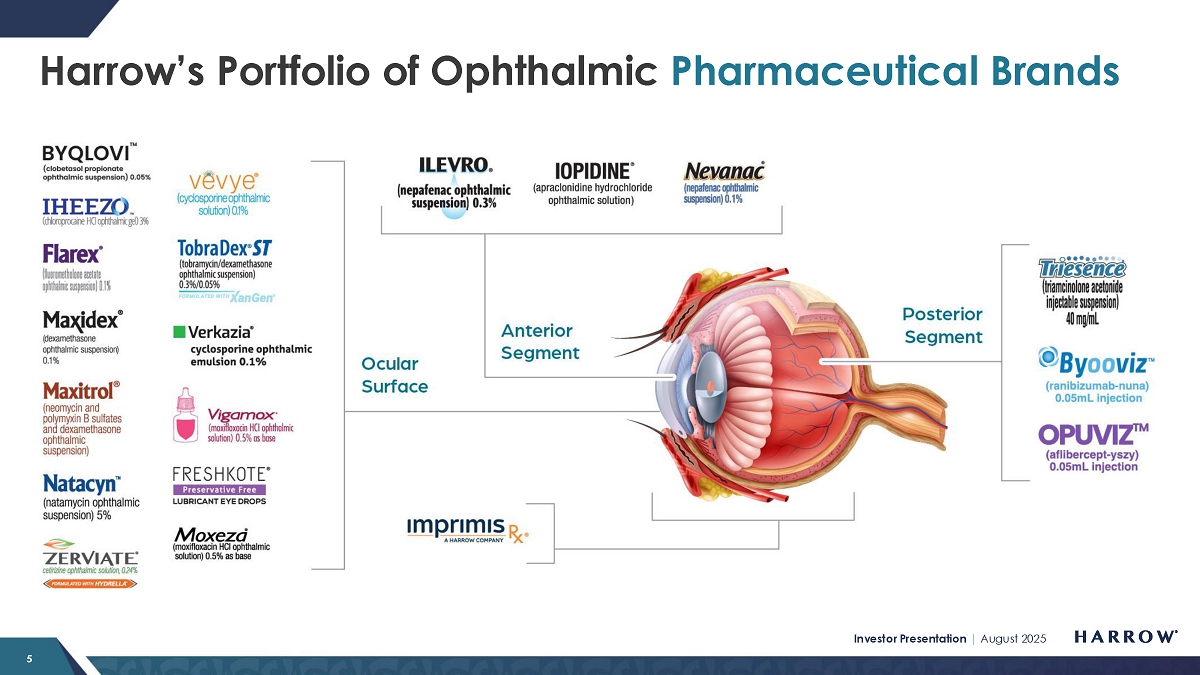
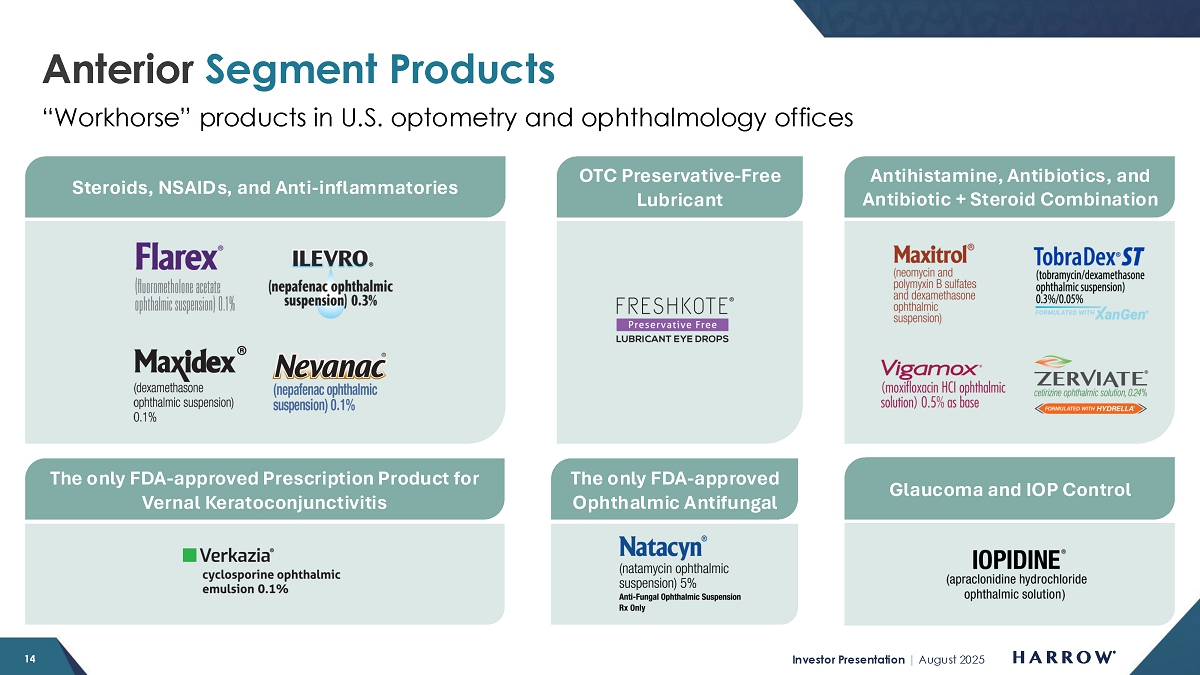
Our Specialty Branded Product (SBP) portfolio consists of well-known products that ECPs depend on to manage a wide array of ophthalmic diseases, including TRIESENCE, ILEVRO®, NEVANAC®, VIGAMOX®, MAXITROL®, MAXIDEX®, IOPIDINE®, NATACYN™, FLAREX®, TOBRADEX® ST, VERKAZIA®, FRESHKOTE®, ZERVIATE®, and the newest addition of BYQLOVI.
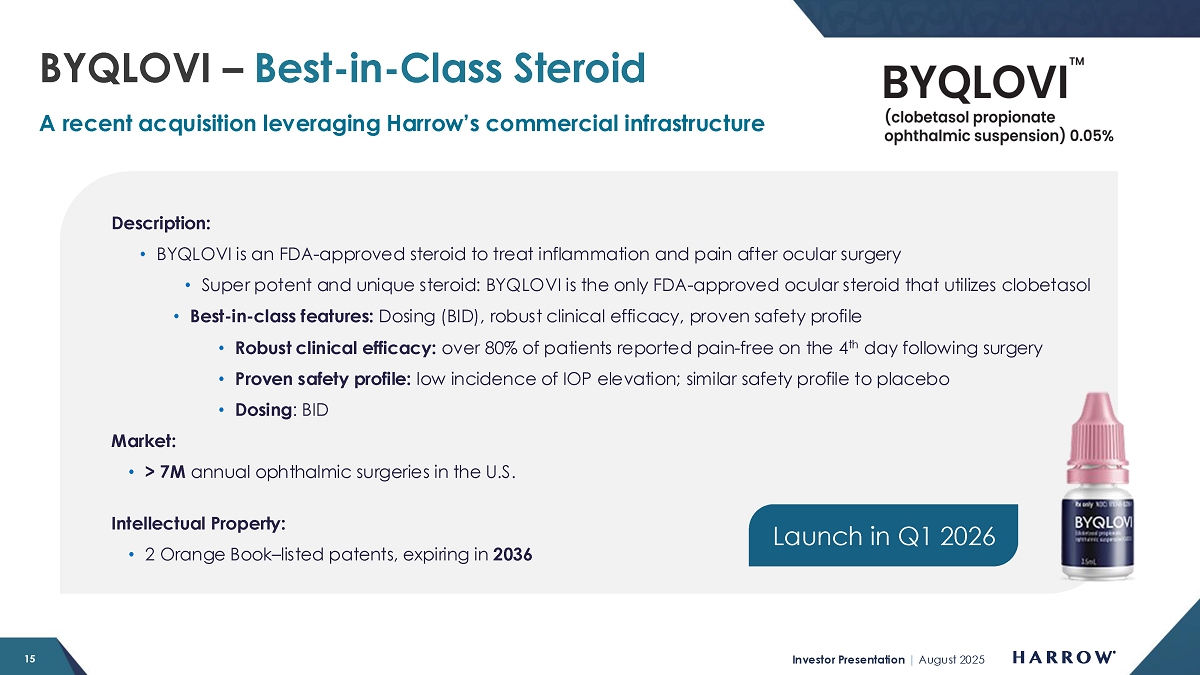
Our latest acquisition and addition to the SBP portfolio is BYQLOVI, an FDA-approved steroid indicated for the treatment of inflammation and pain after ocular surgery. I am particularly excited about this product as it represents the first novel steroid introduced to the market in over a decade. BYQLOVI is a highly potent, best-in-class therapy and the only FDA-approved ocular steroid formulated with clobetasol, offering strong clinical efficacy alongside a well-established safety profile.
With over 7 million ophthalmic surgeries performed annually in the United States and numerous other viable use cases for topical steroids, we see a significant market opportunity for BYQLOVI. I’m confident that our commercial team will drive strong adoption of this clinically differentiated product. We remain on track to launch BYQLOVI within the next few quarters.
|
|
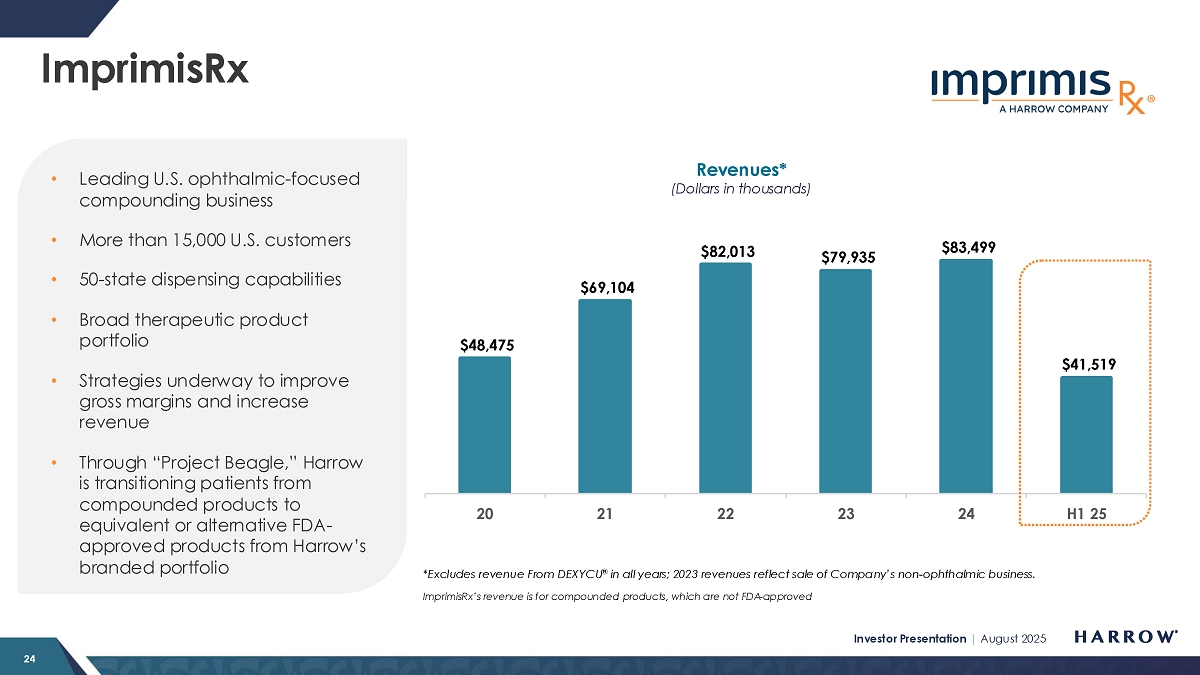
ImprimisRx
ImprimisRx demonstrated sequential recovery after experiencing seasonal softness in Q1, with revenue of $21.5 million, representing a sequential increase of 7% from the first quarter of 2025. April was a record month for ImprimisRx, which maintained strong growth throughout the remainder of the quarter.
I’m excited to report that we continue to identify new strategic opportunities to leverage the work we’ve put into building ImprimisRx into the leading U.S. provider of ophthalmic compounded prescription medications. Over the balance of this year, I expect ImprimisRx CEO John Saharek and Frank Mullery to drive several initiatives to enhance gross margins, drive revenue growth, and improve operational efficiency. While I won’t go into the specifics of our strategy, I remain exceedingly pleased with the direction ImprimisRx is heading. ImprimisRx continues to generate steady cash flow, allowing us to continue to creatively leverage into new and exciting ways to serve our customers and drive value to our stockholders.
Lastly, as an update on the previously announced $34.9 million jury verdict award to ImprimisRx in the case of ImprimisRx, LLC v. OSRX, Inc. (OSRX), the case is in the final stages of litigation. We expect a final legal ruling shortly and will provide stockholders with an update as material details become available.
Closing
We are confident in our guidance of “more than $280 million” in 2025 revenue. As in prior years – and as should be expected on an ongoing basis – we anticipate stronger revenue performance in the second half of the year compared to the first. This pattern will be especially evident across our key growth drivers: VEVYE, IHEEZO, and TRIESENCE.
To be clear – some areas of our business will likely overperform and others may underperform. Not everything is going to go our way, but a lot of things do appear to be moving in the right direction for us. My assessment, and I believe Andrew would agree, is that we are in the best shape we’ve ever been in.
On behalf of the entire Harrow Family, thank you for your continued support. Together, we are delivering on our promise to lead in ophthalmic disease management solutions – and we are just getting started.
Sincerely,
Mark L. Baum
Founder, Chairman of the Board, and Chief Executive Officer
Nashville, Tennessee
Index to Previous Letters to Stockholders
| 2025 | 2024 | 2023 | 2022 | 2021 | 2020 | 2019 | ||||||
| 4Q 2025 | 4Q 2023 | 4Q 2022 | 4Q 2021 | 4Q 2020 | 4Q 2019 | |||||||
| 3Q 2024 | 3Q 2023 | 3Q 2022 | 3Q 2021 | 3Q 2020 | 3Q 2019 | |||||||
| 2Q 2024 | 2Q 2023 | 2Q 2022 | 2Q 2021 | 2Q 2020 | ||||||||
| 1Q25 | 1Q 2024 | 1Q 2023 | 1Q 2022 | 1Q 2021 | 1Q 2020 |
|
|
Commentary on Second Quarter 2025 Financials
Revenues of $63.7 million for the second quarter of 2025 represent a 30% increase over the prior-year second quarter revenues of $48.9 million and an increase of 33% over first-quarter 2025 revenues.
Selling, general and administrative (“SG&A”) costs for the second quarter of 2025 were $33.2 million compared with $31.8 million during the same period last year. The slight increase in SG&A expenses between the three-month periods was primarily attributable to the addition of new employees within our commercial team and other departments to support current and expected growth, which when combined contributed to a $4,375,000 increase in SG&A expenses between the periods. However, these increases were offset by a $2,957,000 decrease in stock-based compensation expense between periods.
GAAP net income for the second quarter of 2025 was $5.0 million compared with a GAAP net loss of $(6.5) million during the same period last year. Core net income (a non-GAAP measure) for the second quarter of 2025 was $9.2 million compared with a core net loss of $(2.0) million in the prior year’s second quarter.
Adjusted EBITDA (a non-GAAP measure) for the second quarter of 2025 was $17.0 million compared with Adjusted EBITDA of $8.8 during the same quarter last year.
As of June 30, 2025, cash and cash equivalents totaled $53.0 million while accounts receivable stood at $78.8 million.
GAAP gross margins were 75% for the second quarter of 2025 compared to 74% in the same quarter in 2024. Core gross margins (a non-GAAP measure) remained steady at 79% in the second quarter of 2025 compared with 80% in the same period in 2024.
IHEEZO and VEVYE both surpassed the threshold of contributing 10% or more to total Harrow revenues. As a result, we reported individual revenues for these products in the Form 10-Q filing, as reflected in the table below:
|
For the Three Months Ended June 30, |
For the Six Months Ended June 30, |
|||||||||||||||||||||||||||||||
| 2025 | 2024 | 2025 | 2024 | |||||||||||||||||||||||||||||
| IHEEZO | $ | 18,336,000 | 29 | % | $ | 11,295,000 | 23 | % | $ | 23,558,000 | 21 | % | $ | 13,616,000 | 16 | % | ||||||||||||||||
| VEVYE | 18,641,000 | 29 | % | 4,315,000 | 9 | % | 40,156,000 | 36 | % | 6,912,000 | 8 | % | ||||||||||||||||||||
| Other branded products | 5,212,000 | 8 | % | 11,681,000 | 24 | % | 6,169,000 | 6 | % | 20,553,000 | 25 | % | ||||||||||||||||||||
| Other revenues | 85,000 | 0 | % | 68,000 | 0 | % | 171,000 | 0 | % | 147,000 | 0 | % | ||||||||||||||||||||
| Branded revenue, net | 42,274,000 | 66 | % | 27,359,000 | 56 | % | 70,054,000 | 63 | % | 41,228,000 | 49 | % | ||||||||||||||||||||
| ImprimisRx revenue, net | 21,468,000 | 34 | % | 21,580,000 | 44 | % | 41,519,000 | 37 | % | 42,298,000 | 51 | % | ||||||||||||||||||||
| Total revenues, net | $ | 63,742,000 | 100 | % | $ | 48,939,000 | 100 | % | $ | 111,573,000 | 100 | % | $ | 83,526,000 | 100 | % | ||||||||||||||||
As we move deeper into 2025, we expect continued growth across our branded portfolio and continue to expect traditional quarter-to-quarter revenue build, enhancing profitability through operational efficiencies and strategically positioning Harrow for continued leadership in the North American ophthalmic pharmaceutical sector.
|
|
Second Quarter 2025 Financial Overview
GAAP Operating Results
Selected financial highlights regarding GAAP operating results for the three months and six months ended June 30, 2025 and 2024 are as follows:
| For the Three Months Ended June 30, | For the Six Months Ended June 30, |
|||||||||||||||
| 2025 | 2024 | 2025 | 2024 | |||||||||||||
| Total revenues | $ | 63,742,000 | $ | 48,939,000 | $ | 111,573,000 | $ | 83,526,000 | ||||||||
| Cost of sales | 16,230,000 | 12,539,000 | 31,754,000 | 23,092,000 | ||||||||||||
| Gross profit | 47,512,000 | 36,400,000 | 79,819,000 | 60,434,000 | ||||||||||||
| Selling, general and administrative | 33,235,000 | 31,817,000 | 73,748,000 | 60,630,000 | ||||||||||||
| Research and development | 2,868,000 | 3,053,000 | 5,894,000 | 5,202,000 | ||||||||||||
| Total operating expenses | 36,103,000 | 34,870,000 | 79,642,000 | 65,832,000 | ||||||||||||
| Income (loss) from operations | 11,409,000 | 1,530,000 | 177,000 | (5,398,000 | ) | |||||||||||
| Total other expense, net | (6,414,000 | ) | (7,348,000 | ) | (12,962,000 | ) | (13,985,000 | ) | ||||||||
| Income tax expense | - | (655,000 | ) | - | (655,000 | ) | ||||||||||
| Net income (loss) attributable to Harrow, Inc. | $ | 4,995,000 | $ | (6,473,000 | ) | $ | (12,785,000 | ) | $ | (20,038,000 | ) | |||||
| Net income (loss) per share: | ||||||||||||||||
| Basic | $ | 0.14 | $ | (0.18 | ) | $ | (0.35 | ) | $ | (0.56 | ) | |||||
| Diluted | $ | 0.13 | $ | (0.18 | ) | $ | (0.35 | ) | $ | (0.56 | ) | |||||
Core Results (Non-GAAP Measures)
Core Results (non-GAAP measures), which we define as the after-tax earnings and other operational and financial metrics generated from our principal business, for the three months and six months ended June 30, 2025 and 2024 are as follows:
|
For the Three Months Ended June 30, |
For the Six Months Ended June 30, |
|||||||||||||||
| 2025 | 2024 | 2025 | 2024 | |||||||||||||
| Total revenues | $ | 63,742,000 | $ | 48,939,000 | $ | 111,573,000 | $ | 83,526,000 | ||||||||
| Gross margin | 75 | % | 74 | % | 72 | % | 72 | % | ||||||||
| Core gross margin(1) | 80 | % | 79 | % | 78 | % | 78 | % | ||||||||
| Net income (loss) | 4,995,000 | (6,473,000 | ) | (12,785,000 | ) | (20,038,000 | ) | |||||||||
| Core net income (loss)(1) | 9,227,000 | (2,047,000 | ) | (4,327,000 | ) | (11,836,000 | ) | |||||||||
| Adjusted EBITDA(1) | 17,006,000 | 8,803,000 | 15,021,000 | 9,030,000 | ||||||||||||
| Net income (loss) per share: | ||||||||||||||||
| Basic | 0.14 | (0.18 | ) | (0.35 | ) | (0.56 | ) | |||||||||
| Diluted | 0.13 | (0.18 | ) | (0.35 | ) | (0.56 | ) | |||||||||
| Core net income (loss) per share:(1) | ||||||||||||||||
| Basic | 0.25 | (0.06 | ) | (0.12 | ) | (0.33 | ) | |||||||||
| Diluted | 0.24 | (0.06 | ) | (0.12 | ) | (0.33 | ) | |||||||||
| (1) | Core gross margin, core net income (loss), core basic and diluted net income (loss) per share (collectively, “Core Results”), and Adjusted EBITDA are non-GAAP measures. For additional information, including a reconciliation of such Core Results and Adjusted EBITDA to the most directly comparable measures presented in accordance with GAAP, see the explanation of non-GAAP measures and reconciliation tables at the end of this Letter to Stockholders. |
|
|
FORWARD-LOOKING STATEMENTS
Management’s remarks in this stockholder letter include forward-looking statements within the meaning of federal securities laws. Forward-looking statements are subject to numerous risks and uncertainties, many of which are beyond Harrow’s control, including risks and uncertainties described from time to time in its Securities and Exchange Commission (SEC) filings, such as the risks and uncertainties related to the Company’s ability to make commercially available its FDA-approved products and compounded formulations and technologies, and FDA approval of certain drug candidates in a timely manner or at all.
For a list and description of those risks and uncertainties, please see the “Risk Factors” section of the Company’s Annual Report on Form 10-K for the year ended December 31, 2024, subsequent Quarterly Reports on Form 10-Q, and other filings with the SEC.
Harrow’s results may differ materially from those projected. Harrow disclaims any intention or obligation to update or revise any financial projections or forward-looking statements whether because of new information, future events or otherwise. This stockholder letter contains time-sensitive information and is accurate only as of today.
Additionally, Harrow refers to non-GAAP financial measures, specifically Adjusted EBITDA, adjusted earnings, core gross margin, core net income (loss), and core basic and diluted net income (loss) per share. A reconciliation of non-GAAP measures with the most directly comparable GAAP measures is included in this letter.
No compounded formulation is FDA-approved. All compounded formulations are customizable. Other than drugs compounded at a registered outsourcing facility, all compounded formulations require a prescription for an individually identified patient consistent with federal and state laws.
All trademarks, service marks, and trade names included or referenced in this publication are the property of their respective owners.
|
|
Non-GAAP Financial Measures
In addition to the Company’s results of operations determined in accordance with U.S. generally accepted accounting principles (GAAP), which are presented and discussed above, management also utilizes Adjusted EBITDA and Core Results, unaudited financial measures that are not calculated in accordance with GAAP, to evaluate the Company’s financial results and performance and to plan and forecast future periods. Adjusted EBITDA and Core Results are considered “non-GAAP” financial measures within the meaning of Regulation G promulgated by the SEC. Management believes that these non-GAAP financial measures reflect an additional way of viewing aspects of the Company’s operations that, when viewed with GAAP results, provide a more complete understanding of the Company’s results of operations and the factors and trends affecting its business. Management believes Adjusted EBITDA and Core Results provide meaningful supplemental information regarding the Company’s performance because (i) they allow for greater transparency with respect to key metrics used by management in its financial and operational decision-making; (ii) they exclude the impact of non-cash or, when specified, non-recurring items that are not directly attributable to the Company’s core operating performance and that may obscure trends in the Company’s core operating performance; and (iii) they are used by institutional investors and the analyst community to help analyze the Company’s results. However, Adjusted EBITDA, Core Results, and any other non-GAAP financial measures should be considered as a supplement to, and not as a substitute for, or superior to, the corresponding measures calculated in accordance with GAAP. Further, non-GAAP financial measures used by the Company and the way they are calculated may differ from the non-GAAP financial measures or the calculations of the same non-GAAP financial measures used by other companies, including the Company’s competitors.
Adjusted EBITDA
The Company defines Adjusted EBITDA as net income (loss), excluding the effects of stock-based compensation and expenses, interest, taxes, depreciation, amortization, investment loss, net, and, if any and when specified, other non-recurring income or expense items. Management believes that the most directly comparable GAAP financial measure to Adjusted EBITDA is net income (loss). Adjusted EBITDA has limitations and should not be considered as an alternative to gross profit or net income (loss) as a measure of operating performance or to net cash provided by (used in) operating, investing, or financing activities as a measure of ability to meet cash needs.
The following is a reconciliation of Adjusted EBITDA, a non-GAAP measure, to the most comparable GAAP measure, net income (loss), for the three months and six months ended June 30, 2025 and for the same period in 2024:
|
For the Three Months Ended June 30, |
For the Six Months Ended June 30, |
|||||||||||||||
| 2025 | 2024 | 2025 | 2024 | |||||||||||||
| GAAP net income (loss) | $ | 4,995,000 | $ | (6,473,000 | ) | $ | (12,785,000 | ) | $ | (20,038,000 | ) | |||||
| Stock-based compensation and expenses | 875,000 | 4,271,000 | 5,431,000 | 8,440,000 | ||||||||||||
| Interest expense, net | 6,408,000 | 5,471,000 | 12,956,000 | 10,886,000 | ||||||||||||
| Income tax expense | - | 655,000 | - | 655,000 | ||||||||||||
| Depreciation | 496,000 | 453,000 | 961,000 | 885,000 | ||||||||||||
| Amortization of intangible assets | 4,226,000 | 2,549,000 | 8,452,000 | 5,103,000 | ||||||||||||
| Investment loss, net | - | 1,923,000 | - | 3,171,000 | ||||||||||||
| Other expense (income), net | 6,000 | (46,000 | ) | 6,000 | (72,000 | ) | ||||||||||
| Adjusted EBITDA | $ | 17,006,000 | $ | 8,803,000 | $ | 15,021,000 | $ | 9,030,000 | ||||||||
|
|
Core Results
Harrow Core Results, including core gross margin, core net income (loss), and core basic and diluted income (loss) per share exclude (1) all amortization and impairment charges of intangible assets, excluding software development costs, (2) net gains and losses on investments and equity securities, including equity method gains and losses and equity valued at fair value through profit and loss (FVPL), and preferred stock dividends, and (3) gains/losses on forgiveness of debt. In certain periods, Core Results may also exclude fair value adjustments of financial assets in the form of options to acquire a company carried at FVPL, obligations related to product recalls, certain acquisition-related items, restructuring charges/releases and associated items, related legal items, gains/losses on early extinguishment of debt or debt modifications, impairments of property, plant and equipment and software, as well as income and expense items that management deems exceptional and that are or are expected to accumulate within the year to be over a $100,000 threshold.
The following is a reconciliation of Core Results, non-GAAP measures, to the most comparable GAAP measures for the three months and six months ended June 30, 2025 and 2024:
| For the Three Months Ended June 30, 2025 | ||||||||||||||||||||
GAAP Results |
Amortization of Certain Intangible Assets |
Investment Gains (Losses) |
Other Items |
Core Results |
||||||||||||||||
| Gross profit | $ | 47,512,000 | $ | 3,780,000 | $ | - | $ | - | $ | 51,292,000 | ||||||||||
| Gross margin | 75 | % | 80 | % | ||||||||||||||||
| Operating income | 11,409,000 | 4,226,000 | - | - | 15,635,000 | |||||||||||||||
| Income before taxes | 4,995,000 | 4,226,000 | - | 6,000 | 9,227,000 | |||||||||||||||
| Taxes | - | - | - | - | - | |||||||||||||||
| Net income | 4,995,000 | 4,226,000 | - | 6,000 | 9,227,000 | |||||||||||||||
| Income per share ($)(1): | ||||||||||||||||||||
| Basic | 0.14 | 0.25 | ||||||||||||||||||
| Diluted | 0.13 | 0.24 | ||||||||||||||||||
| Weighted average number of shares of common stock outstanding: |
||||||||||||||||||||
| Basic | 36,790,306 | 36,790,306 | ||||||||||||||||||
| Diluted | 38,853,855 | 38,853,855 | ||||||||||||||||||
| For the Six Months Ended June 30, 2025 | ||||||||||||||||||||
| GAAP Results | Amortization of Certain Intangible Assets | Investment Gains (Losses) | Other Items |
Core Results |
||||||||||||||||
| Gross profit | $ | 79,819,000 | $ | 7,560,000 | $ | - | $ | - | $ | 87,379,000 | ||||||||||
| Gross margin | 72 | % | 78 | % | ||||||||||||||||
| Operating income | 177,000 | 8,452,000 | - | - | 8,629,000 | |||||||||||||||
| Loss before taxes | (12,785,000 | ) | 8,452,000 | 6,000 | (4,327,000 | ) | ||||||||||||||
| Taxes | - | - | - | - | - | |||||||||||||||
| Net loss | (12,785,000 | ) | 8,452,000 | - | 6,000 | (4,327,000 | ) | |||||||||||||
| Basic and diluted loss per share ($)(1) | (0.35 | ) | (0.12 | ) | ||||||||||||||||
| Weighted average number of shares of common stock outstanding, basic and diluted | 36,304,787 | 36,304,787 | ||||||||||||||||||
|
|
| For the Three Months Ended June 30, 2024 | ||||||||||||||||||||
|
GAAP Results |
Amortization of Certain Intangible Assets |
Investment Gains (Losses) |
Other Items |
Core Results |
||||||||||||||||
| Gross profit | $ | 36,400,000 | $ | 2,140,000 | $ | - | $ | - | $ | 38,540,000 | ||||||||||
| Gross margin | 74 | % | 79 | % | ||||||||||||||||
| Operating income | 1,530,000 | 2,549,000 | - | - | 4,079,000 | |||||||||||||||
| (Loss) income before taxes | (5,818,000 | ) | 2,549,000 | 1,923,000 | (46,000 | ) | (1,392,000 | ) | ||||||||||||
| Taxes | (655,000 | ) | - | - | - | (655,000 | ) | |||||||||||||
| Net (loss) income | (6,473,000 | ) | 2,549,000 | 1,923,000 | (46,000 | ) | (2,047,000 | ) | ||||||||||||
| Basic and diluted loss per share ($)(1) | (0.18 | ) | (0.06 | ) | ||||||||||||||||
| Weighted average number of shares of common stock outstanding, basic and diluted | 35,618,977 | 35,618,977 | ||||||||||||||||||
| For the Six Months Ended June 30, 2024 | ||||||||||||||||||||
|
GAAP Results |
Amortization of Certain Intangible Assets |
Investment Gains (Losses) |
Other Items |
Core Results |
||||||||||||||||
| Gross profit | $ | 60,434,000 | $ | 4,280,000 | $ | - | $ | - | $ | 64,714,000 | ||||||||||
| Gross margin | 72 | % | 78 | % | ||||||||||||||||
| Operating loss | (5,398,000 | ) | 5,103,000 | - | - | (295,000 | ) | |||||||||||||
| (Loss) income before taxes | (19,383,000 | ) | 5,103,000 | 3,171,000 | (72,000 | ) | (11,181,000 | ) | ||||||||||||
| Taxes | (655,000 | ) | - | - | - | (655,000 | ) | |||||||||||||
| Net (loss) income | (20,038,000 | ) | 5,103,000 | 3,171,000 | (72,000 | ) | (11,836,000 | ) | ||||||||||||
| Basic and diluted loss per share ($)(1) | (0.56 | ) | (0.33 | ) | ||||||||||||||||
| Weighted average number of shares of common stock outstanding, basic and diluted | 35,544,312 | 35,544,312 | ||||||||||||||||||
| (1) | Core basic and diluted loss per share is calculated using the weighted-average number of shares of common stock outstanding during the period. Core basic and diluted loss per share also contemplates dilutive shares associated with equity based awards as described in Note 2 and elsewhere in the Consolidated Financial Statements included in the Company’s Quarterly Report on Form 10-Q for the quarter ended June 30, 2025. |
|
|
Exhibit 99.3