Document
Heavy maintenance schedule and inventory
rebuild limited pulp volumes
São Paulo, May 8th, 2025. Suzano S.A. (B3: SUZB3 | NYSE: SUZ), one of the world’s largest integrated pulp and paper producers, announces today its consolidated results for the first quarter of 2025 (1Q25).
HIGHLIGHTS
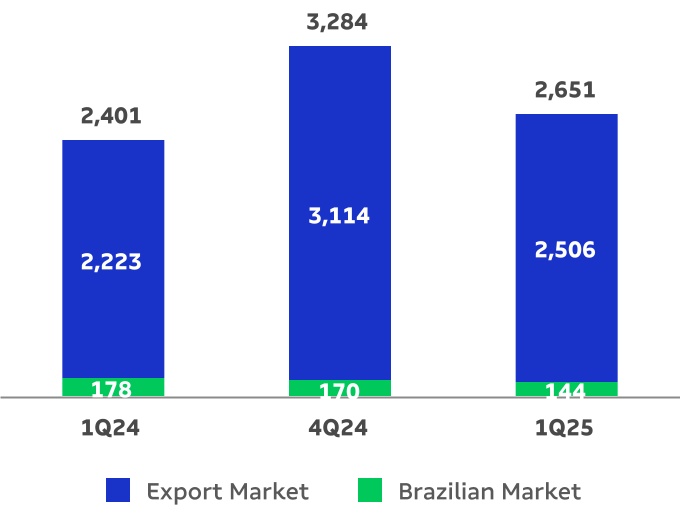
•Pulp sales of 2,651 thousand tonnes (10% vs. 1Q24).
•Paper sales¹ of 390 thousand tonnes (25% vs. 1Q24).
•Adjusted EBITDA2 and Operating cash generation3: R$ 4.9 billion and R$2.6 billion, respectively.
•Adjusted EBITDA2/t from pulp of R$1,605/t (-1% vs. 1Q24).
•Adjusted EBITDA2/t from paper of R$1,568/t (-25% vs. 1Q24).
•Average net pulp price in export market: US$556/t (-11% vs. 1Q24).
•Average net paper price1 of R$7,540/t (12% vs. 1Q24).
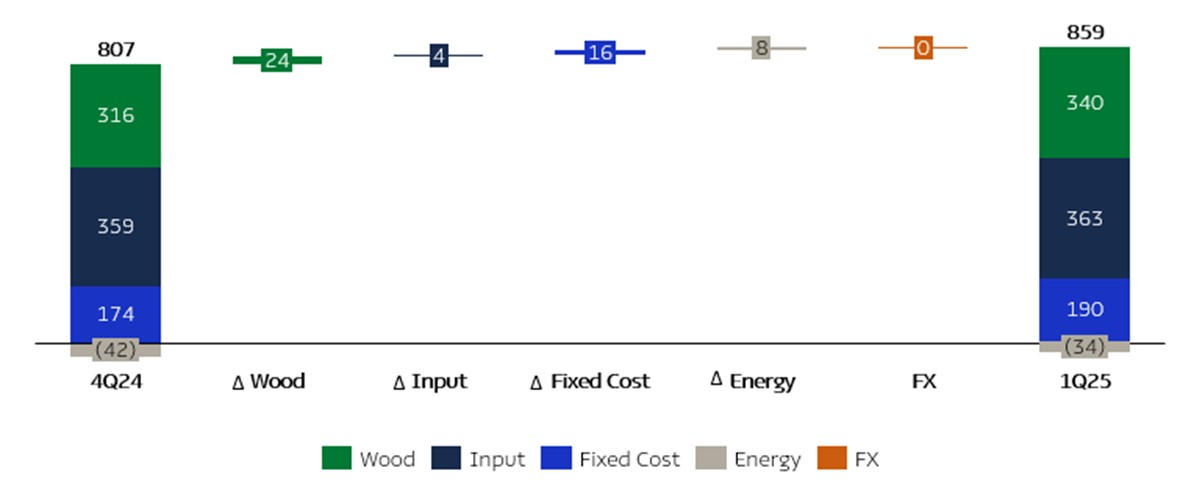
•Pulp cash cost ex-downtimes of R$859/t (6% vs.1Q24).
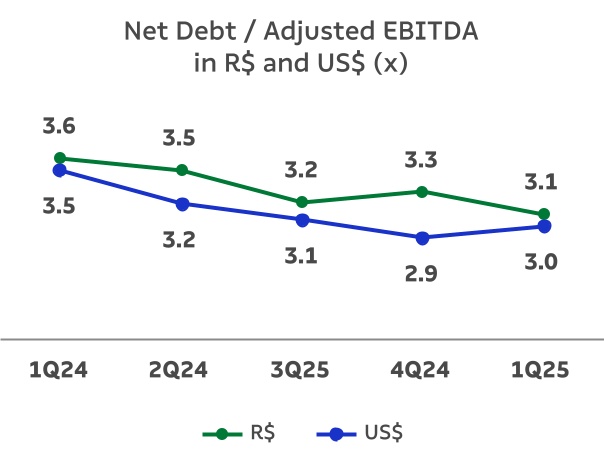
•Leverage of 3.0 times in USD and 3.1 times in BRL.
•Free Cash Flow Yield ("FCF Yield" - LTM ) of 18.5% (+3.2 p.p. vs. 1Q24).
|
|
|
|
|
|
|
|
|
|
|
|
|
|
|
|
|
|
|
|
|
| Financial Data (R$ million) |
1Q25 |
4Q24 |
Δ Q-o-Q |
1Q24 |
Δ Y-o-Y |
LTM 1Q25 |
| Net Revenue |
11,553 |
14,177 |
-19% |
9,459 |
22% |
49,498 |
Adjusted EBITDA2 |
4,866 |
6,481 |
-25% |
4,558 |
7% |
24,157 |
Adjusted EBITDA Margin2 |
42% |
46% |
-4 p.p. |
48% |
-6 p.p. |
49% |
| Net Financial Result |
7,696 |
(15,556) |
— |
(3,040) |
— |
(18,066) |
| Net Income |
6,348 |
(6,737) |
— |
220 |
— |
(917) |
Operating Cash Generation3 |
2,625 |
4,843 |
-46% |
2,499 |
5% |
16,364 |
Net Debt/ Adjusted EBITDA2 (x) (R$) |
3.1 x |
3.3 x |
-0.2 x |
3.6 x |
-0.5 x |
3.1 x |
Net Debt/ Adjusted EBITDA2 (x) (US$) |
3.0 x |
2.9 x |
0.1 x |
3.5 x |
-0.5 x |
3.0 x |
|
|
|
|
|
|
|
|
|
|
|
|
|
|
|
|
|
|
|
|
|
| Operational Data ('000 t) |
1Q25 |
4Q24 |
Δ Q-o-Q |
1Q24 |
Δ Y-o-Y |
LTM 1Q25 |
| Sales |
3,041 |
3,714 |
-18% |
2,713 |
12% |
12,628 |
| Pulp |
2,651 |
3,284 |
-19% |
2,401 |
10% |
11,114 |
Paper1 |
390 |
430 |
-9% |
313 |
25% |
1,513 |
¹Considers the results of the Consumer Goods Unit (tissue) and the results of the operation of the Suzano Packaging US Unit (Pine Bluff and Waynesville). | ² Excluding non-recurring items. | ³Considers Adjusted EBITDA less maintenance capex (cash basis).
The consolidated quarterly financial information was prepared in accordance with the standards set by the Securities and Exchange Commission of Brazil (CVM) and the Accounting Pronouncements Committee (CPC) and complies with the International Financial Reporting Standards (IFRS) issued by the International Accounting Standards Board (IASB). The operating and financial information is presented on a consolidated basis and in Brazilian real (R$). Note that figures may present discrepancies due to rounding.
CONTENTS
EXECUTIVE SUMMARY
The pulp market showed a favorable performance in the first 2 months of 2025, with successive price increases fully implemented, in light of the effects of limited supply caused by the downtime of an important integrated paper producer in China as well as the conversion of production to dissolving pulp by one of the sector's producers. In March, market sentiment remained positive regarding pulp prices and the implementation of the new price increase announced for the period, especially after Shanghai Pulp Week - an important event in the P&P sector. However, the more uncertain global macroeconomic environment at the end of the quarter had a negative impact on market dynamics.
The results of the company's pulp business were impacted by the lower volume sold, given the commercial strategy of inventory restocking to normal levels, and the lower realized price, in turn due to the invoicing of backlogs for some regions. Operating performance was according to plan, with an increase in the cash production cost, mainly due to the effect of scheduled maintenance downtimes. This combination of factors resulted in a decrease in adjusted pulp EBITDA per ton compared to the previous quarter. In the paper business unit, the sales volume decreased mainly due to seasonality, while prices increased in relation to the previous quarter and the same period in 2024. Consolidated adjusted EBITDA in the quarter amounted to R$4.9 billion, down 25% on 4Q24 and up 7% compared to the same period in 2024. Operating cash generation reached R$2.6 billion in the quarter, representing a 36% reduction compared to 4Q24 and a 24% increase year-on-year.
Regarding the performance of the paperboard assets acquired by the company in the United States in October 2024 (now Suzano Packaging US), 1Q25 results show an operational and commercial evolution of the business, fully in line with the company's strategy.
In terms of financial management, net debt measured in dollars stood at US$12.9 billion, in a quarter marked by the disbursement of interest on equity of R$2.2 billion. Leverage in USD, on the other hand, stood at 3.0 times, given the slight decrease in Adjusted EBITDA in the last 12 months and the minor increase in net debt. The foreign exchange hedging policy continued to play its part, with average strikes of Zero Cost Collar operations contracted at 5.44 (put) and 6.26 (call) and a notional value of US$7.3 billion.
Regarding the financial execution of the Cerrado project (Ribas do Rio Pardo Unit), the company has completed approximately 97% of the total capex disbursement, with R$0.6 billion remaining to be paid still in 2025.
PULP BUSINESS PERFORMANCE
PULP SALES VOLUME AND REVENUE
The first quarter of 2025 was marked by successive price increases in all regions, and paper production at healthy levels globally.
The Chinese market continued to present the effects of the temporary withdrawal of a major integrated paper producer, which is reflected in the price increases of printing and writing paper and paperboard by 3.3% and 4.1%, respectively, when comparing the average price with the fourth quarter of 2024. Despite the seasonal impact of the Chinese New Year and the uncertain scenario preceding the tariff announcements in April, paper production across all segments remained at levels similar to the previous quarter. Notably, the production of coated paper and paperboard increased by 2.4% and 7.5%, respectively.
In Europe, according to Utipulp, pulp consumption in the first quarter increased 5.8% for BHKP and decreased 2.3% for BSKP compared to 4Q24, also as a result of the fiber substitution movement - which continues to be active with the maintenance of the high spread between long and short fiber prices in the region. In North America, the sanitary paper market remained stable and healthy.
The average PIX/FOEX indices for the quarter for hardwood pulp in China increased 4% and in Europe decreased 2% when compared to 4Q24. In both regions, March price levels were the highest in the quarter. The average price difference between long and short fiber in the quarter was USD 220/t in China and USD 432/t in Europe, motivating the substitution movement from long to short fiber.
Suzano's pulp sales decreased 19% when compared to the previous quarter due to the seasonality of the period, with a reduction in volumes to Asia, totaling 2,651 thousand tonnes. Compared to 1Q24, the increase was 10%, mainly driven by the increases observed in Asia and North America, supported by higher volumes produced from the new Ribas do Rio Pardo operation.
Pulp Sales Volume ('000 t)
Average net price in USD of pulp sold by Suzano was US$555/t, decreasing 5% from 4Q24 and decreasing 10% from 1Q24. In the export market, average net price charged by the Company was US$556/t, down 5% from 4Q24 and 11% from 1Q24. Average net price in BRL was R$3,249/t in 1Q25, 5% lower than in 4Q24, due to the lower average net price in USD. Compared to 1Q24, the 6% increase was mainly due to the appreciation of the average USD against the average BRL (18%), despite the decrease in the average net price in USD.
Average Net Price (USD/t)
Net revenue from pulp sales decreased 23% compared to 4Q24, due to the lower sales volume (-19%) and the lower average net price in USD (-5%). Compared to 1Q24, the increase of 17% is mainly explained by the appreciation of average USD against average BRL (18%) and higher sales volume (10%), partially offset by lower average net price in USD (-10%).
Pulp Net Revenue (R$ million)
PULP CASH COST
Consolidated Pulp Cash Cost
ex-downtime (R$/t)
Cash cost excluding downtimes in 1Q25 was R$859/t, showing an increase of 6% compared to 4Q24 due to: i) higher wood cost, associated with a larger average radius, mix of mills (greater share of mills with structurally higher distance), and higher harvesting cost (in some units, also impacted by the increase in diesel prices) and higher wood specific consumption; ii) higher input prices, mainly caustic soda and natural gas; iii) higher fixed costs, mainly due to the fact that maintenance is carried out at when there is a downtime; and iv) lower utilities result, impacted by the lower volume exported due to the calendar of scheduled maintenance downtimes. The negative cash cost factors were partially offset by the reduced consumption of inputs, particularly fuel oil, mainly associated with the wood gasification project implemented in Ribas do Rio Pardo, as well as caustic soda, which is in turn due to the start of operation of the sulphuric acid plant at the same plant.
Consolidated Pulp Cash Cost ex-downtime (R$/t)¹
1Excluding the impact of maintenance and administrative downtimes.
Cash cost excluding downtimes in 1Q25 was 6% higher compared to 1Q24 mainly due to: i) the appreciation of the average USD against the average BRL (18%), leading to higher price especially of caustic soda, natural gas and chlorine dioxide; ii) higher wood cost, mainly explained by higher costs with logistics services, mill mix effect, and higher labor costs and and specific consumption; and iii) higher maintenance and labor costs in some units, as well as the opportunity to concentrate scheduled downtimes in the quarter. These effects were partially offset by lower fuel oil and natural gas consumption.
Consolidated Pulp Cash Cost ex-downtime (R$/t)¹
¹Excluding the impact of maintenance and administrative downtimes.
¹Based on cash cost excluding downtimes. Excludes energy sales.
PULP SEGMENT EBITDA
|
|
|
|
|
|
|
|
|
|
|
|
|
|
|
|
|
|
|
|
|
| Pulp Segment |
1Q25 |
4Q24 |
Δ Q-o-Q |
1Q24 |
Δ Y-o-Y |
LTM 1Q25 |
| Adjusted EBITDA (R$ million)¹ |
4,254 |
5,730 |
-26% |
3,902 |
9% |
21,218 |
| Sales volume (k t) |
2,651 |
3,284 |
-19% |
2,401 |
10% |
11,114 |
| Pulp adjusted¹ EBITDA (R$/t) |
1,605 |
1,745 |
-8% |
1,625 |
-1% |
1,909 |
1Excluding non-recurring items.
Adjusted EBITDA from pulp was 26% lower compared to 4Q24, due to: i) the lower sales volume (-19%); ii) lower average net pulp price in USD (-5%); and iii) greater impact of scheduled maintenance downtimes and higher cash cost of production (as mentioned earlier); These effects were partially offset by reduced SG&A expenses (refer to the Selling and General and Administrative Expenses sections for further details) and decreased logistics costs (more information can be found in the Cost of Goods Sold section). Adjusted EBITDA per tonne was 8% lower, given the higher cash COGS per tonne and the effect of the lower price in USD.
Compared to 1Q24, the 9% increase in Adjusted EBITDA from pulp is due to: i) the appreciation of the average USD against the average BRL (18%); and ii) higher sales volume (+10%). These factors were partially offset by the decrease in the average net price in USD (-10%), by the higher cash COGS (greater impact of scheduled maintenance downtimes, higher cash cost of production and increased logistics cost) and higher SG&A expenses (refer to the Selling and General and Administrative Expenses sections for further details). Adjusted EBITDA per tonne fell 1% due to the same factors excluding sales volume.
Adjusted EBITDA¹ (R$ million) and Adjusted
EBITDA Margin (%) from Pulp
¹Excluding non-recurring items.
Pulp Adjusted EBITDA per tonne (R$/t)
OPERATING CASH GENERATION FROM THE PULP SEGMENT
|
|
|
|
|
|
|
|
|
|
|
|
|
|
|
|
|
|
|
|
|
| Pulp Segment (R$ million) |
1Q25 |
4Q24 |
Δ Q-o-Q |
1Q24 |
Δ Y-o-Y |
LTM 1Q25 |
Adjusted EBITDA1 |
4,254 |
5,730 |
-26% |
3,902 |
9% |
21,218 |
Maintenance Capex2 |
(2,054) |
(1,462) |
41% |
(1,894) |
8% |
(7,120) |
| Operating Cash Flow |
2,200 |
4,268 |
-48% |
2,008 |
10% |
14,098 |
¹Excluding non-recurring items.
²Cash basis.
Operating cash generation per tonne in the pulp segment was 36% lower than in 4Q24, due to higher sustaining capex per tonne and lower adjusted EBITDA per tonne. Compared to 1Q24, the 1% decrease is due to lower adjusted EBITDA per tonne, partially offset by lower sustaining capex per tonne.
Operating Cash Generation from Pulp
per tonne (R$/t)
PAPER BUSINESS PERFORMANCE
The following data and analyses incorporate the joint results of the paper and consumer goods (tissue) businesses.
PAPER SALES VOLUME AND REVENUE
According to data published by Brazil's Forestry Industry Association (Ibá), demand for Printing & Writing paper in Brazil, including imports, decreased 23% in the first two months of 1Q25 compared to the first two months of the previous quarter, and increased 21% compared to the same period of 1Q24.
Compared to the previous quarter, the reduction in demand is due to the seasonality historically observed in these markets. Compared to the period in 1Q24, the growth is primarily attributed to the increase in sales of uncoated paper lines, which are intended for the National Textbook Program, whose announcement provides for the acquisition of larger volumes this year. In the cut size and coated paper lines, demand remained stable.
Regarding the international markets served by the Company, demand remained increasing in Latin America. However, in North America and Europe, there is already a reversion to structural trends of declining demand, exacerbated by global macroeconomic uncertainties.
Regarding the demand for paperboard in Brazil, there was a 19% decrease in the first two months of 1Q25 compared to the previous quarter and an 8% compared to 1Q24. The reduction compared to the previous quarter reflects the historical seasonality of consumption, while the reduction compared to 1Q24 is due to the relative economic slowdown and the natural adjustment of the chain after a very buoyant second half of 2024.
Consolidating the market segments mentioned above (paper market accessible to Suzano), domestic sales increased 7.5% in the first two months of 1Q25 compared to the same period in the previous year, according to Ibá data. In the context of robust domestic market demand, the company's results were supported by increased sales in the Brazilian market and operations in the U.S., which offset the decline in exports from Brazilian operations.
The company continue to make progress on the integration and enhancement of the assets that comprise our operations in the U.S., as well as strategic initiatives in other markets, where our unique go-to-market model stands out, aiming to expand our customer base and the regions we serve. In addition, Suzano continues to invest in its portfolio of innovation products, focused on the packaging sector and the replacement of single-use plastics.
With the acquisition of Kimberly Clark's tissue business in Brazil, the consumer goods segment has accounted for a bigger share of the paper business results since 3Q23.
Suzano’s paper sales (printing & writing, paperboard and tissue) in the domestic market totaled 221 thousand tonnes in 1Q25, down 25% from the previous quarter, due to the historical seasonality of consumption in the segments served. In relation to 1Q24, the 6% growth was driven by an increase in sales of Printing & Writing papers, particularly uncoated paper, as the printing sector began preparations to fulfill the current call for the National Textbook Program.
Paper sales in the international markets amounted to 169,000 tonnes, representing 43% of total sales volume in 1Q25. The 23% increase compared to 4Q24 is attributed to the inclusion of sales from the operations in the U.S. during the quarter. In 4Q24, due to the acquisition timeline, only two months of sales were accounted for. This inclusion of volumes also accounts for the rise in sales compared to 1Q24, offsetting the reduction in exports of operations in Brazil, which is a result of the allocation strategy between markets and segments.
Paper Sales Volume ('000 t)
¹Includes the Consumer Goods unit and Suzano Packaging US operation.
Average net price increased by 9% compared to the previous quarter, mainly due to the new Suzano Packaging US operation, price increases in all segments on the domestic market and the increase in the price of paperboard in the international market. Compared to 1Q24, the 12% increase was mainly due to: i) the new Suzano Packaging US operation; ii) the increase in the price of Printing & Writing (uncoated paper) on the international market; and iii) the price increase in all segments on the domestic market.
Average Net Paper Price (R$/t)¹
¹Includes the Consumer Goods unit and Suzano Packaging US operation.
Net revenue from paper sales amounted to R$2,941 million, a decrease of 1% compared to 4Q24, mainly due to lower sales volume in the domestic market, partially offset by the higher average net price. Compared to 1Q24, there was an increase of +40% due to the higher average net price (+12%) and higher sales volume (+25%), both factors largely explained by the new Suzano Packaging US operation.
Paper Revenue (R$ million)¹
¹Includes the Consumer Goods unit and Suzano Packaging US operation.
PAPER SEGMENT EBITDA
|
|
|
|
|
|
|
|
|
|
|
|
|
|
|
|
|
|
|
|
|
| Paper Segment |
1Q25 |
4Q24 |
Δ Q-o-Q |
1Q24 |
Δ Y-o-Y |
LTM 1Q25 |
Adjusted EBITDA (R$ million)1 |
612 |
751 |
-19% |
656 |
-7% |
2,939 |
| Sales volume (k t) |
390 |
430 |
-9% |
313 |
25% |
1,513 |
Paper adjusted1 EBITDA (R$/t) |
1,568 |
1,746 |
-10% |
2,097 |
-25% |
1,942 |
¹Excluding non-recurring items.
Adjusted EBITDA from paper decreased 19% compared to 4Q24, mainly due to lower sales volume (-9%) due to market seasonality and higher cash COGS, due to the impact of the scheduled maintenance downtime at Mucuri and higher input prices. These effects were partially offset by the reduction in SG&A (lower variable salaries, commercial and logistics expenses), higher average net price and the lower impact of Suzano Packaging US's adjusted EBITDA (1Q25: -R$ 24 million | 4Q24: -R$ 73 million). In the analysis of adjusted EBITDA per ton, the 10% reduction is due to the same factors mentioned above, excluding sales volumes.
Compared to 1Q24, the 7% reduction was mainly due to: i) the higher cash basis COGS (due to the increase in input prices); ii) the higher SG&A (partially explained by the increase in labor, projects, and third-party services); and iii) the new Suzano Packaging US operation. These effects were partially offset by the appreciation of the average USD against the average BRL (+18%), the increase in the average net price and the higher volume sold. In the analysis of adjusted EBITDA per tonne, the 25% decrease is explained by the same factors, excluding sales volumes.
Adjusted EBITDA (R$ million) and
Adjusted EBITDA Margin (%) from Paper
Paper Adjusted EBITDA (R$/t)
OPERATING CASH GENERATION FROM THE PAPER SEGMENT
|
|
|
|
|
|
|
|
|
|
|
|
|
|
|
|
|
|
|
|
|
| Paper Segment (R$ million) |
1Q25 |
4Q24 |
Δ Q-o-Q |
1Q24 |
Δ Y-o-Y |
LTM 1Q25 |
Adjusted EBITDA1 |
612 |
751 |
-19% |
656 |
-7% |
2,939 |
Maintenance Capex2 |
(187) |
(176) |
6% |
(164) |
14% |
(672) |
| Operating Cash Flow |
424 |
575 |
-26% |
491 |
-14% |
2,267 |
1Excluding non-recurring items.
2Cash basis.
Operating cash generation per tonne in the paper segment was R$1,088/t in 1Q25, decreasing 19% from 4Q24, due to higher sustaining capex per tonne and lower adjusted EBITDA per tonne. Compared to the same period of the previous year, the reduction was -31%, due to the decrease in adjusted EBITDA per tonne, partially offset by lower sustaining capex per tonne.
Paper Operating Cash Generation per tonne (R$/t)
FINANCIAL PERFORMANCE
NET REVENUE
Suzano's net revenue in 1Q25 was R$11,553 million, 81% of which came from exports (vs. 81% in 4Q24 and 78% in 1Q24). Compared to 4Q24, the 19% reduction is explained by the lower volume sold during the period (-18%), the reduction in the average net price of pulp in dollars (-5%) and the depreciation of the revenue USD, despite the stability of the average exchange rate for the period. These effects were partially offset by the greater impact of Suzano Packaging US (volume and price) and the increase in the average net price of paper ex-Suzano Packaging US (+11%). The 22% increase in consolidated net revenue compared to 1Q24 is explained by the appreciation of the average USD against the average BRL (18%), the impact of Suzano Packaging US (volume and price) and the higher volume sold in the period (10% higher in the pulp segment and 25% higher in paper), offsetting the drop in the average net price of pulp in dollars (-10%).
|
|
|
|
|
|
|
|
|
|
|
|
|
|
|
|
|
|
|
|
|
|
|
|
|
|
|
|
|
|
| Net Revenue¹ (R$ million) |
|
|
|
|
|
|
|
|
|
|
|
|
|
+22% |
|
|
-19% |
|
|
|
|
|
|
|
|
|
|
|
|
|
|
|
|
|
|
|
|
|
|
|
|
|
|
|
|
|
q |
1Does not include Portocel service revenue.
CALENDAR OF SCHEDULED MAINTENANCE DOWNTIMES
|
|
|
|
|
|
|
|
|
|
|
|
|
|
|
|
|
|
|
|
|
|
|
|
|
|
|
|
|
|
|
|
|
|
|
|
|
|
|
|
|
|
|
|
|
| Mill – Pulp capacity |
2024 |
2025 |
2026 |
| 1Q24 |
2Q24 |
3Q24 |
4Q24 |
1Q25 |
2Q25 |
3Q25 |
4Q25 |
1Q26 |
2Q26 |
3Q26 |
4Q26 |
| Aracruz - Mill A (ES) – 590 kt |
|
|
|
|
No downtime |
|
|
|
|
| Aracruz - Mill B (ES) – 830 kt |
|
|
|
|
|
|
|
|
No downtime |
| Aracruz - Mill C (ES) – 920 kt |
No downtime |
|
|
|
|
|
|
|
|
| Imperatriz (MA)¹ – 1,650 kt |
|
|
|
|
No downtime |
|
|
|
|
| Jacareí (SP) – 1,100 kt |
|
|
|
|
No downtime |
|
|
|
|
| Limeira (SP)¹ – 690 kt |
|
|
|
|
|
|
|
|
No downtime |
| Mucuri - Mill 1 (BA)¹ – 600 kt |
No downtime |
|
|
|
|
|
|
|
|
| Mucuri - Mill 2 (BA) – 1,130 kt |
|
|
|
|
No downtime |
|
|
|
|
| Ribas do Rio Pardo (MS) - 2,550 kt |
No downtime |
|
|
|
|
|
|
|
|
| Suzano (SP)¹ – 620 kt |
|
|
|
|
|
|
|
|
No downtime |
| Três Lagoas - Mill 1 (MS) – 1,300 kt |
No downtime |
|
|
|
|
|
|
|
|
| Três Lagoas - Mill 2 (MS) – 1,950 kt |
No downtime |
|
|
|
|
|
|
|
|
| Veracel (BA)² – 560 kt |
|
|
|
|
No downtime |
|
|
|
|
1Includes integrated capacities and fluff.
2Veracel is a joint operation between Suzano (50%) and Stora Enso (50%) with total annual capacity of 1,120 thousand tonnes.
COST OF GOODS SOLD (COGS)
|
|
|
|
|
|
|
|
|
|
|
|
|
|
|
|
|
|
|
|
|
| COGS (R$ million) |
1Q25 |
4Q24 |
Δ Q-o-Q |
1Q24 |
Δ Y-o-Y |
LTM 1Q25 |
| COGS |
7,729 |
8,761 |
-12% |
5,700 |
36% |
29,431 |
| (-) Depreciation, depletion and amortization |
(2,224) |
(2,542) |
-13% |
(1,706) |
30% |
(8,652) |
| Cash COGS |
5,506 |
6,219 |
-11% |
3,993 |
38% |
20,779 |
| Sales volume (000' t) |
3,041 |
3,714 |
-18% |
2,713 |
12% |
12,628 |
| Cash COGS/ton (R$/t) |
1,811 |
1,674 |
8% |
1,472 |
23% |
1,645 |
Cash COGS in 1Q25 totaled R$5,506 million or R$1,811/t. Compared to 4Q24, cash COGS decreased by 11%, primarily due to: i) a reduced sales volume of pulp and paper; and ii) decreased logistics costs (lower ocean freight costs resulting from a regional mix and reduced terminal costs). These effects were partially offset by: i) an additional cost impact due to an extra month of results from the Suzano Packaging US operation (in 4Q24, there were only two months of results from the unit); ii) a greater impact from the scheduled maintenance downtimes (as per the schedule presented above); and iii) a higher pulp production cash cost, as detailed previously. On a per-tonne basis, cash COGS increased 8% due to the same factors excluding sales volumes.
Compared to 1Q24, cash COGS increased by 38% due to: i) the additional impact on cost with the new Suzano Packaging US operation; ii) the higher volume of pulp sold; iii) greater impact of scheduled maintenance downtimes; iv) higher pulp production cash cost; v) appreciation of the average USD against the average BRL by 18% on items more exposed to the foreign currency; and vi) higher logistics cost, in turn due to higher mill-port expenses and diesel prices, partially offset by lower ocean freight costs. On a per-tonne basis, cash COGS increased 23% year on year due to the same factors excluding sales volumes.
SELLING EXPENSES
|
|
|
|
|
|
|
|
|
|
|
|
|
|
|
|
|
|
|
|
|
| Selling Expenses (R$ million) |
1Q25 |
4Q24 |
Δ Q-o-Q |
1Q24 |
Δ Y-o-Y |
LTM 1Q25 |
| Selling expenses |
755 |
857 |
-12% |
653 |
16% |
3,040 |
| (-) Depreciation, depletion and amortization |
(241) |
(237) |
1% |
(239) |
1% |
(957) |
| Cash selling expenses |
514 |
619 |
-17% |
414 |
24% |
2,083 |
| Sales volume (000' t) |
3,041 |
3,714 |
-18% |
2,713 |
12% |
12,628 |
| Cash selling expenses/ton (R$/t) |
169 |
167 |
1% |
153 |
11% |
165 |
Cash selling expenses decreased 17% compared to 4Q24, mainly due to lower sales volume and reduced spending on various types of fixed commercial expenses. These factors were partially offset by the additional effect on expenses due to an extra month of results from the operations of Suzano Packaging US. On a per-tonne basis, cash selling expenses increased 1% due to the same factors excluding sales volumes.
Compared to 1Q24, cash selling expenses increased 24%, mainly due to: i) the additional impact on expenses due to the new Suzano Packaging US operation; ii) appreciation of the average USD against the average BRL (18%), primarily affecting international logistics expenses (inland freight); iii) lower sales volume; and iv) higher labor and third-party service expenses. Cash selling expenses per tonne increased 11%, due to the same factors mentioned above excluding sales volumes.
GENERAL AND ADMINISTRATIVE EXPENSES
|
|
|
|
|
|
|
|
|
|
|
|
|
|
|
|
|
|
|
|
|
| General and Administrative Expenses (R$ million) |
1Q25 |
4Q24 |
Δ Q-o-Q |
1Q24 |
Δ Y-o-Y |
LTM 1Q25 |
| General and Administrative Expenses |
674 |
990 |
-32% |
503 |
34% |
2,790 |
| (-) Depreciation, depletion and amortization |
(30) |
(38) |
-21% |
(34) |
-12% |
(140) |
| Cash general and administrative expenses |
643 |
952 |
-32% |
469 |
37% |
2,651 |
| Sales volume (000' t) |
3,041 |
3,714 |
-18% |
2,713 |
12% |
12,628 |
| Cash general and administrative expenses/t (R$/t) |
212 |
256 |
-17% |
173 |
22% |
210 |
Compared to 4Q24, the 32% decrease in cash general and administrative expenses is mainly explained by lower personnel expenses (primarily related to variable compensation) and reduced spending on third-party services. On a per-tonne basis, these expenses decreased 17% due to the same factors.
Compared to 1Q24, cash general and administrative expenses were 37% higher, mainly due to: i) increased personnel expenses, due to salary increases and the expansion of the administrative staff, partly associated with the operation of Suzano Packaging US and the new Ribas do Rio Pardo mill; ii) higher spending of third-party services. On a per-tonne basis, the 22% increase is explained by the same factors.
Other operating income (expenses) was an expense of R$119 million in 1Q25, compared to an income of R$846 million in 4Q24 and an expense of R$40 million in 1Q24.The variation in relation to 4Q24 is mainly due to the absence of the updated fair value of biological assets (which happens in the second and fourth quarters of each year). Compared to 1Q24, the variation was due to various events of low materiality.
ADJUSTED EBITDA
|
|
|
|
|
|
|
|
|
|
|
|
|
|
|
|
|
|
|
|
|
| Consolidated |
1Q25 |
4Q24 |
Δ Q-o-Q |
1Q24 |
Δ Y-o-Y |
LTM 1Q25 |
| Adjusted EBITDA (R$ million)¹ |
4,866 |
6,481 |
-25% |
4,558 |
7% |
24,157 |
| Adjusted EBITDA Margin |
42% |
46% |
-4 p.p |
48% |
-6 p.p |
49% |
| Sales Volume (k t) |
3,041 |
3,714 |
-18% |
2,713 |
12% |
12,628 |
| Adjusted EBITDA¹/ton (R$/t) |
1,600 |
1,745 |
-8% |
1,680 |
-5% |
1,913 |
¹Excluding non-recurring items.
The 25% reduction in Adjusted EBITDA in 1Q25 compared to 4Q24 is mainly explained by: i) the lower sales of pulp (-19%) and paper (-9%); ii) the lower average net price of pulp in USD (-5%) iii) the higher cost explained by the greater impact of scheduled maintenance downtimes and the increase in the pulp and paper production cash cost; and iv) the devaluation of the revenue USD, despite the stability of the average exchange rate in the period. These effects were partially offset by the lower SG&A expenses (as discussed earlier) and lower logistics costs. Adjusted EBITDA per tonne decreased 8% due to the same factors, excluding sales volume.
Compared to 1Q24, the 7% increase in Adjusted EBITDA was mainly due to: i) the appreciation of the average USD against the average BRL (+18%); and ii) the higher sales volume of pulp (+10%) and mainly paper (+25). These factors were partially offset by: i) the lower average net price of pulp in USD (-10%); ii) higher cash COGS, which is explained by the greater impact of scheduled maintenance downtimes, higher cash cost of production and increased logistics cost; and iii) higher SG&A expenses (refer to the Selling and General and Administrative Expenses sections for further details). Adjusted EBITDA per tonne decreased by 5% due to the same reasons, excluding sales volume.
FINANCIAL RESULT
|
|
|
|
|
|
|
|
|
|
|
|
|
|
|
|
|
|
|
|
|
| Financial Result (R$ million) |
1Q25 |
4Q24 |
Δ Q-o-Q |
1Q24 |
Δ Y-o-Y |
LTM 1Q25 |
| Financial Expenses |
(1,640) |
(1,692) |
-3% |
(1,130) |
45% |
(6,052) |
| Interest on loans and financing (local currency) |
(421) |
(393) |
7% |
(346) |
22% |
(1,545) |
| Interest on loans and financing (foreign currency) |
(996) |
(1,077) |
-8% |
(885) |
13% |
(4,054) |
| Capitalized interest¹ |
53 |
77 |
-31% |
378 |
-86% |
635 |
| Other financial expenses |
(276) |
(298) |
-7% |
(277) |
0% |
(1,087) |
| Financial Income |
439 |
435 |
1% |
424 |
3% |
1,752 |
| Interest on financial investments |
348 |
386 |
-10% |
409 |
-15% |
1,537 |
| Other financial income |
90 |
50 |
81% |
15 |
0% |
215 |
| Monetary and Exchange Variations |
5,204 |
(8,930) |
–% |
(1,699) |
0% |
(8,982) |
| Foreign exchange variations (Debt) |
5,703 |
(9,699) |
–% |
(2,072) |
0% |
(9,938) |
| Other foreign exchange variations |
(499) |
770 |
–% |
373 |
0% |
956 |
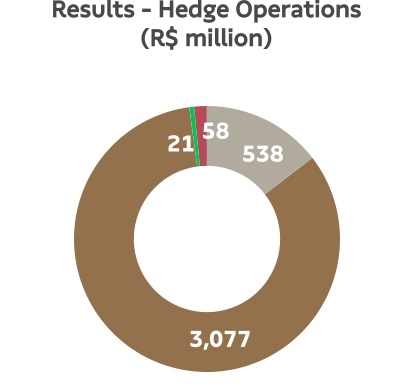
Derivative income (loss), net2 |
3,693 |
(5,370) |
–% |
(635) |
–% |
(4,785) |
| Operating Cash flow hedge |
3,077 |
(3,920) |
–% |
(405) |
–% |
(2,664) |
| Cash flow - Cerrado project hedge |
— |
— |
–% |
(64) |
–% |
(32) |
| Debt hedge |
538 |
(1,319) |
–% |
(258) |
–% |
(1,851) |
| Others³ |
79 |
(132) |
0% |
92 |
-15% |
(238) |
| Net Financial Result |
7,696 |
(15,556) |
–% |
(3,040) |
—% |
(18,066) |
¹Capitalized interest related to work in progress.
² Variation in mark-to-market adjustment (1Q25: -R$2,999 million | 4Q24: -R$6,568 million), plus adjustments paid and received (1Q25: R$125 million).
³Includes commodity hedging and embedded derivatives.
Financial expenses decreased by 3% compared to 4Q24 due to a lower balance of foreign currency debt, partially offset by a reduction in capitalized interest following the completion of the Cerrado Project and an increase in interest on local currency loans, which worsened by 7% due to a rise in the average CDI rate (1Q25: 12.95% p.a. | 4Q24 11.14% p.a.). Compared to 1Q24, financial expenses increased 45%, due to the reduction of interest capitalized by the investment in the Cerrado Project, the increase in interest expenses in foreign currency due to the appreciation of the USD against the BRL, and the increase in debt in local currency, and growth in the average CDI rate (1Q25: 12.95% p.a.| 1Q24: 11.28% p.a.).
Financial income increased by 1% compared to 4Q24, primarily due to the rise in other financial income, which resulted from the inflation adjustment of federal taxes and contributions to be refunded, which was partially offset by a decrease in investment revenue, attributed to a lower average cash balance in 1Q25. Compared to 1Q24, financial income increased 3%, driven by the addition of other financial income related to interest on tax credits, partially offset by lower income from financial investments due to the reduction in average cash balance for the period and reduced returns on offshore cash due to a decline in the SOFR rate (1Q25: 4.33% p.a. | 1Q24: 5.31% p.a.).
Inflation adjustment and exchange variation had a positive impact of R$5,204 million on the Company’s financial result due to the 7% appreciation of the BRL against USD at the close of 4Q24, which affected foreign currency debt (US$12,654 million at the end of 1Q25). This effect was partially offset by the negative result of exchange variation on other balance sheet items in foreign currency.
Note that the accounting impact of exchange variation on foreign currency debt has a cash impact only on the respective maturities.
Derivative operations resulted in an income of R$3,693 million in 1Q25, due to the positive impact of stronger BRL. The mark-to-market adjustment of derivative financial instruments on March 31st, 2025 was negative at R$2,999 million, compared to an expense of R$6,568 million from the mark-to-market adjustment on December 31st, 2024, representing a positive variation of R$3,569 million. Note that the impact of BRL appreciation on the derivatives portfolio generates a cash impact only upon the respective maturities. The net effect on cash, which refers to the maturity of derivative operations in the first quarter, was a positive R$125 million (R$144 million gain on debt hedge, R$29 million loss on cash flow hedge and R$9 million gain from commodities).
As a result of the above factors, net financial result, considering all financial expense and income lines, was an income of R$7,696 million in 1Q25, compared to an expense of R$15,556 million in 4Q24 and an expense of R$3,040 million in 1Q24.
DERIVATIVE OPERATIONS
Suzano carries out derivative operations exclusively for hedging purposes. The following table reflects the position of derivative instruments on March 31st, 2025:
|
|
|
|
|
|
|
|
|
|
|
|
|
|
|
Hedge1 |
Notional (US$ million) |
Fair Value (R$ million) |
| Mar/25 |
Dec/24 |
Mar/25 |
Dec/24 |
| Debt |
4,921 |
5,123 |
(1,450) |
(1,843) |
| Cash Flow – Operating (ZCC + NDF) |
7,450 |
7,433 |
(1,556) |
(4,661) |
Others2 |
409 |
342 |
6 |
(64) |
| Total |
12,779 |
12,898 |
(2,999) |
(6,568) |
¹See note 4 of the 1Q25 Quarterly Financial Statements (ITR) for further details and fair value sensitivity analysis.
²Includes commodity hedging and embedded derivatives.
The Company’s foreign exchange exposure policy seeks to minimize the volatility of its cash generation and ensure greater flexibility in cash flow management. Currently, the policy stipulates that surplus dollars may be partially hedged (at least 40% and up to 75% of exchange variation exposure over the next 24 months) using plain vanilla instruments such as Zero Cost Collars (ZCC) and Non-Deliverable Forwards (NDF). Based on the policy forecast, in November 2024, seeking to increase currency hedge in a scenario of a devalued Brazilian real and high interest rates, the Board of Directors approved an extraordinary cash flow hedge program totaling US$600 million for a period of 25-30 months. This extraordinary program was fully executed in 4Q24. At the end of 1Q25, 71% of the exchange variation exposure from the cash flow hedge portfolio was covered.
ZCC transactions establish minimum and maximum limits for the exchange rate that minimize adverse effects in the event of significant appreciation of the BRL. As such, if the exchange rate is within such limits, the Company neither pays nor receives any financial adjustments. This characteristic allows for capturing greater benefits from export revenue in a potential scenario of BRL appreciation versus USD within the range contracted. In cases of extreme BRL appreciation, the Company is protected by the minimum limits, which are considered appropriate for the operation. However, this protection instrument also limits, temporarily and partially, potential gains in scenarios of extreme BRL depreciation when exchange rates exceed the maximum limits contracted.
On March 31st, 2025, the outstanding notional value of operations involving forward USD sales through ZCCs related to Cash Flows was US$7,265 million, with an average forward rate ranging from R$5.44 to R$6.28 and maturities between April 2025 and May 2027. On the same date, the outstanding notional value of operations involving forward USD sales through NDFs was US$185 million, whose maturities are distributed between April 2025 and June 2026 and with an average rate of R$5.81. Cash flow hedge operations in 1Q25 resulted in an income of R$3,077 million. The mark-to-market adjustment (“MtM” or “fair value”) of these operations was a loss of R$1,556 million.
The following table presents a sensitivity analysis of the cash impact that the Company could have on its cash flow hedge portfolios (ZCC and NDF) if the exchange rate remains the same as at the end of 1Q25 (BRL/USD = 5.74) in the coming quarters, as well as the projected cash impact for R$0.10 variations below / above the strike of put/call options, respectively, defined in each quarter. Note that the figures presented in the table are the Company’s projections based on the end-of-period curves and could vary depending on market conditions.
|
|
|
|
|
|
|
|
|
|
|
|
|
|
|
|
|
|
|
|
|
Cash Adjustment (R$ million) |
| Maturity (up to) |
Strike Range |
Notional
(US$ million) |
Actual |
Exchange Rate
1Q25 (R$ 5.74) |
Sensitivity at R$
0.10 / US$
variation (+/-) |
| Zero Cost Collars |
| 1Q25 |
|
|
1 |
|
|
| 2Q25 |
5.24 - 6.03 |
814 |
|
— |
81 |
| 3Q25 |
5.16 - 5.96 |
1,138 |
|
— |
114 |
| 4Q25 |
5.09 - 5.85 |
1,376 |
|
(34) |
138 |
| 1Q26 |
5.14 - 5.91 |
1,127 |
|
— |
113 |
| 2Q26 |
5.36 - 6.17 |
1,257 |
|
— |
126 |
| 3Q26 |
6.18 - 7.08 |
45 |
|
20 |
5 |
| 4Q26 |
6.36 - 7.39 |
475 |
|
294 |
47 |
| 1Q27 |
6.34 - 7.47 |
603 |
|
360 |
60 |
| 2Q27 |
6.42 - 7.34 |
430 |
|
293 |
43 |
| Total |
5.44 - 6.28 |
7,265 |
1 |
933 |
726 |
| NDF |
| 1Q25 |
|
|
(30) |
|
|
| 2Q25 |
5.71 |
95 |
|
(3) |
10 |
| 1Q26 |
5.85 |
27 |
|
3 |
3 |
| 2Q26 |
5.95 |
63 |
|
13 |
6 |
| Total |
5.81 |
185 |
(30) |
13 |
19 |
To mitigate the effects of exchange and interest rate variations on its debt and its cash flows, the Company also uses currency and interest rate swaps. Swap contracts are entered into considering different interest rates and inflation indices in order to mitigate the mismatch between financial assets and liabilities.
On March 31st, 2025, the Company had an outstanding notional amount of US$4,921 million in swap contracts as shown in the table below. In 1Q25, the result of debt hedge transactions was an income of R$538 million, mainly due to stronger BRL. The mark-to-market adjustment (fair value) of these operations was a loss of R$1,450 million.
|
|
|
|
|
|
|
|
|
|
|
|
|
|
|
|
|
|
|
|
|
|
|
|
Notional (US$ million) |
Fair Value (R$ million) |
| Debt Hedge |
Maturity
(up to) |
Currency |
Mar/25 |
Dec/24 |
Mar/25 |
Dec/24 |
| Swap (CDI x USD) |
2036 |
USD |
904 |
910 |
(570) |
(776) |
| Swap (CNH x USD) |
2027 |
USD |
166 |
166 |
(7) |
(6) |
| Swap (SOFR x USD) |
2030 |
USD |
1,688 |
1,974 |
244 |
394 |
| Swap (CDI x SOFR) |
2034 |
USD |
610 |
610 |
(331) |
(591) |
| Swap SOFR |
2029 |
USD |
151 |
151 |
(21) |
(38) |
| Swap (IPCA x CDI) |
2044 |
BRL |
1402¹ |
1313¹ |
(764) |
(826) |
| Total |
|
|
4,921 |
5,123 |
(1,450) |
(1,843) |
¹Translated at the quarterly closing exchange rate (R$5.74).
The following table presents a sensitivity analysis¹ of the cash impact that the Company could have on its debt hedge portfolio (swaps) if the exchange rate remains the same as at the end of 1Q25 (BRL/USD = 5.74) in the coming quarters, as well as the projected variation in cash impact for each R$0.10 variation on the same reference exchange rate (1Q25). Note that the figures presented in the table are the Company’s projections based on the end-of-period curves and could vary depending on market conditions.
|
|
|
|
|
|
|
|
|
|
|
|
|
|
|
|
|
Cash Adjustment (R$ million) |
| Maturity (up to) |
Notional
(US$ million) |
Actual |
R$ / US$ = 5.74 (1Q25) |
Sensitivity at R$ 0.10 / US$ variation (+/-)1 |
| 1Q25 |
|
144 |
|
|
| 2Q25 |
138 |
|
106 |
13 |
| 3Q25 |
174 |
|
46 |
1 |
| 4Q25 |
169 |
|
117 |
3 |
| 2026 |
451 |
|
324 |
8 |
| 2027 |
523 |
|
309 |
26 |
| 2028 |
233 |
|
277 |
23 |
| >=2029 |
3,233 |
|
1,826 |
185 |
| Total |
4,921 |
144 |
3,005 |
233 |
¹Sensitivity analysis considers variation only in the exchange rate (BRL/USD), while other variables are presumed constant.
Other transactions involving the Company’s derivatives are related to the embedded derivative resulting from forestry partnerships and commodity hedges, as shown in the table.
|
|
|
|
|
|
|
|
|
|
|
|
|
|
|
|
|
|
|
|
|
|
|
|
|
|
|
|
|
|
Notional (US$ million) |
Fair Value (R$ million) |
Cash Adjustment
(R$ million) |
| Other hedges |
Maturity (up to) |
Index |
Mar/25 |
Dec/24 |
Mar/25 |
Dec/24 |
Mar/25 |
Dec/24 |
Embedded
derivative |
2039 |
Fixed | USD US-CPI |
138 |
138 |
(23) |
(81) |
– |
– |
| Commodities |
2026 |
Brent/VLSFO/Others |
271 |
204 |
29 |
17 |
9 |
16 |
| Total |
|
|
409 |
342 |
6 |
(64) |
9 |
16 |
A portion of the forestry partnership agreements and standing timber supply agreements is denominated in USD per cubic meter of standing timber, adjusted by U.S. inflation measured by the Consumer Price Index (CPI), which is not related to inflation in the economic environment where the forests are located and, hence, constitutes an embedded derivative. This instrument, presented in the table above, consists of a sale swap contract of the variations in the US-CPI during the period of the contracts. See note 4 of the 1Q25 Financial Statements for more details and for a sensitivity analysis of the fair value in case of a sharp rise in the US-CPI and USD. On March 31st, 2025, the outstanding notional value of the operation was US$138 million. The result from this swap in 1Q25 was a gain of R$58 million. The mark-to-market (fair value) of such operations was negative R$23 million at the end of the quarter.
The Company is also exposed to the price of some commodities and, therefore, constantly assesses the contracting of derivative financial instruments to mitigate such risks. On March 31st, 2025, the outstanding notional value of these operations was US$271 million. The result of these hedges in 1Q25 was a gain of R$21 million. The mark-to-market (fair value) adjustment of these operations generated a gain of R$29 million at the end of the quarter.
Total 3,693

Total 12,779

Total (2,999)
|
|
|
|
|
|
|
|
|
|
|
|
|
|
|
|
|
|
|
|
|
|
|
|
|
|
|
|
|
|
|
|
|
|
|
|
|
|
|
|
|
|
|
|
|
|
|
Debt Hedge |
|
|
|
Cash flow Hedge |
|
|
|
Commodity Hedge |
|
|
|
Embedded Derivatives |
|
|
|
|
|
|
|
|
|
|
|
|
|
|
|
|
|
|
|
|
|
|
NET INCOME (LOSS)
In 1Q25, the Company posted net income of R$6,348 million, compared to net loss of R$6,737 million in 4Q24 and profit of R$220 million in 1Q24. The positive variation in relation to 4Q24 was due to the positive financial result, which was explained by the positive impact of stronger BRL (+7%) on debt and derivative operations (in contrast to the significant negative result registered in the previous quarter), in addition to the decrease in COGS. These effects were partially offset mainly by the IR/CSLL expenses (primarily affecting the positive results from exchange rate variations on debt and the mark-to-market adjustments of derivatives), reduced net revenue, and a negative variation in other operating results (with the absence of the revaluation of biological assets as the main factor).
The variation in relation to 1Q24 is also explained by the positive variation in financial result (driven by stronger BRL on debt and derivative operations of 15% vs. weaker BRL in 1Q24 of 3%) and the increase in net revenue, as explained earlier. The aforementioned factors were partially offset by the negative amount of deferred IR/CSLL (compared to the positive amount in 1Q24, due to the negative result of exchange rate variation on debt and mark-to-market of derivatives) and by increases in COGS and SG&A expenses.
DEBT
|
|
|
|
|
|
|
|
|
|
|
|
|
|
|
|
|
|
| Debt (R$ million) |
1Q25 |
4Q24 |
Δ Q-o-Q |
1Q24 |
Δ Y-o-Y |
| Local Currency |
18,382 |
18,431 |
0% |
15,381 |
20% |
| Short Term |
778 |
894 |
-13% |
649 |
20% |
| Long Term |
17,604 |
17,537 |
0% |
14,733 |
19% |
| Foreign Currency |
72,661 |
83,005 |
-12% |
63,568 |
14% |
| Short Term |
2,651 |
9,607 |
-72% |
4,395 |
-40% |
| Long Term |
70,010 |
73,397 |
-5% |
59,173 |
18% |
| Gross Debt |
91,043 |
101,436 |
-10% |
78,950 |
15% |
| (-) Cash |
16,833 |
22,382 |
-25% |
19,323 |
-13% |
| Net debt |
74,209 |
79,053 |
-6% |
59,626 |
24% |
| Net debt/Adjusted EBITDA¹ (x) - R$ |
3,1x |
3.3 x |
-0.2 x |
3,6x |
-0.5 x |
| Net debt/Adjusted EBITDA¹ (x) – US$ |
3,0x |
2.9 x |
0.1 x |
3,5x |
-0.5 x |
1Excluding non-recurring items.
On March 31st, 2025, gross debt totaled R$91.0 billion and was composed of 96% long-term maturities and 4% short-term maturities. Foreign currency debt corresponded to 80% of the Company's total debt at the end of the quarter. The percentage of gross debt in foreign currency, considering the effect of debt hedge, was 89%. Compared to 4Q24, gross debt decreased 10%, mainly due to the amortization of principal and interest and a positive exchange variation of R$5,703 million. Suzano ended 1Q25 with 45% of its total debt linked to ESG instruments.
Suzano contracts debt in foreign currency as a natural hedge, since net operating cash generation is mostly denominated in foreign currency (USD) due to its predominant status as an exporter. This structural exposure allows the Company to match loans and financing payments in USD with receivable flows from sales.
Changes in Gross Debt (R$ million)
1Corresponding mainly to transaction costs (issue, funding, goodwill, discount and loss on business combinations, etc.).
On March 31st, 2025, the total average cost of debt in USD was 5.0% p.a. (considering the debt in BRL adjusted by the market swap curve), compared to 5.0% p.a. on December 31st, 2024. The average term of consolidated debt at the end of the quarter was 76 months, compared to 73 months at the end of 4Q24.
1Considers the portion of debt with swap for fixed rate in foreign currency. The exposure of the original debt was: Fixed (USD) – 53%, SOFR – 27%, CDI – 10%, Other (Fixed BRL, IPCA, TJLP) – 10%.
2Considers the portion of debt with currency swaps. The original debt was 80% in USD and 20% in BRL.
Cash and cash equivalents and financial investments on March 31st, 2025 amounted to R$16.8 billion, 49% of which were in foreign currency, allocated to remunerated account or in short-term fixed-income investments abroad. The remaining 51% was invested in local currency fixed-income bonds (mainly CDBs, but also in government bonds and others), remunerated at the CDI rate.
On March 31st, 2025, the Company also had a stand-by credit facility totaling R$7.3 billion (US$1.3 billion) available through February 2027. This facility strengthens the company's liquidity position and can be withdrawn during times of uncertainty. As a result, the cash and equivalents of R$16.8 billion plus the stand-by credit facilities amounted to a readily available cash position of R$24.2 billion on March 31st, 2025. Moreover, the Company has a financing agreement with Finnvera (US$758 million) related to the Cerrado Project (as per the Notices to the Market of November 1st and December 22nd, 2022) which has not yet been withdrawn, further strengthening Suzano's liquidity position.
On March 31st, 2025, net debt stood at R$74.2 billion (US$12.9 billion), compared to R$79.1 billion (US$12.8 billion) on December 31st, 2024. The decrease in net debt in local currency is mainly due to the impact of exchange variation on the debt balance in foreign currency. For more details, see the Changes in Net Debt section.
Financial leverage, measured as the ratio of net debt to Adjusted EBITDA in BRL, stood at 3.1 times on March 31st, 2025 (3.3 times on December 31st, 2024). The same ratio in USD (the measure established in Suzano’s financial policy) rose to 3.0 times on March 31st, 2025 (2.9 times on December 31st, 2024).
The breakdown of total gross debt between trade and non-trade finance on March 31st, 2025 is shown below:
|
|
|
|
|
|
|
|
|
|
|
|
|
|
|
|
|
|
|
|
|
|
|
|
|
2025 |
2026 |
2027 |
2028 |
2029 |
2030 onwards |
Total |
| Trade Finance¹ |
63% |
26% |
39% |
40% |
28% |
8% |
21% |
| Non-Trade Finance² |
37% |
74% |
61% |
60% |
72% |
92% |
79% |
1EEC, ECN, EPP
2Bonds, BNDES, CRA, Debentures, among others.
CAPITAL EXPENDITURE
In 1Q25, capital expenditure (cash basis) totaled R$3,553 million. The 8% increase compared to 4Q24 was mainly due to: i) higher spending on forest maintenance, due to the higher purchases of standing timber; and ii) higher spending on industrial maintenance due to the investment opportunity provided by the concentration of maintenance downtimes during the period. These factors were partially offset by: i) lower disbursement on forestry and land acquisitions classified under the Land and Forests line; and ii) lower disbursement related to expansion and modernization projects, such as Cerrado Project, in line with its disbursement curve.
Compared to 1Q24, the 14% decrease is mainly due to lower disbursements related to the Cerrado Project. These factors were partially offset by: i) an increase in industrial maintenance in the pulp business due to a higher volume of payments related to the concentration of maintenance downtimes; and ii) higher investments in the expansion and modernization category, especially related to the spending curve of projects (conversion to fluff pulp in Limeira and purchase of machines for improved harvesting efficiency).
|
|
|
|
|
|
|
|
|
|
|
|
|
|
|
|
|
|
|
|
|
|
|
|
| Investments (R$ million)¹ |
1Q25 |
4Q24 |
Δ Q-o-Q |
1Q24 |
Δ Y-o-Y |
LTM 1Q25 |
Guidance 2025 |
| Maintenance |
2,241 |
1,638 |
37% |
2,058 |
9% |
7,793 |
7,678 |
| Industrial maintenance |
531 |
460 |
16% |
290 |
83% |
1,527 |
1,263 |
| Forestry maintenance |
1,687 |
1,107 |
52% |
1,753 |
-4% |
6,102 |
6,177 |
| Others |
22 |
71 |
— |
15 |
45% |
163 |
238 |
| Expansion and modernization |
378 |
482 |
-22% |
153 |
148% |
1,198 |
331 |
| Land and forestry |
508 |
637 |
— |
470 |
— |
4,080 |
3,296 |
| Others |
— |
— |
125% |
1 |
— |
1 |
544 |
| Cerrado Project |
426 |
523 |
-19% |
1,469 |
-71% |
3,449 |
4,605 |
| Total |
3,553 |
3,281 |
8% |
4,152 |
-14% |
16,521 |
16,453 |
1The amounts in the table above do not include the effect of monetization of ICMS credits in the state of Espírito Santo. They do not consider the acquisition of non-controlling stake in Lenzing and the investments for acquisition of Pactiv's assets (Suzano Packaging US).
OPERATING CASH FLOW
|
|
|
|
|
|
|
|
|
|
|
|
|
|
|
|
|
|
|
|
|
| Operating Cash Flow (R$ million) |
1Q25 |
4Q24 |
Δ Q-o-Q |
1Q24 |
Δ Y-o-Y |
LTM 1Q25 |
| Adjusted EBITDA¹ |
4,866 |
6,481 |
-25% |
4,558 |
7% |
24,157 |
| Maintenance Capex² |
(2,241) |
(1,638) |
37% |
(2,058) |
9% |
(7,793) |
| Operating Cash Flow |
2,625 |
4,843 |
-46% |
2,499 |
5% |
16,364 |
| Operating Cash Flow (R$/t) |
863 |
1,304 |
-34% |
921 |
-6% |
1,296 |
1Excluding non-recurring items.
2Cash basis.
Operating cash flow, measured by adjusted EBITDA less sustaining capex (cash basis), amounted to R$2,625 million in 1Q25. The -34% decrease in operating cash generation per tonne in relation to 4Q24 a higher sustaining capex per tonne and lower adjusted EBITDA per tonne. Compared to 1Q24, operating cash generation per tonne decrease 6%, due to the lower adjusted EBITDA per tonne, partially offset by the lower maintenance capex per tonne.
Operating Cash Generation
per tonne (R$/t)
FREE CASH FLOW
|
|
|
|
|
|
|
|
|
|
|
|
|
|
|
|
|
|
|
|
|
| Free Cash Flow (R$ million) |
1Q25 |
4Q24 |
Δ Q-o-Q |
1Q24 |
Δ Y-o-Y |
LTM 1Q25 |
| Adjusted EBITDA |
4,866 |
6,481 |
-25% |
4,558 |
7% |
24,157 |
| (-) Total Capex¹ |
(3,080) |
(4,309) |
-29% |
(4,243) |
-27% |
(19,407) |
| (-) Leases contracts – IFRS 16 |
(372) |
(379) |
-2% |
(321) |
16% |
(1,376) |
| (+/-) △ Working capital² |
1,311 |
639 |
—% |
146 |
—% |
3,162 |
| (-) Net interest³ |
(1,653) |
(612) |
—% |
(1,521) |
9% |
(3,872) |
| (-) Income taxes |
(159) |
(102) |
56% |
(56) |
—% |
(470) |
| (-) Dividend and interest on own capital payment/Share Buyback Program |
(2,232) |
(306) |
—% |
(1,619) |
38% |
(5,044) |
| (+/-) Derivative cash adjustment |
125 |
(198) |
—% |
444 |
-72% |
(870) |
| Free cash flow |
(1,193) |
1,214 |
—% |
(2,612) |
-54% |
(3,720) |
| (+) Capex ex-maintenance |
1,467 |
2,382 |
-38% |
2,782 |
-47% |
10,839 |
| (+) Dividend and interest on own capital payment/Share Buyback Program |
2,232 |
306 |
—% |
1,619 |
38% |
5,044 |
Free cash flow – Adjusted4 |
2,505 |
3,902 |
-36% |
1,789 |
40% |
12,163 |
| Free Cash Flow Yield ("FCF Yield") - LTM |
18.5% |
15.0% |
3.5 p.p. |
15.2% |
3.2 p.p. |
18.5% |
1Accrual basis, except for investments related to the Cerrado Project since 2Q23, as per note 15 (Property, Plant and Equipment) to the Financial Statements. It also considers the acquisition of land and forest assets and equity interest in Lenzing and assets acquisition of Pactiv Evergreen.
2Considers costs of capitalized loans paid (1Q25: R$53 million | 4Q24: R$77 million | 1Q24: R$378 million), with no impact on free cash flow, which is included in the Total Capex item with the opposite sign.
3Considers interest paid on debt and interest received on financial investments.
4Free cash flow prior to dividend and interest on own capital payments, share buyback program and capex ex-maintenance (accrual basis).
Adjusted Free Cash Flow in 1Q25 was R$2,505 million, compared to R$3,902 million in 4Q24 and R$1,789 million in 1Q24. Compared to the previous period, Adjusted Free Cash Flow decreased 36%, mainly due to: i) the lower Adjusted EBITDA; and ii) a higher concentration of interest payments in the period, due to bonds payment schedule. These effects were partially offset by: i) a higher release of working capital (mainly in the Accounts Receivable category due to the drop in the volume and price of pulp, in addition to receivables anticipation programs); ii) the positive cash adjustment from derivatives (as opposed to the negative adjustment observed in the previous quarter); and iii) lower maintenance capex during the period.
Compared to 1Q24, the increase was attributed to: i) greater release of working capital mainly in the Accounts Receivable category, driven by the drop in pulp volume and prices, as well as receivables anticipation programs, in contrast to the lower release observed in 1Q24; and ii) higher adjusted EBITDA. These effects were partially offset by a smaller positive cash adjustment from derivatives, higher maintenance capex, increased interest payments, and higher disbursement of net interest and income/social contribution taxes (IR/CSLL).
CHANGES IN NET DEBT
Following were the changes in net debt in 1Q25:
1Accrual basis, except for the capex related to Cerrado Project (cash basis), as per the Cash Flow Statement.
2Net of exchange variations on cash and financial investments.
3Considers cash amounts related to derivative adjustments, lease agreements and other items.
ESG
In pursuit of continuous evolution in transparency, Suzano published in March its 2024 Annual Sustainability Report and Sustainability Center, disclosing them for another consecutive year simultaneously with the Management Proposal for the Ordinary General Meeting held on April 25, 2025, to meet the growing interest for informed voting at shareholder meetings. The report adopts the Global Reporting Initiative (GRI) Standards and incorporates references from national and international reporting initiatives, such as the principles of the International Integrated Reporting Council (IIRC), the CVM Resolution No. 59, the United Nations' 17 Sustainable Development Goals (SDGs), the metrics of the Sustainability Accounting Standards Board (SASB), and the climate guidelines of the International Sustainability Standards Board (ISSB) - IFRS S2, which include the recommendations of the Task Force on Climate-related Financial Disclosures (TCFD). The report also includes limited assurance conducted by independent auditors.
In February, Suzano issued a US$1.2 billion export prepayment financing (EPP) structured as a Sustainability Linked Loan , tied to its long-term biodiversity target of connecting 500,000 hectares of priority areas for biodiversity conservation in the Cerrado, Atlantic Forest and Amazon biomes by 2030. The structure of the operation underwent an independent evaluation conducted by S&P Global, which ensured its compliance with the Sustainability Linked Loan Principles (SLLP) issued by the International Capital Market Association (ICMA).
TOTAL OPERATIONAL EXPENDITURE - PULP
As disclosed in the Material Fact notice of December 12th, 2024, the total operational expenditure forecast for 2027 is approximately R$1,900 per tonne. The indicator has been evolving according to plan, considering the exchange rate and monetary assumptions used. Said estimate refers to the currency in real terms of 2025. The Company also reports that the total operational expenditure for 2024 was R$2,183/t, consisting of cash production cost (including downtimes) of R$875/t, sustaining capex of R$618/t and Freight plus SG&A expenses of R$690/t.
CAPITAL MARKETS
On March 31st, 2025, Suzano’s stock was quoted at R$52.94/share (SUZB3) and US$9.29/share (SUZ). The Company’s stock is listed on the Novo Mercado, the listing segment of the São Paulo Stock Exchange (B3 – Brasil, Bolsa e Balcão) with the highest corporate governance standards, and on the New York Stock Exchange (NYSE) - Level II.
Source: Bloomberg.
Liquidity - SUZB3
Source: Bloomberg.
As part of the 5th share buyback program announced and currently open, “August/2024 Program”, until the end of March 2025, the Company had traded 11,815,000 shares at an average cost of acquisition of R$55.17 each, representing R$652 million in market value, according to the monthly reports released by the Company under CVM Instruction 44.
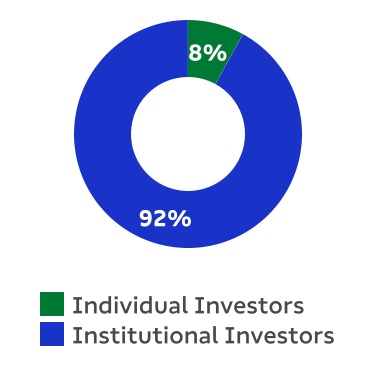
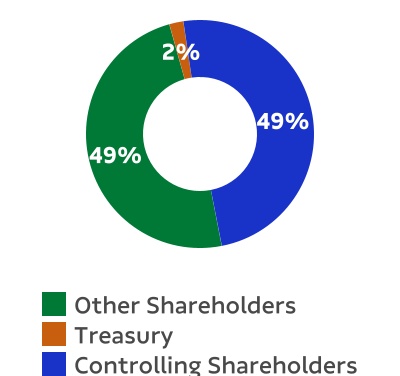
On March 31st, 2025, the Company's capital stock consisted of 1,264,117,615 common shares, of which 25,455,929 common shares were held in treasury. Suzano’s market capitalization on the same date (ex-treasury shares) stood at R$65.6 billion. Free float in 1Q25 corresponded to 49% of the total capital.
|
|
|
|
|
|
|
|
|
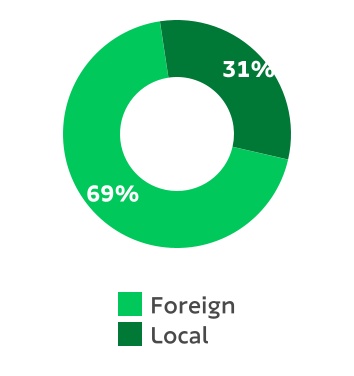
| Free Float distribution on 3/31/2025 (B3 + NYSE) |
|
Ownership structure on 3/31/2025 |
FIXED INCOME
|
|
|
|
|
|
|
|
|
|
|
|
|
|
|
|
|
|
|
|
|
|
Unit |
Mar/25 |
Dec/24 |
Mar/24 |
Δ Q-o-Q |
Δ Y-o-Y |
| Fibria 2025 – Price |
USD/k |
— |
99.73 |
98.70 |
0% |
0% |
| Fibria 2025 – Yield |
% |
— |
— |
5.74 |
0% |
0% |
| Suzano 2026 – Price |
USD/k |
101.29 |
100.56 |
100.20 |
1% |
1% |
| Suzano 2026 – Yield |
% |
4.70 |
5.36 |
5.66 |
-12% |
-17% |
| Fibria 2027 – Price |
USD/k |
101.18 |
100.20 |
99.70 |
1% |
1% |
| Fibria 2027 – Yield |
% |
4.80 |
5.40 |
5.62 |
-11% |
-15% |
| Suzano 2028 – Price |
USD/k |
91.58 |
89.49 |
88.20 |
2% |
4% |
| Suzano 2028 – Yield |
% |
5.19 |
5.69 |
5.52 |
-9% |
-6% |
| Suzano 2029 – Price |
USD/k |
102.09 |
100.20 |
100.60 |
2% |
1% |
| Suzano 2029 – Yield |
% |
5.38 |
5.94 |
5.86 |
-9% |
-8% |
| Suzano 2030 – Price |
USD/k |
98.00 |
96.08 |
96.10 |
2% |
2% |
| Suzano 2030 – Yield |
% |
5.48 |
5.91 |
5.80 |
-7% |
-6% |
| Suzano 2031 – Price |
USD/k |
90.39 |
88.43 |
88.40 |
2% |
2% |
| Suzano 2031 – Yield |
% |
5.72 |
6.07 |
5.85 |
-6% |
-2% |
| Suzano 2032 – Price |
USD/k |
85.25 |
83.01 |
83.10 |
3% |
3% |
| Suzano 2032 – Yield |
% |
5.78 |
6.14 |
5.85 |
-6% |
-1% |
| Suzano 2047 – Price |
USD/k |
106.30 |
104.72 |
105.00 |
2% |
1% |
| Suzano 2047 – Yield |
% |
6.46 |
6.59 |
6.58 |
-2% |
-2% |
| Treasury 10 years |
% |
4.21 |
4.57 |
4.20 |
-8% |
0% |
Note: Senior Notes issued with face value of 100 USD/k.
RATING
|
|
|
|
|
|
|
|
|
|
|
|
| Agency |
National Scale |
Global Scale |
Outlook |
| Fitch Ratings |
AAA |
BBB- |
Positive |
| Standard & Poor’s |
br.AAA |
BBB- |
Stable |
| Moody’s |
Aaa.br |
Baa3 |
Positive |
UPCOMING EVENTS
Earnings Conference Call (1Q25)
Date: May 9th, 2025 (Friday)
|
|
|
|
|
|
| Portuguese (simultaneous translation) |
English |
| 9:30 a.m. (Brasília) |
9:30 a.m. (Brasília) |
| 8:30 a.m. (New York) |
8:30 a.m. (New York) |
| 1:30 p.m. (London) |
1:30 p.m. (London) |
The conference call will be held in English and feature a presentation, with simultaneous webcast. The access links will be available on the Company’s Investor Relations website (www.suzano.com.br/ri).
If you are unable to participate, the webcast link will be available for future consultation on the Investor Relations website of Suzano.
IR CONTACTS
Marcos Assumpção
Camila Nogueira
Roberto Costa
Mariana Spinola
André Azambuja
Victor Valladares
Tel.: +55 (11) 3503-9330
ri@suzano.com.br
www.suzano.com.br/ri
APPENDICES
APPENDIX 1 – Operating Data
|
|
|
|
|
|
|
|
|
|
|
|
|
|
|
|
|
|
|
|
|
Revenue Breakdown
(R$ '000) |
1Q25 |
4Q24 |
Δ Q-o-Q |
1Q24 |
Δ Y-o-Y |
|
|
|
| Exports |
9,404,309 |
11,522,651 |
-18% |
7,399,944 |
27% |
|
|
|
| Pulp |
8,154,127 |
10,610,274 |
-23% |
6,873,678 |
19% |
|
|
|
| Paper |
1,250,182 |
912,377 |
37% |
526,266 |
138% |
|
|
|
| Domestic Market |
2,148,612 |
2,654,347 |
-19% |
2,058,658 |
4% |
|
|
|
| Pulp |
457,416 |
585,349 |
-22% |
486,168 |
-6% |
|
|
|
| Paper |
1,691,196 |
2,068,998 |
-18% |
1,572,490 |
8% |
|
|
|
| Total Net Revenue |
11,552,921 |
14,176,998 |
-19% |
9,458,602 |
22% |
|
|
|
| Pulp |
8,611,543 |
11,195,623 |
-23% |
7,359,846 |
17% |
|
|
|
| Paper |
2,941,378 |
2,981,375 |
-1% |
2,098,756 |
40% |
|
|
|
|
|
|
|
|
|
|
|
|
|
|
|
|
|
|
|
|
|
|
|
|
| Sales volume (‘000) |
1Q25 |
4Q24 |
Δ Q-o-Q |
1Q24 |
Δ Y-o-Y |
|
|
|
| Exports |
2,675,177 |
3,251,298 |
-18% |
2,326,582 |
15% |
|
|
|
| Pulp |
2,506,288 |
3,113,900 |
-20% |
2,223,108 |
13% |
|
|
|
| Paper |
168,889 |
137,398 |
23% |
103,474 |
63% |
|
|
|
| Paperboard |
96,673 |
60,920 |
59% |
7,829 |
1135% |
|
|
|
| Printing & Writing |
71,628 |
75,627 |
-5% |
95,450 |
-25% |
|
|
|
| Other paper¹ |
588 |
851 |
-31 |
195 |
202 |
|
|
|
| Domestic Market |
365,478 |
463,036 |
-21% |
386,758 |
-6% |
|
|
|
| Pulp |
144,256 |
169,992 |
-15% |
177,594 |
-19% |
|
|
|
| Paper |
221,222 |
293,044 |
-25% |
209,164 |
6% |
|
|
|
| Paperboard |
33,095 |
42,524 |
-22% |
34,314 |
-4% |
|
|
|
| Printing & Writing |
126,775 |
186,763 |
-32% |
115,657 |
10% |
|
|
|
| Other paper¹ |
61,352 |
63,757 |
-4% |
59,193 |
4% |
|
|
|
| Total Sales Volume |
3,040,655 |
3,714,334 |
-18% |
2,713,340 |
12% |
|
|
|
| Pulp |
2,650,544 |
3,283,892 |
-19% |
2,400,702 |
10% |
|
|
|
| Paper |
390,111 |
430,442 |
-9% |
312,638 |
25% |
|
|
|
| Paperboard |
129,768 |
103,444 |
25% |
42,143 |
208% |
|
|
|
| Printing & Writing |
198,403 |
262,390 |
-24% |
211,107 |
-6% |
|
|
|
| Other paper¹ |
61,940 |
64,608 |
-4% |
59,388 |
4% |
|
|
|
¹ Paper of other manufacturers sold by Suzano and tissue paper.
|
|
|
|
|
|
|
|
|
|
|
|
|
|
|
|
|
|
|
|
|
Average net price
(R$/t) |
1Q25 |
4Q24 |
Δ Q-o-Q |
1Q24 |
Δ Y-o-Y |
|
|
|
| Exports |
3,515 |
3,544 |
-1% |
3,181 |
10% |
|
|
|
| Pulp |
3,253 |
3,407 |
-5% |
3,092 |
5% |
|
|
|
| Paper |
7,402 |
6,640 |
11% |
5,086 |
46% |
|
|
|
| Domestic Market |
5,879 |
5,732 |
3% |
5,323 |
10% |
|
|
|
| Pulp |
3,171 |
3,443 |
-8% |
2,738 |
16% |
|
|
|
| Paper |
7,645 |
7,060 |
8% |
7,518 |
2% |
|
|
|
| Total |
3,799 |
3,817 |
0% |
3,486 |
9% |
|
|
|
| Pulp |
3,249 |
3,409 |
-5% |
3,066 |
6% |
|
|
|
| Paper |
7,540 |
6,926 |
9% |
6,713 |
12% |
|
|
|
|
|
|
|
|
|
|
|
|
|
|
|
|
|
|
|
|
|
|
|
|
Revenue Breakdown
(R$ '000) |
1Q25 |
4Q24 |
Δ Q-o-Q |
1Q24 |
Δ Y-o-Y |
|
|
|
| Exports |
601 |
607 |
-1% |
643 |
-7% |
|
|
|
| Pulp |
556 |
583 |
-5% |
624 |
-11% |
|
|
|
| Paper |
1,265 |
1,137 |
11% |
1,027 |
23% |
|
|
|
| Domestic Market |
1,005 |
982 |
2% |
1,075 |
-7% |
|
|
|
| Pulp |
542 |
590 |
-8% |
553 |
-2% |
|
|
|
| Paper |
1,307 |
1,209 |
8% |
1,518 |
-14% |
|
|
|
| Total Net Revenue |
649 |
654 |
-1% |
704 |
-8% |
|
|
|
| Pulp |
555 |
584 |
-5% |
619 |
-10% |
|
|
|
| Paper |
1,289 |
1,186 |
9% |
1,356 |
-5% |
|
|
|
|
|
|
|
|
|
|
|
|
|
|
|
|
|
|
|
|
|
|
|
|
| FX Rate R$/US$ |
1Q25 |
4Q24 |
Δ Q-o-Q |
1Q24 |
Δ Y-o-Y |
|
|
|
| Closing |
5.74 |
6.19 |
-7% |
5.00 |
15% |
|
|
|
| Average |
5.85 |
5.84 |
0% |
4.95 |
18% |
|
|
|
APPENDIX 2 – Consolidated Income Statement and Goodwill Amortization
|
|
|
|
|
|
|
|
|
|
|
|
|
|
|
|
|
|
|
|
|
| Income Statement (R$ ‘000) |
1Q25 |
4Q24 |
Δ Q-o-Q |
1Q24 |
Δ Y-o-Y |
|
|
|
|
|
|
|
|
|
|
|
|
| Net Revenue |
11,552,921 |
14,176,998 |
-19% |
9,458,602 |
22% |
|
|
|
| Cost of Goods Sold |
(7,729,167) |
(8,760,717) |
-12% |
(5,699,870) |
36% |
|
|
|
| Gross Debt |
3,823,754 |
5,416,281 |
-29 |
3,758,732 |
2% |
|
|
|
| Gross Margin |
33% |
38% |
-5 p.p. |
40% |
-7 p.p. |
|
|
|
|
|
|
|
|
|
|
|
|
| Operating Expense/Income |
(1,564,719) |
(1,000,460) |
— |
(1,206,506) |
30% |
|
|
|
| Selling Expenses |
(754,882) |
(856,759) |
-12% |
(653,415) |
16% |
|
|
|
| General and Administrative Expenses |
(673,551) |
(990,245) |
-32% |
(502,975) |
34% |
|
|
|
| Other Operating Income (Expenses) |
(119,209) |
845,547 |
— |
(40,209) |
196% |
|
|
|
| Equity Equivalence |
(17,077) |
997 |
-1813% |
(9,907) |
— |
|
|
|
| EBIT |
2,259,035 |
4,415,821 |
-49% |
2,552,226 |
-11% |
|
|
|
|
|
|
|
|
|
|
|
|
| Depreciation, Amortization & Depletion |
2,497,422 |
2,809,949 |
-11% |
1,982,024 |
26% |
|
|
|
|
|
|
|
|
|
|
|
|
| EBITDA |
4,756,457 |
7,225,770 |
-34% |
4,534,250 |
5% |
|
|
|
| EBITDA Margin |
41% |
51% |
-10 p.p. |
48% |
-7 p.p. |
|
|
|
|
|
|
|
|
|
|
|
|
| Adjusted EBITDA¹ |
4,865,774 |
6,480,919 |
-25% |
4,557,906 |
7% |
|
|
|
| Adjusted EBITDA Margin¹ |
42% |
46% |
-4 p.p. |
48% |
-6 p.p. |
|
|
|
|
|
|
|
|
|
|
|
|
| Net Financial Result |
7,696,213 |
(15,556,184) |
— |
(3,040,048) |
— |
|
|
|
| Financial Expenses |
438,853 |
435,391 |
1% |
424,217 |
3% |
|
|
|
| Financial Revenues |
(1,640,085) |
(1,691,603) |
-3% |
(1,130,400) |
45 |
|
|
|
| Exchange Rate Variation |
3,693,159 |
(5,370,257) |
— |
(634,537) |
— |
|
|
|
| Net Proceeds Generated by Derivatives |
5,204,286 |
(8,929,715) |
— |
(1,699,328) |
— |
|
|
|
| Earnings Before Taxes |
9,955,248 |
(11,140,363) |
— |
(487,822) |
— |
|
|
|
|
|
|
|
|
|
|
|
|
| Income and Social Contribution Taxes |
(3,607,070) |
4,403,791 |
— |
707,854 |
— |
|
|
|
|
|
|
|
|
|
|
|
|
| Net Income (Loss) |
6,348,178 |
(6,736,572) |
— |
220,032 |
— |
|
|
|
| Net Margin |
55% |
-48% |
102 p.p. |
2% |
53 p.p. |
|
|
|
¹ Excluding non-recurring items and PPA effects.
|
|
|
|
|
|
|
|
|
|
|
|
|
|
|
|
|
|
| Goodwill amortization - PPA (R$ ‘000) |
1Q25 |
4Q24 |
Δ Q-o-Q |
1Q24 |
Δ Y-o-Y |
| COGS |
(96,736) |
(114,953) |
-16 |
(115,740) |
-16% |
| Selling Expenses |
(210,282) |
(206,637) |
2 |
(207,475) |
1 |
| General and administrative expenses |
(1,199) |
(7,978) |
— |
(7,967) |
-85% |
| Other operational revenues (expenses) |
(18,546) |
12,365 |
-250% |
3,473 |
-634% |
APPENDIX 3 – Consolidated Balance Sheet
|
|
|
|
|
|
|
|
|
|
|
|
| Assets (R$ ’000) |
03/31/2025 |
12/31/2024 |
03/31/2024 |
|
|
|
|
| Current Assets |
|
|
|
| Cash and cash equivalents |
9,914,505 |
9,018,818 |
4,203,126 |
| Financial investments |
6,516,323 |
12,971,547 |
14,671,943 |
| Trade accounts receivable |
6,354,237 |
9,132,860 |
6,634,735 |
| Inventories |
8,642,882 |
7,962,324 |
6,521,769 |
| Recoverable taxes |
1,074,377 |
929,001 |
481,314 |
| Recoverable income taxes |
337,663 |
180,618 |
405,345 |
| Derivative financial instruments |
888,004 |
1,006,427 |
1,961,643 |
| Advance to suppliers |
85,581 |
92,133 |
119,962 |
| Other assets |
665,543 |
889,232 |
871,969 |
| Total Current Assets |
34,479,115 |
42,182,960 |
35,871,806 |
|
|
|
|
| Non-Current Assets |
|
|
|
| Financial investments |
402,442 |
391,964 |
448,077 |
| Recoverable taxes |
1,042,971 |
1,179,125 |
1,401,124 |
| Deferred taxes |
4,431,946 |
7,984,015 |
1,368,618 |
| Derivative financial instruments |
3,244,326 |
2,880,673 |
1,544,010 |
| Advance to suppliers |
2,496,154 |
2,503,537 |
2,472,894 |
| Judicial deposits |
590,245 |
487,993 |
401,758 |
| Other assets |
125,724 |
156,880 |
207,984 |
|
|
|
|
| Biological assets |
22,861,555 |
22,283,001 |
18,721,063 |
| Investments |
1,651,534 |
1,816,923 |
620,259 |
| Property, plant and equipment |
65,005,656 |
64,986,040 |
60,640,882 |
| Right of use on lease agreements |
5,249,601 |
5,180,691 |
5,146,347 |
| Intangible |
13,663,616 |
13,902,303 |
14,554,669 |
| Total Non-Current Assets |
120,765,770 |
123,753,145 |
107,527,685 |
| Total Assets |
155,244,885 |
165,936,105 |
143,399,491 |
|
|
|
|
| Liabilities and Equity (R$ ’000) |
03/31/2025 |
12/31/2024 |
03/31/2024 |
|
|
|
|
| Current Liabilities |
|
|
|
| Trade accounts payable |
5,669,809 |
6,033,285 |
4,942,766 |
| Loans, financing and debentures |
3,428,610 |
10,501,387 |
5,043,997 |
| Accounts payable for lease operations |
870,322 |
872,228 |
759,368 |
| Derivative financial instruments |
1,561,094 |
2,760,273 |
82,556 |
| Taxes payable |
282,866 |
245,353 |
291,545 |
| Income taxes payable |
71,201 |
118,362 |
188,604 |
| Payroll and charges |
702,399 |
1,232,971 |
534,263 |
| Liabilities for assets acquisitions and subsidiaries |
20,877 |
21,166 |
94,770 |
| Dividends and interest on own capital payable |
7,699 |
2,200,917 |
7,078 |
| Advance from customers |
213,338 |
145,200 |
154,588 |
| Other liabilities |
361,676 |
346,796 |
314,662 |
| Total Current Liabilities |
13,189,891 |
24,477,938 |
12,414,197 |
|
|
|
|
| Non-Current Liabilities |
|
|
|
| Loans, financing and debentures |
87,613,961 |
90,934,144 |
73,905,644 |
| Accounts payable for lease operations |
5,981,197 |
6,100,687 |
5,534,430 |
| Derivative financial instruments |
5,570,354 |
7,694,547 |
2,507,363 |
| Liabilities for assets acquisitions and subsidiaries |
94,547 |
99,324 |
99,159 |
| Provision for judicial liabilities |
2,943,436 |
2,926,750 |
2,876,590 |
| Actuarial liabilities |
730,032 |
721,560 |
839,185 |
| Deferred taxes |
— |
12,596 |
12,596 |
| Share-based compensation plans |
361,895 |
361,974 |
320,806 |
| Provision for loss on investments in subsidiaries |
— |
– |
938 |
| Advance from customers |
74,715 |
74,715 |
74,715 |
| Other liabilities |
149,211 |
116,295 |
89,269 |
| Total Non-Current Liabilities |
103,519,348 |
109,042,592 |
86,260,695 |
| Total Liabilities |
116,709,239 |
133,520,530 |
98,674,892 |
|
|
|
|
| Shareholders’ Equity |
|
|
|
| Share capital |
19,235,546 |
19,235,546 |
9,235,546 |
| Capital reserves |
64,827 |
60,226 |
25,321 |
| Treasury shares |
(1,371,424) |
(1,339,197) |
(935,473) |
| Retained earnings reserves |
12,978,898 |
12,978,898 |
34,522,473 |
| Other reserves |
1,133,200 |
1,348,796 |
1,522,641 |
| Retained earnings |
6,357,219 |
— |
233,267 |
| Controlling shareholders’ |
38,398,266 |
32,284,269 |
44,603,775 |
| Non-controlling interest |
137,380 |
131,306 |
120,824 |
| Total Equity |
38,535,646 |
32,415,575 |
44,724,599 |
| Total Liabilities and Equity |
155,244,885 |
165,936,105 |
143,399,491 |
APPENDIX 4 – Consolidated Statement of Cash Flow
|
|
|
|
|
|
|
|
|
|
|
| Cash Flow (R$ ’000) |
1Q25 |
1Q24 |
|
|
|
|
|
|
|
| OPERATING ACTIVITIES |
|
|
|
|
| Net income (loss) for the period |
6,348,178 |
220,032 |
|
|
|
|
|
|
|
| Depreciation, depletion and amortization |
2,408,025 |
1,899,297 |
|
|
| Depreciation of right of use |
89,397 |
82,727 |
|
|
| Interest expense on lease liabilities |
116,258 |
109,806 |
|
|
| Result from sale and disposal of property, plant and equipment and biological assets, net |
46,307 |
47,554 |
|
|
| Income (expense) from associates and joint ventures |
17,077 |
9,907 |
|
|
| Exchange rate and monetary variations, net |
(5,204,286) |
1,699,328 |
|
|
| Interest expenses on financing, loans and debentures |
1,412,878 |
1,230,849 |
|
|
| Capitalized loan costs |
(52,753) |
(377,560) |
|
|
| Accrual of interest on marketable securities |
(264,440) |
(312,425) |
|
|
| Amortization of transaction costs, premium and discounts |
31,923 |
17,308 |
|
|
| Derivative gains, net |
(3,693,159) |
634,537 |
|
|
| Deferred income tax and social contribution |
3,539,970 |
(822,208) |
|
|
| Interest on actuarial liabilities |
19,822 |
18,963 |
|
|
| Provision for judicial liabilities, net |
28,985 |
29,015 |
|
|
| Provision for doubtful accounts, net |
7,653 |
(1,317) |
|
|
| Provision for inventory losses, net |
4,475 |
8,030 |
|
|
| Provision for loss of ICMS credits, net |
45,766 |
(23,763) |
|
|
| Other |
15,856 |
15,121 |
|
|
| Decrease (increase) in assets |
1,915,060 |
67,771 |
|
|
| Trade accounts receivable |
2,238,113 |
373,116 |
|
|
| Inventories |
(430,784) |
(298,050) |
|
|
| Recoverable taxes |
(75,463) |
8,363 |
|
|
| Other assets |
183,194 |
(15,658) |
|
|
| Increase (decrease) in liabilities |
(656,429) |
(299,562) |
|
|
| Trade accounts payable |
(91,408) |
(141,975) |
|
|
| Taxes payable |
5,303 |
90,822 |
|
|
| Payroll and charges |
(528,881) |
(232,642) |
|
|
| Other liabilities |
(41,443) |
(15,767) |
|
|
| Cash generated from operations |
6,176,563 |
4,253,410 |
|
|
| Payment of interest on financing, loans and debentures |
(2,014,500) |
(1,749,517) |
|
|
| Capitalized loan costs paid |
52,753 |
377,560 |
|
|
| Interest received on marketable securities |
361,942 |
228,249 |
|
|
| Payment of income tax and social contribution |
(159,068) |
(55,574) |
|
|
| Cash provided by operating activities |
4,417,690 |
3,054,128 |
|
|
|
|
|
|
|
| INVESTING ACTIVITIES |
|
|
|
|
| Additions to property, plant and equipment |
(1,231,900) |
(2,556,172) |
|
|
| Additions to intangible |
(11,836) |
(55,110) |
|
|
| Additions to biological assets |
(1,836,180) |
(1,631,502) |
|
|
| Proceeds from sales of property, plant and equipment and biological assets |
43,551 |
26,719 |
|
|
| Capital increase in affiliates |
— |
(18,908) |
|
|
| Marketable securities, net |
6,367,566 |
(1,566,266) |
|
|
| Advances for acquisition (receipt) of wood from operations with development and partnerships |
(6,998) |
(235,775) |
|
|
| Cash used in investing activities |
3,324,203 |
(6,037,014) |
|
|
|
|
|
|
|
| FINANCING ACTIVITIES |
|
|
|
|
| Proceeds from loans, financing and debentures |
7,055,244 |
4,244,874 |
|
|
| Proceeds of derivative transactions |
124,558 |
444,112 |
|
|
| Payment of loans, financing and debentures |
(11,175,521) |
(4,038,400) |
|
|
| Payment of leases |
(371,531) |
(320,643) |
|
|
| Payment of interest on own capital and dividends |
(2,192,903) |
(1,309,450) |
|
|
| Shares repurchased |
(38,664) |
(309,952) |
|
|
| Cash provided (used) by financing activities |
(6,598,817) |
(1,289,459) |
|
|
|
|
|
|
|
| EXCHANGE VARIATION ON CASH AND CASH EQUIVALENTS |
(247,389) |
129,600 |
|
|
|
|
|
|
|
| Increase (decrease) in cash and cash equivalents, net |
895,687 |
(4,142,745) |
|
|
| At the beginning of the period |
9,018,818 |
8,345,871 |
|
|
| At the end of the period |
9,914,505 |
4,203,126 |
|
|
| Increase (decrease) in cash and cash equivalents, net |
895,687 |
(4,142,745) |
|
|
|
|
|
|
|
|
|
|
|
|
|
|
|
|
|
APPENDIX 5 – EBITDA
|
|
|
|
|
|
|
|
|
|
|
| (R$ '000, except where otherwise indicated) |
1Q25 |
1Q24 |
|
|
| Net income |
6,348,178 |
220,032 |
|
|
| Net Financial Result |
(7,696,213) |
3,040,048 |
|
|
| Income and Social Contribution Taxes |
3,607,070 |
(707,854) |
|
|
| EBIT |
2,259,035 |
2,552,226 |
|
|
| Depreciation, Amortization and Depletion |
2,497,422 |
1,982,024 |
|
|
| EBITDA¹ |
4,756,457 |
4,534,250 |
|
|
| EBITDA Margin |
41% |
48% |
|
|
|
|
|
|
|
| Equity method |
17,077 |
9,907 |
|
|
| Extinction of packaging business line |
23 |
1,190 |
|
|
| Effective loss of the development contract advance program |
146 |
10 |
|
|
| Provision for loss of ICMS credits, net |
45,765 |
(23,763) |
|
|
| Income from disposal and write-off of property, plant and equipment and biological assets |
46,306 |
36,312 |
|
|
| Adjusted EBITDA |
4,865,774 |
4,557,906 |
|
|
| Adjusted EBITDA Margin |
42% |
48% |
|
|
1 The Company's EBITDA is calculated in accordance with CVM Instruction 527 of October 4th, 2012.
APPENDIX 6 – Segmented Income Statement
|
|
|
|
|
|
|
|
|
|
|
|
|
|
|
|
|
|
|
|
|
|
|
|
|
|
|
| Segmented Financial Statement (R$ '000) |
1Q25 |
1Q24 |
| Pulp |
Paper |
Non Segmented |
Total Consolidated |
Pulp |
Paper |
Non Segmented |
Total Consolidated |
|
|
|
|
|
|
|
|
|
| Net Revenue |
8,611,543 |
2,941,378 |
– |
11,552,921 |
7,359,846 |
2,098,756 |
– |
9,458,602 |
| Cost of Goods Sold |
(5,696,157) |
(2,033,010) |
– |
(7,729,167) |
(4,374,903) |
(1,324,967) |
– |
(5,699,870) |
| Gross Profit |
2,915,386 |
908,368 |
– |
3,823,754 |
2,984,943 |
773,789 |
– |
3,758,732 |
| Gross Margin |
34% |
31% |
– |
33% |
41% |
37% |
– |
40% |
|
|
|
|
|
|
|
|
|
| Operating Expense/Income |
(1,013,214) |
(551,505) |
– |
(1,564,719) |
(872,594) |
(333,912) |
– |
(1,206,506) |
| Selling Expenses |
(467,482) |
(287,400) |
– |
(754,882) |
(446,409) |
(207,006) |
– |
(653,415) |
| General and Administrative Expenses |
(435,249) |
(238,302) |
– |
(673,551) |
(362,973) |
(140,002) |
– |
(502,975) |
| Other Operating Income (Expenses) |
(89,855) |
(29,354) |
– |
(119,209) |
(45,844) |
5,635 |
– |
(40,209) |
| Equity Equivalence |
(20,628) |
3,551 |
– |
(17,077) |
(17,368) |
7,461 |
– |
(9,907) |
| EBIT |
1,902,172 |
356,863 |
– |
2,259,035 |
2,112,349 |
439,877 |
– |
2,552,226 |
|
|
|
|
|
|
|
|
|
| Depreciation, Amortization & Depletion |
2,239,672 |
257,750 |
– |
2,497,422 |
1,751,690 |
230,334 |
– |
1,982,024 |
|
|
|
|
|
|
|
|
|
| EBITDA |
4,141,844 |
614,613 |
– |
4,756,457 |
3,864,039 |
670,211 |
– |
4,534,250 |
| EBITDA Margin |
48% |
21% |
– |
41% |
53% |
32% |
– |
48% |
|
|
|
|
|
|
|
|
|
| Adjusted EBITDA¹ |
4,254,146 |
611,628 |
– |
4,865,774 |
3,902,250 |
655,654 |
– |
4,557,904 |
| Adjusted EBITDA Margin¹ |
49% |
21% |
– |
42% |
53% |
31% |
– |
48% |
|
|
|
|
|
|
|
|
|
| Net Financial Result |
– |
– |
7,696,213 |
7,696,213 |
– |
– |
(3,040,048) |
(3,040,048) |
|
|
|
|
|
|
|
|
|
| Earnings Before Taxes |
1,902,172 |
356,863 |
7,696,213 |
9,955,248 |
2,112,349 |
439,877 |
(3,040,048) |
(487,822) |
|
|
|
|
|
|
|
|
|
| Income and Social Contribution Taxes |
– |
– |
(3,607,070) |
(3,607,070) |
– |
– |
707,854 |
707,854 |
|
|
|
|
|
|
|
|
|
| Net Income (Loss) |
1,902,172 |
356,863 |
4,089,143 |
6,348,178 |
2,112,349 |
439,877 |
(2,332,194) |
220,032 |
| Net Margin |
22% |
12% |
– |
55% |
29% |
21% |
– |
2% |
1Excluding non-recurring items and PPA effects.
Forward-Looking Statements
This release may contain forward-looking statements. Such statements are subject to known and unknown risks and uncertainties due to which such expectations may not happen at all or may substantially differ from what was expected. These risks include, among others, changes in future demand for the Company’s products, changes in factors affecting domestic and international product prices, changes in the cost structure, changes in the seasonal patterns of markets, changes in prices charged by competitors, foreign exchange variations, changes in the political or economic situation of Brazil, as well as emerging and international markets. The forward-looking statements were not reviewed by our independent auditors.