| Exhibit No. | Description | ||||
| 99.1 | Interim Consolidated Financial Statements (unaudited) for the period ended September 30, 2023. | ||||
| 99.2 | Management's Discussion and Analysis for the period ended September 30, 2023. | ||||
| Crescent Point Energy Corp. | |||||||||||
| (Registrant) | |||||||||||
| By: | /s/ Ken Lamont | ||||||||||
| Name: | Ken Lamont | ||||||||||
| Title: | Chief Financial Officer | ||||||||||
| Interim Consolidated Financial Statements (unaudited) for the period ended September 30, 2023. | |||||
| Management's Discussion and Analysis for the period ended September 30, 2023. | |||||
| As at | |||||||||||||||||
| September 30, | December 31, | ||||||||||||||||
| (UNAUDITED) (Cdn$ millions) | Notes | 2023 | 2022 | ||||||||||||||
| ASSETS | |||||||||||||||||
| Cash | 45.6 | 289.9 | |||||||||||||||
| Accounts receivable | 472.9 | 327.8 | |||||||||||||||
| Deposit on acquisition | — | 18.7 | |||||||||||||||
| Prepaids and deposits | 75.5 | 65.5 | |||||||||||||||
| Derivative asset | 19 | 119.4 | 138.9 | ||||||||||||||
| Assets held for sale | 5 | 905.4 | 148.4 | ||||||||||||||
| Total current assets | 1,618.8 | 989.2 | |||||||||||||||
| Derivative asset | 19 | 24.9 | 96.4 | ||||||||||||||
| Other long-term assets | 6.6 | 6.4 | |||||||||||||||
| Exploration and evaluation | 4, 5 | 260.5 | 104.2 | ||||||||||||||
| Property, plant and equipment | 5, 7 | 8,189.6 | 7,729.4 | ||||||||||||||
| Right-of-use asset | 10 | 67.0 | 78.1 | ||||||||||||||
| Goodwill | 5 | 203.6 | 203.9 | ||||||||||||||
| Deferred income tax | — | 278.8 | |||||||||||||||
| Total assets | 10,371.0 | 9,486.4 | |||||||||||||||
| LIABILITIES | |||||||||||||||||
| Accounts payable and accrued liabilities | 501.2 | 448.2 | |||||||||||||||
| Dividends payable | 53.1 | 99.4 | |||||||||||||||
| Current portion of long-term debt | 9 | 388.6 | 538.7 | ||||||||||||||
| Derivative liability | 19 | 48.3 | 8.7 | ||||||||||||||
| Other current liabilities | 8 | 109.9 | 115.6 | ||||||||||||||
| Liabilities associated with assets held for sale | 5 | 153.5 | 28.4 | ||||||||||||||
| Total current liabilities | 1,254.6 | 1,239.0 | |||||||||||||||
| Long-term debt | 9 | 2,559.3 | 902.8 | ||||||||||||||
| Derivative liability | 19 | 0.9 | — | ||||||||||||||
| Other long-term liabilities | 35.8 | 40.8 | |||||||||||||||
| Lease liability | 10 | 87.7 | 99.2 | ||||||||||||||
| Decommissioning liability | 11 | 482.0 | 633.9 | ||||||||||||||
| Deferred income tax | 240.3 | 77.3 | |||||||||||||||
| Total liabilities | 4,660.6 | 2,993.0 | |||||||||||||||
| SHAREHOLDERS’ EQUITY | |||||||||||||||||
| Shareholders’ capital | 12 | 16,158.7 | 16,419.3 | ||||||||||||||
| Contributed surplus | 16.4 | 17.1 | |||||||||||||||
| Deficit | 13 | (11,085.5) | (10,563.3) | ||||||||||||||
| Accumulated other comprehensive income | 620.8 | 620.3 | |||||||||||||||
| Total shareholders' equity | 5,710.4 | 6,493.4 | |||||||||||||||
| Total liabilities and shareholders' equity | 10,371.0 | 9,486.4 | |||||||||||||||
| CRESCENT POINT ENERGY CORP. | 1 |
||||
| (UNAUDITED) (Cdn$ millions, except per share and shares outstanding amounts) | Three months ended September 30 | Nine months ended September 30 | |||||||||||||||||||||||||||
| Notes | 2023 | 2022 Revised (1) |
2023 | 2022 Revised (1) |
|||||||||||||||||||||||||
| REVENUE AND OTHER INCOME | |||||||||||||||||||||||||||||
Oil and gas sales |
22 | 998.7 | 930.3 | 2,552.3 | 2,982.8 | ||||||||||||||||||||||||
Purchased product sales |
9.6 | 24.1 | 45.6 | 73.7 | |||||||||||||||||||||||||
Royalties |
(99.6) | (106.5) | (269.4) | (343.4) | |||||||||||||||||||||||||
| Oil and gas revenue | 908.7 | 847.9 | 2,328.5 | 2,713.1 | |||||||||||||||||||||||||
| Commodity derivative gains (losses) | 15, 19 | (79.1) | 163.5 | (29.2) | (446.1) | ||||||||||||||||||||||||
| Other income | 1.1 | 28.9 | 12.5 | 52.0 | |||||||||||||||||||||||||
| 830.7 | 1,040.3 | 2,311.8 | 2,319.0 | ||||||||||||||||||||||||||
| EXPENSES | |||||||||||||||||||||||||||||
| Operating | 214.2 | 162.9 | 566.0 | 467.9 | |||||||||||||||||||||||||
| Purchased product | 9.6 | 24.6 | 47.7 | 75.0 | |||||||||||||||||||||||||
| Transportation | 45.8 | 33.5 | 118.3 | 95.1 | |||||||||||||||||||||||||
| General and administrative | 16.5 | 20.6 | 77.2 | 59.8 | |||||||||||||||||||||||||
| Interest | 16 | 43.3 | 9.4 | 90.8 | 47.5 | ||||||||||||||||||||||||
| Foreign exchange (gain) loss | 17 | (2.3) | 7.8 | (9.5) | 14.6 | ||||||||||||||||||||||||
| Share-based compensation | 22.8 | 5.3 | 46.8 | 28.1 | |||||||||||||||||||||||||
| Depletion, depreciation and amortization | 4, 7, 10 | 248.9 | 207.2 | 646.8 | 601.8 | ||||||||||||||||||||||||
| Impairment (impairment reversal) | 7 | 45.4 | — | 45.4 | (1,413.6) | ||||||||||||||||||||||||
| Accretion and financing | 10, 11 | 6.9 | 6.5 | 20.3 | 18.0 | ||||||||||||||||||||||||
| 651.1 | 477.8 | 1,649.8 | (5.8) | ||||||||||||||||||||||||||
| Net income before tax from continuing operations | 179.6 | 562.5 | 662.0 | 2,324.8 | |||||||||||||||||||||||||
| Tax expense | |||||||||||||||||||||||||||||
Current |
— | — | — | — | |||||||||||||||||||||||||
Deferred |
46.0 | 147.4 | 165.2 | 600.3 | |||||||||||||||||||||||||
| Net income from continuing operations | 133.6 | 415.1 | 496.8 | 1,724.5 | |||||||||||||||||||||||||
| Net income (loss) from discontinued operations | 6 | (943.5) | 51.3 | (877.7) | 257.0 | ||||||||||||||||||||||||
| Net income (loss) | (809.9) | 466.4 | (380.9) | 1,981.5 | |||||||||||||||||||||||||
| Other comprehensive income | |||||||||||||||||||||||||||||
| Items that may be subsequently reclassified to profit or loss | |||||||||||||||||||||||||||||
Foreign currency translation of foreign operations |
35.2 | 86.9 | 0.5 | 108.5 | |||||||||||||||||||||||||
| Comprehensive income (loss) | (774.7) | 553.3 | (380.4) | 2,090.0 | |||||||||||||||||||||||||
| Net income (loss) per share | |||||||||||||||||||||||||||||
Continuing operations - basic |
0.25 | 0.74 | 0.92 | 3.02 | |||||||||||||||||||||||||
Discontinued operations - basic |
(1.77) | 0.09 | (1.62) | 0.45 | |||||||||||||||||||||||||
| Net income (loss) per share - basic | (1.52) | 0.83 | (0.70) | 3.47 | |||||||||||||||||||||||||
| Continuing operations - diluted | 0.25 | 0.73 | 0.92 | 2.99 | |||||||||||||||||||||||||
| Discontinued operations - diluted | (1.77) | 0.09 | (1.62) | 0.45 | |||||||||||||||||||||||||
| Net income (loss) per share - diluted | (1.52) | 0.82 | (0.70) | 3.44 | |||||||||||||||||||||||||
| Weighted average shares outstanding | |||||||||||||||||||||||||||||
Basic |
534,259,825 | 563,555,121 | 541,976,513 | 570,579,943 | |||||||||||||||||||||||||
Diluted |
536,907,203 | 567,435,208 | 544,795,179 | 575,196,393 | |||||||||||||||||||||||||
| CRESCENT POINT ENERGY CORP. | 2 |
||||
|
(UNAUDITED)
(Cdn$ millions, except per share amounts)
|
Notes | Shareholders’ capital | Contributed surplus | Deficit | Accumulated other comprehensive income | Total shareholders’ equity | |||||||||||||||||||||||||||||
| December 31, 2021 | 16,706.9 | 17.5 | (11,848.7) | 529.6 | 5,405.3 | ||||||||||||||||||||||||||||||
| Redemption of restricted shares | 4.6 | (4.7) | 2.4 | 2.3 | |||||||||||||||||||||||||||||||
| Common shares repurchased for cancellation | (207.7) | (207.7) | |||||||||||||||||||||||||||||||||
| Share-based compensation | 4.8 | 4.8 | |||||||||||||||||||||||||||||||||
| Stock options exercised | 1.5 | (1.4) | 0.1 | ||||||||||||||||||||||||||||||||
| Net income | 1,981.5 | 1,981.5 | |||||||||||||||||||||||||||||||||
| Dividends declared ($0.145 per share) | (81.8) | (81.8) | |||||||||||||||||||||||||||||||||
| Foreign currency translation adjustment | 108.5 | 108.5 | |||||||||||||||||||||||||||||||||
| September 30, 2022 | 16,505.3 | 16.2 | (9,946.6) | 638.1 | 7,213.0 | ||||||||||||||||||||||||||||||
| December 31, 2022 | 16,419.3 | 17.1 | (10,563.3) | 620.3 | 6,493.4 | ||||||||||||||||||||||||||||||
| Redemption of restricted shares | 12 | 4.8 | (4.8) | 2.3 | 2.3 | ||||||||||||||||||||||||||||||
| Common shares repurchased for cancellation | 12 | (266.1) | (266.1) | ||||||||||||||||||||||||||||||||
| Share-based compensation | 4.7 | 4.7 | |||||||||||||||||||||||||||||||||
| Stock options exercised | 12 | 0.7 | (0.6) | 0.1 | |||||||||||||||||||||||||||||||
| Net income (loss) | (380.9) | (380.9) | |||||||||||||||||||||||||||||||||
| Dividends declared ($0.267 per share) | (143.6) | (143.6) | |||||||||||||||||||||||||||||||||
| Foreign currency translation adjustment | 0.5 | 0.5 | |||||||||||||||||||||||||||||||||
| September 30, 2023 | 16,158.7 | 16.4 | (11,085.5) | 620.8 | 5,710.4 | ||||||||||||||||||||||||||||||
| CRESCENT POINT ENERGY CORP. | 3 |
||||
| Three months ended September 30 | Nine months ended September 30 | ||||||||||||||||||||||||||||
| (UNAUDITED) (Cdn$ millions) | Notes | 2023 | 2022 | 2023 | 2022 | ||||||||||||||||||||||||
| CASH PROVIDED BY (USED IN): | |||||||||||||||||||||||||||||
| OPERATING ACTIVITIES | |||||||||||||||||||||||||||||
Net income (loss) |
(809.9) | 466.4 | (380.9) | 1,981.5 | |||||||||||||||||||||||||
Items not affecting cash |
|||||||||||||||||||||||||||||
Other income |
(0.1) | (27.7) | (9.5) | (43.4) | |||||||||||||||||||||||||
Deferred tax expense |
303.5 | 153.4 | 443.8 | 601.6 | |||||||||||||||||||||||||
Share-based compensation |
1.6 | 1.6 | 4.6 | 4.6 | |||||||||||||||||||||||||
Depletion, depreciation and amortization |
4, 7, 10 | 320.9 | 247.2 | 817.1 | 706.4 | ||||||||||||||||||||||||
| Impairment (impairment reversal) | 7 | 773.8 | — | 773.8 | (1,484.9) | ||||||||||||||||||||||||
Accretion |
11 | 5.7 | 5.3 | 16.7 | 14.0 | ||||||||||||||||||||||||
Unrealized (gains) losses on derivatives |
19 | 35.4 | (349.5) | 155.5 | (117.3) | ||||||||||||||||||||||||
Translation of US dollar long-term debt |
17 | 62.7 | 76.9 | 22.7 | 107.6 | ||||||||||||||||||||||||
Realized gain on cross currency swap maturity |
17 | (6.8) | — | (95.9) | (63.8) | ||||||||||||||||||||||||
Decommissioning expenditures |
11 | (10.8) | (5.9) | (26.6) | (16.8) | ||||||||||||||||||||||||
Change in non-cash working capital |
21 | (27.1) | 79.3 | (136.9) | (86.8) | ||||||||||||||||||||||||
| 648.9 | 647.0 | 1,584.4 | 1,602.7 | ||||||||||||||||||||||||||
| INVESTING ACTIVITIES | |||||||||||||||||||||||||||||
Development capital and other expenditures |
4, 7 | (351.9) | (324.2) | (928.4) | (762.5) | ||||||||||||||||||||||||
Capital acquisitions |
5 | (1.1) | (88.2) | (2,075.8) | (89.4) | ||||||||||||||||||||||||
Capital dispositions |
5 | 0.2 | 244.1 | 11.2 | 284.8 | ||||||||||||||||||||||||
| Other long-term assets | (0.1) | — | (0.1) | — | |||||||||||||||||||||||||
Deposit on acquisition |
— | — | 18.7 | — | |||||||||||||||||||||||||
Change in non-cash working capital |
21 | 25.4 | 17.3 | 42.3 | 25.3 | ||||||||||||||||||||||||
| (327.5) | (151.0) | (2,932.1) | (541.8) | ||||||||||||||||||||||||||
| FINANCING ACTIVITIES | |||||||||||||||||||||||||||||
Issue of shares, net of issue costs |
— | — | 0.1 | — | |||||||||||||||||||||||||
Common shares repurchased for cancellation |
12 | (124.5) | (75.1) | (266.1) | (207.7) | ||||||||||||||||||||||||
Increase (decrease) in bank debt, net |
21 | (96.2) | (180.2) | 2,018.0 | (338.5) | ||||||||||||||||||||||||
Repayment of senior guaranteed notes |
21 | — | — | (534.1) | (281.8) | ||||||||||||||||||||||||
Realized gain on cross currency swap maturity |
17, 21 | 6.8 | — | 95.9 | 63.8 | ||||||||||||||||||||||||
Payments on principal portion of lease liability |
10, 21 | (5.6) | (5.1) | (16.2) | (15.3) | ||||||||||||||||||||||||
Dividends declared |
21 | (71.7) | (44.9) | (143.6) | (81.8) | ||||||||||||||||||||||||
Change in non-cash working capital |
21 | 1.5 | 17.9 | (51.0) | 11.4 | ||||||||||||||||||||||||
| (289.7) | (287.4) | 1,103.0 | (849.9) | ||||||||||||||||||||||||||
Impact of foreign currency on cash balances |
(0.1) | 1.0 | 0.4 | 1.0 | |||||||||||||||||||||||||
| INCREASE (DECREASE) IN CASH | 31.6 | 209.6 | (244.3) | 212.0 | |||||||||||||||||||||||||
| CASH AT BEGINNING OF PERIOD | 14.0 | 15.9 | 289.9 | 13.5 | |||||||||||||||||||||||||
| CASH AT END OF PERIOD | 45.6 | 225.5 | 45.6 | 225.5 | |||||||||||||||||||||||||
Cash taxes paid |
(0.1) | — | (0.1) | — | ||||||||||||||||||||||
Cash interest paid |
(33.4) | (1.5) | (71.1) | (40.5) | ||||||||||||||||||||||
| CRESCENT POINT ENERGY CORP. | 4 |
||||
($ millions) |
September 30, 2023 | December 31, 2022 | ||||||||||||
Exploration and evaluation assets at cost |
1,234.8 | 1,453.4 | ||||||||||||
Accumulated amortization |
(974.3) | (1,349.2) | ||||||||||||
Net carrying amount |
260.5 | 104.2 | ||||||||||||
Reconciliation of movements during the period |
||||||||||||||
Cost, beginning of period |
1,453.4 | 1,613.3 | ||||||||||||
Accumulated amortization, beginning of period |
(1,349.2) | (1,564.5) | ||||||||||||
Net carrying amount, beginning of period |
104.2 | 48.8 | ||||||||||||
Net carrying amount, beginning of period |
104.2 | 48.8 | ||||||||||||
Acquisitions through business combinations |
160.4 | 28.0 | ||||||||||||
Additions |
139.6 | 134.2 | ||||||||||||
Dispositions |
— | (10.9) | ||||||||||||
| Reclassified as assets held for sale | (1.8) | — | ||||||||||||
Transfers to property, plant and equipment |
(122.9) | (80.8) | ||||||||||||
Amortization |
(18.9) | (15.2) | ||||||||||||
Foreign exchange |
(0.1) | 0.1 | ||||||||||||
Net carrying amount, end of period |
260.5 | 104.2 | ||||||||||||
| CRESCENT POINT ENERGY CORP. | 5 |
||||
| ($ millions) | Alberta Montney Acquisition | Kaybob Duvernay Acquisition | Other minor dispositions, net | ||||||||||||||||||||
| Cash | (1,703.9) | (370.4) | 9.7 | ||||||||||||||||||||
| Consideration (paid) received | (1,703.9) | (370.4) | 9.7 | ||||||||||||||||||||
| Exploration and evaluation | 108.3 | 52.1 | — | ||||||||||||||||||||
| Property, plant and equipment | 1,620.1 | 323.7 | (7.5) | ||||||||||||||||||||
| Goodwill | — | — | (0.3) | ||||||||||||||||||||
| Decommissioning liability | (24.6) | (5.4) | 2.3 | ||||||||||||||||||||
| Other long-term assets | 0.1 | — | — | ||||||||||||||||||||
| Fair value of net assets acquired (Carrying value of net assets disposed) | 1,703.9 | 370.4 | (5.5) | ||||||||||||||||||||
| Gain on capital dispositions | — | — | 4.2 | ||||||||||||||||||||
| CRESCENT POINT ENERGY CORP. | 6 |
||||
($ millions) |
E&E
(Note 4)
|
PP&E
(Note 7)
|
Other assets
(Note 10)
|
Decommissioning liability
(Note 11)
|
Other liabilities (1)(2)
(Note 10, 19)
|
Total | |||||||||||||||||||||||||||||||||||
| North Dakota | 1.8 | 630.8 | 1.0 | (14.1) | (34.1) | 585.4 | |||||||||||||||||||||||||||||||||||
| Non-core Alberta | — | 271.8 | — | (105.3) | — | 166.5 | |||||||||||||||||||||||||||||||||||
| Assets (liabilities) held for sale | 1.8 | 902.6 | 1.0 | (119.4) | (34.1) | 751.9 | |||||||||||||||||||||||||||||||||||
| Three months ended September 30 | Nine months ended September 30 | |||||||||||||||||||||||||
| ($ millions) | 2023 | 2022 | 2023 | 2022 | ||||||||||||||||||||||
| REVENUE AND OTHER INCOME | ||||||||||||||||||||||||||
| Oil and gas sales | 237.6 | 167.0 | 547.2 | 493.7 | ||||||||||||||||||||||
| Royalties | (61.1) | (44.4) | (139.8) | (126.6) | ||||||||||||||||||||||
| Oil and gas revenue | 176.5 | 122.6 | 407.4 | 367.1 | ||||||||||||||||||||||
| Commodity derivative losses | (28.5) | — | (28.5) | — | ||||||||||||||||||||||
| Other income (loss) | (0.1) | — | 6.2 | — | ||||||||||||||||||||||
| 147.9 | 122.6 | 385.1 | 367.1 | |||||||||||||||||||||||
| EXPENSES | ||||||||||||||||||||||||||
| Operating | 28.1 | 22.1 | 71.9 | 66.3 | ||||||||||||||||||||||
| Transportation | 4.5 | 2.4 | 11.2 | 6.6 | ||||||||||||||||||||||
| General and administrative | 0.6 | 0.8 | 1.7 | 2.2 | ||||||||||||||||||||||
| Share-based compensation | 0.2 | (0.2) | 0.3 | 0.1 | ||||||||||||||||||||||
| Depletion, depreciation and amortization | 72.0 | 40.0 | 170.3 | 104.6 | ||||||||||||||||||||||
| Impairment (impairment reversal) | 728.4 | — | 728.4 | (71.3) | ||||||||||||||||||||||
| Accretion and financing | 0.1 | 0.2 | 0.4 | 0.3 | ||||||||||||||||||||||
| 833.9 | 65.3 | 984.2 | 108.8 | |||||||||||||||||||||||
| Net income (loss) before tax from discontinued operations | (686.0) | 57.3 | (599.1) | 258.3 | ||||||||||||||||||||||
| Tax expense | ||||||||||||||||||||||||||
| Current | — | — | — | — | ||||||||||||||||||||||
| Deferred | 257.5 | 6.0 | 278.6 | 1.3 | ||||||||||||||||||||||
| Net income (loss) from discontinued operations | (943.5) | 51.3 | (877.7) | 257.0 | ||||||||||||||||||||||
| CRESCENT POINT ENERGY CORP. | 7 |
||||
| Three months ended September 30 | Nine months ended September 30 | |||||||||||||||||||||||||
| ($ millions) | 2023 | 2022 | 2023 | 2022 | ||||||||||||||||||||||
| Cash provided by (used in) discontinued operations | ||||||||||||||||||||||||||
| Operating activities | 111.8 | 116.5 | 311.6 | 281.5 | ||||||||||||||||||||||
| Investing activities | (66.1) | (83.9) | (312.8) | (169.4) | ||||||||||||||||||||||
| Increase (decrease) in cash from discontinued operations | 45.7 | 32.6 | (1.2) | 112.1 | ||||||||||||||||||||||
| CRESCENT POINT ENERGY CORP. | 8 |
||||
| Three months ended | Three months ended | Year ended | Year ended | |||||||||||||||||||||||
| ($ millions, except per share amount) | June 30, 2023 | March 31, 2023 | December 31, 2022 | December 31, 2021 | ||||||||||||||||||||||
| REVENUE AND OTHER INCOME | ||||||||||||||||||||||||||
| Oil and gas sales | 791.6 | 762.0 | 3,847.0 | 2,735.3 | ||||||||||||||||||||||
| Purchased product sales | 16.2 | 19.8 | 100.8 | 31.7 | ||||||||||||||||||||||
| Royalties | (83.8) | (86.0) | (435.5) | (285.5) | ||||||||||||||||||||||
| Oil and gas revenue | 724.0 | 695.8 | 3,512.3 | 2,481.5 | ||||||||||||||||||||||
| Commodity derivative gains (losses) | 36.7 | 13.2 | (473.4) | (488.9) | ||||||||||||||||||||||
| Other income | 2.9 | 8.5 | 59.0 | 97.5 | ||||||||||||||||||||||
| 763.6 | 717.5 | 3,097.9 | 2,090.1 | |||||||||||||||||||||||
| EXPENSES | ||||||||||||||||||||||||||
| Operating | 182.8 | 169.0 | 628.2 | 546.3 | ||||||||||||||||||||||
| Purchased product | 17.6 | 20.5 | 102.9 | 32.6 | ||||||||||||||||||||||
| Transportation | 39.7 | 32.8 | 131.0 | 114.6 | ||||||||||||||||||||||
| General and administrative | 36.7 | 24.0 | 78.4 | 79.1 | ||||||||||||||||||||||
| Interest | 31.5 | 16.0 | 63.6 | 90.6 | ||||||||||||||||||||||
| Foreign exchange (gain) loss | (4.2) | (3.0) | 18.8 | (4.4) | ||||||||||||||||||||||
| Share-based compensation | 6.5 | 17.5 | 38.8 | 29.9 | ||||||||||||||||||||||
| Depletion, depreciation and amortization | 211.5 | 186.4 | 807.2 | 668.2 | ||||||||||||||||||||||
| Impairment reversal | — | — | (357.3) | (2,077.5) | ||||||||||||||||||||||
| Accretion and financing | 6.4 | 7.0 | 24.5 | 21.5 | ||||||||||||||||||||||
| 528.5 | 470.2 | 1,536.1 | (499.1) | |||||||||||||||||||||||
| Net income before tax from continuing operations | 235.1 | 247.3 | 1,561.8 | 2,589.2 | ||||||||||||||||||||||
| Tax expense | ||||||||||||||||||||||||||
| Current | — | — | — | — | ||||||||||||||||||||||
| Deferred | 56.7 | 62.5 | 415.1 | 715.6 | ||||||||||||||||||||||
| Net income from continuing operations | 178.4 | 184.8 | 1,146.7 | 1,873.6 | ||||||||||||||||||||||
| Net income from discontinued operations | 33.9 | 31.9 | 336.7 | 490.5 | ||||||||||||||||||||||
| Net income | 212.3 | 216.7 | 1,483.4 | 2,364.1 | ||||||||||||||||||||||
| Other comprehensive income (loss) | ||||||||||||||||||||||||||
| Items that may be subsequently reclassified to profit or loss | ||||||||||||||||||||||||||
Foreign currency translation of foreign operations |
(34.5) | (0.2) | 90.7 | 11.9 | ||||||||||||||||||||||
| Comprehensive income | 177.8 | 216.5 | 1,574.1 | 2,376.0 | ||||||||||||||||||||||
| Net income per share | ||||||||||||||||||||||||||
Continuing operations - basic |
0.33 | 0.33 | 2.03 | 3.29 | ||||||||||||||||||||||
Discontinued operations - basic |
0.06 | 0.06 | 0.59 | 0.86 | ||||||||||||||||||||||
| Net income per share - basic | 0.39 | 0.39 | 2.62 | 4.15 | ||||||||||||||||||||||
| Continuing operations - diluted | 0.33 | 0.33 | 2.01 | 3.26 | ||||||||||||||||||||||
| Discontinued operations - diluted | 0.06 | 0.06 | 0.59 | 0.85 | ||||||||||||||||||||||
| Net income per share - diluted | 0.39 | 0.39 | 2.60 | 4.11 | ||||||||||||||||||||||
| CRESCENT POINT ENERGY CORP. | 9 |
||||
($ millions) |
September 30, 2023 | December 31, 2022 | ||||||||||||
Development and production assets |
21,853.4 | 22,340.0 | ||||||||||||
Corporate assets |
130.0 | 126.2 | ||||||||||||
Property, plant and equipment at cost |
21,983.4 | 22,466.2 | ||||||||||||
Accumulated depletion, depreciation and impairment |
(13,793.8) | (14,736.8) | ||||||||||||
Net carrying amount |
8,189.6 | 7,729.4 | ||||||||||||
Reconciliation of movements during the period |
||||||||||||||
Development and production assets |
||||||||||||||
Cost, beginning of period |
22,340.0 | 23,402.9 | ||||||||||||
Accumulated depletion and impairment, beginning of period |
(14,651.8) | (15,762.6) | ||||||||||||
Net carrying amount, beginning of period |
7,688.2 | 7,640.3 | ||||||||||||
Net carrying amount, beginning of period |
7,688.2 | 7,640.3 | ||||||||||||
Acquisitions through business combinations |
1,945.4 | 66.0 | ||||||||||||
Additions |
710.2 | 741.9 | ||||||||||||
Dispositions |
(9.1) | (285.8) | ||||||||||||
Transfers from exploration and evaluation assets |
122.9 | 80.8 | ||||||||||||
Reclassified as assets held for sale |
(754.2) | (148.4) | ||||||||||||
Depletion |
(779.1) | (911.4) | ||||||||||||
Impairment reversal (impairment) |
(773.8) | 428.6 | ||||||||||||
Foreign exchange |
0.1 | 76.2 | ||||||||||||
Net carrying amount, end of period |
8,150.6 | 7,688.2 | ||||||||||||
Cost, end of period |
21,853.4 | 22,340.0 | ||||||||||||
Accumulated depletion and impairment, end of period |
(13,702.8) | (14,651.8) | ||||||||||||
Net carrying amount, end of period |
8,150.6 | 7,688.2 | ||||||||||||
Corporate assets |
||||||||||||||
Cost, beginning of period |
126.2 | 123.2 | ||||||||||||
Accumulated depreciation, beginning of period |
(85.0) | (76.2) | ||||||||||||
Net carrying amount, beginning of period |
41.2 | 47.0 | ||||||||||||
Net carrying amount, beginning of period |
41.2 | 47.0 | ||||||||||||
Additions |
3.8 | 2.6 | ||||||||||||
Depreciation |
(6.0) | (8.5) | ||||||||||||
Foreign exchange |
— | 0.1 | ||||||||||||
Net carrying amount, end of period |
39.0 | 41.2 | ||||||||||||
Cost, end of period |
130.0 | 126.2 | ||||||||||||
Accumulated depreciation, end of period |
(91.0) | (85.0) | ||||||||||||
Net carrying amount, end of period |
39.0 | 41.2 | ||||||||||||
| CRESCENT POINT ENERGY CORP. | 10 |
||||
($ millions) |
September 30, 2023 | December 31, 2022 | ||||||||||||
Long-term compensation liability |
47.9 | 49.1 | ||||||||||||
Lease liability |
22.1 | 24.9 | ||||||||||||
| Decommissioning liability | 39.9 | 41.6 | ||||||||||||
Other current liabilities |
109.9 | 115.6 | ||||||||||||
| ($ millions) | September 30, 2023 | December 31, 2022 | ||||||||||||
| Bank debt | 2,044.9 | — | ||||||||||||
| Senior guaranteed notes | 903.0 | 1,441.5 | ||||||||||||
| Long-term debt | 2,947.9 | 1,441.5 | ||||||||||||
Long-term debt due within one year |
388.6 | 538.7 | ||||||||||||
| Long-term debt due beyond one year | 2,559.3 | 902.8 | ||||||||||||
| CRESCENT POINT ENERGY CORP. | 11 |
||||
| Principal ($ millions) |
Coupon Rate |
Hedged
Principal (1)
(Cdn$ millions)
|
Unhedged
Principal (2)
(Cdn$ millions)
|
Interest Payment Dates | Maturity Date | Financial statement carrying value | |||||||||||||||||||||||
| September 30, 2023 | December 31, 2022 | ||||||||||||||||||||||||||||
| US$61.5 | 4.12 | % | — | — | October 11 and April 11 | April 11, 2023 | — | 83.2 | |||||||||||||||||||||
| Cdn$80.0 | 3.58 | % | — | — | October 11 and April 11 | April 11, 2023 | — | 80.0 | |||||||||||||||||||||
| Cdn$10.0 | 4.11 | % | — | — | December 12 and June 12 | June 12, 2023 | — | 10.0 | |||||||||||||||||||||
| US$270.0 | 3.78 | % | — | — | December 12 and June 12 | June 12, 2023 | — | 365.5 | |||||||||||||||||||||
| Cdn$40.0 | 3.85 | % | 40.0 | — | December 20 and June 20 | June 20, 2024 | 40.0 | 40.0 | |||||||||||||||||||||
| US$257.5 | 3.75 | % | 276.4 | — | December 20 and June 20 | June 20, 2024 | 348.6 | 348.5 | |||||||||||||||||||||
| US$82.0 | 4.30 | % | 67.9 | 40.6 | October 11 and April 11 | April 11, 2025 | 111.0 | 111.0 | |||||||||||||||||||||
| Cdn$65.0 | 3.94 | % | 65.0 | — | October 22 and April 22 | April 22, 2025 | 65.0 | 65.0 | |||||||||||||||||||||
| US$230.0 | 4.08 | % | 262.6 | 30.5 | October 22 and April 22 | April 22, 2025 | 311.4 | 311.3 | |||||||||||||||||||||
| US$20.0 | 4.18 | % | — | 27.1 | October 22 and April 22 | April 22, 2027 | 27.0 | 27.0 | |||||||||||||||||||||
| Senior guaranteed notes | 711.9 | 98.2 | 903.0 | 1,441.5 | |||||||||||||||||||||||||
| Due within one year | 316.4 | — | 388.6 | 538.7 | |||||||||||||||||||||||||
| Due beyond one year | 395.5 | 98.2 | 514.4 | 902.8 | |||||||||||||||||||||||||
| ($ millions) | Office (1) |
Fleet Vehicles | Equipment | Total | ||||||||||||||||||||||
| Right-of-use asset at cost | 121.9 | 26.0 | 13.3 | 161.2 | ||||||||||||||||||||||
| Accumulated depreciation | (62.9) | (22.2) | (9.1) | (94.2) | ||||||||||||||||||||||
| Net carrying amount | 59.0 | 3.8 | 4.2 | 67.0 | ||||||||||||||||||||||
Reconciliation of movements during the period |
||||||||||||||||||||||||||
| Cost, beginning of period | 121.9 | 28.5 | 11.1 | 161.5 | ||||||||||||||||||||||
| Accumulated depreciation, beginning of period | (55.4) | (20.4) | (7.6) | (83.4) | ||||||||||||||||||||||
| Net carrying amount, beginning of period | 66.5 | 8.1 | 3.5 | 78.1 | ||||||||||||||||||||||
| Net carrying amount, beginning of period | 66.5 | 8.1 | 3.5 | 78.1 | ||||||||||||||||||||||
| Additions | 0.8 | — | 2.2 | 3.0 | ||||||||||||||||||||||
| Reclassified as assets held for sale | (0.1) | (0.9) | — | (1.0) | ||||||||||||||||||||||
| Depreciation | (8.2) | (3.4) | (1.5) | (13.1) | ||||||||||||||||||||||
| Net carrying amount, end of period | 59.0 | 3.8 | 4.2 | 67.0 | ||||||||||||||||||||||
| CRESCENT POINT ENERGY CORP. | 12 |
||||
| ($ millions) | September 30, 2023 | December 31, 2022 | ||||||||||||
Lease liability, beginning of period |
124.1 | 141.4 | ||||||||||||
| Additions | 3.0 | 3.8 | ||||||||||||
| Reclassified as liabilities associated with assets held for sale | (1.1) | — | ||||||||||||
| Financing | 4.0 | 5.7 | ||||||||||||
Payments on lease liability |
(20.2) | (26.1) | ||||||||||||
| Other | — | (0.7) | ||||||||||||
| Lease liability, end of period | 109.8 | 124.1 | ||||||||||||
| Expected to be incurred within one year | 22.1 | 24.9 | ||||||||||||
| Expected to be incurred beyond one year | 87.7 | 99.2 | ||||||||||||
| ($ millions) | September 30, 2023 | |||||||
1 year |
23.3 | |||||||
| 2 to 3 years | 39.6 | |||||||
| 4 to 5 years | 33.9 | |||||||
More than 5 years |
29.5 | |||||||
Total (1) |
126.3 | |||||||
($ millions) |
September 30, 2023 | December 31, 2022 | ||||||||||||
Decommissioning liability, beginning of period |
675.5 | 918.8 | ||||||||||||
Liabilities incurred |
15.7 | 21.6 | ||||||||||||
Liabilities acquired through capital acquisitions |
30.1 | 3.4 | ||||||||||||
Liabilities disposed through capital dispositions |
(2.4) | (46.7) | ||||||||||||
Liabilities settled (1) |
(32.0) | (43.1) | ||||||||||||
Revaluation of acquired decommissioning liabilities (2) |
27.1 | 3.8 | ||||||||||||
Change in estimates |
— | (11.4) | ||||||||||||
Change in discount and inflation rate estimates |
(117.8) | (163.0) | ||||||||||||
Accretion |
16.7 | 19.2 | ||||||||||||
Reclassified as liabilities associated with assets held for sale |
(91.0) | (28.4) | ||||||||||||
Foreign exchange |
— | 1.3 | ||||||||||||
Decommissioning liability, end of period |
521.9 | 675.5 | ||||||||||||
Expected to be incurred within one year |
39.9 | 41.6 | ||||||||||||
Expected to be incurred beyond one year |
482.0 | 633.9 | ||||||||||||
| CRESCENT POINT ENERGY CORP. | 13 |
||||
| September 30, 2023 | December 31, 2022 | |||||||||||||||||||||||||
|
|
Number of
shares
|
Amount
($ millions)
|
Number of
shares
|
Amount
($ millions)
|
||||||||||||||||||||||
Common shares, beginning of period |
550,888,983 | 16,675.8 | 579,484,032 | 16,963.4 | ||||||||||||||||||||||
Issued on redemption of restricted shares |
1,391,364 | 4.8 | 1,713,730 | 5.2 | ||||||||||||||||||||||
| Issued on exercise of stock options | 445,351 | 0.7 | 1,038,321 | 1.4 | ||||||||||||||||||||||
Common shares repurchased for cancellation |
(26,239,700) | (266.1) | (31,347,100) | (294.2) | ||||||||||||||||||||||
Common shares, end of period |
526,485,998 | 16,415.2 | 550,888,983 | 16,675.8 | ||||||||||||||||||||||
Cumulative share issue costs, net of tax |
— | (256.5) | — | (256.5) | ||||||||||||||||||||||
Total shareholders’ capital, end of period |
526,485,998 | 16,158.7 | 550,888,983 | 16,419.3 | ||||||||||||||||||||||
| ($ millions) | September 30, 2023 | December 31, 2022 | ||||||||||||
Accumulated earnings (deficit) |
(3,081.5) | (2,700.6) | ||||||||||||
Accumulated gain on shares issued pursuant to DRIP (1) and SDP (2) |
8.4 | 8.4 | ||||||||||||
Accumulated tax effect on redemption of restricted shares |
18.1 | 15.8 | ||||||||||||
Accumulated dividends |
(8,030.5) | (7,886.9) | ||||||||||||
| Deficit | (11,085.5) | (10,563.3) | ||||||||||||
| ($ millions) | September 30, 2023 | December 31, 2022 | ||||||||||||
Long-term debt (1) |
2,947.9 | 1,441.5 | ||||||||||||
Adjusted working capital (surplus) deficiency (2) |
45.7 | (95.1) | ||||||||||||
| Unrealized foreign exchange on translation of hedged US dollar long-term debt | (117.4) | (191.7) | ||||||||||||
| Net debt | 2,876.2 | 1,154.7 | ||||||||||||
| Shareholders’ equity | 5,710.4 | 6,493.4 | ||||||||||||
| Total capitalization | 8,586.6 | 7,648.1 | ||||||||||||
| CRESCENT POINT ENERGY CORP. | 14 |
||||
| ($ millions) | September 30, 2023 | September 30, 2022 | ||||||||||||
| Cash flow from operating activities | 1,584.4 | 1,602.7 | ||||||||||||
Changes in non-cash working capital |
136.9 | 86.8 | ||||||||||||
| Transaction costs | 16.7 | 3.3 | ||||||||||||
| Decommissioning expenditures | 26.6 | 16.8 | ||||||||||||
| Adjusted funds flow from operations | 1,764.6 | 1,709.6 | ||||||||||||
| Three months ended September 30 | Nine months ended September 30 | |||||||||||||||||||||||||
($ millions) |
2023 | 2022 (1) |
2023 | 2022 (1) |
||||||||||||||||||||||
Realized gains (losses) |
(4.9) | (120.2) | 13.0 | (546.2) | ||||||||||||||||||||||
Unrealized gains (losses) |
(74.2) | 283.7 | (42.2) | 100.1 | ||||||||||||||||||||||
Commodity derivative gains (losses) |
(79.1) | 163.5 | (29.2) | (446.1) | ||||||||||||||||||||||
| Three months ended September 30 | Nine months ended September 30 | |||||||||||||||||||||||||
($ millions) |
2023 | 2022 | 2023 | 2022 | ||||||||||||||||||||||
Interest expense on long-term debt |
43.8 | 15.3 | 89.7 | 53.1 | ||||||||||||||||||||||
| Unrealized (gain) loss on interest derivative contracts | (0.5) | (5.9) | 1.1 | (5.6) | ||||||||||||||||||||||
Interest expense |
43.3 | 9.4 | 90.8 | 47.5 | ||||||||||||||||||||||
| Three months ended September 30 | Nine months ended September 30 | |||||||||||||||||||||||||
($ millions) |
2023 | 2022 | 2023 | 2022 | ||||||||||||||||||||||
| Realized gain on CCS - principal | 6.8 | — | 95.9 | 63.8 | ||||||||||||||||||||||
| Translation of US dollar long-term debt | (62.7) | (76.9) | (22.7) | (107.6) | ||||||||||||||||||||||
| Unrealized gain (loss) on CCS - principal and foreign exchange swaps | 55.9 | 63.4 | (64.6) | 20.9 | ||||||||||||||||||||||
| Other | 2.3 | 5.7 | 0.9 | 8.3 | ||||||||||||||||||||||
| Foreign exchange gain (loss) | 2.3 | (7.8) | 9.5 | (14.6) | ||||||||||||||||||||||
| CRESCENT POINT ENERGY CORP. | 15 |
||||
Restricted Shares |
ESVP | PSUs (1) |
DSUs |
|||||||||||||||||||||||
Balance, beginning of period |
2,244,738 | 5,274,478 | 2,713,176 | 1,745,879 | ||||||||||||||||||||||
Granted |
712,159 | 1,482,811 | 879,218 | 159,169 | ||||||||||||||||||||||
Redeemed |
(1,391,364) | (3,721,568) | — | (248,920) | ||||||||||||||||||||||
Forfeited |
(62,305) | (354,908) | (155,309) | — | ||||||||||||||||||||||
Balance, end of period |
1,503,228 | 2,680,813 | 3,437,085 | 1,656,128 | ||||||||||||||||||||||
| Stock options (number of units) |
Weighted average exercise price ($) | |||||||||||||
Balance, beginning of period |
3,889,130 | 4.43 | ||||||||||||
Exercised |
(605,592) | 2.94 | ||||||||||||
Forfeited |
(24,817) | 2.62 | ||||||||||||
Balance, end of period |
3,258,721 | 4.72 | ||||||||||||
| Range of exercise prices ($) | Number of stock options outstanding | Weighted average remaining term for stock options outstanding (years) | Weighted average exercise price per share for stock options outstanding ($) | Number of stock options exercisable | Weighted average exercise price per share for stock options exercisable ($) | ||||||||||||||||||||||||||||||
| 1.09 - 1.65 | 1,556,593 | 3.50 | 1.09 | 521,227 | 1.09 | ||||||||||||||||||||||||||||||
| 1.66 - 5.16 | 260,708 | 2.53 | 3.93 | 248,839 | 3.97 | ||||||||||||||||||||||||||||||
| 5.17 - 9.86 | 451,889 | 3.96 | 5.99 | 162,599 | 7.28 | ||||||||||||||||||||||||||||||
| 9.87 - 10.06 | 989,531 | 1.28 | 10.06 | 989,531 | 10.06 | ||||||||||||||||||||||||||||||
| 3,258,721 | 2.81 | 4.72 | 1,922,196 | 6.60 | |||||||||||||||||||||||||||||||
| CRESCENT POINT ENERGY CORP. | 16 |
||||
| ($ millions) | Commodity (1) |
Interest (2) |
Foreign exchange (3) |
Equity | Total | |||||||||||||||||||||||||||
| Derivative assets, beginning of period | 14.0 | 6.7 | 175.0 | 30.9 | 226.6 | |||||||||||||||||||||||||||
| Unrealized change in fair value | (66.2) | (1.1) | (64.6) | (23.6) | (155.5) | |||||||||||||||||||||||||||
| Reclassified as liabilities associated with assets held for sale | 24.0 | — | — | — | 24.0 | |||||||||||||||||||||||||||
| Derivative assets (liabilities), end of period | (28.2) | 5.6 | 110.4 | 7.3 | 95.1 | |||||||||||||||||||||||||||
| Derivative assets, end of period | 19.7 | 5.6 | 111.7 | 7.3 | 144.3 | |||||||||||||||||||||||||||
| Derivative liabilities, end of period | (47.9) | — | (1.3) | — | (49.2) | |||||||||||||||||||||||||||
| ($ millions) | September 30, 2023 | September 30, 2022 | ||||||||||||||||||||||||
| Increase 10% | Decrease 10% | Increase 10% | Decrease 10% | |||||||||||||||||||||||
| Commodity price | ||||||||||||||||||||||||||
Crude oil (1) |
(87.7) | 81.8 | (76.1) | 74.0 | ||||||||||||||||||||||
| Natural gas | (7.8) | 7.8 | (4.1) | 4.3 | ||||||||||||||||||||||
| Propane | — | — | (0.1) | 0.1 | ||||||||||||||||||||||
| Differential | ||||||||||||||||||||||||||
| Crude oil | 1.0 | (1.0) | 0.1 | (0.1) | ||||||||||||||||||||||
| Natural gas | 6.1 | (6.1) | 3.8 | (3.8) | ||||||||||||||||||||||
| CRESCENT POINT ENERGY CORP. | 17 |
||||
($ millions) |
Exchange Rate |
September 30, 2023 | September 30, 2022 | ||||||||||||||||||||||||||
Cdn$ relative to US$ |
Increase 10% | Decrease 10% | Increase 10% | Decrease 10% |
|||||||||||||||||||||||||
US dollar long-term debt |
Period End |
275.7 | (275.7) | 126.2 | (126.2) | ||||||||||||||||||||||||
Cross currency swaps |
Forward |
(267.2) | 267.2 | (127.7) | 127.7 | ||||||||||||||||||||||||
| Foreign exchange swaps | Forward |
65.0 | (65.0) | 5.1 | (5.1) | ||||||||||||||||||||||||
($ millions) |
September 30, 2023 | September 30, 2022 | ||||||||||||||||||||||||
Share price |
Increase 50% | Decrease 50% | Increase 50% | Decrease 50% | ||||||||||||||||||||||
Total return swaps |
15.5 | (15.5) | 23.6 | (23.6) | ||||||||||||||||||||||
Financial WTI Crude Oil Derivative Contracts – Canadian Dollar (1) | ||||||||||||||||||||||||||||||||||||||||||||||||||
| Swap | Collar | Put | ||||||||||||||||||||||||||||||||||||||||||||||||
| Term | Volume (bbls/d) |
Average Price ($/bbl) |
Volumes (bbls/d) | Average Sold Call Price ($/bbl) |
Average Bought Put Price ($/bbl) |
Volume (bbls/d) |
Average Bought Put Price ($/bbl) |
Average Put Premium ($/bbl) |
||||||||||||||||||||||||||||||||||||||||||
| October 2023 - December 2023 | 4,500 | 104.58 | 23,000 | 108.25 | 94.95 | 2,500 | 85.00 | 2.43 | ||||||||||||||||||||||||||||||||||||||||||
| January 2024 - December 2024 | — | — | 12,081 | 115.69 | 96.72 | — | — | — | ||||||||||||||||||||||||||||||||||||||||||
Financial WTI Crude Oil Derivative Contracts – US Dollar (1) (2) |
||||||||||||||
| Swap | ||||||||||||||
| Volume (bbls/d) |
Average Price (US$/bbl) |
|||||||||||||
| Term | ||||||||||||||
| October 2023 - December 2023 | 8,185 | 77.13 | ||||||||||||
| January 2024 - October 2024 | 4,915 | 75.38 | ||||||||||||
| CRESCENT POINT ENERGY CORP. | 18 |
||||
Financial WTI Crude Oil Differential Derivative Contracts – Canadian Dollar (1) | ||||||||||||||||||||||||||
| Term | Volume (bbls/d) |
Contract | Basis | Fixed Differential ($/bbl) |
||||||||||||||||||||||
| October 2023 - December 2023 | 4,000 | Basis Swap | WCS (2) |
(22.73) | ||||||||||||||||||||||
| October 2023 - December 2023 | 3,000 | Basis Swap | MSW (3) |
(4.39) | ||||||||||||||||||||||
Financial AECO Natural Gas Derivative Contracts – Canadian Dollar (1) |
||||||||||||||
| Swap | ||||||||||||||
| Volume (GJ/d) |
Average Price ($/GJ) |
|||||||||||||
| Term | ||||||||||||||
| October 2023 - December 2023 | 31,348 | 4.13 | ||||||||||||
| January 2024 - October 2024 | 31,403 | 3.33 | ||||||||||||
Financial NYMEX Natural Gas Derivative Contracts – US Dollar (1) |
||||||||||||||||||||||||||||||||
| Swap | Collar | |||||||||||||||||||||||||||||||
| Term | Volume (mmbtu/d) |
Average Price (US$/mmbtu) |
Volume (mmbtu/d) | Average Sold Call Price (US$/mmbtu) |
Average Bought Put Price (US$/mmbtu) |
|||||||||||||||||||||||||||
| October 2023 - December 2023 | 20,000 | 3.13 | — | — | — | |||||||||||||||||||||||||||
| January 2024 - December 2024 | — | — | 35,000 | 4.19 | 3.00 | |||||||||||||||||||||||||||
Financial NYMEX Natural Gas Differential Derivative Contracts – US Dollar (1) |
||||||||||||||||||||||||||
| Term | Volume (mmbtu/d) |
Contract | Basis | Fixed Differential (US$/mmbtu) |
||||||||||||||||||||||
| October 2023 - December 2023 | 40,000 | Basis Swap | AECO | (1.05) | ||||||||||||||||||||||
| January 2024 - December 2024 | 70,000 | Basis Swap | AECO | (1.08) | ||||||||||||||||||||||
| January 2025 - December 2025 | 29,863 | Basis Swap | AECO | (1.08) | ||||||||||||||||||||||
| Financial Cross Currency Derivative Contracts | |||||||||||||||||||||||||||||
| Term | Contract |
Receive Notional Principal
(US$ millions)
|
Fixed Rate (US%) |
Pay Notional Principal
(Cdn$ millions)
|
Fixed Rate (Cdn%) | ||||||||||||||||||||||||
| October 2023 | Swap | 646.0 | 6.95 | 852.1 | 6.60 | ||||||||||||||||||||||||
| October 2023 | Swap | 634.0 | 7.08 | 855.2 | 6.67 | ||||||||||||||||||||||||
| October 2023 - November 2023 | Swap | 167.0 | 7.11 | 227.2 | 6.73 | ||||||||||||||||||||||||
| October 2023 - June 2024 | Swap | 257.5 | 3.75 | 276.4 | 4.03 | ||||||||||||||||||||||||
| October 2023 - April 2025 | Swap | 52.0 | 4.30 | 67.9 | 3.98 | ||||||||||||||||||||||||
| October 2023 - April 2025 | Swap | 207.5 | 4.08 | 262.6 | 4.13 | ||||||||||||||||||||||||
| Financial Foreign Exchange Forward Derivative Contracts | |||||||||||||||||||||||||||||
| Settlement Date | Contract | Receive Currency | Receive Notional Principal ($ millions) |
Pay Currency |
Pay Notional Principal
($ millions)
|
||||||||||||||||||||||||
| October 2023 | Swap | Cdn$ | 529.1 | US$ | 390.0 | ||||||||||||||||||||||||
| October 2023 | Swap (1) |
Cdn$ | 43.2 | US$ | 32.0 | ||||||||||||||||||||||||
| June 2024 | Swap | Cdn$ | 40.5 | US$ | 30.0 | ||||||||||||||||||||||||
| December 2024 | Swap | Cdn$ | 40.5 | US$ | 30.0 | ||||||||||||||||||||||||
| CRESCENT POINT ENERGY CORP. | 19 |
||||
Financial Equity Derivative Contracts |
Notional Principal
($ millions)
|
Number of shares |
||||||||||||||||||
Term |
Contract |
|||||||||||||||||||
October 2023 - March 2024 |
Swap |
11.8 | 1,549,947 | |||||||||||||||||
October 2023 - March 2025 |
Swap |
12.0 | 1,207,754 | |||||||||||||||||
| ($ millions) | 1 year | 2 to 3 years | 4 to 5 years | More than 5 years | Total | ||||||||||||||||||||||||||||||
Operating (1) |
11.2 | 11.2 | 9.7 | 8.3 | 40.4 | ||||||||||||||||||||||||||||||
| Gas processing | 82.8 | 121.2 | 97.2 | 266.0 | 567.2 | ||||||||||||||||||||||||||||||
| Transportation | 95.9 | 183.8 | 100.5 | 47.7 | 427.9 | ||||||||||||||||||||||||||||||
| Capital | 13.7 | 14.9 | — | — | 28.6 | ||||||||||||||||||||||||||||||
Total contractual commitments (2) |
203.6 | 331.1 | 207.4 | 322.0 | 1,064.1 | ||||||||||||||||||||||||||||||
| Three months ended September 30 | Nine months ended September 30 | |||||||||||||||||||||||||
| ($ millions) | 2023 | 2022 | 2023 | 2022 | ||||||||||||||||||||||
Operating activities |
||||||||||||||||||||||||||
Changes in non-cash working capital: |
||||||||||||||||||||||||||
Accounts receivable |
(97.3) | 134.9 | (144.5) | (81.1) | ||||||||||||||||||||||
Prepaids and deposits |
(0.5) | (2.5) | (1.1) | (9.6) | ||||||||||||||||||||||
Accounts payable and accrued liabilities |
40.5 | (54.1) | 15.1 | 9.9 | ||||||||||||||||||||||
Other current liabilities |
17.9 | — | (1.4) | (2.0) | ||||||||||||||||||||||
Other long-term liabilities |
12.3 | 1.0 | (5.0) | (4.0) | ||||||||||||||||||||||
| (27.1) | 79.3 | (136.9) | (86.8) | |||||||||||||||||||||||
Investing activities |
||||||||||||||||||||||||||
Changes in non-cash working capital: |
||||||||||||||||||||||||||
Accounts receivable |
0.2 | 0.6 | (0.4) | (2.0) | ||||||||||||||||||||||
Accounts payable and accrued liabilities |
25.2 | 16.7 | 42.7 | 27.3 | ||||||||||||||||||||||
| 25.4 | 17.3 | 42.3 | 25.3 | |||||||||||||||||||||||
| Financing activities | ||||||||||||||||||||||||||
Changes in non-cash working capital: |
||||||||||||||||||||||||||
Prepaids and deposits |
1.0 | — | (8.9) | — | ||||||||||||||||||||||
| Accounts payable and accrued liabilities | 1.6 | 10.0 | 4.2 | 10.0 | ||||||||||||||||||||||
| Dividends payable | (1.1) | 7.9 | (46.3) | 1.4 | ||||||||||||||||||||||
| 1.5 | 17.9 | (51.0) | 11.4 | |||||||||||||||||||||||
| CRESCENT POINT ENERGY CORP. | 20 |
||||
($ millions) |
Dividends payable |
Long-term debt (1) |
Lease liability (2) |
||||||||||||||||||||
| December 31, 2021 | 43.5 | 1,970.2 | 141.4 | ||||||||||||||||||||
Changes from cash flow from financing activities: |
|||||||||||||||||||||||
| Decrease in bank debt, net | (338.5) | ||||||||||||||||||||||
Repayment of senior guaranteed notes |
(281.8) | ||||||||||||||||||||||
| Realized gain on cross currency swap maturity | 63.8 | ||||||||||||||||||||||
| Dividends paid | (80.4) | ||||||||||||||||||||||
Payments on principal portion of lease liability |
(15.3) | ||||||||||||||||||||||
Non-cash changes: |
|||||||||||||||||||||||
| Dividends declared | 81.8 | ||||||||||||||||||||||
Additions |
0.5 | ||||||||||||||||||||||
| Other | (0.7) | ||||||||||||||||||||||
Foreign exchange |
43.1 | ||||||||||||||||||||||
| September 30, 2022 | 44.9 | 1,456.8 | 125.9 | ||||||||||||||||||||
| December 31, 2022 | 99.4 | 1,441.5 | 124.1 | ||||||||||||||||||||
Changes from cash flow from financing activities: |
|||||||||||||||||||||||
| Increase in bank debt, net | 2,018.0 | ||||||||||||||||||||||
Repayment of senior guaranteed notes |
(534.1) | ||||||||||||||||||||||
| Realized gain on cross currency swap maturity | 91.8 | ||||||||||||||||||||||
| Dividends paid | (189.9) | ||||||||||||||||||||||
Payments on principal portion of lease liability |
(16.2) | ||||||||||||||||||||||
Non-cash changes: |
|||||||||||||||||||||||
| Dividends declared | 143.6 | ||||||||||||||||||||||
Additions |
3.0 | ||||||||||||||||||||||
Reclassified as liabilities associated with assets held for sale |
(1.1) | ||||||||||||||||||||||
Foreign exchange |
(69.3) | ||||||||||||||||||||||
| September 30, 2023 | 53.1 | 2,947.9 | 109.8 | ||||||||||||||||||||
| CRESCENT POINT ENERGY CORP. | 21 |
||||
| Three months ended September 30 | Nine months ended September 30 | |||||||||||||||||||||||||
($ millions) (1) |
2023 | 2022 | 2023 | 2022 | ||||||||||||||||||||||
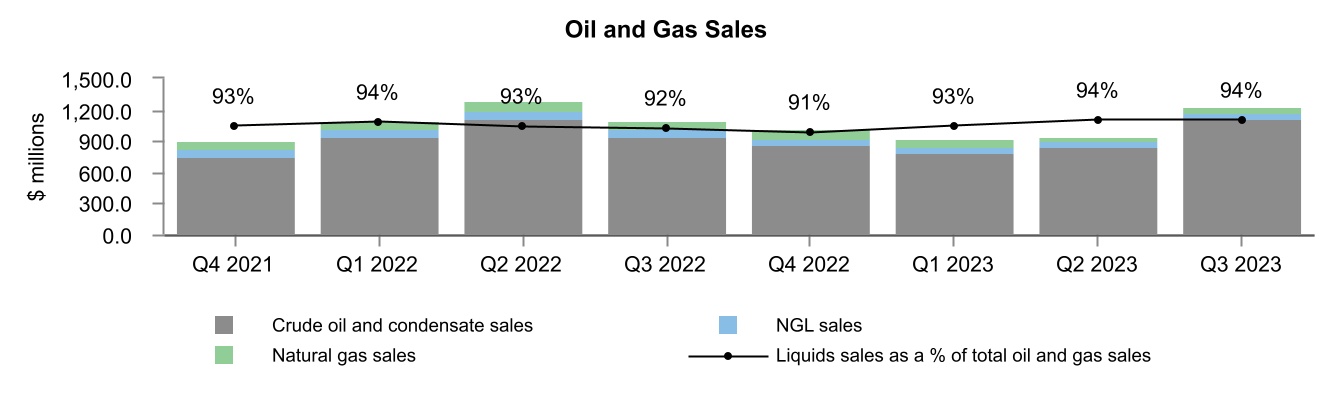
| Canada | ||||||||||||||||||||||||||
| Crude oil and condensate sales | 889.4 | 800.1 | 2,245.4 | 2,587.7 | ||||||||||||||||||||||
| NGL sales | 45.7 | 55.6 | 135.2 | 173.3 | ||||||||||||||||||||||
| Natural gas sales | 63.6 | 74.6 | 171.7 | 221.8 | ||||||||||||||||||||||
| Total Canada | 998.7 | 930.3 | 2,552.3 | 2,982.8 | ||||||||||||||||||||||
| U.S. | ||||||||||||||||||||||||||
| Crude oil and condensate sales | 224.0 | 140.8 | 504.7 | 421.1 | ||||||||||||||||||||||
| NGL sales | 8.9 | 13.8 | 26.8 | 43.7 | ||||||||||||||||||||||
| Natural gas sales | 4.7 | 12.4 | 15.7 | 28.9 | ||||||||||||||||||||||
Total U.S. (2) |
237.6 | 167.0 | 547.2 | 493.7 | ||||||||||||||||||||||
| Total oil and gas sales | 1,236.3 | 1,097.3 | 3,099.5 | 3,476.5 | ||||||||||||||||||||||
| CRESCENT POINT ENERGY CORP. | 22 |
||||
|
Directors
Barbara Munroe, Chair (6)
James Craddock (2) (3) (5)
John Dielwart (3) (4)
Mike Jackson (1) (5)
Jennifer Koury (2) (5)
Francois Langlois (1) (3) (4)
Myron Stadnyk (1) (2) (4)
Mindy Wight (1) (2)
Craig Bryksa (4)
(1) Member of the Audit Committee of the Board of Directors
(2) Member of the Human Resources and Compensation Committee of the Board of Directors
(3) Member of the Reserves Committee of the Board of Directors
(4) Member of the Environment, Safety and Sustainability Committee of the Board of Directors
(5) Member of the Corporate Governance and Nominating Committee
(6) Chair of the Board serves in an ex officio capacity on each Committee
Officers
Craig Bryksa
President and Chief Executive Officer
Ken Lamont
Chief Financial Officer
Ryan Gritzfeldt
Chief Operating Officer
Mark Eade
Senior Vice President, General Counsel and Corporate Secretary
Garret Holt
Senior Vice President, Strategy & Sustainability
Michael Politeski
Senior Vice President, Finance and Treasurer
Shelly Witwer
Senior Vice President, Business Development
Justin Foraie
Vice President, Operations and Marketing
Head Office
Suite 2000, 585 - 8th Avenue S.W.
Calgary, Alberta T2P 1G1
Tel: (403) 693-0020
Fax: (403) 693-0070
Toll Free: (888) 693-0020
Banker
The Bank of Nova Scotia
Calgary, Alberta
|
Auditor
PricewaterhouseCoopers LLP
Calgary, Alberta
Legal Counsel
Norton Rose Fulbright Canada LLP
Calgary, Alberta
Evaluation Engineers
McDaniel & Associates Consultants Ltd.
Calgary, Alberta
Registrar and Transfer Agent
Investors are encouraged to contact Crescent Point's Registrar and Transfer Agent for information regarding their security holdings:
Computershare Trust Company of Canada
600, 530 - 8th Avenue S.W.
Calgary, Alberta T2P 3S8
Tel: (403) 267-6800
Stock Exchanges
Toronto Stock Exchange - TSX
New York Stock Exchange - NYSE
Stock Symbol
CPG
Investor Contacts
Shant Madian
Vice President, Capital Markets
(403) 693-0020
Sarfraz Somani
Manager, Investor Relations
(403) 693-0020
|
|||||||
| CRESCENT POINT ENERGY CORP. | 23 |
||||
| CRESCENT POINT ENERGY CORP. | 1 |
||||
| Three months ended September 30, 2023 | Three months ended September 30, 2022 | |||||||||||||||||||||||||||||||||||||
| ($ millions) | Continuing | Discontinued | Total | Continuing (1) |
Discontinued (1) |
Total | ||||||||||||||||||||||||||||||||
| REVENUE AND OTHER INCOME | ||||||||||||||||||||||||||||||||||||||
Oil and gas sales |
998.7 | 237.6 | 1,236.3 | 930.3 | 167.0 | 1,097.3 | ||||||||||||||||||||||||||||||||
Purchased product sales |
9.6 | — | 9.6 | 24.1 | — | 24.1 | ||||||||||||||||||||||||||||||||
Royalties |
(99.6) | (61.1) | (160.7) | (106.5) | (44.4) | (150.9) | ||||||||||||||||||||||||||||||||
| Oil and gas revenue | 908.7 | 176.5 | 1,085.2 | 847.9 | 122.6 | 970.5 | ||||||||||||||||||||||||||||||||
| Commodity derivative gains (losses) | (79.1) | (28.5) | (107.6) | 163.5 | — | 163.5 | ||||||||||||||||||||||||||||||||
| Other income (loss) | 1.1 | (0.1) | 1.0 | 28.9 | — | 28.9 | ||||||||||||||||||||||||||||||||
| 830.7 | 147.9 | 978.6 | 1,040.3 | 122.6 | 1,162.9 | |||||||||||||||||||||||||||||||||
| EXPENSES | ||||||||||||||||||||||||||||||||||||||
| Operating | 214.2 | 28.1 | 242.3 | 162.9 | 22.1 | 185.0 | ||||||||||||||||||||||||||||||||
| Purchased product | 9.6 | — | 9.6 | 24.6 | — | 24.6 | ||||||||||||||||||||||||||||||||
| Transportation | 45.8 | 4.5 | 50.3 | 33.5 | 2.4 | 35.9 | ||||||||||||||||||||||||||||||||
| General and administrative | 16.5 | 0.6 | 17.1 | 20.6 | 0.8 | 21.4 | ||||||||||||||||||||||||||||||||
| Interest | 43.3 | — | 43.3 | 9.4 | — | 9.4 | ||||||||||||||||||||||||||||||||
| Foreign exchange (gain) loss | (2.3) | — | (2.3) | 7.8 | — | 7.8 | ||||||||||||||||||||||||||||||||
| Share-based compensation | 22.8 | 0.2 | 23.0 | 5.3 | (0.2) | 5.1 | ||||||||||||||||||||||||||||||||
| Depletion, depreciation and amortization | 248.9 | 72.0 | 320.9 | 207.2 | 40.0 | 247.2 | ||||||||||||||||||||||||||||||||
| Impairment | 45.4 | 728.4 | 773.8 | — | — | — | ||||||||||||||||||||||||||||||||
| Accretion and financing | 6.9 | 0.1 | 7.0 | 6.5 | 0.2 | 6.7 | ||||||||||||||||||||||||||||||||
| 651.1 | 833.9 | 1,485.0 | 477.8 | 65.3 | 543.1 | |||||||||||||||||||||||||||||||||
| Net income (loss) before tax | 179.6 | (686.0) | (506.4) | 562.5 | 57.3 | 619.8 | ||||||||||||||||||||||||||||||||
| Tax expense | ||||||||||||||||||||||||||||||||||||||
Current |
— | — | — | — | — | — | ||||||||||||||||||||||||||||||||
Deferred |
46.0 | 257.5 | 303.5 | 147.4 | 6.0 | 153.4 | ||||||||||||||||||||||||||||||||
| Net income (loss) | 133.6 | (943.5) | (809.9) | 415.1 | 51.3 | 466.4 | ||||||||||||||||||||||||||||||||
| CRESCENT POINT ENERGY CORP. | 2 |
||||
| Nine months ended September 30, 2023 | Nine months ended September 30, 2022 | |||||||||||||||||||||||||||||||||||||
| ($ millions) | Continuing | Discontinued | Total | Continuing (1) |
Discontinued (1) |
Total | ||||||||||||||||||||||||||||||||
| REVENUE AND OTHER INCOME | ||||||||||||||||||||||||||||||||||||||
Oil and gas sales |
2,552.3 | 547.2 | 3,099.5 | 2,982.8 | 493.7 | 3,476.5 | ||||||||||||||||||||||||||||||||
Purchased product sales |
45.6 | — | 45.6 | 73.7 | — | 73.7 | ||||||||||||||||||||||||||||||||
Royalties |
(269.4) | (139.8) | (409.2) | (343.4) | (126.6) | (470.0) | ||||||||||||||||||||||||||||||||
| Oil and gas revenue | 2,328.5 | 407.4 | 2,735.9 | 2,713.1 | 367.1 | 3,080.2 | ||||||||||||||||||||||||||||||||
| Commodity derivative losses | (29.2) | (28.5) | (57.7) | (446.1) | — | (446.1) | ||||||||||||||||||||||||||||||||
| Other income | 12.5 | 6.2 | 18.7 | 52.0 | — | 52.0 | ||||||||||||||||||||||||||||||||
| 2,311.8 | 385.1 | 2,696.9 | 2,319.0 | 367.1 | 2,686.1 | |||||||||||||||||||||||||||||||||
| EXPENSES | ||||||||||||||||||||||||||||||||||||||
| Operating | 566.0 | 71.9 | 637.9 | 467.9 | 66.3 | 534.2 | ||||||||||||||||||||||||||||||||
| Purchased product | 47.7 | — | 47.7 | 75.0 | — | 75.0 | ||||||||||||||||||||||||||||||||
| Transportation | 118.3 | 11.2 | 129.5 | 95.1 | 6.6 | 101.7 | ||||||||||||||||||||||||||||||||
| General and administrative | 77.2 | 1.7 | 78.9 | 59.8 | 2.2 | 62.0 | ||||||||||||||||||||||||||||||||
| Interest | 90.8 | — | 90.8 | 47.5 | — | 47.5 | ||||||||||||||||||||||||||||||||
| Foreign exchange (gain) loss | (9.5) | — | (9.5) | 14.6 | — | 14.6 | ||||||||||||||||||||||||||||||||
| Share-based compensation | 46.8 | 0.3 | 47.1 | 28.1 | 0.1 | 28.2 | ||||||||||||||||||||||||||||||||
| Depletion, depreciation and amortization | 646.8 | 170.3 | 817.1 | 601.8 | 104.6 | 706.4 | ||||||||||||||||||||||||||||||||
| Impairment (impairment reversal) | 45.4 | 728.4 | 773.8 | (1,413.6) | (71.3) | (1,484.9) | ||||||||||||||||||||||||||||||||
| Accretion and financing | 20.3 | 0.4 | 20.7 | 18.0 | 0.3 | 18.3 | ||||||||||||||||||||||||||||||||
| 1,649.8 | 984.2 | 2,634.0 | (5.8) | 108.8 | 103.0 | |||||||||||||||||||||||||||||||||
| Net income (loss) before tax | 662.0 | (599.1) | 62.9 | 2,324.8 | 258.3 | 2,583.1 | ||||||||||||||||||||||||||||||||
| Tax expense | ||||||||||||||||||||||||||||||||||||||
Current |
— | — | — | — | — | — | ||||||||||||||||||||||||||||||||
Deferred |
165.2 | 278.6 | 443.8 | 600.3 | 1.3 | 601.6 | ||||||||||||||||||||||||||||||||
| Net income (loss) | 496.8 | (877.7) | (380.9) | 1,724.5 | 257.0 | 1,981.5 | ||||||||||||||||||||||||||||||||
| Three months ended September 30 | Nine months ended September 30 | |||||||||||||||||||||||||||||||||||||
| 2023 | 2022 | % Change |
2023 | 2022 | % Change |
|||||||||||||||||||||||||||||||||
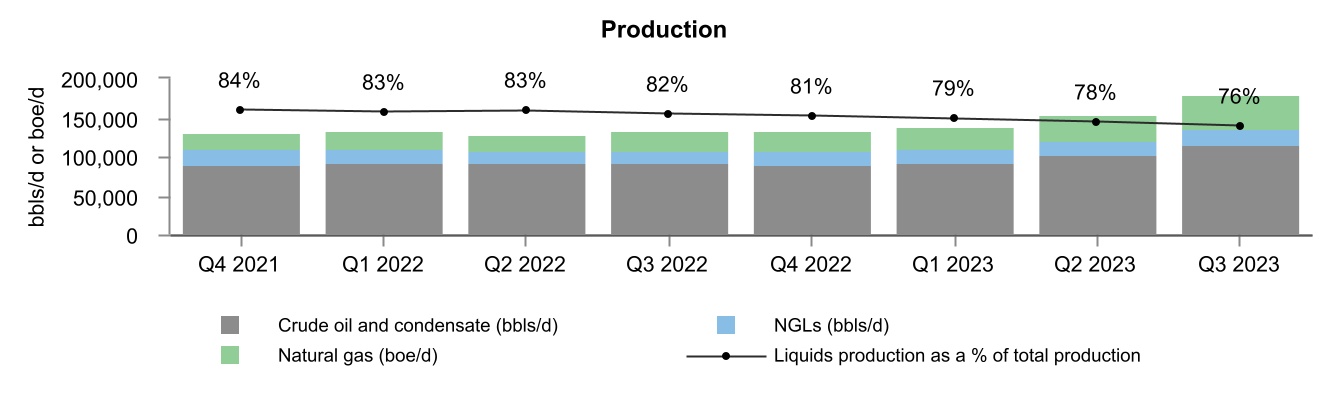
| Crude oil and condensate (bbls/d) | 114,997 | 91,762 | 25 | 103,094 | 91,989 | 12 | ||||||||||||||||||||||||||||||||
| NGLs (bbls/d) | 21,635 | 17,198 | 26 | 19,519 | 16,793 | 16 | ||||||||||||||||||||||||||||||||
Natural gas (mcf/d) |
263,694 | 144,356 | 83 | 215,012 | 137,277 | 57 | ||||||||||||||||||||||||||||||||
Total (boe/d) |
180,581 | 133,019 | 36 | 158,448 | 131,662 | 20 | ||||||||||||||||||||||||||||||||
| Crude oil and liquids (%) | 76 | 82 | (6) | 77 | 83 | (6) | ||||||||||||||||||||||||||||||||
Natural gas (%) |
24 | 18 | 6 | 23 | 17 | 6 | ||||||||||||||||||||||||||||||||
Total (%) |
100 | 100 | — | 100 | 100 | — | ||||||||||||||||||||||||||||||||
| Three months ended September 30 | Nine months ended September 30 | |||||||||||||||||||||||||||||||||||||
| Production By Area (boe/d) | 2023 | 2022 | % Change | 2023 | 2022 | % Change | ||||||||||||||||||||||||||||||||
Alberta |
88,694 | 47,661 | 86 | 70,287 | 43,598 | 61 | ||||||||||||||||||||||||||||||||
Saskatchewan |
61,045 | 66,382 | (8) | 62,908 | 69,842 | (10) | ||||||||||||||||||||||||||||||||
North Dakota (1) |
30,842 | 18,976 | 63 | 25,253 | 18,222 | 39 | ||||||||||||||||||||||||||||||||
Total |
180,581 | 133,019 | 36 | 158,448 | 131,662 | 20 | ||||||||||||||||||||||||||||||||
| CRESCENT POINT ENERGY CORP. | 3 |
||||
| Three months ended September 30 | Nine months ended September 30 | |||||||||||||||||||||||||||||||||||||
Average Selling Prices (1) |
2023 | 2022 | % Change | 2023 | 2022 | % Change |
||||||||||||||||||||||||||||||||
| Crude oil and condensate ($/bbl) | 105.24 | 111.46 | (6) | 97.72 | 119.81 | (18) | ||||||||||||||||||||||||||||||||
NGLs ($/bbl) |
27.45 | 43.83 | (37) | 30.40 | 47.33 | (36) | ||||||||||||||||||||||||||||||||
Natural gas ($/mcf) |
2.81 | 6.55 | (57) | 3.19 | 6.69 | (52) | ||||||||||||||||||||||||||||||||
Total ($/boe) |
74.42 | 89.66 | (17) | 71.65 | 96.72 | (26) | ||||||||||||||||||||||||||||||||
| Three months ended September 30 | Nine months ended September 30 | |||||||||||||||||||||||||||||||||||||
Benchmark Pricing |
2023 | 2022 | % Change |
2023 | 2022 | % Change |
||||||||||||||||||||||||||||||||
Crude Oil Prices |
||||||||||||||||||||||||||||||||||||||
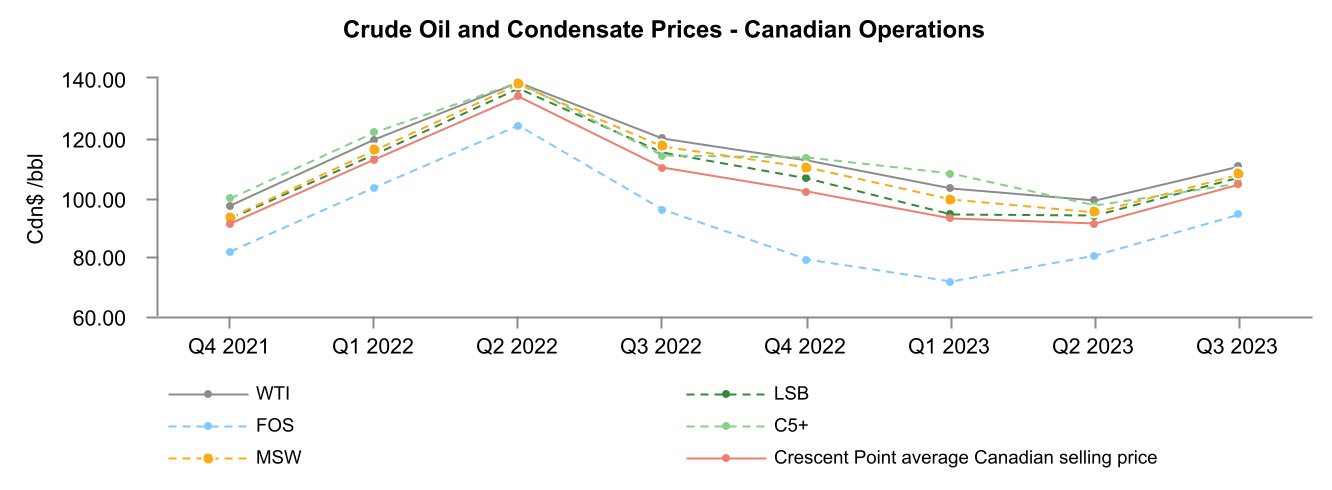
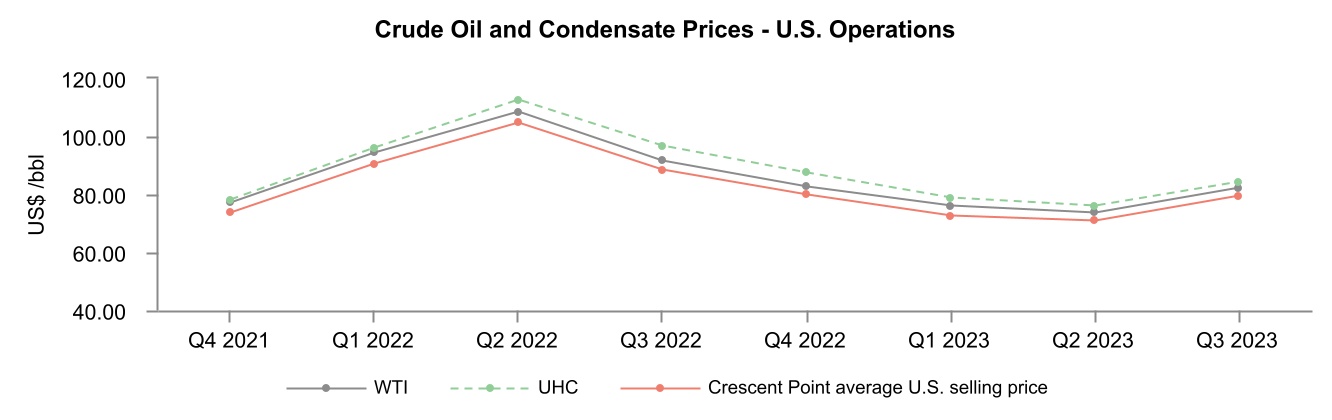
WTI crude oil (US$/bbl) (1) |
82.18 | 91.64 | (10) | 77.37 | 98.14 | (21) | ||||||||||||||||||||||||||||||||
WTI crude oil (Cdn$/bbl) |
110.16 | 119.63 | (8) | 104.13 | 125.82 | (17) | ||||||||||||||||||||||||||||||||
| Crude Oil and Condensate Differentials | ||||||||||||||||||||||||||||||||||||||
LSB crude oil (Cdn$/bbl) (2) |
(3.67) | (4.61) | (20) | (5.87) | (3.85) | 52 | ||||||||||||||||||||||||||||||||
FOS crude oil (Cdn$/bbl) (3) |
(15.99) | (23.72) | (33) | (21.83) | (18.13) | 20 | ||||||||||||||||||||||||||||||||
UHC crude oil (US$/bbl) (4) |
2.25 | 5.11 | (56) | 2.43 | 3.65 | (33) | ||||||||||||||||||||||||||||||||
MSW crude oil (Cdn$/bbl) (5) |
(2.48) | (2.62) | (5) | (3.50) | (2.35) | 49 | ||||||||||||||||||||||||||||||||
C5+ condensate (Cdn$/bbl) (6) |
(5.78) | (5.63) | 3 | (0.97) | (1.14) | (15) | ||||||||||||||||||||||||||||||||
Natural Gas Prices |
||||||||||||||||||||||||||||||||||||||
AECO daily spot natural gas (Cdn$/mcf) (7) |
2.59 | 4.16 | (38) | 2.76 | 5.38 | (49) | ||||||||||||||||||||||||||||||||
AECO monthly index natural gas (Cdn$/mcf) |
2.38 | 5.81 | (59) | 3.02 | 5.56 | (46) | ||||||||||||||||||||||||||||||||
NYMEX natural gas (US$/mmbtu) (8) |
2.55 | 8.18 | (69) | 2.69 | 6.77 | (60) | ||||||||||||||||||||||||||||||||
Foreign Exchange Rate |
||||||||||||||||||||||||||||||||||||||
Exchange rate (US$/Cdn$) |
0.746 | 0.766 | (3) | 0.743 | 0.780 | (5) | ||||||||||||||||||||||||||||||||
| CRESCENT POINT ENERGY CORP. | 4 |
||||
| CRESCENT POINT ENERGY CORP. | 5 |
||||
| CRESCENT POINT ENERGY CORP. | 6 |
||||
| Three months ended September 30 | Nine months ended September 30 | |||||||||||||||||||||||||||||||||||||
($ millions, except volume amounts) |
2023 | 2022 | % Change |
2023 | 2022 | % Change |
||||||||||||||||||||||||||||||||
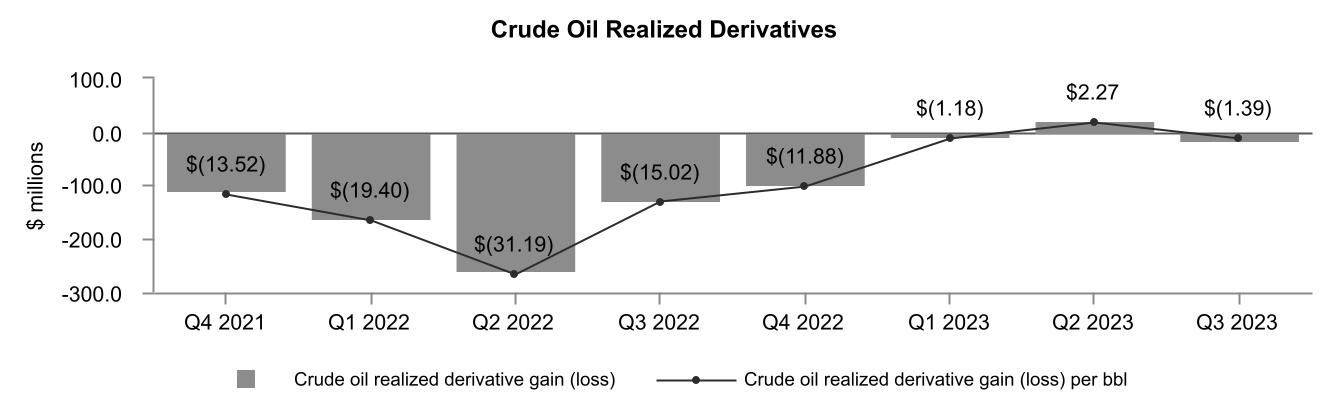
Average crude oil volumes hedged (bbls/d) (1) |
32,500 | 41,750 | (22) | 28,159 | 45,065 | (38) | ||||||||||||||||||||||||||||||||
Crude oil realized derivative loss (1) |
(14.7) | (126.8) | (88) | (3.6) | (548.1) | (99) | ||||||||||||||||||||||||||||||||
per bbl |
(1.39) | (15.02) | (91) | (0.13) | (21.83) | (99) | ||||||||||||||||||||||||||||||||
| Average NGL volumes hedged (bbls/d) | — | 500 | (100) | — | 500 | (100) | ||||||||||||||||||||||||||||||||
| NGL realized derivative loss | — | (0.2) | (100) | — | (1.2) | (100) | ||||||||||||||||||||||||||||||||
per bbl |
— | (0.09) | (100) | — | (0.26) | (100) | ||||||||||||||||||||||||||||||||
Average natural gas volumes hedged (GJ/d) (2) (3) |
34,000 | 30,000 | 13 | 32,681 | 31,642 | 3 | ||||||||||||||||||||||||||||||||
Natural gas realized derivative gain (3) |
5.3 | 6.8 | (22) | 12.1 | 3.1 | 290 | ||||||||||||||||||||||||||||||||
| per GJ | 0.22 | 0.51 | (57) | 0.21 | 0.08 | 163 | ||||||||||||||||||||||||||||||||
Average barrels of oil equivalent hedged (boe/d) (1) (3) |
37,871 | 46,989 | (19) | 33,322 | 50,563 | (34) | ||||||||||||||||||||||||||||||||
Total realized commodity derivative gains (losses) (1) (3) |
(9.4) | (120.2) | (92) | 8.5 | (546.2) | (102) | ||||||||||||||||||||||||||||||||
per boe |
(0.57) | (9.82) | (94) | 0.20 | (15.20) | (101) | ||||||||||||||||||||||||||||||||
| Three months ended September 30 | Nine months ended September 30 | |||||||||||||||||||||||||||||||||||||
($ millions) |
2023 | 2022 | % Change |
2023 | 2022 | % Change |
||||||||||||||||||||||||||||||||
| Crude oil | (97.2) | 269.0 | (136) | (62.0) | 78.4 | (179) | ||||||||||||||||||||||||||||||||
| NGLs | — | 0.6 | (100) | — | (0.1) | (100) | ||||||||||||||||||||||||||||||||
Natural gas |
(1.0) | 14.1 | (107) | (4.2) | 21.8 | (119) | ||||||||||||||||||||||||||||||||
| Total unrealized commodity derivative gains (losses) | (98.2) | 283.7 | (135) | (66.2) | 100.1 | (166) | ||||||||||||||||||||||||||||||||
| CRESCENT POINT ENERGY CORP. | 7 |
||||
| Three months ended September 30 | Nine months ended September 30 | |||||||||||||||||||||||||||||||||||||
($ millions) (1) |
2023 | 2022 | % Change |
2023 | 2022 | % Change |
||||||||||||||||||||||||||||||||
| Crude oil and condensate sales | 1,113.4 | 940.9 | 18 | 2,750.1 | 3,008.8 | (9) | ||||||||||||||||||||||||||||||||
NGL sales |
54.6 | 69.4 | (21) | 162.0 | 217.0 | (25) | ||||||||||||||||||||||||||||||||
Natural gas sales |
68.3 | 87.0 | (21) | 187.4 | 250.7 | (25) | ||||||||||||||||||||||||||||||||
Total oil and gas sales |
1,236.3 | 1,097.3 | 13 | 3,099.5 | 3,476.5 | (11) | ||||||||||||||||||||||||||||||||
| Three months ended September 30 | Nine months ended September 30 | |||||||||||||||||||||||||||||||||||||
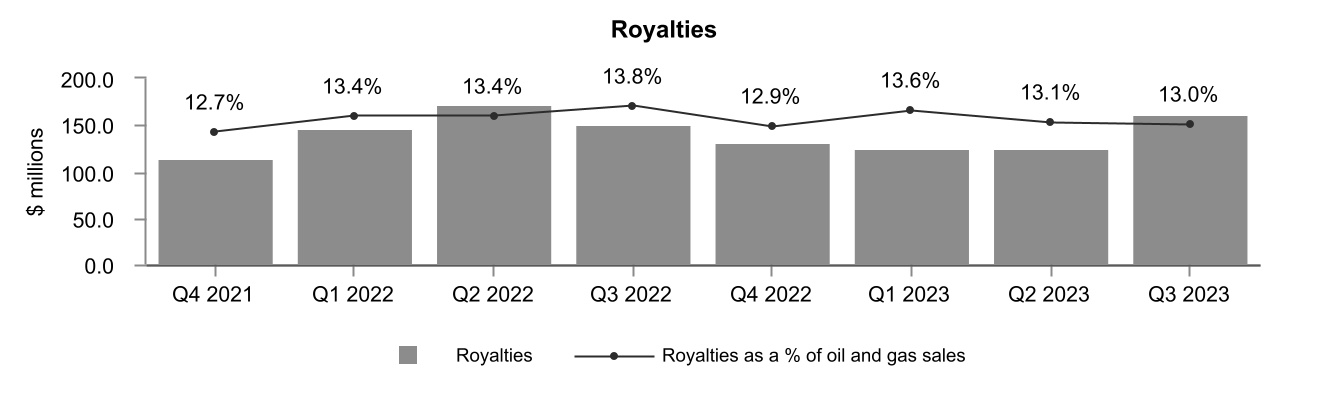
| ($ millions, except % and per boe amounts) | 2023 | 2022 | % Change | 2023 | 2022 | % Change | ||||||||||||||||||||||||||||||||
| Royalties | 160.7 | 150.9 | 6 | 409.2 | 470.0 | (13) | ||||||||||||||||||||||||||||||||
| As a % of oil and gas sales | 13.0 | 13.8 | (0.8) | 13.2 | 13.5 | (0.3) | ||||||||||||||||||||||||||||||||
| Per boe | 9.67 | 12.33 | (22) | 9.46 | 13.08 | (28) | ||||||||||||||||||||||||||||||||
| CRESCENT POINT ENERGY CORP. | 8 |
||||
| Three months ended September 30 | Nine months ended September 30 | |||||||||||||||||||||||||||||||||||||
($ millions, except per boe amounts) |
2023 | 2022 | % Change |
2023 | 2022 | % Change |
||||||||||||||||||||||||||||||||
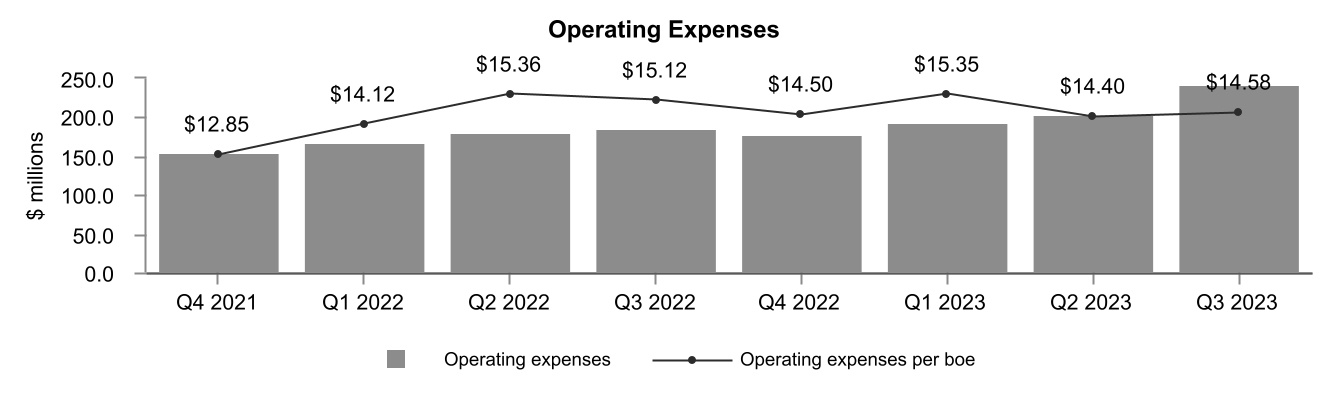
Operating expenses |
242.3 | 185.0 | 31 | 637.9 | 534.2 | 19 | ||||||||||||||||||||||||||||||||
Per boe |
14.58 | 15.12 | (4) | 14.75 | 14.86 | (1) | ||||||||||||||||||||||||||||||||
| Three months ended September 30 | Nine months ended September 30 | |||||||||||||||||||||||||||||||||||||
| ($ millions, except per boe amounts) | 2023 | 2022 | % Change | 2023 | 2022 | % Change | ||||||||||||||||||||||||||||||||
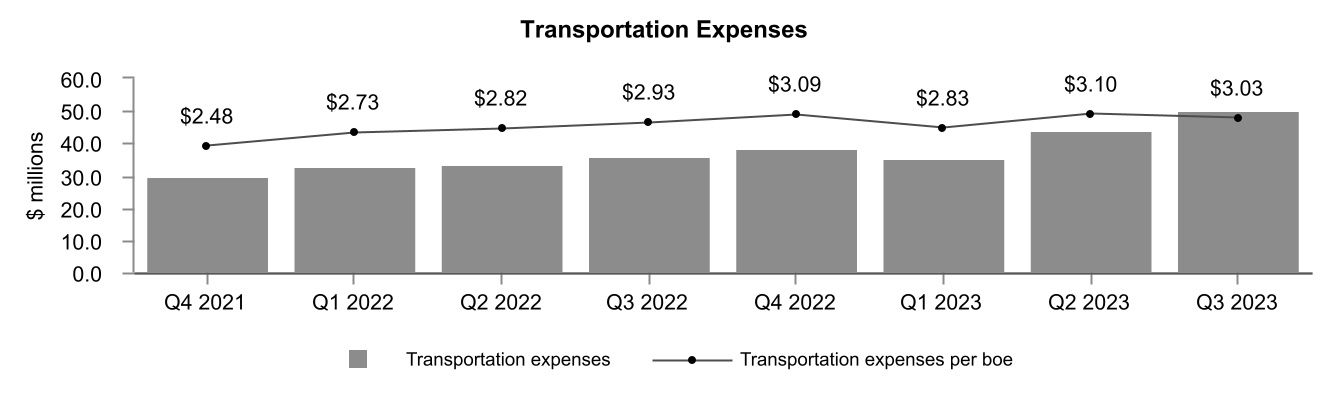
| Transportation expenses | 50.3 | 35.9 | 40 | 129.5 | 101.7 | 27 | ||||||||||||||||||||||||||||||||
| Per boe | 3.03 | 2.93 | 3 | 2.99 | 2.83 | 6 | ||||||||||||||||||||||||||||||||
| CRESCENT POINT ENERGY CORP. | 9 |
||||
| Three months ended September 30 | Nine months ended September 30 | |||||||||||||||||||||||||||||||||||||
| 2023 | 2022 | 2023 | 2022 | |||||||||||||||||||||||||||||||||||
|
Total (2)
($/boe)
|
Total (2)
($/boe)
|
% Change |
Total (2)
($/boe)
|
Total (2)
($/boe)
|
% Change |
|||||||||||||||||||||||||||||||||
| Oil and gas sales | 74.42 | 89.66 | (17) | 71.65 | 96.72 | (26) | ||||||||||||||||||||||||||||||||
Royalties |
(9.67) | (12.33) | (22) | (9.46) | (13.08) | (28) | ||||||||||||||||||||||||||||||||
Operating expenses |
(14.58) | (15.12) | (4) | (14.75) | (14.86) | (1) | ||||||||||||||||||||||||||||||||
Transportation expenses |
(3.03) | (2.93) | 3 | (2.99) | (2.83) | 6 | ||||||||||||||||||||||||||||||||
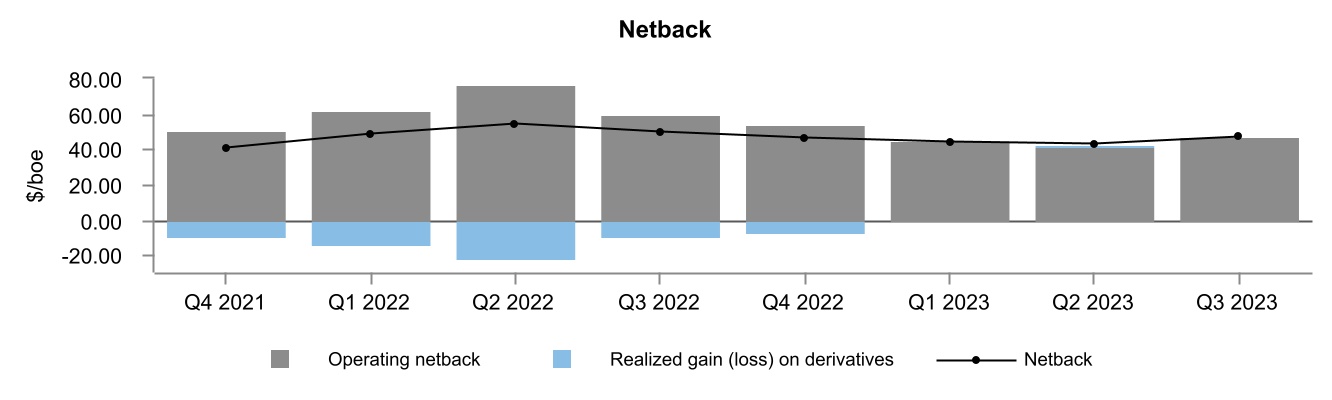
Operating netback (1) |
47.14 | 59.28 | (20) | 44.45 | 65.95 | (33) | ||||||||||||||||||||||||||||||||
| Realized gain (loss) on commodity derivatives | (0.57) | (9.82) | (94) | 0.20 | (15.20) | (101) | ||||||||||||||||||||||||||||||||
Netback (1) |
46.57 | 49.46 | (6) | 44.65 | 50.75 | (12) | ||||||||||||||||||||||||||||||||
| CRESCENT POINT ENERGY CORP. | 10 |
||||
| Three months ended September 30 | Nine months ended September 30 | |||||||||||||||||||||||||||||||||||||
($ millions, except per boe amounts) |
2023 | 2022 | % Change | 2023 | 2022 | % Change |
||||||||||||||||||||||||||||||||
| Gross general and administrative expenses | 32.2 | 35.2 | (9) | 122.1 | 102.2 | 19 | ||||||||||||||||||||||||||||||||
| Overhead recoveries | (5.7) | (5.7) | — | (15.0) | (15.1) | (1) | ||||||||||||||||||||||||||||||||
Capitalized |
(9.4) | (8.1) | 16 | (28.2) | (25.1) | 12 | ||||||||||||||||||||||||||||||||
Total general and administrative expenses |
17.1 | 21.4 | (20) | 78.9 | 62.0 | 27 | ||||||||||||||||||||||||||||||||
| Transaction costs | (0.3) | (2.9) | (90) | (16.7) | (3.3) | 406 | ||||||||||||||||||||||||||||||||
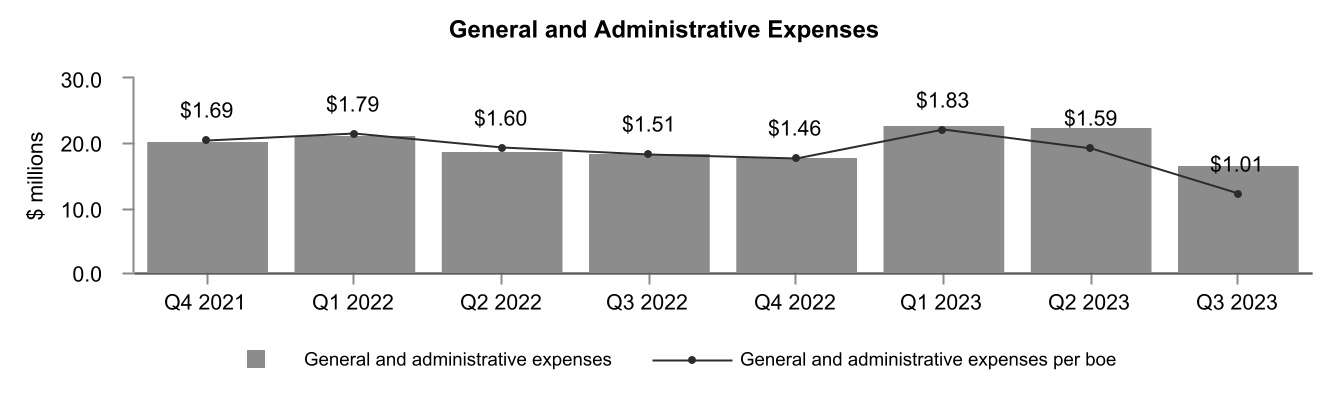
| General and administrative expenses | 16.8 | 18.5 | (9) | 62.2 | 58.7 | 6 | ||||||||||||||||||||||||||||||||
Per boe |
1.01 | 1.51 | (33) | 1.44 | 1.63 | (12) | ||||||||||||||||||||||||||||||||
| Three months ended September 30 | Nine months ended September 30 | |||||||||||||||||||||||||||||||||||||
($ millions, except per boe amounts) |
2023 | 2022 | % Change | 2023 | 2022 | % Change |
||||||||||||||||||||||||||||||||
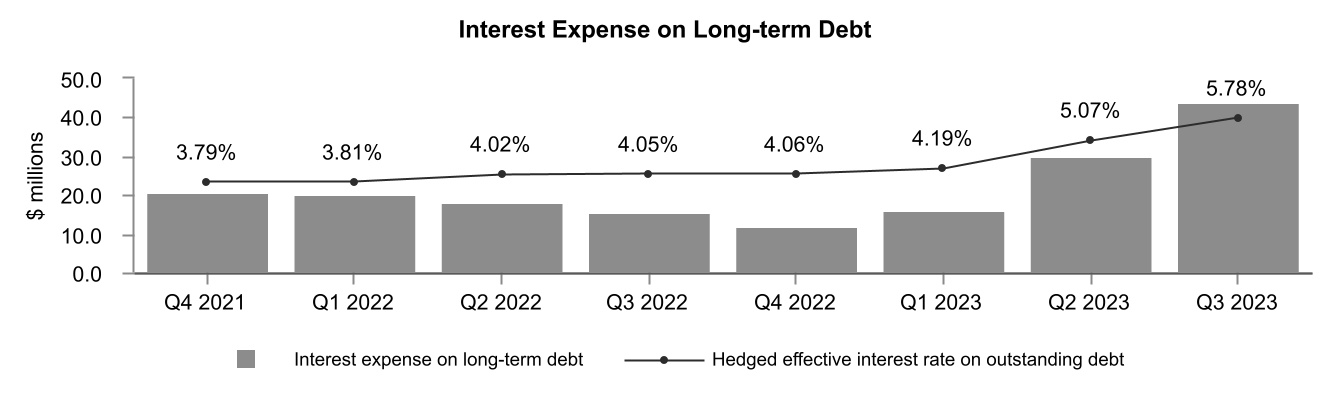
Interest expense on long-term debt |
43.8 | 15.3 | 186 | 89.7 | 53.1 | 69 | ||||||||||||||||||||||||||||||||
| Unrealized (gain) loss on interest derivative contracts | (0.5) | (5.9) | (92) | 1.1 | (5.6) | (120) | ||||||||||||||||||||||||||||||||
| Interest expense | 43.3 | 9.4 | 361 | 90.8 | 47.5 | 91 | ||||||||||||||||||||||||||||||||
Per boe |
2.61 | 0.77 | 239 | 2.10 | 1.32 | 59 | ||||||||||||||||||||||||||||||||
| CRESCENT POINT ENERGY CORP. | 11 |
||||
| Three months ended September 30 | Nine months ended September 30 | |||||||||||||||||||||||||||||||||||||
| ($ millions) | 2023 | 2022 | % Change | 2023 | 2022 | % Change | ||||||||||||||||||||||||||||||||
| Realized gain on CCS - principal | 6.8 | — | — | 95.9 | 63.8 | 50 | ||||||||||||||||||||||||||||||||
| Translation of US dollar long-term debt | (62.7) | (76.9) | (18) | (22.7) | (107.6) | (79) | ||||||||||||||||||||||||||||||||
| Unrealized gain (loss) on CCS - principal and foreign exchange swaps |
55.9 | 63.4 | (12) | (64.6) | 20.9 | (409) | ||||||||||||||||||||||||||||||||
| Other | 2.3 | 5.7 | (60) | 0.9 | 8.3 | (89) | ||||||||||||||||||||||||||||||||
| Foreign exchange gain (loss) | 2.3 | (7.8) | (129) | 9.5 | (14.6) | (165) | ||||||||||||||||||||||||||||||||
| Three months ended September 30 | Nine months ended September 30 | |||||||||||||||||||||||||||||||||||||
| ($ millions, except per boe amounts) | 2023 | 2022 | % Change | 2023 | 2022 | % Change | ||||||||||||||||||||||||||||||||
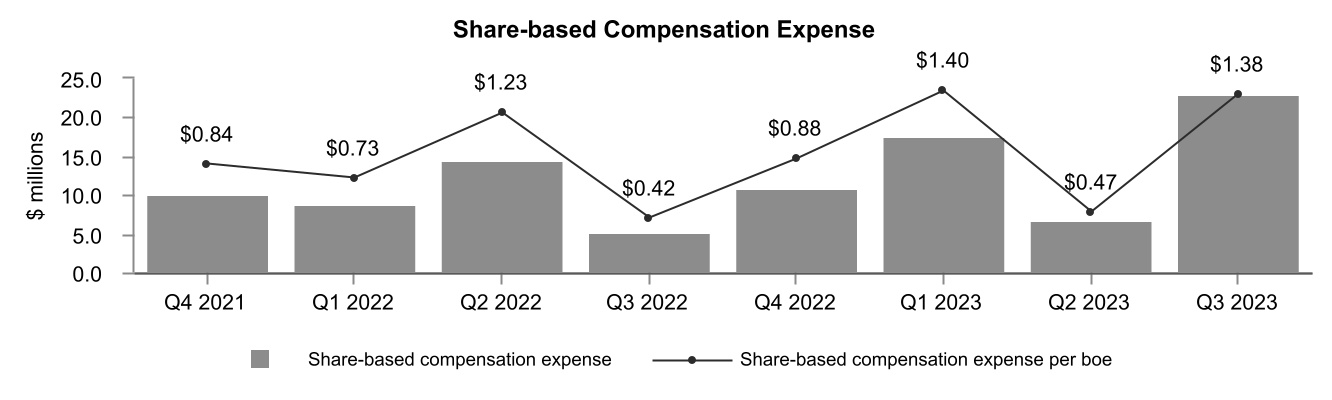
| Share-based compensation costs | 31.8 | 2.7 | 1,078 | 54.5 | 56.1 | (3) | ||||||||||||||||||||||||||||||||
| Realized (gain) loss on equity derivative contracts | 0.1 | (0.1) | (200) | (25.7) | (26.2) | (2) | ||||||||||||||||||||||||||||||||
| Unrealized (gain) loss on equity derivative contracts | (6.4) | 3.5 | (283) | 23.6 | 9.3 | 154 | ||||||||||||||||||||||||||||||||
| Capitalized | (2.5) | (1.0) | 150 | (5.3) | (11.0) | (52) | ||||||||||||||||||||||||||||||||
| Share-based compensation expense | 23.0 | 5.1 | 351 | 47.1 | 28.2 | 67 | ||||||||||||||||||||||||||||||||
| Per boe | 1.38 | 0.42 | 229 | 1.09 | 0.78 | 40 | ||||||||||||||||||||||||||||||||
| CRESCENT POINT ENERGY CORP. | 12 |
||||
| September 30, 2023 | December 31, 2022 | |||||||||||||
Restricted Share Bonus Plan (1) |
1,503,228 | 2,244,738 | ||||||||||||
| Employee Share Value Plan | 2,680,813 | 5,274,478 | ||||||||||||
Performance Share Unit Plan (2) |
3,437,085 | 2,713,176 | ||||||||||||
| Deferred Share Unit Plan | 1,656,128 | 1,745,879 | ||||||||||||
Stock Option Plan (3) |
3,258,721 | 3,889,130 | ||||||||||||
| Three months ended September 30 | Nine months ended September 30 | |||||||||||||||||||||||||||||||||||||
($ millions, except per boe amounts) |
2023 | 2022 | % Change |
2023 | 2022 | % Change |
||||||||||||||||||||||||||||||||
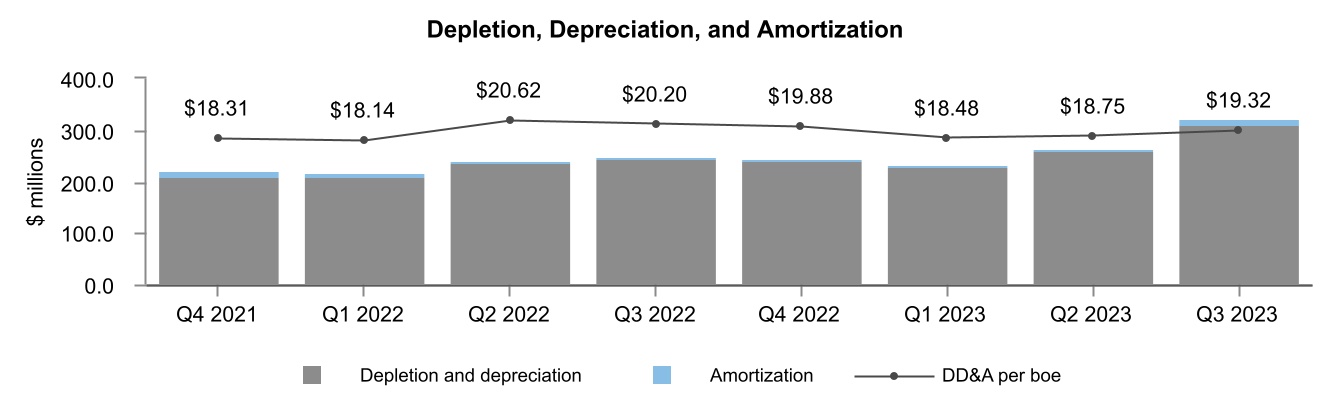
Depletion and depreciation |
309.9 | 246.0 | 26 | 798.2 | 694.0 | 15 | ||||||||||||||||||||||||||||||||
| Amortization of exploration and evaluation undeveloped land | 11.0 | 1.2 | 817 | 18.9 | 12.4 | 52 | ||||||||||||||||||||||||||||||||
| Depletion, depreciation and amortization | 320.9 | 247.2 | 30 | 817.1 | 706.4 | 16 | ||||||||||||||||||||||||||||||||
| Per boe | 19.32 | 20.20 | (4) | 18.89 | 19.65 | (4) | ||||||||||||||||||||||||||||||||
| CRESCENT POINT ENERGY CORP. | 13 |
||||
| Three months ended September 30 | Nine months ended September 30 | |||||||||||||||||||||||||||||||||||||
($ millions, except per boe amounts) |
2023 | 2022 | % Change |
2023 | 2022 | % Change |
||||||||||||||||||||||||||||||||
| Impairment (impairment reversal) | 773.8 | — | — | 773.8 | (1,484.9) | (152) | ||||||||||||||||||||||||||||||||
| Per boe | 46.58 | — | — | 17.89 | (41.31) | (143) | ||||||||||||||||||||||||||||||||
| Three months ended September 30 | Nine months ended September 30 | |||||||||||||||||||||||||||||||||||||
($ millions) |
2023 | 2022 | % Change |
2023 | 2022 | % Change |
||||||||||||||||||||||||||||||||
Current tax expense |
— | — | — | — | — | — | ||||||||||||||||||||||||||||||||
| Deferred tax expense | 303.5 | 153.4 | 98 | 443.8 | 601.6 | (26) | ||||||||||||||||||||||||||||||||
| CRESCENT POINT ENERGY CORP. | 14 |
||||
| Three months ended September 30 | Nine months ended September 30 | |||||||||||||||||||||||||||||||||||||
($ millions, except per share amounts) |
2023 | 2022 | % Change | 2023 | 2022 | % Change |
||||||||||||||||||||||||||||||||
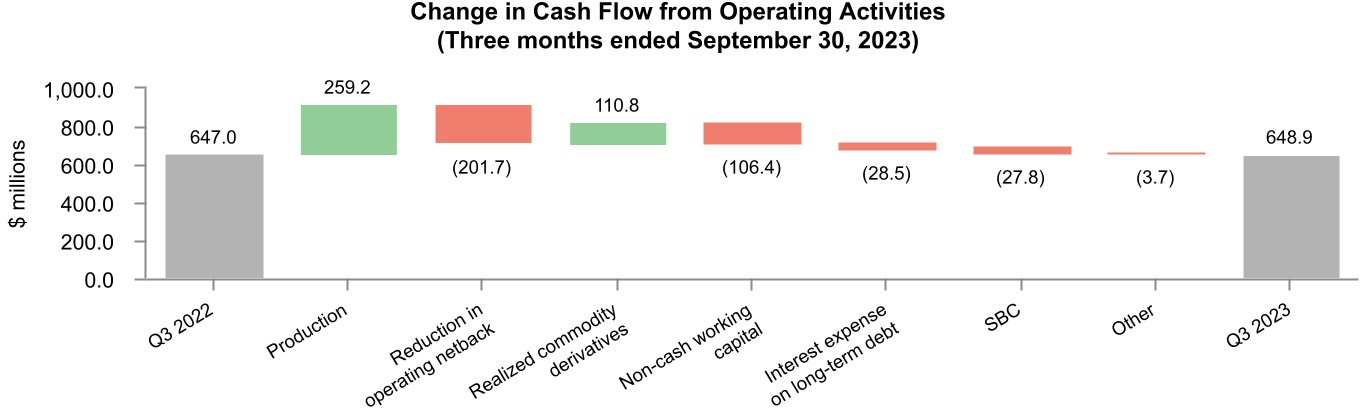
| Cash flow from operating activities from continuing operations | 537.1 | 530.5 | 1 | 1,272.8 | 1,321.2 | (4) | ||||||||||||||||||||||||||||||||
Cash flow from operating activities |
648.9 | 647.0 | — | 1,584.4 | 1,602.7 | (1) | ||||||||||||||||||||||||||||||||
Adjusted funds flow from continuing operations (1) |
548.6 | 479.1 | 15 | 1,440.6 | 1,417.7 | 2 | ||||||||||||||||||||||||||||||||
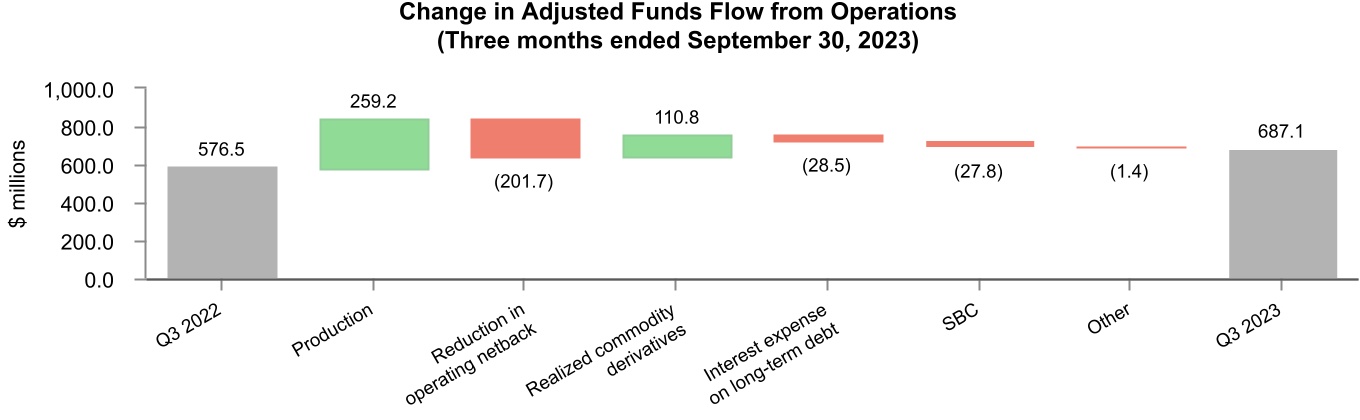
Adjusted funds flow from operations (1) |
687.1 | 576.5 | 19 | 1,764.6 | 1,709.6 | 3 | ||||||||||||||||||||||||||||||||
| Net income from continuing operations | 133.6 | 415.1 | (68) | 496.8 | 1,724.5 | (71) | ||||||||||||||||||||||||||||||||
| Net income from continuing operations per share - diluted | 0.25 | 0.73 | (66) | 0.92 | 2.99 | (69) | ||||||||||||||||||||||||||||||||
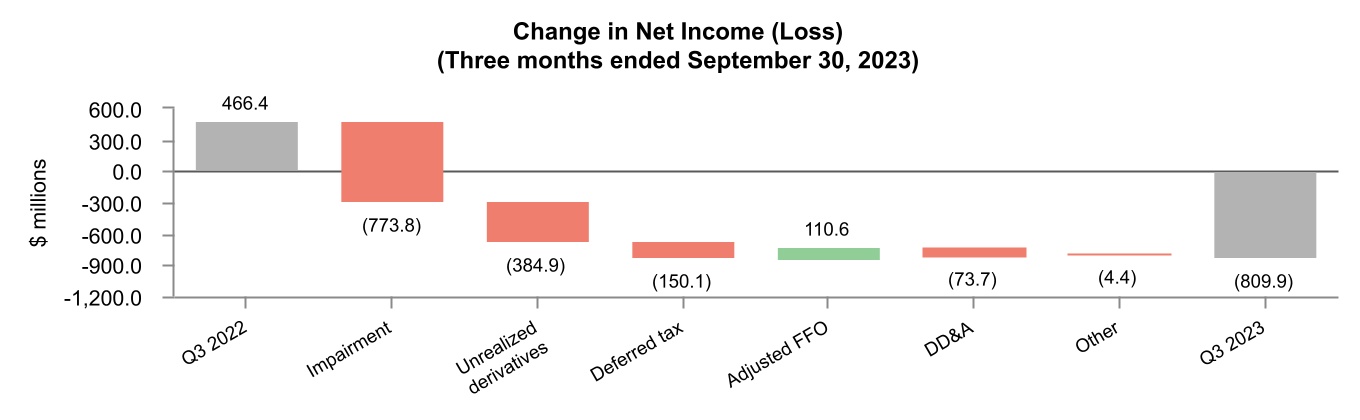
| Net income (loss) | (809.9) | 466.4 | (274) | (380.9) | 1,981.5 | (119) | ||||||||||||||||||||||||||||||||
| Net income (loss) per share - diluted | (1.52) | 0.82 | (285) | (0.70) | 3.44 | (120) | ||||||||||||||||||||||||||||||||
Adjusted net earnings from continuing operations (1) |
226.5 | 195.7 | 16 | 585.8 | 598.5 | (2) | ||||||||||||||||||||||||||||||||
Adjusted net earnings from continuing operations per share - diluted (1) |
0.42 | 0.35 | 20 | 1.08 | 1.04 | 4 | ||||||||||||||||||||||||||||||||
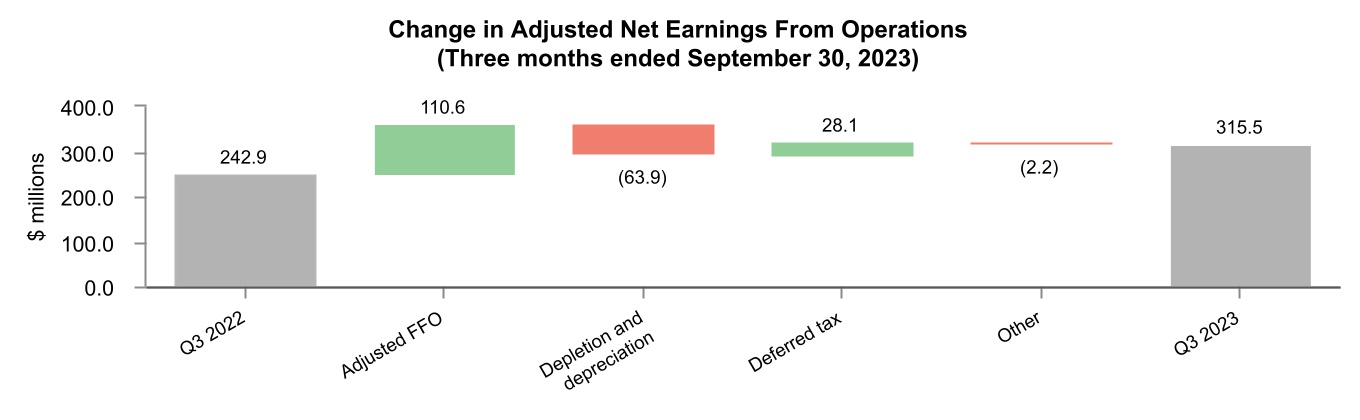
Adjusted net earnings from operations (1) |
315.5 | 242.9 | 30 | 739.8 | 755.9 | (2) | ||||||||||||||||||||||||||||||||
Adjusted net earnings from operations per share - diluted (1) |
0.59 | 0.43 | 37 | 1.36 | 1.31 | 4 | ||||||||||||||||||||||||||||||||
| CRESCENT POINT ENERGY CORP. | 15 |
||||
| CRESCENT POINT ENERGY CORP. | 16 |
||||
| Three months ended September 30 | Nine months ended September 30 | |||||||||||||||||||||||||||||||||||||
| ($ millions, except per share amounts) | 2023 | 2022 | % Change | 2023 | 2022 | % Change | ||||||||||||||||||||||||||||||||
| Cash flow from operating activities from discontinued operations | 111.8 | 116.5 | (4) | 311.6 | 281.5 | 11 | ||||||||||||||||||||||||||||||||
Adjusted funds flow from discontinued operations (1) |
138.5 | 97.4 | 42 | 324.0 | 291.9 | 11 | ||||||||||||||||||||||||||||||||
| Net income (loss) from discontinued operations | (943.5) | 51.3 | (1,939) | (877.7) | 257.0 | (442) | ||||||||||||||||||||||||||||||||
| Net income (loss) from discontinued operations per share - diluted | (1.77) | 0.09 | (2,067) | (1.62) | 0.45 | (460) | ||||||||||||||||||||||||||||||||
Adjusted net earnings from discontinued operations (1) |
89.0 | 47.2 | 89 | 154.0 | 157.4 | (2) | ||||||||||||||||||||||||||||||||
Adjusted net earnings from discontinued operations per share - diluted (1) |
0.17 | 0.08 | 113 | 0.28 | 0.27 | 4 | ||||||||||||||||||||||||||||||||
| CRESCENT POINT ENERGY CORP. | 17 |
||||
| Three months ended September 30 | Nine months ended September 30 | |||||||||||||||||||||||||||||||||||||
| 2023 | 2022 | 2023 | 2022 | |||||||||||||||||||||||||||||||||||
|
Total (2)
($/boe)
|
Total (2)
($/boe)
|
% Change |
Total (2)
($/boe)
|
Total (2)
($/boe)
|
% Change |
|||||||||||||||||||||||||||||||||
| Oil and gas sales | 83.74 | 95.66 | (12) | 79.37 | 99.25 | (20) | ||||||||||||||||||||||||||||||||
Royalties |
(21.53) | (25.43) | (15) | (20.28) | (25.45) | (20) | ||||||||||||||||||||||||||||||||
Operating expenses |
(9.90) | (12.66) | (22) | (10.43) | (13.33) | (22) | ||||||||||||||||||||||||||||||||
Transportation expenses |
(1.59) | (1.37) | 16 | (1.62) | (1.33) | 22 | ||||||||||||||||||||||||||||||||
Operating netback from discontinued operations (1) |
50.72 | 56.20 | (10) | 47.04 | 59.14 | (20) | ||||||||||||||||||||||||||||||||
| Realized loss on commodity derivatives | (1.59) | — | — | (0.65) | — | — | ||||||||||||||||||||||||||||||||
Netback from discontinued operations (1) |
49.13 | 56.20 | (13) | 46.39 | 59.14 | (22) | ||||||||||||||||||||||||||||||||
| Three months ended September 30 | Nine months ended September 30 | |||||||||||||||||||||||||||||||||||||
| ($ millions, except per share amounts) | 2023 | 2022 | % Change | 2023 | 2022 | % Change | ||||||||||||||||||||||||||||||||
| Dividends declared | 71.7 | 44.9 | 60 | 143.6 | 81.8 | 76 | ||||||||||||||||||||||||||||||||
| Dividends declared per share | 0.135 | 0.080 | 69 | 0.267 | 0.145 | 84 | ||||||||||||||||||||||||||||||||
| Three months ended September 30 | Nine months ended September 30 | |||||||||||||||||||||||||||||||||||||
($ millions) |
2023 | 2022 | % Change | 2023 | 2022 | % Change |
||||||||||||||||||||||||||||||||
Capital acquisitions |
1.1 | 88.2 | (99) | 2,075.8 | 89.4 | 2,222 | ||||||||||||||||||||||||||||||||
Capital dispositions |
(0.2) | (244.1) | (100) | (11.2) | (284.8) | (96) | ||||||||||||||||||||||||||||||||
Development capital expenditures |
315.5 | 308.5 | 2 | 859.8 | 709.7 | 21 | ||||||||||||||||||||||||||||||||
Land expenditures |
23.0 | 5.7 | 304 | 31.4 | 15.0 | 109 | ||||||||||||||||||||||||||||||||
Capitalized administration (1) |
11.9 | 9.1 | 31 | 33.4 | 35.9 | (7) | ||||||||||||||||||||||||||||||||
Corporate assets |
1.5 | 0.9 | 67 | 3.8 | 1.9 | 100 | ||||||||||||||||||||||||||||||||
Total |
352.8 | 168.3 | 110 | 2,993.0 | 567.1 | 428 | ||||||||||||||||||||||||||||||||
| CRESCENT POINT ENERGY CORP. | 18 |
||||
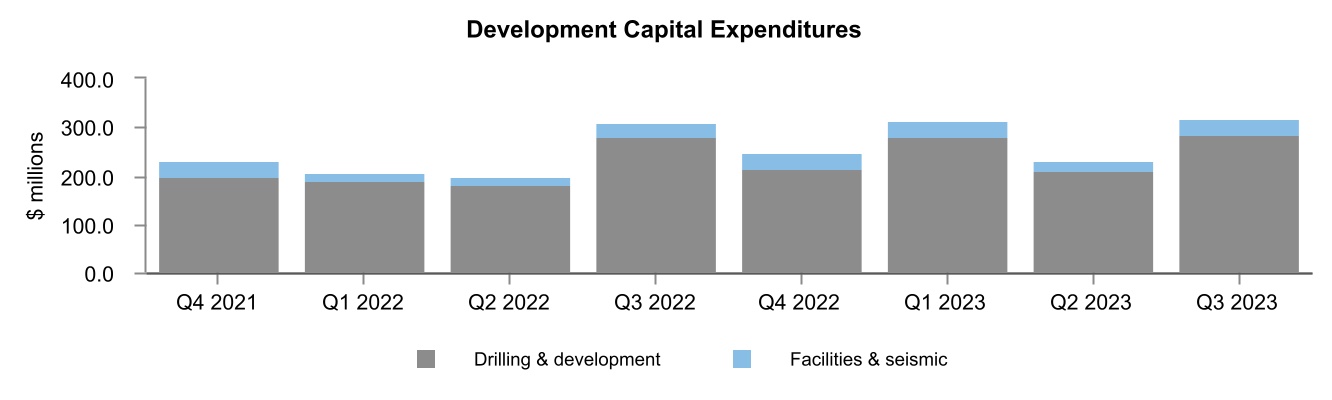
| CRESCENT POINT ENERGY CORP. | 19 |
||||
|
Capitalization Table
($ millions, except share, per share, ratio and percent amounts)
|
September 30, 2023 | December 31, 2022 | ||||||||||||
Net debt (1) |
2,876.2 | 1,154.7 | ||||||||||||
Shares outstanding |
526,485,998 | 550,888,983 | ||||||||||||
| Market price at end of period (per share) | 11.26 | 9.66 | ||||||||||||
| Market capitalization | 5,928.2 | 5,321.6 | ||||||||||||
Enterprise value (1) |
8,804.4 | 6,476.3 | ||||||||||||
Net debt as a percentage of enterprise value (1) |
33 | 18 | ||||||||||||
Adjusted funds flow from operations (1) (2) |
2,287.4 | 2,232.4 | ||||||||||||
Net debt to adjusted funds flow from operations (1) (3) |
1.3 | 0.5 | ||||||||||||
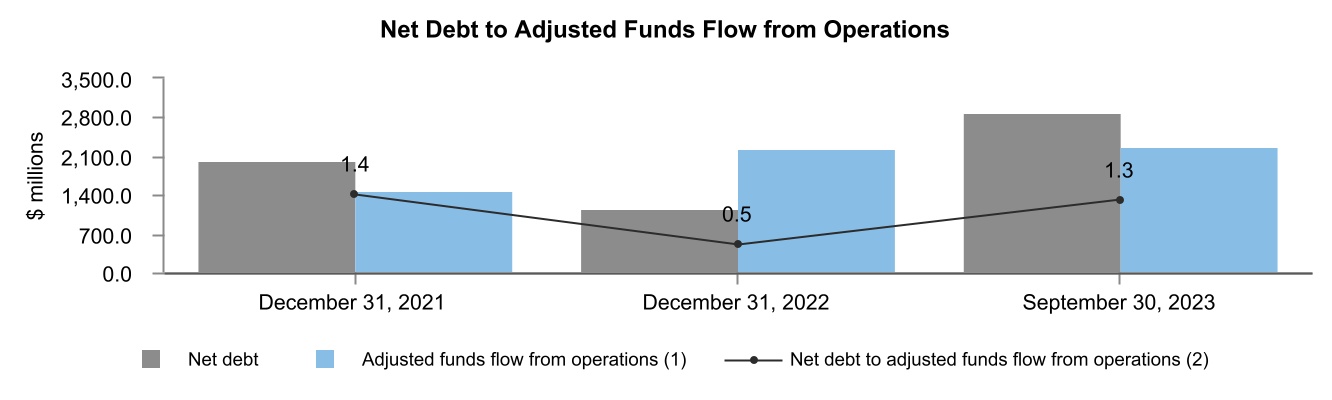
| CRESCENT POINT ENERGY CORP. | 20 |
||||
Covenant Description |
Maximum Ratio |
September 30, 2023 | ||||||||||||
Senior debt to adjusted EBITDA (1) (2) |
3.5 | 1.08 | ||||||||||||
Total debt to adjusted EBITDA (1) (3) |
4.0 | 1.08 | ||||||||||||
Senior debt to capital (2) (4) |
0.55 | 0.35 | ||||||||||||
| ($ millions) | 1 year | 2 to 3 years | 4 to 5 years | More than 5 years | Total | ||||||||||||||||||||||||||||||
Off balance sheet commitments |
|||||||||||||||||||||||||||||||||||
Operating (1) |
11.2 | 11.2 | 9.7 | 8.3 | 40.4 | ||||||||||||||||||||||||||||||
Gas processing (2) |
82.8 | 121.2 | 97.2 | 266.0 | 567.2 | ||||||||||||||||||||||||||||||
Transportation |
95.9 | 183.8 | 100.5 | 47.7 | 427.9 | ||||||||||||||||||||||||||||||
| Capital | 13.7 | 14.9 | — | — | 28.6 | ||||||||||||||||||||||||||||||
Total contractual commitments (3) |
203.6 | 331.1 | 207.4 | 322.0 | 1,064.1 | ||||||||||||||||||||||||||||||
| CRESCENT POINT ENERGY CORP. | 21 |
||||
| CRESCENT POINT ENERGY CORP. | 22 |
||||
| 2023 | 2022 | 2021 | |||||||||||||||||||||||||||||||||
| ($ millions, except per share amounts) | Q3 | Q2 | Q1 | Q4 | Q3 | Q2 | Q1 | Q4 | |||||||||||||||||||||||||||
| Oil and gas sales | 1,236.3 | 949.6 | 913.6 | 1,016.6 | 1,097.3 | 1,286.5 | 1,092.7 | 900.4 | |||||||||||||||||||||||||||
| Average daily production | |||||||||||||||||||||||||||||||||||
| Crude oil and condensate (bbls/d) | 114,997 | 101,347 | 92,695 | 90,759 | 91,762 | 91,250 | 92,971 | 88,544 | |||||||||||||||||||||||||||
| NGLs (bbls/d) | 21,635 | 18,911 | 17,970 | 17,770 | 17,198 | 16,139 | 17,039 | 20,884 | |||||||||||||||||||||||||||
| Natural gas (mcf/d) | 263,694 | 208,640 | 171,692 | 153,572 | 144,356 | 130,724 | 136,667 | 125,871 | |||||||||||||||||||||||||||
| Total (boe/d) | 180,581 | 155,031 | 139,280 | 134,124 | 133,019 | 129,176 | 132,788 | 130,407 | |||||||||||||||||||||||||||
Net income (loss) from continuing operations (1) |
133.6 | 178.4 | 184.8 | (577.8) | 415.1 | 279.6 | 1,029.8 | 217.1 | |||||||||||||||||||||||||||
Net income (loss) from continuing operations per share (1) |
0.25 | 0.33 | 0.33 | (1.04) | 0.74 | 0.49 | 1.78 | 0.37 | |||||||||||||||||||||||||||
Net income (loss) from continuing operations per share – diluted (1) |
0.25 | 0.33 | 0.33 | (1.04) | 0.73 | 0.49 | 1.77 | 0.37 | |||||||||||||||||||||||||||
Net income (loss) |
(809.9) | 212.3 | 216.7 | (498.1) | 466.4 | 331.5 | 1,183.6 | 121.6 | |||||||||||||||||||||||||||
| Net income (loss) per share | (1.52) | 0.39 | 0.39 | (0.90) | 0.83 | 0.58 | 2.05 | 0.21 | |||||||||||||||||||||||||||
| Net income (loss) per share – diluted | (1.52) | 0.39 | 0.39 | (0.90) | 0.82 | 0.58 | 2.03 | 0.21 | |||||||||||||||||||||||||||
Adjusted net earnings from operations (2) |
315.5 | 205.4 | 218.9 | 209.8 | 242.9 | 272.1 | 240.9 | 160.0 | |||||||||||||||||||||||||||
Adjusted net earnings from operations per share (2) |
0.59 | 0.38 | 0.40 | 0.38 | 0.43 | 0.48 | 0.42 | 0.27 | |||||||||||||||||||||||||||
Adjusted net earnings from operations per share – diluted (2) |
0.59 | 0.38 | 0.40 | 0.38 | 0.43 | 0.47 | 0.41 | 0.27 | |||||||||||||||||||||||||||
| Cash flow from operating activities | 648.9 | 462.1 | 473.4 | 589.5 | 647.0 | 529.6 | 426.1 | 492.4 | |||||||||||||||||||||||||||
Adjusted funds flow from operations (2) |
687.1 | 552.6 | 524.9 | 522.8 | 576.5 | 599.1 | 534.0 | 432.5 | |||||||||||||||||||||||||||
Adjusted working capital surplus (deficiency) (2) |
(45.7) | (82.5) | (79.9) | 95.1 | 47.9 | (40.9) | (91.8) | (201.6) | |||||||||||||||||||||||||||
| Total assets | 10,371.0 | 11,277.2 | 9,759.6 | 9,486.4 | 10,437.6 | 10,279.4 | 10,412.5 | 9,171.2 | |||||||||||||||||||||||||||
| Total liabilities | 4,660.6 | 4,597.5 | 3,113.8 | 2,993.0 | 3,224.6 | 3,501.3 | 3,901.2 | 3,765.9 | |||||||||||||||||||||||||||
Net debt (2) |
2,876.2 | 3,000.7 | 1,436.3 | 1,154.7 | 1,198.3 | 1,467.9 | 1,775.2 | 2,005.0 | |||||||||||||||||||||||||||
| Weighted average shares – diluted (millions) | 536.9 | 545.3 | 552.7 | 559.2 | 567.4 | 575.9 | 582.7 | 587.7 | |||||||||||||||||||||||||||
| Capital acquisitions | 1.1 | 1,702.7 | 372.0 | 1.3 | 88.2 | 0.3 | 0.9 | 5.2 | |||||||||||||||||||||||||||
| Capital dispositions | (0.2) | (8.4) | (2.6) | 1.2 | (244.1) | (37.8) | (2.9) | (0.1) | |||||||||||||||||||||||||||
| Development capital expenditures | 315.5 | 230.1 | 314.2 | 246.4 | 308.5 | 196.9 | 204.3 | 229.5 | |||||||||||||||||||||||||||
| Dividends declared | 71.7 | 54.8 | 17.1 | 118.8 | 44.9 | 37.1 | (0.2) | 26.0 | |||||||||||||||||||||||||||
| Dividends declared per share | 0.135 | 0.100 | 0.032 | 0.215 | 0.080 | 0.065 | — | 0.045 | |||||||||||||||||||||||||||
| CRESCENT POINT ENERGY CORP. | 23 |
||||
| CRESCENT POINT ENERGY CORP. | 24 |
||||
Prior (1) |
Revised (2) |
|||||||||||||
Total Annual Average Production (boe/d) (3) |
160,000 - 166,000 | 156,000 - 161,000 | ||||||||||||
| Capital Expenditures | ||||||||||||||
| Development capital expenditures ($ millions) | $1,150 - $1,250 | $1,050 - $1,150 | ||||||||||||
| Capitalized administration ($ millions) | $40 | $40 | ||||||||||||
Total ($ millions) (4) |
$1,190 - $1,290 | $1,090 - $1,190 | ||||||||||||
| Other Information for 2023 Guidance | ||||||||||||||
Reclamation activities ($ millions) (5) |
$40 | $40 | ||||||||||||
| Capital lease payments ($ millions) | $20 | $20 | ||||||||||||
| Annual operating expenses ($/boe) | $13.75 - $14.75 | $13.75 - $14.75 | ||||||||||||
| Royalties | 13.25% - 13.75% | 12.25% - 12.75% | ||||||||||||
Base Dividend |
||||||||
Current quarterly base dividend per share |
$0.10 | |||||||
Total Return of Capital (1) |
||||||||
| % of excess cash flow | ~60% | |||||||
| CRESCENT POINT ENERGY CORP. | 25 |
||||
| Three months ended September 30 | Nine months ended September 30 | |||||||||||||||||||||||||||||||||||||
($ millions) |
2023 | 2022 | % Change | 2023 | 2022 | % Change | ||||||||||||||||||||||||||||||||
| Oil and gas sales | 998.7 | 930.3 | 7 | 2,552.3 | 2,982.8 | (14) | ||||||||||||||||||||||||||||||||
| Royalties | (99.6) | (106.5) | (6) | (269.4) | (343.4) | (22) | ||||||||||||||||||||||||||||||||
| Operating expenses | (214.2) | (162.9) | 31 | (566.0) | (467.9) | 21 | ||||||||||||||||||||||||||||||||
| Transportation expenses | (45.8) | (33.5) | 37 | (118.3) | (95.1) | 24 | ||||||||||||||||||||||||||||||||
| Total operating netback from continuing operations | 639.1 | 627.4 | 2 | 1,598.6 | 2,076.4 | (23) | ||||||||||||||||||||||||||||||||
| Realized gain (loss) on commodity derivatives | (4.9) | (120.2) | (96) | 13.0 | (546.2) | (102) | ||||||||||||||||||||||||||||||||
| Total netback from continuing operations | 634.2 | 507.2 | 25 | 1,611.6 | 1,530.2 | 5 | ||||||||||||||||||||||||||||||||
| Three months ended September 30 | Nine months ended September 30 | |||||||||||||||||||||||||||||||||||||
($ millions) (1) |
2023 | 2022 | % Change | 2023 | 2022 | % Change | ||||||||||||||||||||||||||||||||
| Oil and gas sales | 237.6 | 167.0 | 42 | 547.2 | 493.7 | 11 | ||||||||||||||||||||||||||||||||
| Royalties | (61.1) | (44.4) | 38 | (139.8) | (126.6) | 10 | ||||||||||||||||||||||||||||||||
| Operating expenses | (28.1) | (22.1) | 27 | (71.9) | (66.3) | 8 | ||||||||||||||||||||||||||||||||
| Transportation expenses | (4.5) | (2.4) | 88 | (11.2) | (6.6) | 70 | ||||||||||||||||||||||||||||||||
| Total operating netback from discontinued operations | 143.9 | 98.1 | 47 | 324.3 | 294.2 | 10 | ||||||||||||||||||||||||||||||||
| Realized loss on commodity derivatives | (4.5) | — | — | (4.5) | — | — | ||||||||||||||||||||||||||||||||
| Total netback from discontinued operations | 139.4 | 98.1 | 42 | 319.8 | 294.2 | 9 | ||||||||||||||||||||||||||||||||
| Three months ended September 30 | Nine months ended September 30 | |||||||||||||||||||||||||||||||||||||
($ millions) |
2023 | 2022 | % Change | 2023 | 2022 | % Change | ||||||||||||||||||||||||||||||||
| Total operating netback from continuing operations | 639.1 | 627.4 | 2 | 1,598.6 | 2,076.4 | (23) | ||||||||||||||||||||||||||||||||
| Total operating netback from discontinued operations | 143.9 | 98.1 | 47 | 324.3 | 294.2 | 10 | ||||||||||||||||||||||||||||||||
| Total operating netback | 783.0 | 725.5 | 8 | 1,922.9 | 2,370.6 | (19) | ||||||||||||||||||||||||||||||||
| Three months ended September 30 | Nine months ended September 30 | |||||||||||||||||||||||||||||||||||||
($ millions) |
2023 | 2022 | % Change | 2023 | 2022 | % Change | ||||||||||||||||||||||||||||||||
| Total netback from continuing operations | 634.2 | 507.2 | 25 | 1,611.6 | 1,530.2 | 5 | ||||||||||||||||||||||||||||||||
| Total netback from discontinued operations | 139.4 | 98.1 | 42 | 319.8 | 294.2 | 9 | ||||||||||||||||||||||||||||||||
| Total netback | 773.6 | 605.3 | 28 | 1,931.4 | 1,824.4 | 6 | ||||||||||||||||||||||||||||||||
| CRESCENT POINT ENERGY CORP. | 26 |
||||
| Three months ended September 30 | Nine months ended September 30 | |||||||||||||||||||||||||||||||||||||
($ millions) |
2023 | 2022 | % Change | 2023 | 2022 | % Change | ||||||||||||||||||||||||||||||||
Dividends declared (1) |
71.7 | 44.9 | 60 | 143.6 | 81.8 | 76 | ||||||||||||||||||||||||||||||||
Dividend timing adjustment (2) |
0.1 | — | — | 55.2 | 26.1 | 111 | ||||||||||||||||||||||||||||||||
| Special dividends | (18.8) | — | — | (36.3) | — | — | ||||||||||||||||||||||||||||||||
| Base dividends | 53.0 | 44.9 | 18 | 162.5 | 107.9 | 51 | ||||||||||||||||||||||||||||||||
| Three months ended September 30 | Nine months ended September 30 | |||||||||||||||||||||||||||||||||||||
($ millions) |
2023 | 2022 (1) |
% Change | 2023 | 2022 (1) |
% Change |
||||||||||||||||||||||||||||||||
Cash flow from operating activities |
648.9 | 647.0 | — | 1,584.4 | 1,602.7 | (1) | ||||||||||||||||||||||||||||||||
Changes in non-cash working capital |
27.1 | (79.3) | (134) | 136.9 | 86.8 | 58 | ||||||||||||||||||||||||||||||||
Transaction costs |
0.3 | 2.9 | (90) | 16.7 | 3.3 | 406 | ||||||||||||||||||||||||||||||||
Decommissioning expenditures (2) |
10.8 | 5.9 | 83 | 26.6 | 16.8 | 58 | ||||||||||||||||||||||||||||||||
Adjusted funds flow from operations |
687.1 | 576.5 | 19 | 1,764.6 | 1,709.6 | 3 | ||||||||||||||||||||||||||||||||
| Capital expenditures | (351.9) | (324.2) | 9 | (928.4) | (762.5) | 22 | ||||||||||||||||||||||||||||||||
| Payments on lease liability | (5.6) | (5.1) | 10 | (16.2) | (15.3) | 6 | ||||||||||||||||||||||||||||||||
| Decommissioning expenditures | (10.8) | (5.9) | 83 | (26.6) | (16.8) | 58 | ||||||||||||||||||||||||||||||||
| Unrealized gain (loss) on equity derivative contracts | 6.4 | (3.5) | (283) | (23.6) | (9.3) | 154 | ||||||||||||||||||||||||||||||||
| Other items | (3.6) | (4.1) | (12) | (17.0) | (4.9) | 247 | ||||||||||||||||||||||||||||||||
| Excess cash flow | 321.6 | 233.7 | 38 | 752.8 | 900.8 | (16) | ||||||||||||||||||||||||||||||||
| Base dividends | (53.0) | (44.9) | 18 | (162.5) | (107.9) | 51 | ||||||||||||||||||||||||||||||||
| Discretionary excess cash flow | 268.6 | 188.8 | 42 | 590.3 | 792.9 | (26) | ||||||||||||||||||||||||||||||||
| CRESCENT POINT ENERGY CORP. | 27 |
||||
| Three months ended September 30 | Nine months ended September 30 | |||||||||||||||||||||||||||||||||||||
($ millions) |
2023 | 2022 | % Change | 2023 | 2022 | % Change | ||||||||||||||||||||||||||||||||
| Cash flow from operating activities from continuing operations | 537.1 | 530.5 | 1 | 1,272.8 | 1,321.2 | (4) | ||||||||||||||||||||||||||||||||
| Cash flow from operating activities from discontinued operations | 111.8 | 116.5 | (4) | 311.6 | 281.5 | 11 | ||||||||||||||||||||||||||||||||
| Cash flow from operating activities | 648.9 | 647.0 | — | 1,584.4 | 1,602.7 | (1) | ||||||||||||||||||||||||||||||||
| Three months ended September 30 | Nine months ended September 30 | |||||||||||||||||||||||||||||||||||||
($ millions) |
2023 | 2022 | % Change | 2023 | 2022 | % Change | ||||||||||||||||||||||||||||||||
| Adjusted funds flow from continuing operations | 548.6 | 479.1 | 15 | 1,440.6 | 1,417.7 | 2 | ||||||||||||||||||||||||||||||||
| Adjusted funds flow from discontinued operations | 138.5 | 97.4 | 42 | 324.0 | 291.9 | 11 | ||||||||||||||||||||||||||||||||
| Adjusted funds flow from operations | 687.1 | 576.5 | 19 | 1,764.6 | 1,709.6 | 3 | ||||||||||||||||||||||||||||||||
| ($ millions) | September 30, 2023 | December 31, 2022 | % Change | |||||||||||||||||
Accounts payable and accrued liabilities (1) |
510.2 | 448.2 | 14 | |||||||||||||||||
| Dividends payable | 53.1 | 99.4 | (47) | |||||||||||||||||
Long-term compensation liability (2) |
76.4 | 59.2 | 29 | |||||||||||||||||
| Cash | (45.6) | (289.9) | (84) | |||||||||||||||||
| Accounts receivable | (472.9) | (327.8) | 44 | |||||||||||||||||
Prepaids and deposits (3) |
(75.5) | (84.2) | (10) | |||||||||||||||||
| Adjusted working capital (surplus) deficiency | 45.7 | (95.1) | (148) | |||||||||||||||||
| ($ millions) | September 30, 2023 | December 31, 2022 | % Change | |||||||||||||||||
Long-term debt (1) |
2,947.9 | 1,441.5 | 105 | |||||||||||||||||
| Adjusted working capital (surplus) deficiency | 45.7 | (95.1) | (148) | |||||||||||||||||
| Unrealized foreign exchange on translation of hedged US dollar long-term debt | (117.4) | (191.7) | (39) | |||||||||||||||||
| Net debt | 2,876.2 | 1,154.7 | 149 | |||||||||||||||||
| CRESCENT POINT ENERGY CORP. | 28 |
||||
| Three months ended September 30 | Nine months ended September 30 | |||||||||||||||||||||||||||||||||||||
($ millions) |
2023 | 2022 | % Change |
2023 | 2022 | % Change |
||||||||||||||||||||||||||||||||
| Net income (loss) | (809.9) | 466.4 | (274) | (380.9) | 1,981.5 | (119) | ||||||||||||||||||||||||||||||||
Amortization of E&E undeveloped land |
11.0 | 1.2 | 817 | 18.9 | 12.4 | 52 | ||||||||||||||||||||||||||||||||
| Impairment (impairment reversal) | 773.8 | — | — | 773.8 | (1,484.9) | (152) | ||||||||||||||||||||||||||||||||
| Unrealized derivative (gains) losses | 35.4 | (349.5) | (110) | 155.5 | (117.3) | (233) | ||||||||||||||||||||||||||||||||
Unrealized foreign exchange (gain) loss on translation of US dollar long-term debt (1) |
55.9 | 76.9 | (27) | (73.2) | 43.8 | (267) | ||||||||||||||||||||||||||||||||
| Gain on capital dispositions | (0.1) | (23.3) | (100) | (4.2) | (26.1) | (84) | ||||||||||||||||||||||||||||||||
| Deferred tax adjustments | 249.4 | 71.2 | 250 | 249.9 | 346.5 | (28) | ||||||||||||||||||||||||||||||||
| Adjusted net earnings from operations | 315.5 | 242.9 | 30 | 739.8 | 755.9 | (2) | ||||||||||||||||||||||||||||||||
| Three months ended September 30 | Nine months ended September 30 | |||||||||||||||||||||||||||||||||||||
($ millions) |
2023 | 2022 | % Change | 2023 | 2022 | % Change | ||||||||||||||||||||||||||||||||
| Adjusted net earnings from continuing operations | 226.5 | 195.7 | 16 | 585.8 | 598.5 | (2) | ||||||||||||||||||||||||||||||||
| Adjusted net earnings from discontinued operations | 89.0 | 47.2 | 89 | 154.0 | 157.4 | (2) | ||||||||||||||||||||||||||||||||
| Adjusted net earnings from operations | 315.5 | 242.9 | 30 | 739.8 | 755.9 | (2) | ||||||||||||||||||||||||||||||||
| CRESCENT POINT ENERGY CORP. | 29 |
||||
|
l Crescent Point's approach to proactively manage the risk exposure inherent in movements in the price of crude oil, propane, natural gas, the Company's share price, the US/Cdn dollar exchange rate and interest rates through the use of derivatives with investment-grade counterparties;
l Return of capital framework, targeting the return of approximately 60 percent of excess cash flow;
l Crescent Point's use of derivatives to reduce the volatility of the selling price of its crude oil and natural gas production and how this provides a measure of stability to cash flow;
l The extent and effectiveness of hedges;
l Crescent Point's 2023 production and capital expenditures guidance, and other information forming part of the 2023 guidance;
|
l Crescent Point's return of capital outlook including dividend expectations and additional return of capital target to return up to 50% of discretionary excess cash flow to shareholders, in addition to the base dividend;
l The Company's liquidity and financial flexibility and ability to manage the impact of inflation and interest rates;
l Use of proceeds from the North Dakota disposition;
l Funding of ongoing working capital requirements;
l NCIB expectations; and
l Estimated undiscounted and uninflated cash flows to settle decommissioning liability.
|
||||
| CRESCENT POINT ENERGY CORP. | 30 |
||||
| Three months ended September 30 | Nine months ended September 30 | |||||||||||||||||||||||||
| 2023 | 2022 | 2023 | 2022 | |||||||||||||||||||||||
| Light & Medium Crude Oil (bbl/d) | 12,408 | 12,347 | 12,824 | 14,477 | ||||||||||||||||||||||
| Heavy Crude Oil (bbl/d) | 3,617 | 4,102 | 3,826 | 4,080 | ||||||||||||||||||||||
| Tight Oil (bbl/d) | 75,879 | 54,030 | 64,375 | 54,455 | ||||||||||||||||||||||
| Total Crude Oil (bbl/d) | 91,904 | 70,479 | 81,025 | 73,012 | ||||||||||||||||||||||
| NGLs (bbl/d) | 44,728 | 38,481 | 41,588 | 35,770 | ||||||||||||||||||||||
| Shale Gas (mcf/d) | 251,152 | 134,049 | 204,459 | 126,892 | ||||||||||||||||||||||
| Conventional Natural Gas (mcf/d) | 12,542 | 10,307 | 10,553 | 10,385 | ||||||||||||||||||||||
| Total Natural Gas (mcf/d) | 263,694 | 144,356 | 215,012 | 137,277 | ||||||||||||||||||||||
| Total (boe/d) | 180,581 | 133,019 | 158,448 | 131,662 | ||||||||||||||||||||||
| 2023 | 2022 | 2021 | ||||||||||||||||||||||||
| Q3 | Q2 | Q1 | Q4 | Q3 | Q2 | Q1 | Q4 | |||||||||||||||||||
| Light & Medium Crude Oil (bbl/d) | 12,408 | 13,190 | 12,879 | 13,671 | 12,347 | 15,752 | 15,365 | 15,517 | ||||||||||||||||||
| Heavy Crude Oil (bbl/d) | 3,617 | 3,857 | 4,010 | 3,870 | 4,102 | 4,103 | 4,034 | 4,226 | ||||||||||||||||||
| Tight Oil (bbl/d) | 75,879 | 63,812 | 53,184 | 52,095 | 54,030 | 53,521 | 55,837 | 55,965 | ||||||||||||||||||
| Total Crude Oil (bbl/d) | 91,904 | 80,859 | 70,073 | 69,636 | 70,479 | 73,376 | 75,236 | 75,708 | ||||||||||||||||||
| NGLs (bbl/d) | 44,728 | 39,399 | 40,592 | 38,893 | 38,481 | 34,013 | 34,774 | 33,720 | ||||||||||||||||||
| Shale Gas (mcf/d) | 251,152 | 199,781 | 161,459 | 142,803 | 134,049 | 119,924 | 126,622 | 115,482 | ||||||||||||||||||
| Conventional Natural Gas (mcf/d) | 12,542 | 8,859 | 10,233 | 10,769 | 10,307 | 10,800 | 10,045 | 10,389 | ||||||||||||||||||
| Total Natural Gas (mcf/d) | 263,694 | 208,640 | 171,692 | 153,572 | 144,356 | 130,724 | 136,667 | 125,871 | ||||||||||||||||||
| Total (boe/d) | 180,581 | 155,031 | 139,280 | 134,124 | 133,019 | 129,176 | 132,788 | 130,407 | ||||||||||||||||||
| CRESCENT POINT ENERGY CORP. | 31 |
||||
|
Directors
Barbara Munroe, Chair (6)
James Craddock (2) (3) (5)
John Dielwart (3) (4)
Mike Jackson (1) (5)
Jennifer Koury (2) (5)
Francois Langlois (1) (3) (4)
Myron Stadnyk (1) (2) (4)
Mindy Wight (1) (2)
Craig Bryksa (4)
(1) Member of the Audit Committee of the Board of Directors
(2) Member of the Human Resources and Compensation Committee of the Board of Directors
(3) Member of the Reserves Committee of the Board of Directors
(4) Member of the Environment, Safety and Sustainability Committee of the Board of Directors
(5) Member of the Corporate Governance and Nominating Committee
(6) Chair of the Board serves in an ex officio capacity on each Committee
Officers
Craig Bryksa
President and Chief Executive Officer
Ken Lamont
Chief Financial Officer
Ryan Gritzfeldt
Chief Operating Officer
Mark Eade
Senior Vice President, General Counsel and Corporate Secretary
Garret Holt
Senior Vice President, Strategy & Sustainability
Michael Politeski
Senior Vice President, Finance and Treasurer
Shelly Witwer
Senior Vice President, Business Development
Justin Foraie
Vice President, Operations and Marketing
Head Office
Suite 2000, 585 - 8th Avenue S.W.
Calgary, Alberta T2P 1G1
Tel: (403) 693-0020
Fax: (403) 693-0070
Toll Free: (888) 693-0020
Banker
The Bank of Nova Scotia
Calgary, Alberta
|
Auditor
PricewaterhouseCoopers LLP
Calgary, Alberta
Legal Counsel
Norton Rose Fulbright Canada LLP
Calgary, Alberta
Evaluation Engineers
McDaniel & Associates Consultants Ltd.
Calgary, Alberta
Registrar and Transfer Agent
Investors are encouraged to contact Crescent Point's Registrar and Transfer Agent for information regarding their security holdings:
Computershare Trust Company of Canada
600, 530 - 8th Avenue S.W.
Calgary, Alberta T2P 3S8
Tel: (403) 267-6800
Stock Exchanges
Toronto Stock Exchange - TSX
New York Stock Exchange - NYSE
Stock Symbol
CPG
Investor Contacts
Shant Madian
Vice President, Capital Markets
(403) 693-0020
Sarfraz Somani
Manager, Investor Relations
(403) 693-0020
|
|||||||
| CRESCENT POINT ENERGY CORP. | 32 |
||||