0001032033false
00010320332022-05-172022-05-170001032033us-gaap:CommonClassAMember2022-05-172022-05-170001032033us-gaap:NoncumulativePreferredStockMember2022-05-172022-05-17
UNITED STATES
SECURITIES AND EXCHANGE COMMISSION
Washington, D.C. 20549
FORM 8-K
CURRENT REPORT
Pursuant to Section 13 or 15(d) of the Securities Exchange Act of 1934
Date of Report (date of earliest event reported): May 17, 2022
SLM CORPORATION
(Exact name of registrant as specified in its charter)
|
|
|
|
|
|
|
|
|
|
|
|
|
|
|
Delaware |
001-13251 |
52-2013874 |
|
(State or other jurisdiction of incorporation or organization) |
(Commission File Number) |
(I.R.S. Employer Identification No.) |
|
|
|
|
|
|
|
|
300 Continental Drive |
Newark, |
Delaware |
19713 |
|
(Address of principal executive offices) |
(Zip Code) |
|
Registrant's telephone number, including area code: (302) 451-0200
(Former name or former address, if changed since last report)
Securities registered pursuant to Section 12(b) of the Act:
|
|
|
|
|
|
|
|
|
| Title of each class |
Trading Symbol(s) |
Name of each exchange on which registered |
| Common stock, par value $.20 per share |
SLM |
The NASDAQ Global Select Market |
| Floating Rate Non-Cumulative Preferred Stock, Series B, par value $.20 per share |
SLMBP |
The NASDAQ Global Select Market
|
Check the appropriate box below if the Form 8-K filing is intended to simultaneously satisfy the filing obligation of the registrant under any of the following provisions:
☐ Written communications pursuant to Rule 425 under the Securities Act (17 CFR 230.425)
☐ Soliciting material pursuant to Rule 14a-12 under the Exchange Act (17 CFR 240.14a-12)
☐ Pre-commencement communications pursuant to Rule 14d-2(b) under the Exchange Act (17 CFR 240.14d-2(b))
☐ Pre-commencement communications pursuant to Rule 13e-4(c) under the Exchange Act (17 CFR 240.13e-4(c))
Indicate by check mark whether the registrant is an emerging growth company as defined in Rule 405 of the Securities Act of 1933 (§230.405 of this chapter) or Rule 12b-2 of the Securities Exchange Act of 1934 (§240.12b-2 of this chapter).
Emerging growth company ☐
If an emerging growth company, indicate by check mark if the registrant has elected not to use the extended transition period for complying with any new or revised financial accounting standards provided pursuant to Section 13(a) of the Exchange Act. o ITEM 7.01 REGULATION FD DISCLOSURE.
SLM Corporation (the “Company”) frequently provides relevant information to its investors via posting to its corporate website. On or about May 17, 2022, a presentation entitled “Sallie Mae — Investor Presentation — Second Quarter 2022” was made available on the Company’s website at https://www.salliemae.com/investors/webcasts-and-presentations/. In addition, the document is being furnished herewith as Exhibit 99.1.
The presentation at Exhibit 99.1 and incorporated by reference herein is being furnished and shall not be deemed "filed" for the purposes of Section 18 of the Securities Exchange Act of 1934, as amended (the "Exchange Act"), or otherwise subject to the liabilities of that Section and shall not be incorporated by reference into any registration statement or other document pursuant to the Securities Act of 1933, as amended, or the Exchange Act, except as otherwise expressly stated in such filing.
ITEM 9.01 FINANCIAL STATEMENTS AND EXHIBITS.
(d) Exhibits
|
|
|
|
|
|
|
|
|
|
Exhibit
Number
|
|
Description |
|
|
|
| 99.1* |
|
|
|
|
|
| 104 |
|
Cover Page Interactive Data File (formatted as Inline XBRL) |
SIGNATURES
Pursuant to the requirements of the Securities Exchange Act of 1934, the registrant has duly caused this report to be signed on its behalf by the undersigned hereunto duly authorized.
|
|
|
|
|
|
|
|
|
|
|
SLM CORPORATION |
| Date: May 17, 2022 |
By: |
/s/ STEVEN J. MCGARRY |
|
|
Steven J. McGarry |
|
|
Executive Vice President and Chief Financial Officer |
EX-99.1
2
slmip05172022.htm
EX-99.1
slmip05172022

Exhibit 99.1
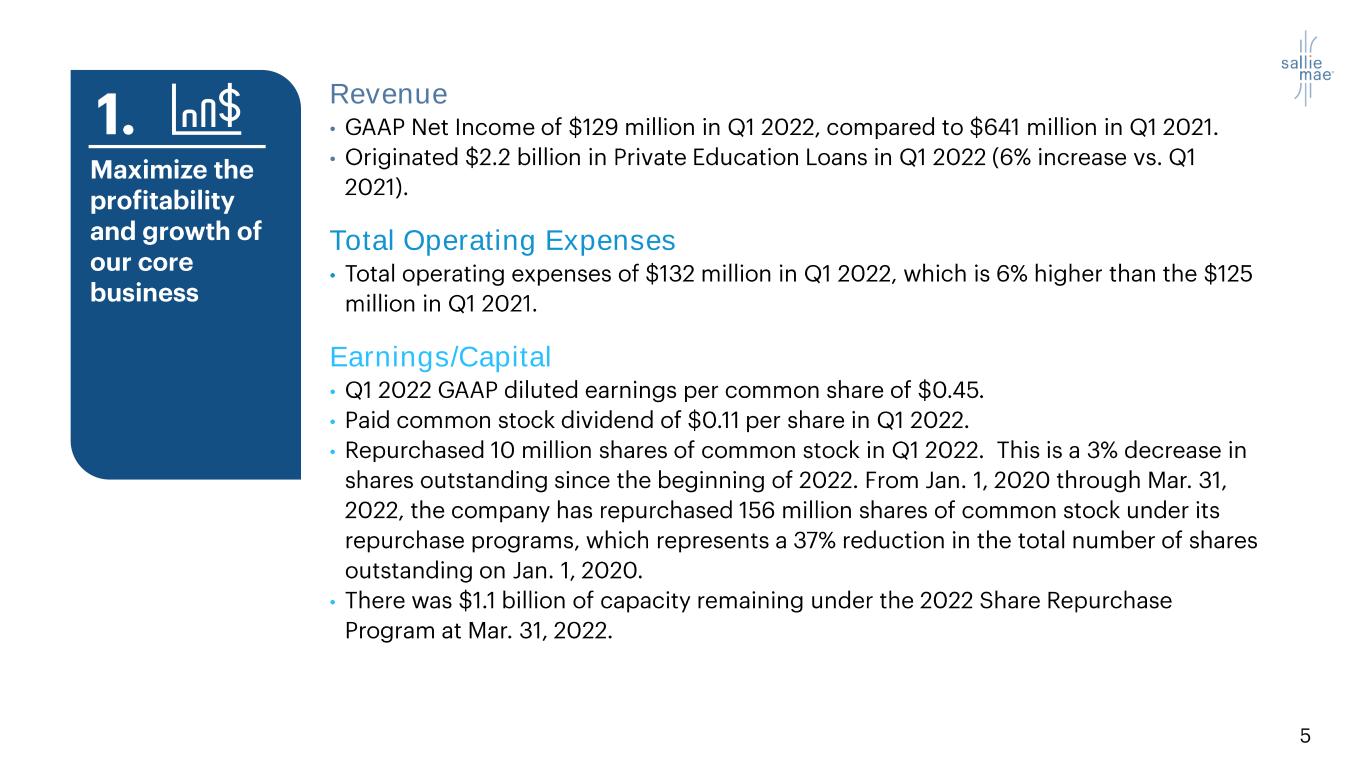
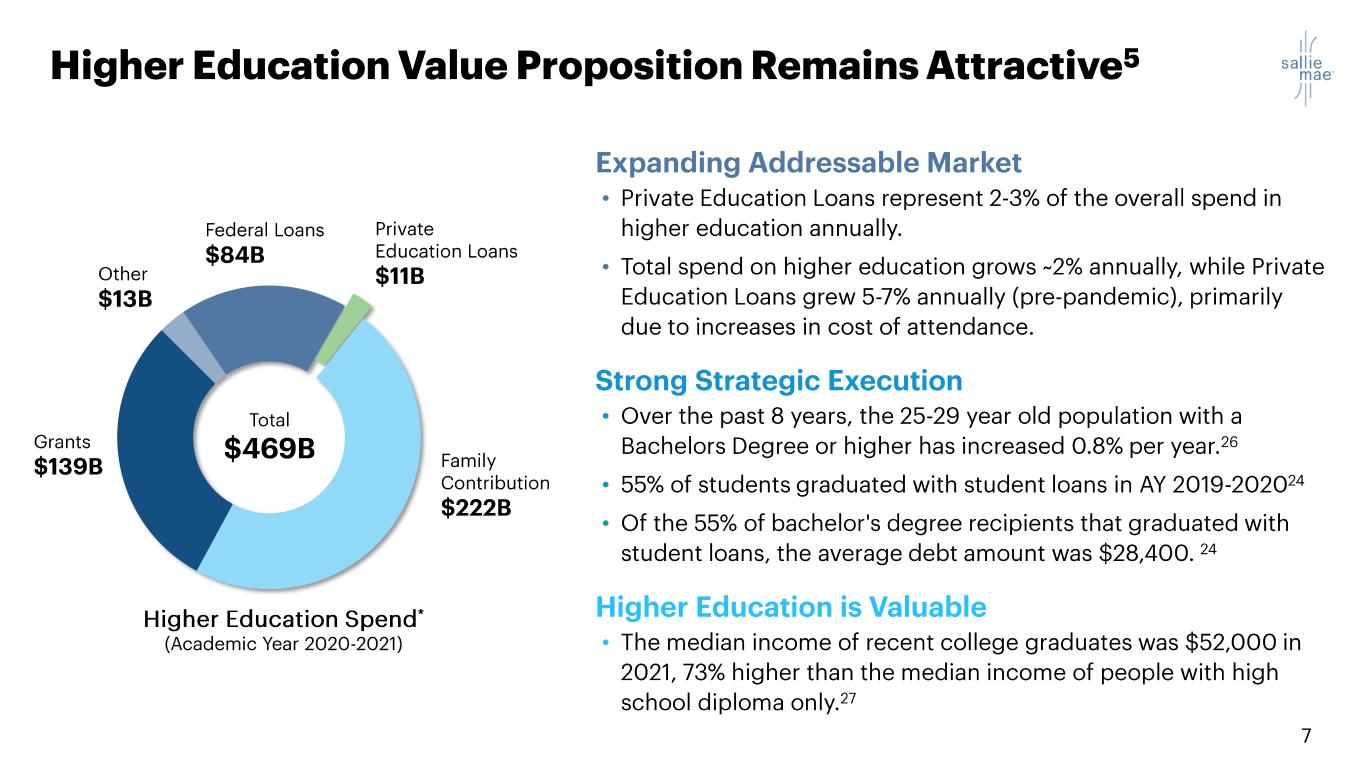
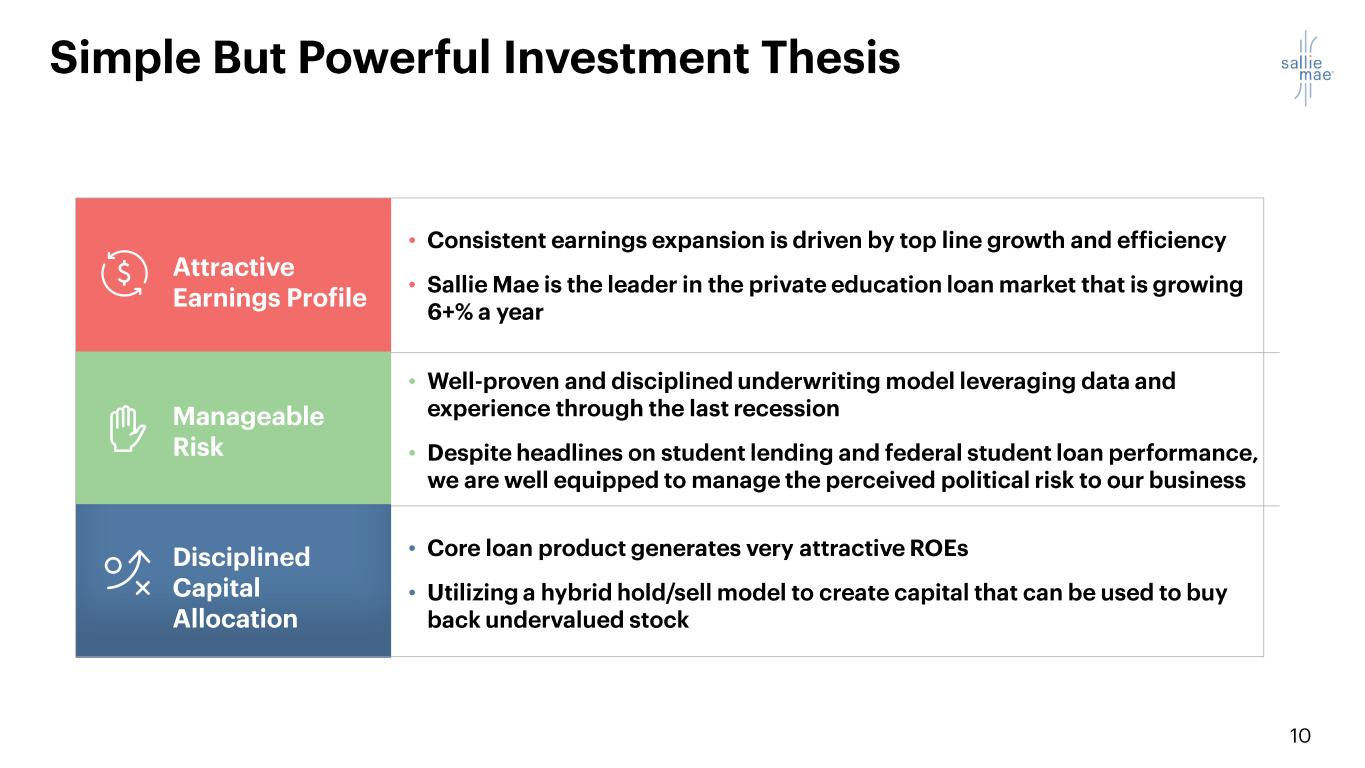
• • • • • Revenue • • Total Operating Expenses • Earnings/Capital • • • •
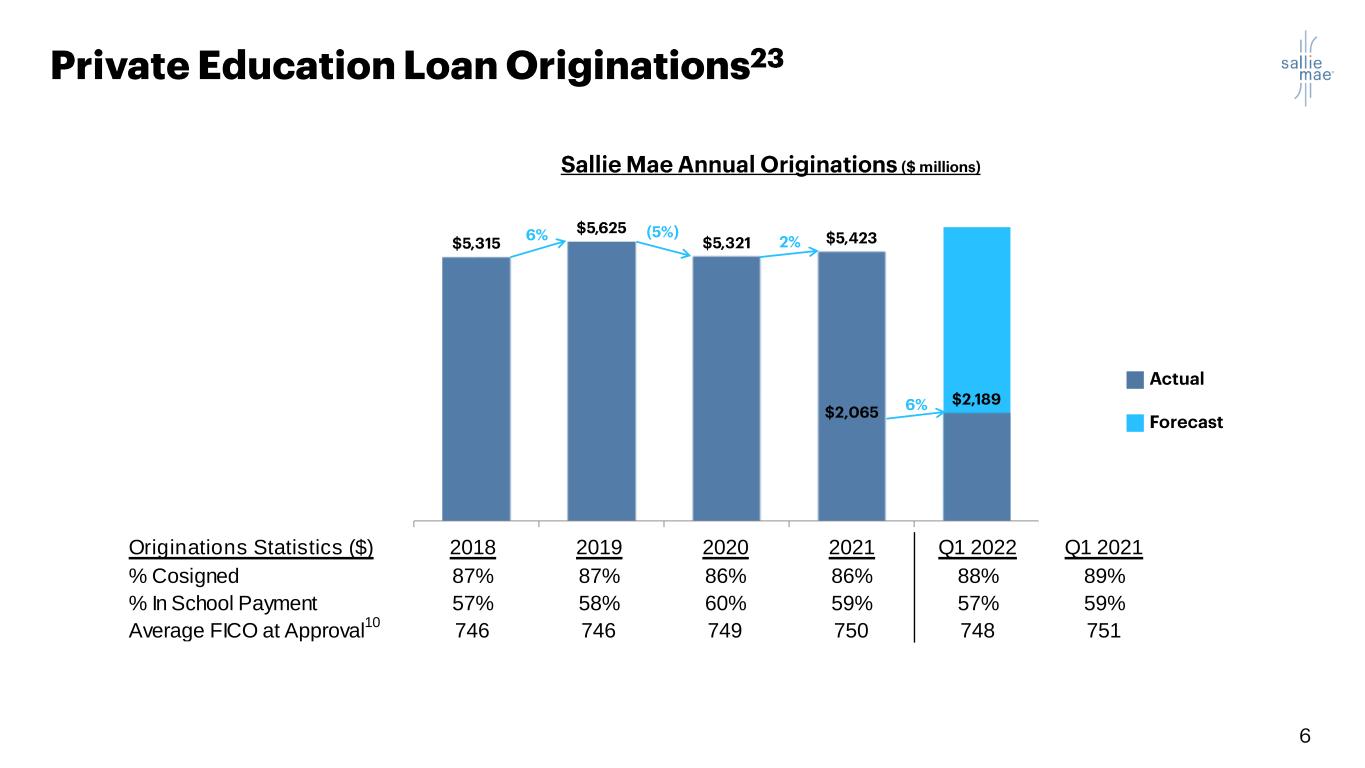
Originations Statistics ($) 2018 2019 2020 2021 Q1 2022 Q1 2021 % Cosigned 87% 87% 86% 86% 88% 89% % In School Payment 57% 58% 60% 59% 57% 59% Average FICO at Approval 10 746 746 749 750 748 751 • • • • • •
• • • • • •
• • • •
• • • • • • We allocate capital with discipline • • • • • As of 5/13/22
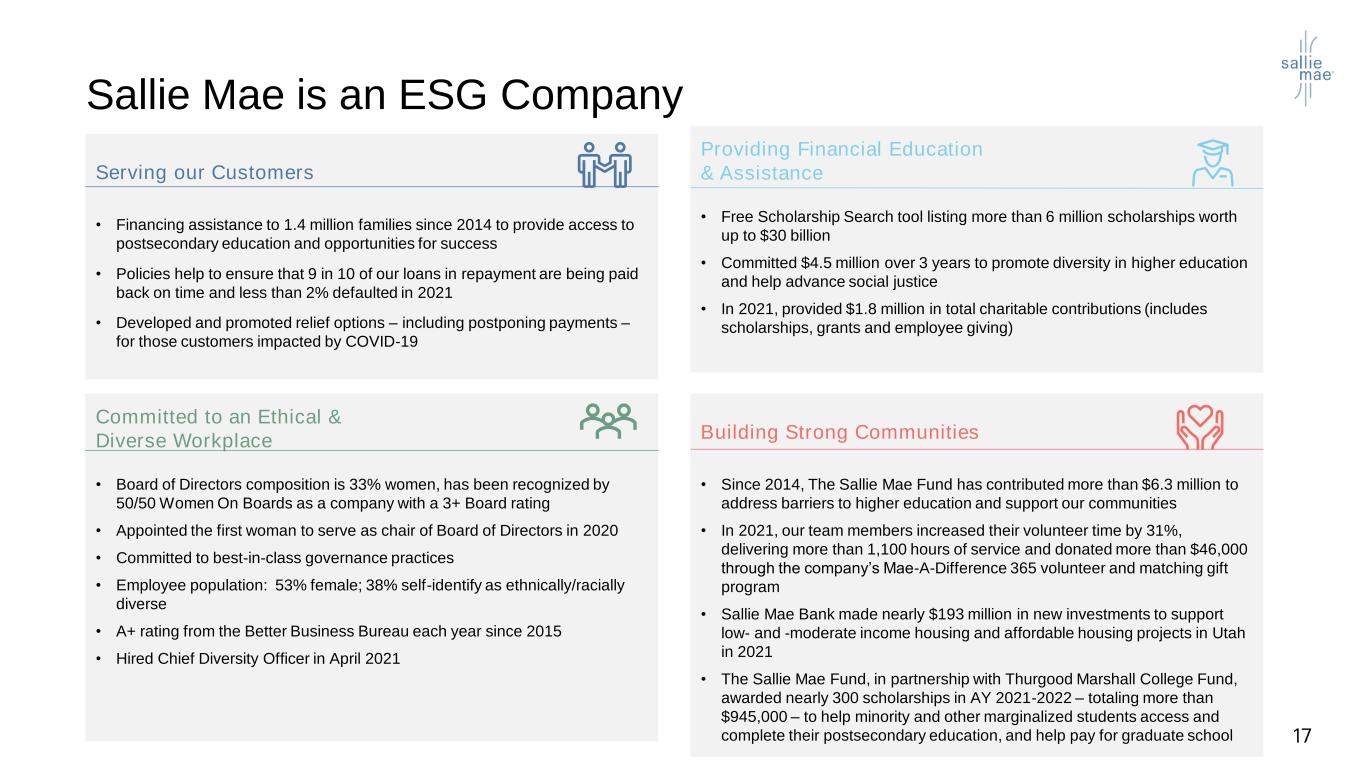
Sallie Mae is an ESG Company Committed to an Ethical & Diverse Workplace • Board of Directors composition is 33% women, has been recognized by 50/50 Women On Boards as a company with a 3+ Board rating • Appointed the first woman to serve as chair of Board of Directors in 2020 • Committed to best-in-class governance practices • Employee population: 53% female; 38% self-identify as ethnically/racially diverse • A+ rating from the Better Business Bureau each year since 2015 • Hired Chief Diversity Officer in April 2021 Building Strong Communities • Since 2014, The Sallie Mae Fund has contributed more than $6.3 million to address barriers to higher education and support our communities • In 2021, our team members increased their volunteer time by 31%, delivering more than 1,100 hours of service and donated more than $46,000 through the company’s Mae-A-Difference 365 volunteer and matching gift program • Sallie Mae Bank made nearly $193 million in new investments to support low- and -moderate income housing and affordable housing projects in Utah in 2021 • The Sallie Mae Fund, in partnership with Thurgood Marshall College Fund, awarded nearly 300 scholarships in AY 2021-2022 – totaling more than $945,000 – to help minority and other marginalized students access and complete their postsecondary education, and help pay for graduate school Serving our Customers • Financing assistance to 1.4 million families since 2014 to provide access to postsecondary education and opportunities for success • Policies help to ensure that 9 in 10 of our loans in repayment are being paid back on time and less than 2% defaulted in 2021 • Developed and promoted relief options – including postponing payments – for those customers impacted by COVID-19 Providing Financial Education & Assistance • Free Scholarship Search tool listing more than 6 million scholarships worth up to $30 billion • Committed $4.5 million over 3 years to promote diversity in higher education and help advance social justice • In 2021, provided $1.8 million in total charitable contributions (includes scholarships, grants and employee giving)
ABS Supplement
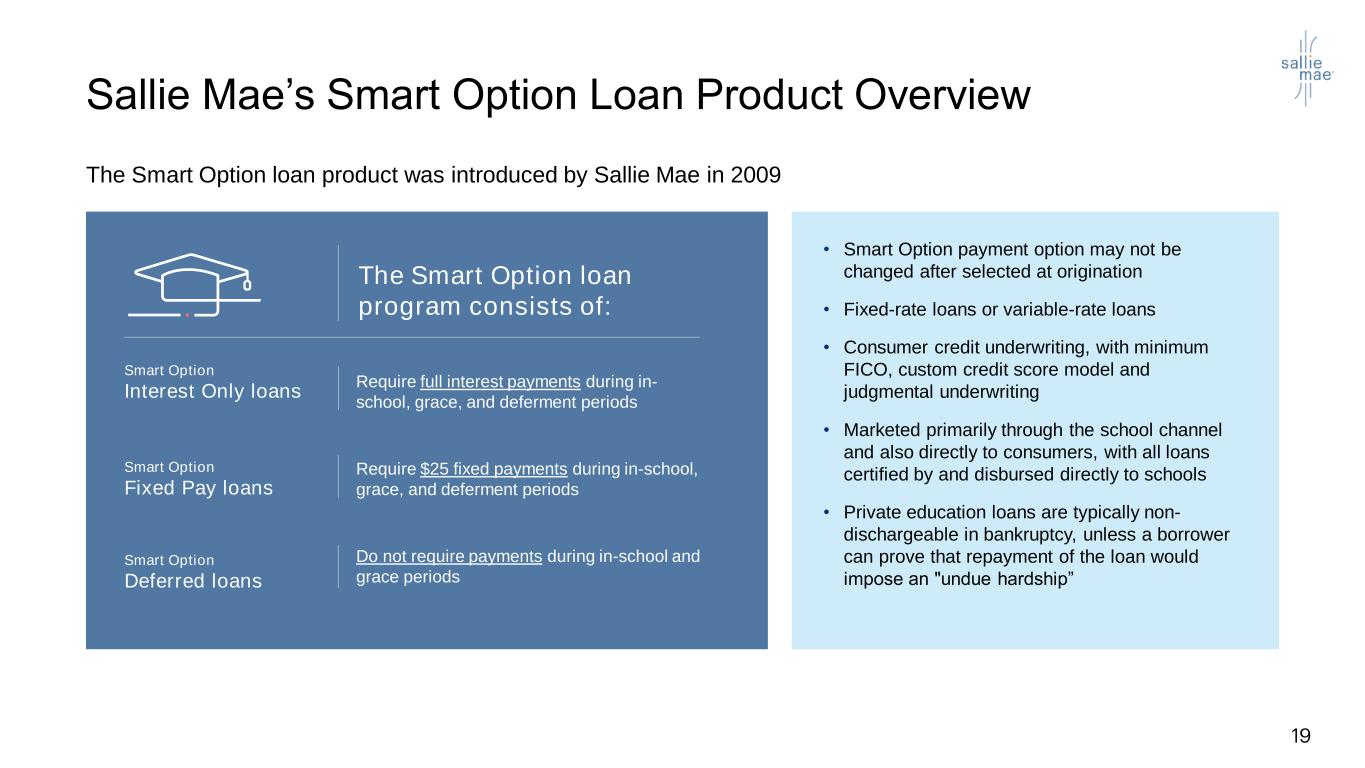
Sallie Mae’s Smart Option Loan Product Overview The Smart Option loan product was introduced by Sallie Mae in 2009 The Smart Option loan program consists of: Smart Option Interest Only loans Require full interest payments during in- school, grace, and deferment periods Smart Option Fixed Pay loans Require $25 fixed payments during in-school, grace, and deferment periods Smart Option Deferred loans Do not require payments during in-school and grace periods • Smart Option payment option may not be changed after selected at origination • Fixed-rate loans or variable-rate loans • Consumer credit underwriting, with minimum FICO, custom credit score model and judgmental underwriting • Marketed primarily through the school channel and also directly to consumers, with all loans certified by and disbursed directly to schools • Private education loans are typically non- dischargeable in bankruptcy, unless a borrower can prove that repayment of the loan would impose an "undue hardship”
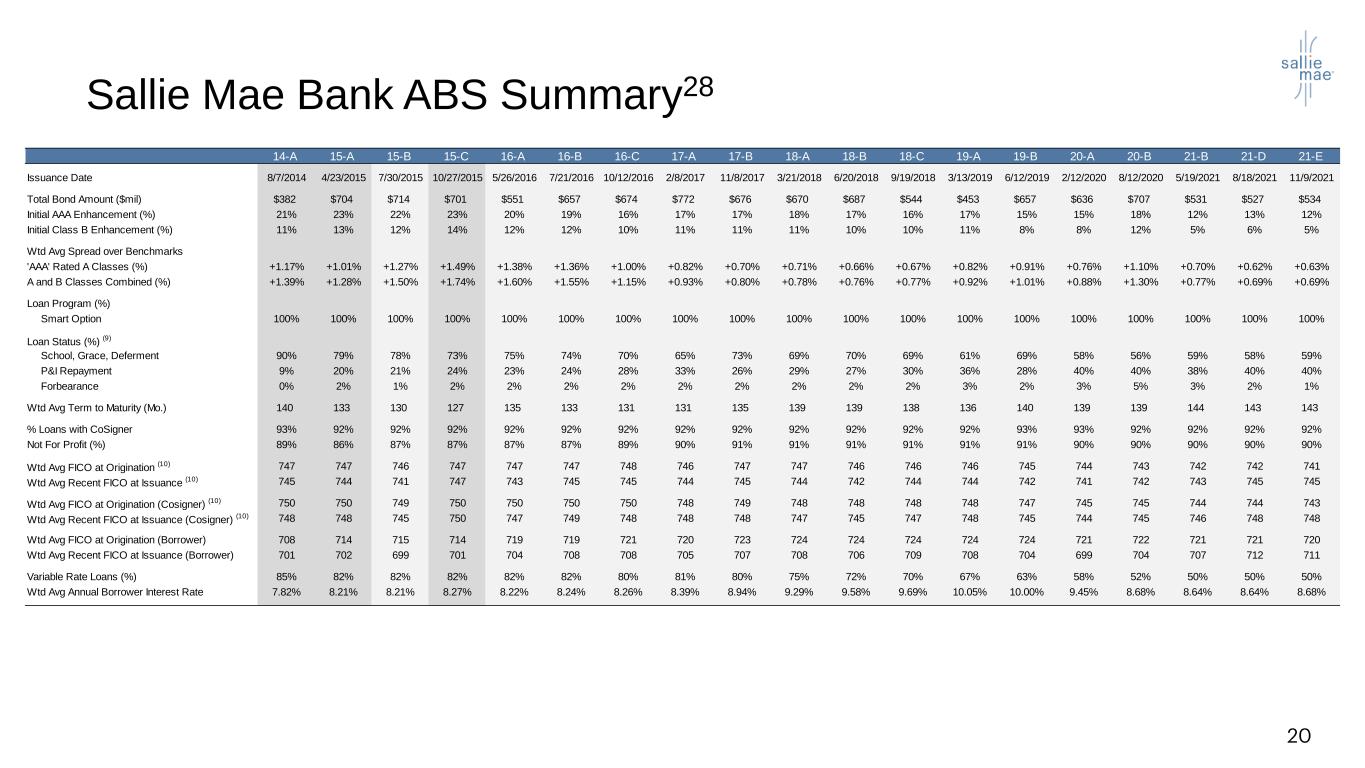
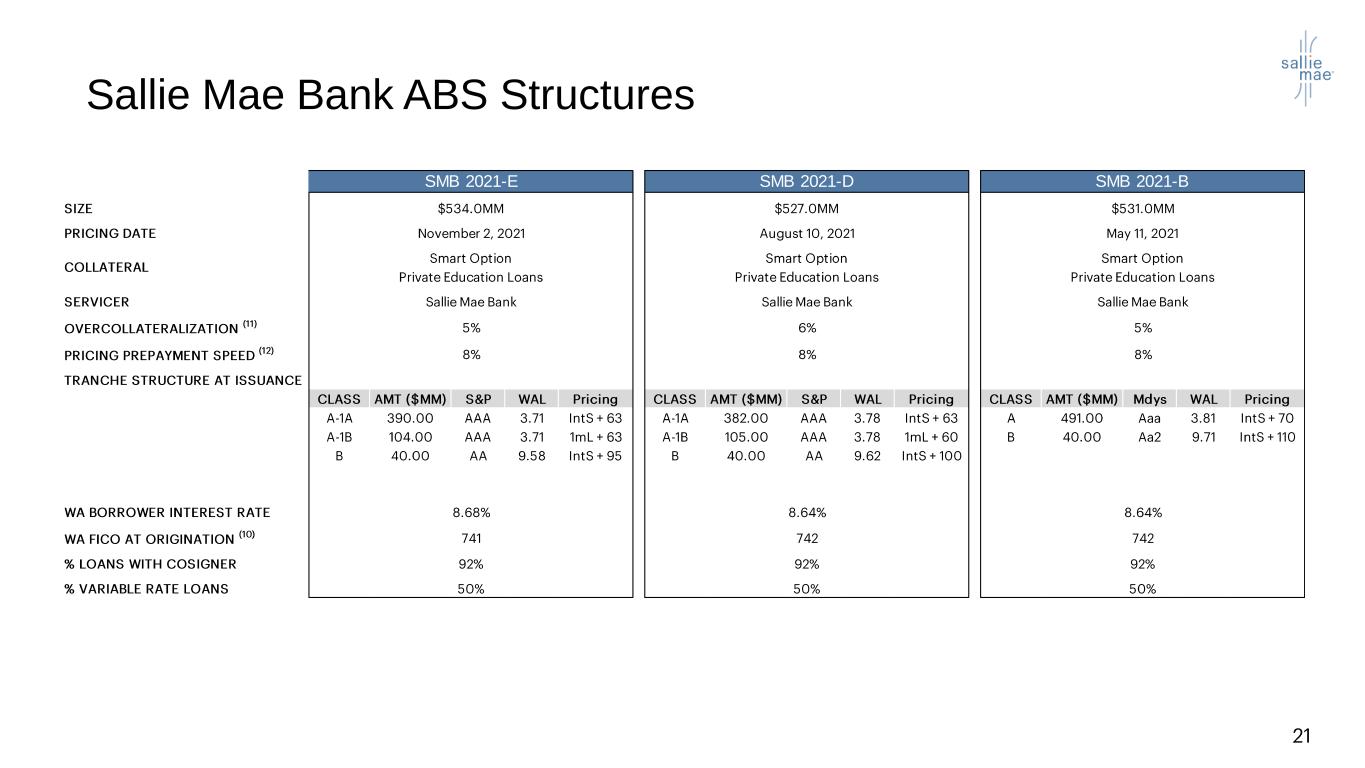
Sallie Mae Bank ABS Summary28 14-A 15-A 15-B 15-C 16-A 16-B 16-C 17-A 17-B 18-A 18-B 18-C 19-A 19-B 20-A 20-B 21-B 21-D 21-E Issuance Date 8/7/2014 4/23/2015 7/30/2015 10/27/2015 5/26/2016 7/21/2016 10/12/2016 2/8/2017 11/8/2017 3/21/2018 6/20/2018 9/19/2018 3/13/2019 6/12/2019 2/12/2020 8/12/2020 5/19/2021 8/18/2021 11/9/2021 Total Bond Amount ($mil) $382 $704 $714 $701 $551 $657 $674 $772 $676 $670 $687 $544 $453 $657 $636 $707 $531 $527 $534 Initial AAA Enhancement (%) 21% 23% 22% 23% 20% 19% 16% 17% 17% 18% 17% 16% 17% 15% 15% 18% 12% 13% 12% Initial Class B Enhancement (%) 11% 13% 12% 14% 12% 12% 10% 11% 11% 11% 10% 10% 11% 8% 8% 12% 5% 6% 5% Wtd Avg Spread over Benchmarks 'AAA' Rated A Classes (%) +1.17% +1.01% +1.27% +1.49% +1.38% +1.36% +1.00% +0.82% +0.70% +0.71% +0.66% +0.67% +0.82% +0.91% +0.76% +1.10% +0.70% +0.62% +0.63% A and B Classes Combined (%) +1.39% +1.28% +1.50% +1.74% +1.60% +1.55% +1.15% +0.93% +0.80% +0.78% +0.76% +0.77% +0.92% +1.01% +0.88% +1.30% +0.77% +0.69% +0.69% Loan Program (%) Smart Option 100% 100% 100% 100% 100% 100% 100% 100% 100% 100% 100% 100% 100% 100% 100% 100% 100% 100% 100% Loan Status (%) (9) School, Grace, Deferment 90% 79% 78% 73% 75% 74% 70% 65% 73% 69% 70% 69% 61% 69% 58% 56% 59% 58% 59% P&I Repayment 9% 20% 21% 24% 23% 24% 28% 33% 26% 29% 27% 30% 36% 28% 40% 40% 38% 40% 40% Forbearance 0% 2% 1% 2% 2% 2% 2% 2% 2% 2% 2% 2% 3% 2% 3% 5% 3% 2% 1% Wtd Avg Term to Maturity (Mo.) 140 133 130 127 135 133 131 131 135 139 139 138 136 140 139 139 144 143 143 % Loans with CoSigner 93% 92% 92% 92% 92% 92% 92% 92% 92% 92% 92% 92% 92% 93% 93% 92% 92% 92% 92% Not For Profit (%) 89% 86% 87% 87% 87% 87% 89% 90% 91% 91% 91% 91% 91% 91% 90% 90% 90% 90% 90% Wtd Avg FICO at Origination (10) 747 747 746 747 747 747 748 746 747 747 746 746 746 745 744 743 742 742 741 Wtd Avg Recent FICO at Issuance (10) 745 744 741 747 743 745 745 744 745 744 742 744 744 742 741 742 743 745 745 Wtd Avg FICO at Origination (Cosigner) (10) 750 750 749 750 750 750 750 748 749 748 748 748 748 747 745 745 744 744 743 Wtd Avg Recent FICO at Issuance (Cosigner) (10) 748 748 745 750 747 749 748 748 748 747 745 747 748 745 744 745 746 748 748 Wtd Avg FICO at Origination (Borrower) 708 714 715 714 719 719 721 720 723 724 724 724 724 724 721 722 721 721 720 Wtd Avg Recent FICO at Issuance (Borrower) 701 702 699 701 704 708 708 705 707 708 706 709 708 704 699 704 707 712 711 Variable Rate Loans (%) 85% 82% 82% 82% 82% 82% 80% 81% 80% 75% 72% 70% 67% 63% 58% 52% 50% 50% 50% Wtd Avg Annual Borrower Interest Rate 7.82% 8.21% 8.21% 8.27% 8.22% 8.24% 8.26% 8.39% 8.94% 9.29% 9.58% 9.69% 10.05% 10.00% 9.45% 8.68% 8.64% 8.64% 8.68% Sallie Mae Bank ABS Structures SMB 2021-E SMB 2021-D SMB 2021-B
Appendix
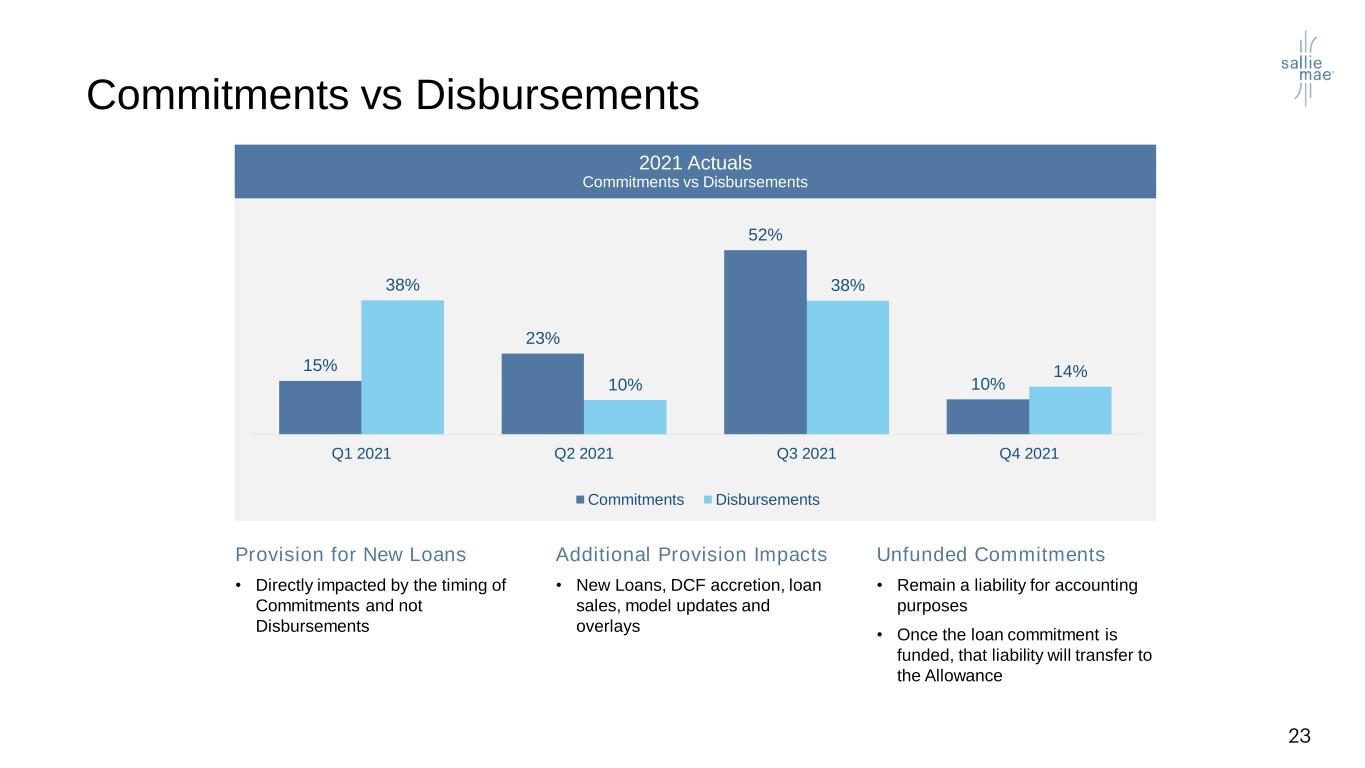
Commitments vs Disbursements Provision for New Loans • Directly impacted by the timing of Commitments and not Disbursements Additional Provision Impacts • New Loans, DCF accretion, loan sales, model updates and overlays Unfunded Commitments • Remain a liability for accounting purposes • Once the loan commitment is funded, that liability will transfer to the Allowance 2021 Actuals Commitments vs Disbursements 15% 23% 52% 10% 38% 10% 38% 14% Q1 2021 Q2 2021 Q3 2021 Q4 2021 Commitments Disbursements CECL Update13 Adopted on January 1, 2020.
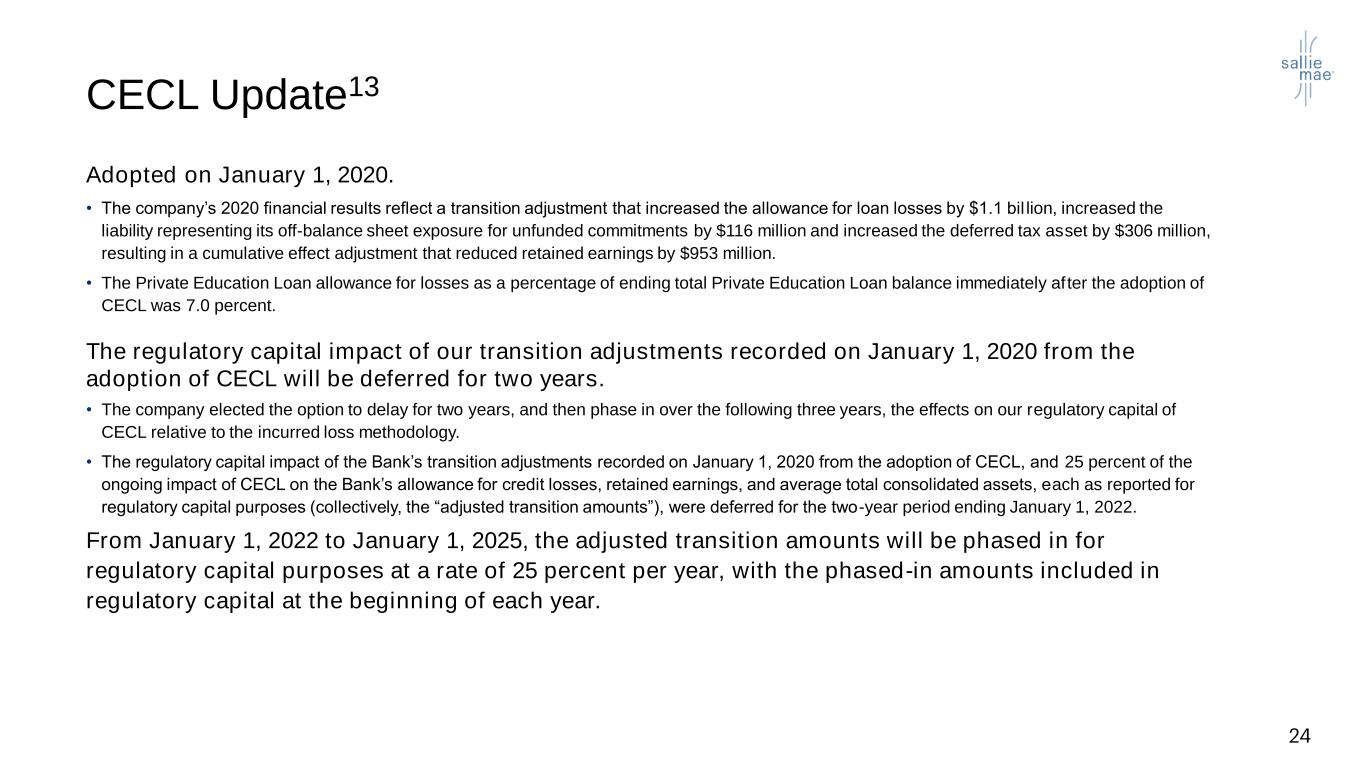
• The company’s 2020 financial results reflect a transition adjustment that increased the allowance for loan losses by $1.1 bil lion, increased the liability representing its off-balance sheet exposure for unfunded commitments by $116 million and increased the deferred tax asset by $306 million, resulting in a cumulative effect adjustment that reduced retained earnings by $953 million. • The Private Education Loan allowance for losses as a percentage of ending total Private Education Loan balance immediately after the adoption of CECL was 7.0 percent. The regulatory capital impact of our transition adjustments recorded on January 1, 2020 from the adoption of CECL will be deferred for two years. • The company elected the option to delay for two years, and then phase in over the following three years, the effects on our regulatory capital of CECL relative to the incurred loss methodology. • The regulatory capital impact of the Bank’s transition adjustments recorded on January 1, 2020 from the adoption of CECL, and 25 percent of the ongoing impact of CECL on the Bank’s allowance for credit losses, retained earnings, and average total consolidated assets, each as reported for regulatory capital purposes (collectively, the “adjusted transition amounts”), were deferred for the two-year period ending January 1, 2022. From January 1, 2022 to January 1, 2025, the adjusted transition amounts will be phased in for regulatory capital purposes at a rate of 25 percent per year, with the phased-in amounts included in regulatory capital at the beginning of each year.


