UNITED STATES
SECURITIES AND EXCHANGE COMMISSION
Washington, DC 20549
FORM 8-K
CURRENT REPORT
Pursuant to Section 13 OR 15(d) of The Securities Exchange Act of 1934
Date of Report (Date of earliest event reported): July 30, 2025
Modine Manufacturing Company
(Exact name of registrant as specified in its charter)
Wisconsin |
001-01373 |
39-0482000 |
(State or other jurisdiction of incorporation) |
(Commission File Number) |
(I.R.S. Employer Identification Number) |
1500 DeKoven Avenue, Racine, Wisconsin |
|
53403 |
(Address of principal executive offices) |
|
(Zip Code) |
Registrant’s telephone number, including area code: |
|
(262) 636-1200 |
|
|
|
(Former name or former address, if changed since last report.) |
|
N/A |
Check the appropriate box below if the Form 8-K filing is intended to simultaneously satisfy the filing obligation of the registrant under any of the following provisions:
☐ |
Written communications pursuant to Rule 425 under the Securities Act (17 CFR 230.425) |
☐ |
Soliciting material pursuant to Rule 14a-12 under the Exchange Act (17 CFR 240.14a-12) |
☐ |
Pre-commencement communications pursuant to Rule 14d-2(b) under the Exchange Act (17 CFR 240.14d-2(b)) |
☐ |
Pre-commencement communications pursuant to Rule 13e-4(c) under the Exchange Act (17 CFR 240.13e-4(c)) |
Securities registered pursuant to Section 12(b) of the Act:
Title of each class |
|
Trading Symbol(s) |
|
Name of each exchange on which registered |
Common Stock, $0.625 par value |
|
MOD |
|
New York Stock Exchange |
Indicate by check mark whether the registrant is an emerging growth company as defined in Rule 405 of the Securities Act of 1933 (§230.405 of this chapter) or Rule 12b-2 of the Securities Exchange Act of 1934 (§240.12b-2 of this chapter).
Emerging growth company ☐
If an emerging growth company, indicate by check mark if the registrant has elected not to use the extended transition period for complying with any new or revised financial accounting standards provided pursuant to Section 13(a) of the Exchange Act. ☐
Information to be Included in the Report
Item 2.02 Results of Operations and Financial Condition
On July 30, 2025, Modine Manufacturing Company (the “Company”) issued a press release announcing the results of operations and financial condition for the first quarter ended June 30, 2025.
During a conference call scheduled to be held at 11:00 a.m. Eastern Time on July 31, 2025, the Company’s President and Chief Executive Officer, Neil D. Brinker, and Executive Vice President, Chief Financial Officer, Michael B. Lucareli, will discuss the Company’s results for the first quarter ended June 30, 2025.
Attached to this Current Report on Form 8-K as Exhibit 99.1 and 99.2, respectively, is a copy of the Company’s press release in connection with the announcement and a copy of the presentation that the Company intends to use in connection with its first quarter earnings call. The information in this Item 2.02, including Exhibit 99.1 and 99.2, is furnished pursuant to Item 2.02 and shall not be deemed to be “filed” for purposes of Section 18 of the Securities Exchange Act of 1934, or otherwise subject to the liabilities of that section, and shall not be deemed incorporated by reference in any filing under the Securities Act of 1933 or the Securities Exchange Act of 1934, except as shall be expressly set forth by specific reference in such filing.
Item 9.01Financial Statements and Exhibits
(d) |
Exhibits |
The following exhibits are being furnished herewith:
|
Press Release dated July 30, 2025 announcing the results of operations and financial condition for the first quarter ended June 30, 2025. |
|
|
|
|
|
July 31, 2025 earnings call presentation. |
|
|
|
|
104 |
|
Cover Page Interactive Data File (formatted as Inline XBRL) |
2
Signatures
Pursuant to the requirements of the Securities Exchange Act of 1934, the registrant has duly caused this report to be signed on its behalf by the undersigned hereunto duly authorized.
Modine Manufacturing Company |
|||
|
|
||
|
|
By: |
/s/ Neil D. Brinker |
|
Neil D. Brinker |
||
|
President and Chief Executive Officer |
||
|
|
||
Date: July 30, 2025 |
|
||
3
Exhibit 99.1

NEWS RELEASE
FOR IMMEDIATE RELEASE
Modine Reports First Quarter Fiscal 2026 Results
Raising guidance for fiscal 2026 based on improved outlook for data center sales resulting from planned capacity expansion coupled with impact from recent acquisitions
Racine, WI – July 30, 2025 – Modine (NYSE: MOD), a diversified global leader in thermal management technology and solutions, today reported financial results for the quarter ended June 30, 2025.
First Quarter Highlights:
| ● | Net sales of $682.8 million increased 3 percent from the prior year |
| ● | Net earnings of $51.7 million increased $3.9 million, or 8 percent, from the prior year |
| ● | Adjusted EBITDA of $101.4 million increased $0.5 million from the prior year |
| ● | Earnings per share of $0.95 increased $0.07, or 8 percent, from the prior year |
| ● | Adjusted earnings per share of $1.06 increased $0.02, or 2 percent, from the prior year |
Fiscal 2026 Outlook:
| ● | Net sales growth between 10% to 15% |
| ● | Adjusted EBITDA range of $440 million to $470 million, resulting in growth between 12% and 20% |
“We are making important investments in our business that are advancing our competitive position in key markets and allowing us to capture incremental growth opportunities this fiscal year and beyond,” said Modine President and Chief Executive Officer, Neil D. Brinker. “Revenues this past quarter benefited from a strong performance by Climate Solutions, driven by continued momentum and higher sales of data center products, along with organic and inorganic growth in the HVAC Technologies product group. In Performance Technologies, we are actively working to control and offset higher material costs. I’m pleased with the company’s performance and look forward to a significant ramp in volumes in the second half of the year.”
First Quarter Financial Results
Net sales increased 3 percent to $682.8 million, compared with $661.5 million in the prior year. Sales growth was driven by higher sales in the Climate Solutions segment, partially offset by lower sales in the Performance Technologies segment resulting from expected market weakness across vehicular end markets and product line exits.
Gross profit increased 2 percent to $165.4 million and gross margin decreased by 40 basis points to 24.2 percent. The decrease in gross margin was primarily driven by lower gross margin in the Performance Technologies segment.
Selling, general and administrative (“SG&A”) expenses increased $2.1 million to $84.9 million. The increase was primarily due to higher spending to support growth and acquisitions in Climate Solutions, partially offset by savings from headcount reductions in Performance Technologies.
Operating income increased 2 percent to $75.7 million, compared to $74.4 million in the prior year. The increase was driven by higher gross profit on higher sales volume, partially offset by higher SG&A expenses, as compared to the prior year. The Company recorded $4.8 million of restructuring expenses during the quarter, primarily severance expenses related to headcount reduction in the Performance Technologies segment. Net earnings of $51.7 million increased $3.9 million, or 8 percent, compared to $47.8 million in the prior year. Adjusted EBITDA, which excludes restructuring expenses, certain other charges, interest expense, the provision for income taxes, and depreciation and amortization expense, was $101.4 million, an increase of $0.5 million, compared to $100.9 million in the prior year.
1
Earnings per share was $0.95, compared with $0.88 in the prior year, an increase of $0.07 or 8 percent. Adjusted earnings per share was $1.06, compared with adjusted earnings per share of $1.04 in the prior year, an increase of $0.02 or 2 percent.
First Quarter Segment Review
| ● | Climate Solutions segment sales were $397.4 million, compared with $357.3 million one year ago, an increase of 11 percent. This increase was driven by higher sales of data center and HVAC technologies products, including $10 million of incremental sales from acquired businesses. These increases were partially offset by lower sales of heat transfer solutions products. The segment reported gross margin of 28.4 percent, which was 20 basis points higher than the prior year. The segment reported operating income of $66.9 million, a 12 percent increase from the prior year, and adjusted EBITDA of $79.4 million, an increase of 10 percent from the prior year. |
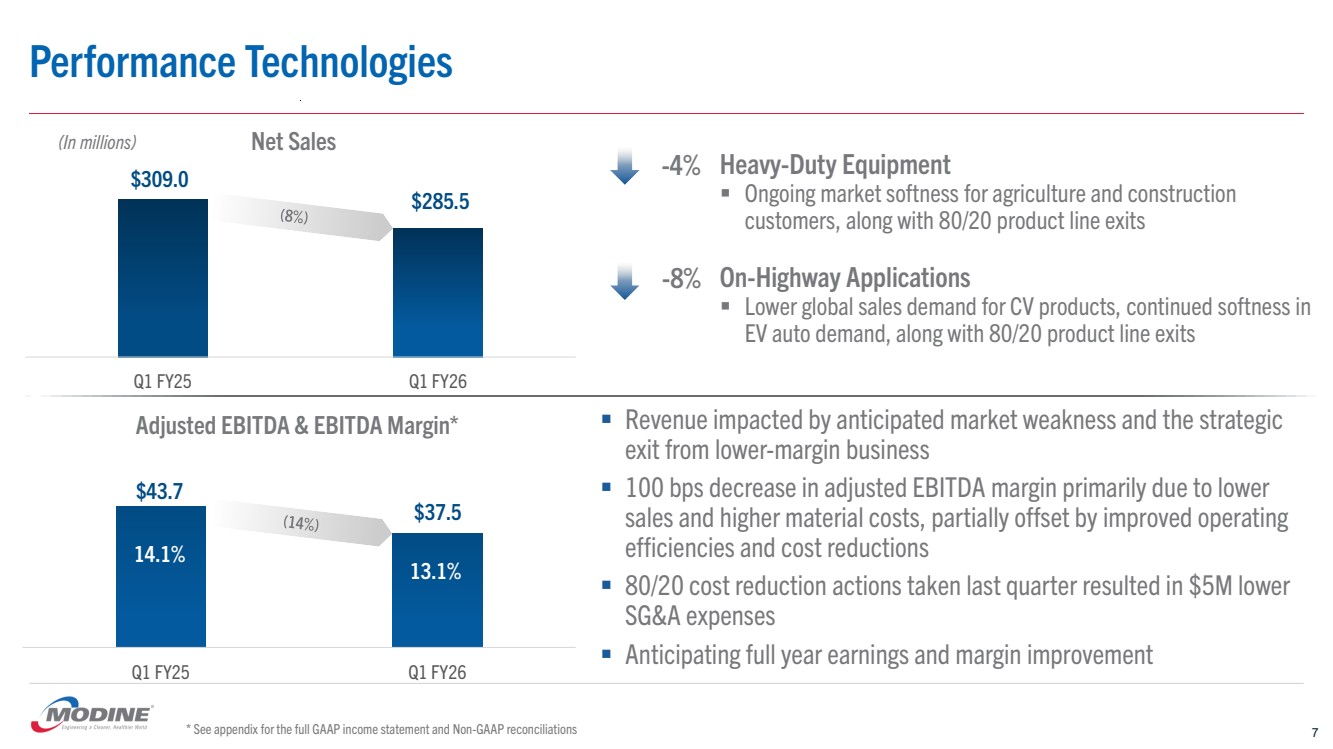
| ● | Performance Technologies segment sales were $285.5 million, compared with $309.0 million one year ago, a decrease of 8 percent. This decrease primarily resulted from market-related declines of both heavy-duty equipment and on-highway applications products, and strategic product line exits. The segment reported gross margin of 18.2 percent, which was 240 basis points lower than the prior year, primarily due to the lower sales volume and higher material costs, partially offset by improved operating efficiencies. The segment reported operating income of $26.5 million, a 16 percent decrease from the prior year, and adjusted EBITDA of $37.5 million, a 14 percent decrease from the prior year. |
Balance Sheet & Liquidity
Net cash provided by operating activities for the quarter ended June 30, 2025, was $27.7 million, a decrease of $12.8 million compared to the prior year. Free cash flow for the quarter ended June 30, 2025, was $0.2 million, a decrease of $13.5 million from the prior year. This decrease was primarily due to an increase in working capital, primarily related to higher inventory balances in Climate Solutions. Cash payments for restructuring activities, acquisition and integration costs, and environmental charges totaled $5.1 million during the quarter ended June 30, 2025.
Total debt was $527.1 million as of June 30, 2025. Cash and cash equivalents totaled $124.5 million as of June 30, 2025. Net debt was $402.6 million as of June 30, 2025, an increase of $123.4 million from the end of fiscal 2025. This increase resulted from borrowings to fund acquisitions.
Outlook
“We are raising our revenue and earnings outlook for the fiscal year, reflecting the impact from recent acquisitions in Climate Solutions and increased demand from data center customers,” added Brinker. “Our recently announced investment to further expand North American manufacturing capacity for data center products is expected to have a positive impact on the second half of this year, and provide an even greater opportunity for growth when fully online in fiscal 2027 and beyond. We believe that this capacity expansion, coupled with strong demand, provides a clear path to approach $2 billion in data center revenues by fiscal 2028. Our focus remains on advancing our multi-year transformation strategy, including reallocating resources to higher growth and higher margin businesses.”
Based on current exchange rates and market conditions, Modine provides its revised outlook for Fiscal 2026:
Fiscal 2026 |
Current Outlook |
Net Sales |
+10% to 15% |
Adjusted EBITDA |
$440 to $470 million |
Conference Call and Webcast
Modine will conduct a conference call and live webcast, with a slide presentation, on Thursday, July 31, 2025, at 10:00 a.m. Central Time (11:00 a.m. Eastern Time) to discuss its first quarter fiscal year 2026 financial results. The webcast and accompanying slides will be available on the Investor Relations section of the Modine website at www.modine.com. Participants are encouraged to log on to the webcast and conference call about ten minutes prior to the start of the event. A replay of the audio and slides will be available on the Investor Relations section of the Modine website at www.modine.com on or after July 31, 2025. A call-in replay will be available through midnight on August 7, 2025, at 877-660-6853, (international replay 201-612-7415); Conference ID# 13754777. The Company will post a transcript of the call on its website on or after August 4, 2025.
2
About Modine
For more than 100 years, Modine has solved the toughest thermal management challenges for mission-critical applications. Our purpose of Engineering a Cleaner, Healthier World™ means we are always evolving our portfolio of technologies to provide the latest heating, cooling, and ventilation solutions. Through the hard work of more than 11,000 employees worldwide, our Climate Solutions and Performance Technologies segments advance our purpose with systems that improve air quality, reduce energy and water consumption, lower harmful emissions, enable cleaner running vehicles, and use environmentally friendly refrigerants. Modine is a global company headquartered in Racine, Wisconsin (U.S.), with operations in North America, South America, Europe, and Asia. For more information about Modine, visit www.modine.com.
Forward-Looking Statements
This press release contains statements, including information about future financial performance and market conditions, accompanied by phrases such as “believes,” “estimates,” “expects,” “plans,” “anticipates,” “intends,” “projects,” and other similar “forward-looking” statements, as defined in the Private Securities Litigation Reform Act of 1995. Modine's actual results, performance or achievements may differ materially from those expressed or implied in these statements because of certain risks and uncertainties, including, but not limited to those described under “Risk Factors” in Item 1A of Part I of the Company's Annual Report on Form 10-K for the year ended March 31, 2025 and under Forward-Looking Statements in Item 7 of Part II of that same report. Other risks and uncertainties include, but are not limited to, the following: the impact of potential adverse developments or disruptions in the global economy and financial markets, including impacts related to inflation, energy costs, government incentive or funding programs, supply chain challenges or supplier constraints, logistical disruptions, tariffs, sanctions and other trade issues or cross-border trade restrictions; the impact of other economic, social and political conditions, changes and challenges in the markets where we operate and compete, including foreign currency exchange rate fluctuations, changes in interest rates, tightening of the credit markets, recession or recovery therefrom, restrictions associated with importing and exporting and foreign ownership, public health crises, and the general uncertainties, including the impact on demand for our products and the markets we serve from regulatory and/or policy changes that have been or may be implemented in the U.S. or abroad, including those related to tax and trade, climate change, public health threats, and military conflicts, including the conflicts in Ukraine and in the Middle East and tensions in the Red Sea; the overall health and pricing focus of our customers; changes or threats to the market growth prospects for our customers; our ability to successfully realize anticipated benefits, including improved profit margins and cash flow, from our strategic initiatives and our application of 80/20 principles across our businesses; our ability to be at the forefront of technological advances and the impacts of any changes in the adoption rate of technologies that we expect to drive sales growth; our ability to accelerate growth organically and through acquisitions and successfully integrate acquired businesses; our ability to successfully exit portions of our business that do not align with our strategic plans; our ability to effectively and efficiently manage our operations in response to sales volume changes, including maintaining adequate production capacity to meet demand in our growing businesses while also completing restructuring activities and realizing benefits thereof; our ability to fund our global liquidity requirements efficiently and comply with the financial covenants in our credit agreements; operational inefficiencies as a result of product or program launches, unexpected volume increases or decreases, product transfers and warranty claims; the impact on Modine of any significant increases in commodity prices, particularly aluminum, copper, steel and stainless steel (nickel) and other purchased components and related costs, and our ability to adjust product pricing in response to any such increases; our ability to recruit and maintain talent in managerial, leadership, operational and administrative functions and to mitigate increased labor costs; our ability to protect our proprietary information and intellectual property from theft or attack; the impact of any substantial disruption or material breach of our information technology systems; costs and other effects of environmental investigation, remediation or litigation and the increasing emphasis on environmental, social and corporate governance matters; our ability to realize the benefits of deferred tax assets; and other risks and uncertainties identified in our public filings with the U.S. Securities and Exchange Commission. Forward-looking statements are as of the date of this press release, and we do not assume any obligation to update any forward-looking statements.
Non-GAAP Financial Disclosures
Adjusted EBITDA, adjusted EBITDA margin, adjusted earnings per share, net debt, free cash flow, organic sales and organic sales growth (which are defined below) as used in this press release are not measures that are defined in generally accepted accounting principles (GAAP). These non-GAAP measures are used by management as performance measures to evaluate the Company’s overall financial performance and liquidity. These measures are not, and should not be viewed as, substitutes for the applicable GAAP measures, and may be different from similarly titled measures used by other companies.
3
Definition – Adjusted EBITDA and adjusted EBITDA margin
The Company defines adjusted EBITDA as net earnings excluding interest expense, the provision or benefit for income taxes, depreciation and amortization expenses, other income and expense, restructuring expenses, acquisition and integration costs, and certain other gains or charges. Adjusted EBITDA margin represents adjusted EBITDA as a percentage of net sales. The Company believes that adjusted EBITDA and adjusted EBITDA margin provide relevant measures of profitability and earnings power. The Company views these financial metrics as being useful in assessing operating performance from period to period by excluding certain items that it believes are not representative of its core business. Adjusted EBITDA, when calculated for the business segments, is defined as operating income excluding depreciation and amortization expenses, restructuring expenses, and certain other gains or charges.
Definition – Adjusted earnings per share
Diluted earnings per share plus restructuring expenses, acquisition and integration costs, and excluding changes in income tax valuation allowances and certain other gains or charges. Adjusted earnings per share is an overall performance measure, not including costs associated with restructuring and acquisitions and certain other gains or charges.
Definition – Net debt
The sum of debt due within one year and long-term debt, less cash and cash equivalents. Net debt is an indicator of the Company's debt position after considering on-hand cash balances.
Definition – Free cash flow
Free cash flow represents net cash provided by operating activities less expenditures for property, plant and equipment. Free cash flow presents cash generated from operations during the period that is available for strategic capital decisions.
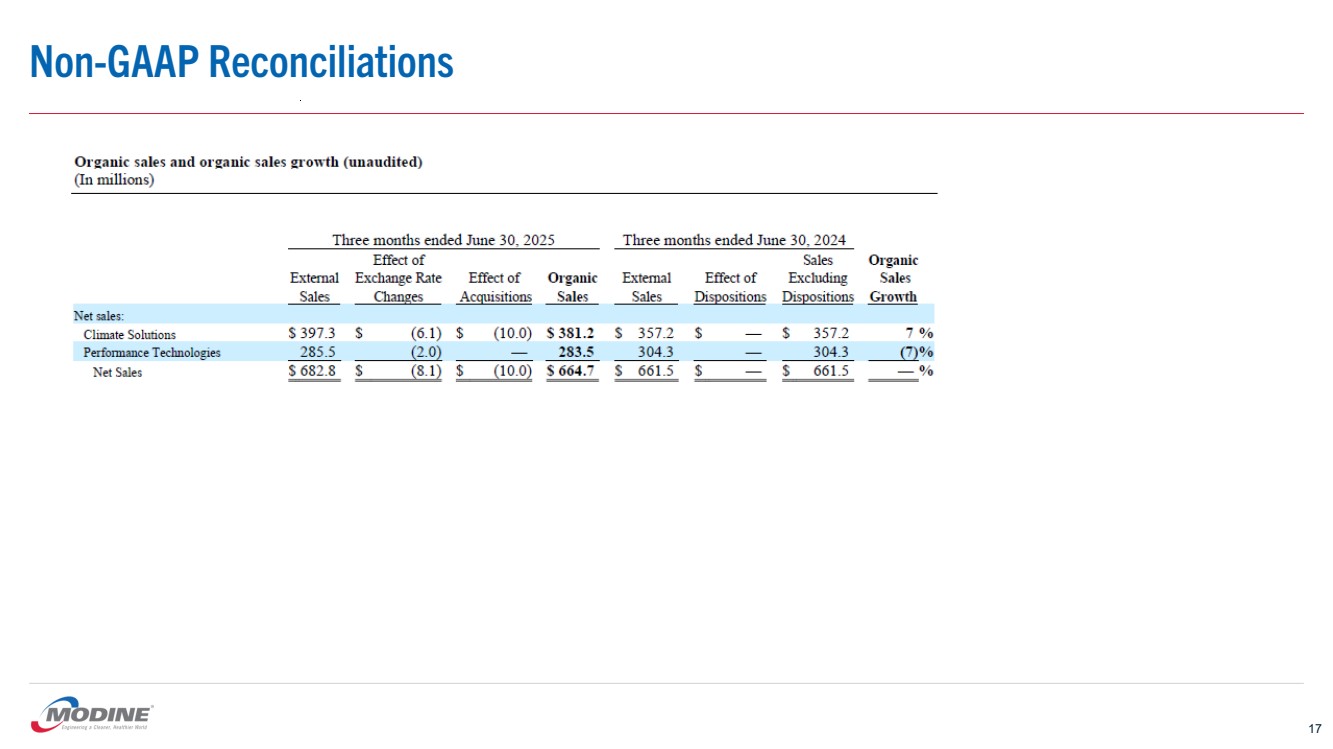
Definition – Organic sales and organic sales growth
Net sales and net sales growth can be impacted by acquisitions, dispositions, and foreign currency exchange rate fluctuations. The Company defines organic sales as external net sales excluding the impact of acquisitions and the effects of foreign currency exchange rate fluctuations. Organic sales growth represents the percentage change of organic sales compared to prior year external net sales, excluding the impact of dispositions. The effect of exchange rate changes is calculated by using the same foreign currency exchange rates as those used to translate financial data for the prior period. The Company adjusts for acquisitions and dispositions by excluding net sales in the current and prior periods, respectively, for which there are no comparable sales in the reported periods. These sales growth measures provide a more consistent indication of our performance, without the effects of foreign currency exchange rate fluctuations or acquisitions and dispositions.
Forward-looking non-GAAP financial measure
The Company’s fiscal 2026 guidance includes adjusted EBITDA, as defined above, which is a non-GAAP financial measure. The fiscal 2026 guidance includes the Company’s estimates for interest expense of approximately $28 to $30 million, a provision for income taxes of approximately $78 to $86 million, and depreciation and amortization expense of approximately $89 to $93 million. The non-GAAP financial measure also excludes certain cash and non-cash expenses or gains. These expenses and gains may be significant and include items such as restructuring expenses (including severance costs and plant consolidation and relocation expenses), acquisition and integration costs, impairment charges and certain other items. These expenses for the first three months of fiscal 2026 are presented on page 8. The Company has agreed to sell its technical service center in Germany and expects to record a gain on sale of approximately $4 million during fiscal 2026 upon closing. Estimates of other expenses and gains for the remainder of fiscal 2026 are not available due to the low visibility and unpredictability of these items.
4
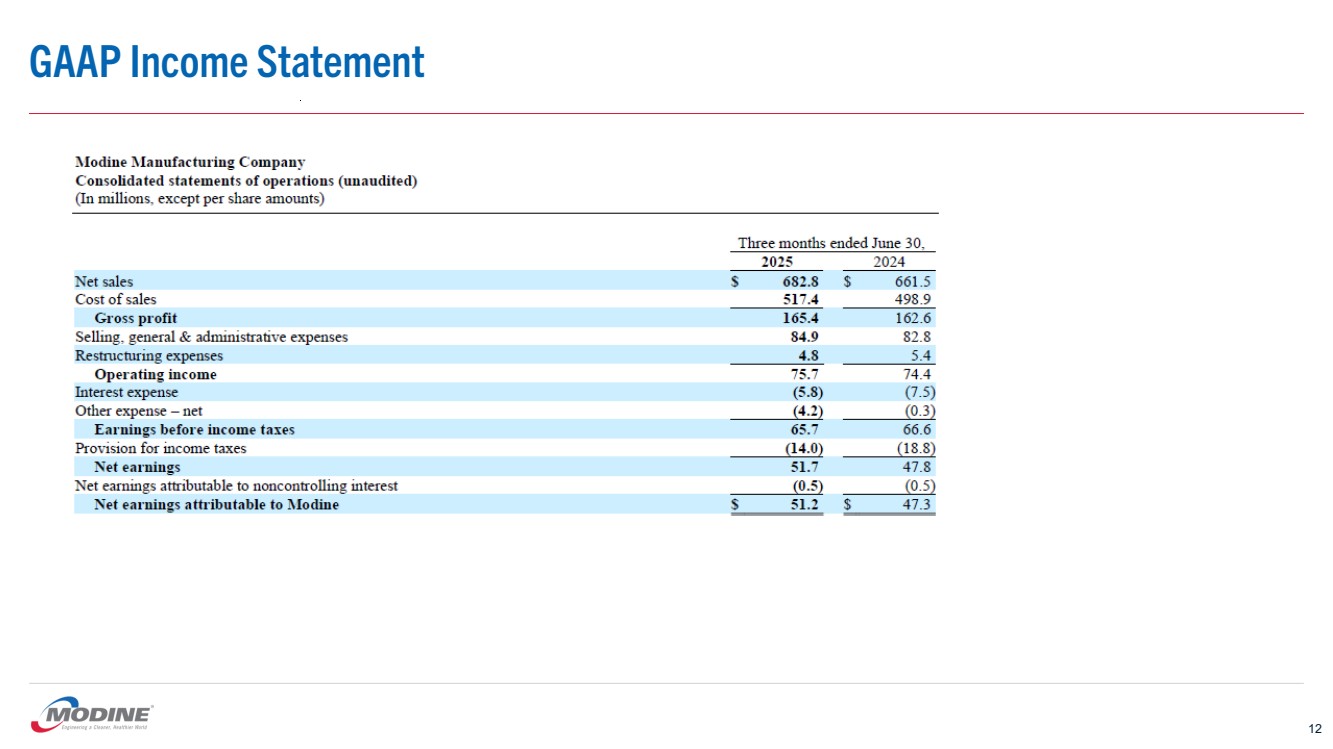
Modine Manufacturing Company
Consolidated statements of operations (unaudited)
(In millions, except per share amounts)
|
|
Three months ended June 30, |
||||
|
|
2025 |
|
2024 |
||
Net sales |
|
$ |
682.8 |
|
$ |
661.5 |
Cost of sales |
|
|
517.4 |
|
|
498.9 |
Gross profit |
|
|
165.4 |
|
|
162.6 |
Selling, general & administrative expenses |
|
|
84.9 |
|
|
82.8 |
Restructuring expenses |
|
|
4.8 |
|
|
5.4 |
Operating income |
|
|
75.7 |
|
|
74.4 |
Interest expense |
|
|
(5.8) |
|
|
(7.5) |
Other expense – net |
|
|
(4.2) |
|
|
(0.3) |
Earnings before income taxes |
|
|
65.7 |
|
|
66.6 |
Provision for income taxes |
|
|
(14.0) |
|
|
(18.8) |
Net earnings |
|
|
51.7 |
|
|
47.8 |
Net earnings attributable to noncontrolling interest |
|
|
(0.5) |
|
|
(0.5) |
Net earnings attributable to Modine |
|
$ |
51.2 |
|
$ |
47.3 |
|
|
|
|
|
|
|
Net earnings per share attributable to Modine shareholders – diluted |
|
$ |
0.95 |
|
$ |
0.88 |
|
|
|
|
|
|
|
Weighted-average shares outstanding – diluted |
|
|
53.7 |
|
|
53.9 |
Condensed consolidated balance sheets (unaudited)
(In millions)
|
|
June 30, 2025 |
|
March 31, 2025 |
||
Assets |
|
|
|
|
|
|
Cash and cash equivalents |
|
$ |
124.5 |
|
$ |
71.6 |
Trade receivables |
|
|
516.6 |
|
|
478.9 |
Inventories |
|
|
434.8 |
|
|
340.9 |
Other current assets |
|
|
79.5 |
|
|
69.8 |
Total current assets |
|
|
1,155.4 |
|
|
961.2 |
Property, plant and equipment – net |
|
|
425.9 |
|
|
390.5 |
Intangible assets – net |
|
|
198.8 |
|
|
146.7 |
Goodwill |
|
|
268.2 |
|
|
233.9 |
Deferred income taxes |
|
|
59.1 |
|
|
67.0 |
Other noncurrent assets |
|
|
121.1 |
|
|
118.3 |
Total assets |
|
$ |
2,228.5 |
|
$ |
1,917.6 |
|
|
|
|
|
|
|
Liabilities and shareholders’ equity |
|
|
|
|
|
|
Debt due within one year |
|
$ |
45.0 |
|
$ |
54.1 |
Accounts payable |
|
|
340.0 |
|
|
290.8 |
Other current liabilities |
|
|
176.9 |
|
|
196.1 |
Total current liabilities |
|
|
561.9 |
|
|
541.0 |
Long-term debt |
|
|
482.1 |
|
|
296.7 |
Other noncurrent liabilities |
|
|
165.8 |
|
|
161.7 |
Total liabilities |
|
|
1,209.8 |
|
|
999.4 |
Total equity |
|
|
1,018.7 |
|
|
918.2 |
Total liabilities & equity |
|
$ |
2,228.5 |
|
$ |
1,917.6 |
5
Modine Manufacturing Company
Condensed consolidated statements of cash flows (unaudited)
(In millions)
|
|
Three months ended June 30, |
||||
|
|
2025 |
|
2024 |
||
Cash flows from operating activities: |
|
|
|
|
|
|
Net earnings |
|
$ |
51.7 |
|
$ |
47.8 |
Adjustments to reconcile net earnings to net cash provided by operating activities: |
|
|
|
|
|
|
Depreciation and amortization |
|
|
19.0 |
|
|
19.1 |
Stock-based compensation expense |
|
|
5.3 |
|
|
4.2 |
Deferred income taxes |
|
|
0.7 |
|
|
6.1 |
Other – net |
|
|
2.6 |
|
|
1.5 |
Changes in operating assets and liabilities: |
|
|
|
|
|
|
Trade accounts receivable |
|
|
(10.6) |
|
|
(18.1) |
Inventories |
|
|
(61.6) |
|
|
6.0 |
Accounts payable |
|
|
46.7 |
|
|
6.5 |
Other assets and liabilities |
|
|
(26.1) |
|
|
(32.6) |
Net cash provided by operating activities |
|
|
27.7 |
|
|
40.5 |
|
|
|
|
|
|
|
Cash flows from investing activities: |
|
|
|
|
|
|
Expenditures for property, plant and equipment |
|
|
(27.5) |
|
|
(26.8) |
Business acquisitions, net of cash acquired |
|
|
(119.0) |
|
|
— |
Other – net |
|
|
2.5 |
|
|
0.3 |
Net cash used for investing activities |
|
|
(144.0) |
|
|
(26.5) |
|
|
|
|
|
|
|
Cash flows from financing activities: |
|
|
|
|
|
|
Net increase in debt |
|
|
172.0 |
|
|
4.5 |
Other – net |
|
|
(5.1) |
|
|
(4.5) |
Net cash provided by financing activities |
|
|
166.9 |
|
|
— |
|
|
|
|
|
|
|
Effect of exchange rate changes on cash |
|
|
2.2 |
|
|
(1.1) |
|
|
|
|
|
|
|
Net increase in cash, cash equivalents and restricted cash |
|
|
52.8 |
|
|
12.9 |
|
|
|
|
|
|
|
Cash, cash equivalents and restricted cash – beginning of period |
|
|
71.9 |
|
|
60.3 |
|
|
|
|
|
|
|
Cash, cash equivalents and restricted cash – end of period |
|
$ |
124.7 |
|
$ |
73.2 |
6
Modine Manufacturing Company
Segment operating results (unaudited)
(In millions)
|
|
Three months ended June 30, |
||||
|
|
2025 |
|
2024 |
||
Net sales: |
|
|
|
|
|
|
Climate Solutions |
|
$ |
397.4 |
|
$ |
357.3 |
Performance Technologies |
|
|
285.5 |
|
|
309.0 |
Segment total |
|
|
682.9 |
|
|
666.3 |
Corporate and eliminations |
|
|
(0.1) |
|
|
(4.8) |
Net sales |
|
$ |
682.8 |
|
$ |
661.5 |
|
|
Three months ended June 30, |
|
|||||||||
|
|
2025 |
|
|
2024 |
|
||||||
|
|
$’s |
|
% of sales |
|
|
$’s |
|
% of sales |
|
||
Gross profit: |
|
|
|
|
|
|
|
|
|
|
|
|
Climate Solutions |
|
$ |
112.9 |
|
28.4 |
% |
|
$ |
100.8 |
|
28.2 |
% |
Performance Technologies |
|
|
51.9 |
|
18.2 |
% |
|
|
63.5 |
|
20.6 |
% |
Segment total |
|
|
164.8 |
|
24.1 |
% |
|
|
164.3 |
|
24.7 |
% |
Corporate and eliminations |
|
|
0.6 |
|
— |
|
|
|
(1.7) |
|
— |
|
Gross profit |
|
$ |
165.4 |
|
24.2 |
% |
|
$ |
162.6 |
|
24.6 |
% |
|
|
Three months ended June 30, |
||||
|
|
2025 |
|
2024 |
||
Operating income: |
|
|
|
|
|
|
Climate Solutions |
|
$ |
66.9 |
|
$ |
59.8 |
Performance Technologies |
|
|
26.5 |
|
|
31.5 |
Segment total |
|
|
93.4 |
|
|
91.3 |
Corporate and eliminations |
|
|
(17.7) |
|
|
(16.9) |
Operating income |
|
$ |
75.7 |
|
$ |
74.4 |
7
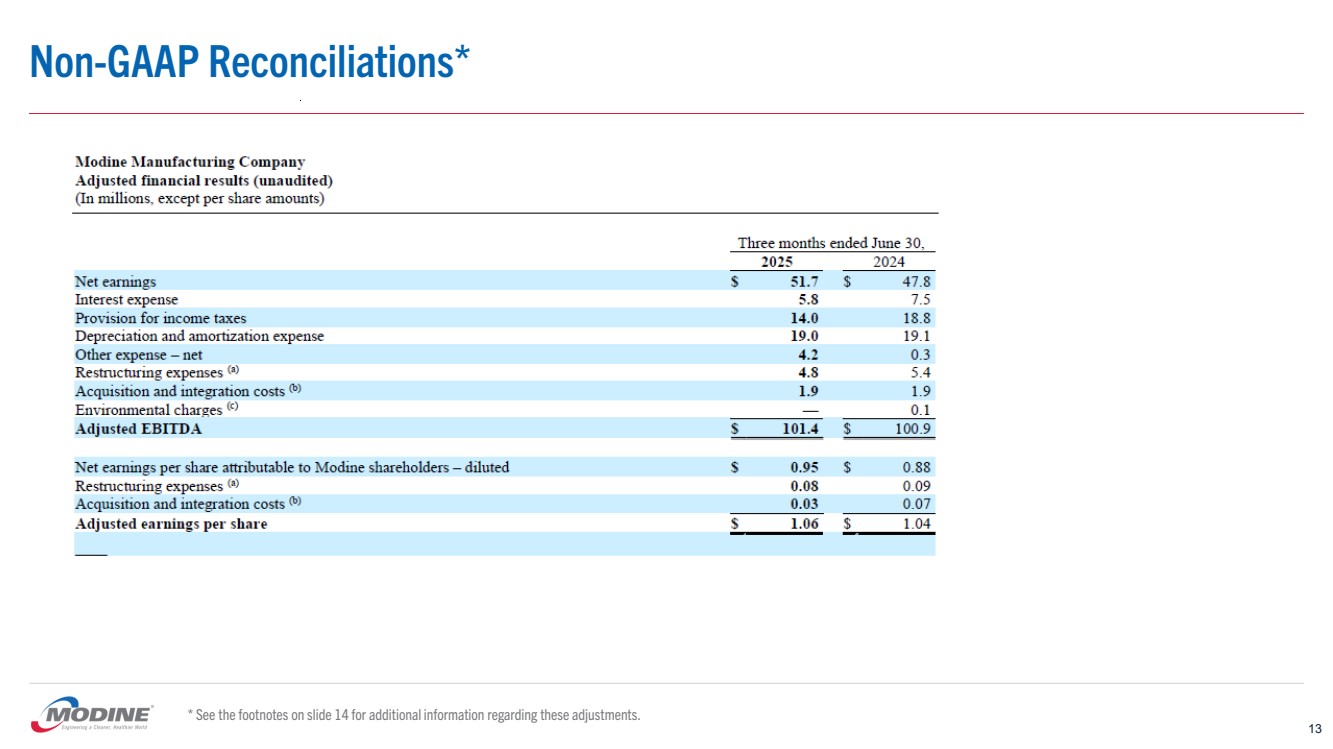
Modine Manufacturing Company
Adjusted financial results (unaudited)
(In millions, except per share amounts)
|
|
Three months ended June 30, |
||||
|
|
2025 |
|
2024 |
||
Net earnings |
|
$ |
51.7 |
|
$ |
47.8 |
Interest expense |
|
|
5.8 |
|
|
7.5 |
Provision for income taxes |
|
|
14.0 |
|
|
18.8 |
Depreciation and amortization expense |
|
|
19.0 |
|
|
19.1 |
Other expense – net |
|
|
4.2 |
|
|
0.3 |
Restructuring expenses (a) |
|
|
4.8 |
|
|
5.4 |
Acquisition and integration costs (b) |
|
|
1.9 |
|
|
1.9 |
Environmental charges (c) |
|
|
— |
|
|
0.1 |
Adjusted EBITDA |
|
$ |
101.4 |
|
$ |
100.9 |
|
|
|
|
|
|
|
Net earnings per share attributable to Modine shareholders – diluted |
|
$ |
0.95 |
|
$ |
0.88 |
Restructuring expenses (a) |
|
|
0.08 |
|
|
0.09 |
Acquisition and integration costs (b) |
|
|
0.03 |
|
|
0.07 |
Adjusted earnings per share |
|
$ |
1.06 |
|
$ |
1.04 |
____ |
|
|
|
|
|
|
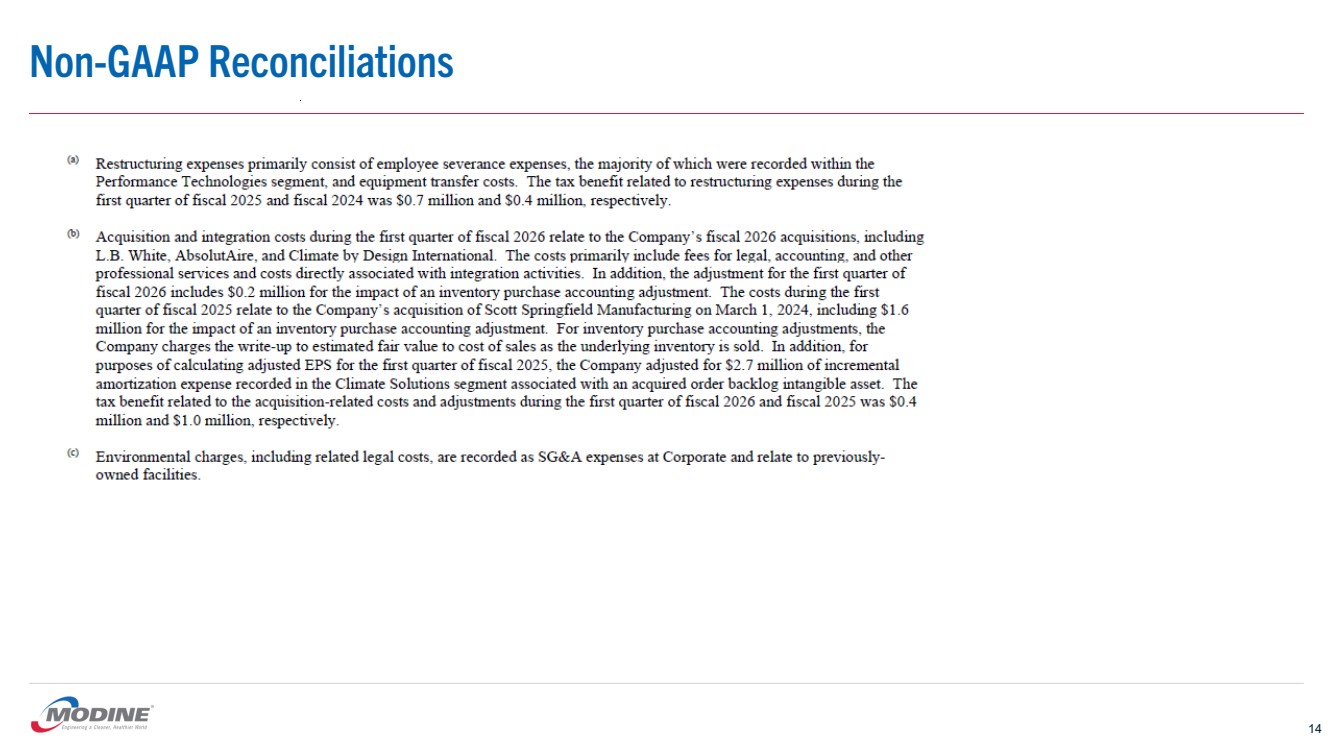
| (a) | Restructuring expenses primarily consist of employee severance expenses, the majority of which were recorded within the Performance Technologies segment, and equipment transfer costs. The tax benefit related to restructuring expenses during the first quarter of fiscal 2025 and fiscal 2024 was $0.7 million and $0.4 million, respectively. |
| (b) | Acquisition and integration costs during the first quarter of fiscal 2026 relate to the Company’s fiscal 2026 acquisitions, including L.B. White, AbsolutAire, and Climate by Design International. The costs primarily include fees for legal, accounting, and other professional services and costs directly associated with integration activities. In addition, the adjustment for the first quarter of fiscal 2026 includes $0.2 million for the impact of an inventory purchase accounting adjustment. The costs during the first quarter of fiscal 2025 relate to the Company’s acquisition of Scott Springfield Manufacturing on March 1, 2024, including $1.6 million for the impact of an inventory purchase accounting adjustment. For inventory purchase accounting adjustments, the Company charges the write-up to estimated fair value to cost of sales as the underlying inventory is sold. In addition, for purposes of calculating adjusted EPS for the first quarter of fiscal 2025, the Company adjusted for $2.7 million of incremental amortization expense recorded in the Climate Solutions segment associated with an acquired order backlog intangible asset. The tax benefit related to the acquisition-related costs and adjustments during the first quarter of fiscal 2026 and fiscal 2025 was $0.4 million and $1.0 million, respectively. |
| (c) | Environmental charges, including related legal costs, are recorded as SG&A expenses at Corporate and relate to previously-owned facilities. |
8
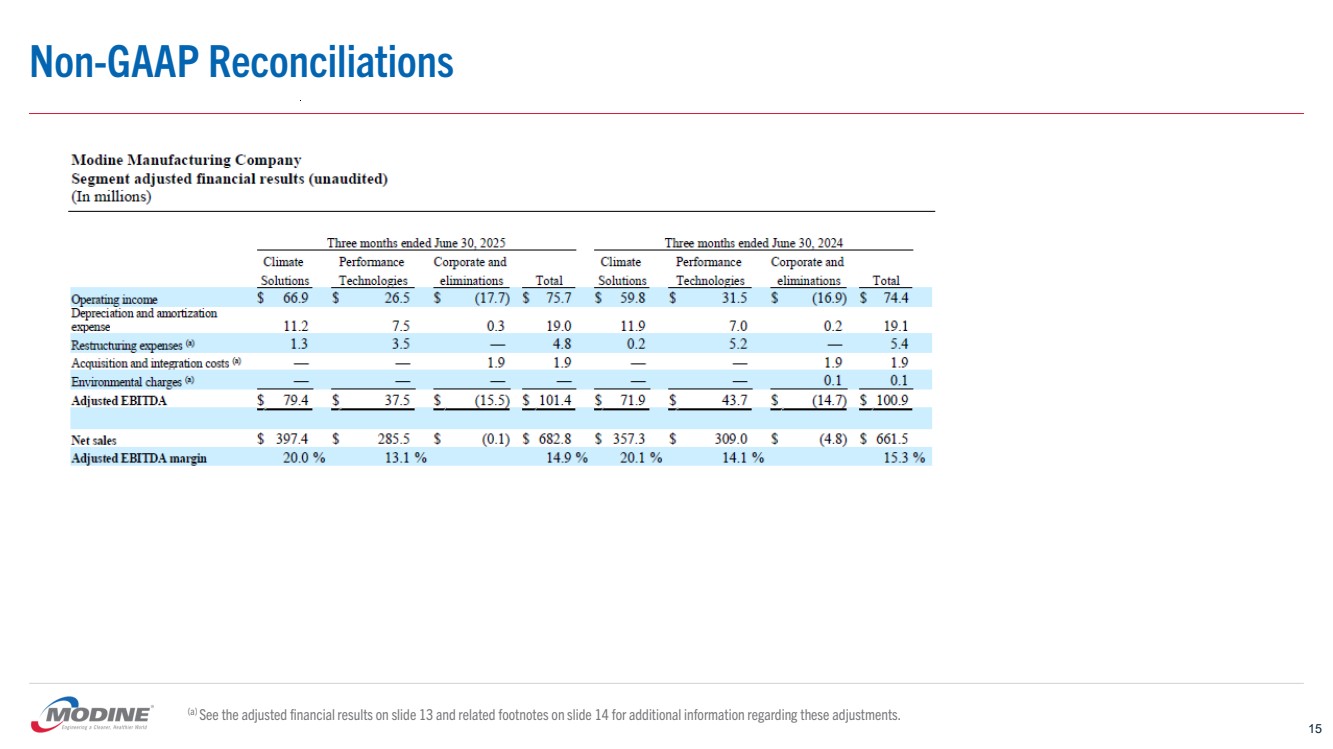
Modine Manufacturing Company
Segment adjusted financial results (unaudited)
(In millions)
|
|
Three months ended June 30, 2025 |
|
Three months ended June 30, 2024 |
|
||||||||||||||||||||
|
|
Climate |
|
Performance |
|
Corporate and |
|
|
|
|
Climate |
|
Performance |
|
Corporate and |
|
|
|
|
||||||
|
|
Solutions |
|
Technologies |
|
eliminations |
|
Total |
|
Solutions |
|
Technologies |
|
eliminations |
|
Total |
|
||||||||
Operating income |
|
$ |
66.9 |
|
$ |
26.5 |
|
$ |
(17.7) |
|
$ |
75.7 |
|
$ |
59.8 |
|
$ |
31.5 |
|
$ |
(16.9) |
|
$ |
74.4 |
|
Depreciation and amortization expense |
|
|
11.2 |
|
|
7.5 |
|
|
0.3 |
|
|
19.0 |
|
|
11.9 |
|
|
7.0 |
|
|
0.2 |
|
|
19.1 |
|
Restructuring expenses (a) |
|
|
1.3 |
|
|
3.5 |
|
|
— |
|
|
4.8 |
|
|
0.2 |
|
|
5.2 |
|
|
— |
|
|
5.4 |
|
Acquisition and integration costs (a) |
|
|
— |
|
|
— |
|
|
1.9 |
|
|
1.9 |
|
|
— |
|
|
— |
|
|
1.9 |
|
|
1.9 |
|
Environmental charges (a) |
|
|
— |
|
|
— |
|
|
— |
|
|
— |
|
|
— |
|
|
— |
|
|
0.1 |
|
|
0.1 |
|
Adjusted EBITDA |
|
$ |
79.4 |
|
$ |
37.5 |
|
$ |
(15.5) |
|
$ |
101.4 |
|
$ |
71.9 |
|
$ |
43.7 |
|
$ |
(14.7) |
|
$ |
100.9 |
|
|
|
|
|
|
|
|
|
|
|
|
|
|
|
|
|
|
|
|
|
|
|
|
|
|
|
Net sales |
|
$ |
397.4 |
|
$ |
285.5 |
|
$ |
(0.1) |
|
$ |
682.8 |
|
$ |
357.3 |
|
$ |
309.0 |
|
$ |
(4.8) |
|
$ |
661.5 |
|
Adjusted EBITDA margin |
|
|
20.0 |
% |
|
13.1 |
% |
|
|
|
|
14.9 |
% |
|
20.1 |
% |
|
14.1 |
% |
|
|
|
|
15.3 |
% |
____ |
|
|
|
|
|
|
|
|
|
|
|
|
|
|
|
|
|
|
|
|
|
|
|
|
|
| (a) | See the Adjusted EBITDA reconciliations on the previous page for information on restructuring expenses and other adjustments. |
9
Modine Manufacturing Company
Net debt (unaudited)
(In millions)
|
|
June 30, 2025 |
|
March 31, 2025 |
||
Debt due within one year |
|
$ |
45.0 |
|
$ |
54.1 |
Long-term debt |
|
|
482.1 |
|
|
296.7 |
Total debt |
|
|
527.1 |
|
|
350.8 |
|
|
|
|
|
|
|
Less: cash and cash equivalents |
|
|
124.5 |
|
|
71.6 |
Net debt |
|
$ |
402.6 |
|
$ |
279.2 |
Free cash flow (unaudited)
(In millions)
|
|
Three months ended June 30, |
||||
|
|
2025 |
|
2024 |
||
Net cash provided by operating activities |
|
$ |
27.7 |
|
$ |
40.5 |
Expenditures for property, plant and equipment |
|
|
(27.5) |
|
|
(26.8) |
Free cash flow |
|
$ |
0.2 |
|
$ |
13.7 |
Organic sales and organic sales growth (unaudited)
(In millions)
|
|
Three months ended June 30, 2025 |
|
Three months ended June 30, 2024 |
|
|
|
|||||||||||||||||
|
|
|
|
|
Effect of |
|
|
|
|
|
|
|
|
|
|
|
Sales |
|
Organic |
|
||||
|
|
External |
|
Exchange Rate |
|
Effect of |
|
Organic |
|
External |
|
Effect of |
|
Excluding |
|
Sales |
|
|||||||
|
|
Sales |
|
Changes |
|
Acquisitions |
|
Sales |
|
Sales |
|
Dispositions |
|
Dispositions |
|
Growth |
|
|||||||
Net sales: |
|
|
|
|
|
|
|
|
|
|
|
|
|
|
|
|
|
|
|
|
|
|
|
|
Climate Solutions |
|
$ |
397.3 |
|
$ |
(6.1) |
|
$ |
(10.0) |
|
$ |
381.2 |
|
$ |
357.2 |
|
$ |
— |
|
$ |
357.2 |
|
7 |
% |
Performance Technologies |
|
|
285.5 |
|
|
(2.0) |
|
|
— |
|
|
283.5 |
|
|
304.3 |
|
|
— |
|
|
304.3 |
|
(7) |
% |
Net Sales |
|
$ |
682.8 |
|
$ |
(8.1) |
|
$ |
(10.0) |
|
$ |
664.7 |
|
$ |
661.5 |
|
$ |
— |
|
$ |
661.5 |
|
— |
% |
|
|
|
|
|
|
|
|
|
|
|
|
|
|
|
|
|
|
|
|
|
|
|
|
|
10
SOURCE: Modine
Kathleen Powers
(262) 636-1687
kathleen.t.powers@modine.com
11
|
First Quarter Fiscal 2026 July 31, 2025 |
|
NEIL BRINKER President and Chief Executive Officer MICK LUCARELI Executive Vice President and Chief Financial Officer KATHY POWERS Vice President, Treasurer, and Investor Relations 2 |
|
Forward-Looking Statements 3 This presentation contains statements, including information about future financial performance and market conditions, accompanied by phrases such as “believes,” “estimates,” “expects,” “plans,” “anticipates,” “intends,” “projects,” and other similar “forward-looking” statements, as defined in the Private Securities Litigation Reform Act of 1995. Modine's actual results, performance or achievements may differ materially from those expressed or implied in these statements because of certain risks and uncertainties, including, but not limited to those described under “Risk Factors” in Item 1A of Part I of the Company's Annual Report on Form 10-K for the year ended March 31, 2025 and under Forward-Looking Statements in Item 7 of Part II of that same report. Other risks and uncertainties include, but are not limited to, the following: the impact of potential adverse developments or disruptions in the global economy and financial markets, including impacts related to inflation, energy costs, government incentive or funding programs, supply chain challenges or supplier constraints, logistical disruptions, tariffs, sanctions and other trade issues or cross-border trade restrictions; the impact of other economic, social and political conditions, changes and challenges in the markets where we operate and compete, including foreign currency exchange rate fluctuations, changes in interest rates, tightening of the credit markets, recession or recovery therefrom, restrictions associated with importing and exporting and foreign ownership, public health crises, and the general uncertainties, including the impact on demand for our products and the markets we serve from regulatory and/or policy changes that have been or may be implemented in the U.S. or abroad, including those related to tax and trade, climate change, public health threats, and military conflicts, including the conflicts in Ukraine and in the Middle East and tensions in the Red Sea; the overall health and pricing focus of our customers; changes or threats to the market growth prospects for our customers; our ability to successfully realize anticipated benefits, including improved profit margins and cash flow, from our strategic initiatives and our application of 80/20 principles across our businesses; our ability to be at the forefront of technological advances and the impacts of any changes in the adoption rate of technologies that we expect to drive sales growth; our ability to accelerate growth organically and through acquisitions and successfully integrate acquired businesses; our ability to successfully exit portions of our business that do not align with our strategic plans; our ability to effectively and efficiently manage our operations in response to sales volume changes, including maintaining adequate production capacity to meet demand in our growing businesses while also completing restructuring activities and realizing benefits thereof; our ability to fund our global liquidity requirements efficiently and comply with the financial covenants in our credit agreements; operational inefficiencies as a result of product or program launches, unexpected volume increases or decreases, product transfers and warranty claims; the impact on Modine of any significant increases in commodity prices, particularly aluminum, copper, steel and stainless steel (nickel) and other purchased components and related costs, and our ability to adjust product pricing in response to any such increases; our ability to recruit and maintain talent in managerial, leadership, operational and administrative functions and to mitigate increased labor costs; our ability to protect our proprietary information and intellectual property from theft or attack; the impact of any substantial disruption or material breach of our information technology systems; costs and other effects of environmental investigation, remediation or litigation and the increasing emphasis on environmental, social and corporate governance matters; our ability to realize the benefits of deferred tax assets; and other risks and uncertainties identified in our public filings with the U.S. Securities and Exchange Commission. Forward-looking statements are as of the date of this presentation, and we do not assume any obligation to update any forward-looking statements. |
|
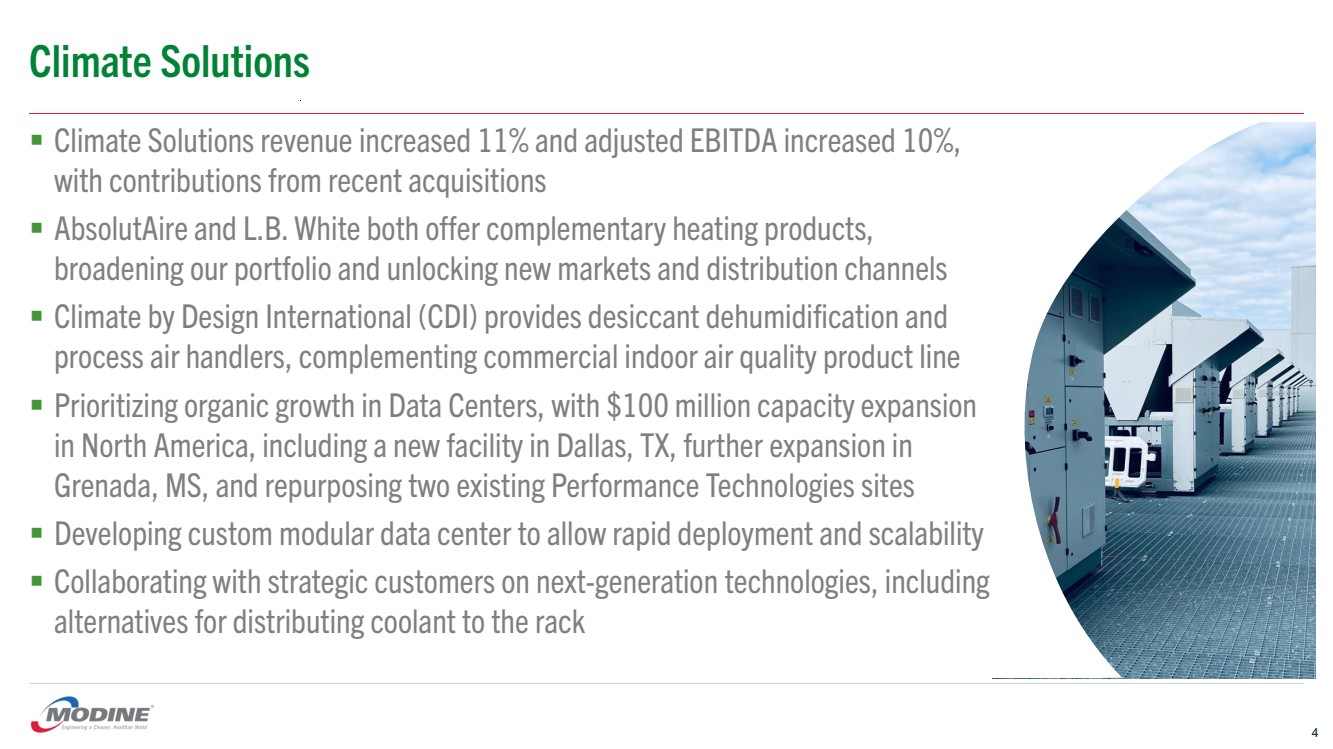
Climate Solutions 4 ▪ Climate Solutions revenue increased 11% and adjusted EBITDA increased 10%, with contributions from recent acquisitions ▪ AbsolutAire and L.B. White both offer complementary heating products, broadening our portfolio and unlocking new markets and distribution channels ▪ Climate by Design International (CDI) provides desiccant dehumidification and process air handlers, complementing commercial indoor air quality product line ▪ Prioritizing organic growth in Data Centers, with $100 million capacity expansion in North America, including a new facility in Dallas, TX, further expansion in Grenada, MS, and repurposing two existing Performance Technologies sites ▪ Developing custom modular data center to allow rapid deployment and scalability ▪ Collaborating with strategic customers on next-generation technologies, including alternatives for distributing coolant to the rack |
|
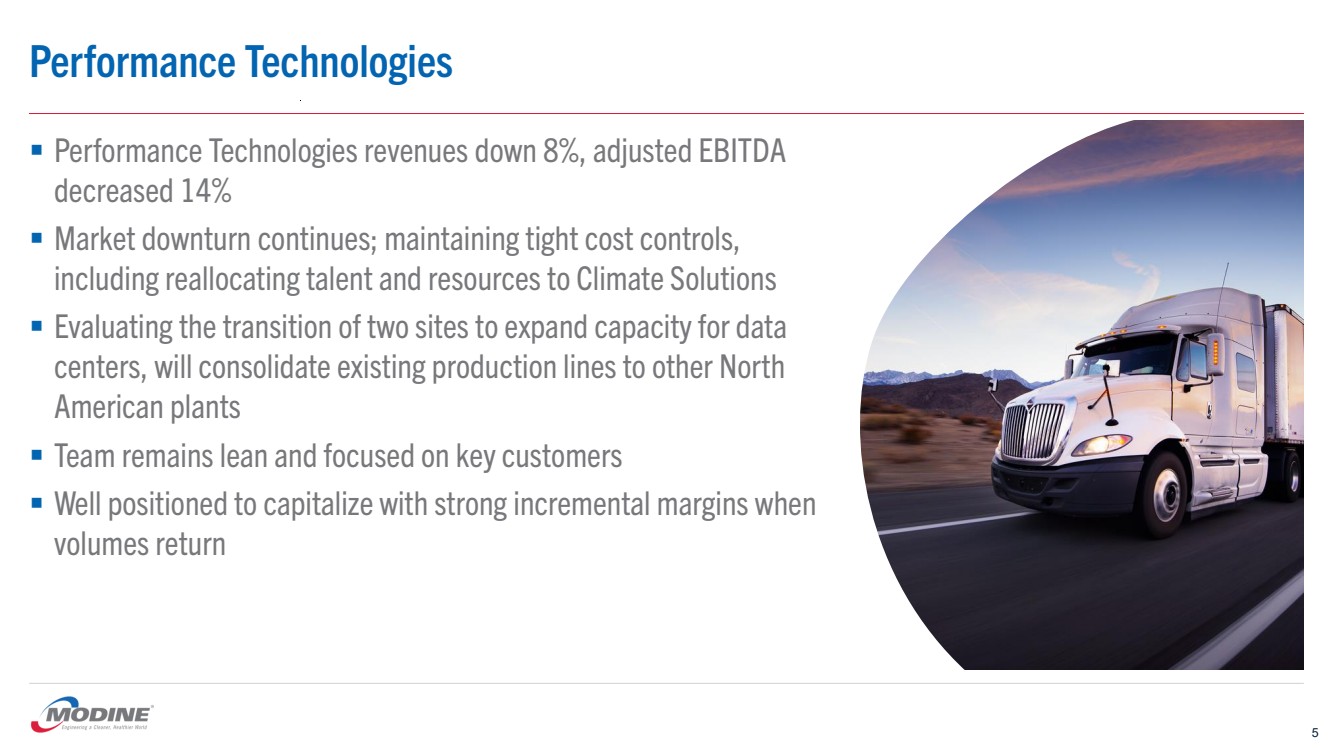
Performance Technologies ▪ Performance Technologies revenues down 8%, adjusted EBITDA decreased 14% ▪ Market downturn continues; maintaining tight cost controls, including reallocating talent and resources to Climate Solutions ▪ Evaluating the transition of two sites to expand capacity for data centers, will consolidate existing production lines to other North American plants ▪ Team remains lean and focused on key customers ▪ Well positioned to capitalize with strong incremental margins when volumes return 5 |
|
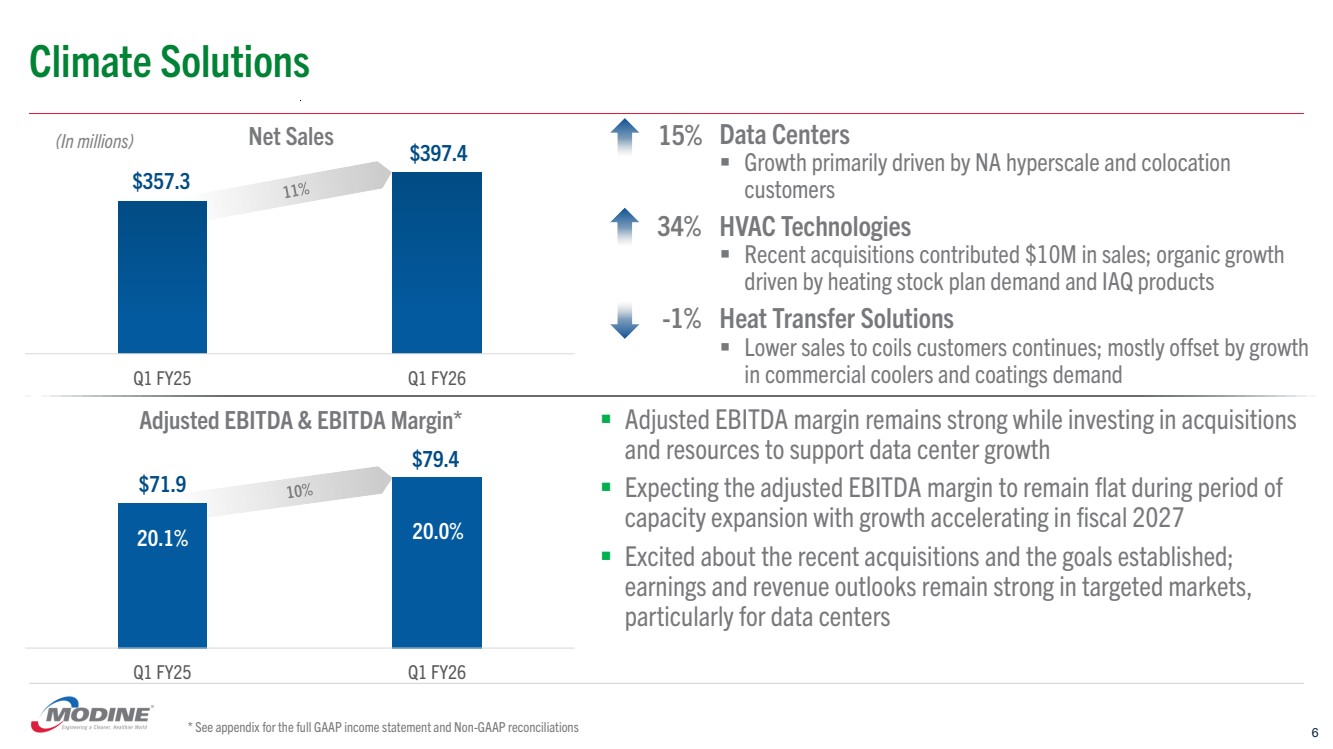
Climate Solutions 6 $357.3 $397.4 (In millions) Data Centers ▪ Growth primarily driven by NA hyperscale and colocation customers HVAC Technologies ▪ Recent acquisitions contributed $10M in sales; organic growth driven by heating stock plan demand and IAQ products Heat Transfer Solutions ▪ Lower sales to coils customers continues; mostly offset by growth in commercial coolers and coatings demand 15% 34% -1% Q1 FY25 Q1 FY26 Adjusted EBITDA & EBITDA Margin* $71.9 $79.4 20.1% 20.0% ▪ Adjusted EBITDA margin remains strong while investing in acquisitions and resources to support data center growth ▪ Expecting the adjusted EBITDA margin to remain flat during period of capacity expansion with growth accelerating in fiscal 2027 ▪ Excited about the recent acquisitions and the goals established; earnings and revenue outlooks remain strong in targeted markets, particularly for data centers * See appendix for the full GAAP income statement and Non-GAAP reconciliations Q1 FY25 Q1 FY26 Net Sales |
|
Q1 FY25 Q1 FY26 Adjusted EBITDA & EBITDA Margin* Q1 FY25 Q1 FY26 Net Sales Performance Technologies $309.0 $285.5 $43.7 $37.5 (In millions) Heavy-Duty Equipment ▪ Ongoing market softness for agriculture and construction customers, along with 80/20 product line exits On-Highway Applications ▪ Lower global sales demand for CV products, continued softness in EV auto demand, along with 80/20 product line exits ▪ Revenue impacted by anticipated market weakness and the strategic exit from lower-margin business ▪ 100 bps decrease in adjusted EBITDA margin primarily due to lower sales and higher material costs, partially offset by improved operating efficiencies and cost reductions ▪ 80/20 cost reduction actions taken last quarter resulted in $5M lower SG&A expenses ▪ Anticipating full year earnings and margin improvement -8% 14.1% 13.1% * See appendix for the full GAAP income statement and Non-GAAP reconciliations 7 -4% |
|
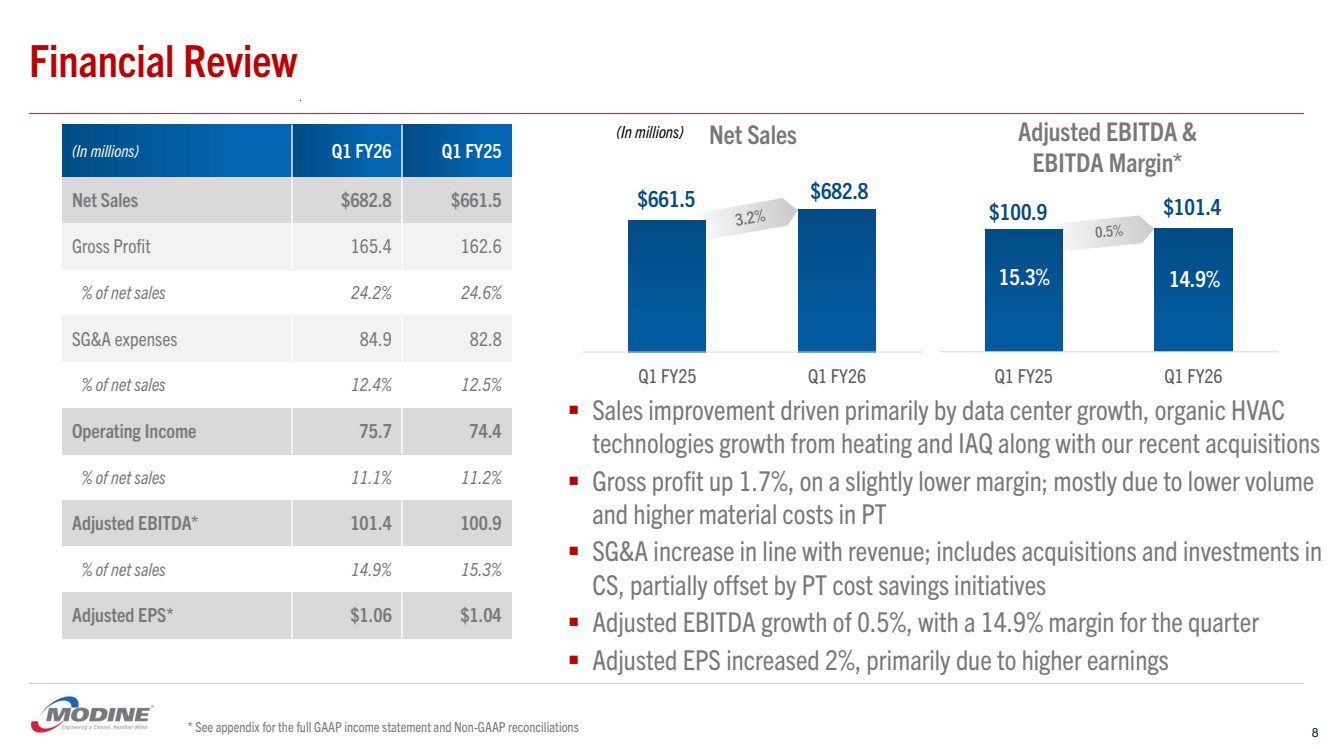
Q1 FY25 Q1 FY26 Adjusted EBITDA & EBITDA Margin* Q1 FY25 Q1 FY26 Net Sales Financial Review (In millions) Q1 FY26 Q1 FY25 Net Sales $682.8 $661.5 Gross Profit 165.4 162.6 % of net sales 24.2% 24.6% SG&A expenses 84.9 82.8 % of net sales 12.4% 12.5% Operating Income 75.7 74.4 % of net sales 11.1% 11.2% Adjusted EBITDA* 101.4 100.9 % of net sales 14.9% 15.3% Adjusted EPS* $1.06 $1.04 (In millions) $661.5 $682.8 $100.9 $101.4 ▪ Sales improvement driven primarily by data center growth, organic HVAC technologies growth from heating and IAQ along with our recent acquisitions ▪ Gross profit up 1.7%, on a slightly lower margin; mostly due to lower volume and higher material costs in PT ▪ SG&A increase in line with revenue; includes acquisitions and investments in CS, partially offset by PT cost savings initiatives ▪ Adjusted EBITDA growth of 0.5%, with a 14.9% margin for the quarter ▪ Adjusted EPS increased 2%, primarily due to higher earnings 15.3% 14.9% * See appendix for the full GAAP income statement and Non-GAAP reconciliations 8 |
|
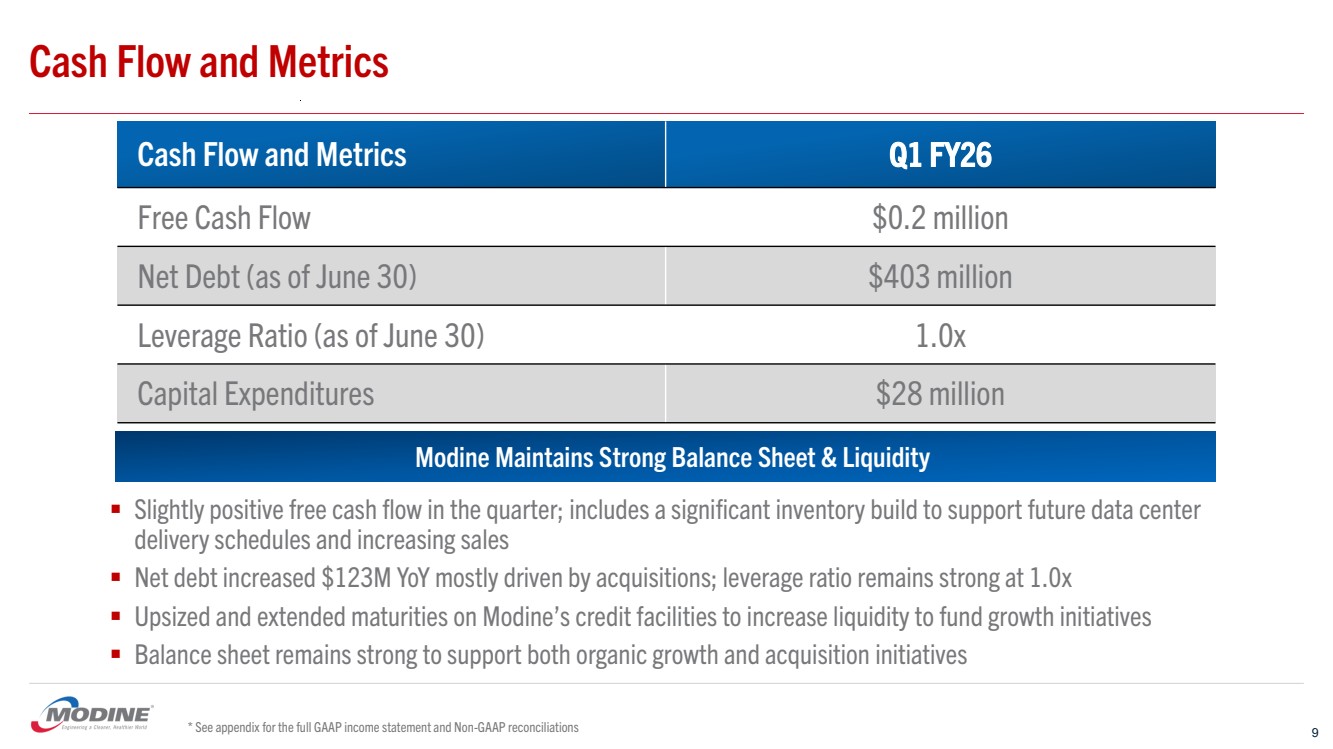
Cash Flow and Metrics Cash Flow and Metrics Q1 FY26 Free Cash Flow $0.2 million Net Debt (as of June 30) $403 million Leverage Ratio (as of June 30) 1.0x Capital Expenditures $28 million ▪ Slightly positive free cash flow in the quarter; includes a significant inventory build to support future data center delivery schedules and increasing sales ▪ Net debt increased $123M YoY mostly driven by acquisitions; leverage ratio remains strong at 1.0x ▪ Upsized and extended maturities on Modine’s credit facilities to increase liquidity to fund growth initiatives ▪ Balance sheet remains strong to support both organic growth and acquisition initiatives * See appendix for the full GAAP income statement and Non-GAAP reconciliations 9 Modine Maintains Strong Balance Sheet & Liquidity |
|
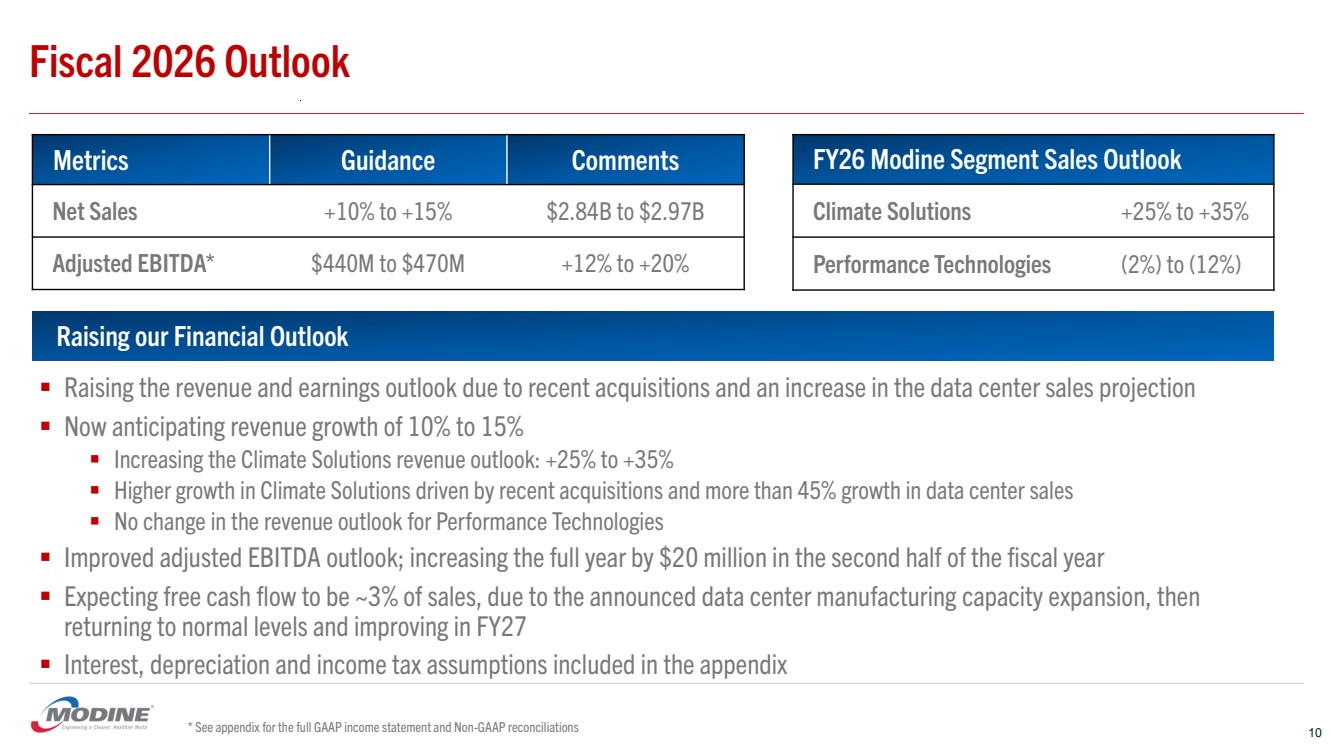
Fiscal 2026 Outlook Metrics Guidance Comments Net Sales +10% to +15% $2.84B to $2.97B Adjusted EBITDA* $440M to $470M +12% to +20% FY26 Modine Segment Sales Outlook Climate Solutions +25% to +35% Performance Technologies (2%) to (12%) * See appendix for the full GAAP income statement and Non-GAAP reconciliations Raising our Financial Outlook ▪ Raising the revenue and earnings outlook due to recent acquisitions and an increase in the data center sales projection ▪ Now anticipating revenue growth of 10% to 15% ▪ Increasing the Climate Solutions revenue outlook: +25% to +35% ▪ Higher growth in Climate Solutions driven by recent acquisitions and more than 45% growth in data center sales ▪ No change in the revenue outlook for Performance Technologies ▪ Improved adjusted EBITDA outlook; increasing the full year by $20 million in the second half of the fiscal year ▪ Expecting free cash flow to be ~3% of sales, due to the announced data center manufacturing capacity expansion, then returning to normal levels and improving in FY27 ▪ Interest, depreciation and income tax assumptions included in the appendix 10 |
|
Appendix 11 |
|
GAAP Income Statement 12 |
|
Non-GAAP Reconciliations* 13 * See the footnotes on slide 14 for additional information regarding these adjustments. |
|
Non-GAAP Reconciliations 14 |
|
Non-GAAP Reconciliations 15 (a) See the adjusted financial results on slide 13 and related footnotes on slide 14 for additional information regarding these adjustments. |
|
Non-GAAP Reconciliations 16 |
|
Non-GAAP Reconciliations 17 |
|
Forward-Looking Non-GAAP Financial Measure 18 The Company’s fiscal 2026 guidance includes adjusted EBITDA, which is a non-GAAP financial measure. The full-year fiscal 2026 guidance includes the Company’s estimates for interest expense of approximately $28 to $30 million, a provision for income taxes of approximately $78 to $86 million, and depreciation and amortization expense of approximately $89 to $93 million. The non-GAAP financial measure also excludes certain cash and non-cash expenses or gains. These expenses and gains may be significant and include items such as restructuring expenses (including severance and equipment transfer costs), acquisition and integration costs, impairment charges and certain other items. These expenses for the first three months of fiscal 2026 are presented on slide 13. The Company has agreed to sell its technical service center in Germany and expects to record a gain on sale of approximately $4 million during fiscal 2026 upon closing. Estimates of other expenses and gains for the remainder of fiscal 2026 that will be excluded for the non-GAAP financial measure are not available due to the low visibility and unpredictability of these items. |