UNITED STATES
SECURITIES AND EXCHANGE COMMISSION
Washington, D.C. 20549
FORM 8-K
CURRENT REPORT
PURSUANT TO SECTION 13 OR 15(D) OF THE
SECURITIES EXCHANGE ACT OF 1934
Date of Report (Date of earliest event reported): July 29, 2025
Camping World Holdings, Inc.
(Exact Name of Registrant as Specified in its Charter)
Delaware |
|
001-37908 |
|
81-1737145 |
(State or Other Jurisdiction of Incorporation) |
|
(Commission File Number) |
|
(IRS Employer Identification No.) |
|
2 Marriott Dr. (Address of principal executive offices) (Zip Code) |
Registrant’s telephone number, including area code (847) 808-3000 |
Not applicable
(Former Name or Former Address, if Changed Since Last Report)
Check the appropriate box below if the Form 8-K filing is intended to simultaneously satisfy the filing obligation of the registrant under any of the following provisions:
☐Written communications pursuant to Rule 425 under the Securities Act (17 CFR 230.425).
☐Soliciting material pursuant to Rule 14a-12 under the Exchange Act (17 CFR 240.14a-12).
☐Pre-commencement communications pursuant to Rule 14d-2(b) under the Exchange Act (17 CFR 240.14d-2(b)).
☐Pre-commencement communications pursuant to Rule 13e-4(c) under the Exchange Act (17 CFR 240.13e-4(c)).
Securities registered pursuant to Section 12(b) of the Act:
Title of each class |
Trading Symbol(s) |
Name of each exchange on which registered |
Class A Common Stock, |
CWH |
New York Stock Exchange |
Indicate by check mark whether the registrant is an emerging growth company as defined in Rule 405 of the Securities Act of 1933 (§230.405 of this chapter) or Rule 12b-2 of the Securities Exchange Act of 1934 (§240.12b-2 of this chapter).
Emerging growth company ☐
If an emerging growth company, indicate by check mark if the registrant has elected not to use the extended transition period for complying with any new or revised financial accounting standards provided pursuant to Section 13(a) of the Exchange Act. ☐
Item 2.02. Results of Operations and Financial Condition.
On July 29, 2025, Camping World Holdings, Inc. (the “Company”) announced its financial results for the three and six months ended June 30, 2025. The full text of the press release issued in connection with the announcement is furnished as Exhibit 99.1 to this Current Report on Form 8-K.
The information in this Item 2.02 of this Current Report on Form 8-K (including Exhibit 99.1) shall not be deemed “filed” for purposes of Section 18 of the Securities Exchange Act of 1934, as amended (the “Exchange Act”) or otherwise subject to the liabilities of that section, nor shall it be deemed incorporated by reference in any filing under the Securities Act of 1933, as amended, or the Exchange Act, except as expressly set forth by specific reference in such a filing.
Item 7.01. Regulation FD Disclosure.
Beginning July 29, 2025, the Company plans to meet with investors and analysts where it expects to discuss sales trends in the Company’s business and industry, as well as a general business update. The presentation materials that will be used in these meetings are furnished hereto as Exhibit 99.2 and are incorporated herein by reference.
The information in Item 7.01 of this Current Report on Form 8-K, including Exhibit 99.2 hereto, shall not be deemed “filed” for purposes of Section 18 of the Exchange Act, or otherwise subject to the liabilities of that Section, nor shall it be deemed to be incorporated by reference into any filing of the Company under the Securities Act of 1933, as amended, or the Exchange Act, except as expressly set forth by specific reference in such filing.
Item 9.01 Financial Statements and Exhibits.
(d) Exhibits
Exhibit 99.1 relating to Item 2.02 and Exhibit 99.2 relating to Item 7.01 shall be deemed to be furnished, and not filed:
Exhibit No. Description
Exhibit 99.1 |
Exhibit 99.2 |
Exhibit 104 |
Cover Page Interactive Data File - the cover page XBRL tags are embedded within the Inline XBRL document |
SIGNATURES
Pursuant to the requirements of the Securities Exchange Act of 1934, the registrant has duly caused this report to be signed on its behalf by the undersigned hereunto duly authorized.
|
CAMPING WORLD HOLDINGS, INC. |
|
|
|
|
|
|
|
|
By: |
/s/ Thomas E. Kirn |
|
Name: |
Thomas E. Kirn |
|
Title: |
Chief Financial Officer |
Date: July 29, 2025
Exhibit 99.1
Camping World Holdings, Inc. Reports Second Quarter 2025 Results, Grows Net Income and Adjusted EBITDA by More Than 30% Driven by Strong Cost Execution and All-Time Quarterly Volume Record of Over 45,000 Units, Momentum Continues Through July
LINCOLNSHIRE, IL – July 29, 2025 (BUSINESS WIRE) -- Camping World Holdings, Inc. (NYSE: CWH) (the “Company” or “CWH”), the World’s Largest Recreational Vehicle Dealer, today reported results for the second quarter ended June 30, 2025.
Marcus Lemonis, Chairman and Chief Executive Officer of CWH stated, “I am unbelievably pleased with our Company’s financial performance in the quarter, driven by volume, margin performance and aggressive cost controls. We continue to surgically manage our inventory to find volume and gross profit opportunities leveraging our new and used supply chains, our contract manufacturing relationships, our sophisticated data analytics, and the strength of our balance sheet to put the right inventory on the ground at the right time and the right price. Our nimbleness is a true testament to the differentiation and durability of our model.”
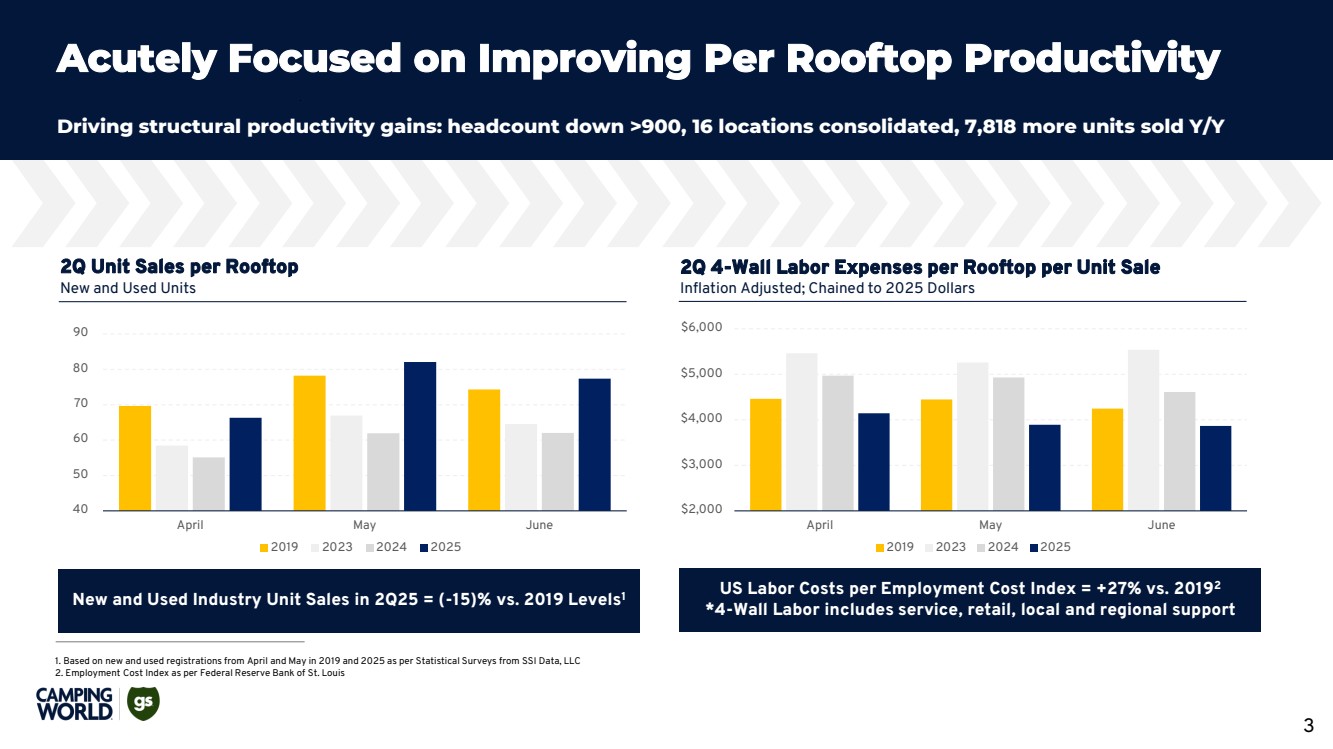
Mr. Lemonis continued, “We have made structural changes to our fixed costs compared to last year, reducing our headcount by over 900, consolidating 16 locations, and selling 7,818 more units; meaningfully improving our per-rooftop productivity and proving we can adapt to the near-term ASP contribution margin environment in new vehicles.”
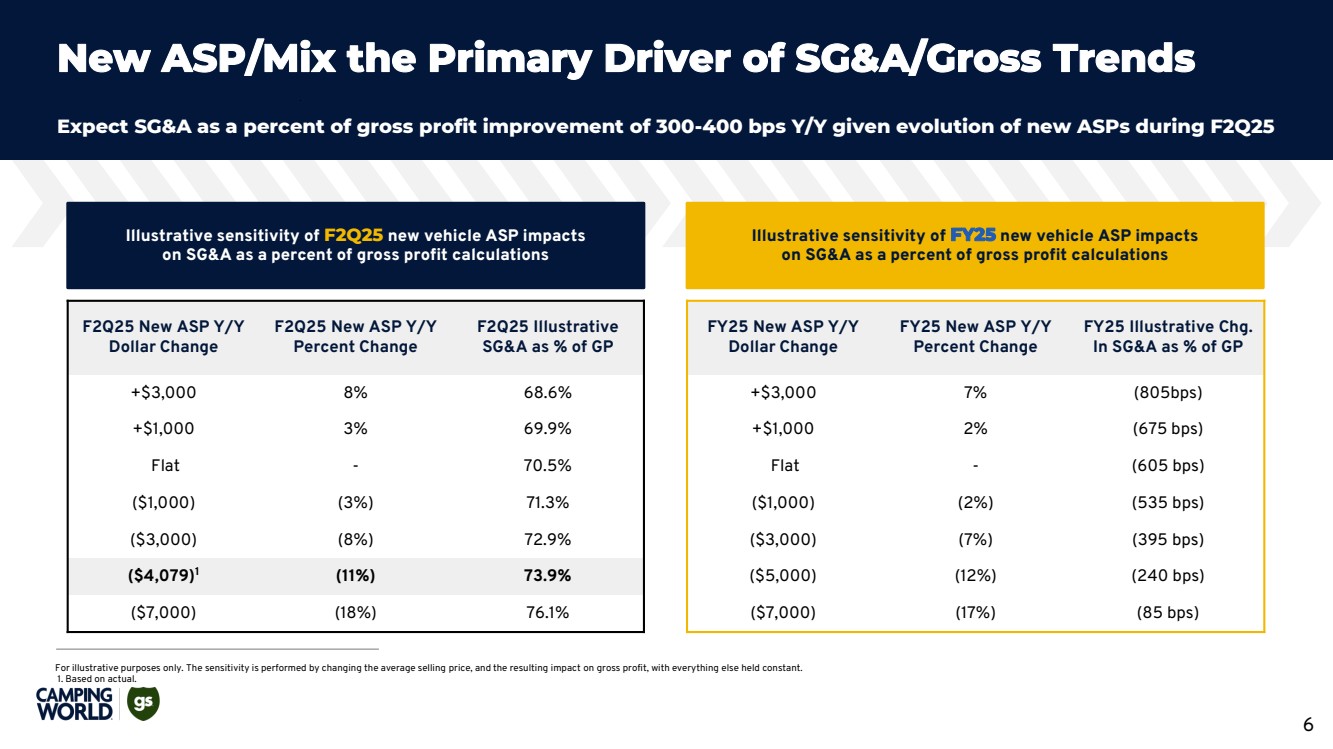
Matthew Wagner, President of CWH commented, “Our same store unit growth trends July month-to-date are tracking up high-teens percent on used vehicles and up high-singles on new vehicles compared to the prior year, both in line on a multi-year basis with our second quarter performance. Our guideposts for the full year remain largely unchanged, although our new unit volume is now expected to be higher, growing in excess of high-singles compared to the prior year. New vehicle ASP is expected to improve seasonally in the third and fourth quarter but could be lower by 10-12% for the full year compared to the prior year. Despite this drop in ASP we are expecting to accomplish 300-400 basis points of improvement in SG&A as a percentage of gross profit(1), recognizing that this efficiency will improve further as ASPs rebound.”
Tom Kirn, Chief Financial Officer of CWH commented, “We expect cash flow to benefit from the passage of the One Big Beautiful Bill Act through the immediate deductibility of floorplan interest expense on travel trailers and fifth wheels. We estimate annual cash tax savings of $15 to $20 million in 2025 and expect to prioritize debt paydown and deleveraging activities with those savings. Including payments in July 2025, we’ve paid down debt by over $75 million in total since October of last year.”
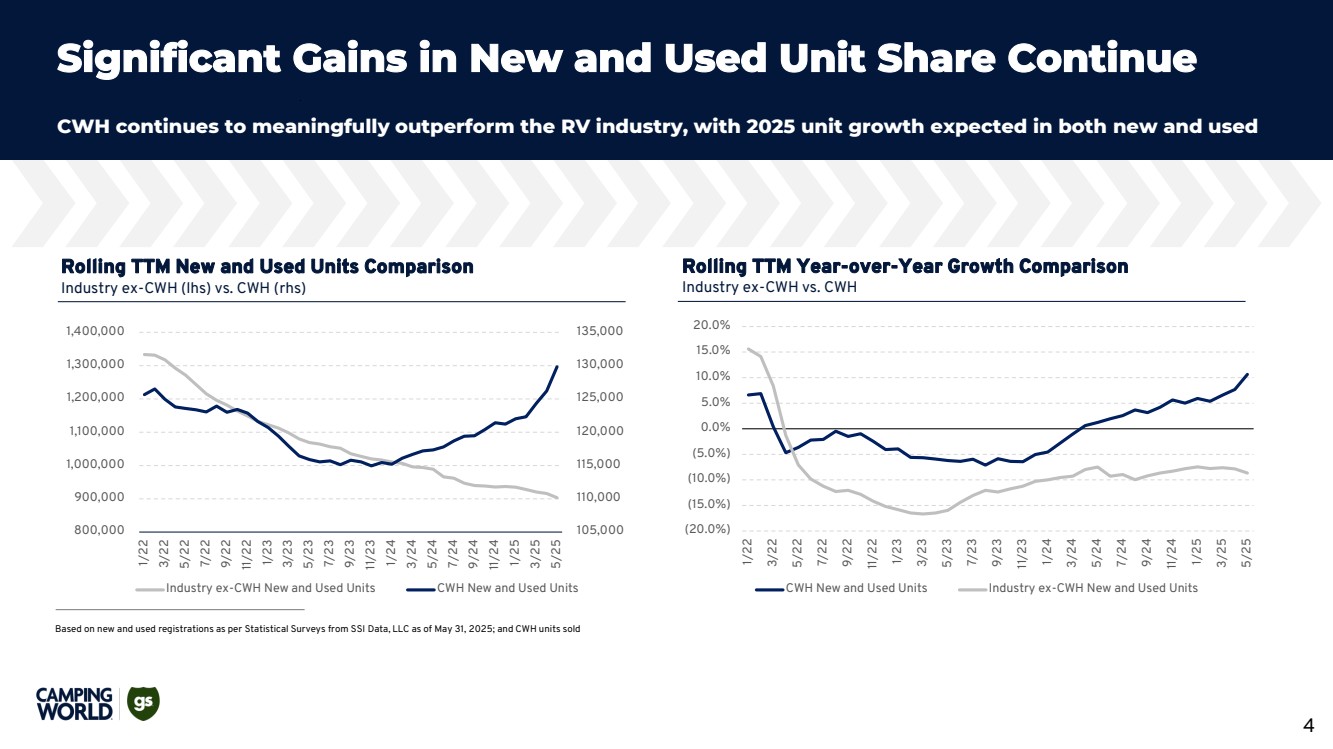
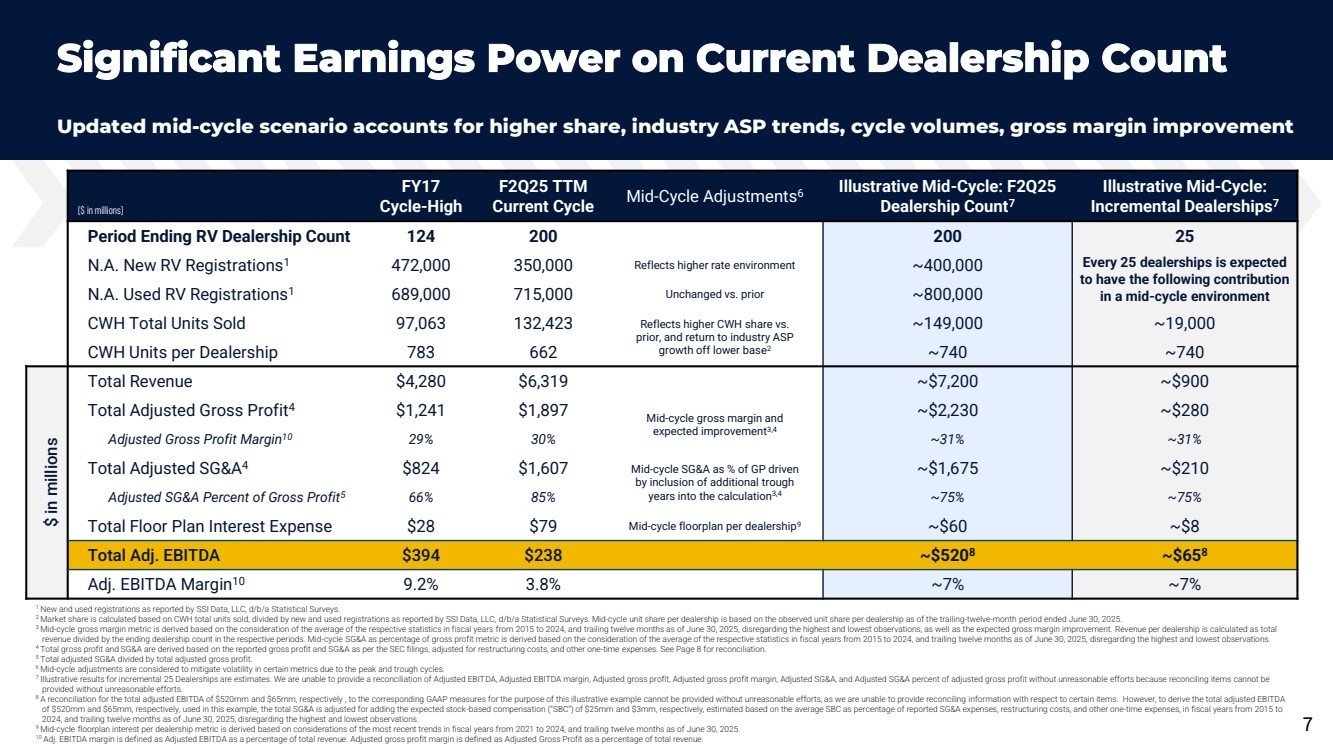
Mr. Lemonis concluded, “We enter the second half more confident than ever in our mid-cycle earnings power scenario of over $500 million of adjusted EBITDA based on today’s store count(2), particularly as the Company’s per rooftop productivity accelerates, resulting in better earnings, better leverage, and a greater willingness to explore new market expansion opportunities. Given results year-to-date, we believe that more upside exists in the 15% new and used combined market share goal we set last year, with 20% plus emerging as a realistic medium-term goal. The team also set an internal mandate to accelerate gross margin by 100 basis points, further bolstering our confidence in the earnings power of our business model.”
Please refer to the Company’s investor presentation slide deck, dated July 2025, on the Investor Relations website at http://investor.campingworld.com for more detailed information on second quarter 2025 results.
Second Quarter-over-Quarter Operating Highlights
| ● | Revenue was $2.0 billion for the second quarter, an increase of $169.4 million, or 9.4%. |
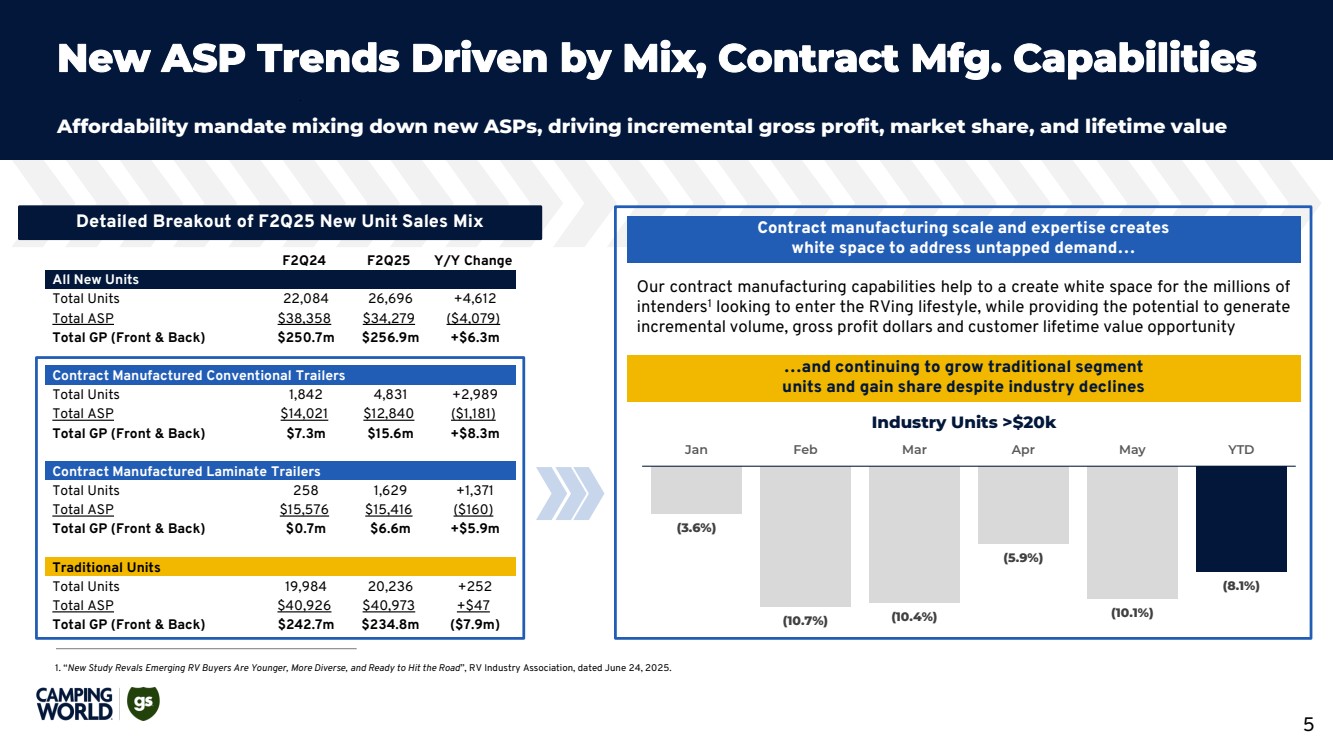
| ● | New vehicle revenue was $915.1 million for the second quarter, an increase of $68.0 million, or 8.0%, and new vehicle unit sales were 26,696 units, an increase of 4,612 units, or 20.9%. Used vehicle revenue was $572.3 million for the second quarter, an increase of $91.5 million, or 19.0%, and used vehicle unit |
1
| sales were 18,906 units, an increase of 3,206 units, or 20.4%. Combined new and used vehicle unit sales were 45,602, an increase of 7,818 units, or 20.7%. |
| ● | Average selling price of new vehicles sold decreased 10.6% and average selling price of used vehicles sold decreased 1.2%. |
| ● | Same store new vehicle unit sales increased 22.2% for the second quarter and same store used vehicle unit sales increased 20.8%. Combined same store new and used vehicle unit sales increased 21.6%. |
| ● | New vehicle gross margin was 13.8%, a decrease of 149 basis points, driven primarily by the 10.6% decrease in the average selling price per new vehicle sold, partially offset by a 9.1% reduction in the average cost per new vehicle sold. Used vehicle gross margin was 20.5%, an increase of 149 basis points, primarily due to a 3.0% decrease in the average cost per unit sold, partially offset by the 1.2% lower average selling price. |
| ● | Products, service and other revenue was $222.9 million, a decrease of $13.1 million, or 5.5%, driven primarily by a reallocation of service labor toward used inventory reconditioning and the divestiture of our RV furniture business in May 2024. Products, service and other gross margin was 47.8%, an increase of 411 basis points, driven by the divestiture of the RV furniture business, which had negative gross margins for the three months ended June 30, 2024, and increased sales volume of our higher-margin aftermarket part assortment. |
| ● | Gross profit was $592.3 million, an increase of $44.6 million, or 8.1%, and total gross margin was 30.0%, a decrease of 34 basis points. The gross profit increase was mainly driven by the $25.9 million higher used vehicle gross profit from the increase in used vehicle unit sales and gross margin as discussed above and $22.2 million increased finance and insurance, net (“F&I”) gross profit largely from the 20.7% increase in combined new and used vehicle unit sales and new F&I offerings. The gross margin decrease was primarily from higher roadside assistance claim costs that drove the 777 basis point decrease in Good Sam Services and Plans gross margin to 59.5%, which was mostly offset by improvements for used vehicles and products, service and other discussed above. |
| ● | Selling, general and administrative expenses (“SG&A”) were $437.5 million, an increase of $17.8 million, or 4.2%. This increase was primarily driven by a $7.5 million increase in employee cash compensation costs, a $3.0 million increase in employee stock-based compensation (“SBC”) expense, $2.9 million of additional advertising expenses, and an additional $3.3 million for other outside service providers. SG&A Excluding SBC(3) was $429.1 million, an increase of $14.8 million, or 3.6%. |
| ● | Floor plan interest expense was $21.0 million, a decrease of $6.8 million, or 24.5%, as a result of lower interest rates and lower principal balances. Other interest expense, net was $30.8 million, a decrease of $5.3 million, or 14.7%, as a result of lower interest rates and, to a lesser extent, lower principal balances. |
| ● | Net income was $57.5 million for the second quarter of 2025, an improvement of $34.1 million, or 145.7%. Adjusted EBITDA(3) was $142.2 million, an increase of $36.6 million, or 34.7%. |
| ● | Diluted earnings per share of Class A common stock was $0.48, an improvement of $0.26, or 118.2%. Adjusted earnings per share – diluted(3) of Class A common stock was $0.57, an improvement of $0.19, or 50.0%. |
| ● | The total number of our store locations was 201 as of June 30, 2025, a net decrease of 14 store locations from June 30, 2024, or 6.5%, which included the consolidation of 16 store locations to improve the overall cost efficiency of the remaining store locations. |
| (1) | Refers to a comparison to the baseline of SG&A as a percentage of gross profit of 86.2% as calculated from the $1.6 billion of SG&A and $1.8 billion total of gross profit for the year ended December 31, 2024. |
| (2) | See the investor presentation, dated July 29, 2025, as an exhibit to Form 8-K filed with the Securities and Exchange Commission (“SEC”) on July 29, 2025 and available on the Company’s Investor Relations website at http://investor.campingworld.com. |
| (3) | Adjusted earnings per share – diluted, Adjusted EBITDA, and SG&A Excluding SBC are non-GAAP measures. For a reconciliation of these non-GAAP measures to the most directly comparable GAAP measures, see the “Non-GAAP Financial Measures” section later in this press release. |
2
Revisions to Prior Period Condensed Consolidated Financial Statements
Subsequent to the issuance of the Company's condensed consolidated financial statements for the three and six months ended June 30, 2024, the Company's management identified prior period misstatements related to the measurement of the realizable portion of the Company’s outside basis difference deferred tax asset in CWGS Enterprises, LLC (“CWGS, LLC”), including the associated valuation allowance. As a result, deferred tax assets, net, additional paid-in capital, and income tax benefit (expense) as of and for the years ended December 31, 2023 and 2022 were revised in the Company’s Annual Report on Form 10-K for the year ended December 31, 2024 filed with the SEC on February 28, 2025. The misstatements impacted the beginning balances of deferred taxes, net, additional paid-in capital, and retained earnings, which have been revised from the amounts previously reported as of June 30, 2024. The Company evaluated the materiality of these errors, both qualitatively and quantitatively, and determined the effect of these revisions was not material to the previously issued financial statements.
The following table presents the effect of the immaterial misstatements on the Company’s consolidated balance sheet for the period indicated:
|
|
As of June 30, 2024 |
|||||||
($ in thousands) |
|
As Previously Reported |
|
Adjustment |
|
As Revised |
|||
Deferred tax assets, net |
|
$ |
150,105 |
|
$ |
43,768 |
|
$ |
193,873 |
Total assets |
|
|
4,962,108 |
|
|
43,768 |
|
|
5,005,876 |
Additional paid-in capital |
|
|
100,076 |
|
|
33,385 |
|
|
133,461 |
Retained earnings |
|
|
161,434 |
|
|
10,383 |
|
|
171,817 |
Total stockholders' equity attributable to Camping World Holdings, Inc. |
|
|
105,894 |
|
|
43,768 |
|
|
149,662 |
Total stockholders' equity |
|
|
166,637 |
|
|
43,768 |
|
|
210,405 |
Total liabilities and stockholders' equity |
|
|
4,962,108 |
|
|
43,768 |
|
|
5,005,876 |
Earnings Conference Call and Webcast Information
A conference call to discuss the Company’s second quarter 2025 financial results is scheduled for July 30, 2025, at 7:30 am Central Time. Investors and analysts can participate on the conference call by dialing 1-844-826-3035 (international callers please dial 1-412-317-5195) and using conference ID# 10201490. Interested parties can also listen to a live webcast or replay of the conference call by logging on to the Investor Relations section on the Company’s website at http://investor.campingworld.com. Presentation materials are available at http://investor.campingworld.com. The replay of the conference call webcast and presentation materials will be available on the investor relations website for approximately 90 days.
Presentation
This press release presents historical results for the periods presented for the Company and its subsidiaries, which are presented in accordance with accounting principles generally accepted in the United States (“GAAP”), unless noted as a non-GAAP financial measure. The Company is the sole managing member of CWGS, LLC, with sole voting power in and control of the management of CWGS, LLC. As of June 30, 2025, the Company owned 61.1% of CWGS, LLC. Accordingly, the Company consolidates the financial results of CWGS, LLC and reports a non-controlling interest in its consolidated financial statements. Unless otherwise indicated, all financial comparisons in this press release compare our financial results for the second quarter ended June 30, 2025 to our financial results from the second quarter ended June 30, 2024.
About Camping World Holdings, Inc.
Camping World Holdings, Inc., headquartered in Lincolnshire, IL, (together with its subsidiaries) is the world’s largest retailer of RVs and related products and services. Through Camping World and Good Sam brands, our vision is to build a business that makes RVing and other outdoor adventures fun and easy. We strive to build long-term value for our customers, employees, and stockholders by combining a unique and comprehensive assortment of RV products and services with a national network of RV dealerships, service centers and customer support centers along with the industry’s most extensive online presence and a highly trained and knowledgeable team of associates serving our customers, the RV lifestyle, and the communities in which we operate.
3
We also believe that our Good Sam organization and family of highly specialized services and plans, including roadside assistance, protection plans and insurance, uniquely enables us to connect with our customers as stewards of an outdoor and recreational lifestyle. With RV sales and service locations in 44 states, Camping World has grown to become the prime destination for everything RV. For more information, visit www.CampingWorld.com.
Forward-Looking Statements
This press release contains forward-looking statements within the meaning of the Private Securities Litigation Reform Act of 1995. All statements contained in this press release that do not relate to matters of historical fact should be considered forward-looking statements, including, without limitation, statements about macroeconomic and industry trends, inventory strategy, reductions in SG&A, accelerating profitability improvement, gross margin improvement, variability in average selling prices, competitive positioning, business plans and goals, future growth of our operations, anticipated effects of new federal legislation, anticipated debt paydown and deleveraging activities, market share goals, and future financial results and position. These forward-looking statements are based on management’s current expectations.
These statements are neither promises nor guarantees, but involve known and unknown risks, uncertainties and other important factors that may cause our actual results, performance or achievements to be materially different from any future results, performance or achievements expressed or implied by the forward-looking statements, including, but not limited to, the following: general economic conditions, including inflation, interest rates and tariffs; the availability of financing to us and our customers; fuel shortages, high prices for fuel or changes in energy sources; the success of our manufacturers; changes in consumer preferences; competition in our industry; risks related to acquisitions, new store openings and expansion into new markets; our failure to maintain the strength and value of our brands; our ability to manage our inventory; fluctuations in our same store sales; the cyclical and seasonal nature of our business; our dependence on the availability of adequate capital and risks related to our debt; our ability to execute and achieve the expected benefits of our cost cutting initiatives; our reliance on our fulfillment and distribution centers; impacts from natural disasters, including pandemics and health crises; our dependence on our relationships with third party suppliers and lending institutions; risks associated with selling goods manufactured abroad; our ability to retain senior executives and attract and retain other qualified employees; risks associated with leasing substantial amounts of space; risks associated with our private brand offerings; we may incur asset impairment charges for goodwill, intangible assets or other long-lived assets; tax risks; our private brand offerings exposing us to various risks; regulatory risks; data privacy and cybersecurity risks; risks related to our intellectual property; the impact of ongoing or future lawsuits against us and certain of our officers and directors; risks related to climate change and other environmental, social and governance matters; and risks related to our organizational structure.
These and other important factors discussed under the caption “Risk Factors” in our Annual Report on Form 10-K for the year ended December 31, 2024, as updated by our Quarterly Reports on Form 10-Q and our other reports filed with the SEC, could cause actual results to differ materially from those indicated by the forward-looking statements made in this press release. Any such forward-looking statements represent management’s estimates as of the date of this press release. While we may elect to update such forward-looking statements at some point in the future, we disclaim any obligation to do so, even if subsequent events cause our views to change, except as required under applicable law. These forward-looking statements should not be relied upon as representing our views as of any date subsequent to the date of this press release.
Future declarations of quarterly dividends, if any, are subject to the determination and discretion of the Company’s Board of Directors based on its consideration of various factors, including the Company’s results of operations, financial condition, level of indebtedness, anticipated capital requirements, contractual restrictions, restrictions in its debt agreements, restrictions under applicable law, receipt of excess tax distributions from CWGS, LLC, its business prospects and other factors that the Company’s Board of Directors may deem relevant.
We intend to use our official Facebook, X (formerly known as Twitter), and Instagram accounts, each at the handle @CampingWorld, as well as the investor page of our website, investor.campingworld.com, as a distribution channel of material information about the Company and for complying with our disclosure obligations under Regulation FD. The information we post through these social media channels and on our investor webpage may be deemed material.
4
Accordingly, investors should subscribe to these accounts and our investor alerts, in addition to following our press releases, SEC filings, public conference calls and webcasts. These social media channels may be updated from time to time.
5
Camping World Holdings, Inc. and Subsidiaries
Consolidated Statements of Operations (unaudited)
(In Thousands Except Per Share Amounts)
|
|
Three Months Ended |
|
Six Months Ended |
||||||||
|
|
June 30, |
|
June 30, |
||||||||
|
|
2025 |
|
2024 |
|
2025 |
|
2024 |
||||
Revenue: |
|
|
|
|
|
|
|
|
|
|
|
|
Good Sam Services and Plans |
|
$ |
54,213 |
|
$ |
52,548 |
|
$ |
100,421 |
|
$ |
98,229 |
RV and Outdoor Retail |
|
|
|
|
|
|
|
|
|
|
|
|
New vehicles |
|
|
915,106 |
|
|
847,105 |
|
|
1,536,538 |
|
|
1,503,191 |
Used vehicles |
|
|
572,271 |
|
|
480,774 |
|
|
994,622 |
|
|
818,459 |
Products, service and other |
|
|
222,890 |
|
|
235,947 |
|
|
387,882 |
|
|
413,841 |
Finance and insurance, net |
|
|
201,198 |
|
|
179,016 |
|
|
349,865 |
|
|
314,470 |
Good Sam Club |
|
|
10,270 |
|
|
11,115 |
|
|
20,144 |
|
|
22,332 |
Subtotal |
|
|
1,921,735 |
|
|
1,753,957 |
|
|
3,289,051 |
|
|
3,072,293 |
Total revenue |
|
|
1,975,948 |
|
|
1,806,505 |
|
|
3,389,472 |
|
|
3,170,522 |
Costs applicable to revenue (exclusive of depreciation and amortization shown separately below): |
|
|
|
|
|
|
|
|
|
|
|
|
Good Sam Services and Plans |
|
|
21,947 |
|
|
17,192 |
|
|
39,668 |
|
|
32,375 |
RV and Outdoor Retail |
|
|
|
|
|
|
|
|
|
|
|
|
New vehicles |
|
|
788,873 |
|
|
717,650 |
|
|
1,325,232 |
|
|
1,282,689 |
Used vehicles |
|
|
455,239 |
|
|
389,601 |
|
|
799,200 |
|
|
668,134 |
Products, service and other |
|
|
116,412 |
|
|
132,933 |
|
|
201,151 |
|
|
234,608 |
Good Sam Club |
|
|
1,222 |
|
|
1,470 |
|
|
2,338 |
|
|
2,660 |
Subtotal |
|
|
1,361,746 |
|
|
1,241,654 |
|
|
2,327,921 |
|
|
2,188,091 |
Total costs applicable to revenue |
|
|
1,383,693 |
|
|
1,258,846 |
|
|
2,367,589 |
|
|
2,220,466 |
|
|
|
|
|
|
|
|
|
|
|
|
|
Gross profit (exclusive of depreciation and amortization shown separately below): |
|
|
|
|
|
|
|
|
|
|
|
|
Good Sam Services and Plans |
|
|
32,266 |
|
|
35,356 |
|
|
60,753 |
|
|
65,854 |
RV and Outdoor Retail |
|
|
|
|
|
|
|
|
|
|
|
|
New vehicles |
|
|
126,233 |
|
|
129,455 |
|
|
211,306 |
|
|
220,502 |
Used vehicles |
|
|
117,032 |
|
|
91,173 |
|
|
195,422 |
|
|
150,325 |
Products, service and other |
|
|
106,478 |
|
|
103,014 |
|
|
186,731 |
|
|
179,233 |
Finance and insurance, net |
|
|
201,198 |
|
|
179,016 |
|
|
349,865 |
|
|
314,470 |
Good Sam Club |
|
|
9,048 |
|
|
9,645 |
|
|
17,806 |
|
|
19,672 |
Subtotal |
|
|
559,989 |
|
|
512,303 |
|
|
961,130 |
|
|
884,202 |
Total gross profit |
|
|
592,255 |
|
|
547,659 |
|
|
1,021,883 |
|
|
950,056 |
|
|
|
|
|
|
|
|
|
|
|
|
|
Operating expenses: |
|
|
|
|
|
|
|
|
|
|
|
|
Selling, general, and administrative |
|
|
437,489 |
|
|
419,676 |
|
|
824,934 |
|
|
791,149 |
Depreciation and amortization |
|
|
23,419 |
|
|
20,032 |
|
|
45,963 |
|
|
39,322 |
Long-lived asset impairment |
|
|
— |
|
|
4,584 |
|
|
620 |
|
|
10,411 |
Lease termination |
|
|
(107) |
|
|
40 |
|
|
(107) |
|
|
40 |
Loss (gain) on sale or disposal of assets |
|
|
1,185 |
|
|
7,945 |
|
|
(638) |
|
|
9,530 |
Total operating expenses |
|
|
461,986 |
|
|
452,277 |
|
|
870,772 |
|
|
850,452 |
Income from operations |
|
|
130,269 |
|
|
95,382 |
|
|
151,111 |
|
|
99,604 |
Other expense |
|
|
|
|
|
|
|
|
|
|
|
|
Floor plan interest expense |
|
|
(20,989) |
|
|
(27,799) |
|
|
(39,295) |
|
|
(55,681) |
Other interest expense, net |
|
|
(30,836) |
|
|
(36,153) |
|
|
(61,367) |
|
|
(72,247) |
Other expense, net |
|
|
(2,600) |
|
|
(81) |
|
|
(2,758) |
|
|
(175) |
Total other expense |
|
|
(54,425) |
|
|
(64,033) |
|
|
(103,420) |
|
|
(128,103) |
Income (loss) before income taxes |
|
|
75,844 |
|
|
31,349 |
|
|
47,691 |
|
|
(28,499) |
Income tax (expense) benefit |
|
|
(18,321) |
|
|
(7,935) |
|
|
(14,850) |
|
|
1,107 |
Net income (loss) |
|
|
57,523 |
|
|
23,414 |
|
|
32,841 |
|
|
(27,392) |
Less: net income (loss) attributable to non-controlling interests |
|
|
(27,307) |
|
|
(13,643) |
|
|
(14,905) |
|
|
14,856 |
Net income (loss) attributable to Camping World Holdings, Inc. |
|
$ |
30,216 |
|
$ |
9,771 |
|
$ |
17,936 |
|
$ |
(12,536) |
|
|
|
|
|
|
|
|
|
|
|
|
|
Earnings (loss) per share of Class A common stock: |
|
|
|
|
|
|
|
|
|
|
|
|
Basic |
|
$ |
0.48 |
|
$ |
0.22 |
|
$ |
0.29 |
|
$ |
(0.28) |
Diluted |
|
$ |
0.48 |
|
$ |
0.22 |
|
$ |
0.28 |
|
$ |
(0.28) |
Weighted average shares of Class A common stock outstanding: |
|
|
|
|
|
|
|
|
|
|
|
|
Basic |
|
|
62,610 |
|
|
45,093 |
|
|
62,571 |
|
|
45,070 |
Diluted |
|
|
62,747 |
|
|
45,244 |
|
|
102,661 |
|
|
45,070 |
6
Camping World Holdings, Inc. and Subsidiaries
Supplemental Data (unaudited)
|
|
Three Months Ended June 30, |
|
Increase |
|
|
Percent |
||||||
|
|
2025 |
|
2024 |
|
(decrease) |
|
|
Change |
||||
Unit sales |
|
|
|
|
|
|
|
|
|
|
|
|
|
New vehicles |
|
|
26,696 |
|
|
22,084 |
|
|
4,612 |
|
|
|
20.9% |
Used vehicles |
|
|
18,906 |
|
|
15,700 |
|
|
3,206 |
|
|
|
20.4% |
Total |
|
|
45,602 |
|
|
37,784 |
|
|
7,818 |
|
|
|
20.7% |
|
|
|
|
|
|
|
|
|
|
|
|
|
|
Average selling price |
|
|
|
|
|
|
|
|
|
|
|
|
|
New vehicles |
|
$ |
34,279 |
|
$ |
38,358 |
|
$ |
(4,079) |
|
|
|
(10.6%) |
Used vehicles |
|
|
30,269 |
|
|
30,623 |
|
|
(354) |
|
|
|
(1.2%) |
|
|
|
|
|
|
|
|
|
|
|
|
|
|
Same store unit sales(1) |
|
|
|
|
|
|
|
|
|
|
|
|
|
New vehicles |
|
|
24,360 |
|
|
19,936 |
|
|
4,424 |
|
|
|
22.2% |
Used vehicles |
|
|
17,528 |
|
|
14,509 |
|
|
3,019 |
|
|
|
20.8% |
Total |
|
|
41,888 |
|
|
34,445 |
|
|
7,443 |
|
|
|
21.6% |
|
|
|
|
|
|
|
|
|
|
|
|
|
|
Same store revenue(1) ($ in 000s) |
|
|
|
|
|
|
|
|
|
|
|
|
|
New vehicles |
|
$ |
833,171 |
|
$ |
768,687 |
|
$ |
64,484 |
|
|
|
8.4% |
Used vehicles |
|
|
525,573 |
|
|
448,019 |
|
|
77,554 |
|
|
|
17.3% |
Products, service and other |
|
|
179,017 |
|
|
186,445 |
|
|
(7,428) |
|
|
|
(4.0%) |
Finance and insurance, net |
|
|
186,659 |
|
|
163,615 |
|
|
23,044 |
|
|
|
14.1% |
Total |
|
$ |
1,724,420 |
|
$ |
1,566,766 |
|
$ |
157,654 |
|
|
|
10.1% |
|
|
|
|
|
|
|
|
|
|
|
|
|
|
Average gross profit per unit |
|
|
|
|
|
|
|
|
|
|
|
|
|
New vehicles |
|
$ |
4,729 |
|
$ |
5,862 |
|
$ |
(1,133) |
|
|
|
(19.3%) |
Used vehicles |
|
|
6,190 |
|
|
5,807 |
|
|
383 |
|
|
|
6.6% |
Finance and insurance, net per vehicle unit |
|
|
4,412 |
|
|
4,738 |
|
|
(326) |
|
|
|
(6.9%) |
Total vehicle front-end yield(2) |
|
|
9,747 |
|
|
10,577 |
|
|
(830) |
|
|
|
(7.8%) |
|
|
|
|
|
|
|
|
|
|
|
|
|
|
Gross margin |
|
|
|
|
|
|
|
|
|
|
|
|
|
Good Sam Services and Plans |
|
|
59.5% |
|
|
67.3% |
|
|
(777) |
bps |
|
|
|
New vehicles |
|
|
13.8% |
|
|
15.3% |
|
|
(149) |
bps |
|
|
|
Used vehicles |
|
|
20.5% |
|
|
19.0% |
|
|
149 |
bps |
|
|
|
Products, service and other |
|
|
47.8% |
|
|
43.7% |
|
|
411 |
bps |
|
|
|
Finance and insurance, net |
|
|
100.0% |
|
|
100.0% |
|
|
unch |
|
|
|
|
Good Sam Club |
|
|
88.1% |
|
|
86.8% |
|
|
133 |
bps |
|
|
|
Subtotal RV and Outdoor Retail |
|
|
29.1% |
|
|
29.2% |
|
|
(7) |
bps |
|
|
|
Total gross margin |
|
|
30.0% |
|
|
30.3% |
|
|
(34) |
bps |
|
|
|
|
|
|
|
|
|
|
|
|
|
|
|
|
|
Retail locations |
|
|
|
|
|
|
|
|
|
|
|
|
|
RV dealerships |
|
|
200 |
|
|
211 |
|
|
(11) |
|
|
|
(5.2%) |
RV service & retail centers |
|
|
1 |
|
|
4 |
|
|
(3) |
|
|
|
(75.0%) |
Total |
|
|
201 |
|
|
215 |
|
|
(14) |
|
|
|
(6.5%) |
|
|
|
|
|
|
|
|
|
|
|
|
|
|
RV and Outdoor Retail inventories ($ in 000s) |
|
|
|
|
|
|
|
|
|
|
|
|
|
New vehicles |
|
$ |
1,330,965 |
|
$ |
1,477,510 |
|
$ |
(146,545) |
|
|
|
(9.9%) |
Used vehicles |
|
|
536,665 |
|
|
349,843 |
|
|
186,822 |
|
|
|
53.4% |
Products, parts, accessories and misc. |
|
|
193,232 |
|
|
186,758 |
|
|
6,474 |
|
|
|
3.5% |
Total RV and Outdoor Retail inventories |
|
$ |
2,060,862 |
|
$ |
2,014,111 |
|
$ |
46,751 |
|
|
|
2.3% |
|
|
|
|
|
|
|
|
|
|
|
|
|
|
Vehicle inventory per location ($ in 000s) |
|
|
|
|
|
|
|
|
|
|
|
|
|
New vehicle inventory per dealer location |
|
$ |
6,655 |
|
$ |
7,002 |
|
$ |
(347) |
|
|
|
(5.0%) |
Used vehicle inventory per dealer location |
|
|
2,683 |
|
|
1,658 |
|
|
1,025 |
|
|
|
61.8% |
|
|
|
|
|
|
|
|
|
|
|
|
|
|
Vehicle inventory turnover(3) |
|
|
|
|
|
|
|
|
|
|
|
|
|
New vehicle inventory turnover |
|
|
1.9 |
|
|
1.6 |
|
|
0.2 |
|
|
|
14.5% |
Used vehicle inventory turnover |
|
|
3.3 |
|
|
3.3 |
|
|
(0.0) |
|
|
|
(0.3%) |
|
|
|
|
|
|
|
|
|
|
|
|
|
|
Other data |
|
|
|
|
|
|
|
|
|
|
|
|
|
Active Customers(4) |
|
|
4,221,642 |
|
|
4,762,376 |
|
|
(540,734) |
|
|
|
(11.4%) |
Good Sam Club members (5) |
|
|
1,662,653 |
|
|
1,880,126 |
|
|
(217,473) |
|
|
|
(11.6%) |
Service bays (6) |
|
|
2,809 |
|
|
2,877 |
|
|
(68) |
|
|
|
(2.4%) |
Finance and insurance gross profit as a % of total vehicle revenue |
|
|
13.5% |
|
|
13.5% |
|
|
5 |
bps |
|
|
n/a |
Same store locations |
|
|
178 |
|
|
n/a |
|
|
n/a |
|
|
|
n/a |
7
|
|
Six Months Ended June 30, |
|
Increase |
|
|
Percent |
||||||
|
|
2025 |
|
2024 |
|
(decrease) |
|
|
Change |
||||
Unit sales |
|
|
|
|
|
|
|
|
|
|
|
|
|
New vehicles |
|
|
43,422 |
|
|
38,966 |
|
|
4,456 |
|
|
|
11.4% |
Used vehicles |
|
|
32,845 |
|
|
26,394 |
|
|
6,451 |
|
|
|
24.4% |
Total |
|
|
76,267 |
|
|
65,360 |
|
|
10,907 |
|
|
|
16.7% |
|
|
|
|
|
|
|
|
|
|
|
|
|
|
Average selling price |
|
|
|
|
|
|
|
|
|
|
|
|
|
New vehicles |
|
$ |
35,386 |
|
$ |
38,577 |
|
$ |
(3,191) |
|
|
|
(8.3%) |
Used vehicles |
|
|
30,282 |
|
|
31,009 |
|
|
(727) |
|
|
|
(2.3%) |
|
|
|
|
|
|
|
|
|
|
|
|
|
|
Same store unit sales(1) |
|
|
|
|
|
|
|
|
|
|
|
|
|
New vehicles |
|
|
39,835 |
|
|
35,657 |
|
|
4,178 |
|
|
|
11.7% |
Used vehicles |
|
|
30,395 |
|
|
24,542 |
|
|
5,853 |
|
|
|
23.8% |
Total |
|
|
70,230 |
|
|
60,199 |
|
|
10,031 |
|
|
|
16.7% |
|
|
|
|
|
|
|
|
|
|
|
|
|
|
Same store revenue(1) ($ in 000s) |
|
|
|
|
|
|
|
|
|
|
|
|
|
New vehicles |
|
$ |
1,410,789 |
|
$ |
1,382,134 |
|
$ |
28,655 |
|
|
|
2.1% |
Used vehicles |
|
|
918,061 |
|
|
763,872 |
|
|
154,189 |
|
|
|
20.2% |
Products, service and other |
|
|
314,183 |
|
|
331,245 |
|
|
(17,062) |
|
|
|
(5.2%) |
Finance and insurance, net |
|
|
326,001 |
|
|
291,581 |
|
|
34,420 |
|
|
|
11.8% |
Total |
|
$ |
2,969,034 |
|
$ |
2,768,832 |
|
$ |
200,202 |
|
|
|
7.2% |
|
|
|
|
|
|
|
|
|
|
|
|
|
|
Average gross profit per unit |
|
|
|
|
|
|
|
|
|
|
|
|
|
New vehicles |
|
$ |
4,866 |
|
$ |
5,659 |
|
$ |
(793) |
|
|
|
(14.0%) |
Used vehicles |
|
|
5,950 |
|
|
5,695 |
|
|
255 |
|
|
|
4.5% |
Finance and insurance, net per vehicle unit |
|
|
4,587 |
|
|
4,811 |
|
|
(224) |
|
|
|
(4.7%) |
Total vehicle front-end yield(2) |
|
|
9,920 |
|
|
10,485 |
|
|
(565) |
|
|
|
(5.4%) |
|
|
|
|
|
|
|
|
|
|
|
|
|
|
Gross margin |
|
|
|
|
|
|
|
|
|
|
|
|
|
Good Sam Services and Plans |
|
|
60.5% |
|
|
67.0% |
|
|
(654) |
bps |
|
|
|
New vehicles |
|
|
13.8% |
|
|
14.7% |
|
|
(92) |
bps |
|
|
|
Used vehicles |
|
|
19.6% |
|
|
18.4% |
|
|
128 |
bps |
|
|
|
Products, service and other |
|
|
48.1% |
|
|
43.3% |
|
|
483 |
bps |
|
|
|
Finance and insurance, net |
|
|
100.0% |
|
|
100.0% |
|
|
unch |
|
|
|
|
Good Sam Club |
|
|
88.4% |
|
|
88.1% |
|
|
31 |
bps |
|
|
|
Subtotal RV and Outdoor Retail |
|
|
29.2% |
|
|
28.8% |
|
|
44 |
bps |
|
|
|
Total gross margin |
|
|
30.1% |
|
|
30.0% |
|
|
18 |
bps |
|
|
|
|
|
|
|
|
|
|
|
|
|
|
|
|
|
Other data |
|
|
|
|
|
|
|
|
|
|
|
|
|
Finance and insurance gross profit as a % of total vehicle revenue |
|
|
13.8% |
|
|
13.5% |
|
|
28 |
bps |
|
|
n/a |
Same store locations |
|
|
178 |
|
|
n/a |
|
|
n/a |
|
|
|
n/a |
unch – unchanged
bps – basis points
n/a – not applicable
| (1) | Our same store revenue and units calculations for a given period include only those stores that were open both at the end of the corresponding period and at the beginning of the preceding fiscal year. |
| (2) | Front end yield is calculated as gross profit from new vehicles, used vehicles and finance and insurance (net), divided by combined new and used vehicle unit sales. |
| (3) | Inventory turnover is calculated as vehicle costs applicable to revenue over the last twelve months divided by the average quarterly ending vehicle inventory over the last twelve months. |
| (4) | An Active Customer is a customer who has transacted with us in any of the eight most recently completed fiscal quarters prior to the date of measurement. |
| (5) | Excludes Good Sam Club members under the free basic plan, which was introduced in November 2023 and provides for limited participation in the loyalty point program without access to the remaining member benefits. |
| (6) | A service bay is a fully-constructed bay dedicated to service, installation, and collision offerings. |
8
Camping World Holdings, Inc. and Subsidiaries
Consolidated Balance Sheets (unaudited)
(In Thousands Except Per Share Amounts)
|
|
June 30, |
|
December 31, |
|
June 30, |
|||
|
|
2025 |
|
2024 |
|
2024 |
|||
Assets |
|
|
|
|
|
|
|
|
|
Current assets: |
|
|
|
|
|
|
|
|
|
Cash and cash equivalents |
|
$ |
118,084 |
|
$ |
208,422 |
|
$ |
23,743 |
Contracts in transit |
|
|
163,767 |
|
|
61,222 |
|
|
165,033 |
Accounts receivable, net |
|
|
137,822 |
|
|
120,412 |
|
|
128,938 |
Inventories |
|
|
2,061,160 |
|
|
1,821,837 |
|
|
2,014,444 |
Prepaid expenses and other assets |
|
|
57,974 |
|
|
58,045 |
|
|
68,220 |
Assets held for sale |
|
|
15,202 |
|
|
1,350 |
|
|
8,418 |
Total current assets |
|
|
2,554,009 |
|
|
2,271,288 |
|
|
2,408,796 |
|
|
|
|
|
|
|
|
|
|
Property and equipment, net |
|
|
910,052 |
|
|
846,760 |
|
|
856,308 |
Operating lease assets |
|
|
716,020 |
|
|
739,352 |
|
|
760,143 |
Deferred tax assets, net |
|
|
211,435 |
|
|
215,140 |
|
|
193,873 |
Intangible assets, net |
|
|
17,602 |
|
|
19,469 |
|
|
21,354 |
Goodwill |
|
|
748,561 |
|
|
734,023 |
|
|
731,015 |
Other assets |
|
|
34,168 |
|
|
37,245 |
|
|
34,387 |
Total assets |
|
$ |
5,191,847 |
|
$ |
4,863,277 |
|
$ |
5,005,876 |
Liabilities and stockholders' equity |
|
|
|
|
|
|
|
|
|
Current liabilities: |
|
|
|
|
|
|
|
|
|
Accounts payable |
|
$ |
283,450 |
|
$ |
145,346 |
|
$ |
260,390 |
Accrued liabilities |
|
|
182,581 |
|
|
118,557 |
|
|
187,120 |
Deferred revenues |
|
|
94,041 |
|
|
92,124 |
|
|
99,045 |
Current portion of operating lease liabilities |
|
|
65,488 |
|
|
61,993 |
|
|
62,795 |
Current portion of finance lease liabilities |
|
|
19,514 |
|
|
7,044 |
|
|
7,335 |
Current portion of Tax Receivable Agreement liability |
|
|
1,700 |
|
|
— |
|
|
12,277 |
Current portion of long-term debt |
|
|
23,023 |
|
|
23,275 |
|
|
24,082 |
Notes payable – floor plan, net |
|
|
1,280,102 |
|
|
1,161,713 |
|
|
1,296,352 |
Other current liabilities |
|
|
79,167 |
|
|
70,900 |
|
|
80,343 |
Total current liabilities |
|
|
2,029,066 |
|
|
1,680,952 |
|
|
2,029,739 |
|
|
|
|
|
|
|
|
|
|
Operating lease liabilities, net of current portion |
|
|
734,083 |
|
|
764,113 |
|
|
788,613 |
Finance lease liabilities, net of current portion |
|
|
128,598 |
|
|
131,004 |
|
|
134,538 |
Tax Receivable Agreement liability, net of current portion |
|
|
148,672 |
|
|
150,372 |
|
|
137,589 |
Revolving line of credit |
|
|
— |
|
|
— |
|
|
31,885 |
Long-term debt, net of current portion |
|
|
1,483,470 |
|
|
1,493,318 |
|
|
1,513,986 |
Deferred revenues |
|
|
63,337 |
|
|
63,642 |
|
|
66,981 |
Other long-term liabilities |
|
|
88,042 |
|
|
94,927 |
|
|
92,140 |
Total liabilities |
|
|
4,675,268 |
|
|
4,378,328 |
|
|
4,795,471 |
Commitments and contingencies |
|
|
|
|
|
|
|
|
|
Stockholders' equity: |
|
|
|
|
|
|
|
|
|
Preferred stock, par value $0.01 per share – 20,000 shares authorized; none issued and outstanding |
|
|
— |
|
|
— |
|
|
— |
Class A common stock, par value $0.01 per share – 250,000 shares authorized; 62,649, 62,502 and 49,571 shares issued, respectively, and 62,649, 62,502 and 45,115 shares outstanding, respectively |
|
|
626 |
|
|
625 |
|
|
496 |
Class B common stock, par value $0.0001 per share – 75,000 shares authorized; 39,466 shares issued and outstanding |
|
|
4 |
|
|
4 |
|
|
4 |
Class C common stock, par value $0.0001 per share – 0.001 share authorized, issued and outstanding |
|
|
— |
|
|
— |
|
|
— |
Additional paid-in capital |
|
|
205,383 |
|
|
193,692 |
|
|
133,461 |
Treasury stock, at cost; 4,456 shares at June 30, 2024 |
|
|
— |
|
|
— |
|
|
(156,116) |
Retained earnings |
|
|
134,525 |
|
|
132,241 |
|
|
171,817 |
Total stockholders' equity attributable to Camping World Holdings, Inc. |
|
|
340,538 |
|
|
326,562 |
|
|
149,662 |
Non-controlling interests |
|
|
176,041 |
|
|
158,387 |
|
|
60,743 |
Total stockholders' equity |
|
|
516,579 |
|
|
484,949 |
|
|
210,405 |
Total liabilities and stockholders' equity |
|
$ |
5,191,847 |
|
$ |
4,863,277 |
|
$ |
5,005,876 |
9
Camping World Holdings, Inc. and Subsidiaries
Summary of Consolidated Statements of Cash Flows (unaudited)
(In Thousands)
|
|
Six Months Ended June 30, |
||||
|
|
2025 |
|
2024 |
||
|
|
|
|
|
|
|
Net cash (used in) provided by operating activities |
|
$ |
(44,595) |
|
$ |
84,341 |
|
|
|
|
|
|
|
Investing activities |
|
|
|
|
|
|
Purchases of property and equipment |
|
|
(49,696) |
|
|
(48,553) |
Proceeds from sale of property and equipment |
|
|
2,966 |
|
|
3,583 |
Purchases of real property |
|
|
(72,386) |
|
|
(1,243) |
Proceeds from the sale of real property |
|
|
9,843 |
|
|
31,195 |
Purchases of businesses, net of cash acquired |
|
|
(81,154) |
|
|
(62,323) |
Proceeds from divestiture of business |
|
|
10,349 |
|
|
19,957 |
Purchases of intangible assets |
|
|
— |
|
|
(142) |
Proceeds from sale of intangible assets |
|
|
— |
|
|
2,595 |
Net cash used in investing activities |
|
|
(180,078) |
|
|
(54,931) |
|
|
|
|
|
|
|
Financing activities |
|
|
|
|
|
|
Proceeds from long-term debt |
|
|
— |
|
|
55,624 |
Payments on long-term debt |
|
|
(12,537) |
|
|
(57,351) |
Net proceeds (payments) on notes payable – floor plan, net |
|
|
168,108 |
|
|
(19,160) |
Borrowings on revolving line of credit |
|
|
— |
|
|
43,000 |
Payments on revolving line of credit |
|
|
— |
|
|
(32,000) |
Payments on finance leases |
|
|
(3,637) |
|
|
(3,682) |
Payments on sale-leaseback arrangement |
|
|
(102) |
|
|
(97) |
Payment of debt issuance costs |
|
|
— |
|
|
(876) |
Payments of stock offering costs |
|
|
(572) |
|
|
— |
Dividends on Class A common stock |
|
|
(15,652) |
|
|
(11,274) |
Proceeds from exercise of stock options |
|
|
— |
|
|
51 |
RSU shares withheld for tax |
|
|
(1,175) |
|
|
(754) |
Distributions to holders of LLC common units |
|
|
(98) |
|
|
(18,795) |
Net cash provided by (used in) financing activities |
|
|
134,335 |
|
|
(45,314) |
|
|
|
|
|
|
|
Decrease in cash and cash equivalents |
|
|
(90,338) |
|
|
(15,904) |
Cash and cash equivalents at beginning of the period |
|
|
208,422 |
|
|
39,647 |
Cash and cash equivalents at end of the period |
|
$ |
118,084 |
|
$ |
23,743 |
10
Earnings (Loss) Per Share
Basic earnings (loss) per share of Class A common stock is computed by dividing net income (loss) attributable to Camping World Holdings, Inc. by the weighted-average number of shares of Class A common stock outstanding during the period. Diluted earnings (loss) per share of Class A common stock is computed by dividing net income (loss) attributable to Camping World Holdings, Inc. by the weighted-average number of shares of Class A common stock outstanding adjusted to give effect to potentially dilutive securities.
The following table sets forth reconciliations of the numerators and denominators used to compute basic and diluted earnings (loss) per share of Class A common stock (unaudited):
|
|
Three Months Ended June 30, |
|
Six Months Ended June 30, |
||||||||
(In thousands except per share amounts) |
|
2025 |
|
2024 |
|
2025 |
|
2024 |
||||
Numerator: |
|
|
|
|
|
|
|
|
|
|
|
|
Net income (loss) |
|
$ |
57,523 |
|
$ |
23,414 |
|
$ |
32,841 |
|
$ |
(27,392) |
Less: net income (loss) attributable to non-controlling interests |
|
|
(27,307) |
|
|
(13,643) |
|
|
(14,905) |
|
|
14,856 |
Net income (loss) attributable to Camping World Holdings, Inc. — basic |
|
$ |
30,216 |
|
$ |
9,771 |
|
$ |
17,936 |
|
$ |
(12,536) |
Add: reallocation of net income (loss) attributable to non-controlling interests from the assumed dilutive effect of stock options and RSUs |
|
|
27 |
|
|
19 |
|
|
— |
|
|
— |
Add: reallocation of net income (loss) attributable to non-controlling interests from the assumed redemption of common units of CWGS, LLC for Class A common stock |
|
|
— |
|
|
— |
|
|
11,049 |
|
|
— |
Net income (loss) attributable to Camping World Holdings, Inc. — diluted |
|
$ |
30,243 |
|
$ |
9,790 |
|
$ |
28,985 |
|
$ |
(12,536) |
Denominator: |
|
|
|
|
|
|
|
|
|
|
|
|
Weighted-average shares of Class A common stock outstanding — basic |
|
|
62,610 |
|
|
45,093 |
|
|
62,571 |
|
|
45,070 |
Dilutive restricted stock units |
|
|
137 |
|
|
151 |
|
|
195 |
|
|
— |
Dilutive common units of CWGS, LLC that are convertible into Class A common stock |
|
|
— |
|
|
— |
|
|
39,895 |
|
|
— |
Weighted-average shares of Class A common stock outstanding — diluted |
|
|
62,747 |
|
|
45,244 |
|
|
102,661 |
|
|
45,070 |
|
|
|
|
|
|
|
|
|
|
|
|
|
Earnings (loss) per share of Class A common stock — basic |
|
$ |
0.48 |
|
$ |
0.22 |
|
$ |
0.29 |
|
$ |
(0.28) |
Earnings (loss) per share of Class A common stock — diluted |
|
$ |
0.48 |
|
$ |
0.22 |
|
$ |
0.28 |
|
$ |
(0.28) |
|
|
|
|
|
|
|
|
|
|
|
|
|
Weighted-average anti-dilutive securities excluded from the computation of diluted earnings (loss) per share of Class A common stock: |
|
|
|
|
|
|
|
|
|
|
|
|
Stock options to purchase Class A common stock |
|
|
151 |
|
|
186 |
|
|
153 |
|
|
188 |
Restricted stock units |
|
|
1,892 |
|
|
1,037 |
|
|
1,684 |
|
|
1,980 |
Common units of CWGS, LLC that are convertible into Class A common stock |
|
|
39,895 |
|
|
40,045 |
|
|
— |
|
|
40,045 |
|
|
|
|
|
|
|
|
|
|
|
|
|
Weighted-average contingently issuable shares excluded from the computation of diluted loss per share of Class A common stock since all necessary conditions had not been satisfied: |
|
|
|
|
|
|
|
|
|
|
|
|
Performance stock units |
|
|
750 |
|
|
— |
|
|
750 |
|
|
— |
Non-GAAP Financial Measures
To supplement our condensed consolidated financial statements, which are prepared and presented in accordance with accounting principles generally accepted in the United States (“GAAP”), we use the following non-GAAP financial measures: EBITDA; Adjusted EBITDA; Adjusted EBITDA Margin; Adjusted Net Income (Loss) Attributable to Camping World Holdings, Inc. – Basic; Adjusted Net Income (Loss) Attributable to Camping World Holdings, Inc. – Diluted; Adjusted Earnings (Loss) Per Share – Basic; Adjusted Earnings (Loss) Per Share – Diluted; and SG&A Excluding SBC (collectively the "Non-GAAP Financial Measures"). We believe that these Non-GAAP Financial Measures, when used in conjunction with GAAP financial measures, provide useful information about operating results, enhance the overall understanding of past financial performance and future prospects, and allow for greater transparency with respect to the key metrics we use in our financial and operational decision making. Certain of these Non-GAAP Financial Measures are also frequently used by analysts, investors and other interested parties to evaluate companies in the Company’s industry and are used by management to evaluate our operating performance, to evaluate the effectiveness of strategic initiatives and for planning purposes. By providing these Non-GAAP Financial Measures, together with reconciliations, we believe we are enhancing investors’ understanding of our business and our results of operations, as well as assisting investors in evaluating how well we are executing our strategic initiatives. In addition, our Senior Secured Credit Facilities use Adjusted EBITDA, as calculated for our subsidiary CWGS Group, LLC, to measure our compliance with covenants such as the consolidated leverage ratio.
11
The Non-GAAP Financial Measures have limitations as analytical tools, and the presentation of this financial information is not intended to be considered in isolation or as a substitute for, or superior to, the financial information prepared and presented in accordance with GAAP. They should not be construed as an inference that the Company’s future results will be unaffected by any items adjusted for in these Non-GAAP Financial Measures. In evaluating these Non-GAAP Financial Measures, it is reasonable to expect that certain of these items will occur in future periods. However, we believe these adjustments are appropriate because the amounts recognized can vary significantly from period to period, do not directly relate to the ongoing operations of our business and complicate comparisons of our internal operating results and operating results of other companies over time. Each of the normal recurring adjustments and other adjustments described in this section and in the reconciliation tables below help management with a measure of our core operating performance over time by removing items that are not related to day-to-day operations.
Our earnings call on July 30, 2025 may present guidance that includes Adjusted EBITDA. A full reconciliation of the forecasted Adjusted EBITDA to its most-directly comparable GAAP metric cannot be provided without unreasonable efforts due to the inherent difficulty in forecasting and quantifying with reasonable accuracy significant items required for the reconciliations.
The Non-GAAP Financial Measures that we use are not necessarily comparable to similarly titled measures used by other companies due to different methods of calculation.
EBITDA, Adjusted EBITDA and Adjusted EBITDA Margin
We define “EBITDA” as net income (loss) before other interest expense, net (excluding floor plan interest expense), provision for income tax expense (benefit) and depreciation and amortization. We define “Adjusted EBITDA” as EBITDA further adjusted for the impact of certain noncash and other items that we do not consider in our evaluation of ongoing operating performance. These items include, among other things, long-lived asset impairment, gains and losses on sale or disposal of assets, net, SBC, losses and gains and/or impairment on investments in equity securities, lease termination costs, and other unusual or one-time items. We define “Adjusted EBITDA Margin” as Adjusted EBITDA as a percentage of total revenue. We caution investors that amounts presented in accordance with our definitions of EBITDA, Adjusted EBITDA, and Adjusted EBITDA Margin may not be comparable to similar measures disclosed by our competitors, because not all companies and analysts calculate EBITDA, Adjusted EBITDA, and Adjusted EBITDA Margin in the same manner. We present EBITDA, Adjusted EBITDA, and Adjusted EBITDA Margin because we consider them to be important supplemental measures of our performance and believe they are frequently used by securities analysts, investors and other interested parties in the evaluation of companies in our industry. Management believes that investors’ understanding of our performance is enhanced by including these Non-GAAP Financial Measures as a reasonable basis for comparing our ongoing results of operations.
12
The following table reconciles EBITDA, Adjusted EBITDA and Adjusted EBITDA Margin to the most directly comparable GAAP financial performance measures (unaudited):
|
|
Three Months Ended June 30, |
|
Six Months Ended June 30, |
|
||||||||
($ in thousands) |
|
2025 |
|
2024 |
|
2025 |
|
2024 |
|
||||
EBITDA and Adjusted EBITDA: |
|
|
|
|
|
|
|
|
|
|
|
|
|
Net income (loss) |
|
$ |
57,523 |
|
$ |
23,414 |
|
$ |
32,841 |
|
$ |
(27,392) |
|
Other interest expense, net |
|
|
30,836 |
|
|
36,153 |
|
|
61,367 |
|
|
72,247 |
|
Depreciation and amortization |
|
|
23,419 |
|
|
20,032 |
|
|
45,963 |
|
|
39,322 |
|
Income tax expense (benefit) |
|
|
18,321 |
|
|
7,935 |
|
|
14,850 |
|
|
(1,107) |
|
Subtotal EBITDA |
|
|
130,099 |
|
|
87,534 |
|
|
155,021 |
|
|
83,070 |
|
Long-lived asset impairment (a) |
|
|
— |
|
|
4,584 |
|
|
620 |
|
|
10,411 |
|
Loss (gain) on sale or disposal of assets, net (b) |
|
|
1,185 |
|
|
7,945 |
|
|
(638) |
|
|
9,530 |
|
SBC (c) |
|
|
8,444 |
|
|
5,397 |
|
|
15,714 |
|
|
10,594 |
|
Loss and/or impairment on investments in equity securities (d) |
|
|
2,600 |
|
|
81 |
|
|
2,757 |
|
|
175 |
|
Lease termination (e) |
|
|
(107) |
|
|
40 |
|
|
(107) |
|
|
40 |
|
Adjusted EBITDA |
|
$ |
142,221 |
|
$ |
105,581 |
|
$ |
173,367 |
|
$ |
113,820 |
|
|
|
Three Months Ended June 30, |
|
Six Months Ended June 30, |
|||||
(as percentage of total revenue) |
|
2025 |
|
2024 |
|
2025 |
|
2024 |
|
Adjusted EBITDA margin: |
|
|
|
|
|
|
|
|
|
Net income (loss) margin |
|
2.9% |
|
1.3% |
|
1.0% |
|
|
(0.9%) |
Other interest expense, net |
|
1.6% |
|
2.0% |
|
1.8% |
|
|
2.3% |
Depreciation and amortization |
|
1.2% |
|
1.1% |
|
1.4% |
|
|
1.2% |
Income tax expense (benefit) |
|
0.9% |
|
0.4% |
|
0.4% |
|
|
(0.0%) |
Subtotal EBITDA margin |
|
6.6% |
|
4.8% |
|
4.6% |
|
|
2.6% |
Long-lived asset impairment (a) |
|
— |
|
0.3% |
|
0.0% |
|
|
0.3% |
Loss (gain) on sale or disposal of assets, net (b) |
|
0.1% |
|
0.4% |
|
(0.0%) |
|
|
0.3% |
SBC (c) |
|
0.4% |
|
0.3% |
|
0.5% |
|
|
0.3% |
Loss and/or impairment on investments in equity securities (d) |
|
0.1% |
|
0.0% |
|
0.1% |
|
|
0.0% |
Lease termination (e) |
|
(0.0%) |
|
0.0% |
|
(0.0%) |
|
|
0.0% |
Adjusted EBITDA margin |
|
7.2% |
|
5.8% |
|
5.1% |
|
|
3.6% |
|
Three Months Ended |
|
TTM Ended |
|||||||||||
|
June 30, |
|
March 31, |
|
December 31, |
|
September 30, |
|
June 30, |
|||||
($ in thousands) |
2025 |
|
2025 |
|
2024 |
|
2024 |
|
2025 |
|||||
Adjusted EBITDA: |
|
|
|
|
|
|
|
|
|
|
|
|
|
|
Net income (loss) |
$ |
57,523 |
|
$ |
(24,682) |
|
$ |
(59,544) |
|
$ |
8,056 |
|
$ |
(18,647) |
Other interest expense, net |
|
30,836 |
|
|
30,531 |
|
|
32,320 |
|
|
35,877 |
|
|
129,564 |
Depreciation and amortization |
|
23,419 |
|
|
22,544 |
|
|
21,285 |
|
|
20,583 |
|
|
87,831 |
Income tax expense (benefit) |
|
18,321 |
|
|
(3,471) |
|
|
(8,221) |
|
|
(2,049) |
|
|
4,580 |
Subtotal EBITDA |
|
130,099 |
|
|
24,922 |
|
|
(14,160) |
|
|
62,467 |
|
|
203,328 |
Long-lived asset impairment (a) |
|
— |
|
|
620 |
|
|
2,706 |
|
|
1,944 |
|
|
5,270 |
Loss (gain) on sale or disposal of assets, net (b) |
|
1,185 |
|
|
(1,823) |
|
|
330 |
|
|
(5) |
|
|
(313) |
SBC (c) |
|
8,444 |
|
|
7,270 |
|
|
5,418 |
|
|
5,573 |
|
|
26,705 |
Loss and/or impairment on investments in equity securities (d) |
|
2,600 |
|
|
157 |
|
|
2,925 |
|
|
162 |
|
|
5,844 |
Lease termination (e) |
|
(107) |
|
|
— |
|
|
288 |
|
|
(2,625) |
|
|
(2,444) |
Adjusted EBITDA |
$ |
142,221 |
|
$ |
31,146 |
|
$ |
(2,493) |
|
$ |
67,516 |
|
$ |
238,390 |
| (a) | Represents long-lived asset impairment charges related to the RV and Outdoor Retail segment. |
(b) |
Represents an adjustment to eliminate the gains and losses on disposals and sales of various assets. |
(c) |
Represents noncash SBC expense relating to employees, directors, and consultants of the Company. |
(d) |
Represents loss and/or impairment on investments in equity securities and interest income relating to any notes receivables with those investments. |
| (e) | Represents the gains and losses on the termination of operating leases resulting from lease termination fees and the derecognition of the operating lease assets and liabilities. |
13
Adjusted Net Income (Loss) Attributable to Camping World Holdings, Inc. and Adjusted Earnings (Loss) Per Share
We define “Adjusted Net Income (Loss) Attributable to Camping World Holdings, Inc. – Basic” as net income (loss) attributable to Camping World Holdings, Inc. adjusted for the impact of certain noncash and other items that we do not consider in our evaluation of ongoing operating performance. These items include, among other things, long-lived asset impairment, gains and losses on sale or disposal of assets, net, SBC, loss and/or impairment on investments in equity securities, lease termination costs, other unusual or one-time items, the income tax (expense) benefit effect of these adjustments, and the effect of net income (loss) attributable to non-controlling interests from these adjustments.
We define “Adjusted Net Income (Loss) Attributable to Camping World Holdings, Inc. – Diluted” as Adjusted Net Income (Loss) Attributable to Camping World Holdings, Inc. – Basic adjusted for the reallocation of net income (loss) attributable to non-controlling interests from stock options and restricted stock units, if dilutive, or the assumed redemption, if dilutive, of all outstanding common units in CWGS, LLC for shares of newly-issued Class A common stock of Camping World Holdings, Inc.
We define “Adjusted Earnings (Loss) Per Share – Basic” as Adjusted Net Income (Loss) Attributable to Camping World Holdings, Inc. - Basic divided by the weighted-average shares of Class A common stock outstanding. We define “Adjusted Earnings (Loss) Per Share – Diluted” as Adjusted Net Income (Loss) Attributable to Camping World Holdings, Inc. – Diluted divided by the weighted-average shares of Class A common stock outstanding, assuming (i) the redemption of all outstanding common units in CWGS, LLC for newly-issued shares of Class A common stock of Camping World Holdings, Inc., if dilutive, and (ii) the dilutive effect of stock options and restricted stock units, if any. We present Adjusted Net Income (Loss) Attributable to Camping World Holdings, Inc. – Basic, Adjusted Net Income (Loss) Attributable to Camping World Holdings, Inc. – Diluted, Adjusted Earnings (Loss) Per Share – Basic, and Adjusted Earnings (Loss) Per Share – Diluted because we consider them to be important supplemental measures of our performance and we believe that investors’ understanding of our performance is enhanced by including these Non-GAAP financial measures as a reasonable basis for comparing our ongoing results of operations.
The following table reconciles Adjusted Net Income (Loss) Attributable to Camping World Holdings, Inc. – Basic, Adjusted Net Income (Loss) Attributable to Camping World Holdings, Inc. – Diluted, Adjusted Earnings (Loss) Per Share – Basic, and Adjusted Earnings (Loss) Per Share – Diluted to the most directly comparable GAAP financial performance measure:
|
|
Three Months Ended June 30, |
|
Six Months Ended June 30, |
||||||||
|---|---|---|---|---|---|---|---|---|---|---|---|---|
(In thousands except per share amounts) |
|
2025 |
|
2024 |
|
2025 |
|
2024 |
||||
Numerator: |
|
|
|
|
|
|
|
|
|
|
|
|
Net income (loss) attributable to Camping World Holdings, Inc. |
|
$ |
30,216 |
|
$ |
9,771 |
|
$ |
17,936 |
|
$ |
(12,536) |
Adjustments related to basic calculation: |
|
|
|
|
|
|
|
|
|
|
|
|
Long-lived asset impairment (a): |
|
|
|
|
|
|
|
|
|
|
|
|
Gross adjustment |
|
|
— |
|
|
4,584 |
|
|
620 |
|
|
10,411 |
Income tax expense for above adjustment (b) |
|
|
— |
|
|
(607) |
|
|
(95) |
|
|
(1,378) |
Lease termination (c): |
|
|
|
|
|
|
|
|
|
|
|
|
Gross adjustment |
|
|
(107) |
|
|
40 |
|
|
(107) |
|
|
40 |
Income tax benefit (expense) for above adjustment (b) |
|
|
16 |
|
|
(5) |
|
|
16 |
|
|
(5) |
Loss (gain) on sale or disposal of assets (d): |
|
|
|
|
|
|
|
|
|
|
|
|
Gross adjustment |
|
|
1,185 |
|
|
7,945 |
|
|
(638) |
|
|
9,530 |
Income tax (expense) benefit for above adjustment (b) |
|
|
(180) |
|
|
(1,052) |
|
|
98 |
|
|
(1,262) |
SBC (e): |
|
|
|
|
|
|
|
|
|
|
|
|
Gross adjustment |
|
|
8,444 |
|
|
5,397 |
|
|
15,714 |
|
|
10,594 |
Income tax expense for above adjustment (b) |
|
|
(1,290) |
|
|
(722) |
|
|
(2,404) |
|
|
(1,417) |
Loss and/or impairment on investments in equity securities (f): |
|
|
|
|
|
|
|
|
|
|
|
|
Gross adjustment |
|
|
2,600 |
|
|
81 |
|
|
2,757 |
|
|
175 |
Income tax expense for above adjustment (b) |
|
|
(397) |
|
|
(11) |
|
|
(421) |
|
|
(23) |
Adjustment to net income (loss) attributable to non-controlling interests resulting from the above adjustments (g) |
|
|
(4,719) |
|
|
(8,481) |
|
|
(7,139) |
|
|
(14,452) |
Adjusted net income (loss) attributable to Camping World Holdings, Inc. – basic |
|
|
35,768 |
|
|
16,940 |
|
|
26,337 |
|
|
(323) |
14
|
|
Three Months Ended June 30, |
|
Six Months Ended June 30, |
||||||||
|---|---|---|---|---|---|---|---|---|---|---|---|---|
(In thousands except per share amounts) |
|
2025 |
|
2024 |
|
2025 |
|
2024 |
||||
Adjustments related to diluted calculation: |
|
|
|
|
|
|
|
|
|
|
|
|
Reallocation of net income (loss) attributable to non-controlling interests from the dilutive effect of stock options and restricted stock units (h) |
|
|
43 |
|
|
39 |
|
|
— |
|
|
(38) |
Income tax on reallocation of net income (loss) attributable to non-controlling interests from the dilutive effect of stock options and restricted stock units (i) |
|
|
(11) |
|
|
(9) |
|
|
— |
|
|
10 |
Reallocation of net income (loss) attributable to non-controlling interests from the dilutive redemption of common units in CWGS, LLC (h) |
|
|
— |
|
|
— |
|
|
22,043 |
|
|
— |
Income tax on reallocation of net income (loss) attributable to non-controlling interests from the dilutive redemption of common units in CWGS, LLC (i) |
|
|
— |
|
|
— |
|
|
(5,637) |
|
|
— |
Adjusted net income (loss) attributable to Camping World Holdings, Inc. – diluted |
|
$ |
35,800 |
|
$ |
16,970 |
|
$ |
42,743 |
|
$ |
(351) |
Denominator: |
|
|
|
|
|
|
|
|
|
|
|
|
Weighted-average Class A common shares outstanding – basic |
|
|
62,610 |
|
|
45,093 |
|
|
62,571 |
|
|
45,070 |
Adjustments related to diluted calculation: |
|
|
|
|
|
|
|
|
|
|
|
|
Dilutive redemption of common units in CWGS, LLC for shares of Class A common stock (j) |
|
|
— |
|
|
— |
|
|
39,895 |
|
|
— |
Dilutive options to purchase Class A common stock (j) |
|
|
— |
|
|
— |
|
|
— |
|
|
14 |
Dilutive restricted stock units (j) |
|
|
137 |
|
|
151 |
|
|
195 |
|
|
207 |
Adjusted weighted average Class A common shares outstanding – diluted |
|
|
62,747 |
|
|
45,244 |
|
|
102,661 |
|
|
45,291 |
|
|
|
|
|
|
|
|
|
|
|
|
|
Adjusted earnings (loss) per share - basic |
|
$ |
0.57 |
|
$ |
0.38 |
|
$ |
0.42 |
|
$ |
(0.01) |
Adjusted earnings (loss) per share - diluted |
|
$ |
0.57 |
|
$ |
0.38 |
|
$ |
0.42 |
|
$ |
(0.01) |
|
|
|
|
|
|
|
|
|
|
|
|
|
Anti-dilutive amounts (k): |
|
|
|
|
|
|
|
|
|
|
|
|
Numerator: |
|
|
|
|
|
|
|
|
|
|
|
|
Reallocation of net income (loss) attributable to non-controlling interests from the anti-dilutive redemption of common units in CWGS, LLC (h) |
|
$ |
31,983 |
|
$ |
22,085 |
|
$ |
— |
|
$ |
(366) |
Income tax on reallocation of net income (loss) attributable to non-controlling interests from the anti-dilutive redemption of common units in CWGS, LLC (i) |
|
$ |
(8,236) |
|
$ |
(5,126) |
|
$ |
— |
|
$ |
592 |
Denominator: |
|
|
|
|
|
|
|
|
|
|
|
|
Anti-dilutive redemption of common units in CWGS, LLC for shares of Class A common stock (j) |
|
|
39,895 |
|
|
40,045 |
|
|
— |
|
|
40,045 |
|
|
|
|
|
|
|
|
|
|
|
|
|
Reconciliation of per share amounts: |
|
|
|
|
|
|
|
|
|
|
|
|
Earnings (loss) per share of Class A common stock — basic |
|
$ |
0.48 |
|
$ |
0.22 |
|
$ |
0.29 |
|
$ |
(0.28) |
Non-GAAP Adjustments (l) |
|
|
0.09 |
|
|
0.16 |
|
|
0.13 |
|
|
0.27 |
Adjusted earnings (loss) per share - basic |
|
$ |
0.57 |
|
$ |
0.38 |
|
$ |
0.42 |
|
$ |
(0.01) |
|
|
|
|
|
|
|
|
|
|
|
|
|
Earnings (loss) per share of Class A common stock — diluted |
|
$ |
0.48 |
|
$ |
0.22 |
|
$ |
0.28 |
|
$ |
(0.28) |
Non-GAAP Adjustments (l) |
|
|
0.09 |
|
|
0.16 |
|
|
0.14 |
|
|
0.27 |
Adjusted earnings (loss) per share - diluted |
|
$ |
0.57 |
|
$ |
0.38 |
|
$ |
0.42 |
|
$ |
(0.01) |
| (a) | Represents long-lived asset impairment charges related to the RV and Outdoor Retail segment. |
| (b) | Represents the current and deferred income tax expense or benefit effect of the above adjustments. This assumption uses blended statutory tax rate of 25.0% for the adjustments for the 2025 and 2024 periods, which represent the estimated tax rates that would apply had the above adjustments been included in the determination of our non-GAAP metric. |
| (c) | Represents the (gain) loss on termination of operating leases resulting from lease termination fees and the derecognition of the operating lease assets and liabilities. |
| (d) | Represents an adjustment to eliminate the gains and losses on disposals and sales of various assets. |
| (e) | Represents noncash SBC expense relating to employees, directors, and consultants of the Company. |
| (f) | Represents loss and/or impairment on investments in equity securities and interest income relating to any notes receivables with those investments. |
| (g) | Represents the adjustment to net income (loss) attributable to non-controlling interests resulting from the above adjustments that impact the net income (loss) of CWGS, LLC. This adjustment uses the non-controlling interest’s weighted average ownership of CWGS, LLC of 38.9% and 47.0% for the three months ended June 30, 2025 and 2024, respectively, and 38.9% and 47.0% for the six months ended June 30, 2025 and 2024, respectively. |
| (h) | Represents the reallocation of net income (loss) attributable to non-controlling interests from the impact of the assumed change in ownership of CWGS, LLC from stock options, restricted stock units, and/or common units of CWGS, LLC. |
| (i) | Represents the income tax expense effect of the above adjustment for reallocation of net income (loss) attributable to non-controlling interests. This assumption uses a blended statutory tax rate of 25.0% for the adjustments for the 2025 and 2024 periods. |
| (j) | Represents the impact to the denominator for stock options, restricted stock units, and/or common units of CWGS, LLC. |
| (k) | The below amounts have not been considered in our adjusted earnings (loss) per share – diluted amounts as the effect of these items are anti-dilutive. Additionally, 750,000 performance stock units granted in January 2025 were excluded from the calculation of our adjusted earnings (loss) per share – diluted, since they represent contingently issuable shares for which all of the necessary conditions had not been satisfied. |
| (l) | Represents the per share impact of the Non-GAAP adjustments to net income (loss) detailed above (see (a) through (g) above). |
15
Our “Up-C” corporate structure may make it difficult to compare our results with those of companies with a more traditional corporate structure. There can be a significant fluctuation in the numerator and denominator for the calculation of our adjusted earnings (loss) per share – diluted depending on if the common units in CWGS, LLC are considered dilutive or anti-dilutive for a given period. To improve comparability of our financial results, users of our financial statements may find it useful to review our loss per share assuming the full redemption of common units in CWGS, LLC for all periods, even when those common units would be anti-dilutive. The relevant numerator and denominator adjustments have been provided under “Anti-dilutive amounts” in the table above (see (k) above).
SG&A Excluding SBC
We define “SG&A Excluding SBC” as SG&A before SBC relating to SG&A. We caution investors that amounts presented in accordance with our definition of SG&A Excluding SBC may not be comparable to similar measures disclosed by our competitors, because not all companies and analysts calculate SG&A Excluding SBC in the same manner. We present SG&A Excluding SBC because we believe that investors’ understanding of our performance and drivers of our other Non-GAAP Financial Measures, such as Adjusted EBITDA, is enhanced by including this Non-GAAP Financial Measure. We believe it provides a reasonable basis for comparing our ongoing results of operations.
The following table reconciles SG&A Excluding SBC to the most directly comparable GAAP financial performance measure:
|
|
Three Months Ended June 30, |
|
Six Months Ended June 30, |
||||||||
($ in thousands) |
|
2025 |
|
2024 |
|
2025 |
|
2024 |
||||
SG&A Excluding SBC: |
|
|
|
|
|
|
|
|
|
|
|
|
SG&A |
|
$ |
437,489 |
|
$ |
419,676 |
|
$ |
824,934 |
|
$ |
791,149 |
SBC - SG&A |
|
|
(8,344) |
|
|
(5,308) |
|
|
(15,489) |
|
|
(10,413) |
SG&A Excluding SBC: |
|
$ |
429,145 |
|
$ |
414,368 |
|
$ |
809,445 |
|
$ |
780,736 |
As a percentage of gross profit |
|
|
72.5% |
|
|
75.7% |
|
|
79.2% |
|
|
82.2% |
Contacts
Investors:
Brett Andress
InvestorRelations@campingworld.com
Media Outlets:
PR-CWGS@CampingWorld.com
16
|
. July 29, 2025 INVESTOR PRESENTATION |
|
Camping World confidential and proprietary. Unauthorized disclosure, reproduction or other use prohibited. 2 Safe Harbor 2 F o r w a r d - L o o k i n g S t a t e m e n t s This presentation contains forward-looking statements within the meaning of the Private Securities Litigation Reform Act of 1995. All statements contained in this presentation that do not relate to matters of historical fact should be considered forward-looking statements, including, without limitation, statements about our business plans and goals, potential financial impacts of industry trends and new store capacity, the strength of our business, anticipated new and used unit sales and gross margin improvements; reductions in SG&A; variability in average selling prices; market share goals; illustrative financial results; expectations regarding M&A; our ability to address untapped demand; expectations regarding contract manufacturing capabilities; and our long-term plan. These forward-looking statements are based on management’s current expectations. These statements are neither promises nor guarantees, but involve known and unknown risks, uncertainties and other important factors that may cause our actual results, performance or achievements to be materially different from any future results, performance or achievements expressed or implied by the forward-looking statements, including, but not limited to, the following: general economic conditions, including inflation, interest rates and tariffs; the availability of financing to us and our customers; fuel shortages, high prices for fuel or changes in energy sources; the success of our manufacturers; changes in consumer preferences; competition in our industry; risks related to acquisitions, new store openings and expansion into new markets; our failure to maintain the strength and value of our brands; our ability to manage our inventory; fluctuations in our same store sales; the cyclical and seasonal nature of our business; our dependence on the availability of adequate capital and risks related to our debt; our ability to execute and achieve the expected benefits of our cost cutting initiatives; our reliance on our fulfillment and distribution centers; impacts from natural disasters, including pandemics and outbreaks; our dependence on our relationships with third party suppliers and lending institutions; risks associated with selling goods manufactured abroad; our ability to retain senior executives and attract and retain other qualified employees; risks associated with leasing substantial amounts of space; risks associated with our private brand offerings; we may incur asset impairment charges for goodwill, intangible assets or other long-lived assets; tax risks; our private brand offerings exposing us to various risks; regulatory risks; data privacy and cybersecurity risks; risks related to our intellectual property; the impact of ongoing or future lawsuits against us and certain of our officers and directors; risks related to climate change and other environmental, social and governance matters; and risks related to our organizational structure. These and other important factors discussed under the caption “Risk Factors” in our Annual Report on Form 10-K filed for the year ended December 31, 2024, as updated by our Quarterly Report on Form 10-Q and our other reports filed with the SEC could cause actual results to differ materially from those indicated by the forward-looking statements made in this presentation. Any such forward-looking statements represent management’s estimates as of the date of this presentation. While we may elect to update such forward-looking statements at some point in the future, we disclaim any obligation to do so, even if subsequent events cause our views to change, except as required under applicable law. These forward-looking statements should not be relied upon as representing our views as of any date subsequent to the date of this presentation. M a r k e t a n d I n d u s t r y D a t a This presentation includes information concerning economic conditions, the Company’s industry, the Company’s markets and the Company’s competitive position that is based on a variety of sources, including information from independent industry analysts and publications, as well as Camping World’s own estimates and research. Camping World’s estimates are derived from publicly available information released by third party sources, as well as data from its internal research, and are based on such data and the Company’s knowledge of its industry, which the Company believes to be reasonable. The independent industry publications used in this presentation were not prepared on the Company’s behalf. While the Company is not aware of any misstatements regarding any information in this presentation, forecasts, assumptions, expectations, beliefs, estimates and projects involve risk and uncertainties and are subject to change based on various factors. |
|
3 To be populated once Q3 final Acutely Focused on Improving Per Rooftop Productivity Driving structural productivity gains: headcount down >900, 16 locations consolidated, 7,818 more units sold Y/Y 1. Based on new and used registrations from April and May in 2019 and 2025 as per Statistical Surveys from SSI Data, LLC 2. Employment Cost Index as per Federal Reserve Bank of St. Louis 40 50 60 70 80 90 April May June 2019 2023 2024 2025 New and Used Industry Unit Sales in 2Q25 = (-15)% vs. 2019 Levels1 2Q Unit Sales per Rooftop New and Used Units 2Q 4-Wall Labor Expenses per Rooftop per Unit Sale Inflation Adjusted; Chained to 2025 Dollars $2,000 $3,000 $4,000 $5,000 $6,000 April May June 2019 2023 2024 2025 US Labor Costs per Employment Cost Index = +27% vs. 20192 *4-Wall Labor includes service, retail, local and regional support |
|
4 To be populated once Q3 final Significant Gains in New and Used Unit Share Continue CWH continues to meaningfully outperform the RV industry, with 2025 unit growth expected in both new and used Based on new and used registrations as per Statistical Surveys from SSI Data, LLC as of May 31, 2025; and CWH units sold Rolling TTM New and Used Units Comparison Industry ex-CWH (lhs) vs. CWH (rhs) 105,000 110,000 115,000 120,000 125,000 130,000 135,000 800,000 900,000 1,000,000 1,100,000 1,200,000 1,300,000 1,400,000 1/22 3/22 5/22 7/22 9/22 11/22 1/23 3/23 5/23 7/23 9/23 11/23 1/24 3/24 5/24 7/24 9/24 11/24 1/25 3/25 5/25 Industry ex-CWH New and Used Units CWH New and Used Units Rolling TTM Year-over-Year Growth Comparison Industry ex-CWH vs. CWH (20.0%) (15.0%) (10.0%) (5.0%) 0.0% 5.0% 10.0% 15.0% 20.0% 1/22 3/22 5/22 7/22 9/22 11/22 1/23 3/23 5/23 7/23 9/23 11/23 1/24 3/24 5/24 7/24 9/24 11/24 1/25 3/25 5/25 CWH New and Used Units Industry ex-CWH New and Used Units |
|
5 To be populated once Q3 final F2Q24 F2Q25 Y/Y Change All New Units Total Units 22,084 26,696 +4,612 Total ASP $38,358 $34,279 ($4,079) Total GP (Front & Back) $250.7m $256.9m +$6.3m Contract Manufactured Conventional Trailers Total Units 1,842 4,831 +2,989 Total ASP $14,021 $12,840 ($1,181) Total GP (Front & Back) $7.3m $15.6m +$8.3m Contract Manufactured Laminate Trailers Total Units 258 1,629 +1,371 Total ASP $15,576 $15,416 ($160) Total GP (Front & Back) $0.7m $6.6m +$5.9m Traditional Units Total Units 19,984 20,236 +252 Total ASP $40,926 $40,973 +$47 Total GP (Front & Back) $242.7m $234.8m ($7.9m) Contract manufacturing scale and expertise creates white space to address untapped demand… Our contract manufacturing capabilities help to a create white space for the millions of intenders1 looking to enter the RVing lifestyle, while providing the potential to generate incremental volume, gross profit dollars and customer lifetime value opportunity (3.6%) (10.7%) (10.4%) (5.9%) (10.1%) (8.1%) Jan Feb Mar Apr May YTD Industry Units >$20k Detailed Breakout of F2Q25 New Unit Sales Mix 1. “New Study Revals Emerging RV Buyers Are Younger, More Diverse, and Ready to Hit the Road”, RV Industry Association, dated June 24, 2025. …and continuing to grow traditional segment units and gain share despite industry declines New ASP Trends Driven by Mix, Contract Mfg. Capabilities Affordability mandate mixing down new ASPs, driving incremental gross profit, market share, and lifetime value |
|
6 To be populated once Q3 final F2Q25 New ASP Y/Y Dollar Change F2Q25 New ASP Y/Y Percent Change F2Q25 Illustrative SG&A as % of GP +$3,000 8% 68.6% +$1,000 3% 69.9% Flat - 70.5% ($1,000) (3%) 71.3% ($3,000) (8%) 72.9% ($4,079)1 (11%) 73.9% ($7,000) (18%) 76.1% Illustrative sensitivity of F2Q25 new vehicle ASP impacts on SG&A as a percent of gross profit calculations FY25 New ASP Y/Y Dollar Change FY25 New ASP Y/Y Percent Change FY25 Illustrative Chg. In SG&A as % of GP +$3,000 7% (805bps) +$1,000 2% (675 bps) Flat - (605 bps) ($1,000) (2%) (535 bps) ($3,000) (7%) (395 bps) ($5,000) (12%) (240 bps) ($7,000) (17%) (85 bps) Illustrative sensitivity of FY25 new vehicle ASP impacts on SG&A as a percent of gross profit calculations New ASP/Mix the Primary Driver of SG&A/Gross Trends Expect SG&A as a percent of gross profit improvement of 300-400 bps Y/Y given evolution of new ASPs during F2Q25 For illustrative purposes only. The sensitivity is performed by changing the average selling price, and the resulting impact on gross profit, with everything else held constant. 1. Based on actual. |
|
1 New and used registrations as reported by SSI Data, LLC, d/b/a Statistical Surveys. 2 Market share is calculated based on CWH total units sold, divided by new and used registrations as reported by SSI Data, LLC, d/b/a Statistical Surveys. Mid-cycle unit share per dealership is based on the observed unit share per dealership as of the trailing-twelve-month period ended June 30, 2025. 3 Mid-cycle gross margin metric is derived based on the consideration of the average of the respective statistics in fiscal years from 2015 to 2024, and trailing twelve months as of June 30, 2025, disregarding the highest and lowest observations, as well as the expected gross margin improvement. Revenue per dealership is calculated as total revenue divided by the ending dealership count in the respective periods. Mid-cycle SG&A as percentage of gross profit metric is derived based on the consideration of the average of the respective statistics in fiscal years from 2015 to 2024, and trailing twelve months as of June 30, 2025, disregarding the highest and lowest observations. 4 Total gross profit and SG&A are derived based on the reported gross profit and SG&A as per the SEC filings, adjusted for restructuring costs, and other one-time expenses. See Page 8 for reconciliation. 5 Total adjusted SG&A divided by total adjusted gross profit. 6 Mid-cycle adjustments are considered to mitigate volatility in certain metrics due to the peak and trough cycles. 7 Illustrative results for incremental 25 Dealerships are estimates. We are unable to provide a reconciliation of Adjusted EBITDA, Adjusted EBITDA margin, Adjusted gross profit, Adjusted gross profit margin, Adjusted SG&A, and Adjusted SG&A percent of adjusted gross profit without unreasonable efforts because reconciling items cannot be provided without unreasonable efforts. 8 A reconciliation for the total adjusted EBITDA of $520mm and $65mm, respectively , to the corresponding GAAP measures for the purpose of this illustrative example cannot be provided without unreasonable efforts, as we are unable to provide reconciling information with respect to certain items. However, to derive the total adjusted EBITDA of $520mm and $65mm, respectively, used in this example, the total SG&A is adjusted for adding the expected stock-based compensation (“SBC”) of $25mm and $3mm, respectively, estimated based on the average SBC as percentage of reported SG&A expenses, restructuring costs, and other one-time expenses, in fiscal years from 2015 to 2024, and trailing twelve months as of June 30, 2025, disregarding the highest and lowest observations. 9 Mid-cycle floorplan interest per dealership metric is derived based on considerations of the most recent trends in fiscal years from 2021 to 2024, and trailing twelve months as of June 30, 2025. 10 Adj. EBITDA margin is defined as Adjusted EBITDA as a percentage of total revenue. Adjusted gross profit margin is defined as Adjusted Gross Profit as a percentage of total revenue. 7 To be populated once Q3 final Significant Earnings Power on Current Dealership Count Updated mid-cycle scenario accounts for higher share, industry ASP trends, cycle volumes, gross margin improvement ($ in millions) FY17 Cycle-High F2Q25 TTM Current Cycle Mid-Cycle Adjustments6 Illustrative Mid-Cycle: F2Q25 Dealership Count7 Illustrative Mid-Cycle: Incremental Dealerships7 Period Ending RV Dealership Count 124 200 200 25 N.A. New RV Registrations1 472,000 350,000 Reflects higher rate environment ~400,000 Every 25 dealerships is expected to have the following contribution N.A. Used RV Registrations in a mid-cycle environment 1 689,000 715,000 Unchanged vs. prior ~800,000 CWH Total Units Sold 97,063 132,423 Reflects higher CWH share vs. prior, and return to industry ASP growth off lower base2 ~149,000 ~19,000 CWH Units per Dealership 783 662 ~740 ~740 $ in millions Total Revenue $4,280 $6,319 ~$7,200 ~$900 Total Adjusted Gross Profit4 $1,241 $1,897 Mid-cycle gross margin and expected improvement3,4 ~$2,230 ~$280 Adjusted Gross Profit Margin10 29% 30% ~31% ~31% Total Adjusted SG&A4 $824 $1,607 Mid-cycle SG&A as % of GP driven by inclusion of additional trough years into the calculation3,4 ~$1,675 ~$210 Adjusted SG&A Percent of Gross Profit5 66% 85% ~75% ~75% Total Floor Plan Interest Expense $28 $79 Mid-cycle floorplan per dealership9 ~$60 ~$8 Total Adj. EBITDA $394 $238 ~$5208 ~$658 Adj. EBITDA Margin10 9.2% 3.8% ~7% ~7% |
|
For the Fiscal Year Ended December 31, For the Six Months Ended June 30, TTM Ended June 30, ($ in millions) 2015 2016 2017 2018 2019 2020 2021 2022 2023 2024 2025 2024 2025 EBITDA Net Income / (loss) (14) $170.796 $198.476 $243.094 $65.938 ($120.122) $349.109 $645.497 $337.832 $52.929 ($78.880) $32.841 ($27.392) ($18.647) Other interest expense, net 53.377 48.318 42.959 63.329 69.363 54.689 46.912 75.745 135.270 140.444 61.367 72.247 129.564 Depreciation and amortization 24.101 24.695 31.545 49.322 59.932 51.981 66.418 80.304 68.643 81.190 45.963 39.322 87.831 Income tax expense (14) 1.293 5.800 142.508 30.433 29.403 52.849 88.702 112.283 (3.527) (11.377) 14.850 (1.107) 4.580 Subtotal EBITDA $249.567 $277.289 $460.106 $209.022 $38.576 $508.628 $847.529 $606.164 $253.315 $131.377 $155.021 $83.070 $203.328 Loss and expense on debt restructure (1) - 6.270 0.849 2.056 - - 13.468 - - - - - - Long-lived asset impairment (2) - - - - 66.270 12.353 3.044 4.231 9.269 15.061 0.620 10.411 5.270 Lease termination (3) - - - - (0.686) 4.547 2.211 1.614 (0.103) (2.297) (0.107) 0.040 (2.444) Loss (gain) on sale of assets and disposition of stores (4) 1.452 (0.564) (0.133) 2.810 11.492 1.332 (0.576) 0.622 (5.222) 9.855 (0.638) 9.530 (0.313) Goodwill impairment (5) - - - 40.046 - - - - - - - - - Equity-based compensation (6) - 1.597 5.109 14.088 13.145 20.661 47.936 33.847 24.086 21.585 15.714 10.594 26.705 Acquisitions – transaction costs (7) - - 2.662 - - - - - - - - - - Gander Outdoors pre-opening costs (8) - - 26.352 43.156 - - - - - - - - - Restructuring costs (9) - - - - 47.223 17.609 25.701 7.026 5.540 - - - - Monitoring Fees (10) 2.500 1.875 - - - - - - - - - - - Tax Receivable Agreement adjustment (11) - - (100.758) 1.324 (10.005) (0.141) 2.813 (0.114) (2.442) - - - - (Gain) loss and impairment on investments in equity securities (12) - - - - - - - - 1.770 3.262 2.757 0.175 5.844 Adjustment to normalize rent on right-to-use assets (13) (7.598) - - - - - - - - - - - - Adjusted EBITDA $245.921 $286.467 $394.187 $312.502 $166.015 $564.989 $942.126 $653.390 $286.213 $178.843 $173.367 $113.820 $238.390 Current portion of long-term debt $52.089 $6.450 $9.465 $12.977 $14.085 $12.174 $15.822 $25.229 $22.121 $23.275 $23.023 Current portion of finance lease liabilities 0.771 1.224 0.844 0.023 - 2.240 4.964 10.244 17.133 7.044 19.514 Long-term debt, net of current portion 673.304 620.303 907.437 1,152.888 1,153.551 1,122.675 1,377.751 1,484.416 1,498.958 1,493.318 1,483.470 Finance lease liabilities, net of current portion 0.751 0.841 0.023 - - 27.742 74.752 94.216 97.751 131.004 128.598 Revolving line of credit - - - 38.739 40.885 20.885 20.885 20.885 20.885 - - Total Debt $726.915 $628.818 $917.769 $1,204.627 $1,208.521 $1,185.716 $1,494.174 $1,634.990 $1,656.848 $1,654.641 $1,654.605 Less: Cash and cash equivalents (92.025) (114.196) (224.163) (138.557) (147.521) (166.072) (267.332) (130.131) (39.647) (208.422) (118.084) Net Debt $634.890 $514.622 $693.606 $1,066.070 $1,061.000 $1,019.644 $1,226.842 $1,504.859 $1,617.201 $1,446.219 $1,536.521 1) Represents the loss and expense incurred on debt restructure and financing expense incurred from the New Term Loan Facility in 2021, the Third Amendment to the Previous Term Loan Facility in 2018, the First and Second Amendment to the Previous Term Loan Facility in 2017, the write-off of a portion of the original issue discount, capitalized finance costs from the Previous Term Loan Facilities, and rating agency fees and legal expenses related to the Previous Term Loan Facilities in 2016. 2) Represents long-lived asset impairment charges related to the RV and Outdoor Retail segment. 3) Represents the (loss) / gain on the termination of operating leases, net of lease termination fees. 4) Represents an adjustment to eliminate the losses and gains on disposals and sales of various assets. 5) Represents a goodwill impairment charge of $40.0 million related to the RV and Outdoor Retail segment in the fourth quarter of 2018. 6) Represents non-cash equity-based compensation expense relating to employees and directors of the Company. 7) Represent transaction expenses, primarily legal costs, associated with acquisitions into new or complementary markets, including the Gander Mountain acquisition. This amount excludes transaction expenses related to the acquisition of RV dealerships, consumer shows, and other RV and Outdoor Retail segment business acquisitions which are considered recurring in nature. 8) Represents pre-opening store costs associated with the Gander Outdoors store openings, which is comprised of 1) Gander Outdoors-specific corporate and retail overhead, 2) distribution center expenses, and 3) store-level startup expenses. The Company incurred significant costs related to the initial rollout of Gander Outdoors locations. Based on the nature of the acquisition through a bankruptcy auction and the large quantity of retail locations opened and to be opened in a very compressed timeframe, the Company does not deem the pre-opening store costs for the initial rollout of Gander Outdoors locations to be normal, recurring charges. The Company does not intend to adjust for pre-opening store costs other than for the initial rollout of Gander Outdoors. 9) Represents restructuring costs relating to our 2019 Strategic Shift and Active Sports Restructuring. These restructuring costs include one-time employee termination benefits, incremental inventory reserve charges, and other associated costs. These costs exclude lease termination costs, which are presented separately (see (3) above). 10) Represents monitoring fees paid pursuant to a monitoring agreement to Crestview and Stephen Adams. The monitoring agreement was terminated on October 6, 2016 in connection with our IPO. 11) Represents an adjustment to eliminate the gains on remeasurement of the Tax Receivable Agreement primarily due to changes in our effective income tax rate and the transfer of certain assets from GSS Enterprises LLC (“GSS”) to Camping World, Inc. (“CW”). 12) Represents gain and loss and impairment on investments in equity securities and interest income relating to any notes receivables with those investments for period beginning after December 31, 2022. 13) Represents an adjustment to rent expense for certain right-to-use assets that were derecognized in the fourth quarter of 2015 due to lease modifications that resulted in the leases meeting the requirements to be reported as operating leases. 14) Reflects unaudited adjustments made to previously reported net income and income tax expense for fiscal years 2017 to 2021 with no impact to EBITDA or Adjusted EBITDA. Reconciliation to GAAP SUPPLEMENTAL INFORMATION 8 |
|
1) See footnote (9) of the previous page. These restructuring costs were included in costs applicable to revenue – products, service and other in the consolidated statements of operations. 2) See footnote (9) of the previous page. These restructuring costs were included in selling, general, and administrative expenses in the consolidated statements of operations. 3) See footnote (7) of the previous page. 4) See footnote (10) of the previous page. 5) See footnote (4) of the previous page. Note that these costs were only added back in 2015 because it is not a separate line item in the consolidated statements of operations. 6) See footnote (13) of the previous page. For the Fiscal Year Ended December 31, TTM Ended June 30, For the Six Months Ended June 30, ($ in millions) 2015 2016 2017 2018 2019 2020 2021 2022 2023 2024 2025 2025 2024 End of Period No. of RV Dealerships 98 105 124 141 154 160 175 189 198 204 200 200 211 Total Revenue $3,275.257 $3,516.307 $4,279.830 $4,792.017 $4,892.019 $5,446.591 $6,913.754 $6,967.013 $6,226.547 $6,099.974 $6,318.924 $3,389.472 $3,170.522 Gross Profit $895.467 $993.733 $1,240.914 $1,362.932 $1,287.398 $1,702.479 $2,456.328 $2,262.284 $1,878.649 $1,825.496 $1,897.323 $1,021.883 $950.056 Add: Restructuring costs – applicable to cost of revenue (1) - - - - 42.494 1.187 15.017 - 4.537 - - - - Adjusted Gross Profit $895.467 $993.733 $1,240.914 $1,362.932 $1,329.892 $1,703.666 $2,471.345 $2,262.284 $1,883.186 $1,825.496 $1,897.323 $1,021.883 $950.056 As % of Total Revenue 27.3% 28.3% 29.0% 28.4% 27.2% 31.3% 35.7% 32.5% 30.2% 29.9% 30.0% Selling, general, and administrative (“SG&A”) $634.890 $691.884 $853.160 $1,069.359 $1,141.643 $1,156.071 $1,573.609 $1,606.984 $1,538.988 $1,573.117 $1,606.902 $824.934 $791.149 Less: Restructuring costs – applicable to SG&A (2) - - - - 4.729 16.422 10.684 7.026 1.003 0.868 0.332 - 0.536 Less: Acquisitions – transaction costs (3) - - 2.662 - - - - - - - - - - Less: Gander Outdoors pre-opening costs (4) - - 26.352 43.156 - - - - - - - - - Less: Monitoring Fees (5) 2.500 1.875 - - - - - - - - - - - Less: Loss (gain) on sale of assets and disposition of stores (6) 1.452 - - - - - - - - - - - - Less: Adjustment to normalize rent on right-to-use assets (7) (7.598) - - - - - - - - - - - - Adjusted SG&A $638.536 $690.009 $824.146 $1,026.203 $1,136.914 $1,139.649 $1,562.925 $1,599.958 $1,537.985 $1,572.249 $1,606.570 $824.934 $790.613 As % of Adjusted Gross Profit 71.3% 69.4% 66.4% 75.3% 85.5% 66.9% 63.2% 70.7% 81.7% 86.1% 84.7% Floor plan interest expense $11.248 $18.854 $27.690 $38.315 $40.108 $19.689 $14.108 $42.031 $83.075 $95.121 $78.735 $39.295 $55.681 Equity-based compensation - $1.597 $5.109 $14.088 $13.145 $20.661 $47.936 $33.847 $24.086 $21.585 $26.705 $15.714 $10.594 Reconciliation to GAAP and Other Information SUPPLEMENTAL INFORMATION – c o n t ’d Excluded resulting from the trim average calculation 9 |