UNITED STATES
SECURITIES AND EXCHANGE COMMISSION
Washington, D.C. 20549
FORM 6-K
REPORT OF FOREIGN PRIVATE ISSUER
Pursuant to Rule 13a-16 or 15d-16
under the Securities Exchange Act of 1934
For the Month of May 2025
Commission File Number: 001-37668
FERROGLOBE PLC
(Name of Registrant)
13 Chesterfield Street,
London W1J 5JN, United Kingdom
(Address of Principal Executive Office)
Indicate by check mark whether the registrant files or will file annual reports under cover of Form 20-F or Form 40-F.
Form 20-F ☒ |
Form 40-F ☐ |
This Form 6-K consists of the following materials, which appear immediately following this page:
| ● | Press release dated May 7, 2025 announcing results for the quarter ended March 31, 2025 |
| ● | First quarter 2025 earnings call presentation |
This Form 6-K is being furnished for the purpose of incorporating by reference the information in this Form 6-K into (a) Registration Statement No. 333-208911 on Form S-8, and (b) Registration Statement No. 333-258254 on Form F-3 and related prospectuses, as such registration statements and prospectuses may be amended from time to time.
SIGNATURES
Pursuant to the requirements of the Securities Exchange Act of 1934, the registrant has duly caused this report to be signed on its behalf by the undersigned, thereunto duly authorized.
|
Date: May 7, 2025 |
|
|
FERROGLOBE PLC |
|
|
|
|
|
by |
/s/ Marco Levi |
|
|
Name: Marco Levi |
|
|
Title: Chief Executive Officer (Principal Executive Officer) |
Ferroglobe Reports First Quarter 2025 Financial Results
Maintaining 2025 Adj. EBITDA guidance of $100-$170 million
First Quarter Highlights
| ● | Reported adjusted EBITDA of $(26.8) million |
| ● | Generated $5.1 million of free cash flow |
| ● | Favorable final decision in the U.S. ferrosilicon case with preliminary EU safeguard decision expected by June |
| ● | New trade case filed by U.S. silicon metal producers on April 24 |
| ● | Increased quarterly cash dividend to $0.014 per share in March, up 8% over the prior quarter |
| ● | Repurchased 720,008 shares during the first quarter |
LONDON, May 7, 2025 (GLOBE NEWSWIRE) – Ferroglobe PLC (NASDAQ: GSM) (“Ferroglobe”, the “Company”, or the “Parent”), a leading global producer of silicon metal, silicon-based and manganese-based specialty alloys, today announced financial results for the first quarter of 2025.
Financial Highlights
|
|
|
|
|
|
% |
|
|
|
% |
|
|||||
($ in millions, except EPS) |
|
Q1 2025 |
|
Q4 2024 |
|
Q/Q |
|
Q1 2024 |
|
Y/Y |
|
|||||
|
|
|
|
|
|
|
|
|
|
|
|
|
|
|
|
|
Sales |
|
$ |
307.2 |
|
$ |
367.5 |
|
|
(16.4)% |
|
$ |
391.9 |
|
|
(21.6)% |
|
Net (loss) income attributable to the parent |
|
$ |
(66.5) |
|
$ |
(28.1) |
|
|
(136.3)% |
|
$ |
(2.0) |
|
|
(3184.7)% |
|
Adj. EBITDA |
|
$ |
(26.8) |
|
$ |
9.8 |
|
|
(372.2)% |
|
$ |
25.8 |
|
|
(203.9)% |
|
Adjusted diluted EPS |
|
$ |
(0.20) |
|
$ |
0.03 |
|
|
(849.2)% |
|
$ |
(0.00) |
|
|
(4872.9)% |
|
Operating cash flow |
|
$ |
19.4 |
|
$ |
32.1 |
|
|
(39.6)% |
|
$ |
198.0 |
|
|
(90.2)% |
|
Capital expenditures1 |
|
$ |
14.3 |
|
$ |
17.9 |
|
|
(20.3)% |
|
$ |
18.2 |
|
|
(21.5)% |
|
Free cash flow2 |
|
$ |
5.1 |
|
$ |
14.1 |
|
|
64.2% |
|
$ |
179.8 |
|
|
(97.2)% |
|
| (1) | Cash outflows for capital expenditures |
| (2) | Free cash flow is calculated as operating cash flow less capital expenditures |
Dr. Marco Levi, Ferroglobe’s Chief Executive Officer, commented, “Our first quarter adjusted EBITDA was negative, in line with our budget, reflecting the uncertain market environment. We anticipate significant improvement from the second quarter forward. Despite the soft quarter, Ferroglobe again generated positive free cash flow. We used this cash to pay increased dividends and repurchase shares, while maintaining a strong balance sheet with no net debt.
“One of the reasons for our optimistic outlook for the coming quarters is driven by our belief that we are at or near the market trough. This, combined with supportive trade actions in the U.S., including various trade measures, such as the final ferrosilicon determination, a newly filed petition by the U.S. silicon metal producers against unfair competition by imports, positions us well there. In the EU, expected safeguard measures covering all our main products should begin to benefit us in the second half. We expect improving demand to translate into higher revenues. We believe that once these uncertainties are resolved, local producers like Ferroglobe will be well-positioned to take advantage of these opportunities and regain market share,” concluded Dr. Levi.
Consolidated Sales
In the first quarter of 2025, Ferroglobe reported sales of $307.2 million, a decrease of 16.4% over the prior quarter and a decrease of 21.6% from the comparable prior year period. This decrease compared to the prior quarter was primarily attributable to lower sales volumes in silicon metal and manganese-based alloys and lower pricing in all our portfolio products, partially offset by higher volumes sold in silicon-based alloys. Sales of silicon metal and manganese-based alloys declined by $56.7 million and $4.0 million, respectively, while silicon-based alloys increased by $5.8 million, compared with the prior quarter.
Product Category Highlights
Silicon Metal
|
|
|
|
|
|
|
|
|
|
|
|||
($,000) |
|
Q1 2025 |
|
Q4 2024 |
|
% Q/Q |
|
Q1 2024 |
|
% Y/Y |
|||
Shipments in metric tons: |
|
|
36,308 |
|
|
49,797 |
|
(27.1)% |
|
|
53,183 |
|
(31.7)% |
Average selling price ($/MT): |
|
|
2,881 |
|
|
3,240 |
|
(11.1)% |
|
|
3,155 |
|
(8.7)% |
|
|
|
|
|
|
|
|
|
|
|
|
|
|
Silicon Metal Revenue |
|
|
104,603 |
|
|
161,342 |
|
(35.2)% |
|
|
167,792 |
|
(37.7)% |
Silicon Metal Adj.EBITDA |
|
|
(15,447) |
|
|
16,849 |
|
(191.7)% |
|
|
16,071 |
|
(196.1)% |
Silicon Metal Adj.EBITDA Margin |
|
|
(14.8)% |
|
|
10.4% |
|
|
|
|
9.6% |
|
|
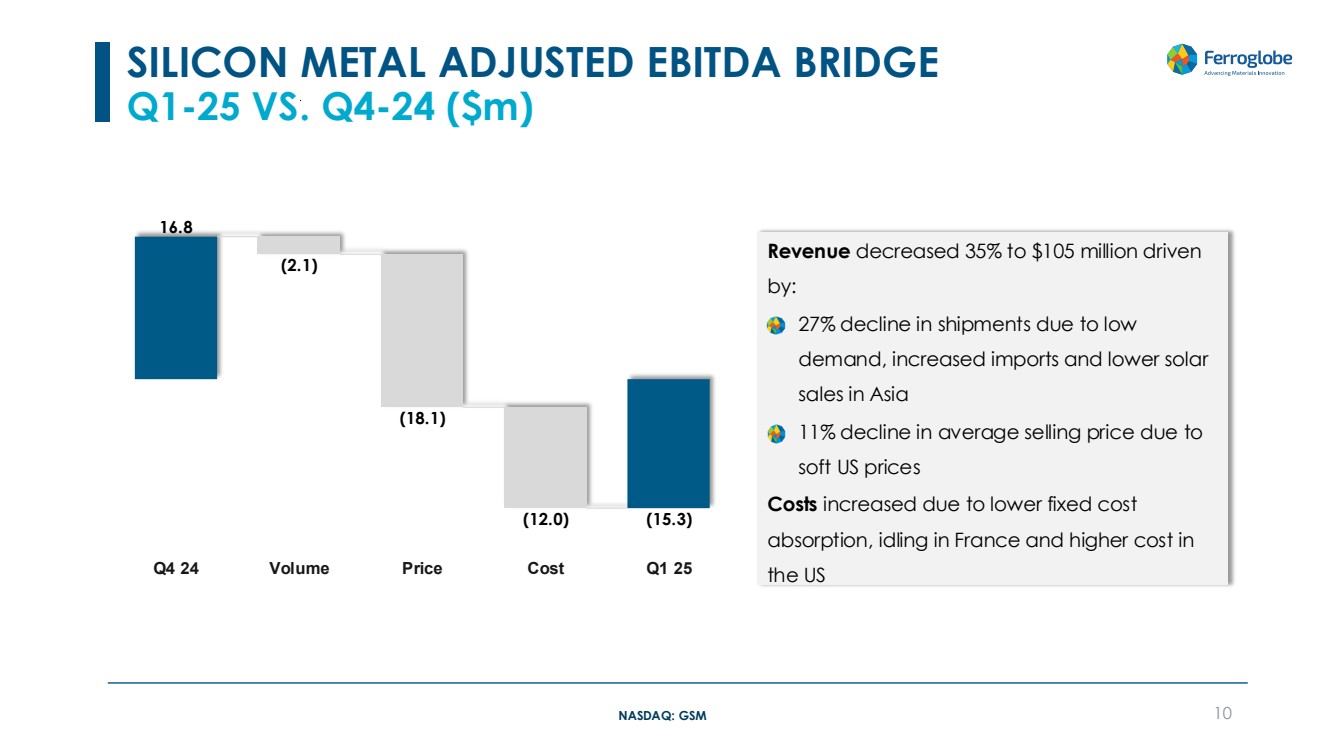
Silicon metal revenue in the first quarter was $104.6 million, a decrease of 35.2% over the prior quarter. The average selling price decreased by 11.1%, and shipments decreased by 27.1% due to lower volumes, mainly in EMEA, compared to the prior quarter. Adjusted EBITDA for silicon metal decreased to $(15.4) million for the first quarter, compared with $16.8 million for the prior quarter. In addition to lower prices, adjusted EBITDA margin further decreased mainly due to cost deterioration attributed to volume declines, lower fixed cost absorption and higher energy costs.
Silicon-Based Alloys
|
|
|
|
|
|
|
|
|
|
|
|||
($,000) |
|
Q1 2025 |
|
Q4 2024 |
|
% Q/Q |
|
Q1 2024 |
|
% Y/Y |
|||
Shipments in metric tons: |
|
|
42,864 |
|
|
39,417 |
|
8.7% |
|
|
51,171 |
|
(16.2)% |
Average selling price ($/MT): |
|
|
2,120 |
|
|
2,159 |
|
(1.8)% |
|
|
2,188 |
|
(3.1)% |
|
|
|
|
|
|
|
|
|
|
|
|
|
|
Silicon-based Alloys Revenue |
|
|
90,872 |
|
|
85,101 |
|
6.8% |
|
|
111,962 |
|
(18.8)% |
Silicon-based Alloys Adj.EBITDA |
|
|
2,414 |
|
|
3,093 |
|
(22.0)% |
|
|
14,412 |
|
(83.3)% |
Silicon-based Alloys Adj.EBITDA Margin |
|
|
2.7% |
|
|
3.6% |
|
|
|
|
12.9% |
|
|
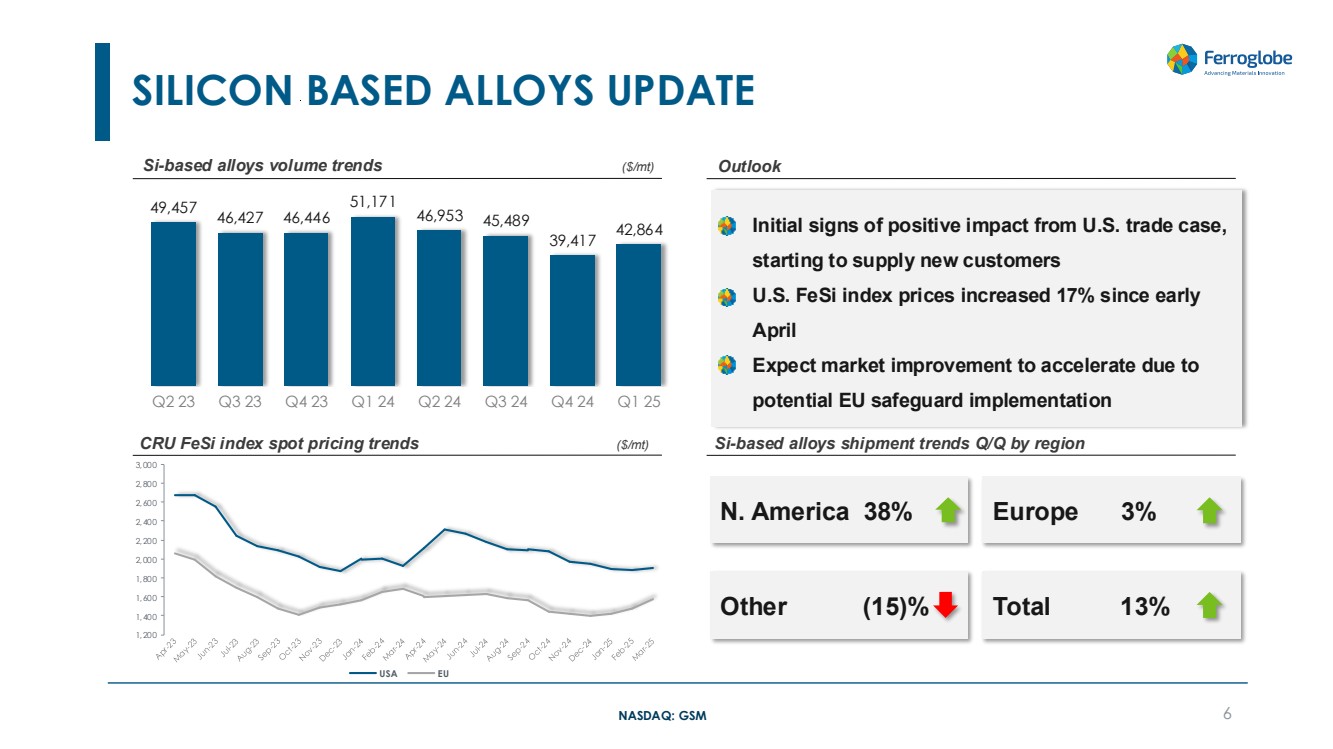
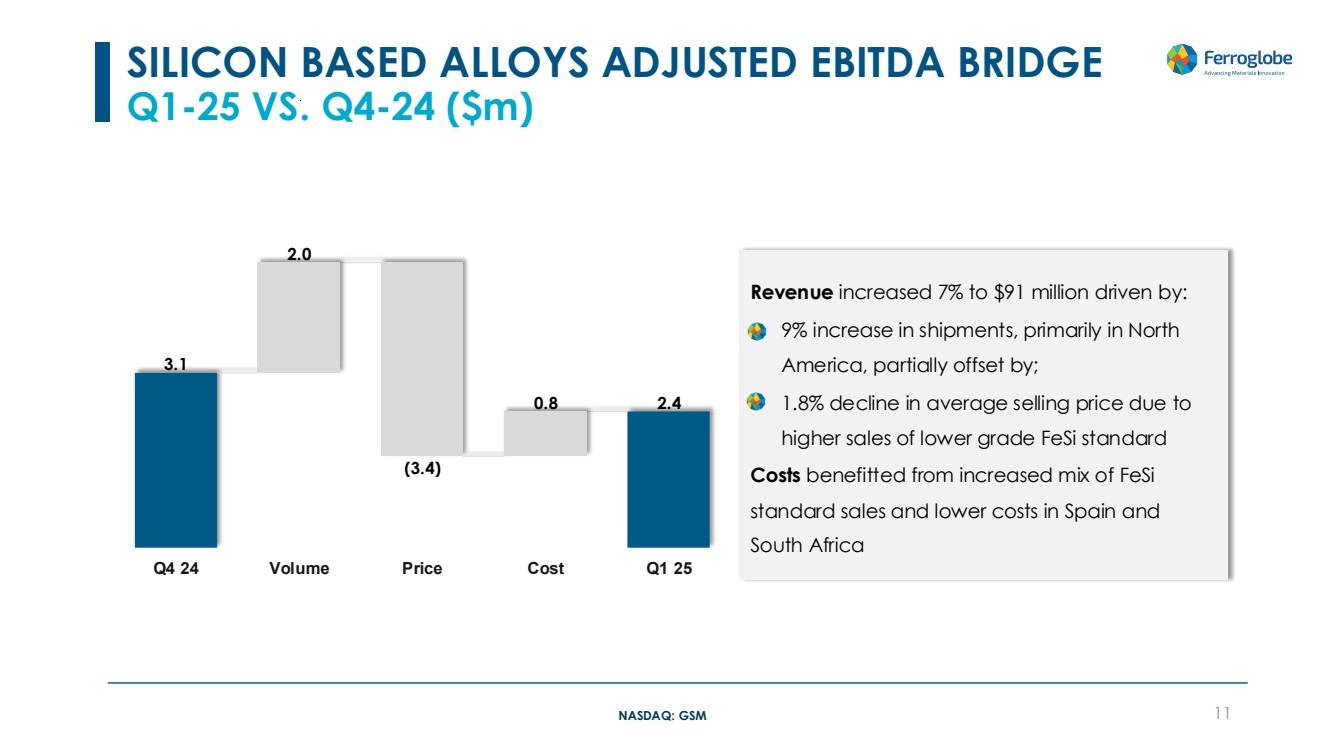
Silicon-based alloy revenue in the first quarter was $90.9 million, an increase of 6.8% over the prior quarter. The average selling price decreased by 1.8% and shipments increased by 8.7% compared to the prior quarter. Volumes increased due to higher demand in the US. Adjusted EBITDA for silicon-based alloys decreased to $2.4 million for the first quarter of 2025, a decrease of 22.0% compared with $3.1 million for the prior quarter. The adjusted EBITDA margin decrease was primarily driven by decline in prices.
Manganese-Based Alloys
|
|
|
|
|
|
|
|
|
|
|
|||
($,000) |
|
Q1 2025 |
|
Q4 2024 |
|
% Q/Q |
|
Q1 2024 |
|
% Y/Y |
|||
Shipments in metric tons: |
|
|
67,229 |
|
|
67,712 |
|
(0.7)% |
|
|
62,320 |
|
7.9% |
Average selling price ($/MT): |
|
|
1,108 |
|
|
1,159 |
|
(4.4)% |
|
|
1,066 |
|
3.9% |
|
|
|
|
|
|
|
|
|
|
|
|
|
|
Manganese-based Alloys Revenue |
|
|
74,490 |
|
|
78,478 |
|
(5.1)% |
|
|
66,433 |
|
12.1% |
Manganese-based Alloys Adj.EBITDA |
|
|
(5,574) |
|
|
7,091 |
|
(178.6)% |
|
|
5,520 |
|
(201.0)% |
Manganese-based Alloys Adj.EBITDA Margin |
|
|
(7.5)% |
|
|
9.0% |
|
|
|
|
8.3% |
|
|
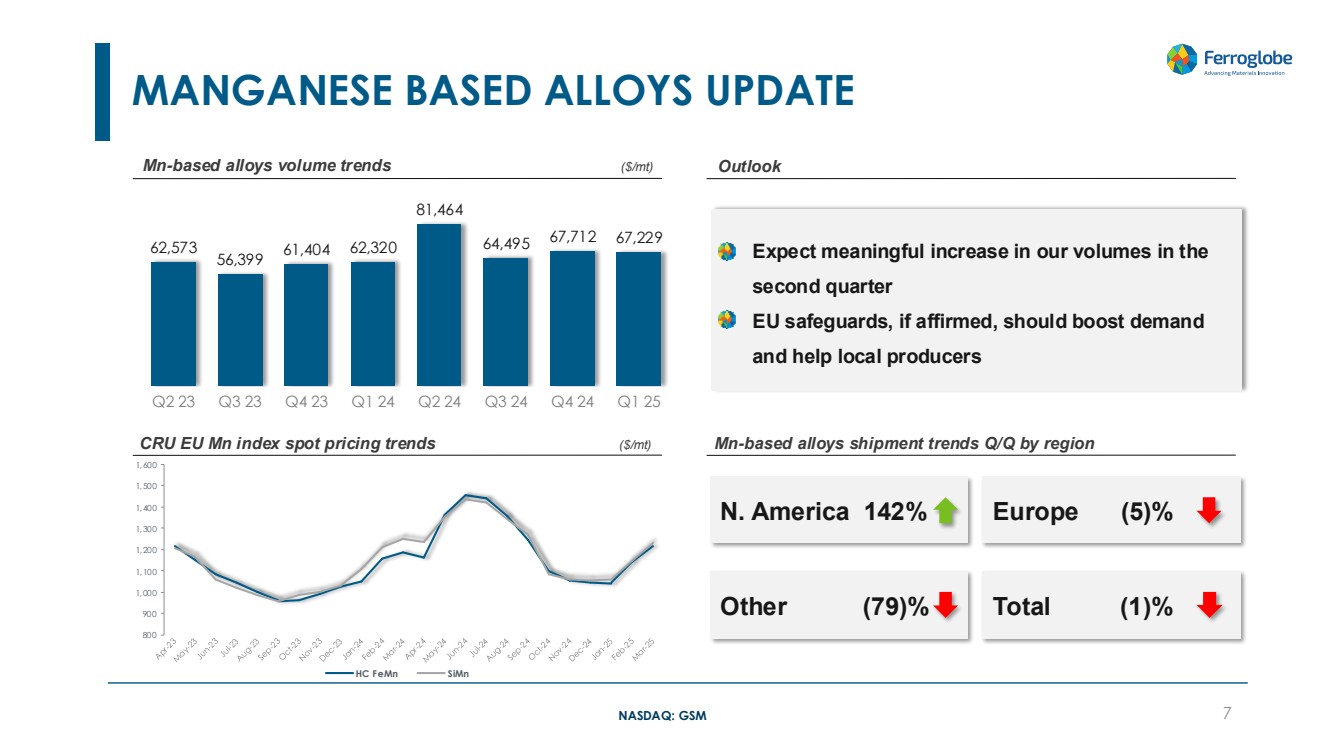
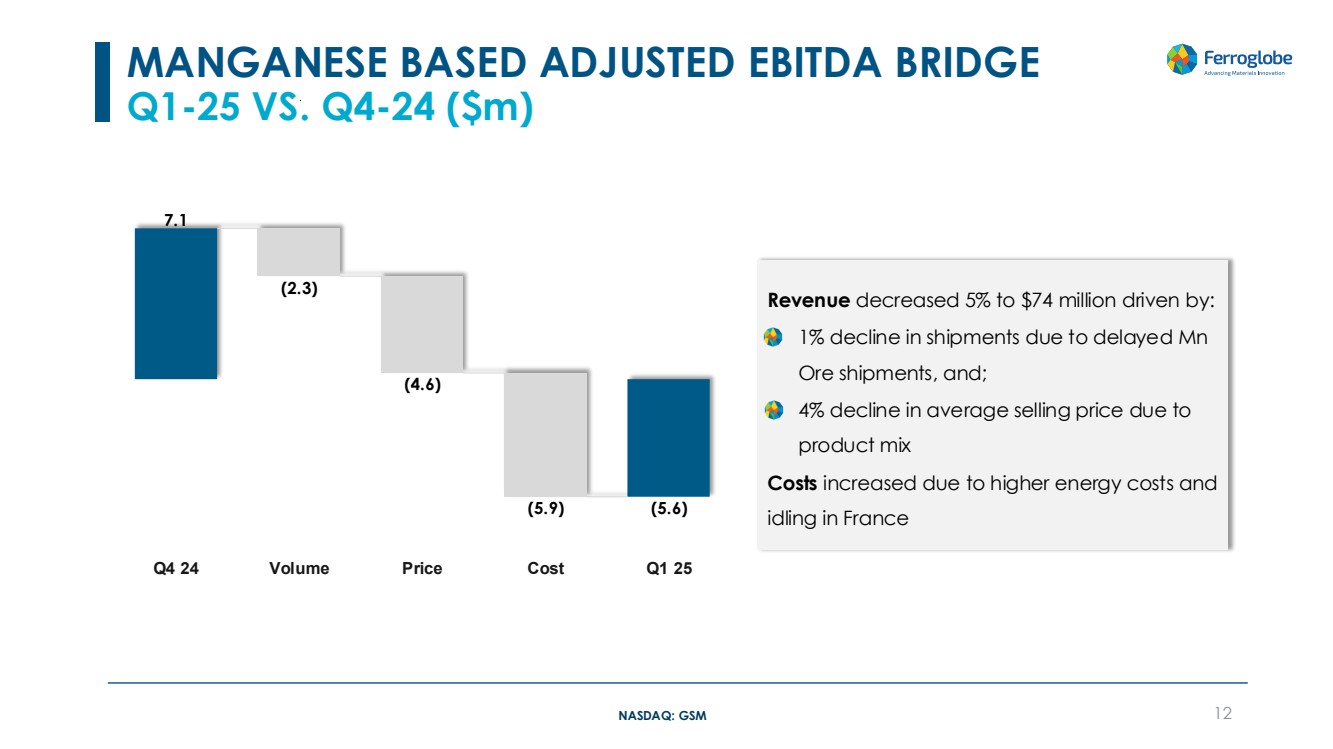
Manganese-based alloy revenue in the first quarter was $74.5 million, a decrease of 5.1% over the prior quarter. The average selling price decreased by 4.4% and shipments were essentially flat compared to the prior quarter. Adjusted EBITDA for the manganese-based alloys portfolio decreased to $(5.6) million for the first quarter, compared with $7.1 million in the prior quarter. Adjusted EBITDA margin decreased mainly due to higher energy costs and idling in France.
Raw materials and energy consumption for production
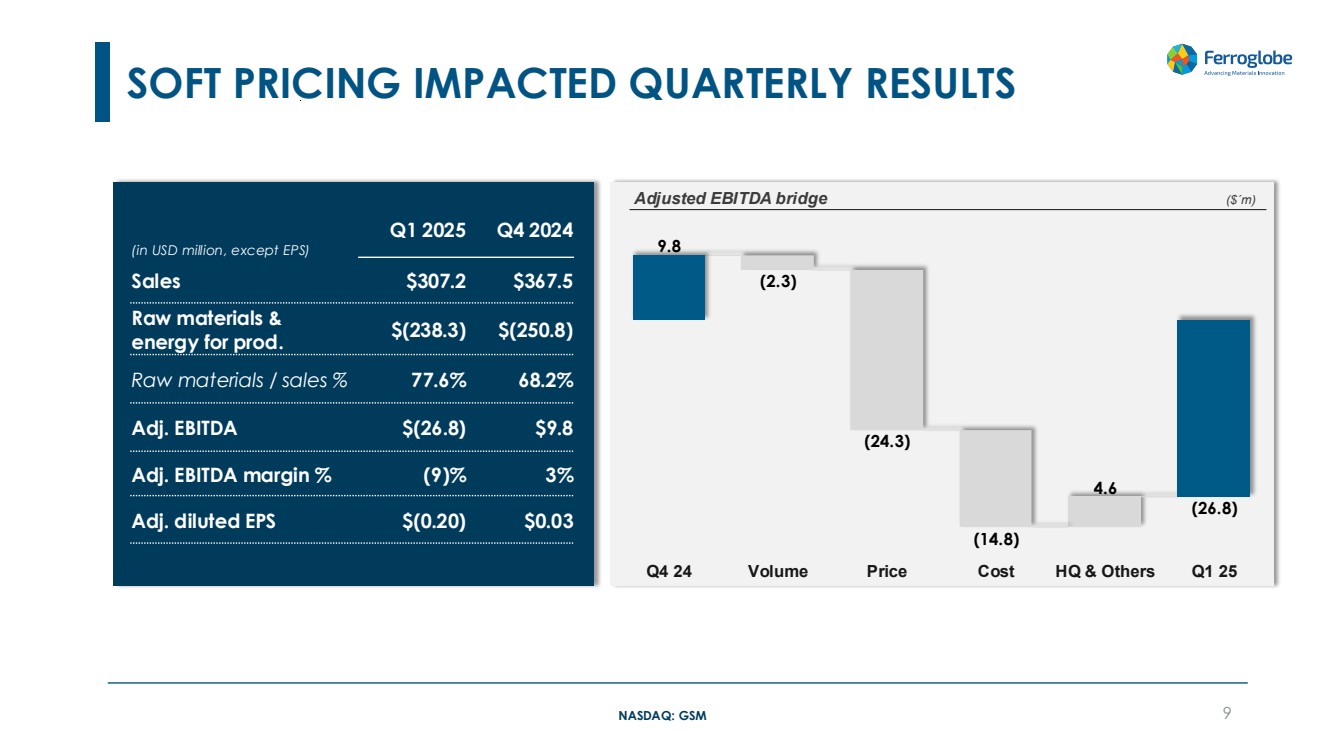
Raw materials and energy consumption for production was $238.3 million in the first quarter of 2025 compared to $250.8 million in the prior quarter, a decrease of 5.0%. As a percentage of sales, raw materials and energy consumption for production was 77.6% in the first quarter of 2025, compared to 68.2% in the fourth quarter.
The increase in costs as percentage of sales was driven by lower pricing and higher energy costs.
Net (Loss) Income Attributable to the Parent
In the first quarter of 2025, net loss attributable to the parent was $(66.5) million, or $(0.36) per diluted share, compared to a net loss attributable to the parent of $(28.1) million, or $(0.15) per diluted share in the prior quarter. This decrease is primarily attributable to reduced prices across our product portfolio and shipments of our main products. The Company reported adjusted diluted earnings per share of $(0.20) for the first quarter, compared with adjusted earnings per share of $0.03 per share in the prior quarter.
Adjusted EBITDA
Adjusted EBITDA was $(26.8) million for the first quarter of 2025 compared to $9.8 million for the prior quarter. The decrease was mainly driven by lower pricing and higher energy costs.
Total Cash, Adjusted Gross Debt and Working Capital
|
|
|
|
|
|
|
|
|
|
|
|
|
|
% |
||||||
($ in millions) |
|
March 31, 2025 |
|
December 31, 2024 |
|
$ |
|
% |
|
March 31, 2024 |
|
$ |
Y/Y |
|||||||
|
|
|
|
|
|
|
|
|
|
|
|
|
|
|
|
|
|
|
|
|
Total Cash1 |
|
$ |
129.6 |
|
$ |
133.3 |
|
|
(3.7) |
|
|
(2.8)% |
|
$ |
159.8 |
|
|
(30.2) |
|
(18.9)% |
Adjusted Gross Debt2 |
|
$ |
110.4 |
|
$ |
94.4 |
|
|
16.0 |
|
|
16.9% |
|
$ |
80.8 |
|
|
29.6 |
|
36.6% |
Net Cash |
|
$ |
19.2 |
|
$ |
38.9 |
|
|
(19.7) |
|
|
(50.6)% |
|
$ |
79.0 |
|
|
(59.8) |
|
75.7% |
Total Working Capital3 |
|
$ |
435.7 |
|
$ |
460.8 |
|
|
(25.1) |
|
|
(5.5)% |
|
$ |
487.5 |
|
|
(51.8) |
|
(10.6)% |
(1) |
Total cash is comprised of restricted cash and cash and cash equivalents |
(2) Adjusted gross debt excludes bank borrowings on our factoring program and the impact of leasing standard IFRS16
(3) Total working capital is comprised of inventories, trade receivables and other receivables minus trade and other payables
Total cash was $129.6 million as of March 31, 2025, down $3.7 million from $133.3 million as of December 31, 2024. Adjusted gross debt increased by $16.0 million to $110.4 million, resulting in net cash of $19.2 million as of March 31, 2025.
During the first quarter cash flows from operating activities were $19.4 million and net cash used in investing activities was $23.0 million. Cash used in financing activities was $2.8 million as a result of lease payments of $3.1 million, dividend payments of $2.6 million and interest payments of $4.5 million. Share repurchases of $2.7 million and repayment of other financing liabilities of $22.7 million were partially offset by net cash proceeds from promissory notes of $4.0 million and financing facilities in the US and South Africa of $30.3 million.
Total working capital was $435.7 million as of March 31, 2025, down from $460.8 million on December 31, 2024. The $25.1 million decrease in working capital balance during the quarter was due to a $32.3 million decrease in inventories and an increase in trade and other payables by $17.7 million, offset by an $11.7 million increase in trade receivables and $13.2 million increase in other receivables.
Beatriz García-Cos, Ferroglobe’s Chief Financial Officer, commented, “We continued to make robust progress in reducing our working capital during the first quarter, achieving approximately 50% of our full-year target. Looking ahead, we expect a modest increase in working capital over the next two quarters as production ramps up in France, followed by a meaningful reduction in the fourth quarter. Our balance sheet remains strong and we generated free cash flow in the first quarter, while also returning capital to shareholders through $2.6 million in dividends and $2.7 million in share repurchases.”
Capital Returns
During the first quarter, Ferroglobe repurchased 720,008 shares at an average price of $3.75 per share and paid a quarterly cash dividend of $0.014 per share on March 26, 2025. Our next cash dividend of $0.014 per share will be paid on June 26, 2025, to shareholders of record as of June 18, 2025.
Conference Call
Ferroglobe invites all interested persons to participate on its conference call at 8:30 AM, Eastern Time on May 8, 2025. The call may also be accessed via an audio webcast.
To join via phone:
Conference call participants should pre-register using this link
https://register-conf.media-server.com/register/BIa09c86627bc54bbfa844f3e0cffca9e2
Once registered, you will receive the dial-in numbers and a personal PIN, which are required to access the conference call.
To join via webcast: A simultaneous audio webcast, and replay will be accessible here: https://edge.media-server.com/mmc/p/7rutmin8 Ferroglobe PLC is a leading global producer of silicon metal, silicon- and manganese- based specialty alloys and ferroalloys, serving a customer base across the globe in dynamic and fast-growing end markets, such as solar, electronics, automotive, consumer products, construction, and energy.
About Ferroglobe
The Company is based in London. For more information, visit http://investor.ferroglobe.com.
Forward-Looking Statements
This release contains “forward-looking statements” within the meaning of U.S. securities laws. Forward-looking statements are not historical facts but are based on certain assumptions of management and describe the Company’s future plans, strategies and expectations. Forward-looking statements often use forward-looking terminology, including words such as “anticipate”, “believe”, “could”, “estimate”, “expect”, “should”,“forecast”, “guidance”, “intends”, “likely”, “may”, “plan”, “potential”, “predicts”, “seek”, “target”, “will” and words of similar meaning or the negative thereof.
Forward-looking statements contained in this press release are based on information currently available to the Company and assumptions that management believe to be reasonable, but are inherently uncertain. As a result, Ferroglobe’s actual results, performance or achievements may differ materially from those expressed or implied by these forward-looking statements, which are not guarantees of future performance and involve known and unknown risks, uncertainties and other factors that are, in some cases, beyond the Company’s control.
Forward-looking financial information and other metrics presented herein represent the Company’s goals and are not intended as guidance or projections for the periods referenced herein or any future periods.
All information in this press release is as of the date of its release. Ferroglobe does not undertake any obligation to update publicly any of the forward-looking statements contained herein to reflect new information, events or circumstances arising after the date of this press release. You should not place undue reliance on any forward-looking statements, which are made only as of the date of this press release.
Non-IFRS Measures
This document may contain summarized, non-audited or non-IFRS financial information. The information contained herein should therefore be considered as a whole and in conjunction with all the public information regarding the Company available, including any other documents released by the Company that may contain more detailed information. Adjusted EBITDA, adjusted EBITDA as a percentage of sales, working capital as a percentage of sales, adjusted EBITDA margin, working capital,adjusted net profit, adjusted diluted EPS, adjusted gross debt and net cash/(debt), are non-IFRS financial metrics that management uses in its decision making. Ferroglobe has included these financial metrics to provide supplemental measures of its performance. The Company believes these metrics are important and useful to investors because they eliminate items that have less bearing on the Company’s current and future operating performance and highlight trends in its core business that may not otherwise be apparent when relying solely on IFRS financial measures.
INVESTOR CONTACT:
Alex Rotonen, CFA
Vice President, Investor Relations
Email: investor.relations@ferroglobe.com
MEDIA CONTACT:
Cristina Feliu Roig
Vice President, Communications & Public Affairs
Email: corporate.comms@ferroglobe.com
Ferroglobe PLC and Subsidiaries
Unaudited Condensed Consolidated Income Statement
(in thousands of U.S. dollars, except per share amounts)
|
|
|
For the Three Months Ended |
|
|
For the Three Months Ended |
|
|
For the Three Months Ended |
|
|
|
|
March 31, 2025 |
|
December 31, 2024 |
|
|
March 31, 2024 |
|
|||
Sales |
|
$ |
307,179 |
|
$ |
367,505 |
|
$ |
391,854 |
|
|
Raw materials and energy consumption for production |
|
|
(238,341) |
|
|
(250,763) |
|
|
(259,289) |
|
|
Other operating income |
|
|
9,072 |
|
|
18,892 |
|
|
10,836 |
|
|
Staff costs |
|
|
(70,450) |
|
|
(70,241) |
|
|
(70,519) |
|
|
Other operating expense |
|
|
(47,290) |
|
|
(52,289) |
|
|
(52,348) |
|
|
Depreciation and amortization |
|
|
(17,520) |
|
|
(19,020) |
|
|
(18,669) |
|
|
Impairment gain (loss) |
|
|
268 |
|
|
(43,052) |
|
|
— |
|
|
Other gain (loss) |
|
|
1,405 |
|
|
(571) |
|
|
696 |
|
|
Operating (loss) profit |
|
|
(55,677) |
|
|
(49,539) |
|
|
2,561 |
|
|
Finance income |
|
|
873 |
|
|
3,533 |
|
|
2,297 |
|
|
Finance costs |
|
|
(4,555) |
|
|
(3,089) |
|
|
(9,966) |
|
|
Exchange differences |
|
|
(6,914) |
|
|
15,167 |
|
|
1,383 |
|
|
Loss before tax |
|
|
(66,273) |
|
|
(33,928) |
|
|
(3,725) |
|
|
Income tax (expense) benefit |
|
|
(625) |
|
|
4,376 |
|
|
1,155 |
|
|
Total loss for the period |
|
|
(66,898) |
|
|
(29,552) |
|
|
(2,570) |
|
|
|
|
|
|
|
|
|
|
|
|
|
|
Loss attributable to the parent |
|
$ |
(66,482) |
|
$ |
(28,134) |
|
$ |
(2,024) |
|
|
Loss attributable to non-controlling interest |
|
|
(416) |
|
|
(1,418) |
|
|
(546) |
|
|
|
|
|
|
|
|
|
|
|
|
|
|
EBITDA |
|
$ |
(45,071) |
|
$ |
(15,352) |
|
$ |
22,613 |
|
|
Adjusted EBITDA |
|
$ |
(26,803) |
|
$ |
9,845 |
|
$ |
25,803 |
|
|
|
|
|
|
|
|
|
|
|
|
|
|
|
|
|
|
|
|
|
|
|
|
|
|
Weighted average number of shares outstanding |
|
|
|
|
|
|
|
|
|
|
|
Basic and diluted |
|
|
187,008 |
|
|
188,072 |
|
|
187,927 |
|
|
|
|
|
|
|
|
|
|
|
|
|
|
Loss per ordinary share |
|
|
|
|
|
|
|
|
|
|
|
Basic and diluted |
|
$ |
(0.36) |
|
$ |
(0.15) |
|
$ |
(0.01) |
|
|
Ferroglobe PLC and Subsidiaries
Unaudited Condensed Consolidated Statement of Financial Position
(in thousands of U.S. dollars)
|
|
As of March 31, |
|
As of December 31, |
|
As of March 31, |
||||
|
|
2025 |
|
2024 |
|
2024 |
||||
ASSETS | ||||||||||
Non-current assets |
|
|
|
|
|
|
|
|
|
|
Goodwill |
|
$ |
|
14,219 |
|
$ |
14,219 |
|
$ |
29,702 |
Intangible assets |
|
|
|
178,583 |
|
|
103,095 |
|
|
193,592 |
Property, plant and equipment |
|
|
|
495,285 |
|
|
487,196 |
|
|
500,940 |
Other financial assets |
|
|
|
25,375 |
|
|
19,744 |
|
|
13,944 |
Deferred tax assets |
|
|
|
7,997 |
|
|
6,580 |
|
|
10,636 |
Receivables from related parties |
|
|
|
1,622 |
|
|
1,558 |
|
|
1,622 |
Other non-current assets |
|
|
|
23,019 |
|
|
22,451 |
|
|
21,770 |
Total non-current assets |
|
|
|
746,100 |
|
|
654,843 |
|
|
772,206 |
Current assets |
|
|
|
|
|
|
|
|
|
|
Inventories |
|
|
|
314,843 |
|
|
347,139 |
|
|
361,602 |
Trade receivables |
|
|
|
200,526 |
|
|
188,816 |
|
|
214,127 |
Other receivables |
|
|
|
96,308 |
|
|
83,103 |
|
|
89,815 |
Receivables from related parties |
|
|
|
— |
|
|
— |
|
|
2,712 |
Current income tax assets |
|
|
|
5,191 |
|
|
7,692 |
|
|
10,740 |
Other financial assets |
|
|
|
8,564 |
|
|
5,569 |
|
|
2 |
Other current assets |
|
|
|
39,385 |
|
|
52,014 |
|
|
27,894 |
Restricted cash and cash equivalents |
|
|
|
300 |
|
|
298 |
|
|
298 |
Cash and cash equivalents |
|
|
|
129,281 |
|
|
132,973 |
|
|
159,470 |
Total current assets |
|
|
|
794,398 |
|
|
817,604 |
|
|
866,660 |
Total assets |
|
$ |
|
1,540,498 |
|
$ |
1,472,447 |
|
$ |
1,638,866 |
|
|
|
|
|
|
|
|
|
|
|
EQUITY AND LIABILITIES | ||||||||||
Equity |
|
$ |
|
780,568 |
|
$ |
834,245 |
|
$ |
843,702 |
Non-current liabilities |
|
|
|
|
|
|
|
|
|
|
Deferred income |
|
|
|
71,764 |
|
|
8,014 |
|
|
77,185 |
Provisions |
|
|
|
26,390 |
|
|
24,384 |
|
|
22,102 |
Provision for pensions |
|
|
|
28,383 |
|
|
27,618 |
|
|
29,293 |
Bank borrowings |
|
|
|
32,299 |
|
|
13,911 |
|
|
14,643 |
Lease liabilities |
|
|
|
59,766 |
|
|
56,585 |
|
|
54,361 |
Debt instruments |
|
|
|
— |
|
|
— |
|
|
— |
Other financial liabilities |
|
|
|
29,487 |
|
|
25,688 |
|
|
68,186 |
Other non-current liabilities |
|
|
|
14,279 |
|
|
13,759 |
|
|
1,760 |
Deferred tax liabilities |
|
|
|
18,834 |
|
|
19,629 |
|
|
30,253 |
Total non-current liabilities |
|
|
|
281,202 |
|
|
189,588 |
|
|
297,783 |
Current liabilities |
|
|
|
|
|
|
|
|
|
|
Provisions |
|
|
|
91,416 |
|
|
83,132 |
|
|
127,533 |
Provision for pensions |
|
|
|
168 |
|
|
168 |
|
|
165 |
Bank borrowings |
|
|
|
56,214 |
|
|
43,251 |
|
|
42,762 |
Lease liabilities |
|
|
|
12,572 |
|
|
12,867 |
|
|
12,297 |
Debt instruments |
|
|
|
14,311 |
|
|
10,135 |
|
|
— |
Other financial liabilities |
|
|
|
27,168 |
|
|
48,117 |
|
|
15,190 |
Payables to related parties |
|
|
|
3,074 |
|
|
2,664 |
|
|
3,527 |
Trade and other payables |
|
|
|
176,017 |
|
|
158,251 |
|
|
178,038 |
Current income tax liabilities |
|
|
|
10,337 |
|
|
10,623 |
|
|
6,262 |
Other current liabilities |
|
|
|
87,451 |
|
|
79,406 |
|
|
111,607 |
Total current liabilities |
|
|
|
478,728 |
|
|
448,614 |
|
|
497,381 |
Total equity and liabilities |
|
$ |
|
1,540,498 |
|
$ |
1,472,447 |
|
$ |
1,638,866 |
Ferroglobe PLC and Subsidiaries
Unaudited Condensed Consolidated Statement of Cash Flows
(in thousands of U.S. dollars)
|
|
For the Three Months Ended |
|
For the Three Months Ended |
|
For the Three Months Ended |
|
|
|||
|
|
March 31, 2025 |
|
December 31, 2024 |
|
March 31, 2024 |
|
|
|||
Cash flows from operating activities: |
|
|
|
|
|
|
|
|
|
|
|
(Loss) for the period |
|
$ |
(66,898) |
|
$ |
(29,552) |
|
$ |
(2,570) |
|
|
Adjustments to reconcile net (loss) to net cash provided by operating activities: |
|
|
|
|
|
|
|
|
|
|
|
Income tax expense (benefit) |
|
|
625 |
|
|
(4,376) |
|
|
(1,155) |
|
|
Depreciation and amortization |
|
|
17,520 |
|
|
19,020 |
|
|
18,669 |
|
|
Finance income |
|
|
(873) |
|
|
(3,533) |
|
|
(2,297) |
|
|
Finance costs |
|
|
4,555 |
|
|
3,089 |
|
|
9,966 |
|
|
Exchange differences |
|
|
6,914 |
|
|
(15,167) |
|
|
(1,383) |
|
|
Impairment (gain) loss |
|
|
(268) |
|
|
43,052 |
|
|
— |
|
|
Share-based compensation |
|
|
1,296 |
|
|
1,587 |
|
|
928 |
|
|
Other (gain) loss |
|
|
(1,405) |
|
|
571 |
|
|
(696) |
|
|
Changes in operating assets and liabilities |
|
|
|
|
|
|
|
|
|
|
|
Decrease in inventories |
|
|
28,357 |
|
|
23,146 |
|
|
19,011 |
|
|
(Increase) decrease in trade receivables |
|
|
(7,206) |
|
|
31,756 |
|
|
2,404 |
|
|
Increase in other receivables |
|
|
(9,573) |
|
|
(12,885) |
|
|
(2,084) |
|
|
Decrease (increase) in energy receivable |
|
|
25,165 |
|
|
(5,735) |
|
|
161,855 |
|
|
Increase (decrease) in trade payables |
|
|
13,186 |
|
|
(19,039) |
|
|
(1,925) |
|
|
Other changes in operating assets and liabilities |
|
|
7,537 |
|
|
4,936 |
|
|
(7,259) |
|
|
Income taxes received (paid) |
|
|
440 |
|
|
(4,776) |
|
|
4,580 |
|
|
Net cash provided by operating activities: |
|
|
19,372 |
|
|
32,094 |
|
|
198,044 |
|
|
Cash flows from investing activities: |
|
|
|
|
|
|
|
|
|
|
|
Interest and finance income received |
|
|
872 |
|
|
692 |
|
|
741 |
|
|
Payments due to investments: |
|
|
|
|
|
|
|
|
|
|
|
Intangible assets |
|
|
(557) |
|
|
(855) |
|
|
(584) |
|
|
Property, plant and equipment |
|
|
(13,750) |
|
|
(17,090) |
|
|
(17,641) |
|
|
Other financial assets |
|
|
(11,119) |
|
|
— |
|
|
— |
|
|
Disposals: |
|
|
|
|
|
|
|
|
|
|
|
Property, plant and equipment |
|
|
1,559 |
|
|
— |
|
|
— |
|
|
Receipt of asset-related government grant |
|
|
— |
|
|
12,453 |
|
|
— |
|
|
Net cash used in investing activities |
|
|
(22,995) |
|
|
(4,800) |
|
|
(17,484) |
|
|
Cash flows from financing activities: |
|
|
|
|
|
|
|
|
|
|
|
Dividends paid |
|
|
(2,613) |
|
|
(2,436) |
|
|
(2,438) |
|
|
Payment for debt and equity issuance costs |
|
|
(95) |
|
|
(6) |
|
|
— |
|
|
Repayment of debt instruments |
|
|
(10,361) |
|
|
— |
|
|
(147,624) |
|
|
Proceeds from debt issuance |
|
|
14,380 |
|
|
10,255 |
|
|
— |
|
|
Increase (decrease) in bank borrowings: |
|
|
|
|
|
|
|
|
|
|
|
Borrowings |
|
|
106,033 |
|
|
122,809 |
|
|
94,611 |
|
|
Payments |
|
|
(77,176) |
|
|
(137,650) |
|
|
(83,012) |
|
|
Payments for lease liabilities |
|
|
(3,098) |
|
|
(4,511) |
|
|
(2,973) |
|
|
(Payments) proceeds from other financing liabilities |
|
|
(22,651) |
|
|
6,054 |
|
|
— |
|
|
Other payments from financing activities |
|
|
— |
|
|
(411) |
|
|
(192) |
|
|
Payments to acquire own shares |
|
|
(2,703) |
|
|
(1,936) |
|
|
— |
|
|
Interest paid |
|
|
(4,531) |
|
|
(2,029) |
|
|
(14,634) |
|
|
Net cash used in financing activities |
|
|
(2,815) |
|
|
(9,861) |
|
|
(156,262) |
|
|
Total net (decrease) increase in cash and cash equivalents |
|
|
(6,438) |
|
|
17,433 |
|
|
24,298 |
|
|
Beginning balance of cash and cash equivalents |
|
|
133,271 |
|
|
120,810 |
|
|
137,649 |
|
|
Foreign exchange gains (losses) on cash and cash equivalents |
|
|
2,748 |
|
|
(4,972) |
|
|
(2,179) |
|
|
Ending balance of cash and cash equivalents |
|
$ |
129,581 |
|
$ |
133,271 |
|
$ |
159,768 |
|
|
Restricted cash and cash equivalents |
|
|
300 |
|
|
298 |
|
|
298 |
|
|
Cash and cash equivalents |
|
|
129,281 |
|
|
132,973 |
|
|
159,470 |
|
|
Ending balance of restricted cash and cash and cash equivalents |
|
$ |
129,581 |
|
$ |
133,271 |
|
$ |
159,768 |
|
|
Adjusted EBITDA ($,000):
|
|
|
|
|
|
|
|
|||
|
|
For the Three Months Ended |
|
For the Three Months Ended |
|
For the Three Months Ended |
|
|||
Loss attributable to the parent |
|
$ |
(66,482) |
|
$ |
(28,134) |
|
$ |
(2,024) |
|
Loss attributable to non-controlling interest |
|
|
(416) |
|
|
(1,418) |
|
|
(546) |
|
Income tax expense (benefit) |
|
|
625 |
|
|
(4,376) |
|
|
(1,155) |
|
Finance income |
|
|
(873) |
|
|
(3,533) |
|
|
(2,297) |
|
Finance costs |
|
|
4,555 |
|
|
3,089 |
|
|
9,966 |
|
Depreciation and amortization charges |
|
|
17,520 |
|
|
19,020 |
|
|
18,669 |
|
EBITDA |
|
|
(45,071) |
|
|
(15,352) |
|
|
22,613 |
|
Exchange differences |
|
|
6,914 |
|
|
(15,167) |
|
|
(1,383) |
|
Impairment (gain) loss |
|
|
(268) |
|
|
43,052 |
|
|
— |
|
Restructuring and termination costs |
|
|
— |
|
|
(2,693) |
|
|
— |
|
New strategy implementation |
|
|
682 |
|
|
1,629 |
|
|
1,361 |
|
Subactivity |
|
|
— |
|
|
1,457 |
|
|
942 |
|
PPA Energy |
|
|
2,768 |
|
|
(3,081) |
|
|
2,270 |
|
Fines inventory adjustment |
|
|
8,172 |
|
|
— |
|
|
— |
|
Adjusted EBITDA |
|
$ |
(26,803) |
|
$ |
9,845 |
|
$ |
25,803 |
|
Adjusted profit attributable to Ferroglobe ($,000):
|
|
|
|
|
|
|
|
|||
|
|
For the Three Months Ended |
|
For the Three Months Ended |
|
For the Three Months Ended |
|
|||
Loss attributable to the parent |
|
$ |
(66,482) |
|
$ |
(28,134) |
|
$ |
(2,024) |
|
Tax rate adjustment |
|
|
21,481 |
|
|
6,301 |
|
|
17 |
|
Impairment (gain) loss |
|
|
(184) |
|
|
28,671 |
|
|
— |
|
Restructuring and termination costs |
|
|
— |
|
|
(1,846) |
|
|
— |
|
New strategy implementation |
|
|
467 |
|
|
1,116 |
|
|
933 |
|
Subactivity |
|
|
— |
|
|
998 |
|
|
646 |
|
PPA Energy |
|
|
1,897 |
|
|
(2,111) |
|
|
1,556 |
|
Fines inventory adjustment |
|
|
5,600 |
|
|
— |
|
|
— |
|
Adjusted (loss) profit attributable to the parent |
|
$ |
(37,220) |
|
$ |
4,996 |
|
$ |
1,168 |
|
Adjusted diluted profit per share:
|
|
|
|
|
|
|
|
|||
|
|
For the Three Months Ended |
|
For the Three Months Ended |
|
For the Three Months Ended |
|
|||
Diluted (loss) per ordinary share |
|
$ |
(0.36) |
|
$ |
(0.15) |
|
$ |
(0.01) |
|
Tax rate adjustment |
|
|
0.11 |
|
|
0.03 |
|
|
0.00 |
|
Impairment (gain) loss |
|
|
(0.00) |
|
|
0.15 |
|
|
— |
|
Restructuring and termination costs |
|
|
— |
|
|
(0.01) |
|
|
— |
|
New strategy implementation |
|
|
0.00 |
|
|
0.01 |
|
|
0.00 |
|
Subactivity |
|
|
— |
|
|
0.01 |
|
|
0.00 |
|
PPA Energy |
|
|
0.01 |
|
|
(0.01) |
|
|
0.01 |
|
Fines inventory adjustment |
|
|
0.03 |
|
|
— |
|
|
— |
|
Adjusted diluted (loss) profit per ordinary share |
|
$ |
(0.20) |
|
$ |
0.03 |
|
$ |
(0.00) |
|
|
NASDAQ: GSM First Quarter 2025 Results May 8, 2025 NASDAQ: GSM Driving innovation of critical materials essential to a sustainable future |
|
NASDAQ: GSM Forward-Looking Statements and Non-IFRS Financial Metrics 2 This presentation contains forward-looking statements within the meaning of Section 27A of the United States Securities Act of 1933, as amended, and Section 21E of the United States Securities Exchange Act of 1934, as amended. Forward-looking statements are not historical facts but are based on certain assumptions of management and describe our future plans, strategies and expectations. Forward-looking statements can generally be identified by the use of forward-looking terminology, including, but not limited to, "may," “could,” “seek,” “guidance,” “predict,” “potential,” “likely,” "believe," "will," "expect," “should," "anticipate," "estimate," "plan," "intend," "forecast," “aim,” “target,” or variations of these terms and similar expressions, or the negative of these terms or similar expressions. Forward-looking statements contained in this presentation are based on information presently available to Ferroglobe PLC (“we,” “us,” “Ferroglobe,” the “Company” or the “Parent”) and assumptions that we believe to be reasonable but are inherently uncertain. As a result, our actual results, performance or achievements may differ materially from those expressed or implied by these forward-looking statements, which are not guarantees of future performance and involve known and unknown risks, uncertainties and other factors that are, in some cases, beyond our control. You are cautioned that all such statements involve risks and uncertainties, including without limitation, the impacts of the Ukraine-Russia conflict; increases in energy prices, disruptions in the supply of power and changes in governmental regulation of the power sector and the effect on costs of production; the outcomes of pending or potential litigation; operating costs, customer losses and business disruptions (including, without limitation, difficulties in maintaining relationships with employees, customers, clients or suppliers) that may be greater than expected; the retention of certain key employees; the current and anticipated competitive landscape; our ability to adapt products and services to changes in technology or the marketplace; our ability to maintain and grow relationships with customers and clients; the historic cyclicality of the metals industry and the attendant swings in market price and demand; the availability of raw materials and transportation; costs associated with labor disputes and stoppages; our ability to maintain our liquidity and to generate sufficient cash to service indebtedness; the integration and development of prior and future acquisitions; the availability and cost of maintaining adequate levels of insurance; our ability to protect trade secrets, trademarks and other intellectual property; equipment failures, delays in deliveries or catastrophic loss at any of our manufacturing facilities, which may not be covered under any insurance policy; exchange rate fluctuations; changes in laws protecting U.S., Canadian and European Union companies from unfair foreign competition (including antidumping and countervailing duty orders and laws) or the measures currently in place or expected to be imposed under those laws; compliance with, or potential liability under, environmental, health and safety laws and regulations (and changes in such laws and regulations, including in their enforcement or interpretation); risks from international operations, such as foreign exchange fluctuations, tariffs, duties and other taxation, inflation, increased costs, political risks and our ability to maintain and increase business in international markets; risks associated with mining operations, metallurgical smelting and other manufacturing activities; our ability to manage price and operational risks including industrial accidents and natural disasters; our ability to acquire or renew permits and approvals; potential losses due to unanticipated cancellations of service contracts; risks associated with potential unionization of employees or work stoppages that could adversely affect our operations; changes in tax laws (including under applicable tax treaties) and regulations or to the interpretation of such tax laws or regulations by governmental authorities; changes in general economic, business and political conditions, including changes in the financial markets; uncertainties and challenges surrounding the implementation and development of new technologies; risks related to potential cybersecurity breaches; risks related to our capital structure; risks related to our ordinary shares; our foreign private issuer status, the loss of which would require us to comply with the Exchange Act’s domestic reporting regime, and cause us to incur significant legal, accounting and other expenses; our incorporation in the United Kingdom, the laws of which govern our corporate affairs and may differ from those applicable to companies incorporated in the U.S.; and our failure to maintain an effective system of internal control over financial reporting. The foregoing list is not exhaustive. You should carefully consider the foregoing factors and the other risks and uncertainties that affect our business, including those described in the “Risk Factors” section of our Annual Reports on Form 20-F, Current Reports on Form 6-K and other documents we file from time to time with the United States Securities and Exchange Commission. We do not give any assurance (1) that we will achieve our expectations or (2) concerning any result or the timing thereof, in each case, with respect to any regulatory action, administrative proceedings, government investigations, litigation, warning letters, consent decree, cost reductions, business strategies, earnings or revenue trends or future financial results. Forward- looking financial information and other metrics presented herein represent our key goals and are not intended as guidance or projections for the periods presented herein or any future periods. We do not undertake or assume any obligation to update publicly any of the forward-looking statements in this presentation to reflect actual results, new information or future events, changes in assumptions or changes in other factors affecting forward-looking statements. If we update one or more forward-looking statements, no inference should be drawn that we will make additional updates with respect to those or other forward-looking statements. We caution you not to place undue reliance on any forward-looking statements, which are made only as of the date of this presentation. EBITDA, adjusted EBITDA, adjusted EBITDA margin, adjusted net profit, adjusted profit per share, working capital, adjusted gross debt, net cash and net debt, are non-IFRS financial metrics that, we believe, are pertinent measures of Ferroglobe’s success. The Company has included these financial metrics to provide supplemental measures of its performance. We believe these metrics are important because they eliminate items that have less bearing on the Company’s current and future operating performance and highlight trends in its core business that may not otherwise be apparent when relying solely on IFRS financial measures. For additional information, including a reconciliation of the differences between such non-IFRS financial measures and the comparable IFRS financial measures, refer to the press release dated May 7, 2025 accompanying this presentation, which is incorporated by reference herein. |
|
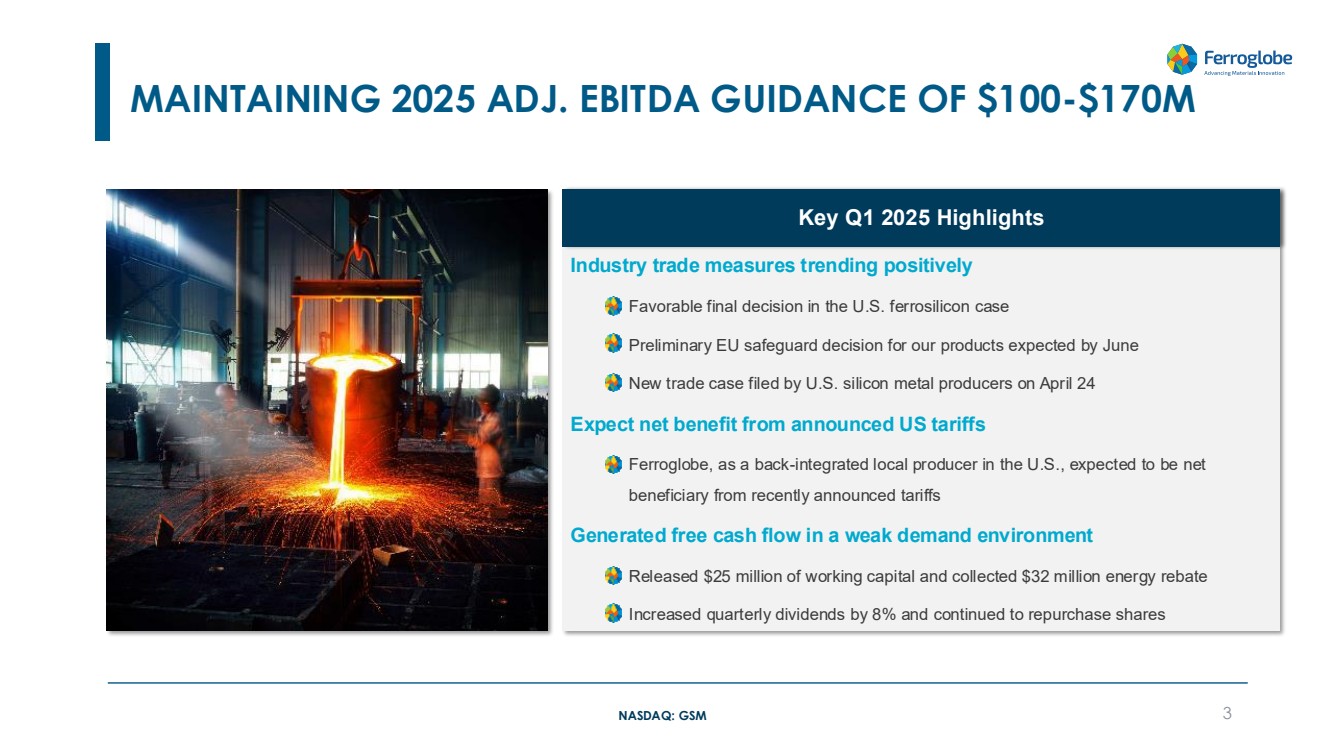
NASDAQ: GSM MAINTAINING 2025 ADJ. EBITDA GUIDANCE OF $100-$170M 3 Industry trade measures trending positively ▪ Favorable final decision in the U.S. ferrosilicon case ▪ Preliminary EU safeguard decision for our products expected by June ▪ New trade case filed by U.S. silicon metal producers on April 24 Expect net benefit from announced US tariffs ▪ Ferroglobe, as a back-integrated local producer in the U.S., expected to be net beneficiary from recently announced tariffs Generated free cash flow in a weak demand environment ▪ Released $25 million of working capital and collected $32 million energy rebate ▪ Increased quarterly dividends by 8% and continued to repurchase shares Key Q1 2025 Highlights |
|
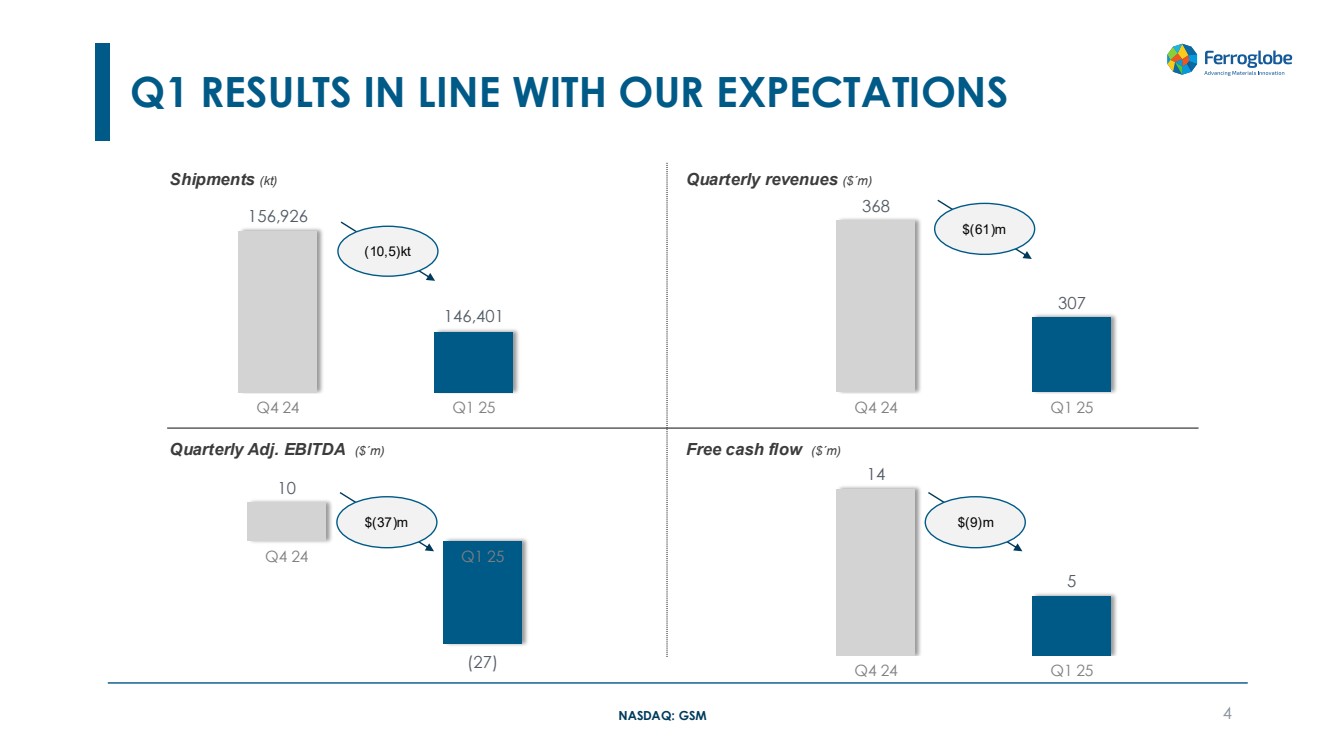
NASDAQ: GSM 368 307 Q4 24 Q1 25 14 5 Q4 24 Q1 25 10 (27) Q4 24 Q1 25 Q1 RESULTS IN LINE WITH OUR EXPECTATIONS 4 Shipments (kt) Quarterly revenues ($´m) Quarterly Adj. EBITDA ($´m) Free cash flow ($´m) 156,926 146,401 Q4 24 Q1 25 $(9)m $(61)m $(37)m (10,5)kt |
|
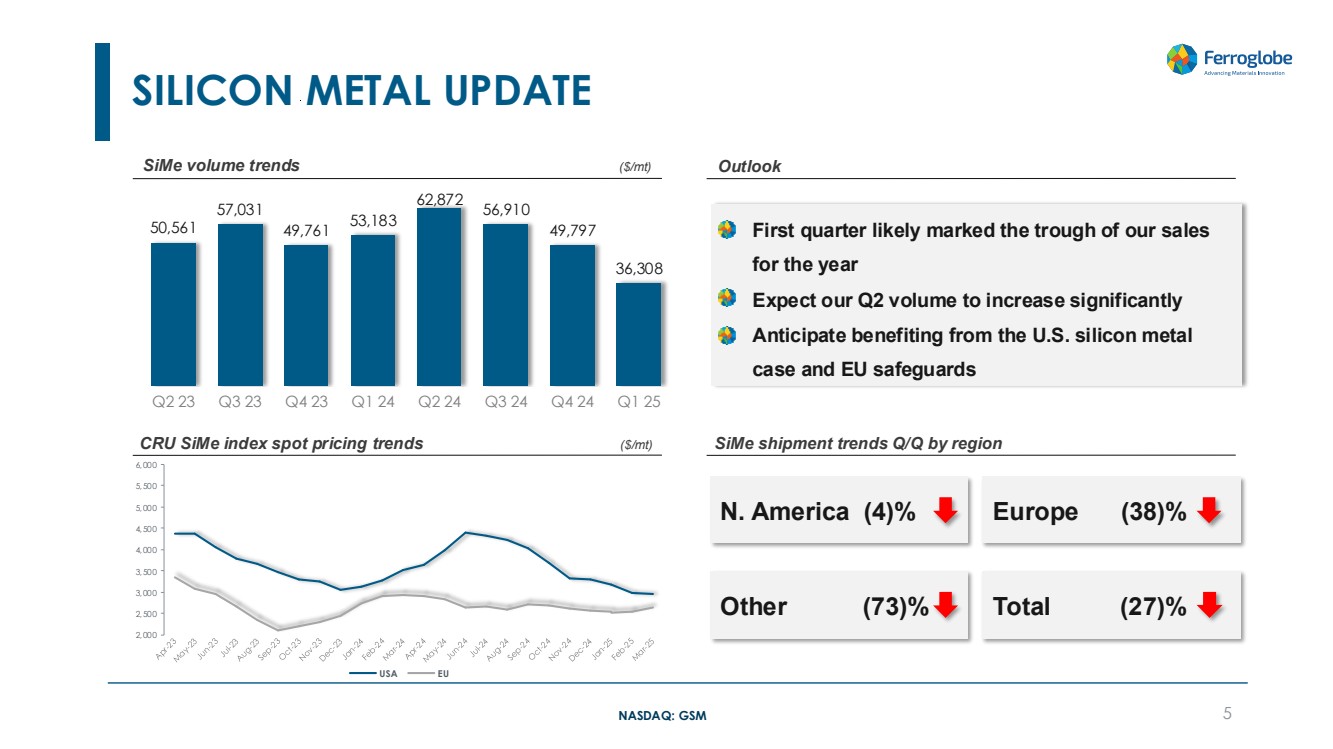
NASDAQ: GSM SILICON METAL UPDATE 50,561 57,031 49,761 53,183 62,872 56,910 49,797 36,308 Q2 23 Q3 23 Q4 23 Q1 24 Q2 24 Q3 24 Q4 24 Q1 25 CRU SiMe index spot pricing trends ($/mt) SiMe shipment trends Q/Q by region SiMe volume trends ($/mt) Outlook • First quarter likely marked the trough of our sales for the year • Expect our Q2 volume to increase significantly • Anticipate benefiting from the U.S. silicon metal case and EU safeguards 2,000 2,500 3,000 3,500 4,000 4,500 5,000 5,500 6,000 USA EU Other (73)% Total (27)% N. America (4)% Europe (38)% 5 |
|
NASDAQ: GSM SILICON BASED ALLOYS UPDATE 49,457 46,427 46,446 51,171 46,953 45,489 39,417 42,864 Q2 23 Q3 23 Q4 23 Q1 24 Q2 24 Q3 24 Q4 24 Q1 25 CRU FeSi index spot pricing trends ($/mt) Si-based alloys shipment trends Q/Q by region Si-based alloys volume trends ($/mt) Outlook 1,200 1,400 1,600 1,800 2,000 2,200 2,400 2,600 2,800 3,000 USA EU Other (15)% Total 13% N. America 38% Europe 3% • Initial signs of positive impact from U.S. trade case, starting to supply new customers • U.S. FeSi index prices increased 17% since early April • Expect market improvement to accelerate due to potential EU safeguard implementation 6 |
|
NASDAQ: GSM MANGANESE BASED ALLOYS UPDATE 62,573 56,399 61,404 62,320 81,464 64,495 67,712 67,229 Q2 23 Q3 23 Q4 23 Q1 24 Q2 24 Q3 24 Q4 24 Q1 25 CRU EU Mn index spot pricing trends ($/mt) Mn-based alloys shipment trends Q/Q by region Mn-based alloys volume trends ($/mt) Outlook 800 900 1,000 1,100 1,200 1,300 1,400 1,500 1,600 HC FeMn SiMn Other (79)% Total (1)% N. America 142% Europe (5)% • Expect meaningful increase in our volumes in the second quarter • EU safeguards, if affirmed, should boost demand and help local producers 7 |
|
NASDAQ: GSM FINANCE UPDATE |
|
NASDAQ: GSM 9.8 (2.3) (24.3) (14.8) 4.6 (26.8) Q4 24 Volume Price Cost HQ & Others Q1 25 SOFT PRICING IMPACTED QUARTERLY RESULTS 9 (in USD million, except EPS) Q1 2025 Q4 2024 Sales $307.2 $367.5 Raw materials & energy for prod. $(238.3) $(250.8) Raw materials / sales % 77.6% 68.2% Adj. EBITDA $(26.8) $9.8 Adj. EBITDA margin % (9)% 3% Adj. diluted EPS $(0.20) $0.03 Adjusted EBITDA bridge ($´m) |
|
NASDAQ: GSM SILICON METAL ADJUSTED EBITDA BRIDGE Q1-25 VS. Q4-24 ($m) 10 16.8 (2.1) (18.1) (12.0) (15.3) Q4 24 Volume Price Cost Q1 25 Revenue decreased 35% to $105 million driven by: • 27% decline in shipments due to low demand, increased imports and lower solar sales in Asia • 11% decline in average selling price due to soft US prices Costs increased due to lower fixed cost absorption, idling in France and higher cost in the US |
|
NASDAQ: GSM SILICON BASED ALLOYS ADJUSTED EBITDA BRIDGE Q1-25 VS. Q4-24 ($m) 11 3.1 2.0 (3.4) 0.8 2.4 Q4 24 Volume Price Cost Q1 25 Revenue increased 7% to $91 million driven by: • 9% increase in shipments, primarily in North America, partially offset by; • 1.8% decline in average selling price due to higher sales of lower grade FeSi standard Costs benefitted from increased mix of FeSi standard sales and lower costs in Spain and South Africa |
|
NASDAQ: GSM MANGANESE BASED ADJUSTED EBITDA BRIDGE Q1-25 VS. Q4-24 ($m) 12 7.1 (2.3) (4.6) (5.9) (5.6) Q4 24 Volume Price Cost Q1 25 Revenue decreased 5% to $74 million driven by: • 1% decline in shipments due to delayed Mn Ore shipments, and; • 4% decline in average selling price due to product mix Costs increased due to higher energy costs and idling in France |
|
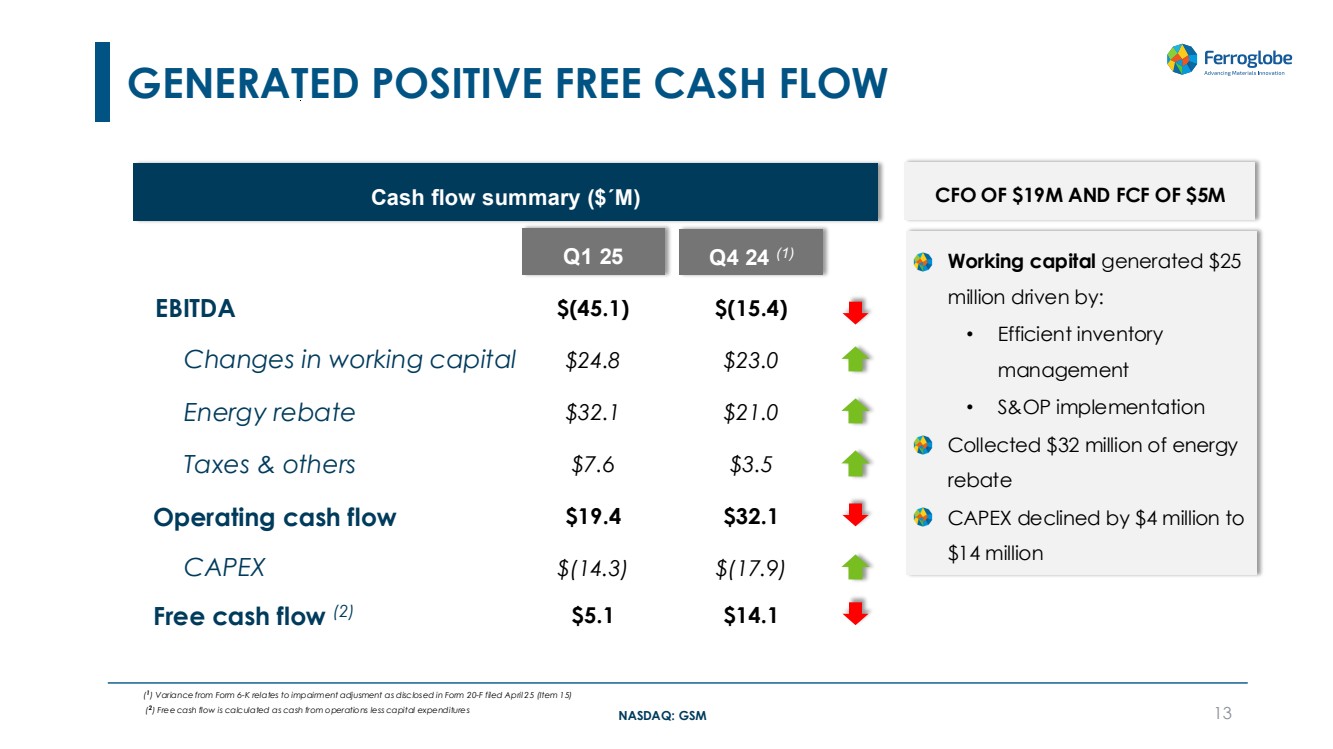
NASDAQ: GSM GENERATED POSITIVE FREE CASH FLOW 13 Cash flow summary ($´M) Changes in working capital Free cash flow (2) CAPEX Taxes & others Operating cash flow Q1 25 $(45.1) $24.8 $7.6 $19.4 $5.1 $(14.3) $(15.4) $23.0 $3.5 $32.1 $14.1 $(17.9) EBITDA Energy rebate $32.1 $21.0 • Working capital generated $25 million driven by: • Efficient inventory management • S&OP implementation • Collected $32 million of energy rebate • CAPEX declined by $4 million to $14 million Q4 24 (1) CFO OF $19M AND FCF OF $5M ( 1 ) Variance from Form 6-K relates to impairment adjusment as disclosed in Form 20-F filed April 25 (Item 15) ( 2 ) Free cash flow is calculated as cash from operations less capital expenditures |
|
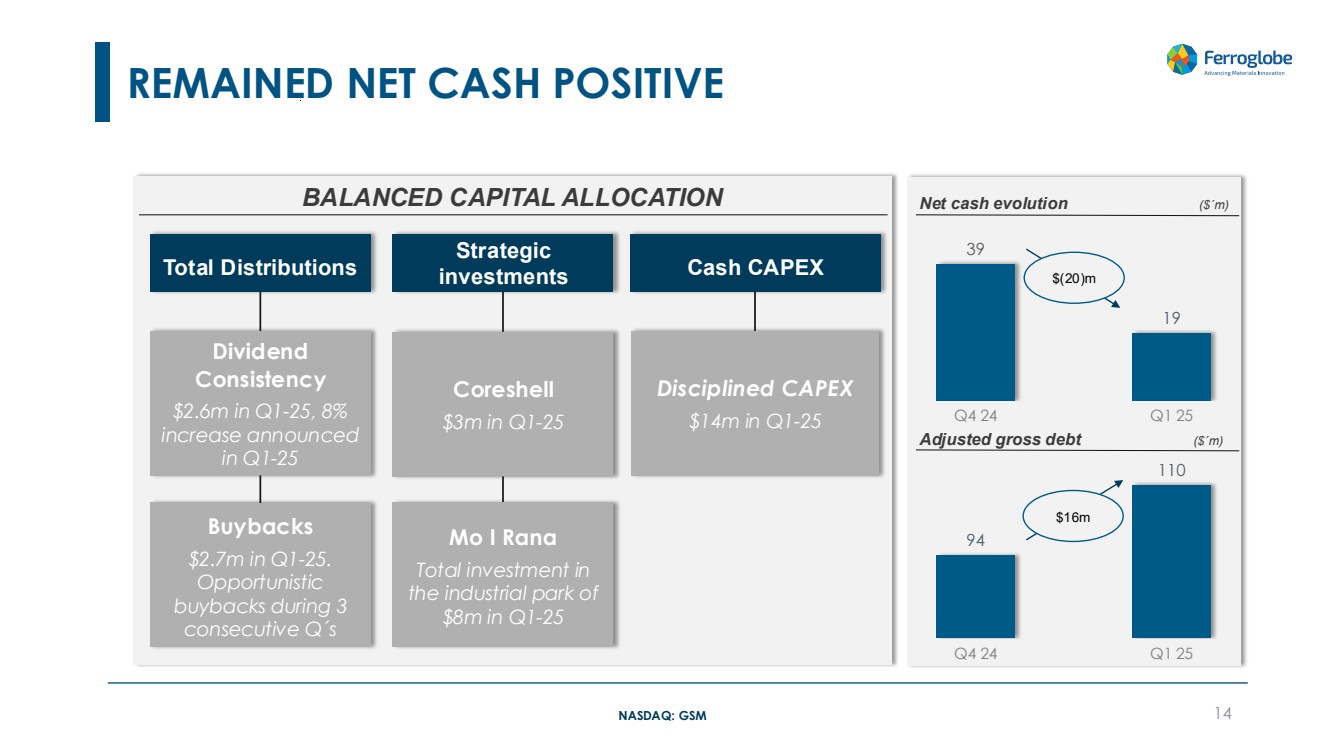
NASDAQ: GSM REMAINED NET CASH POSITIVE 14 Total Distributions BALANCED CAPITAL ALLOCATION Cash CAPEX Buybacks $2.7m in Q1-25. Opportunistic buybacks during 3 consecutive Q´s Dividend Consistency $2.6m in Q1-25, 8% increase announced in Q1-25 Coreshell $3m in Q1-25 Disciplined CAPEX $14m in Q1-25 39 19 Q4 24 Q1 25 Net cash evolution ($´m) Adjusted gross debt ($´m) 94 110 Q4 24 Q1 25 $16m $(20)m Strategic investments Mo I Rana Total investment in the industrial park of $8m in Q1-25 |
|
NASDAQ: GSM Key Takeaways Maintaining 2025 Adj. EBITDA guidance of $100-$170m Positive trade cases and safeguard outcomes expected to level the playing field Expect significantly improved performance for the balance of the year Generated free cash flow amid challenging environment and maintained strong balance sheet 15 |
|
NASDAQ: GSM Q&A |
|
NASDAQ: GSM Appendix ─ Supplemental Information |
|
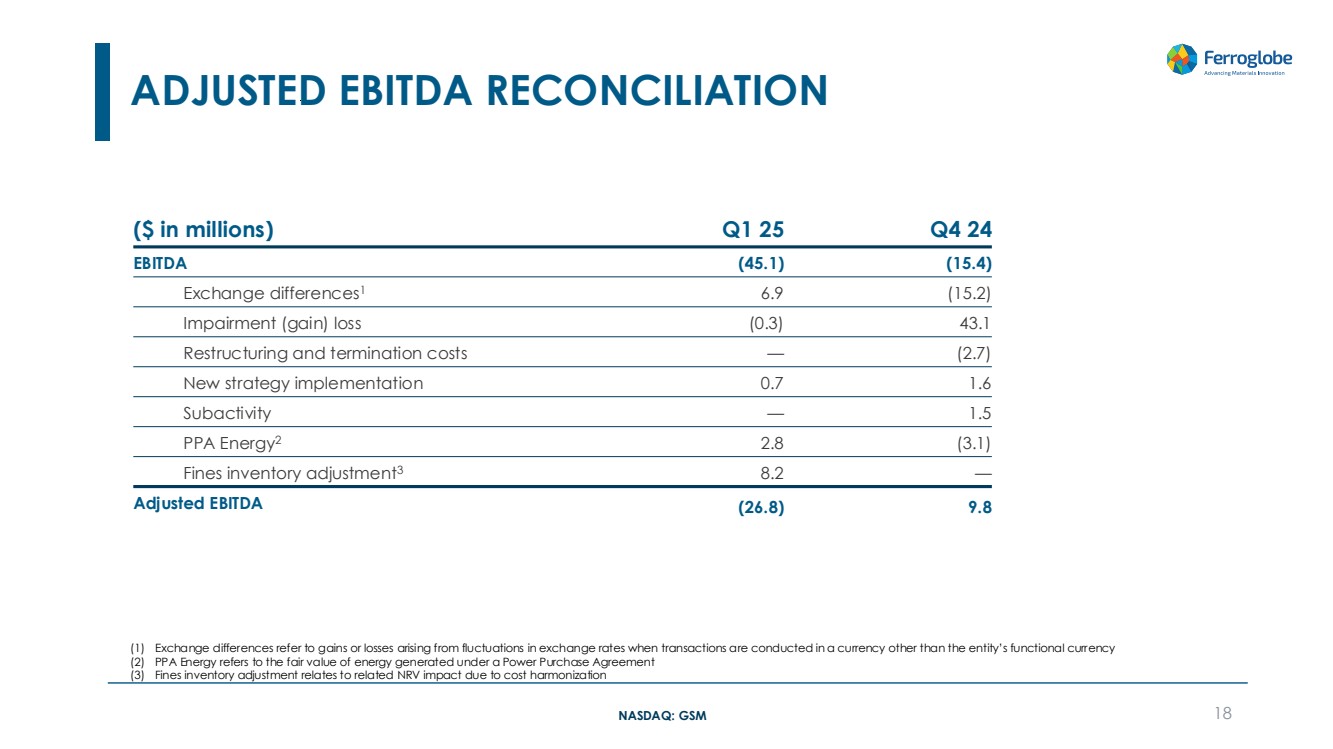
NASDAQ: GSM ADJUSTED EBITDA RECONCILIATION 18 ($ in millions) Q1 25 Q4 24 EBITDA (45.1) (15.4) Exchange differences1 6.9 (15.2) Impairment (gain) loss (0.3) 43.1 Restructuring and termination costs — (2.7) New strategy implementation 0.7 1.6 Subactivity — 1.5 PPA Energy2 2.8 (3.1) Fines inventory adjustment3 8.2 — Adjusted EBITDA (26.8) 9.8 (1) Exchange differences refer to gains or losses arising from fluctuations in exchange rates when transactions are conducted in a currency other than the entity’s functional currency (2) PPA Energy refers to the fair value of energy generated under a Power Purchase Agreement (3) Fines inventory adjustment relates to related NRV impact due to cost harmonization |
|
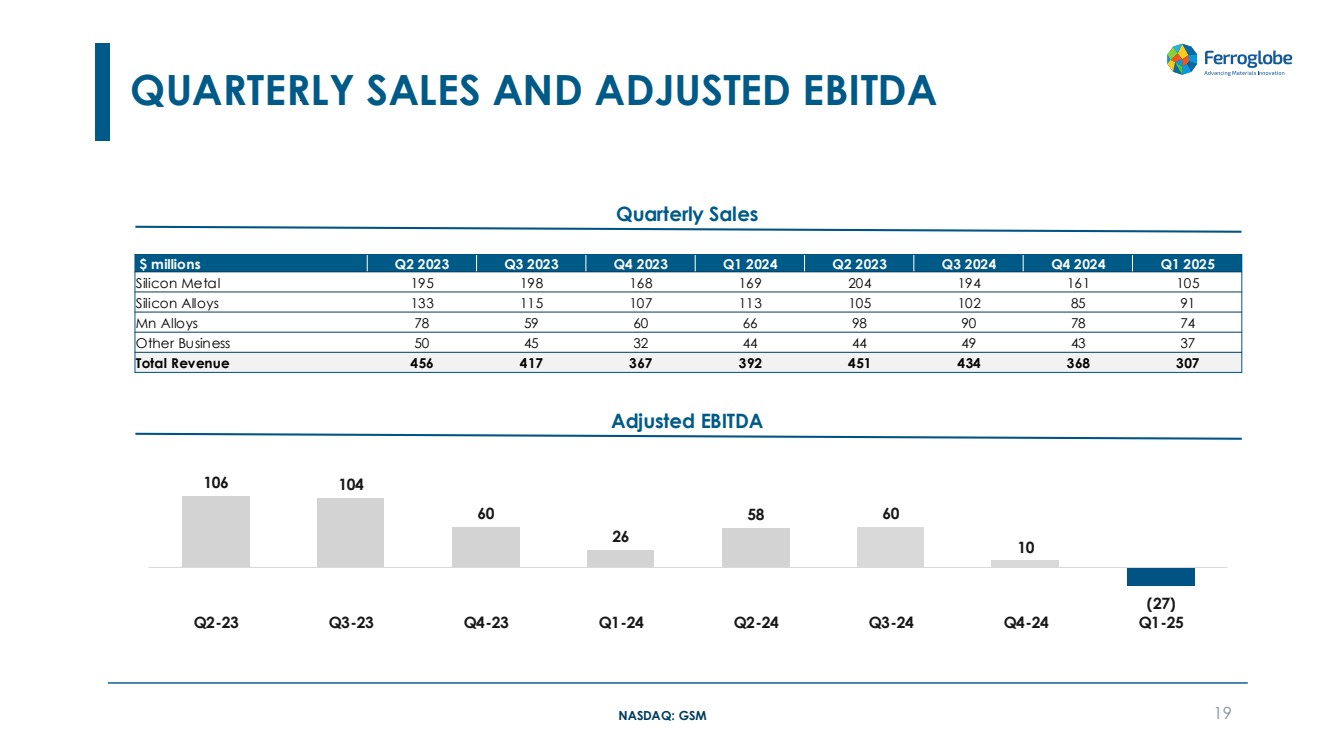
NASDAQ: GSM QUARTERLY SALES AND ADJUSTED EBITDA 19 Adjusted EBITDA Quarterly Sales $ millions Q2 2023 Q3 2023 Q4 2023 Q1 2024 Q2 2023 Q3 2024 Q4 2024 Q1 2025 Silicon Metal 195 198 168 169 204 194 161 105 Silicon Alloys 133 115 107 113 105 102 85 91 Mn Alloys 78 59 60 66 98 90 78 74 Other Business 50 45 32 44 44 49 43 37 Total Revenue 456 417 367 392 451 434 368 307 106 104 60 26 58 60 10 (27) Q2-23 Q3-23 Q4-23 Q1-24 Q2-24 Q3-24 Q4-24 Q1-25 |
|
NASDAQ: GSM Investor Relations Alex Rotonen Vice President, Investor Relations investor.relations@ferroglobe.com Media Inquiries Cristina Feliu Roig Vice President, Communications & Public Affairs NASDAQ: GSM corporate.comms@ferroglobe.com |