| Nevada | 001-36555 | 01-0949984 | ||||||
| (State or Other Jurisdiction of Incorporation) |
(Commission File Number) | (IRS Employer Identification No.) |
||||||
| Title of each class: | Trading Symbol(s): | Name of each exchange on which registered: | ||||||||||||
| Common Stock | MARA | NASDAQ Capital Market |
||||||||||||
| Exhibit No. | Description | ||||
| 99.1 | |||||
| 99.2 | |||||
| 104 | Cover page interactive data file (embedded with the inline XBRL document) | ||||
| MARA HOLDINGS, INC. | ||||||||
Date: July 29, 2025 |
By: | /s/ Zabi Nowaid |
||||||
Zabi Nowaid |
||||||||
| General Counsel and Corporate Strategy | ||||||||


Revenues increased
64% to $238.5 million
|
IN Q2 2025 |
from $145.1 million in Q2 2024. |
Net income (loss)
increased 505%
|
TO $808.2 MILLION |
in Q2 2025 from ($199.7) million in Q2 2024. |
Adjusted EBITDA
increased 1093%
|
$1.2 BILLION |
compared to ($125.5) million in Q2 2024. |
Cost/petahash per
day improved by 24%
|
IN Q2 2025 |
from Q2 2024. |
Energized hashrate
("EH/s") increased 82%
|
TO 57.4 EH/S IN Q2 2025 |
from 31.5 EH/s in Q2 2024. |
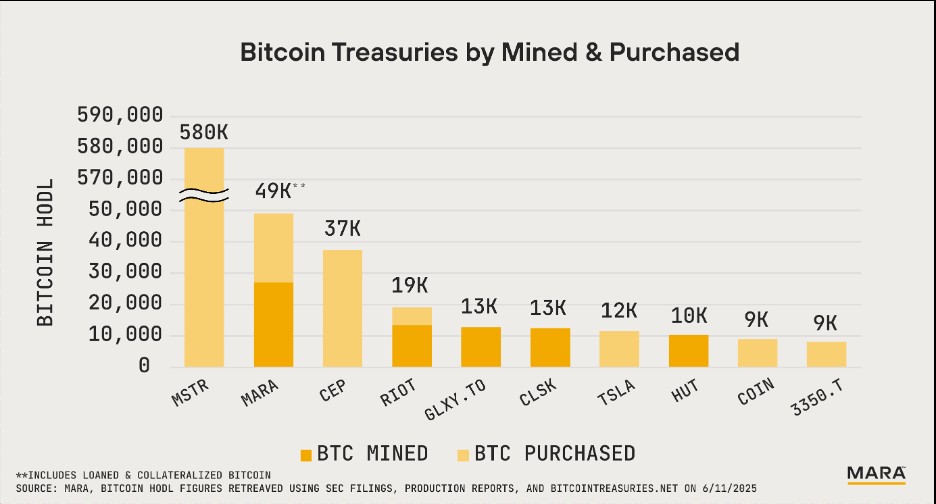
Bitcoin holdings
increased 170%
|
TO 49,951 BTC (C. $5.3B) |
Including 15,550 BTC loaned, actively managed and pledged as
collateral as of June 30, 2025.
|
Total blocks won
increased 52% to 694
|
IN Q2 2025 |
from 457 in Q2 2024. |
Purchased energy cost per
BTC $33,735
|
IN Q2 2025 |
for our owned sites |
Cost per kWh: $0.04 |
FOR Q2 2025 |
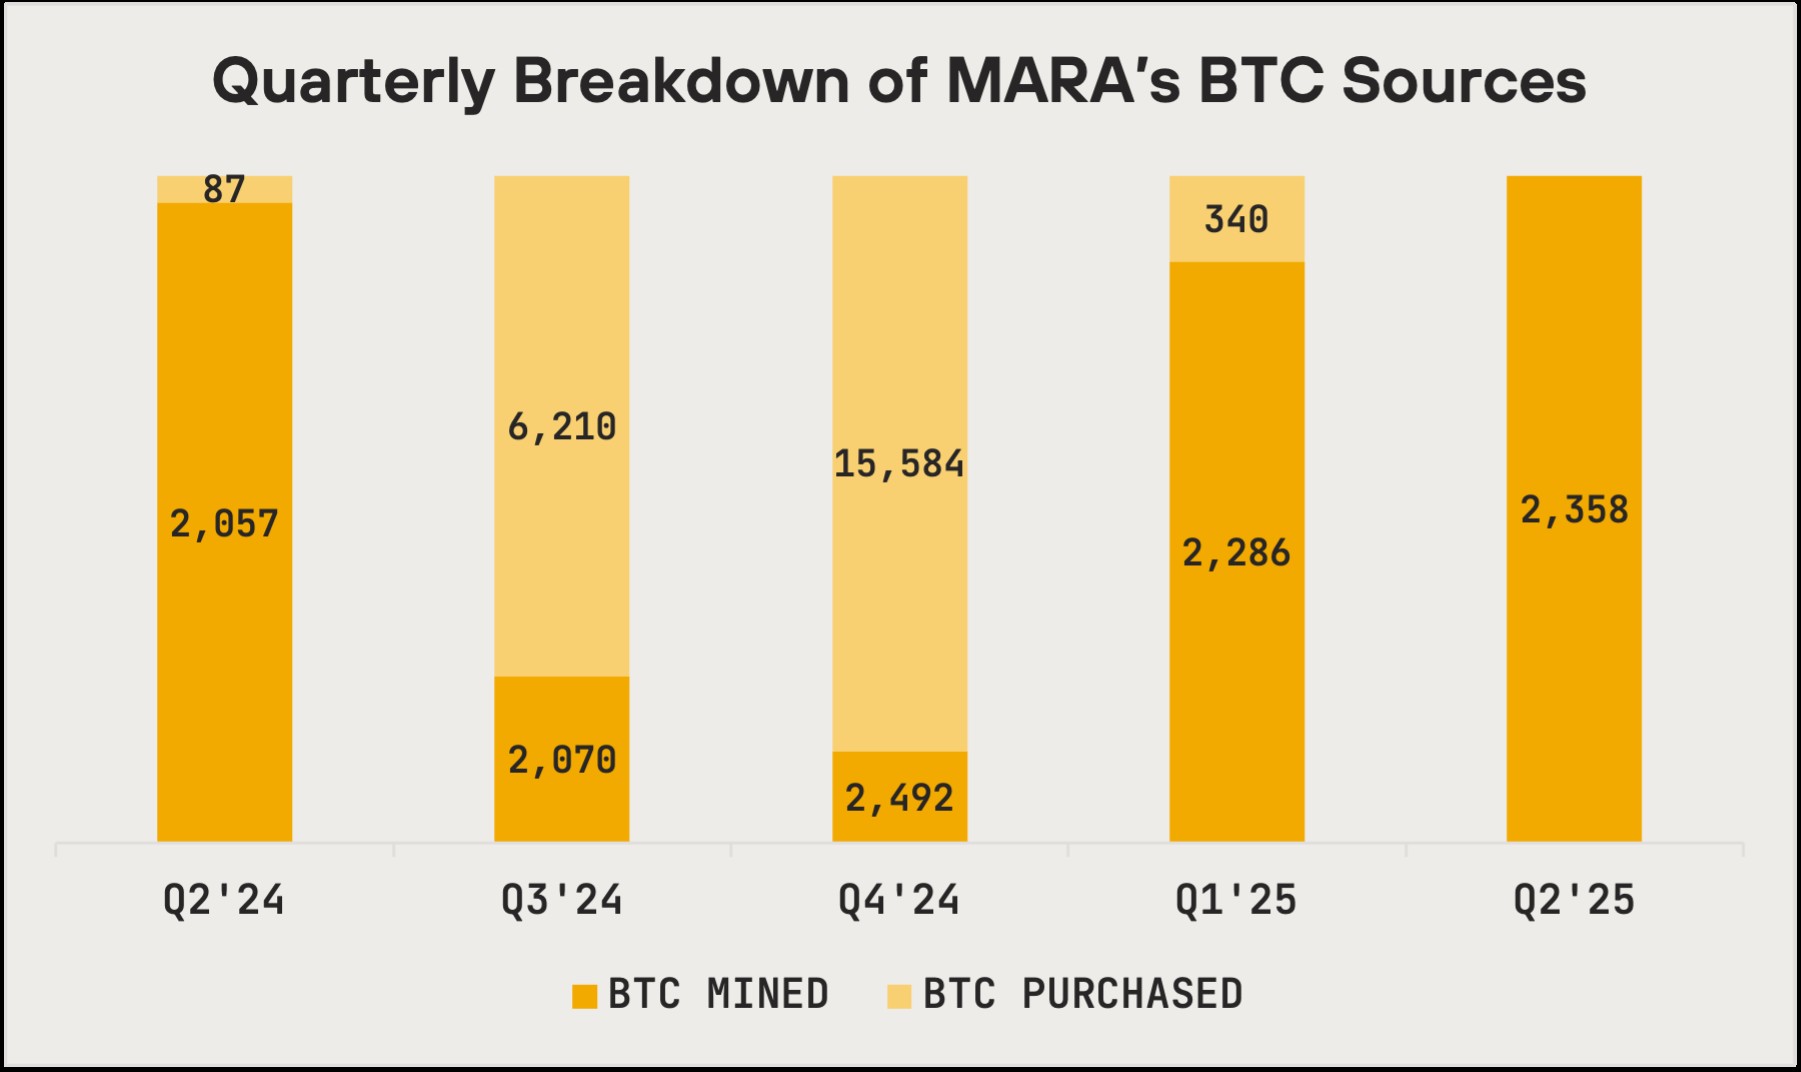
Mined 2,358 BTC |
IN Q2 2025 |
There were no purchases in Q2 2025 |


Prior Quarter Comparison |
|||
Metric |
Q2 2025 |
Q1 2025 |
% Δ |
Number of Blocks Won |
694 |
666 |
4% |
BTC Produced |
2,358 |
2,286 |
3% |
Average BTC Produced per Day |
25.9 |
25.4 |
2% |
Share of Available Miners Rewards (1) |
5.7% |
5.5% |
N/A |
Energized Hashrate (EH/s) (2) |
57.4 |
54.3 |
6% |


MARA's BTC Holdings | |
Quantity |
|
Bitcoin, unrestricted |
34,401 |
Bitcoin Asset Management |
|
Bitcoin - Loaned |
7,877 |
Bitcoin - Actively Managed |
2,004 |
Bitcoin - Pledged as Collateral |
5,669 |
15,550 |
|
Total |
49,951 |

Twitter |
@MARAHoldings |
Linkedin |
MARAHoldings |
Facebook |
MARAHoldings |
Instagram |
@MARAHoldingsinc |
Three Months Ended June 30, |
Six Months Ended June 30, |
|||||||
(in thousands, except share and per share data) |
2025 |
2024 |
2025 |
2024 |
||||
Revenues |
$238,485 |
$145,139 |
$452,369 |
$310,337 |
||||
Costs and operating expenses (income) |
||||||||
Purchased energy costs |
41,730 |
26,113 |
85,211 |
32,201 |
||||
Third-party hosting and other energy costs |
69,029 |
54,020 |
137,212 |
123,586 |
||||
Operating and maintenance costs |
22,362 |
15,595 |
42,156 |
31,409 |
||||
General and administrative |
92,948 |
53,492 |
178,813 |
122,398 |
||||
Depreciation and amortization |
161,741 |
107,508 |
319,638 |
189,110 |
||||
Change in fair value of digital assets |
(846,027) |
147,999 |
(451,865) |
(340,808) |
||||
Change in fair value of derivative instrument |
(20,311) |
(38,251) |
(47,139) |
(22,999) |
||||
Impairment of assets |
26,253 |
— |
26,253 |
— |
||||
Taxes other than on income |
2,437 |
1,555 |
5,532 |
4,065 |
||||
Early termination expenses |
— |
5,660 |
— |
27,757 |
||||
Research and development |
8,546 |
3,845 |
17,844 |
6,311 |
||||
Total costs and operating expenses (income) |
(441,292) |
377,536 |
313,655 |
173,030 |
||||
Operating income (loss) |
679,777 |
(232,397) |
138,714 |
137,307 |
||||
Other income |
||||||||
Change in fair value of digital assets - receivable, net |
346,547 |
— |
230,480 |
— |
||||
Interest income |
9,631 |
2,308 |
21,626 |
4,881 |
||||
Interest expense |
(12,835) |
(1,369) |
(22,776) |
(2,625) |
||||
Equity in net earnings of unconsolidated affiliate |
(902) |
49 |
(915) |
1,308 |
||||
Other |
(5,509) |
93 |
(3,035) |
3,037 |
||||
Total other income |
336,932 |
1,081 |
225,380 |
6,601 |
||||
Income (loss) before income taxes |
1,016,709 |
(231,316) |
364,094 |
143,908 |
||||
Income tax benefit (expense) |
(208,504) |
31,657 |
(89,332) |
(6,394) |
||||
Net income (loss) |
$808,205 |
$(199,659) |
$274,762 |
$137,514 |
||||
Less: net loss attributable to noncontrolling interest |
30 |
— |
274 |
— |
||||
Net income (loss) attributable to common stockholders |
$808,235 |
$(199,659) |
$275,036 |
$137,514 |
||||
Net income (loss) per share of common stock - basic |
$2.29 |
$(0.72) |
$0.79 |
$0.51 |
||||
Weighted average shares of common stock - basic |
352,901,683 |
278,674,506 |
348,524,166 |
268,899,932 |
||||
Net income (loss) per share of common stock - diluted |
$1.84 |
$(0.72) |
$0.64 |
$0.50 |
||||
Weighted average shares of common stock - diluted |
440,912,159 |
278,674,506 |
436,271,805 |
277,959,660 |
||||
Three Months Ended June 30, |
Six Months Ended June 30, |
|||||||
(in thousands, except share and per share data) |
2025 |
2024 |
2025 |
2024 |
||||
Reconciliation to Adjusted EBITDA: |
||||||||
Net income (loss) attributable to common stockholders |
$808,235 |
$(199,659) |
$275,036 |
$137,514 |
||||
Interest expense (income), net |
3,204 |
(939) |
1,150 |
(2,256) |
||||
Income tax expense (benefit) |
208,504 |
(31,657) |
89,332 |
6,394 |
||||
Depreciation and amortization |
164,914 |
111,047 |
325,916 |
195,232 |
||||
EBITDA |
1,184,857 |
(121,208) |
691,434 |
336,884 |
||||
Stock based compensation expense |
54,656 |
28,332 |
103,771 |
80,245 |
||||
Change in fair value of derivative instrument |
(20,311) |
(38,251) |
(47,139) |
(22,999) |
||||
Impairment of assets |
26,253 |
— |
26,253 |
— |
||||
Net gain on investments |
— |
— |
(12,429) |
(5,236) |
||||
Early termination expenses |
— |
5,660 |
— |
27,757 |
||||
Adjusted EBITDA (1) |
$1,245,455 |
$(125,467) |
$761,890 |
$416,651 |
||||
Three Months Ended |
||||||||||
(in thousands, except return on capital employed) |
June 30, 2025 |
March 31,
2025
|
December 31,
2024
|
September
30, 2024
|
June 30, 2024 |
|||||
Reconciliation of last twelve month ("LTM") net income to LTM Adjusted EBITDA (2): | ||||||||||
Net income (loss) attributable to common
stockholders
|
$678,775 |
$(329,119) |
$541,253 |
$164,551 |
$288,950 |
|||||
Interest income, net |
(309) |
(4,452) |
(3,715) |
(4,068) |
(406) |
|||||
Income tax expense (benefit) |
158,433 |
(81,728) |
75,495 |
(26,692) |
22,542 |
|||||
Depreciation and amortization |
572,238 |
518,371 |
441,554 |
372,749 |
321,814 |
|||||
EBITDA |
1,409,137 |
103,072 |
1,054,587 |
506,540 |
632,900 |
|||||
Stock based compensation expense |
181,168 |
154,844 |
157,642 |
122,322 |
104,493 |
|||||
Change in fair value of derivative instrument |
(22,097) |
(40,037) |
2,043 |
35,235 |
(22,999) |
|||||
Impairment of assets |
26,253 |
— |
— |
— |
— |
|||||
Net gain on investments |
(13,121) |
(11,429) |
(4,236) |
(4,236) |
(5,236) |
|||||
Net gain from extinguishment of debt |
(11,429) |
(13,121) |
(13,121) |
— |
(82,600) |
|||||
Early termination expenses |
10,304 |
15,964 |
38,061 |
38,061 |
27,757 |
|||||
Adjusted EBITDA |
$1,580,215 |
$209,293 |
$1,234,976 |
$697,922 |
$654,315 |
|||||
LTM total assets |
$6,136,839 |
$4,985,767 |
$4,113,902 |
$2,911,316 |
$2,362,224 |
|||||
Less: LTM total current liabilities |
241,094 |
155,642 |
81,332 |
65,972 |
60,568 |
|||||
Average capital employed |
$5,895,745 |
$4,830,125 |
$4,032,570 |
$2,845,344 |
$2,301,656 |
|||||
Return on capital employed (1) |
27% |
4% |
31% |
25% |
28% |
|||||