UNITED STATES
SECURITIES AND EXCHANGE COMMISSION
Washington, D.C. 20549
FORM 20-F
☐ REGISTRATION STATEMENT PURSUANT TO SECTION 12(b) OR (g) OF THE SECURITIES EXCHANGE ACT OF 1934
OR
☒ ANNUAL REPORT PURSUANT TO SECTION 13 OR 15(d) OF THE SECURITIES EXCHANGE ACT OF 1934
For the fiscal year ended December 31, 2024
OR
☐ TRANSITION REPORT PURSUANT TO SECTION 13 OR 15(d) OF THE SECURITIES EXCHANGE ACT OF 1934
OR
☐ SHELL COMPANY REPORT PURSUANT TO SECTION 13 OR 15(d) OF THE SECURITIES EXCHANGE ACT OF 1934
Date of event requiring this shell company report
For the transition period from to
Commission File No. 001-38145
Fury Gold Mines Limited
(Translation of registrant's name into English)
British Columbia, Canada
(Jurisdiction of incorporation or organization)
401 Bay Street, 16th Floor, Toronto, Ontario, Canada M5H 2Y4
(Address of principal executive office)
Phil van Staden, Chief Financial Officer, +1 (647) 673-7664, phil.vanstaden@furygoldmines.com
401 Bay Street, 16th Floor, Toronto, Ontario, Canada M5H 2Y4
(Name, telephone, email and/or facsimile number and address of Company Contact Person)
Securities registered or to be registered pursuant to Section 12(b) of the Act:
| Title of Class |
Trading Symbol(s) |
Name of Each Exchange on Which Registered |
||
| Common Shares, no par value |
FURY |
NYSE American and Toronto Stock Exchange (TSX) |
Securities registered or to be registered pursuant to Section 12(g) of the Act: None
Securities for which there is a reporting obligation pursuant to Section 15(d) of the Act: None
Indicate the number of outstanding shares of each of the issuer’s classes of capital or stock as of the closing of the period covered by the Annual Report: 151,556,273 Common Shares
Indicate by check mark if the registration is a well-known seasoned issuer, as defined in Rule 405 of the Securities Act.
☐ Yes ☒ No
If this report is an annual or transition report, indicate by check mark if the registrant is not required to file reports pursuant to Section 13 or 15(d) of the Securities Exchange Act of 1934.
☐ Yes ☒ No
Indicate by check mark whether the Registrant (1) has filed all reports required to be filed by Section 13 or 15(d) of the Securities Exchange Act of 1934 during the preceding 12 months (or for such shorter period that the Registrant was required to file such reports) and (2) has been subject to such filing requirements for the past 90 days.
☒ Yes ☐ No
Indicate by check mark whether the registrant has submitted electronically every Interactive Data File required to be submitted pursuant to Rule 405 of Regulation S-T (§232.405 of this chapter) during the preceding 12 months (or for such shorter period that the registrant was required to submit such files).
☒ Yes ☐ No
Indicate by check mark whether the registrant is a large accelerated filer, an accelerated filer, a non-accelerated filer, and/or an emerging growth company. See definition of “large accelerated filer,” “accelerated filer,” and “emerging growth company” in Rule 12b-2 of the Exchange Act:
| Large accelerated filer ☐ |
Accelerated filer ☐ |
Non-accelerated filer ☒ |
| Emerging growth company ☐ |
If an emerging growth company that prepares its financial statements in accordance with U.S. GAAP, indicate by check mark if the registrant has elected not to use the extended transition period for complying with any new or revised financial accounting standards provided pursuant to Section 13(a) of the Exchange Act. ☐
Indicate by check mark whether the registrant has filed a report on and attestation to its management’s assessment of the effectiveness of its internal control over financial reporting under Section 404(b) of the Sarbanes-Oxley Act (15 U.S.C. 7262(b)) by the registered public accounting firm that prepared or issued its audit report. ☐
If securities are registered pursuant to Section 12(b) of the Act, indicate by check mark whether the financial statements of the registrant included in the filing reflect the correction of an error to previously issued financial statements. ☐
Indicate by check mark whether any of those error corrections are restatements that required a recovery analysis of incentive-based compensation received by any of the registrant’s executive officers during the relevant recovery period pursuant to §240.10D-1(b). ☐
Indicate by check mark which basis of accounting the registrant has used to prepare the financial statements included in this filing:
| U.S. GAAP |
☐ |
| International Financial Reporting Standards as issued by the International Accounting Standards Board |
☒ |
| Other |
☐ |
If “Other” has been checked in response to the previous question, indicate by check mark which financial statement item the registrant has elected to follow.
Item 17 ☐ Item 18 ☐
If this is an annual report, indicate by check mark whether the registrant is a shell company (as defined in Rule 12b-2 of the Exchange Act).
☐ Yes ☒ No
TABLE OF CONTENTS
Cautionary Note Regarding Forward-Looking Statements
Certain statements made on this Form 20-F (“Annual Report”) contain forward-looking information within the meaning of applicable United States securities laws (“forward-looking statements”). These forward-looking statements are presented for the purpose of assisting the Company’s securityholders and prospective investors in understanding management’s intentions and views regarding future outcomes and are inherently uncertain and should not be heavily relied upon. When used in this Annual Report, the words “may”, “would”, “could”, “will”, “intend”, “plan”, “anticipate”, “believe”, “seek”, “propose”, “estimate”, “expect”, and similar expressions, as they relate to the Company, identify such forward-looking statements. Specific forward-looking statements in this Annual Report include:
| ● |
the Company’s exploration and financing plans, |
| ● |
the ability of the Company to realize the objectives of the Company’s planned exploration programs; |
| ● |
the results of the Company’s exploration programs and the likelihood of discovering or expanding resources; |
| ● |
the Company’s estimated mineral resources; |
| ● |
the future price of minerals, especially gold and other precious metals; |
| ● |
the Company’s future capital expenditures and requirements, and sources and timing of additional financing; |
| ● |
the potential for resource expansion and ultimately mine development of the Company’s Eau Claire Project, |
| ● |
the Company’s plans to complete the acquisition of Quebec Precious Metals Corporation.; |
| ● |
the potential for resource expansion; |
| ● |
permitting timelines and possible delays; |
| ● |
local indigenous and other affected communities engagement; |
| ● |
government regulation of mining operations; |
| ● |
environmental and climate-related risks; |
| ● |
the possible impairment of mining interests; |
| ● |
any objectives, expectations, intentions, plans, results, levels of activity, goals or achievements; |
| ● |
the liquidity of the common shares in the capital of the Company; and |
| ● |
other events or conditions that may occur in the future. |
The forward-looking statements contained in this Annual Report represent the Company’s views as of the date hereof. The assumptions related to these plans, estimates, projections, beliefs, and opinions may change without notice and in unanticipated ways. Many assumptions may prove to be incorrect, including:
| ● |
the Company’s budgeting plans, expected costs, assumptions regarding capital and commodity market conditions and other factors upon which the Company has based its expenditure and funding expectations; |
| ● |
the Company will be able to raise additional capital to proceed with its exploration, development and operations plans and attracting finance for precious metal exploration will be possible; |
| ● |
the Company’s ability to obtain or renew the licenses, permits and regulatory approvals necessary for its planned exploration and securing support of locally affected communities; |
| ● |
the Company’s exploration plans will not be adversely impacted by declines in prices of precious metals and consequent impairment of the Company’s ability to finance its operations; |
| ● |
that operations and financial markets will not in the long term be adversely impacted by wars or pandemics or other natural or man-made disasters; |
| ● |
the Company’s ability to complete and successfully integrate acquisitions, including its acquisition of Quebec Precious Metals Corporation.; |
| ● |
the Company’s plan of operations will not be adversely impacted by climate change, extreme weather events, water scarcity, and seismic events, and the Company’s strategies to deal with these issues will be effective; |
| ● |
the Company’s expectations regarding the future demand for, and supply and price of, precious metals; |
| ● |
the Company’s ability to recruit and retain qualified personnel to pursue its business operations; |
| ● |
the Company’s mineral resource estimates, and the assumptions upon which they are based, are reasonably accurate; |
| ● |
the Company will be able to comply with current and future environmental, safety and other regulatory requirements and to obtain and maintain local community support. |
Inherent in the forward-looking statements are known and unknown risks, uncertainties and other factors beyond the Company’s ability to control or predict, that may cause the actual results, performance or achievements of the Company, or developments in the Company’s business or in its industry, to adversely differ materially from the anticipated results, performance, achievements or developments expressed or implied by such forward-looking statements. Some of the risks and other factors (some of which are beyond the Company’s control) which could cause results to differ materially from those expressed in the forward-looking statements and information contained in this Annual Report include, but are not limited to:
| ● |
fluctuations in the current and projected prices for gold, other precious and base metals and other commodities (such as natural gas, fuel oil and electricity) which are needed to explore for and ultimately produce these metals; |
| ● |
the Company does not earn any revenues from its business and has history of losses and negative cash flows from operations, each of which is expected to continue in the future; |
| ● |
the Company may not be able to secure additional financings, including equity financings, to continue the planned exploration of its mineral properties; |
| ● |
the Company’s exploration programs are inherently risky as they involve uncertain geology and risk exploration failure and may overrun on costs and not be successful in achieving the targeted objectives or result in the discovery of new resources or the expansion of existing resources; |
| ● |
the Company’s plan of operations involves risks and hazards associated with the business of mineral exploration, development and mining (including environmental hazards, potential unintended releases of contaminants, industrial accidents, unusual or unexpected geological or structural formations, pressures, cave-ins and flooding); |
| ● |
the speculative nature of mineral exploration and development; the estimation of mineral resources, the Company’s ability to obtain funding, including the Company’s ability to complete future equity financings; |
| ● |
the shareholders of Quebec Precious Metals Corporation. may not approve the acquisition by the Company; |
| ● |
environmental risks and remediation measures, including evolving environmental regulations and legislation; |
| ● |
changes in laws and regulations impacting exploration and mining activities; |
| ● |
the Company’s mineral properties being subject to prior unregistered agreements, transfers or claims and other defects in title; |
| ● |
legal and litigation risks; |
| ● |
statutory and regulatory compliance; |
| ● |
insurance and uninsurable risks; |
| ● |
the continuation of our management team and our ability to secure the specialized skill and knowledge necessary to operate in the mining industry |
| ● |
the Company’s limited business history and history of losses and negative cash, which will continue into the foreseeable future; |
| ● |
our inability to pay dividends, volatility in the Company’s share price, the continuation of our management team and our ability to secure the specialized skill and knowledge necessary to operate in the mining industry; relations with and claims by local communities and non-governmental organizations, including relations with and claims by indigenous populations; |
| ● |
the effectiveness of the Company’s internal control over financial reporting; |
| ● |
cybersecurity risks and other reputational risks; |
| ● |
general business, economic, competitive, political and social uncertainties; |
| ● |
the effects of climate change, extreme weather events, water scarcity, and seismic events, and the effectiveness of strategies to deal with these issues; |
| ● |
and public health crises such as the COVID-19 pandemic and other uninsurable risks. |
While intended to list the primary risks that we see, no list can contain an exhaustive list of the risk and other factors that may affect any of the Company’s forward-looking statements. Some of these risks and other factors are discussed in more detail in the section entitled “Risk Factors”. Investors and others should carefully consider these risks and other factors and not place heavy reliance on the forward-looking statements.
The Company only updates its risk factors and forward-looking statements, when and to the extent required by applicable securities laws. See Item 3.D - Risk Factors below for a more detailed discussion of the risks faced by the Company.
Emerging Growth Company (“EGC”) Status
The Company ceased to qualify as an “emerging growth company”, as defined in Section 3(a) of the United States Securities Exchange Act of 1934, as amended (the “Exchange Act”) by the Jumpstart Our Business Startups Act of 2012 (the “JOBS Act”), on December 31, 2022, which was the last day of the Company’s fiscal year following the fifth anniversary of the date of the first sale of equity securities pursuant to an effective registration statement under the United States Securities Act of 1933, as amended (“Securities Act”).
Generally, any registrant that has any class of its securities under Section 12 of the Exchange Act is required to include in its annual reports filed by it under the Exchange Act a management report on internal control over financial reporting and, subject to an exemption available to registrants that are neither an "accelerated filer" or a "larger accelerated filer" (as those terms are defined in Exchange Act Rule 12b-2), an auditor attestation report on management’s assessment of internal control over financial reporting. As the Company has ceased to qualify as an “emerging growth company”, the Company will be required to include in its subsequent annual reports, an auditor attestation report on management’s assessment of internal control over financial reporting to the extent that it does not qualify for the exemption available to registrants that are neither an “accelerated filer” or “large accelerated filer”. Based on the Company’s aggregate market-value as at June 30, 2024, the Company qualifies as a “non-accelerated filer” and, as such, is not to required to include and has not included an auditors attestation report on the Company’s internal control over financial reporting with this Annual Report.
In this Annual Report, unless otherwise indicated, all dollar amounts and references to “C$” or “$” are to Canadian dollars and references to “US$” are to U.S. dollars. All dollar amounts are expressed in thousands of Canadian dollars unless otherwise indicated.
Item 1 — Identity of Directors, Senior Management, and Advisers
Not applicable
Item 2 — Offer Statistics and Expected Timetable
Not applicable
| [Reserved] |
| Capitalization and indebtedness |
Not Applicable
| Reasons for the offer and use of proceeds |
Not Applicable
| Risk factors |
An investment in securities of Fury Gold involves significant risks, which should be carefully considered by prospective investors before purchasing such securities through any stock exchange or private sale. Management of Fury Gold considers the following risks to be most significant for potential investors in Fury Gold, but such risks do not necessarily comprise all those associated with an investment in Fury Gold. Additional risks and uncertainties not currently known to management of Fury Gold may also have an adverse effect on Fury Gold’s business. If any of these adverse events for which we are at risk actually occur, Fury Gold’s business, financial condition, capital resources, results of operations and/or future operations could be materially adversely affected.
In addition to the other information set forth elsewhere in this Annual Report, the following risk factors should be carefully considered when assessing risks related to Fury Gold’s business.
Exploration Activities May Not Be Successful
Exploration for, and development of, mineral properties is highly speculative and involves significant financial risks, which even a combination of careful evaluation, experience and knowledge may not eliminate. While the discovery of an ore body may result in substantial rewards, few properties that are explored are ultimately developed into producing mines. Major expenditures may be required to establish reserves by drilling, to complete a feasibility study and to construct mining and processing facilities at a site for extracting gold or other metals from ore. Fury Gold cannot ensure that its future exploration programs will result in profitable commercial mining operations.
Few properties that are explored are ultimately developed into producing mines. Unusual or unexpected formations, formation pressures, fires, power outages, labour disruptions, flooding, explosions, cave-ins, landslides and the inability to obtain adequate machinery, equipment and/or labour are some of the risks involved in mineral exploration activities.
The Company has implemented safety and environmental measures designed to comply with or exceed government regulations and ensure safe, reliable and efficient operations in all phases of its operations. The Company maintains liability and property insurance, where reasonably available, in such amounts as it considers prudent. The Company may become subject to liability for hazards against which it cannot insure or which it may elect not to insure against because of high premium costs or other reasons.
Also, substantial expenses may be incurred on exploration projects that are subsequently abandoned due to poor exploration results or the inability to define reserves that can be mined economically. Estimates of proven and probable mineral reserves and cash operating costs are, to a large extent, based upon detailed geological and engineering analysis. There have been no feasibility studies conducted in order to derive estimates of capital and operating costs including, among others, anticipated tonnage and grades of ore to be mined and processed, the configuration of the ore body, ground and mining conditions, expected recovery rates of the gold from the ore, and anticipated environmental and regulatory compliance costs.
Substantial expenditures are required to establish mineral resources and mineral reserves through drilling and development and for mining and processing facilities and infrastructure. No assurances can be given that mineral will be discovered in sufficient quantities to justify commercial operations or that funds required for development can be obtained on a timely basis. There is also no assurance that even if commercial quantities of ore are discovered that the properties will be brought into commercial production or that the funds required to exploit any mineral reserves and resources discovered by the Company will be obtained on a timely basis or at all. Economic feasibility of a project is based on several other factors including anticipated metallurgical recoveries, environmental considerations and permitting, future metal prices and timely completion of any development plan. Most of the above factors are beyond the control of the Company. There can be no assurance that the Company’s mineral exploration activities will be successful. In the event that such commercial viability is never attained, the Company may seek to transfer its property interests or otherwise realize value or may even be required to abandon its business and fail as a “going concern”.
Moreover, advancing any of the Company’s exploration properties into a revenue generating property, will require the construction and operation of mines, processing plants and related infrastructure, the development of which includes various risks associated with establishing new mining operations, including:
| ● |
the ability to obtain acceptance and support from the local communities affected given many communities are opposed to mining operations of any kind; |
| ● |
the timing and costs, which can be considerable, of the construction of mining and processing facilities; |
| ● |
the availability and cost of skilled labour, mining equipment and principal supplies needed for operations; |
| ● |
the availability and cost of appropriate smelting and refining arrangements; |
| ● |
the need to maintain necessary environmental and other governmental approvals and permits; |
| ● |
the availability of funds to finance construction and development activities; |
| ● |
potential opposition from non-governmental organizations, environmental groups, local groups or other stakeholders which may delay or prevent development activities; and |
| ● |
potential increases in construction and operating costs due to changes in the cost of labour, fuel, power, materials and supplies. |
It is possible that actual costs and economic returns of future mining operations may differ materially from Fury Gold’s best estimates. It is not unusual for new mining operations to experience unexpected problems during the start-up phase and to require more capital than anticipated. These additional costs could have an adverse impact on Fury Gold’s future cash flows, earnings, results of operations and financial condition.
Commodity Price Fluctuations and Cycles
Resource exploration is significantly linked to the outlook for commodities. When the price of commodities being explored for declines, investor interest subsides, and capital markets become more difficult. The price of commodities varies on a daily basis and there is no reliable way to predict future prices.
Gold prices specifically are historically subject to wide fluctuation and are influenced by a number of factors including not only supply and demand for industrial its uses, but for speculation purposes, all of which factors are beyond the control or influence of the Company. Some factors that affect the price of gold include industrial and jewelry demand; central bank lending or purchase or sales of gold bullion; forward or short sales of gold by producers and speculators; future level of gold productions; and rapid short-term changes in supply and demand due to speculative or hedging activities by producers, individuals or funds. Gold prices are also affected by macroeconomic factors including: confidence in the global monetary system; expectations of the future rate of inflation; the availability and attractiveness of alternative investment vehicles; the general level of interest rates; the strength of, and confidence in the U.S. dollar, the currency in which the price of gold is generally quoted, and other major currencies; global and regional political or economic events; and costs of production of other gold producing companies.
Additional Funding Requirements and Shareholder Equity Dilution
Fury Gold’s business is in the exploration stage and the Company does not carry-on mining activities. As such, it will require additional financing to continue its operations. Fury Gold’s ability to secure additional financing and fund ongoing exploration will be affected by many factors, including the strength of the economy and other general economic factors. Global financial conditions continue to be subject to volatility arising from international geopolitical developments and global economic phenomenon, as well as general financial market turbulence. Access to public financing and credit can be negatively impacted by the effect of these events on Canadian and global credit markets. These instances of volatility and market turmoil could adversely impact Fury Gold’s operations and the trading price of the Common Shares. There can be no assurance that Fury Gold will be able to obtain adequate financing in the future, or that the terms of such financing will be favourable for further exploration and development of its projects. Failure to obtain such additional financing could result in delay or indefinite postponement of further exploration, drilling and/or development. Further, revenues, financings and profits, if any, will depend upon various factors, including the success, if any, of exploration programs and general market conditions for natural resources.
In order to finance future operations, Fury Gold may raise funds through the issuance of additional Common Shares or the issuance of debt instruments or other securities convertible into Common Shares. Fury Gold cannot predict the size of future issuances of Common Shares or the issuance of debt instruments or other securities convertible into Common Shares or the dilutive effect, if any, that future issuances and sales of Fury Gold’s securities will have on the market price of the Common Shares.
Negative Cash Flow
Fury Gold experiences negative cash flow from operations and anticipates incurring negative cash flow from operations for 2025 and beyond as a result of the fact that it does not have revenues from mining or any other activities. In addition, as a result of Fury Gold’s business plans for the development of its mineral projects, Fury Gold expects cash flow from operations to continue to be negative until Fury Gold is able to establish the economic viability and the development of one of its mineral projects, of which there is no assurance. Accordingly, Fury Gold’s cash flow from operations will be negative for the foreseeable future as a result of expenses to be incurred s in connection with advancement of exploration on its mineral projects.
Indirect Economic Interest in the Homestake Ridge Project
As a result of the completion of the sale of the Homestake Ridge Project to Dolly Varden in February 2022, the Company continues to own an indirect minority economic interest in the Homestake Ridge Project through its ownership of a significant interest in Dolly Varden’s common shares (currently 16.11 %). Additionally, the Company has the right to nominate one director to the Dolly Varden Board, based on the Company’s current ownership position of Dolly Varden, and the right to nominate a representative to the technical committee. The value of the Company’s ownership in Dolly Varden will vary as the price of the common shares of Dolly Varden fluctuate on the TSX Venture Exchange and this value may be more or less than the accounting value ascribed to these shares (which may create non-cash charges and credits when Dolly Varden finances). While the Company has pre-emptive rights under the Investor Rights Agreement to retain is ownership position in Dolly Varden (on a percentage ownership basis) there is no assurance that the Company will exercise these pre-emptive rights to continue to maintain its position if Dolly Varden determines to complete future equity offerings, either as a result of a determination of the Company not to invest or the inability of the Company to allocate available funds to complete a required investment. Accordingly, the Company’s interest in Dolly Varden may ultimately be diluted.
Price Volatility of Publicly Traded Securities
In recent years, the securities markets in the United States and Canada, and in particular the markets for junior resource companies, have experienced a high level of price and volume volatility, and the market prices of securities of many mining companies have experienced wide fluctuations in price which have not necessarily been related to the operating performance, underlying asset values or prospects of such companies. There can be no assurance that continuing fluctuations in share price will not occur in connection with the Company’s common shares or with its shareholding in Dolly Varden shares. These factors are ultimately beyond the control of Fury Gold and could have a material adverse effect on the Company’s financial condition and results of operations. Securities class action litigation often has been brought against companies following periods of volatility in the market price of their securities. The Company may in the future be the target of similar litigation. Securities litigation could result in substantial costs and damages and divert management's attention and resources.
Mineral Resource Estimates
There is no certainty that any of the mineral resources estimated on the Eau Claire Project, the Committee Bay Project, or any other project with mineral resources will be advanced into mineral reserves. Until a deposit is actually mined and processed, the quantity of mineral resources and grades must be considered as estimates only, and are expressions of judgment based on knowledge, mining experience, analysis of drilling results and industry best practices. Valid estimates made at any given time may vary significantly when new information becomes available. While Fury Gold believes that the Company’s estimates of mineral resources are well established and reflect management’s best estimates, by their nature mineral resource estimates are imprecise and depend, to a certain extent, upon statistical inferences and geological interpretations, which may ultimately prove inaccurate.
The mineral resource estimates included herein have been determined and valued based on assumed future prices, mineralization percentage cut-off grades and operating costs. Furthermore, fluctuations in gold and base or other precious metals prices, results of drilling, metallurgical testing and production and the evaluation of studies, reports and plans subsequent to the date of any estimate may require revisions to such estimates. Any material reductions in estimates of mineral resources could have a material adverse effect on the Company’s results of operations and financial condition.
To date, the Company has not established mineral reserves on any of its mineral properties.
Inflation
Consumer price inflation, although lower than 2023, has stayed above 2% in 2024 and if it continues will mean much higher costs for Fury Gold’s expenditure programs. Fury Gold’s program cost estimates could rapidly become out-of-date. If this happens, the Company will need to either raise additional funds causing equity dilution or reduce its expenditures and reducing progress. Increases in inflation usually result in central bank interest rate hikes which can trigger negative capital market conditions making financing difficult. While inflation increases have often led to higher precious metals prices, there can be no assurance of that and the Company’s operations and its share price could well be adversely affected by increased inflation.
Property Commitments
Fury Gold’s mineral properties and/or interests may be subject to various land payments, royalties and/or work commitments. Failure by Fury Gold to meet its payment obligations or otherwise fulfill its commitments under these agreements could result in the loss of related property interests.
Environmental Regulatory, Health & Safety Risks
Fury Gold’s operations are subject to environmental regulations promulgated by government agencies from time to time. Environmental legislation and regulation provide for restrictions and prohibitions on spills, releases or emissions of various substances produced in association with certain exploration industry operations, such as from tailings disposal areas, which would result in environmental pollution. A breach of such legislation may result in the imposition of fines and penalties. In addition, certain types of operations require the submission and approval of environmental impact assessments. Environmental legislation is evolving in a manner which means stricter standards, and enforcement, fines and penalties for non-compliance are more stringent. Future legislation and regulations could cause additional expenses, capital expenditures, restrictions, liabilities and delays in exploration of any of Fury Gold’s properties, the extent of which cannot be predicted. Environmental assessments of proposed projects carry a heightened degree of responsibility for companies and directors, officers and employees. The cost of compliance with changes in governmental regulations has a potential to reduce the profitability of operations.
Although Fury Gold believes its operations are in compliance in all material respects with all relevant permits, licenses and regulations involving worker health and safety as well as the environment, there can be no assurance regarding continued compliance or ability of the Company to meet stricter environmental regulation, which may also require the expenditure of significant additional financial and managerial resources.
Moreover, mining companies are often targets of actions by non-governmental organizations and environmental groups in the jurisdictions in which they operate. Such organizations and groups may take actions in the future to disrupt Fury Gold’s operations. They may also apply pressure to local, regional and national government officials to take action which may be adverse to Fury Gold’s operations. Such actions could have an adverse effect on Fury Gold’s ability to advance is projects and, as a result on its operations and financial performance.
Relationships with Local Communities and Indigenous Organizations
Negative relationships with Indigenous and local communities could result in opposition to the Company’s projects. Such opposition could result in material delays in attaining key operating permits or make certain projects inaccessible to the Company’s personnel. Fury Gold respects and engages meaningfully with Indigenous and local communities at all of its operations. Fury Gold is committed to working constructively with local communities, government agencies and Indigenous groups to ensure that exploration work is conducted in a culturally and environmentally sensitive manner.
Fury Gold believes its operations can provide valuable benefits to surrounding communities, in terms of direct employment, training and skills development and other benefits associated with ongoing community support. In addition, Fury Gold seeks to maintain its partnerships and relationships with local communities, including Indigenous peoples, and stakeholders in a variety of ways, including in-kind contributions, volunteer time, sponsorships and donations. Notwithstanding the Company’s ongoing efforts, local communities and stakeholders could become dissatisfied with its activities or the level of benefits provided, which could result in civil unrest, protests, direct action or campaigns against it. Any such occurrence could materially and adversely affect the Company’s business, financial condition or results of operations.
Environmental Protection
All phases of the Company’s operations are subject to treaty provision and federal, provincial and local environmental laws and regulations. These provisions, laws and regulations address, among other things, the maintenance of air and water quality standards, land reclamation, the generation, transportation, storage and disposal of solid and hazardous waste, and the protection of natural resources and endangered species. Fury Gold has expanded significant financial and managerial resources to comply with environmental protection laws, regulations and permitting requirements in each jurisdiction where it operates. Fury Gold’s exploration and drilling projects operate under various operating and environmental permits, licenses and approvals that contain conditions that must be met. Failure to obtain such permits, licenses and approvals and/or meet any conditions set forth therein could have a material adverse effect on Fury Gold’s financial conditions or results of operations. Environmental hazards may exist on the Company’s properties which are unknown to the Company at present and were caused by previous or existing owners or operators of the properties, for which the Company could be held liable.
Although Fury Gold believes its operations are in compliance, in all material respects, with all relevant permits, licenses and regulations involving worker health and safety as well as the environment, there can be no assurance regarding continued compliance or ability of Fury Gold to meet potentially stricter environmental regulation, which may also require the expenditure of significant additional financial and managerial resources.
Fury Gold cannot be certain that all environmental permits, licenses and approvals which it may require for its future operations will be obtainable on reasonable terms or that such laws and regulations would not have an adverse effect on any mining project that it might undertake. To the extent such permits, licenses and approvals are required and are not obtained, Fury Gold may be delayed or prohibited from proceeding with planned exploration or development of its projects, which would adversely affect Fury Gold’s business, prospects and operations.
Failure to comply with applicable laws, regulations and permitting requirements may result in enforcement actions including orders issued by governmental, regulatory or judicial authorities causing operations to cease or be curtailed, and may include corrective measures requiring capital expenditures, installation of additional equipment or remedial actions. Parties engaged in mining operations may be required to compensate those suffering loss or damage by reason of the mining activities and may have civil or criminal fines or penalties imposed upon them for violation of applicable laws or regulations. Amendments to current provisions, laws and regulations and permits governing operations and activities of mining companies, or more stringent implementation thereof, could have a material adverse impact on Fury Gold and cause increases in capital expenditures or exploration costs, reduction in levels of exploration or abandonment or delays in the development of mining properties.
Moreover, mining companies are often targets of actions by non-governmental organizations and environmental groups in the jurisdictions in which they operate. Such organizations and groups may take actions in the future to disrupt Fury Gold’s operations. They may also apply pressure to local, regional and national government officials to take actions which may be adverse to Fury Gold’s operations. Such actions could have an adverse effect on Fury Gold’ ability to advance its projects and, as a result, on its financial position and results.
Climate Change
Fury Gold recognizes climate change as an international concern. The effects of climate change or extreme weather events may cause prolonged disruption to economies. Furthermore, increased regulation of greenhouse gas emissions (including in the form of carbon taxes or other charges) may adversely affect the Company’s operations and that related legislation is becoming more stringent.
As a junior explorer Fury does not have operations which contribute significant green house gases relative the operations of a producing mining company. Fury Gold is focused on operating in a manner that minimizes environmental impacts of its activities; however, environmental impacts from exploration and drilling activities are inevitable. The physical risks of climate change that may impact the Company’s operations are highly uncertain and may be particular to the unique geographic circumstances associated with each of its operations. Such physical risks include, but are not limited to, extreme weather events, wildfires, resource shortages, changes in rainfall and storm patterns and intensities, water shortages, changing sea levels and changing temperatures. There may also be supply chain implications in getting supplies to the Company’s operations, including transportation issues. Fury Gold makes efforts to mitigate climate risks by ensuring that extreme weather conditions are included in its emergency response plans. However, there is no assurance that the response will be effective, and the physical risks of climate change will not have an adverse effect on the Company’s operations and profitability.
Changes in Government Mining, Permitting, Environmental, Regulations
In addition to climate change, other changes in government regulations or the application thereof and the presence of unknown environmental hazards on any of Fury Gold’s mineral properties may result in significant unanticipated compliance and reclamation costs. Government regulations and treaty provisions relating to mineral rights tenure, permission to disturb areas and the right to operate can adversely affect Fury Gold.
Fury Gold may not be able to obtain all necessary licenses and permits that may be required to carry out exploration on any of its projects. Obtaining the necessary governmental permits is a complex, time consuming and costly process. The duration and success of efforts to obtain permits are contingent upon many variables not within our control. Obtaining environmental permits may increase costs and cause delays depending on the nature of the activity to be permitted and the interpretation of applicable requirements implemented by the permitting authority. There can be no assurance that all necessary approvals and permits will be obtained and, if obtained, that the costs involved will not exceed those that we previously estimated. It is possible that the costs and delays associated with the compliance with such standards and regulations could become such that we would not proceed with the development or operation.
Competitive Conditions
Fury Gold’s activities are directed towards exploration, evaluation and development of mineral deposits. The mineral exploration industry is competitive and Fury Gold will be required to compete for the acquisition of mineral permits, claims, leases and other mineral interests for operations, exploration and development projects. As a result of this competition Fury Gold may not be able to acquire or retain prospective development projects, technical experts that can find, develop and mine such mineral properties and interests, workers to operate its mineral properties, and capital to finance exploration, development and future operations. The Company competes with other mining companies, some of which have greater financial resources and technical facilities, for the acquisition of mineral property interests, the recruitment and retention of qualified employees; and for investment capital with which to fund its projects. If Fury Gold is unable to successfully compete in its industry it could have a material adverse effect on the Company’s results of operations and financial condition.
Local Community Uncertainties
Fury Gold’s operations at the Committee Bay Project are located in Nunavut, and, as such, its operations are exposed to various levels of political, economic and other risks and uncertainties inherent in operating in such jurisdictions. Risks and uncertainties of operating in Nunavut may vary from time to time, but are not limited to a limited local workforce, poor infrastructure, a complex regulatory regime and harsh weather. Moreover, Fury Gold’s operations at the Eau Claire Project are located within the Eeyou Istchee James Bay region, which is subject to a modern treaty with the Cree Nation. The treaty identifies land use categories across the region and communities of interest within the Cree Nations which will be consulted with during development of mineral projects in the Eau Claire Project area.
Acquisitions May Not Be Successfully Integrated
Fury Gold undertakes evaluations from time to time of opportunities to acquire additional mining assets and businesses. Any such acquisitions may be significant in size, may change the scale of the Company’s business, may require additional capital, and/or may expose the Company to new geographic, political, operating, financial and geological risks.
Fury Gold recently entered into an arrangement agreement (the “Arrangement Agreement”) to acquire 100% of Quebec Precious Metals Corporation. (“QPM”) for approximately $5.1 million payable in common shares of Fury Gold. Completion of the acquisition of QPM under the Arrangement Agreement remains subject to the approval of QPM’s shareholders, final court approval under the Canada Business Corporations act and satisfaction of other customary conditions to closing. Accordingly, there is no assurance that this acquisition will be completed as planned.
Fury Gold’s success in its acquisition activities depends on its ability to identify suitable acquisition candidates, acquire them on acceptable terms, and integrate their operations successfully. Any acquisitions would be accompanied by risks such as: (i) a significant decline in the relevant metal price after Fury Gold commits to complete an acquisition on certain terms; (ii) the quality of the mineral deposit acquired proving to be lower than expected; the difficulty of assimilating the operations and personnel of any acquired companies; (iii) the potential disruption of Fury Gold’s ongoing business; (iv) the inability of management to realize anticipated synergies and maximize the financial and strategic position of Fury Gold; (v) the failure to maintain uniform standards, controls, procedures and policies; (vi) the impairment of relationships with employees, customers and contractors as a result of any integration of new management personnel; and (vii) the potential unknown liabilities associated with acquired assets and businesses.
Changes in the Market Price of Common Shares
The Common Shares are listed on the TSX and the NYSE American. The price of Common Shares is likely to be significantly affected by short-term changes in the gold price or in its financial condition or results of operations as reflected in its quarterly earnings reports. Other factors unrelated to Fury Gold’s performance that may have an effect on the price of Common Shares and may adversely affect an investor’s ability to liquidate an investment and consequently an investor’s interest in acquiring a significant stake in Fury Gold include: a reduction in analyst coverage by investment banks with research capabilities, a drop in trading volume and general market interest in Fury Gold’s securities, a failure to meet the reporting and other obligations under relevant securities laws or imposed by applicable stock exchanges could result in a delisting of the Common Shares and a substantial decline in the price of the Common Shares that persists for a significant period of time.
Properties May Be Subject to Defects in Title
Fury Gold has investigated its rights to explore and exploit its projects and, to the best of its knowledge, its rights are in good standing. However, no assurance can be given that such rights will not be revoked, or significantly altered, to Fury Gold’s detriment. There can also be no assurance that Fury Gold’s rights will not be challenged or impugned by third parties.
Some of Fury Gold’s mineral claims may overlap with other mineral claims owned by third parties which may be considered senior in title to the Fury Gold mineral claims. The junior claim is only invalid in the areas where it overlaps a senior claim. Fury Gold has not determined which, if any, of the Fury Gold mineral claims is junior to a mineral claim held by a third party. Although Fury Gold is not aware of any existing title uncertainties with respect to any of its projects, there is no assurance that such uncertainties will not result in future losses or additional expenditures, which could have an adverse impact on Fury Gold’s future cash flows, earnings, results of operations and financial condition.
Reliance on Contractors and Experts
In various aspects of its operations, Fury Gold relies on the services, expertise and recommendations of its service providers and their employees and contractors, whom often are engaged at significant expense to the Company. For example, the decision as to whether a property contains a commercial mineral deposit and should be brought into production depends in large part upon the results of exploration programs and/or feasibility studies, and the recommendations of duly qualified third-party engineers and/or geologists. In addition, while Fury Gold emphasizes the importance of conducting operations in a safe and sustainable manner, it cannot exert absolute control over the actions of these third parties when providing services to Fury Gold or otherwise operating on Fury Gold’s properties. Any material error, omission, act of negligence or act resulting in environmental pollution, accidents or spills, industrial and transportation accidents, work stoppages or other actions could adversely affect the Company’s operations and financial condition.
Qualified and Experienced Employees, Management, and Board Members
Fury Gold’s future success is based on successfully attracting, training and developing employees at all levels of the company from Site Staff to Executive Management. This is especially true for professional geologists with the required skillset being available in the geographic areas that we operate in. The markets for highly skilled workers, as well as talented professionals and leaders in the mining and exploration industry are extremely competitive. The inability to meet our needs for skilled workers and talented professionals and leaders, whether through recruitment or internal training and development activities, could impact our ability to effectively implement our strategy. In addition to this, retaining qualified board members with diversified experience also brings valuable oversight and knowledge to the business.
Legal and Litigation Risks
All industries, including the exploration industry, are subject to legal claims, with and without merit. Defense and settlement costs of legal claims can be substantial, even with respect to claims that have no merit. Due to the inherent uncertainty of the litigation process, the resolution of any particular legal proceeding to which Fury Gold may become subject could have a material adverse effect on Fury Gold’s business, prospects, financial condition, and operating results. Defense and settlement of costs of legal claims can be substantial.
Risks Relating to Statutory and Regulatory Compliance
Fury Gold’s current and future operations, from exploration through development activities and commercial production, if any, are and will be governed by applicable laws, regulations and treaty obligations governing mineral claims acquisition, prospecting, development, mining, production, exports, taxes, labour standards, occupational health, waste disposal, toxic substances, land use, environmental protection, mine safety and other matters. Companies engaged in exploration activities and in the development and operation of mines and related facilities, generally experience increased costs and delays in production and other schedules as a result of the need to comply with applicable laws, regulations, treaty obligations and permits. Fury Gold has received all necessary permits for the exploration work it is presently conducting; however, there can be no assurance that all permits which Fury Gold may require for future exploration, construction of mining facilities and conduct of mining operations, if any, will be obtainable on reasonable terms or on a timely basis or at all, or that such laws and regulations would not have an adverse effect on any project which Fury Gold may undertake.
Failure to comply with applicable laws, regulations, treaty obligations and permits may result in enforcement actions thereunder, including the forfeiture of claims, orders issued by regulatory or judicial authorities requiring operations to cease or be curtailed, and may include corrective measures requiring capital expenditures, installation of additional equipment or costly remedial actions. Fury Gold may be required to compensate those suffering loss or damage by reason of its mineral exploration activities and may have civil or criminal fines or penalties imposed for violations of such laws, regulations, treaty obligations and permits. Fury Gold is not currently covered by any form of environmental liability insurance. See “ Insurance Risk” below.
Existing and possible future laws, regulations and permits governing operations and activities of exploration companies, or more stringent implementation thereof, could have a material adverse impact on Fury Gold and cause increases in capital expenditures or require abandonment or delays in exploration.
Insurance and Uninsurable Risks
Fury Gold is subject to a number of operational risks and may not be adequately insured for certain risks, including: accidents or spills, industrial and transportation accidents, which may involve hazardous materials, labour disputes, catastrophic accidents, fires, blockades or other acts of social activism, changes in the regulatory environment, impact of non-compliance with laws and regulations, natural phenomena such as inclement weather conditions, floods, earthquakes, ground movements, cave-ins, and encountering unusual or unexpected geological conditions and technological failure of exploration methods.
Limited Business History and No History of Earnings
Fury Gold has no history of operating earnings. The likelihood of success of Fury Gold must be considered in light of the problems, expenses, difficulties, complications and delays frequently encountered in connection with the establishment of its business. Fury Gold has limited financial resources and there is no assurance that additional funding will be available to it for further operations or to fulfill its obligations under applicable agreements. There is no assurance that Fury Gold will ultimately generate revenues, operate profitably, or provide a return on investment, or that it will successfully implement its plans.
Claims by Investors Outside of Canada
Fury Gold is incorporated under the laws of British Columbia. All of Fury Gold’s directors and officers, with the exception of Mr. Tim Clark, CEO of the Company who is a US resident, and all of the experts named herein, are residents of Canada or otherwise reside outside of the United States, and all or a substantial portion of their assets, and a substantial portion of Fury Gold’s assets, are located outside of the United States. As a result, it may be difficult for investors in the United States or outside of Canada to bring an action against directors, officers or experts who are not resident in the United States. It may also be difficult for an investor to enforce a judgment obtained in a United States court or a court of another jurisdiction of residence predicated upon the civil liability provisions of United States federal securities laws or other laws of the United States or any state thereof or the equivalent laws of other jurisdictions outside of Canada against those persons or Fury Gold.
No-Dividends Policy
No dividends on the Common Shares have been paid by Fury Gold to date. Payment of any future dividends, if any, will be at the discretion of the Board after taking into account many factors, including Fury Gold’s operating results, financial conditions, development and growth, and current and anticipated cash needs.
Disclosure and Internal Controls
Internal controls over financial reporting are procedures designed to provide reasonable assurance that transactions are properly authorized, assets are safeguarded against unauthorized or improper use, and transactions are properly recorded and reported. Disclosure controls and procedures are designed to ensure that information required to be disclosed by a company in reports filed with securities regulatory agencies is recorded, processed, summarized and reported on a timely basis and is accumulated and communicated to Fury Gold’s management, including its Chief Executive Officer and Chief Financial Officer, as appropriate, to allow timely decisions regarding required disclosure. A control system, no matter how well designed and operated, can provide only reasonable, not absolute, assurance with respect to the reliability of reporting, including financial reporting and financial statement preparation.
The Company documented and tested its internal controls over financial reporting during its most recent fiscal year in order to satisfy the requirements of Section 404 of the Sarbanes-Oxley Act (“SOX”). SOX requires an annual assessment by management and an independent assessment by the Company’s independent auditors of the effectiveness of the Company’s internal controls over financial reporting. As the Company is presently a “non-accelerated filer”, the Company’s independent auditors are not required to attest to the effectiveness of the Company’s internal control over financial reporting. While the Company’s management has assessed and made a statement to the effectiveness of the Company’s internal controls over financial reporting as at December 31, 2024, and the Company will be required to detail changes to our internal controls on a quarterly basis, the Company cannot provide assurance that the independent registered public accounting firm’s review process in assessing the effectiveness of our internal controls over financial reporting, if obtained, would not find one or more material weaknesses or significant deficiencies in the Company’s internal control over financial reporting.
The Company may fail to achieve and maintain the adequacy of its internal controls over financial reporting as such standards are modified, supplemented, or amended from time to time, and the Company may not be able to ensure that it can conclude on an ongoing basis that its internal controls over financial reporting are effective. The Company’s failure to maintain effective internal controls over financial reporting could result in the loss of investor confidence in the reliability of its financial statements, which in turn could harm the Company’s business and negatively impact the trading price of its common shares. In addition, any failure to implement required new or improved controls, or difficulties encountered in their implementation, could harm the Company’s operating results or cause it to fail to meet its reporting obligations. There can be no assurance that the Company will be able to remediate material weaknesses, if any, identified in future periods, or maintain all the controls necessary for continued compliance, and there can be no assurance that the Company will be able to retain sufficient skilled finance and accounting personnel, especially in light of the increased demand for such personnel among publicly traded companies. Future acquisitions of companies, if any, may provide the Company with challenges in implementing the required processes, procedures and controls in its acquired operations. Acquired companies may not have disclosure controls and procedures or internal control over financial reporting that are as thorough or effective as those required by the securities laws currently applicable to the Company.
No evaluation can provide complete assurance that the Company’s internal control over financial reporting will detect or uncover all failures of persons within the Company to disclose material information otherwise required to be reported. The effectiveness of the Company’s controls and procedures could also be limited by simple errors or faulty judgment. The challenges involved in implementing appropriate internal controls over financial reporting will likely increase with the Company’s plans for ongoing development of its business and this will require that the Company continues to improve its internal controls over financial reporting. Although the Company intends to devote substantial time and incur costs, as necessary, to ensure ongoing compliance, the Company cannot be certain that it will be successful in complying with SOX.
Cybersecurity Risks
Information systems and other technologies, including those related to the Company’s financial and operational management, and its technical and environmental date, are an integral part of the Company’s business activities. Network and information systems related events, such as computer hacking, cyber-attacks, computer viruses, works or other destructive or disruptive software, process breakdowns, denial of service attaches, or other malicious activities or any combination of the foregoing, or power outages, natural disasters, terrorist attacks or other similar events could result in damage to the Company’s property, equipment and date. These events also could result in significant expenditures to repair or replace damage property or information systems and/or to protect them from similar events in the future. Furthermore, any security breaches such as misappropriation, misuse, leakage, falsification, accidental release or loss of information contained in the Company’s information technology seems including personal and other data that could damage is reputation and require the Company to expend significant capital and other resources to remedy any such security breach. Insurance held by the Company may mitigate losses; however, in any such events or security breaches may not be sufficient to cover any consequent losses or otherwise adequately compensate the Company for disruptions to its business that may result and the occurrence of any such events or security breaches could have a material adverse effect on the Company’s operations and financial results. There can be no assurances that these events and/or security breaches will not occur in the future or not have an adverse effect on the Company’s operations and financial results.
Social Media Risks
As a result of social media and other web-based applications, companies today are at much greater risk of losing control over how they are perceived. Damage to Fury Gold’s reputation can be the result of the actual or perceived occurrence of any number of events, and could include any negative publicity, whether true or not. Although the Company places a great emphasis on protecting its image and reputation, it does not ultimately have direct control over how it is perceived by others. Reputation loss may lead to increased challenges in developing and maintaining community relations, decreased investor confidence and act as an impediment to the Company’s overall ability to advance its projects, thereby having a material adverse impact on the Company’s business, financial condition or results of operations.
Liabilities relating to Past Issuances of Flow-Through Shares
The Company has issued Flow-Through (or FT) Shares which are Canadian tax-incentivized common shares for initial purchasers of treasury common shares for which the rules require that the Company expend the FT Share issuance proceeds on exploration in Canada. FT Shares are sold pursuant to the requirements of Canadian tax legislation which incentivize investors to purchase these shares by allowing a deduction from income for their purchase price (aside from the tax aspects, FT Shares are in all respects ordinary common shares). Although the Company believes it will be able to incur the necessary amount of exploration expenditures as required by the Flow-Through Share subscription agreements, there is a risk that expenditures incurred by the Company may not be expended within the time limits, or that they will qualify as “Canadian exploration expenditures” (“CEE”) , as such term is defined in the Income Tax Act (Canada) (the “Tax Act”), or that any such resource expenses incurred will be reduced by other events including failure to comply with the provisions of the Flow-Through Share subscription agreements or of applicable income tax legislation.
If the Company does not renounce to Flow-Through Share subscribers CEE within 2024, or if there is a reduction in such amount renounced pursuant to the provisions of the Tax Act, the Company may need to indemnify such subscribers, on the terms included in the Flow-Through Share subscription agreements, for an amount equal to the amount of any tax payable or that may become payable under the Tax Act. There were $0.9 million remaining expenditures as of December 31, 2024, which are to be used by December 31, 2025, in connection with the requirement to incur CEE in 2025.
On June 13, 2024, the Company issued 5,320,000 FTS of the Company for gross proceeds of $5 million. The Company is required to deploy the remaining $0.9 million of CEE on or before December 31, 2025 in respect of this financing and the balance in 2025 and failure to do so will result in financial penalties.
The Company is a foreign private issuer which exempts us from complying with certain Exchange Act reporting requirements.
Under U.S. law, the Company is considered a “foreign private issuer” and will report under the Exchange Act as a non-U.S. company with foreign private issuer status. This means that, as long as the Company qualifies as a foreign private issuer under the Exchange Act, it will be exempt from certain provisions of the Exchange Act that are applicable to U.S. domestic public companies, including:
| ● |
the sections of the Exchange Act regulating the solicitation of proxies, consents, or authorizations in respect of a security registered under the Exchange Act; |
| ● |
the sections of the Exchange Act requiring insiders to file public reports of their stock ownership and trading activities and liability for insiders who profit from trades made in a short period of time; |
| ● |
the rules under the Exchange Act requiring the filing with the SEC of quarterly reports on Form 10-Q containing unaudited financial and other specified information, or current reports on Form 8-K, upon the occurrence of specified significant events. |
The Company intends to take advantage of these exemptions (or voluntarily comply with the requirements applicable to U.S. domestic public companies) until such time as it is no longer a foreign private issuer. The Company would cease to be a foreign private issuer at such time as more than 50% of the Company’s outstanding voting securities are held by U.S. residents and any of the following three circumstances applies: (i) the majority of the Company’s executive officers or directors are U.S. citizens or residents; (ii) more than 50% of the Company’s assets are located in the USA; or (iii) the Company’s business is administered principally in the USA.
If the Company fails to maintain its foreign private issuer status and decides, or is required, to register as a U.S. domestic issuer, the regulatory, insurance and compliance costs to the Company will be significantly more than the costs incurred as a foreign private issuer. In such event, the Company would not be eligible to use foreign issuer forms and would be required to file periodic and current reports and registration statements on U.S. domestic issuer forms with the SEC, which are generally more detailed and extensive than the forms available to a foreign private issuer.
It may be difficult to enforce judgments or bring actions outside the United States against the Company and certain of its directors.
The Company is a British Columbia, Canada corporation and all but one of its officers and directors are neither citizens nor residents of the USA. A substantial part of the assets of several of these persons are located outside the USA. As a result, it may be difficult or impossible for an investor:
| ● |
to enforce in courts outside the U.S. judgments obtained in U.S. courts based upon the civil liability provisions of U.S. federal securities laws against these persons and the Company; or |
| ● |
to bring in courts outside the U.S. an original action to enforce liabilities based upon U.S. federal securities laws against these persons and the Company. |
We may be a “passive foreign investment company” (“PFIC”), which may have adverse U.S. federal income tax consequences for U.S. investors.
We believe that we were classified as a PFIC for our most recently completed tax year, and based on current business plans and financial expectations, we expect that we may be a PFIC for our current tax year and subsequent tax years. If we are a PFIC for any year during a U.S. taxpayer’s holding period of Common Shares, then such U.S. taxpayer generally will be required to treat any gain realized upon a disposition of the Common Shares or any so-called “excess distribution” received on its Common Shares as ordinary income, and to pay an interest charge on a portion of such gain or distribution. In certain circumstances, the sum of the tax and the interest charge may exceed the total amount of proceeds realized on the disposition, or the amount of excess distribution received, by the U.S. taxpayer. Subject to certain limitations, these tax consequences may be mitigated if a U.S. taxpayer makes a timely and effective QEF Election (as defined below) or a Mark-to-Market Election (as defined below). A U.S. taxpayer who makes a timely and effective QEF Election generally must report on a current basis its share of our net capital gain and ordinary earnings for any year in which we are a PFIC, whether or not we distribute any amounts to our shareholders. However, U.S. taxpayers should be aware that there can be no assurance that we will satisfy the record keeping requirements that apply to a qualified electing fund, or that we will supply U.S. taxpayers with information that such U.S. taxpayers require to report under the QEF Election rules, in the event that we are a PFIC and a U.S. taxpayer wishes to make a QEF Election. Thus, U.S. taxpayers may not be able to make a QEF Election with respect to their Common Shares. A U.S. taxpayer who makes the Mark-to-Market Election generally must include as ordinary income each year the excess of the fair market value of the Common Shares over the taxpayer’s basis therein. This paragraph is qualified in its entirety by the discussion below under the heading “Certain United States Federal Income Tax Considerations — Passive Foreign Investment Company Rules.” Each potential investor who is a U.S. taxpayer should consult its own tax advisor regarding the tax consequences of the PFIC rules and the acquisition, ownership, and disposition of the Common Shares.
Item 4 — Information on the Company
A. History and development of the company
Name, Address and Incorporation
The Company was incorporated under the British Columbia Business Corporations Act (the “BCBCA”) on June 9, 2008, under the name Georgetown Capital Corp. The Company was a Capital Pool Company under the policies of the TSX Venture Exchange (the “TSXV”) and, accordingly, on February 23, 2011, the Company completed a qualifying transaction (the “Qualifying Transaction”) with Full Metal Minerals USA Inc., a wholly owned subsidiary of Full Metals Minerals Ltd. Pursuant to the Qualifying Transaction, the Common Shares began trading on the TSXV. On October 15, 2013, the Company changed its name to Auryn Resources Inc. On November 1, 2016, the Company completed its graduation to the TSX and the Common Shares began trading on the TSX. In connection with the Company’s graduation to the TSX, the Common Shares were voluntarily delisted from the TSXV. On July 17, 2017, the Common Shares also commenced trading on the NYSE American.
Fury Gold is a reporting issuer in all of the provinces and territories of Canada. In addition, the Common Shares are registered under Section 12(b) of the U.S. Exchange Act by virtue of being listed on the NYSE American. The Company’s legal registered and records office is in care of its attorneys at 1500-1055 West Georgia Street Vancouver, BC, V6E 4N7 and the mailing address is 401 Bay Street, 16th Floor, Toronto, Ontario, M5H 2Y4. The SEC maintains a web site that contains reports and other information regarding registrants that file electronically with the SEC at http://www.sec.gov.
2020 Merger and Reorganization
On October 9, 2020, the Company concurrently acquired all of the then-issued and outstanding shares of Eastmain Resources Inc. (“Eastmain”) while distributing (or “spinning out”) shares of two subsidiaries to its shareholders (“Spinco Transactions”) in accordance with the terms and conditions of the arrangement agreement dated August 10, 2020 (the “Arrangement Agreement”). The Spinco Transactions resulted in the divestment of the Company’s South American exploration assets to focus on Canadian mineral projects. On October 5, 2020, the Eastmain Transaction and the Spinco Transactions received the approval of both the Company’s and Eastmain’s shareholders, and on October 7, 2020, the British Columbia Supreme Court and the Ontario Superior Court of Justice approved the Reorganization Arrangement and the Eastmain Arrangement, respectively, and both courts issued final orders approving the Eastmain Transaction and the Spinco Transactions. In accordance with the terms of the Arrangement Agreement, the Company changed its name to “Fury Gold Mines Limited” pursuant to a certificate of change of name dated October 8, 2020.
Immediately following the closing of the Transaction, the Company’s ticker symbol for the Common Shares was changed to “FURY” effective October 12, 2020 on the NYSE American and October 13, 2020 on the TSX. Eastmain’s shares were delisted from the TSX and removed from the OTCQB after the end of trading on October 9, 2020. Immediately following the closing of the Eastmain Arrangement, Eastmain became a wholly-owned subsidiary of Fury Gold.
2022 Sale of Homestake Mineral Project to Dolly Varden Silver Corporation for Dolly Varden Shares
On February 25, 2022, the Company announced the completion of the sale of the Homestake Ridge project to Dolly Varden Silver Corporation (“Dolly Varden”), a publicly traded corporation listed on the TSX Venture Exchange. Pursuant to the Homestake Purchase Agreement entered into on December 6, 2021, Dolly Varden acquired 100% of Homestake Resource Corporation from Fury in exchange for a $5 million cash payment and the issuance of 76,504,590 common shares of Dolly Varden. On October 13, 2022, the Company reduced its holdings to 59,504,590 by selling 17 million common shares, representing 22.2% of the Company’s interest in Dolly Varden, for gross proceeds of $6.8 million, and resulting in the Company’s interest in Dolly Varden being reduced to 25.8%. Following further dilutive equity financings completed by Dolly Varden on December 22, 2022 and November 2, 2023, Fury Gold held 59,504,590 common shares, representing a 22.03% interest in Dolly Varden as at December 31, 2023. The Company's interest in Dolly Varden was further reduced by 5,450,000 shares in a March 2024 private sale, and by 3,000,000 shares in an October 2024 private sale, resulting in in the Company’s interest being 16.11% in Dolly Varden as at December 31, 2024.
2022 to 2024 Unification of the Éléonore South Gold Project
On September 12, 2022, the Company and its joint venture partner Newmont Corporation (“Newmont”), through their respective subsidiaries, completed the acquisition of the remaining approximately 23.77% participating interest of Azimut Exploration Inc. in the Éléonore South Joint Venture (“ESJV”), on a pro-rata basis. Following the completion of the transaction, the 100% ESJV participating interests were then held 50.022% by the Company and 49.978% by Newmont with Fury remaining the operator under an amended and restated joint operating agreement.
On February 29, 2024, the Company completed the purchase of Newmont’s 49.978% interest in the Éléonore South Gold Project in Quebec (“Éléonore South”) for $3,000,000. As a result of the consolidation, Fury Gold is the 100% owner of Éléonore South. The Company also acquired Newmont’s 30,392,372 common shares or 10.98% of Sirios Resources Inc. (“Sirios”) as part of the transaction for an additional $1,300,000. Sirios shares have been acquired for investment purposes, and Fury will evaluate its investment in Sirios on an ongoing basis with respect to any possible additional purchases or dispositions. In March 2024, the Company sold 1,514,000 common shares of Sirios, resulting in the Company’s interest in Sirios being reduced to 10.4%. Following further dilutive equity financings completed by Sirios in 2024, the Company’s holding interest in Sirios as at December 31, 2024 was less than 9.9%.
Fury Gold conducts its business through a number of wholly-owned subsidiaries depicted in a diagram under the Organizational structure section. It owns 25% of a shared service provider company, Universal Mineral Services Ltd. (with three other junior resource explores each owning 25%) which is further discussed under “Related Party Transactions” below.
Significant Events and Highlights
2022
2022 Eau Claire Exploration Program
In October 2022, the Company completed the initial drilling program at Eau Claire and the Percival prospect, completing a total of approximately 52,700m from 2020-2022, with the final 17,700m completed in 2022. Additionally, the company completed a B-horizon soil sampling program at Lac Clarkie, a property adjacent to the Eau Claire project.
The Expansion Drill Program, Exploration Drill Program and the Regional Exploration Program are discussed below under “Eau Claire Project – 2023 Eau Claire Exploration Program”.
2022 Changes to Management and the Board
On March 9, 2022, the Company announced the appointment of Bryan Atkinson, P.Geo, to Senior Vice President (SVP), Exploration and Michael Henrichsen, P.Geo, to Chief Geological Officer, effective immediately. The Company also announced that Salisha Ilyas, Vice President of Investor Relations, has resigned to pursue other opportunities.
On May 24, 2022, the Company announced that the Company’s Board Chair, Ivan Bebek, was retiring from the Board, effective June 29, 2022 and would be an advisor.
2022 Financing
On April 14, 2022, the Company completed a non-brokered private placement with two placees, who include a Canadian corporate investor and a US institutional investor, for a private placement sale of 13.75 million common shares of the Company at a price of $0.80 per share for gross proceeds of $11,000,000.
2022 Completion of Sale of Homestake Ridge Project to Dolly Varden and Investor Rights Agreement
On February 25, 2022, the Company completed the sale of the Homestake Ridge Project to Dolly Varden. Pursuant to the agreement entered into on December 6, 2021 (“Homestake Purchase Agreement”), Dolly Varden purchased 100% of the shares of the Company’s subsidiary, Homestake Resource Corporation for a $5,000,000 cash payment and the issuance of 76,504,590 common shares of Dolly Varden (the “Homestake Transaction”). As a result of the sale, the Company has an indirect economic interest in the Homestake Ridge Project through its ownership of shares of Dolly Varden but does not have legal control over either Dolly Varden or the Homestake Ridge Project.
In connection with the Homestake Transaction, Dolly Varden and Fury Gold entered into an investor rights agreement (the "Homestake Investor Rights Agreement") pursuant to which Fury Gold has the following rights, and is subject to the following obligations:
| (i) |
Fury Gold will have the right to appoint two nominees to the Dolly Varden board so long as Fury Gold owns greater than 20% of the Dolly Varden common shares outstanding. As Fury Gold now owns less than 20% but greater than 10% of the Dolly Varden shares outstanding, Fury Gold’s nomination right has been reduced to the right to appoint one nominee to the Dolly Varden board. Tim Clark, the Chief Executive Officer of Fury Gold, and Michael Henrichsen, the Chief Geological Officer of Fury Gold, joined the Dolly Varden Board upon closing of the Homestake Transaction. As Fury Gold now owns less than 20% but greater than 10% of the Dolly Varden shares outstanding, only Mr. Clark remains a director. |
| (ii) |
Fury Gold will have the right to appoint one member to Dolly Varden’s technical committee for the purpose of providing non-binding advice and recommendations to the Dolly Varden board for so long as Fury Gold is entitled to appoint one nominee to the Dolly Varden board. |
| (iii) |
Fury will have pre-emptive rights to maintain its ownership percentage in Dolly Varden for so long as Fury Gold owns more than 10% of the outstanding Dolly Varden common shares, subject to certain carve-outs and top-up rights. |
| (iv) |
Fury Gold will not sell the Dolly Varden Shares during the one-year hold period following closing and will provide to Dolly Varden the right to direct the sale of any DV Shares proposed to be sold by Fury Gold after the expiry of the initial one-year hold period. |
| (v) |
Fury Gold will, for the initial two-year period following closing, and subject to Fury Gold continuing to hold at least 10% of Dolly Varden’s outstanding shares, vote its shares in accordance with Dolly Varden management’s recommendations at each meeting of the shareholders of Dolly Varden, subject to exceptions for certain excluded matters, including special resolutions, minority shareholder votes required pursuant to Multilateral Instrument 61-101 and matters that would materially and adversely impact Fury Gold disproportionately. |
| (vi) |
Fury Gold will not, for the initial three-year period following Closing, and subject to Fury Gold continuing to hold at least 10% of Dolly Varden’s outstanding shares, acquire additional securities of Dolly Varden, solicit proxies separately from any Dolly Varden board approved proxy circular or otherwise seek to control management, the board or the policies of Dolly Varden. |
2022 Partial Sale of Dolly Varden Shareholdings
On October 3, 2022, the Company announced that it had entered into a non-brokered sale agreement to sell 17 million common shares of Dolly Varden at $0.40 per share, representing approximately 7.4% of the outstanding common shares of Dolly Varden. The gross proceeds received by the Company upon the close of the transaction on October 13, 2022, was $6.8 million. At December 31, 2022, the Company held a 23.5% interest in Dolly Varden.
2023
2023 Eau Claire Exploration Program
On February 13, 2023, Fury Gold provided an update on targeting the wholly owned Lac Clarkie project immediately to the east of its 100% owned Eau Claire project in the Eeyou Istchee Territory in the James Bay region of Quebec. The Company has defined a total of eight gold targets through the completion of a B-horizon soil sampling program. Six of the targets lie along the Cannard Deformation Zone, which hosts numerous gold occurrences along its >100 kilometre (km) mapped extent, including Fury’s Eau Claire Deposit and Percival Property.
In April 2023, Fury Gold commenced a drilling program at the Eau Claire Deposit, comprising of 10,000 to 15,000 metres, with the goals of i) continuing expansion of the high-grade Eau Claire resource; ii) following up on the 2022 success at the Percival Prospect 14 km to the east of Eau Claire; and iii) advancing several early-stage exploration targets along the Cannard Deformation Zone to the drill ready stage.
On July 10, 2023, the Company announced its 2023 summer exploration program and the restart of all exploration activities, which had been interrupted since June 5, 2023, due to a governmental emergency fire evacuation order.
On August 3, 2023, Fury announced results for the first three 2023 core drill holes at the high-grade Eau Claire gold project. The 2023 drill program focused on the continued expansion of the Hinge Target located immediately west of the Eau Claire Deposit. Drilling at the Hinge Target continues to return multiple stacked zones of gold mineralization from each drill hole, including 5.0m of 3.6 g/t Au within a broader interval of 14.0m of 2.37 g/t Au. Additional drill intercepts include 6.5m of 2.66 g/t Au, 6.0m of 2.77 g/t Au and 1.0m of 10.35 g/t Au.
On October 3, 2023, the Company reported the results for an additional two infill core drill holes from the Hinge Target at the Eau Claire Project. The 2023 drill program continues to focus on infill drilling at the Hinge Target located immediately west of the Eau Claire Deposit. Every hole completed at the Hinge Target to date has intercepted two corridors of stacked gold-bearing quartz tourmaline veins and alteration, including 3.5m of 5.73 g/t gold and 11.27 g/t Tellurium and 7.43g/t gold over 2.5m within a broader interval of 4.65g/t gold and 8.72 g/t Tellurium over 4.5m. Drill holes 23EC-065 and 23EC-068 represent the continuation of a series of infill drill holes designed to tighten up the spacing of the 2022 Hinge Target drilling to a nominal spacing of 60-80m. The stacked intercepts through these new holes continue to exhibit the overall strength of the mineralized system within the Hinge Target.
On November 28, 2023, the Company reported additional results from the 2023 infill drilling program at the Hinge Target at the Eau Claire Project. Drilling continues to intercept multiple zones of gold mineralization, including 5.5m of 4.52 g/t gold and 3.0m of 3.34 g/t gold from 23-EC-069; 1.0m of 20.20 g/t gold and 3.5m of 3.51 g/t gold from 23EC-070; 1.0m of 19.55 g/t gold from 23EC-066; and 3.5m of 3.82 g/t gold from 23EC-067.
On January 17, 2024, the Company reported results from the 2023 drilling program at the Hinge Target at the Eau Claire Project. Highlights from the seven drill holes include 31.77 g/t gold over 3.50m from 23EC-077; 65.0 g/t gold over 0.50m and 14.25 g/t gold over 1.0m from 23EC-074; 2.56 g/t gold over 7.50m from 23EC-068; and 3.41 g/t gold over 6.50m and 5.0 g/t gold over 3.50m from 23EC-075.
On February 6, 2024, the Company announced the final set of results from the 12,000m 2023 drilling program at the Hinge Target, part of the high-grade Eau Claire Project. Highlights from these last five drill holes include 17.62 g/t gold over 3.50m, including 29.80 g/t gold over 2m, and 22.20 g/t gold over 0.50m from 23EC-079; and 5.49 g/t gold over 3.50m from 23-EC-078. The reported intercepts from drill hole 23EC-082 of 17.62 g/t gold over 3.50m is within 135m of surface and is completely open to surface and to the west, above the rest of the Hinge Target.
2023 Changes to Management and the Board
On February 22, 2023, the Company announced that its Board of Directors has appointed Brian Christie as an Independent Director, effective immediately. Mr. Christie most recently served as Vice President, Investor Relations at Agnico Eagle Mines Limited, prior to which Mr. Christie worked for over 17 years as a precious and base metals mining analyst and brings with him extensive experience in the capital markets and the mining industry. Mr. Christie holds a BSc. in Geology (University of Toronto) and an MSc. in Geology (Queen’s University) and is a member of the Canadian Investor Relations Institute (CIRI) and the National Investor Relations Institute (NIRI). On May 15, 2023, the Company announced the appointment of Mr. Christie as Board Chair, replacing Mr. Jeffrey Mason, who was appointed Board Chair on January 11, 2023 and continues to serve as Independent Director of Fury Gold. The Company also announced that Michael Henrichsen, Chief Geological Officer, resigned from his role to pursue other interests.
On June 23, 2023, Phil van Staden, having previously served as the Company’s Corporate Controller since 2020, was appointed Interim Chief Financial Officer of the Company and brings over 15 years of diverse international experience in various accounting roles and industries throughout South Africa and Canada. He holds B. Commerce and B. Commerce Honours degrees, respectively, from the University of Pretoria and the University of South Africa. Mr. van Staden took over from Dr. Lynsey Sherry, who had been the Chief Financial Officer since November 2020. Mr. van Staden was appointed (permanent) Chief Financial Officer effective January 1, 2024.
On September 5, 2023 Fury announced that it had appointed Ms. Isabelle Cadieux as an Independent Director, effective immediately. Ms. Cadieux, a professional geologist, brings more than 30 years of experience in mineral exploration and financing in the mining sector. She last held the position of Managing Director, Investment at SIDEX, a Québec institutional fund that finances exploration companies, including Fury, and continues to hold shares in Fury, where she served from 2001 until 2023. She holds an M.Sc. in Mineral Exploration (MINEX) from McGill University and a B.Sc. in Geology from the University of Ottawa. Ms. Cadieux acted as President of the Ordre des géologues du Québec (OGQ) in 2008, sat on the Board of Directors from 2005 to 2010, and was Director of the Canadian Council of Professional Geoscientists from 2007 to 2011 where she represented the OGQ. From 2011 to 2016, she was a member of the Executive Committee of the UQAT-UQAM Chair in Mining Entrepreneurship. Throughout her career, she has been involved in various sector-related organizations, among others the Québec Mineral Exploration Association (AEMQ), the Canadian Institute of Mines and Metallurgy (CIM), Minalliance and Mine d’Avenir.
2023 Financings
In March 2023, the Company closed a bought-deal private placement (the “March 2023 Offering”) of 6,076,500 Common Shares of the Company that qualify as “flow-through shares” (the “FT Shares”) at a price of $1.44 per FT Share for aggregate gross proceeds of approximately $8.750 million. The proceeds from the March 2023 Offering were used to incur “flow-through mining expenditures” in connection with the exploration of the Company’s Eau Claire and ESJV projects. As at December 31, 2023, the Company had approximately $544,000 available to incur flow-through mining expenditures before December 31, 2024.
2023 Corporate developments
On October 12, 2023, the Company filed a short form base shelf prospectus (the "Shelf Prospectus") with the securities commissions or similar regulatory authorities in all of the provinces and territories of Canada and has filed a corresponding registration statement on Form F-10 with the United States Securities and Exchange Commission. As a result of the completion of these filings, the Company is permitted to publicly offer up to $75 million of common shares, subscription receipts, warrants, and units or any combination thereof to investors in Canada and the United States during the 25-month period from October 12, 2023, that the Shelf Prospectus is effective.
2024
2024 Exploration Program
On June 28, 2024, the Company announced the filing of a Canadian law compliant Technical Report for the Increased Mineral Resource Estimate for the high-grade Eau Claire deposit as well as a Maiden Mineral Resource Estimate for the Percival deposit located in the Eeyou Istchee Territory of the James Bay region of Quebec. The Eau Claire project now contains a combined mineral resource of 1.16Moz gold (Au) at a grade of 5.64 g/t Au in the Measured and Indicated category as well as an additional 723koz gold at a grade of 4.13 g/t Au in the Inferred Category. Gold mineralization remains open for expansion in all directions at both the Eau Claire and Percival deposits through additional drilling.
On September 9, 2024, the Company announced results from the diamond drilling program at the greenfield Serendipity Prospect on its wholly owned Eau Claire project in the Eeyou Istchee Territory in the James Bay region of Quebec. The Serendipity Prospect lies within the same prospective geological setting as the Company’s Percival Deposit. In total 3,871 metres (m) were drilled in 10 holes across five distinct targets at Serendipity. Drill hole 24SD-009 targeted a biogeochemical anomaly overlying the easterly extension of the structure controlling the mineralization at Serendipity and intercepted 12.16 g/t gold over 3.0 m (Figures 1 and 2, Table 1). Drill hole 24SD-002 targeted a biogeochemical anomaly at the hinge of an interpreted fold within volcanic stratigraphy and intercepted 5.27 g/t gold over 1.0 m. The two noted intercepts above are separated by over 2 kilometres (km) indicating the potential for a large mineralizing system at Serendipity. The Company is in the process of planning follow-up drilling at Serendipity for 2025.
On October 7, 2024, the Company announced the discovery of high-grade lithium outcrop on the western claim block of its 100% owned Éléonore South project in the Eeyou Istchee Territory in the James Bay region of Quebec. The outcrop sampling program targeted the historical Fliszar showing lepidolite bearing pegmatite as well as new rock exposures over an area of approximately 1000 x 500 metres (m) resulting in the collection of 34 samples. Seven samples returned high-grade values above 1.75% lithium oxide (Li2O) with a peak value of 4.67% Li2O. The Company’s focus remains on the gold prospectivity of the Éléonore South project. However, the announced lithium results provide additional exploration targets as the overall project is advanced.
On October 24, 2024, the Company announced the results from the summer exploration program at its 100% Committee Bay project in the Kitikmeot Region of Nunavut. The 2024 exploration program defined three drill ready shear zone hosted targets advanced through a combination of till sampling, rock sampling and geological mapping:
| ■ |
Three Bluffs Shear, where drilling in 2021 intercepted 13.93 g/t Au over 10 metres (m) (see news release dated December 1, 2021); |
| ■ |
Raven Shear where 7 rock samples have averaged 16.12 g/t gold; and |
| ■ |
Burro West where a 300 by 300 m discrete >90th percentile gold in till anomaly has been defined with a peak value of 50 ppb gold. |
On November 12, 2024, the Company announced the finalization of drill targeting at the Éléonore South gold project in the Eeyou Istchee Territory in the James Bay Region of Quebec. Drilling will target robust geochemical gold anomalies within the same sedimentary rock package that hosts Newmont’s Éléonore Mine. The completed biogeochemical sampling survey covered an interpreted fold nose within the Low Formation sediments where an orientation level study identified a large-scale gold anomaly in a similar geological, geophysical, and structural setting to that of the nearby Éléonore Mine. Six priority drill targets across over 3 kilometres (km) of prospective folded sedimentary stratigraphy have been identified. These six targets encompass multi point gold anomalies above the 90th percentile of the data and correlate with moderate pathfinder elemental anomalies, most notably arsenic which is associated with gold mineralization at the Éléonore Mine. The Company intends to mobilize crews in Q1 2025 for an initial fully funded 3,000 – 5,000 metre (m) diamond drilling program.
2024 Changes to Management and the Board
On January 10, 2024, the Company announced the appointment of Phil van Staden, the current Interim CFO of the Company, to the position of Chief Financial Officer effective as of January 1, 2024.
On June 27, 2024, as a result of the voting at its Annual General Meeting (“AGM”) of Shareholders held on June 26, 2024, the Company confirmed that each director nominee listed in the Company’s management information circular dated May 14, 2024, in connection with the AGM were re-elected as directors of the Company and that Deloitte LLP was re-appointed as the Company’s auditor. Mr Mason did not stand for re-election as a director in 2024.
2024 Financings
On June 13, 2024, the Company closed the $5 Million financing announced on May 23, 2024. The Company issued 5,320,000 common shares of the Company that qualify as “flow-through shares” as defined under subsection 66(15) of the Income Tax Act (Canada) and section 359.1 of the Taxation Act (Québec) (the “FT Shares”) at a price of C$0.94 per FT Share for total gross proceeds to the Company of C$5,001.
2024 Corporate developments
On February 29, 2024, the Company, and its joint operation partner Newmont Corporation (“Newmont”), through their respective subsidiaries, closed a transaction whereby the Company acquired 100% control of the joint operation interests, the Éléonore South project, consolidating these properties into the Company’s portfolio at which time the joint venture operation was dissolved. The 49.978% that Newmont held was acquired by the Company for $3,000 while incurring $22 in transaction costs. As part of the transaction, the Company acquired 30,392,372 shares of Sirios Resources Inc. from Newmont which represented a 10.98% share at the time. The Company has sold a portion of the Sirios shares to retain under 9.9% which is the insider reporting threshold in Canada.
2024 Partial Sale of Dolly Varden Shareholdings
On March 14, 2024, the Company announced that it had sold 5.45 million common shares of Dolly Varden at $0.735 per share, for gross proceeds of $4,006, lowering its holdings to 19.99% and decreasing its right to one director on Dolly Varden under its Investors Rights Agreement, to which notice have been given. On October 4, 2024 the Company sold another 3 million common shares of Dolly Varden for gross proceeds of $3,356 lowering its interest to 16.11% as at December 31, 2024.
2025
The Company entered into the Arrangement Agreement with QPM on February 25, 2025. Under the terms of the Arrangement Agreement, Fury Gold has agreed to acquire QPM pursuant to a statutory plan of arrangement (the “Arrangement”) under Section 192 of the Canada Business Corporations Act (the “CBCA”) whereby Fury Gold will acquire all of the issued and outstanding shares of QPM on the basis of 0.0741 of one common share of Fury Gold for each share of QPM (the “Exchange Ratio”) as consideration for the acquisition. On March 6, 2025, Fury and QPM amended and restated the Original Arrangement Agreement in order to address certain technical matters related to QPM’s share capital (the “Amended and Restated Arrangement Agreement”, as further amended on March 19, 2025 and together with the original Arrangement Agreement, the “Arrangement Agreement”). In addition, each outstanding option and warrant of QPM will become exercisable to purchase shares of Fury following closing in accordance with the Exchange Ratio. Fury anticipates that approximately 8,385,030 common shares of Fury will be issued on closing of the Arrangement and that an additional 879,277 common shares will be issuable upon exercise of QPM options and warrants after closing. Fury Gold has obtained the approval of the Toronto Stock Exchange and NYSE American for the completion of the acquisition and related share issuances. Closing remains subject to the approval of the shareholders of QPM, the receipt of a final court order approving the Arrangement under the CBCA and satisfaction of other customary conditions to closing. Closing is anticipated to occur by April 30, 2025 if the required shareholder and court approvals are obtained. QPM’s main asset is the Sakami gold project located in Eeyou Istchee James Bay territory in Québec, Canada (the “Sakami Project”). QPM’s other assets include the Cheechoo-Eleonore Trend gold project which is adjacent to the northwest to the Sakami Project, and the Elmer East gold and lithium project located in Eeyou Istchee James Bay territory in Québec, Canada. QPM also holds a 68% interest in the Kippawa rare earths project and a 100% interest in the Zeus heavy rare earths project, both of which are located in the Témiscamingue region of Québec, Canada.
Fury Gold Mines is a Canadian-focused gold exploration company strategically positioned in two prolific mining regions: the Eeyou Istchee James Bay Region of Quebec and the Kitikmeot Region in Nunavut. Fury Gold has a portfolio of mineral properties of which three are considered material at this time: the Eau Claire property located in the Eeyou Istchee James Bay Region of Northern Quebec (the “Eau Claire Project”), the Committee Bay gold project located in the Kitikmeot Region of Nunavut (the “Committee Bay Project”) and the Éléonore South property also located in the Eeyou Istchee James Bay Region of Northern Quebec (“Éléonore South Project”) which was determined to have become material as of March, 31, 2025.
Since 2016, the Company has been actively exploring its mineral projects with the goal of identifying new areas of significant mineralization. As discussed in relevant project sections below, the majority of this work has taken place away from the known deposit areas in the form of regional exploration and prospect drilling at satellite targets. Though this work has yet to lead to the discovery of any new material mineral deposits, it has strengthened the Company’s understanding of the geological systems and provided new evidence with respect to the projects’ continued perspectivity. The Company expects to continue its exploration on the Eau Claire Project and Éléonore South project through 2025.
The Company has not yet determined whether any of its mineral property interests may contain economically recoverable mineral reserves. The Company’s continuing operations and the underlying value of the Company’s mineral property interests are entirely dependent upon the existence of economically recoverable mineral reserves, the ability of the Company to obtain the necessary financing to complete the exploration of its mineral property interests, obtaining the necessary mining permits, and on future profitable production or the proceeds from the disposition of the exploration and evaluation assets. See “Risk Factors” section for further information.
Most aspects of the Company’s business require specialized skills and knowledge. Such skills and knowledge include the areas of geology, mining, metallurgy, engineering, environment issues, permitting, social issues, capital markets, financing and accounting. While competition in the resource mining industry can make it difficult to locate and retain competent employees in such fields, the Company has been successful in finding and retaining personnel for the majority of its key processes. See “Risk Factors – Qualified and Experienced Employees, Management, and Board Members”.
In addition, some members of Fury Gold’s technical and management teams have a track record of successfully monetizing assets for all stakeholders. Fury Gold conducts itself to the highest standards of corporate governance and sustainability.
The mineral exploration industry is competitive and Fury Gold will be required to compete for the acquisition of project opportunities. As a result of this competition, Fury Gold may not be able to acquire or retain prospective mineral projects, technical experts that can find, develop and mine such mineral properties and interests, workers to operate its mineral properties, and capital to finance exploration, development and future operations. The Company competes with other mining companies, some of which have greater financial resources and technical facilities, for the acquisition of mineral property interests, the recruitment and retention of qualified employees and for necessary investment capital with which to fund its operations and projects. See “Risk Factors – Competitive Conditions”.
The Company’s mineral exploration activities may be subject to seasonality due to adverse weather conditions affecting exploration including, without limitation, incremental weather, frozen ground and restricted access due to snow, ice or other weather-related factors. Further, the mining business, and particularly the precious metals industry, including the gold industry, is subject to metal price cycles. Moreover, the mining and mineral exploration business is subject to global economic cycles effecting, among other things, the marketability and price of gold products in the global marketplace. See “Risk Factors – Commodity Price Fluctuations and Cycles”.
The Company’s intangible property, including its mineral and surface rights, is described elsewhere in this document. The Company’s business is not materially affected by intangibles such as business or commercial licenses, patents and trademarks or other intellectual property.
Exploration activities are subject to numerous and often stringent environmental laws and regulations. Compliance with such laws and regulations increases the costs of and delays planning, designing, drilling and developing the Company’s properties. To the best of management’s knowledge, the Company is in compliance in all material respects with all environmental laws and regulations applicable to its exploration and drilling activities. Fury Gold is committed to meeting or surpassing all applicable environmental legislation, regulations, permit and license requirements, and to continuously improving its environmental performance and practices. The Company embraces safe, socially and environmentally responsible and sustainable work practices during all activities. Fury Gold seeks to utilize innovative technologies and techniques to reduce its environmental footprint across all of the Company’s projects. This includes awarding drill contracts to an EcoLogo certified contractor at Eau Claire, the use of Rotary Air Blast (RAB) drilling at the Committee Bay Project, which reduces water usage, footprint and time on the ground, and the use of drone imagery to allow targeted ground-based follow up of outcrop. Current costs associated with compliance are considered to be normal. See “Risk Factors – Environmental Regulatory, Health & Safety Risks” and “Risk Factors – Environmental Protection”.
As at December 31, 2024, the Company had approximately 9 equivalent full-time employees located primarily in Canada. The Company shares certain technical and administrative functions provided by Vancouver-based Universal Mineral Services Ltd. on a full-cost recovery basis (See “Related Party Transactions”). The Company also relies on consultants and contractors to carry on many of its business activities and, in particular, to supervise and carry out mineral exploration and drilling on its mineral properties. No management functions of Fury Gold are performed to any substantial degree by a person other than the directors or executive officers of Fury Gold.
Social and Environmental Policies
Building and maintaining good corporate citizenship is an important component of Fury Gold’s business practices. The Company has adopted several social and environmental policies and codes of conduct that are essential to its operations. The Company’s operating practices are governed by the principles set out in its Code of Business Conduct and Ethics, Diversity Policy, Insider Trading Policy, Indigenous Relations Policy, Disclosure Policy and Whistle-Blower Policy.
Fury Gold endeavours to contribute to the communities in which it operates by focusing on activities that can make a meaningful, positive and lasting difference to the lives of those affected by its presence. Fury Gold prioritizes creating mutually beneficial and long-term partnerships with the communities where it operates, respecting their interests as our own. Fury Gold establishes constructive local partnerships to contribute to local priorities and interests and to have communities benefit both socially and economically from its activities. The Company seeks opportunities to maximize employment and procurement for local communities through the provision of suitable training opportunities and resources.
Fury Gold endeavours to engage in open and transparent dialogue with governments, local communities, Indigenous peoples, organizations and individuals on the basis of respect, fairness and meaningful consultation and participation.
Further information regarding Fury Gold’s corporate governance policies and charters can be found on its website at https://furygoldmines.com/about-us/governance/.
Indigenous and Local Community Engagement
Fury Gold respects and engages meaningfully with Indigenous and local communities at all of its operations. The Company is committed to working constructively with local communities, government agencies and Indigenous groups to ensure that exploration work is conducted in a culturally and environmentally sensitive manner. The Company’s engagement with Indigenous and local communities is governed by the principles set out in its Indigenous and Community Relations Committee Charter. Moreover, Fury Gold is committed to:
| ● |
sharing information about its projects and operations, providing meaningful opportunities for input and dialogue and involving local and Indigenous communities in archaeological work, environmental assessments and related studies; |
| ● |
making meaningful efforts to reach agreements with local and Indigenous groups on the preferred method of participation and engagement processes; |
| ● |
exploring opportunities for local and Indigenous communities to benefit from its projects and activities, which may include employment, contracting, training, community benefits and agreements, as appropriate to the type and stage of activity being undertaken; and |
| ● |
engaging in candid and respectful dialogue with a view to resolving or minimizing any disagreements and ensuring full communication in respect of any unresolved issues. |
Fury Gold is committed to responsible mineral exploration. The Company is dedicated to collaborating with Indigenous peoples and communities to establish and maintain effective, lasting, and mutually beneficial relationships. To achieve this commitment, we strive for relationships based on transparency, mutual respect, and trust. Accordingly, Fury implemented an Indigenous Relations Policy in 2024, which can be found on the Company’s website at www.furygoldmines.com/about-us/governance.
During the year ended December 31, 2024, the Company received its Ecologo certification for mineral exploration. Ecologo is the first comprehensive certification for mineral exploration companies and their service providers that features third-party certification of environmental, social and economic practices in Quebec.
Additionally, during the first quarter of 2022, the Company undertook a qualitative environmental, social and governance (“ESG”) assessment with Digbee, a technology company which provides qualitative assessment tools to mining companies to track their ESG achievements. Fury Gold received an overall score of BB with a range of CC to A broken down into a corporate score of BB with a range of B to A and a project score of BB with a range of CC to A for both the Eau Claire and Committee Bay projects. These results are considered strong for an exploration company and the Company is continually evaluating and implementing initiatives to improve future scores. Fury Gold conducted a second annual Digbee ESG Certification in 2024, and achieved an overarching score of BBB with a range of CC to AA as of June 2024. A corporate score of A with a range of BB to A was obtained, which is considered to be strong for an Exploration company. The Eau Claire project achieved a score of BB with a range of CC to AA. The Company continues to evaluate and implement initiatives to improve future scores.
During 2023 and 2024, the Company’s subsidiary, Eastmain, entered into a Services Agreement with Stajune Ventures Inc, a business entity of the Cree Nation of Eastmain which provided for the local First Nation personnel, to provide services for the Summer exploration activities at the Eau Claire project during those years.
Fury Gold’s Indigenous and Community Relations Committee Charter can be viewed on its website at https://furygoldmines.com/about-us/governance/.
Cultural Awareness
In 2021, employees and the board of directors participated in a multi-module accredited in-house learning program aimed at developing Indigenous cultural competency. This program is provided to any new board members as part of the director onboarding process. In 2024, employees and the board of directors completed additional cultural awareness training which focused on the Indigenous communities in the regions of its projects in Quebec.
Fury, in partnership with the Cree Hunters Economic Security Board and 15 other mining and exploration companies, contributed to a voluntary fund totalling C$750,000 for the Reconstruction Initiative Forest Fires Fund 2023. This initiative aimed to support the rebuilding of cabins destroyed by the 2023 wildfires in the Eeyou Istchee James Bay territory of Quebec.
The following diagram depicts the Company’s corporate structure as of December 31, 2024, and its material subsidiaries, including the name, jurisdiction of incorporation and proportion of ownership in each:
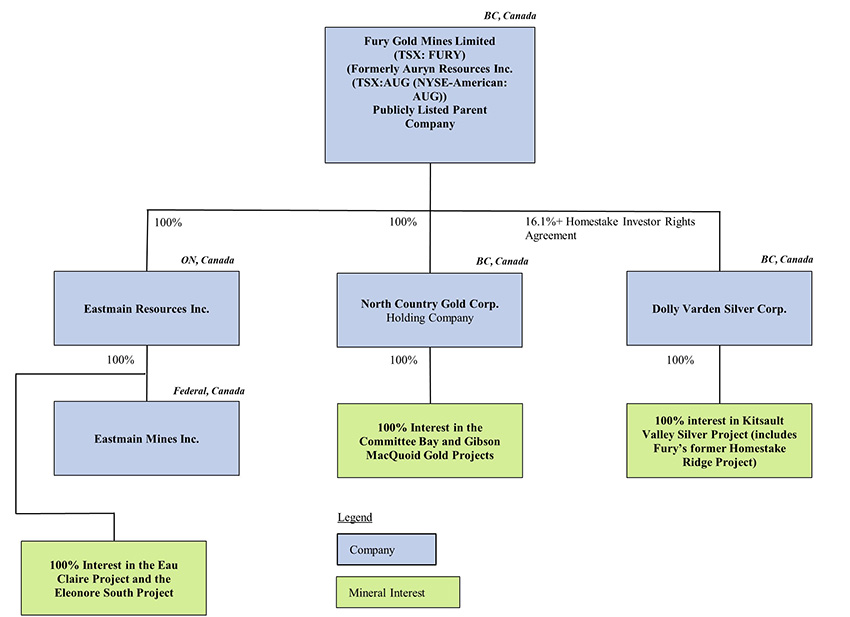
Not reflected in the above organization chart is the Company’s non-material 25% interest in a shared service provider entity, Universal Mineral Services Ltd (“UMS”). (See interest of “Related Party Transactions - Universal Mineral Services”)
D. Property, Plant and Equipment and Exploration and Evaluation Assets
Summary of Three Material Mineral Properties
At December 31, 2024, the Company’s three main 100% held material mineral properties were the Eau Claire Project and the Éléonore South Project located in the Eeyou Istchee James Bay Region of Northern Quebec, and the Committee Bay Project located in the Kitikmeot Region of Nunavut, Canada. The Éléonore South Project has been determined to have become material effective March 31, 2025 as a result of the Company increasing its ownership interest to 100% and increasing exploration expenditures.
The Eau Claire Project is a resource stage project, 100% held and operated by Fury, comprised of 446 claims, totaling 23,284 hectares(ha). Located in 1:50,000 scale NTS map sheets 33B04 and 33B05, approximately 320 km northwest of the town of Chibougamau and 800 km north of Montreal in the Eeyou Istchee James Bay Region of Quebec. The centre of the property is located at approximately 75.78 degrees longitude west and 52.22 degrees latitude north.
The early exploration stage Éléonore South Project, 100% held and operated by Fury, comprises 282 claims, totaling 14,760 hectares (ha). Located in 1:50,000 scale NTS map sheets 33B12 and 33C09, approximately 200 km east of the Cree community of Wemindji, 330 km northwest of the town of Chibougamau and 800 km north of Montreal in the Eeyou Istchee James Bay Region of Quebec. The centre of the property is located at approximately 75.98 degrees longitude west and 52.58 degrees latitude north.
The Committee Bay Project, 100% held by Fury, is a resource stage project comprising 156 claims and 57 crown leases, totalling 254,623.05 hectares (ha). located in 1:250,000 scale NTS map sheets 56J, 56K, 59O and 56P, approximately 430 km northwest of the town of Rankin Inlet. The approximate centre of the Project is located at Universal Transverse Mercator (UTM) co-ordinates 7,400,000m N and 570,000m E (NAD 83, Zone 15N).
| Project |
Measured Mineral Resources |
Indicated Mineral Resources |
Measured + Indicated Mineral Resources |
Inferred Mineral Resources |
||||||||||||||||||||
| Tonnes |
Au g/t |
Contained Au (oz) |
Tonnes |
Au g/t |
Contained Au (oz) |
Tonnes |
Au g/t |
Contained Au (oz) |
Tonnes |
Au g/t |
Contained Au (oz) |
|||||||||||||
| Eau Claire |
1,612,000 | 5.67 | 294,000 | 4,781,000 | 5.64 | 866,000 | 6,393,000 | 5.64 | 1,160,000 | 5,445,000 | 4.13 | 723,000 | ||||||||||||
| Committee Bay |
2,075,000 | 7.85 | 523,835 | 2,075,000 | 7.85 | 523,835 | 2,934,000 | 7.63 | 720,364 | |||||||||||||||
| Total |
1,612,000 | 5.67 | 294,000 | 6,856,000 | 6.31 | 1,389,835 | 8,468,000 | 6.18 | 1,683,835 | 8,379,000 | 5.36 | 1,443,364 | ||||||||||||
The following disclosure relating to the Eau Claire Project (other than the disclosure regarding the 2023 Eau Claire exploration programs) is based on information derived from the technical report summary on the Eau Claire Project entitled “Technical Report on the Eau Claire Project, Quebec, Canada” prepared by Mrs. Valerie Doyon, the Company’s Senior Project Geologist, with an effective date of December 31, 2024 (the “Eau Claire Technical Report Summary”), as attached to this Annual Report as Exhibit 15.2. The Eau Claire Technical Report Summary conforms to SEC’s Modernized Property Disclosure Requirements for Mining Registrants as described in Subpart 229.1300 of Regulation S-K, Disclosure by Registrants Engaged in Mining Operations (“S-K 1300”) and Item 601(b)(96) - Technical Report Summary. All information of a scientific or technical nature contained below and provided after the date of the Eau Claire Report has been reviewed and approved by Mrs. Valerie Doyon, the Company’s Senior Project Geologist and a “qualified person” for the purposes of S-K 1300.
The Eau Claire Project is a material property for the purposes of S-K 1300.
Property Description and Location
The Project is located in the Eeyou Istchee James Bay Territory of Northern Quebec, approximately 320 km northwest of the town of Chibougamau and 800 km north of Montreal. The property is accessible, year-round, by the Route du Nord and is located 100 km north of Nemaska, serviced by commercial flights twice per week.
The approximate centre of the Project is located at Universal Transverse Mercator (UTM) co-ordinates 5,786,800m N and 453,000m E (NAD 83, Zone 18N). The approximate UTM co-ordinates for the centre of the currently defined Eau Claire deposit are 5,785,100m N and 444,600m E. The Project is located within National Topographic System (NTS) 1:50,000 scale map-areas; 33B04 and 33B05.
Land Tenure
As of the effective date of the Eau Claire Technical Report Summary the Eau Claire Project, 100% held by Fury, comprises 446 claims, totaling 23,284 hectares(ha). Located in 1:50,000 scale NTS map sheets 33B04 and 33B05, approximately 320 km northwest of the town of Chibougamau and 800 km north of Montreal. The property is accessible, year-round, by the Route du Nord and is located 100 km north of Nemaska, serviced by commercial flights twice per week. The centre of the property is located at approximately 75.78 degrees longitude west and 52.22 degrees latitude north.
The Project is north of the 52nd parallel (52ºN) and as such is subject to the provisions of the James Bay and Northern Quebec Agreement (1975), and the Paix des Braves Agreement (2002). The Project falls within the Eeyou Istchee Territory of the Eastmain Cree First Nation, including trap line VC36 held by Dr. Ted Moses as the Cree Tallyman, and on Category III lands, as established under the James Bay and Northern Quebec Agreement.
The figure below presents property location and claims comprising the Eau Claire Deposit:
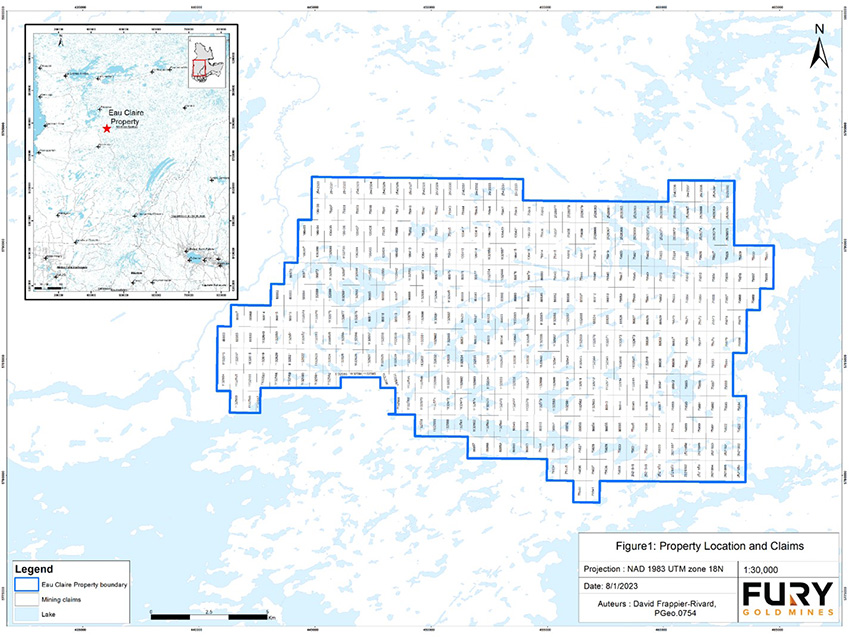
Existing Infrastructure
Fury, through its Eastmain subsidiary, maintains a forty-person camp to support exploration activities at the Eau Claire project. The closest infrastructures to the Eau Claire deposit include a number of hydroelectric complexes and associated infrastructure, including the EM-1 hydroelectric complex. The EM-1 complex is located within 15 kilometres of the Eau Claire gold deposit. Hydro Québec has established a 600-person camp at EM-1 that includes fuel and medical services. More major necessities such as skilled labour and specialized equipment are sourced from Val-d’Or or Chibougamau. Many services are now available through numerous Cree owned businesses and partnerships in Mistissini, Eastmain and Nemaska.
History
Key historical events are:
| ● |
1897: First reconnaissance survey in the area by the Geological Survey of Canada (GSC) (A. P. Low). |
| ● |
1942: Mapping of the Eastmain Greenstone Belt by the Geological Survey of Canada (GSC) (Shaw). |
| ● |
1966: Eade from the Geological Survey of Canada mapped the area of interest at a 1:1 000 000 scale. |
| ● |
1971 and 1972: Canico carried out a “winkie” drilling program (19 holes). |
| ● |
1973 to 1977: SEREM and Société de développement de la Baie-James (SDBJ) carried out geochemical surveys, prospecting, rock sampling, airborne and ground geophysics, geological mapping, and diamond drilling. |
| ● |
1978: Mapping at the 1:100 000 scale by the Ministère des Richesse Naturelle (MRN) (Franconi) |
| ● |
1985 to 1990: Westmin conducted airborne geophysics, soil geochemistry, prospecting, mapping, trenching and drilling (79 DDH, totalling 8,937 metres) |
| ● |
1995 to 2001: SOQUEM conducted soil geochemistry, geological mapping, trenching and drilling (54 DDH totalling 19,639 metres) |
| ● |
2002 to 2020: Eastmain Resources carried out geochemical and airborne geophysical surveys, geological mapping, prospecting, trenching and drilling. A total 816 diamond drilled holes, totalling 277,410.6 metres, were drilled. In 2018, discovered the Percival prospect where they drilled 13,182.6 metres in 2018 and 2019. |
Geology and Mineralization
The Eau Claire project is contained within the La Grande volcano-plutonic Subprovince (2,752 to 2,696 Ma) of the Superior Province approximately 30 kilometres south of the contact with the metasedimentary Opinaca Subprovince (2700 to 2648 Ma). Portions of the La Grande Subprovince were formerly referred to as the Eastmain Greenstone Belt. Depending on the literature, the Eastmain Greenstone Belt has retained its title as a distinct greenstone belt lying within the La Grande Subprovince.
The La Grande Subprovince consists of four volcanic cycles erupted between 2,752 and 2,705 Ma (Kauputauch, Natel, Anatacau-Pivert, and Komo-Kasak formations). The supracrustal rocks of the region are intruded by syn-volcanic (2747 to 2710 Ma) and post- or late-tectonic (2,697 to 2,618 Ma) tonalite- trondhjemite-granodiorite (TTG) suites.
The Eastmain Greenstone Belt consists of a 5- to 10-kilometre wide by 150-kilometre long succession of Archean bimodal volcanic rocks (Figures 2 and 3). The volcanic sequence includes lowermost mafic volcanic rocks overlain by felsic pyroclastic to volcaniclastic rocks, intercalated facies of iron formation, shaly and graphitic sedimentary units.
The majority of the gold mineralization identified to date at Eau Claire occurs as stacked late quartz tourmaline veining (VQTL) within interbedded mafic volcanics and volcaniclastic sequences proximal to regional D2 shear zones. Gold mineralization also occurs within altered host rock without veining occurring as centimetre to several metre wide tourmaline-actinolite ± biotite ± calcite replacement zones around vein selvages. A third style of gold mineralization recently identified in silicified breccias and quartz veins hosted in sediments and volcanic rocks proximal to iron formation on the eastern side of the Eau Claire Project. Eau Claire hosts over 12 showings, the most advanced being the Eau Claire deposit and the Percival prospect.
Gold mineralization at the Eau Claire gold deposit is generally located within approximately EW trending structurally-controlled, high-grade en-echelon quartz-tourmaline veins and adjacent altered wall rocks, as well as variable width ESE trending sheared and foliated alteration zones. The alteration zones are parallel to the overall foliation and are thus believed to represent an altered stratigraphic unit. The vein systems are predominantly hosted within a thick sequence of massive and locally pillowed mafic volcanic flows, interbedded with narrow intervals of volcaniclastic meta-sedimentary rocks. Both gold bearing vein sets may occur with as narrow intervals with tourmaline and develop into thick quartz-tourmaline veins with zoned tourmaline+/-actinolite+/-biotite+/-carbonate alteration halos which can measure up to several metres in thickness.
The Eau Claire deposit is a structurally-controlled gold deposit. Mineralization occurs primarily in a series of sheeted en-echelon quartz-tourmaline veins and associated metre scale alteration zones. Carbonate within the veins is associated with gold mineralization. The overall trend of the mineralized veins is controlled by a structural corridor sub-parallel to the D2 Cannard Deformation Zone. Individual veins are up to 1 metre thick and extent for at least 100 metres along strike.
Veins are composed of quartz and tourmaline; the ratio between quartz with accessory calcite to tourmaline can vary from 100 percent quartz to 100 percent tourmaline. The quartz-tourmaline veins are massive, banded and/or brecciated. Pyrite, pyrrhotite, chalcopyrite and rare molybdenite generally constitute less than 1.5 percent of the composition of these veins but can be upwards of 20% locally. Commonly, brecciated veins contain angular blocks of tourmaline, ranging in size from less than one to more than 25 centimetres in size. Fragments are cemented by a quartz-carbonate matrix. Breccia textures locally form a “piano key” pattern with angular tourmaline blocks aligned perpendicular to the vein walls. This texture is due to protracted deformation that affected already formed veins and generated new veins (tension gash veins developed on pre-existing laminated veins). The piano-key breccia has been observed throughout the deposit at all scales in tourmaline veins of less than 1 centimetre to more than 1 metre thick. A “ladder vein” texture has also been observed in outcrop at the 450 West Zone consisting of massive tourmaline layers with quartz-carbonate “ladders” aligned perpendicular to the vein walls.
Gold occurs as isolated grains or as clusters of fine-grained particles. Irregular to sub-angular shaped gold grains range in size from less than 10 micrometres to 1 millimetre. In rare instances, grains up to 1 centimetre in size have been observed. Locally, veins contain micrometre-size clusters of visible gold particles. Tellurobismuthite (Bi2Te3) occurs throughout the deposit. Gold and tellurides occur within micro fractures in quartz, interstitial to granular tourmaline grains, at the contact between massive aphanitic tourmaline and quartz bands, and along tourmaline laminations.
Gold mineralization also occurs within altered host rock without veining occurring as centimetre to several metre wide tourmaline-actinolite ± biotite ± calcite replacement zones around vein selvages.
The two major vein areas discovered to date in the resource area (the 450 West and 850 West zones) form a crescent-shaped mineralized, surface projected footprint 1.8 kilometres long by more than 100 metres wide, which has been traced to date to a vertical depth of 900 metres. Veins within the 450 West zone typically strike 85 degrees and dip 50 to 65 degrees to the south. Veins within the 850 West zone typically strike 60 degrees and dip subvertically.
Mineral Resources
A Mineral Resource Estimate was first disclosed in a 2015 Technical Report (SRK, 2015) and updated in 2017 (Armitage and Hafez, 2017). The 2017 updated Mineral Resource Estimate was subsequently updated for use in a 2018 preliminary economic assessment (2018 PEA) study (Puritch et. al. 2018). No updated economic study was conducted on the 2023 Mineral Resource Estimate and the 2018 PEA is no longer current and should not be relied upon. The 2024 Mineral Resource Estimate included the addition of Fury’s 2020 through 2023 drilling to update the resource wireframes and block model.
The Eau Claire project contains a combined Mineral Resource of 1,160,000 oz of Au at a grade of 5.65 g/t in the Measured and Indicated category, and an additional 723,000 oz of Au at a grade of 4.13 g/t Au in the Inferred Category.
Completion of the MREs involved the assessment of a validated drill hole and channel sample database, which included all data for surface drilling and surface and channel sampling completed through the end of 2023. Completion of the MREs also included the assessment of updated three-dimensional (3D) mineral resource models (mineral resource domains), 3D topographic surface models and 3D overburden surface models.
The Inverse Distance Cubed (“ID3”) and Inverse Distance Squared (“ID2”) calculation methods restricted to the mineral resource domains were used to interpolate grades for Au (g/t) into block models for all deposit areas.
The 2024 Mineral Resource Estimate (MRE) was prepared using 2019 CIM Best Practice Guidelines for mineral resource estimation. The wireframe grade shell models represent the drilled mineralization and are suitable for use in block model estimations. The Eau Claire deposit meets the criteria of reasonable prospects for eventual economic extraction in the combined open pit and underground portions of the MRE.
There is no mineralization that qualifies as Mineral Reserves on the Eau Claire Project.
Sample Preparation, Analyses and Security
Drill core was placed sequentially in wooden core boxes at the drill by the drillers and sealed with top covers and ties before transport. The core boxes were transported by ATV and/or Pickup trucks on a twice daily basis for the conventional drill and one time a day for the helicopter supported drill. The core was transported to the camp where depth markers and box numbers were checked and the core was carefully reconstructed in a secure core facility. The core was logged geotechnically on a 3 m run by run basis including, core recovery, RQD. Magnetic susceptibility and XRF measurements were taken every metres.
The core was descriptively logged and marked for sampling by an OGQ registered geologist or geologist in-training, paying particular attention to lithology, structure, alteration, veining/brecciation, and sulphide mineralization.
Logging and sampling information was entered into MX Deposit cloud-based core logging application by MINALYTIX INC. which allowed for the integration of the data into the project database.
The core was photographed both wet and dry after logging but prior to sampling.
Sampling, Analysis and Data Verification
Core recovery is generally very good to excellent, allowing for representative samples to be taken and accurate analyses to be performed. Half-core samples, 0.5 metre to 1.5 metre long, were taken where the rock was mineralized and/or altered. In the case of the Snake Lake and Percival holes, the core was sampled along the entire length of each hole.
Individual core samples were placed in rice bags which were sealed using uniquely numbered zip ties. Completed sample shipments for the Extension Program in 2020 and early 2021 and all 2022 drilling were sent to ALS Lab in Val d’Or, QC (ISO/IEC 17025:2017 and ISO 9001:2015 accredited facility) for preparation and analysis. Preparation included crushing core samples to 90% < 2mm and pulverizing 1000g of the crushed material to better than 85% < 75 microns. All samples are assayed using 50 g nominal weight fire assay with atomic absorption finish (Au-AA24) and multi-element four acid digest ICP-AES/ICP-MS method (ME-MS61). In 2020-2021, where Au-AA24 results are greater than 5 ppm Au the assay are repeated with 50 g nominal weight fire assay with gravimetric finish (Au-GRA22), the 5 ppm threshold was change for 10 ppm in 2022. QA/QC programs using internal and lab standard and blank samples, field and lab duplicates and re-assay indicate good overall accuracy and precision.
Sample shipments from the exploration program in 2021 were sent to Actlabs in Val d’Or, QC for preparation and then to Actlabs in Thunder Bay, ON for analysis. All samples are assayed using 50 g nominal weight fire assay with atomic absorption finish (1A2B-50) and multi-element four acid digest ICP-AES/ICP-MS method (1F2). Where 1A2B-50 results were greater than 5 ppm Au the assay were repeated with 50 g nominal weight fire assay with gravimetric finish (1A3-50). QA/QC programs using internal standard samples, field and lab duplicates and blanks indicate good.
Analytical samples for the Extension Program from March 2021 through to October 2021 were sent to Bureau Veritas (BV) lab in Timmins, ON (ISO/IEC 17025 accredited facility) for preparation and analysis. Preparation included crashing core sample to 90% < 2mm and pulverizing 1000g of crushed material to better than 85% < 75 microns. All samples are assayed using 50 g nominal weight fire assay with atomic absorption finish (BV code FA450) and multi-element four acid digest ICP-AES/ICP-MS method (BV code MA200). Where FA450 results are greater than 5 ppm Au the assay is repeated with 50 g nominal weight fire assay with gravimetric finish (FA550-Au). QA/QC programs using internal and lab standard and blank samples, field and lab duplicates and re-assay indicate good overall accuracy and precision.
QC protocols were established in 2002 and carried through with minor refinements through the current drilling program.
Quality Control (QC) samples are introduced into the sample stream at a rate of 5% for both blank samples and CRM samples. Field duplicates in the form of quarter sawn core samples, are introduced into the sample stream at a rate of 1 in 50 samples.
Mineral Processing and Metallurgical Testing
Work performed in the SGS 2017 study was performed essentially on a single master sample. The sample included appropriate vein and mining dilution from the hanging wall and footwall. This sample was well documented and traceable.
The 2017 metallurgical testing indicated that gravity concentration with cyanide leaching outperformed production of a gold bearing flotation concentrate. The reported gold recoveries of 95 percent are supported by testing performed. The process was very simple with a primary grind size and reagent consumption levels that are typical for this style of deposit.
The limited metallurgical testwork conducted to date suggests that a high proportion of the gold can be recovered by conventional means and the Eau Claire material is relatively free-milling. Additional metallurgical testwork is recommended particularly to optimize leach parameters and investigate variability of the mineralization with respect to comminution requirements.
2024 Mineral Resource Estimate
Mineral Resource Estimate (effective December 31, 2024)(1-15)
| Category |
Tonnes |
(g/t Au) |
Contained Au (oz) |
|||||||||
| Measured |
1,612,000 | 5.67 | 294,000 | |||||||||
| Indicated |
4,781,000 | 5.64 | 866,000 | |||||||||
| Total Measured & Indicated |
6,393,000 | 5.65 | 1,160,000 | |||||||||
| Inferred |
5,445,000 | 4.13 | 723,000 | |||||||||
Open Pit and Underground Mineral Resources for Eau Claire Deposit (effective December 31, 2024)(1-15)
| Open Pit (surface to 150 m) |
Underground (150 m – 860 m) |
|||||||||||||||||||||||
| Category |
Tonnes |
(g/t Au) |
Contained Au (oz) |
Tonnes |
(g/t Au) |
Contained Au (oz) |
||||||||||||||||||
| Measured |
1,157,000 | 5.19 | 193,000 | 455,000 | 6.9 | 101,000 | ||||||||||||||||||
| Indicated |
1,291,000 | 4.19 | 174,000 | 3,490,000 | 6.17 | 692,000 | ||||||||||||||||||
| Measured & Indicated |
2,448,000 | 4.66 | 367,000 | 3,945,000 | 6.25 | 793,000 | ||||||||||||||||||
| Inferred |
69,000 | 4.39 | 10,000 | 2,566,000 | 6.08 | 502,000 | ||||||||||||||||||
Open Pit and Underground Mineral Resources for Percival Deposit (effective December 31, 2024) (1-15)
| Open Pit (surface to 150 m) |
Underground (150 m – 860 m) |
|||||||||||||||||||||||
| Category |
Tonnes |
(g/t Au) |
Contained Au (oz) |
Tonnes |
(g/t Au) |
Contained Au (oz) |
||||||||||||||||||
| Inferred |
2,253,000 | 1.81 | 131,000 | 557,000 | 4.47 | 80,000 | ||||||||||||||||||
Notes:
| 1. |
The effective date of the Eau Claire project Mineral Resource Estimates (“MREs”), including the Eau Claire and Percival deposit estimates, is May 10, 2024. |
| 2. |
The Mineral Resource Estimates were estimated by Maxime Dupéré, B.Sc., géo. of SGS Geological Services and is an independent Qualified Person as defined by NI 43-101. |
| 3. |
The classification of the current Mineral Resource Estimates into Measured, Indicated and Inferred mineral resources is consistent with current 2014 CIM Definition Standards – For Mineral Resources and Mineral Reserves. |
| 4. |
All figures are rounded to reflect the relative accuracy of the estimate and numbers may not add due to rounding. |
| 5. |
The mineral resources are presented undiluted and in situ, constrained by continuous 3D wireframe models, and are considered to have reasonable prospects for eventual economic extraction. |
| 6. |
Mineral resources which are not mineral reserves do not have demonstrated economic viability. An Inferred Mineral Resource has a lower level of confidence than that applying to an Indicated Mineral Resource and must not be converted to a Mineral Reserve. It is reasonably expected that most Inferred Mineral Resources could be upgraded to Indicated Mineral Resources with continued exploration. |
| 7. |
The Project mineral resource estimates are based on a validated database which includes data from 1202 surface diamond drill holes totalling 406,431 m, and 426 surface channels (Eau Claire deposit) for 1,345 m. The resource database totals 273,402 drill hole assay intervals representing 267,721 m of data and 2,254 channel assays for 1,316 m. |
| 8. |
The MRE for the Eau Claire deposit is based on 280 three-dimensional (“3D”) resource models representing the 450, 850 and hinge zones. The MRE for the Percival deposit is based on 29 3D resource models representing high grade and lower grade halo zones. |
| 9. |
Grades for Au were estimated for each mineralization domain using 1.0 metre capped composites assigned to that domain. To generate grade within the blocks, the inverse distance cubed (ID3) interpolation method was used for all domains. An average density value was assigned to each domain. |
| 10. |
Based on the location, surface exposure, size, shape, general true thickness, and orientation, it is envisioned that parts of the Eau Claire and Percival deposits may be mined using open-pit mining methods. In-pit mineral resources are reported at a base case cut-off grade of 0.5 g/t Au. The in-pit resource grade blocks are quantified above the base case cut-off grade, above the constraining pit shell, below topography and within the constraining mineralized domains (the constraining volumes). |
| 11. |
The pit optimization and base-case cut-off grade consider a gold price of $1,900/oz and considers a gold recovery of 95%. The pit optimization and base case cut-off grade also considers a mining cost of US$2.80/t mined, pit slope of 55⁰ degrees, and processing, treatment, refining, G&A and transportation cost of USD$19.00/t of mineralized material. |
| 12. |
The results from the pit optimization, using the pseudoflow optimization method in Whittle 4.7.4, are used solely for the purpose of testing the “reasonable prospects for economic extraction” by an open pit and do not represent an attempt to estimate mineral reserves. There are no mineral reserves on the Property. The results are used as a guide to assist in the preparation of a Mineral Resource statement and to select an appropriate resource reporting cut-off grade. A Whittle pit shell at a revenue factor of 0.52 was selected as the ultimate pit shell for the purposes of this mineral resource estimate. |
| 13. |
Based on the size, shape, general true thickness, and orientation, it is envisioned that parts of the Eau Claire and Percival deposits may be mined using underground mining methods. Underground mineral resources are reported at a base case cut-off grade of 2.5 g/t Au. The mineral resource grade blocks were quantified above the base case cut-off grade, below surface/pit surface and within the constraining mineralized wireframes (considered mineable shapes). Based on the size, shape, general thickness, and orientation of the mineralized structures, it is envisioned that the deposits may be mined using a combination of underground mining methods including sub-level stoping (SLS) and/or cut and fill (CAF) mining. |
| 14. |
The underground base case cut-off grade of 2.5 g/t Au considers a mining cost of US$65.00/t mined, and processing, treatment, refining, G&A and transportation cost of USD$19.00/t of mineralized material. |
| 15. |
The estimate of Mineral Resources may be materially affected by environmental, permitting, legal, title, taxation, socio-political, marketing, or other relevant issues. |
2023 Mineral Resource Estimate
Eau Claire Deposit Mineral Resource Estimate as of December 31, 2023
Mineral Resource Estimate (effective February December 31, 2023)(1-7)
| Category |
Tonnes |
(g/t Au) |
Contained Au (oz) |
|||||||||
| Measured |
906,000 | 6.63 | 193,000 | |||||||||
| Indicated |
3,388,000 | 6.06 | 660,000 | |||||||||
| Total Measured & Indicated |
4,294,000 | 6.18 | 853,000 | |||||||||
| Inferred |
2,382,000 | 6.53 | 500,000 | |||||||||
Open Pit and Underground Mineral Resources (effective December 31, 2023)(1-7)
| Open Pit (surface to 150 m) |
Underground (150 m – 860 m) |
|||||||||||||||||||||||
| Category |
Tonnes |
(g/t Au) |
Contained Au (oz) |
Tonnes |
(g/t Au) |
Contained Au (oz) |
||||||||||||||||||
| Measured |
574,000 | 6.66 | 123,000 | 332,000 | 6.56 | 70,000 | ||||||||||||||||||
| Indicated |
636,000 | 5.13 | 105,000 | 2,752,000 | 6.27 | 555,000 | ||||||||||||||||||
| Measured & Indicated |
1,210,000 | 5.86 | 228,000 | 3,084,000 | 6.30 | 625,000 | ||||||||||||||||||
| Inferred |
43,000 | 5.06 | 7,000 | 2,339,000 | 6.56 | 493,000 | ||||||||||||||||||
Notes:
| 1. |
The classification of the current Mineral Resource Estimate into Measured, Indicated and Inferred Resources has been completed in accordance with the definitions under S-K 1300, which are consistent with current 2014 CIM Definition Standards - For Mineral Resources and Mineral Reserves. |
| 2. |
All figures are rounded to reflect the relative accuracy of the estimate. |
| 3. |
All Resources are presented undiluted and in situ, constrained by 3D wireframe models (the constraining volumes), and are considered to have reasonable prospects for eventual economic extraction. |
| 4. |
Mineral resources which are not mineral reserves do not have demonstrated economic viability. An Inferred Mineral Resource has a lower level of confidence than that applying to a Measured and Indicated Mineral Resource and must not be converted to a Mineral Reserve. It is reasonably expected that most of the Inferred Mineral Resources could be upgraded to Indicated Mineral Resources with continued exploration. |
| 5. |
Open pit Mineral Resources are reported at a base case cut-off grade of 0.5 g/t Au within a conceptual pit shell and underground Mineral Resources are reported at a cut-off grade of 2.5 g/t Au outside the conceptual pit shell. Cut-off grades are based on a gold price of US$1,250 per ounce, a foreign exchange rate of US$0.80 and a gold recovery of 95%. |
| 6. |
The results from pit optimization are used solely for the purpose of testing the “reasonable prospects for eventual economic extraction” by an open pit and do not represent an attempt to estimate mineral reserves. There are no mineral reserves on the Property. The results are used as a guide to assist in the preparation of a Mineral Resource statement and to select an appropriate resource reporting cut-off grade. |
| 7. |
There is no certainty that all or any part of the Inferred Mineral Resource will be upgraded to an Indicated or Measured Mineral Resource as a result of continued exploration. There is no other relevant data or information available that is necessary to make the technical report summary understandable and not misleading. |
Discussion on 2024 versus 2023 Mineral Resource Estimate
The 2024 Eau Claire project mineral resource estimate of 1.16Moz Au at a grade of 5.64 g/t Au in the Measured and Indicated category as well as an additional 723koz Au at a grade of 4.13 g/t Au in the Inferred Category incorporates the additional drilling completed between 2021 and 2023 at the Eau Claire deposit as well as provided a maiden resource estimate for the Percival deposit located 14 km to the east of Eau Claire. The additional drilling resulted in the addition of 307koz Au in the Measured and Indicated category (a 36% increase) and 223 koz Au in the Inferred category (a 44.6% increase).
Conclusions
The Eau Claire and Percival deposits contain within-pit and underground Measured, Indicated and Inferred Mineral Resources that are associated with well-defined mineralized trends and models. The deposits are open along strike and at depth. Project geologists have a good understanding of the regional, local, and deposit geology and controls on mineralization. The geological models are reasonable and plausible interpretations of the drill results.
Mineral Resources for the Eau Claire deposit were estimated assuming combined open pit and underground mining methods. At cut-off grades of 0.5 g/t Au for open pit and 2.5 g/t Au for underground, Measured Mineral Resources are estimated to total 1.61 Mt at an average grade of 5.67 g/t Au containing 294,000 ounces gold. At the same cut-off grades, Indicated Mineral Resources are estimated to total 4.78 Mt at an average grade of 5.64 g/t Au containing 860,000 ounces gold. At the same cut-off grades, Inferred Mineral Resources are estimated to total 5.44 Mt at an average grade of 4.13 g/t Au containing 723,000 ounces gold. The open pit resources were constrained by a preliminary pit shell generated in Whittle software.
The limited metallurgical testwork conducted so far suggests that the gold can be recovered by conventional means, such as a combination of gravity followed by cyanide leaching of the concentrate. Additional metallurgical testwork will be warranted if further exploration increases the size of the resource.
The Author considers that the Project has potential for delineation of additional Mineral Resources and that further exploration is warranted. Given the prospective nature of the Property, it is the Author’s opinion that the Property merits further exploration and that a proposed plan for further work by Fury is justified. The Author is recommending Fury conduct further exploration, subject to funding and any other matters which may cause the proposed exploration program to be altered in the normal course of its business activities or alterations which may affect the program as a result of exploration activities themselves.
Recommendations
The following summarizes the work programs recommended by the author of the Eau Claire Technical Report Summary.
Fury’s intentions are to continue exploration on the Property in 2025 and onwards. The proposed work program consists of a regional portion focused on refining known gold occurrences within the Percival – Serendipity trend, 14km to the east of Eau Claire, and attempting to define new prospects in areas with favourable geological and structural settings. In addition to the regional program, a drill program focused on the Eau Claire deposit has been proposed to tie-in the mineralization identified 450m west of the current resource with the aim of updating the current mineral resource. Additional drilling would focus on the Percival prospect and other nearby geochemical anomalies to determine the continuity and scale of gold mineralization.
Fury has gained a better understanding of the combination of pathfinder elements and structural controls on the gold mineralization at Percival. The broad low-grade gold mineralization occurs along a well-defined east–west trending structural splay of the Cannard Deformation Zone. Certain elemental associations, most notably Arsenic, Bismuth, and Tungsten, are proving to be important pathfinders for the gold mineralization. Higher-grade gold within the broader corridor is controlled by secondary shearing and is identified by the high degree of silicification. With this knowledge, the Company has refined their targeting along the Percival to Serendipity Trend identifying ten priority targets for 2024. These identified targets lie within the same stratigraphic package as Percival Main and have undergone varying degrees of deformation. The proximity of the main Cannard and Hashimoto Deformation Zones varies from one target to the other and may have a significant impact on the gold mineralization. Fury believes the varying degrees of deformation are an important control on both gold mineralization and the potential preservation of a sizeable, mineralized body.
The recommended work program is anticipated to include the collection of 15,000 infill till and biogeochemical samples and 30,000 m of diamond drilling. Drilling would be allocated with 2,000 m to 7,500 m focused on testing biogeochemical anomalies within the Percival – Serendipity trend, approximately 20,000 m at the Eau Claire deposit for resource expansion, and 2,500 m to 8,000 m at Percival for resource expansion. Subsequent to the completion of additional drilling on the Property, updated MREs are planned which will form the basis of an updated engineering study in the form of an updated Preliminary Economic Assessment.
The total cost of the planned work program by Fury is estimated at up to $14.2 M shown in the table below. The Company has not yet made a decision to fully implement these recommendations as they are financing and success dependent.
Recommended Work Programs
| Type |
Details |
Cost Estimate (C$) |
|||
| Labour |
Staff Wages, Technical and Support Contractors |
1,750,000 | |||
| Assaying |
Sampling and Analytical |
750,000 | |||
| Drilling |
Diamond Drilling (30,000m at $175/m) |
5,250,000 | |||
| Till Sampling |
Detailed sampling program |
1,500,000 | |||
| Land Management |
Consultants. Assessment Filing, Claim maintenance |
750,000 | |||
| Community Relations |
Community Tours, Outreach |
75,000 | |||
| Information Technology |
Remote site communications and IT |
35,000 | |||
| Safety |
Equipment, Training and Supplies |
75,000 | |||
| Expediting |
Expediting |
150,000 | |||
| Camp Costs |
Equipment, Maintenance, Food, Supplies |
250,000 | |||
| Freight and Transportation |
Freight, Travel, Helicopter |
450,000 | |||
| Fuel |
1,200,000 | ||||
| General and Administration |
100,000 | ||||
| Update MRE and PEA |
600,000 | ||||
| Sub-total |
12,935,000 | ||||
| Contingency (10%) |
1,293,500 | ||||
| Total |
14,228,500 | ||||
2020 - 2024 Eau Claire Exploration Program
From 2020 through to 2024, Fury completed a total of 120 diamond drill holes for approximately 75,654.3 m on the Project. The drill program consisted of i) an extension phase focused on extensions to the known vein corridors along strike from the current resource (“Extension Program”); ii) an exploration phase designed to test targets along the 4.5km long deposit trend (“Exploration Program”) and iii) an exploration phase of drilling designed to test targets at the Percival and Serendipity prospects 14km east and 20 km northeast of the Eau Claire Deposit respectively. Large stepout drilling in 2022 increased the mineralized footprint of the Eau Claire deposit by over 450m to the west. At Percival Fury intercepted 13.5 m of 8.05 g/t gold (Au) outlining a 500x100x300m zone of gold mineralization.
The 2023 drilling campaign focused on the Hinge Target, which is located west of the deposit, adjacent to the 850 W zone, and the at Percival prospect area. Results from the 2023 Hinge drilling expanded the Hinge Target gold mineralization 50m up-dip and 75m to the west respectively, over 450m from the defined Eau Claire Resource as well as intercepting high grade shallow mineralization on the eastern edge of the Hinge target.
The Extension Program at the Eau Claire deposit was designed to target strike extensions of the known vein corridors to the west and southeast of the current mineral resource. To date, Fury Gold has drilled twenty one holes targeting the southeast extension of the Eau Claire Resource with intercepts including: 23.27 g/t Au over 7.09m, 11.56 g/t Au over 6.04m, 59.3 g/t Au over 0.96m and 4.89 g/t Au over 2.94m. Results from the four holes completed in the second quarter of 2022 were released on August 3, 2022 including 4.43 g/t Au over 1.43m and 4.60 g/t Au over 1.25m. Two additional holes were completed in October 2022 with results released on January 23, 2023 including 3.91 g/t Au over 2.50m.
The exploration drilling program along the Eau Claire deposit trend continues to demonstrate the potential to significantly expand the Eau Claire deposit to the west. The focus has been on the Western Hinge, and Gap Zone as well as along the north limb of the anticline. All exploration targets within the Deposit Trend have the potential to significantly expand the Eau Claire mineralized footprint. To date the footprint of gold mineralization has been increased by over 455m or 25% at the Hinge Target alone and remains open to further expansion to the West.
Regional Exploration
The Company completed 11,497.8m in 18 diamond drill holes in 2022 and 2023 at Percival. Five holes targeted the parallel hinge 500m to the east of Percival proper. All holes intercepted silicified sulphide rich breccias, however only narrow low grade gold values were returned. The remainder of the drilling tested extensions of the historical gold mineralization at Percival proper. The results from the Percival proper drilling program confirm that the high-grade core of the Percival mineralization plunges steeply to the west and remains open in all directions. Highlights included an 85m step out from historical high-grade mineralization which intercepted 13.5m of 8.05 g/t Au, (including 3.00m of 25.8 g/t Au) in drill hole 22KP-008 and a 150m step out which intercepted 7.5m of 4.38 g/t Au, (including 3m of 8.7 g/t Au, and 3m of 5.5 g/t Au) in drill hole 22KP-005. As well as 279 g/t Au over 1.5m along the eastern edge of the defined mineralization. With the recent drilling the gold mineralization at Percival Main is represented by a 500 m by 100 m footprint with high-grade gold being defined to 300 m below surface hosted within folded sulphidized, silicified, and brecciated sediments.
The following disclosure relating to the Committee Bay Project is based on information derived from the technical report summary entitled “Technical Report on the Committee Bay Project, Nunavut Territory, Canada” dated effective December 31, 2023, prepared by Bryan Atkinson, P.Geo., as Senior Vice President Exploration of Fury Gold (the “Committee Bay Technical Report Summary”). The Committee Bay Technical Report Summary conforms to the SEC’s Modernized Property Disclosure Requirements for Mining Registrants as described in S-K 1300 and Item 601(b)(96) - Technical Report Summary. All information of a scientific or technical nature contained below and provided after the date of the Committee Bay Technical Report Summary has been reviewed and approved by Mr. Atkinson as a “qualified person” for the purposes of SK-1300.
The Committee Bay Project is a material property for the purposes of S-K 1300. The 2023 Committee Bay Technical Report Summary is considered to still be current as not material work was conducted on the project in 2024.
Description and Location
The Committee Bay Project is located in the eastern part of the Kitikmeot Region of Nunavut, approximately 430 km northwest of the town of Rankin Inlet, Nunavut. The Project is accessible by air, either from Rankin Inlet or Baker Lake, Nunavut. Rankin Inlet and Baker Lake are serviced seasonally by barge and ship. The hamlets of Rankin Inlet, Baker Lake, Naujaat, Gjoa Haven, Taloyoak, and Kugaaruk are accessible by scheduled commercial flights.
The Committee Bay Project consists of 57 Crown Leases and 150 mineral claims in six non-contiguous blocks totaling approximately 247.972.53 ha.
The figure below presents property location and claims comprising the Committee Bay project:
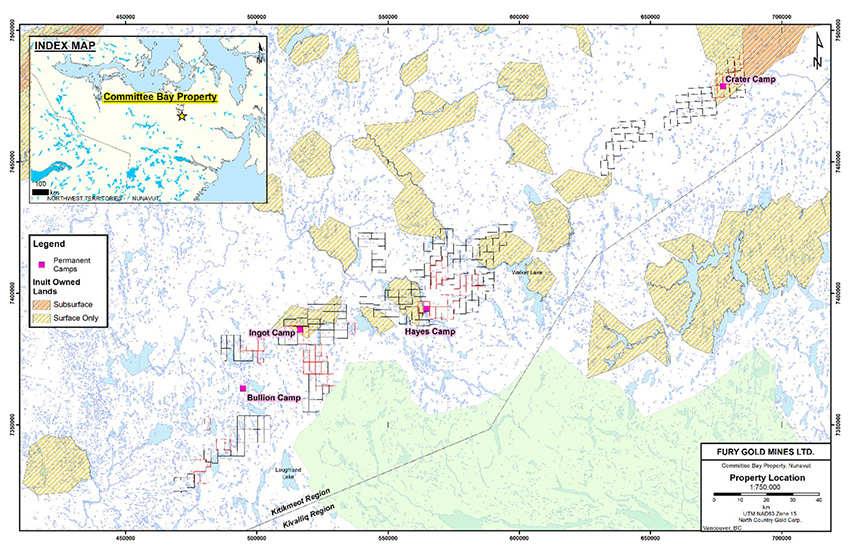
Access, Climate, Local Resources, Infrastructure and Physiography
The Committee Bay Project is accessed via fixed wing charter primarily through a 914 m, graded, esker airstrip at Hayes Camp, a permitted, seasonally prepared 1,580 m winter ice airstrip, which is constructed on the adjacent Sandspit Lake, or a 320 m tundra airstrip at the Bullion Camp.
The Committee Bay Project is located in the Wager Bay Plateau Ecoregion of the Northern Arctic Ecozone (Marshall and Schutt, 1999). This ecoregion is classified as having a low arctic ecoclimate. Summers are short and cold, with mean daily temperatures above freezing only in July and August. Snow cover usually lasts from September to June, but it can fall during any month. Most of the lakes are icebound until approximately mid-July. Precipitation is moderate throughout the year, but drifting of snow in the winter can result in considerable localized accumulations, particularly on the sides of hills. Fog is often a problem near the coast and at higher elevations particularly during the late spring to early summer and the fall months.
There is no permanent infrastructure at the Committee Bay Project. The Company maintains four camps to support seasonal exploration campaigns in various portions of the Committee Bay Project, namely the Hayes Camp (100-person capacity), the Bullion Camp (20- to 40-person capacity), Crater Camp (40-person capacity) and the Ingot Camp (10-person capacity). A drill water system is maintained at the Three Bluffs site.
Geology, Mineralization and Deposit Types
The Committee Bay Project area, situated in the Churchill Structural Province, is underlain by Archean and Proterozoic rocks and extensively covered by Quaternary glacial drift. It comprises three distinct Archean sub-domains (Prince Albert Group, Northern Migmatite, and Walker Lake Intrusive Complex).
The Committee Bay Greenstone Belt (the “CBGB”), which hosts the gold occurrences discussed in the Committee Bay Report, is composed of Prince Albert Group rocks. These are bounded by the wide, northeast-striking Slave-Chantrey mylonite belt to the northwest and by the Amer and Wager Bay shear zones to the south. Two major fault systems, the northeast-striking Kellet fault and the northwest-striking Hayes River fault, intersect the central portion of the CBGB and cut the Prince Albert Group rocks. Gold occurrences in the CBGB appear to be spatially related to the major shear systems and their sub-structures indicating the potential for the re-mobilization of mineral-bearing fluids along these structures.
The regional strike of rock units in the West Laughland Lake area is generally north but shows a degree of variability. Units, generally vertically dipping in much of the CBGB, have a more moderate to shallow dip at Four Hills. Rocks generally strike northeast from Four Hills east to the Committee Bay Project. In the Hayes River area, the east-striking Walker Lake shear zone is the dominant structure. Dips in the Hayes River area are generally sub-vertical and there is evidence of flexural shear and silicification along lithological contacts between iron formation and talc-actinolite schist (meta-komatiite). Rocks of the Curtis River area, approximately 120 km northeast of the Hayes River area, strike northeast and dip sub-vertically.
The iron formations that host the Three Bluffs, Antler, Hayes, and Ledge gold occurrences have unique lithological associations with their contact rocks and do not appear to be stratigraphically equivalent.
Three low, rounded, rusty outcrops, called West, Central, and East, comprise the Three Bluffs gold occurrence. Gold mineralization is hosted in gossanous, predominantly oxide, silicate, and sulphide facies iron formations. Iron formation thicknesses range from 25 m to 30 m at the West Bluff to 55 m at the Central Bluff. The Three Bluffs iron formation maintains a thickness of 10 m for a minimum strike length of 1.8 km and is at least 55 m thick for 700 m. The iron formations are poorly banded to massive with locally shared, quartz-veined intervals of up to 3 m near lithological contacts. Chlorite and epidote alteration indicates either lower amphibolite grade metamorphism (epidote-amphibolite facies) or the result of retrograde greenschist facies metamorphism associated with gold deposition. Local mineralization, composed of disseminated pyrite and pyrrhotite, can occupy up to 50% of the rock volume.
History
Key historical events for the project are include:
(i) in 1961 and 1967, mapping was done in the area by the Geological Survey of Canada (“GSC”);
(ii) in 1970, King Resources Company conducted reconnaissance geological mapping and sampling in the Laughland Lake and Ellice Hills areas, with follow-up work including geophysics and detailed mapping, trenching, and sampling;
(iii) in 1970, 1974, and 1976 Cominco Ltd. Carried out reconnaissance and detailed geological mapping, ground geophysics, and sampling in the Hayes River area; (iv) in 1971, the Aquitaine Company conducted airborne electromagnetic (‘EM”) and magnetometer surveys;
(v) from 1972 to 1977, detailed re-mapping of the area was done by the GSC;
(vi) in 1979, Urangesellschaft Canada Ltd. Carried out reconnaissance airborne radiometric surveys and prospecting for uranium in the Laughland Lake area;
(vii) in 1986, Wollex carried out geological mapping and rock sampling in the West Laughland Lake area;
(viii) in 1992, GSC conducted geological re-assessment of the mineral potential of the Prince Albert Group;
(ix) in 1994, channel sampling carried out over the Three Bluffs area but the results were lost;
(x) in 1996, Terraquest Ltd. Conducted a high-resolution airborne magnetometer survey;
(xi) from 1997 to 1998, P.H. Thompson Geological Consulting Ltd. Conducted regional geological mapping in the Three Bluffs area;
(xii) from 1999 to 2002: GSC conducted a multi-disciplinary study of the Committee Bay Greenstone Belt;
(xiii) from 1992 to 2012, North Country Gold and its predecessors Carried out prospecting, rock sampling, gridding, airborne and ground geophysics, geophysics, geological mapping, and reverse circulation and diamond drilling on several of the gold targets including Three Bluffs, Three Bluffs West, West Plains, Anuri, Inuk, Antler, and Hayes.
Historical drilling (pre-2015) on the Project amounts to 68,269.98 metres drilled in 426 drill holes. Of the historical drilling, 351 drill holes comprising 58,575.56 m were completed at Three Bluffs and are the basis for the Three Bluffs Mineral Resource described below.
Sampling, Analyses and Data Verification
Committee Bay RAB Drilling QA/QC Disclosure
Intercepts were calculated using a minimum of a 0.25 g/t Au cut off at beginning and end of the intercept and allowing for no more than four consecutive samples (six metres) of less than 0.25 g/t Au.
Analytical samples were taken using 1/8 of each 5ft (1.52m) interval material (chips) and sent to ALS Global (“ALS”) Lab in Yellowknife, NWT and Vancouver, BC for preparation and then to ALS Lab in Vancouver, BC for analysis. All samples are assayed using 30g nominal weight fire assay with atomic absorption finish (Au-AA25) and multi-element four acid digest ICP-AES/ICP-MS method (ME-MS61). Quality Assurance/Quality Control (“QA/QC”) programs using internal standard samples, field and lab duplicates and blanks indicate good accuracy and precision in a large majority of standards assayed.
Committee Bay Diamond Drilling QA/QC Disclosure
Intercepts were calculated using a minimum of a 0.25 g/t Au cut off at beginning and end of the intercept and allowing for no more than six consecutive metres of less than 0.25 g/t Au.
Analytical samples were taken by sawing NQ diameter core into equal halves on site and sent one of the halves to ALS Lab in Yellowknife, NWT for preparation and then to ALS Lab in Vancouver, BC for analysis. All samples are assayed using 50g nominal weight fire assay with atomic absorption finish (Au-AA26) and multi-element four acid digest ICP-AES/ICP-MS method (ME-MS61). QA/QC programs using internal standard samples, field and lab duplicates and blanks indicate good accuracy. Due to the nuggety nature of mineralization encountered, the Company will be running additional analysis on duplicate samples to better understand the analytical precision.
True widths of mineralization are unknown based on current geometric understanding of the mineralized intervals.
Committee Bay Grabs QA/QC Disclosure:
Approximately 1 to 2 kg of material was collected for analysis and sent to ALS Lab in Vancouver, BC for preparation and analysis. All samples are assayed using 50 g nominal weight fire assay with atomic absorption finish (Au-AA26) and multi-element four acid digest ICP-AES/ICP-MS method (ME-MS61). QA/QC programs for 2018 rock grab samples using internal standard samples, lab duplicates, standards and blanks indicate good accuracy and precision in a large majority of standards assayed. Grab samples are selective in nature and cannot be consider as representative of the underlying mineralization.
Core arrives in camp at the end of each drill shift where geological technicians check and correct and downhole distance discrepancies. Technicians record core recovery, fracture density and orientation, magnetic susceptibility, and overall rock quality designation. Geological logging follows, comprising measurement and descriptions of geological units and the collection of semi- quantitative data such as the number of visible gold occurrences, volume percent sulphide minerals, volume percent of alteration minerals, volume percent vein quartz, etc. Sample intervals are then designated by the logging geologist focusing on sulphide bearing and/or silicified Intervals that are well bracketed by apparently unmineralized rock. Protocols limit sampling intervals between 0.75 m and 1 m in length with a minimum length of 0.3 m and a maximum length of 1.5 m so long as geological boundaries were honoured.
Drill core is digitally photographed and core samples are marked for sawing. Sampling intervals, geological boundaries, and a saw line are marked by the logging geologist and the core is sawed in half longitudinally by technicians. One half of the core is placed in a sample bag with a uniquely numbered tag and secured with plastic cable ties. Each batch of 20 field samples contain a blank and one of four commercial certified reference materials. The remaining half core is returned to the core box for reference. The majority of the reference core remains on-site except for chosen intervals which are taken to Edmonton, Alberta for display purposes. Individual sample bags are placed inside a larger bag which is closed with a security seal for shipment to the laboratory.
Assaying procedures are generally similar to those used in 2003, with some minor modifications. The standard aliquot size was increased to 2AT (58.32 g) and the samples were all analyzed using FA with a gravimetric finish. Selected samples, containing visible gold or which assayed greater than 20 g/t Au, are re-analyzed using metallic screen fire assay that include twin 2AT gravimetric assays of the fine fraction. A pulp from each sample is sent for standard 30 element ICP analysis using a three-acid digestion.
All the RAB and diamond drill core samples are analyzed at the ALS laboratory in Vancouver, BC, by fire assay of a 50 g sample followed by a gravimetric finish according to ALS lab code Au-GRA22 and by a multi-element inductively couple plasma atomic emission spectrometry or mass spectrometry (“ICP-AES/ICP-MS”) package following a four acid digestion of a one gram sample according to ALS lab code ME-MS61. Sample intervals with visible gold in core were assayed using a Screen Fire Assay method on a one kg sample according to ALS lab code Au-SCR24 where the entire sample is screened to 100 μm and fire assays are performed on a 50 g sample of <100 μm material and on the entire >100 μm material. The fire assay is calculated as a weighted average of the two fire assays.
In the opinion of Roscoe Postle Associates Inc. (“RPA”, formerly Scott Wilson Roscoe Postle Associates Inc.), the sample collection, preparation, analysis, transport, and security procedures at the Committee Bay Project are adequate for use in the estimation of mineral resources.
Mineral Processing and Metallurgical Testing
2003 Metallurgical Testing
Dawson Metallurgical Laboratories, Inc. of Salt Lake City, Utah, was commission in 2003 to conduct metallurgical tests on Three Bluffs mineralized material. Twelve drill core samples, eight high-grade and four low-grade, totaling approximately 20 kg were used. The mineralogical study reported the principal sulphide minerals as pyrrhotite with minor pyrite. No reference was made to any deleterious elements in the samples.
The test indicated that 92% gold recovery could be achieved with cyanidation but the presence of pyrrhotite would result in high cyanide consumption. RPA notes that these preliminary tests suggest gold at Three Bluffs can be recovered using conventional methods.
2008 Metallurgical Testing
Mineral processing testwork comprising exploratory gravity concentration, cyanide leaching, and froth flotation studies were undertaken by Process Research Associates Ltd. (“PRA”) under the guidance of RPA. The sample used was a 110 kg composite of drill core samples from the 2007 exploration program with an average estimated grade of 4.3 g/t Au and 7.5% S.
Additional gravity recovery test work on Three Bluffs mineralization was performed by Knelson Research Technology Centre. An 18 kg sample, taken from a composite of coarse rejects sample material from 2007 drill core samples, was subjected to multi-pass testing utilizing a bench-scale enhanced gravity concentrator. The tests were designed to examine recovery trends for gold and gold-bearing sulphides.
Based on the composite sample tested it was expected that Three Bluffs mineralization could be processed by various standard beneficiation steps to recover approximately 93% of the gold. The limited metallurgical testwork conducted to date suggests that the gold can be recovered by conventional means, a combination of gravity and flotation followed by cyanide leaching of the concentrate. The metallurgical test results indicated that a combination of gravity and flotation followed by cyanide leaching of the concentrate is likely the most suitable processing option.
2009 Metallurgical Testing
Follow-up work at PRA was then undertaken in April 2009 to look specifically at a flowsheet consisting of gravity recovery followed by cyanidation. These results were reported by PRA on May 6, 2009.
At a primary grind size P80 of 74 μm, gold was effectively extracted by gravity and flotation, with 96% of the gold recovered. In a single Locked-Cycle test, a gravity circuit recovery of 60.5% gold in 0.22% of mass, followed by a cleaner flotation recovery of 35.3% gold in 17.7% of the mass, was obtained. Thus, an overall gold recovery of 95.8% in 17.9% of the mass was shown to be possible. Flotation recovery without gravity scalping was also reasonably successful.
Flotation concentrate was subjected to cyanide leach testwork. A total of eight concentrate leach tests were performed. A single whole ore cyanide leach test obtained 79.2% gold extraction after 48 hours and 94.6% after 72 hours.
Several issues were identified during metallurgical testing of samples, the largest issue lies with cyanide consumption. Cyanide consumption has been found to be extremely high at up to 0.2 kg/h, while leaching kinetics remain low. Another issue that has been identified is that gold bearing sulphides are not amenable to enhanced gravity separation, therefore batch concentration and not continuous gravity concentration should be utilized.
Based on the samples tested to date, Three Bluffs ore is generally considered to be relatively free-milling. Gravity concentration has been effective in recovering up to 60% of the gold. Much of the remaining gold can be effectively recovered by either flotation or cyanide leaching to produce an overall metallurgical recovery above 90%. RPA recommends further optimization and variability work on a greater variety of samples from the Three Bluffs property if further economic studies are conducted.
There has been no mineralogical processing and metallurgical testing since 2009.
2023 Mineral Resource Estimates
The mineral resources at the Committee Bay Project are estimated to be approximately 2.07 million tonnes of indicated mineral resources grading 7.85 g/t Au, containing 524,000 ounces of gold, and 2.93 million tonnes of inferred mineral resources grading 7.64 g/t Au, containing 720,000 ounces of gold as of September 11, 2023. No additional drilling within the resource has been completed and the 2017 Mineral Resource Estimate and the 2017 block model remains appropriate for the 2023 mineral resource calculation in the opinion of Mr. Atkinson. Mr. Atkinson acknowledges that some other parties may be using somewhat higher long-term gold price assumptions than were used for this estimate. A bulk density of 3.15 t/m3 was applied for estimation of tonnage. This value was derived from a total of 6,426 density determinations carried out on drill core from a variety of locations in the deposit.
The estimate was carried out using a block model method constrained by wireframe grade shell models, with Inverse Distance Cubed (“ID3”) weighting. Two sets of wireframes and block models were employed: one contemplated open pit mining and the other, underground mining. The block model grade interpolations were checked by (i) an inspection of the interpolated block grades in plan and section views and comparison to the composite grades, and (ii) through a statistical comparison of global block and composite mean grades. Inspection of the block grades in plan and section indicates that the grade estimation honours the drill hole grades reasonably well.
The reported mineral resources at calculated cut-off grades of 3.0 g/t Au for open pit mining and 4.0 g/t Au for underground mining based on the following assumptions:
| ● |
Gold Sale Price: US$1,200/oz; |
| ● |
Process Recovery 93%; |
| ● |
Open Pit Mining Cost C$10.00/t; |
| ● |
Underground Mining Cost C$70.00/t; |
| ● |
Process + G&A Costs C$75.00/t; and |
| ● |
Exchange Rate 1.25 US$/C$. |
To fulfill the resource criteria of “reasonable prospects for eventual economic extraction”, a pit shell analysis was run on the 0.5 g/t Au model to determine how much of the deposit could potentially be extracted using open pit methods. The analysis was done using Whittle software with very preliminary assumptions for pit slopes, metallurgical recovery, prices, and costs.
For this mineral resource the preliminary pit shell that was optimized in 2013 using a different gold price and cost assumptions (listed below) than those used to calculate the updated cut-off grade. Mr. Atkinson considers this approach reasonable given that the pit shell used to report open pit resources is conceptual and the relative difference between the underground and open-pit resource cut-off grades is negligible.
The following cost assumptions were used:
| ● |
Gold Sale Price: US$1,500/oz; |
| ● |
Overall Pit Slope Angles: 50°; |
| ● |
Process Recovery 93%; |
| ● |
Mining Cost US$10.00/t; and |
| ● |
Process + G&A Costs US$60.00/t |
Blocks from the open pit model captured within this shell were considered eligible for reporting as open pit resources. The same pit shell was applied to the underground model, except that blocks from this model were included in the resource only if they were outside of the shell.
Mineral Resources as of December 31, 2023(1-7)
| Class |
Type |
Cut-off (g/t AU) |
Tonnes (000 t) |
Gold Grade (g/t Au) |
Contained Gold |
||||||||||||
| Indicated |
Open Pit |
3.0 | 1,760 | 7.72 | 437,000 | ||||||||||||
| Indicated |
Underground |
4.0 | 310 | 8.57 | 86,000 | ||||||||||||
| Total |
2,070 | 7.85 | 524,000 | ||||||||||||||
| Inferred |
Open Pit |
3.0 | 590 | 7.57 | 144,000 | ||||||||||||
| Inferred |
Underground |
4.0 | 2,340 | 7.65 | 576,000 | ||||||||||||
| Total |
2,930 | 7.64 | 720,000 | ||||||||||||||
Notes:
1. Mineral Resources are not Mineral Reserves as they do not have demonstrated economic viability, although, as per CIM requirements, the Mineral Resources reported above have been determined to have demonstrated reasonable prospects for eventual economic extraction.
2. The Mineral Resources were estimated in accordance with S-K 1300 definitions, which are consistent with the definitions adopted by the Canadian Institute of Mining, Metallurgy and Petroleum (CIM), CIM Standards on Mineral Resources and Reserves, Definitions (2014) and Best Practices Guidelines (2019) prepared by the CIM Standing Committee on Reserve Definitions and adopted by the CIM Council.
3. The Mineral Resources Committee Bay Gold Project was initially reported in Ross (2017) – QP David A. Ross, M.Sc., P.Geo, effective date of May 31, 2017.
4. The resources reported above are reviewed in detail within this Report and are accepted as effective as of December 31, 2023 by the Qualified Person, Mr. Bryan Atkinson, Senior Vice President Exploration of the Company.
5. The Cutoff grades were determined using average block grade values within the estimation domains and an Au price of US$1,200/oz, and Process Recovery of 93%, Open Pit mining costs of C$10.00/t, Underground mining costs of C$70.00/t, Process and G&A costs of approximately C$75/t and an exchange rate of 1.25 US$/C$.
6. A bulk density values value of 3.15 t/m3 was assigned based on available SG measurements.
7. Differences may occur in totals due to rounding.
Exploration Program Recommendations
The following summarizes the work programs recommended by the authors of the Committee Bay Technical Report Summary for the Committee Bay Project. The Phase 1 program is anticipated to include collection of 15,000 infill detailed till samples and 7,500 m of Diamond drilling along the shear zone sub-parallel to the Three Bluffs deposit. The Phase 1 program is estimated to cost approximately $5 million. Details of the recommended Phase I program can be found below.
A Phase 2 exploration program will be drill intensive. An additional 10,000 – 15,000 m of diamond drilling should be completed at the Three Bluffs deposit to explore the down dip potential of the limb mineralization as well as tying in the newly identified shear zone hosted mineralization with the ultimate goal of updating the Mineral Resource Estimate. An additional 10,000 m of drilling should be allocated to regional targets defined from the Phase 1 program. The Phase 2 program is estimated to cost between $15 and $20 million. Details of the recommended Phase 2 program can be found below although readers must appreciate there is no certainty that Fury will carry out all or a portion of these recommendations in the foreseeable future.
Recommended Work Programs for 2024 and beyond
| Phase 1 |
|||||
| Type |
Details |
Cost Estimate (C$) |
|||
| Labour |
Staff Wages, Technical and Support Contractors |
350,000 | |||
| Assaying |
Sampling and Analytical |
150,000 | |||
| Drilling |
Three Bluffs Diamond Drilling (7,500 meters at $220/m) |
1,650,000 | |||
| Till Sampling |
Detailed sampling program |
120,000 | |||
| Land Management |
Consultants. Assessment Filing, Lease Payments |
250,000 | |||
| Community Relations |
Community Tours, Outreach |
30,000 | |||
| Information Technology |
Remote site communications and IT |
35,000 | |||
| Safety |
Equipment, Training and Supplies |
15,000 | |||
| Expediting |
Expediting (Rankin Inlet, Baker Lake, Churchill) |
150,000 | |||
| Camp Costs |
Equipment, Maintenance, Food, Supplies |
250,000 | |||
| Freight and Transportation |
Freight, Travel, Helicopter, Fixed Wing |
450,000 | |||
| Fuel |
1,000,000 | ||||
| General and Administration |
100,000 | ||||
| Sub-total |
4,550,000 | ||||
| Contingency (10%) |
455,000 | ||||
| Total |
5,005,000 | ||||
| Phase 2 |
|||||
| Type |
Details |
Cost Estimate (C$) |
|||
| Labour |
Staff Wages, Technical and Support Contractors |
1,750,000 | |||
| Drilling |
20,000 – 25,000 m Diamond Drilling at Three Bluffs and regional |
6,500,000 | |||
| Assaying |
Sampling and Analytical |
750,000 | |||
| Community Relations |
Community Tours, Outreach |
50,000 | |||
| Information Technology |
Remote site communications and IT |
150,000 | |||
| Safety |
Equipment, Training and Supplies |
75,000 | |||
| Expediting |
Expediting (Rankin Inlet, Baker Lake, Churchill) |
550,000 | |||
| Camp Costs |
Equipment, Maintenance, Food, Supplies |
1,250,000 | |||
| Freight and Transportation |
Freight, Travel, Helicopter, Fixed Wing |
1,950,000 | |||
| Fuel |
2,750,000 | ||||
| General and Administration |
400,000 | ||||
| Sub-total |
16,175,000 | ||||
| Contingency (10%) |
1,617,500 | ||||
| Total |
17,792,500 | ||||
2015 through 2021 Committee Bay Exploration by Fury
Since acquiring the Project, Fury Gold has completed a total of 47,194.47 m of RAB drilling in 271 drill holes as well as 14,006.28 m of diamond drilling as part of the Phase 1 recommendations detailed above. In addition to the drilling extensive regional and infill till geochemical campaigns, ground and airborne geophysical surveying as well as aerial drone surveying have been undertaken. The Company has incurred approximately $60M in expenditures exploring the Project. The Company views that the results from this exploration further support conclusions drawn in the Committee Bay Report and do not represent a material change to the Committee Bay Project. The Company intends to continue its exploration in accordance with the Phase 2 recommendations with the continued testing of regional drill targets and expansion drilling at the Three Bluffs deposit.
The Company did not undertake an exploration program at Committee Bay in 2022 in order to focus available resources on the exploration program in Quebec.
2018 Committee Bay Exploration Program
During 2018, the Company drilled approximately 10,000 m across several targets in the vicinity of the Three Bluffs deposit but away from known mineralization. Summarized results from this program are highlighted as follows:
| ● |
Aiviq - 16 core and 7 RAB holes - The majority of the core drill holes intersected 20 - 40 meter widths of intense quartz veining and sulphidized banded iron formations. Results from the Aiviq core drill program include highlights of 13.5 m of 1.54 g/t gold (including 6 m of 3.3 g/t gold) 4.5 m of 2.93/t Au, and 1.5 m of 8.95/t Au; |
| ● |
Kalulik - 8 RAB holes - The 2018 drill program at Kalulik identified two separate gold-bearing hydrothermal systems, 4 km apart, that intersected broad zones of low-grade mineralization over 10 - 20 meter widths within sulphidized banded iron formations and associated quartz veining. These results include 21.34 m at 0.4 g/t gold and 16.76 m at 0.45 g/t gold; and, |
| ● |
Aarluk - 7 RAB holes - At the Aarluk prospect the best intercept was 3.05 m of 3.39 g/t gold, which was encountered in a weakly sulphidized banded iron formation. |
2019 Committee Bay Exploration Program
During 2019, the Company followed up on the results from its 2018 program by completing the following:
| ● |
Machine Learning - A total of twelve new targets were generated through unbiased processing of existing exploration data. Two of the targets overlapped with the Company’s geologist derived targets adjacent to the Aiviq and Kalulik discoveries; |
| ● |
Drill Program - A 2,700m diamond drill program at the Committee Bay Project targeted a combination of both machine learning and traditional geologist generated targets and drilled a new gold-bearing system along the regional fault zone that hosts the Aiviq and Kalulik systems. These results include 30 m of 0.67 g/t gold, including 1.5m of 5.03 g/t gold; and |
| ● |
IP Survey - A 27 line - kilometer induced polarization survey was conducted to identify both chargeability and conductivity targets along the Aiviq-Shamrock corridor. |
2021 Committee Bay Project Drill and Exploration Program
The Company completed 2,587m of diamond drilling during a six-week field program in the third quarter of 2021. The drilling was focused on expanding the defined high-grade mineralization at the Raven prospect and testing the potential mineralization below the current resource at the Three Bluffs deposit.
Raven Prospect
The Raven prospect is located in the southwest third of the Committee Bay Gold Belt, approximately 50 km west of the Three Bluffs deposit. The prospect is situated along an 8km long shear zone where defined gold mineralization is strongly associated with arsenopyrite within sheared and altered gabbros as well as within quartz veins marking the contact between the gabbro and metasediments over a known strike length of approximately 1.2 km. There have been 207 rock samples historically taken over the defined area of mineralization, with 30 samples returning values greater than 5 g/t gold with a peak value of 143 g/t gold. Importantly, only 1.2 km of the 8 km shear zone has been systematically explored to date.
The prospect has a total of nine historical drill holes totaling 1,670 m with intercepts including 5.49 m of 12.6 g/t gold, 2.84 m of 31.1 g/t gold, and 5.38 m of 2.99 g/t gold over a drilled strike length of 400 m. Historical drilling at the prospect has defined a high-grade body of mineralization approximately 250 m in length, with a 30-degree plunge to the east that is open along strike and down dip. Highlights include drill intercepts of 9.18 g/t gold (Au) over 1.5 m and 7.30 g/t Au over 1.0m in drill hole 21RV-012 and 0.88 g/t Au over 8.00 m in drill hole 21RV-011 as well as rock grab results of up to 32.90 g/t Au from a newly identified gold mineralized outcrop 150 m to the south of the Raven structure that was drilled in this program.
The reported intercepts have extended mineralization 160 m down dip and 70 m along strike from historical drilling at Raven. These results paired with the identification of a previously untested gold mineralized structure clearly indicate the significance of the Raven structure and shear zones in general, as exploration targets along the belt. Additional till sampling was completed at the Raven prospect to explore the entire length of the 8 km shear zone to define new targets. The sampling has identified high-grade gold mineralization 150 m south of the main Raven showing along an undrilled structure at the edge of an 8 km long regional shear zone. Seven rock grab samples from outcrop returned results above 10 g/t Au with a peak of 32.9 g/t Au. Gold and arsenic in till now define a coherent 1,400 m by 500 m anomaly at Raven.
Three Bluffs Deposit
The Three Bluffs deposit contains a high-grade resource defined by 525,000 oz at 7.85 g/t gold in the indicated category and 720,000 oz at 7.64 g/t gold in the inferred category. The deposit is characterized by gold mineralization hosted within a folded, silicified, and sulphidized banded iron formation. The anticline that defines the deposit has a strike length of approximately 4km and has been drilled from 150 m to 650 m vertical depth and is open down dip. High-grade mineralization at the deposit is associated with high conductivity responses due to the intense sulphidation of the banded iron formation as evidenced in the hinge zone of the anticline.
Fury Gold's primary target for 2021 at the Three Bluffs deposit was a conductive body that measures 600 m by 200 m at a vertical depth of between 300 m and 500 m. The target is down dip from high grade mineralization within the limbs of the anticline and is offsetting the following intersections: 5 m of 40.6 g/t gold, 5.3 m of 29.03 g/t gold, 11 m of 16.23 g/t gold, 5 m of 15.2 g/t gold, 2 m of 21.81 g/t gold, and 2 m of 19.38 g/t gold. The Company completed a single drill hole that intersected 10.0 m of 13.93 g/t Au, 3.0 m of 18.67 g/t Au and 1.0 m of 23.2 g/t Au. These intercepts are associated with a deformation zone within a meta-sediment unit that is underexplored at Three Bluffs.
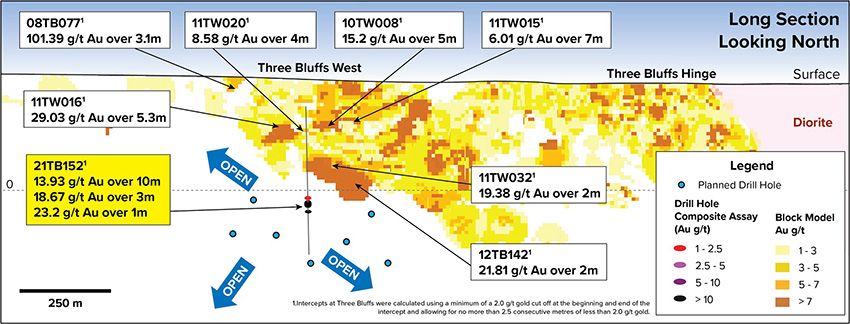
Figure 2: Three Bluffs Gold Deposit Long Section Looking North depicting the 2021 drilling results.
2022 and 2023 Committee Bay Project Exploration Program
The Company did not undertake an exploration program in 2022 and 2023 in order to focus all resources on the Quebec programs. However all claims were and are maintained in good standing.
2024 Committee Bay Project Exploration Program
The 2024 exploration program prioritized follow-up and infill sampling of highly anomalous regional gold-in-till samples with unidentified sources. The exploration model focused on regional shear zones proximal to favourable lithologies such as iron formation and ultramafic lithologies.
Three drill targets have now been determined:
| 1. |
Three Bluffs Shear, where drilling in 2021 intercepted 13.93 g/t Au over 10 metres (m) (see news release dated December 1, 2021); |
| 2. |
Raven Shear where 7 rock samples have averaged 16.12 g/t gold; and |
| 3. |
Burro West where a 300 by 300 m discrete >90th percentile gold in till anomaly has been defined with a peak value of 50 ppb gold. |
The program resulted in the collection of 546 infill till samples from two detailed grids, Burro West and Aarluk East, and 69 rock samples from 5 targets.
The 2024 mapping and rock sampling focused on shear zones proximal to and sub-parallel to favourable lithologies for gold mineralization within the Committee Bay Greenstone Belt with samples being collected at Three Bluffs, Raven, Burro, Aarluk East and Aarluk West.
The mapping and rock sampling at Three Bluffs was able to confirm the continuity of the interpreted shear zone that is sub-parallel to the Three Bluffs iron formation to the east of the reported 2021 intercept of 13.93 g/t gold over 10 m from drill hole 21TB152 (see news release dated December 1st, 2021). The reported 2021 intercept was a 120 m step out from the defined high-grade Three Bluffs gold deposit which on its own demonstrates the potential to meaningfully expand the known resource. The mapped continuation of this sub-parallel shear zone to the east trends into an area where there is no historic drilling providing an excellent near deposit drill target.
At Raven rock sampling and mapping has identified a mineralized sub parallel shear zone to the south of the main Raven showing where the average grade from seven rock samples collected is 16.12 g/t gold. The extensions along strike of the Raven south shear zone are obscured by glacial till deposits however, the average grade from outcrop sampling and prevalence of visible gold observed in the limited outcrop are encouraging and warrant drilling.
Infill till sampling at the Burro West target has identified a robust multi point +90th percentile approximately 300 x 300 m gold in till anomaly. The Burro West anomaly is spatially associated with a break in the regional magnetics data which is interpreted as a sheared contact between mafic volcanics and ultramafic lithologies. Additionally, the highest gold value returned from all the 2024 infill till samples is located at the SW corner of the Burro West grid and remains open.
The Aarluk East grid returned several intriguing moderate isolated gold in till anomalies associated with interpreted regional structures that require additional mapping work to potentially advance to the drill ready stage.
2023 Committee Bay resource estimate and technical report
Three Bluffs resource estimations were completed by APEX Geoscience Ltd. (“APEX”) (see the Technical Report on the Committee Bay Project, Nunavut Territory, Canada, dated September 11, 2023, and filed under Fury’s SEDAR+ profile). It supersedes all previous Committee Bay technical reports.
The Company expects to incur approximately $160 in annual mineral claims expenditures in 2025, in order to keep the property in good standing. Payments totalling $157 were made during the year ended December 31, 2024, in respect of these mineral claims.
The following disclosure relating to the Éléonore South project is based on information derived from the technical report summary on the Éléonore South Project entitled “Technical Report on the Éléonore South Project, Quebec, Canada” prepared by Mrs. Valerie Doyon, the Company’s Senior Project Geologist with an effective date of December 31, 2024 (the “Éléonore South Technical Report Summary”), as attached to this Annual Report as Exhibit 15.3. Mrs Doyon is a technically “qualified person” for the purposes of SK-1300. The Éléonore South Technical Report Summary conforms to SEC’s Modernized Property Disclosure Requirements for Mining Registrants as described in Subpart 229.1300 of Regulation S-K, Disclosure by Registrants Engaged in Mining Operations (“S-K 1300”) and Item 601(b)(96) - Technical Report Summary. All information of a scientific or technical nature contained below and provided after the date of the Éléonore South Report has been reviewed and approved by Mrs. Valerie Doyon.
The Éléonore South Project has been determined to be a material property for the purposes of S-K 1300 effective March 31, 2025.
Property Description and Location
The Éléonore South Project, 100% held and operated by by Fury, is an exploration stage project comprised of 282 claims, totaling 14,760 hectares (ha). Located in 1:50,000 scale NTS map sheets 33B12 and 33C09, approximately 200 km east of the Cree community of Wemindji, 330 km northwest of the town of Chibougamau and 800 km north of Montreal. The property is accessible, year-round, by either the James Bay Highway or Route du Nord and is located 100 km north of Nemaska, serviced by commercial flights twice per week. The centre of the property is located at approximately 75.98 degrees longitude west and 52.58 degrees latitude north.
116 of the claims are subject to an escalating Net Smelter Royalty (NSR) held by Osisko Royalties (Osisko Royalty). The Osisko Royalty is tied to overall production from these claims as well as from the Éléonore Mine property claims held by Newmont Corporation. The royalty amounts to 2% on the first 3 Moz of gold production and tops out at 3.5% after 8 Moz Au production. The royalty increases by 10% for gold prices above US$550/oz Au – again topping out at 3.5%. The remaining 166 claims are free of any royalty.
The Project is located north of the 52nd parallel (52ºN) and as such is subject to the provisions of the James Bay and Northern Quebec Agreement (1975), and the Paix des Braves Agreement (2002). The Project falls within the Eeyou Istchee Territory and straddles the boundary between the Cree Nations of Wemindji and Eastmain, including trap lines held by Angus Mayappo and Roderick Mayappo (tallyman).
The Éléonore South project is located on Category III lands, as established under the James Bay and Northern Quebec Agreement. Category III lands are administered by the province of Quebec, and they do not have any substantial restrictions on mineral exploration. A notice of work must be forwarded to the Wemindji and Eastmain Communities and the tallyman prior to initiating exploration activities. The Project straddles the traditional territories of the Cree Nations of Wemindji and Eastmain (Figure 1) and lies on traplines VC-29, VC-35 and VC-36.
The figure below presents property location and claims comprising the Éléonore South Project:
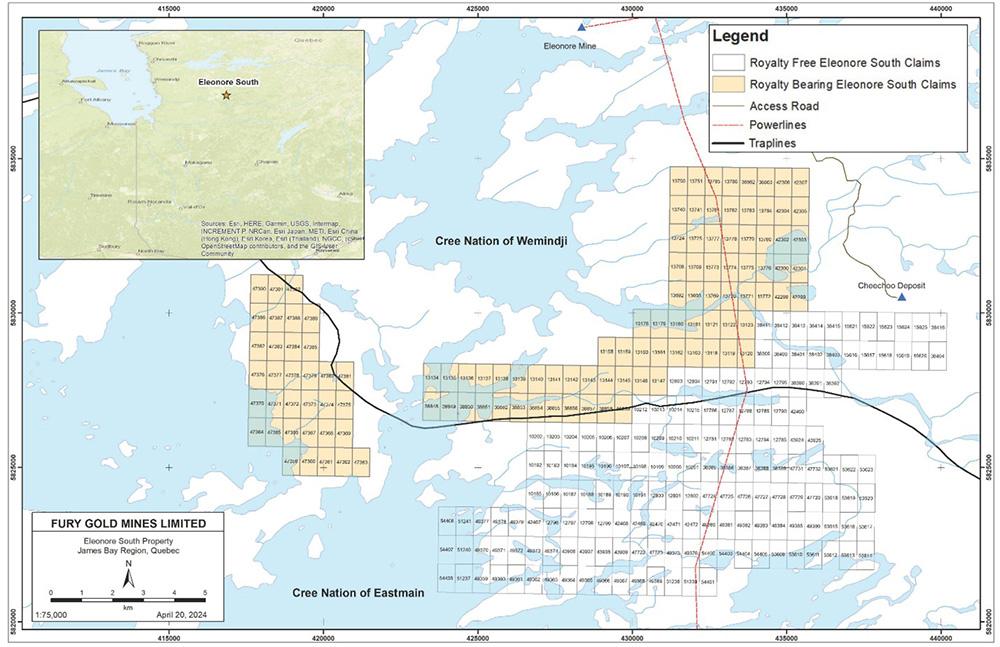
The Éléonore South property is strategically located in an area of prolific gold mineralization within the Eeyou Istchee James Bay gold camp and is locally defined by Newmont’s Éléonore mine and Sirios Resources’ Cheechoo deposit. The property has been explored over the last 12 years by the joint venture focused on the extension of the Cheechoo deposit mineralization within the portion of the Cheechoo Tonalite on the joint venture ground. Approximately 27,000 m of drilling in 172 drill holes, covering only a small proportion of the property at the Moni and JT prospects has been completed. Notable drill intercepts include 53.25 m of 4.22 g/t gold (Au); 6.0 m of 49.50 g/t Au including 1.0 m of 294 g/t Au and 23.8 m of 3.08 g/t Au including 1.5 m of 27.80 g/t Au.
In December 2020, Fury Gold announced the recognition of a large-scale gold in till anomaly on the Éléonore South property through a review of historical datasets. This target has not been drill tested. In September 2021 the ESJV initiated a field program designed to refine the broad geochemical anomaly into discrete targets for further follow up and eventual drill testing. Additionally, a regional survey was completed on the southern third of the property where no historical systematic sampling had been completed.
During the third quarter of 2022 an orientation biogeochemical sampling survey was completed over a buried fold hinge target interpreted to be hosted within the same sedimentary rock package as Newmont's Éléonore mine. A total of 641 biogeochemical samples were collected. In addition to the biogeochemical orientation survey the Company completed a rock sampling program within the nine discrete gold in soil anomalies identified from the 2021 field work. The nine discrete gold in till anomalies are centered on an east-west structural corridor that separates intrusives to the south and sediments to the north. The importance of this new structural framework is that the newly defined gold in till anomalies are located along deep-rooted structures clearly visible in the geophysical data. Based on the elemental associations observed of gold with arsenic, bismuth and tungsten, in both the historical and infill sampling the most likely style of mineralization to be encountered in the nine targets will be the Cheechoo style observed at the JT and Moni showings.
Access, Climate, Local Resources, Infrastructure and Physiography
The Project is located in the Eeyou Istchee James Bay Territory of Northern Quebec, approximately 200 km east of the Cree community of Wemindji, 330 km northwest of the town of Chibougamau and 800 km north of Montreal (NTS Map sheet 33B12 and 33C09). The Project is 15 km southeast of Newmont Corporation’s Éléonore Mine (Figure 1). The property is accessible, year-round, by either the James Bay Highway or Route du Nord and is located 100 km north of Nemaska, serviced by commercial flights twice per week.
The property is accessible, year-round through a combination of the Billy Diamond (James Bay) Highway, the Route du Nord and Hydro-Quebec’s Sarcelle road. Sirios Resources has constructed a resource access road which leads to the Cheechoo Deposit within the Cheechoo Tonalite along the central east portion of the Property. Éléonore South is located 100 km north of Nemaska, serviced by commercial flights twice per week.
Fury, through its Eastmain subsidiary, maintains a 20-person camp to support exploration activities at the Éléonore South project. The hydroelectric power line that feeds Newmont’s Éléonore Mine transects the Éléonore South property (Figure 1). Newmont’s Éléonore mine complex, including a private airport are located 15 km to the northwest. Necessities such as skilled labour and specialized equipment are sourced from Val-d’Or or Chibougamau. Many services are now available through numerous Cree owned businesses and partnerships in Wemindji, Eastmain and Nemaska.
The property is located within the Canadian Shield and is characterized by many lakes, swamps, rivers, and low-lying terrain. The Property is bordered to the west by the Opinaca Reservoir. The Gipouloux River flows westward through the northern portion of the Property. The Éléonore South project is located in the boreal forest where forest fires are common. Vegetation is typical of taiga, including areas dominated by sparse black spruce, birch, and poplar forests, in addition to large areas of peat bog devoid of trees.
Overburden is typically 3 to 4 m thick, with the exception of isolated areas where overburden thickness can reach 20 m. Numerous glacial eskers often reaching tens of km in length can be seen of satellite images.
Rock outcrops are sparse due to the abundance of quaternary deposits and swamps. The topography of the area is subdued and characterized dominantly by lowlands, with few hills that attain elevations up to 300 m above sea level.
Geology, Mineralization and Deposit Types
The Éléonore South property is in the northeastern part of the Archean Superior Province (4.3-2.6 Ga; Percival et al., 2012), in a region comprising both the La Grande and Opinaca Subprovinces. Both subprovinces were largely constructed and metamorphosed during a series of micro-continent collisions formerly known as the “Kenoran Orogeny” (ca. 2,720-2,660 Ma; Card, 1990; Percival et al., 2012). The property is entirely enclosed in the southwestern part of the La Grande Subprovince known as the Eastmain River domain at proximity of the boundary with the Opinaca Subprovince. This proximity with the Opinaca boundary is considered highly prospective for various types of gold mineralization along both north and south portions of the contact exemplified by the Éléonore and Eastmain mines, and several exploration projects such as Corvet Est, Poste Lemoyne and La Grande Sud.
The Éléonore South property is characterized by the widespread presence of metasedimentary rocks and felsic intrusions. The northern part of the main block consists almost exclusively of the LGSP Low Formation (which has in the past been attributed to the OPSP). The Low Formation comprises essentially variably recrystallized tubiditic biotite meta-wacke along with minor aluminous porphyroblasts bearing meta-pelite bands, conglomerates and iron formations. Its deposition is poorly constrained due to a complex history resulting in apparently conflicting dates. The Ell Lake diorite (2,706±2 Ma, Fontaine et al., 2017) intrudes the sediments, setting a local minimum age for consolidation, while sedimentation is locally thought to have kept going well after 2,700 Ma (Bandyayera et al., 2010; Ravenelle, 2013). However, some parts were deposited as early as shortly after 2,714 Ma. (Bandyayera et al., 2010) The sediments were therefore likely deposited in a tectonically active basin with magma intruding barely consolidated sedimentary rocks, while some parts were still sedimenting. Proximity and similarity in composition and chronology suggest that the Low Formation could represent a more proximal lower grade extension of the Laguiche basin (OPSP).
Two distinct styles of mineralization have been identified to date; structurally controlled quartz veins hosted within sedimentary rocks similar to the high-grade mineralization observed at the Éléonore Mine; and intrusion-related disseminated gold mineralization similar to that seen at the low-grade bulk tonnage Cheechoo deposit with higher grade potential as seen at the JT and Moni Prospects on the project.
History
Regional exploration work was undertaken in the 1970s to evaluate the mineral economic potential of the area in anticipation of the flooding· resulting from the construction of the James Bay hydroelectric projects. Lake bottom sediment and geophysical surveys were conducted as well as regional geological mapping. Systematic and focused exploration work on the property started in 2005.
1970
In 1970’s, Société de Développement de la Baie James (SDBJ) did an evaluation of the mineral endowment of the area in anticipation of the flooding that was planned with the building of the James Bay hydroelectric projects (GM 34000, 34001, 34002 and 38167).
1976
In 1976 Quebec Government (MRNF) carried out a geological compilation of the James Bay area (DP 358 - Dube & al.,1976).
1977
In 1977 Quebec Government (MRNF) carried out a geological mapping covering the western part of the NTS 32/C09 (DPV 446 - Remick, 1976).
1999
In 1999 Quebec Government (MRNF) carried out a geological reconnaissance which covered the eastern part of the NTS 33/B12 (Simard & Gosselin, 1999).
2002
In 2002 Quebec Government (MRNF) worked on a geological synthesis report by Moukshil et al., 2002 - ET2002-06.
2003
In 2003, Azimut Exploration Inc. acquires by map designation the Opinaca C Property. The property counts 99 claims, (news release from 2003, November 24th).
2004
In 2004, Viriginia Gold mines discovered the Roberto gold deposit located 15 km north and adjacent to the Eastmain's Éléonore South Property (Robinson & Tolhurst, 2011).
Following the discovery of Roberto deposits, Azimut Exploration Inc. increases its holding near the area of Éléonore discovery and add 67 map designated claims to Opinaca C property. The property totalized at this time 166 conjugate claims owns at 100% by Azimut (news release from 2004 November 22nd).
2005
In March 2005, Azimut Exploration Inc. and Eastmain Resources Inc. signed an agreement for the Opinaca C property (news release from 2005, March 30th). Eastmain could acquire a 50% interest from Azimut Exploration during a 5-year period for certain payments of cash and shares.
In the summer of 2005, Eastmain Resources contracted Geotech Limited to carried out a helicopter-borne geophysical survey. It included a time domain electromagnetic and magnetic survey. A total of 1021-line km were flown on a 100 m spacing. Several EM anomaly groupings were identified (GM 62241).
Groundwork was conducted by Eastmain Resources for 2005 summer. A geochemical soil survey was completed over the entire property on a 100 m by 500 m grid alongside a prospecting and reconnaissance mapping survey. A total of 2118 soil samples (B-horizon) were collected and confirmed a large gold arsenic anomaly. A total of 202 rocks samples were collected and selected grab samples assayed up to 3390 ppb gold and 4170 ppm arsenic. The prospecting/mapping work confirmed underlying rock and alteration (aluminosilicate) are comparable to Roberto Gold Deposit (GM 62732).
2006
In March 2006, an interpretation of the airborne geophysical surveys flown by Geotech in 2005 was done by Eastmain. A total of 6 areas of interest were identified from the electromagnetic data (GM 62242).
In April 2006, Azimut, Goldcorp and Eastmain sign a Three-Way Joint Venture agreement to merge the 166 claims from Opinaca C block (azimuth and Eastmain) to 116 additional claims (Goldcorp) located north and west of the property. This new merged will become the Éléonore South property and count 282 claims in total split in two blocs (the main block with 248 claims and the west block with 34 claims). Eastmain was appointed the Project operator. Eastmain had the option to earn 33% of the property by funding certain exploration work.
In summer/fall 2006, Eastmain continue to work on the Éléonore South property, and 318.8-line km of grid was cut over 40% of the property. The grid line was completed with a north-south orientation at 200 m spacing and 50 m station. A regional geochemistry soil sampling (O, A and B-horizon) was executed and a total of 8639 samples were harvested and 688 samples from 2005 survey were re-assayed to obtain more precise multi-element values. Several km-size multi-element (Au-As-Sb) Roberto-type geochemical anomalies were detected. A geological mapping and prospecting survey were completed at 200 m line intervals. A total of 675 rock samples were collected from outcrops and boulders. From this number, 11 outcrops assayed between 100 to 1,915 ppb and 9 boulders assayed between 100 to 4,750 ppb. Details mapping and trenching were carried out to follow-up on 7 anomaly areas from 2005 campaign and geophysical survey. A total of 19 trenches were excavated totalizing 3,580 linear m and 380 rock samples were collected (331 grabs and 49 of 1 m intervals channel samples). Several trenches (9) assayed at least one value between 100 to 12,950 ppb. The best value was found in trench 1A (2,090 ppb gold with and > 10,000 ppm arsenic) and in trench 1E (one grab of 12,950 ppb gold and 527 ppm arsenic and a channel composite of 1.4 g/t Au across 16 m). Trench 1A is associated with the WB showing and trench 1E is associated with the JT Prospect (GM 63371).
Eastmain contracted Geotech Limited to carried out a helicopter-borne geophysical survey on the new claims added to the property. It included a time domain electromagnetic and magnetic survey. A total of 814.6-line km were flown on a 100 m spacing. Several EM anomaly groupings were identified (GM 63373).
2007
In 2007, Eastmain Resources contracted Abitibi Geophysics to complete a resistivity/induced polarization survey. A total of 267-line km was surveyed over the central area of the main grid and over JT Prospect. A gradient IP survey and a dipole-dipole configuration was carried out. The resistivity signature showed two distinctive resistivity unit split by a very conductive lineament interpreted as a major shear zone corridor (GM 64031).
A 9.2-line km grid was cut over JT to facilitate the IP survey. A mapping and prospecting survey was carried out on the property. The goal was to complete the regional mapping, to visit the previous gold and arsenic soil anomalies and the preliminary IP conductors. A total of 387 grabs were assayed and 10 samples return values between 30 and 1,130 ppb gold. Trenches was excavated to investigate firstly the JT Prospect and then to investigate geochemical, geophysical and geological target across the property. Several trenches were excavated for a total of 5,074-line-m split in 28 trenches and 3,391 channel samples. Visible gold was identified first the first time at JT (trench 1E) and some of the best channel composite graded 10.98 g/t over 3.0 m and 15.73 g/t over 2.0 m, 20.0 g/t over 2.0 m. Trench 1A (WB showing) return 7,950 ppb Au over 1.0 m (GM 64030).
Eastmain contracted L.E. Reed Geophysical Consultant Inc to interpret the VTEM and mag survey done on the property in the year 2005 and 2006. The interpretation confirms the existence of several conductor with some associated to mag anomalies (GM 64032).
Eastmain contracted Mehmet F. Taner to conduct a petrographic and mineralogical study. A total of 18 grab samples were analyzed under the microscope. The study confirmed the presence of alumino silicate as alteration in the metasediment. A brief look at the metamorphism mineralogy indicates an upper greenschist to amphibolite metamorphic grade on the property. No gold was found in the thin section and the assays return all below detection limit for those grab samples (GM 64033).
2008
In 2008, Eastmain began a drilling campaign on the Éléonore South property. A total of 3,129 m of drilling were done in 16 drill holes. From this number, 1,275 m were completed on the JT Prospect and 1,854 m were complete on other anomalies. A total of 2,750 core samples were collected and assayed for gold. Holes ES08-09 to ES08-13 drilled the JT Prospect and all intercepted gold value. Several assays return between 500 to 18,400 ppb gold. Holes ES08-15 and ES08-16 were drilled 4 km southeast of JT and tested anomalous rocks trenched and return few values between 550 to 4,980 pbb (GM 64367).
In 2008, Goldcorp mandated Inlandsis Consultant s.e.n.c. to carried a till survey to cover the whole Éléonore Property and part of the Éléonore South Property. Samples were collected at 100 m to 200 m spacing along lines distributed at every 1 km to 1.5 km. A total of 32 samples were collected on the north-west side of the property. Several anomalies of more than 0.1 ppm gold were identified (GM 65193).
2009
In 2009, Eastmain drilled a total of 3,697 m on the Éléonore South property split in 14 drill holes. Drilling was divided in 3 parts focusing on JT and WB showing and on regional geological, geophysical and geochemical anomalies. Multiple broad zones of anomalous gold and arsenic were intersected, and one composite calculated 0.54 g/t over 14 m gold. Total of 28 assayed intervals return more than 1 g/t gold with 2 samples over 9 g/t gold. Drilling on the WB showing confirm the continuation of the mineralization and one composite return 0.37 g/t over 24 m of gold. Two drill holes tested regional anomalies. One of the holes drilled at 2.5 km southeast of JT return a composite value of 0.93 g/t over 4 m with a peak value of 1.64 g/t over 1 m gold. During fall, Eastmain also completed a mapping and prospecting survey. A total of 64 grabs were collected and 2 samples return assays over 500 ppb (GM 65239).
2010
In 2010, Eastmain drilled a total of 3,622 m on the Éléonore South property split in 17 drill holes. Drilling was divided in 3 parts focusing on JT and WB showing and on regional geological, geophysical and geochemical anomalies. Drilling on JT intersected 15 intervals which contain greater than 1.0 g/t, with a maximum of 3.81 g/t gold. The JT Prospect remain open to the west, south and north. One hole was testing the south extension of the WB showing. Hole return one value of 0.79 g/t over 1.0 m. Three holes from the regional targeting located approximatively at 2.5 km and 4.5 km southeast of JT return value up to 2.41 g/t gold. A total of 90 grabs were collected during a mapping and prospecting campaign. Best value from the prospection survey returns 61 ppb gold (GM 65891).
2012
In the summer of 2012, Eastmain contracted Eagle Mapping from Coquitlam, British Columbia to conduct an aerial Light Detection and Ranging (LiDAR) survey over the Éléonore South property. The survey permits to delineate some structure to be tested in the future (GM 68093).
2016
In 2016, Azimut Exploration Inc. performed a prospection program to test several previously uncovered geochemical soil anomalies. Prospecting focused on the soil anomalies localized in the northern sector of the property and on the southeast side of JT just south of the Cheechoo discovery. A total of 448 samples were collected including 432 grabs samples from outcrops and boulders and 16 channel samples. Results return 48 samples with values over 1.0 g/t (grabs and channel). A total of 12 grab samples returned values between 11.65 to 247.0 g/t. The best channel composite return results of 19.22 g/t Au over 3.8 m, 7.85 g/t Au over 3.4 m, 49.18 g/t Au over 4.0 m and 50.37 g/t Au over 3.50m Gold is found in pegmatite and tonalite rocks and all the gold value but one were found east of the JT Prospect identified as the Moni Prospect (GM 71311).
In fall 2016, Azimut conducted a first phase drilling campaign and 2,509.6 m was drilled split in 12 holes. Drill holes were mostly targeting the Moni Prospect and the Cheechoo extension all return value values over 0.5 g/t with 10 assays over 2.5 g/t gold. Some of the calculated composites give value of 8.88 g/t gold over 2.5m, 0.83 g/t gold over 12.0 m, 5.0 g/t gold over 4.0 m and 0.76 g/t gold over 21.58 m. Two drill holes were targeting a linear high mag anomaly, and one assay return 0.1 g/t gold (GM 71346).
2017
In 2017, Azimut carried out a drilling program (second phase) contemporary to a prospecting and mapping survey. Phase 2 drilling program consists of 32 drill holes totalizing 7,176.2 m. Drill targets were selected from coincident geochemical and geophysical anomalies in the vicinity of the Cheechoo extension and Moni Prospect. All drill holes but 2 return gold values over 0.5 g/t and the best assay up to 68.8 g/t gold. Some of the best calculated composites give value of 4.74 g/t gold over 6.0 m and 3.75 g/t gold over 23.25 m (GM 71346).
In 2017, Azimut carried out a prospection survey and a total of 458 surface samples were collected and comprises 313 grabs samples, 82 channels on 17 trenches and 63 soil samples. The exploration program focused on the soil anomalies localized in the northern sector of the property and on the southeast side of JT just south of the Cheechoo discovery (on Moni Prospect and Cheechoo extension). The exploration program confirmed the presence of gold in many areas of the property. The best gold results returned 96.6 g/t Au over 1.0m from the Moni Prospect in a quartz-feldspar vein / Tonalite (channel R16) and 1,500 g/t Au from the Trench prospect from an angular boulder of quartz-feldspar±biotite and pegmatitic vein with native gold. The Trench prospect is situated just southwest of the Moni Prospect (GM 71972).
2018
In winter 2018, Azimut drilled 30 holes (28 new holes and 2 extension holes) for a total drilled of 5,448.6 m. Drill targets were collared on coincident geochemical and geophysical anomalies and based on the results from the 2017 prospection campaign. A total of 3,940 core samples were assayed for gold. Drilling campaign focused on the southwestern extension of the Cheechoo discovery, the Moni Prospect discovered in the Summer 2016 campaign, the Trench Prospect Iocated southwest of the Moni Prospect and an elongated E-W trending magnetic high to the south. Drilling from the southwestern Cheechoo extension return 32 values over 1.0 g/t. The best calculated composite in the tonalite assayed value of 2.02 g/t over 4.4 m, 2.50 g/t over 3.05 m and 2.44 g/t over 7.10 m. Drilling on the Moni Prospect return 100 values over 1.0 g/t. Some of the best intersect were obtained in the tonalite with calculated composite of 13.58 g/t over 2.5 m, 8.46 g/t over 8.4 m and 2.58 g/t over 7.8 m (GM 71647).
In the summer of 2018, Eastmain Resources Inc. carried out a stripping program to extend the exposure of the Moni Prospect and to expose the under explored west-south-west extension of Moni. A total of 9 trenches were dug and 2,352 m2 of rock were exposed and 225 samples were collected. Only 5 trenches on 9 were sampled due to lack of pegmatite dykes in some trenches. A total of 23 samples graded over 0.1 g/t gold and 2 graded over 1.0 g/t gold. Those 2 samples are found in trench TRES18-01 at the Moni Extension and return value of 2.18 g/t gold over 0.9 m and 2.5 g/t gold over 1.0 m (GM 73120).
In fall 2018, Eastmain conducted a first phase of drilling. A total of 7,216.4 m was drilled split in 27 holes. All drill holes return values over 0.1 g/t gold and 26 of them return value over 0.5 g/t gold. The campaign tested the JT Prospect with 4 holes and the others tested the Cheechoo southeast extension. In JT, the hole ES18-140 return one value of 28.3 g/t gold over 0.5 m in wacke and the hole ES18-141 return the best composite calculated of 0.64 g/t over 6.9 m. The Cheechoo Southeast Extension return value up to 84.0 g/t gold over 1.0 m and some of the best calculated composite return 3.8 g/t gold over 3.9 m, 3.5 g/t gold over 3.5 m and 22.4 g/t gold over 4.0 m (GM 73121).
In 2018, Les Mines Opinacas mandated Ios Services Géoscientifiques to carried a till survey to cover between the 2008 lines to evaluate the mineral potential in the Roberto deposit neighbourhood. Samples were collected at 200 m to 250 m spacing along lines distributed at every 1 km to 1.5 km. A total of 27 samples were collected on the north-west side of the property and 6 in the north-north-west side of the property. Gold grains count varied from 4 to 16 in the north-north-west side of the property and varied from 17 to 66 in the north-west side of the property both on normalized on 10 kg samples (GM 71452).
2019
In winter 2019, Eastmain conducted a second phase of drilling. A total of 4,708.5 m was drilled split in 14 holes and hole extension. The drilling campaign was achieved on the Cheechoo southeastern extension. All drill hole return value over 0.1 g/t gold and best assay graded 63.2 g/t gold on 1.0 m. Some of the best calculated composite return 8.7 g/t gold over 8.2 m and 12.7 g/t gold over 3.5 m (GM 73121).
In summer 2019, Eastmain carried out a field work survey with mapping, rock sampling, soil sampling and channel sampling. No excavator was available on-site in 2019. Chennel sampling was executed on 2018 trenches and on outcrops. The objective of the campaign was to identify new prospective areas for further work. In total, 1,299 rock samples, 130 channel samples and 1,744 A-B-C-horizon soil samples were collected. The soil samples were collected every 50 m with an interline spacing of 400 m and were then analyzed by XRF at the Eastmain Éléonore South coreshack. The XRF study permit to identified 5 geochemical signature and a new geological map was interpreted. A total of 9 rocks sample return values between 0.114 and 0.828 ppm gold. Sample are found in the extreme north, West, and south-west of the property and south of the Cheechoo tonalite. Mapping on the property permit to recognize several geological units as felsic intrusion, sediments and mafic volcanic. The channel sampling was done in the Moni trend to follow-up on 2018 anomalies. In total 57 samples return values over 0.1 g/t and 6 return value over a 1 g/t. The best values are associated with the Bill zone and the 101 zone and vary between 1.285 and 5.426 g/t (GM 73381).
At total of 37,816 m of drilling in 164 drill holes has been completed on the Property. Drilling has largely focussed on the Moni - JT trend and successfully defined two zones, 2,000 m x 750 m at Moni and 1,200 m x 500 m at JT, of lower-grade intrusion related gold mineralization similar to that of the Cheechoo gold deposit. The Moni trend comprises the Cheechoo Southwest Extension and JT Prospect comprises the WB Prospect. Within the lower-grade gold mineralization halo, there are a series of structurally controlled quartz vein stockworks which host significantly higher grades of gold.
Sampling, Analyses and Data Verification
Method of analysis varied since the beginning of the project. QC protocols were established in 2008 and carried through with minor refinements through the current drilling program.
Quality Control (QC) samples were introduced into the sample stream at a rate of 4% for both blank samples and CRM samples. Fury increases this rate to 5% and add field duplicates in the form of quarter sawn core samples introduced into the sample stream at a rate of 1 in 50 samples.
Core recovery is generally very good to excellent, allowing for representative samples to be taken and accurate analyses to be performed. Half-core samples, 0.5 m to 1.5 m long, were taken. The core was sampled along the entire length of each hole. Samples intervals were recorded with red grease pencil on the drill core during logging. Each sample was assigned a laboratory sample number for analytical purposes.
The sample is split along the cutting line and starting and stopping at the marked red arrows on the core. Place one half of the core in the bag and place the other half back in the core box with the cut face upwards. He/she is to place the sample end pieces (the core marked with red arrows) cut face side up, with the arrows pointing in the appropriate direction.
Samples with native gold were identified. This was to make sure the core cutting blade was cleaned before and after each of these mineralized samples by cutting through a concrete block.
Split core samples were placed in fiber rice bags in batches and labelled for shipment to ALS laboratories (ISO/IEC 17025:2017 and ISO 9001:2015 accredited facility) for preparation and analysis. These sacks were sealed with cable ties and fiber tape and shipped by commercial transport companies directly to the lab. A control file, the laboratory sample dispatch form, includes the sample-bag numbers in each shipment. The laboratory sample dispatch form accompanies the sample shipment and is used to control and monitor the shipment. The lab sends a confirmation email with detail of samples received upon delivery.
In the opinion of The Author, the logging, sampling, assaying, and chain of custody protocols practiced through the history of the Project meet or exceed industry standards. The drill programs have been configured and carried out in a manner that is appropriate for the geometry of the known mineralization. Drill holes are oriented perpendicular to strike and aimed to intersect the zones at an angle generally greater than 45°. As such, the samples should be representative of the mineralization as it is presently known.
The Author has reviewed the QC reports and files, as well as the laboratory procedures undertaken and conclude that the QC program for the Project is sufficient to support the current level of exploration. QC sample failures were dealt with on a case-by-case basis and were documented with commentary in the Dispatch Returns table within the database.
The Author has been involved in all exploration programs on the Project since 2020 and was last on-site August 2024.
Comprehensive data verification was performed by Fury Gold Mines. These included checks against original data sources, standard database checks such as from/to errors and basic visual checks for discrepancies with respect to topography and drillhole deviations.
The Author has been personally involved in the integration and merging of the historical drill data into the current database. This work included relogging of historical holes to provide consistency of logging codes across all generations of drilling, as well as spot checks of drill core versus drill logs to verify the geologic model. During this process sample intervals were verified. Lastly, the assay database was compared to original assay certificates. No errors were found within the geologic or assay databases.
Mineral Processing and Metallurgical Testing
There has been no metallurgical testing completed on the Éléonore South project.
Mineral Resource Estimates
There are no Mineral Resource Estimates for the Éléonore South Project.
2024 Éléonore South Exploration Program
Biochemical Sampling
A biogeochemical sampling survey designed to target an interpreted fold nose within the Low Formation sediments in an area where conventional soil or till sampling was not possible due to the ground conditions was completed in the summer of 2024. The targeted area exhibited similar geological, geophysical, and structural characteristics to those present at the nearby Éléonore Mine. Six priority drill targets across over 3 km of prospective folded sedimentary stratigraphy have been identified. These six targets encompass multi point gold anomalies above the 90th percentile of the data and correlate with moderate pathfinder elemental anomalies, most notably arsenic which is associated with gold mineralization at the Éléonore Mine.
Drilling
In winter 2024, Fury carried out a drilling campaign to focus on Moni Trend structural corridors and following up on previous drill intercepts of 53.25 m of 4.22 g/t Au; 6.2 m of 14.7 g/t Au and 23.8 m of 3.08 g/t Au (figure 6). In total, 2,331 m of were drilled in 7 holes. A total of 1,704 core samples were sent to the lab to be tested for gold. The drilling campaign work area was 2,500 m east-west by 800 m north-south. Most holes were drilled at 320 degrees azimuth and one at 140 degrees and one through north. All holes dip at -50 degrees.
The holes intersected broad gold zone with local gold peak value. The hole 24ES-161 intersected 0.44 g/t gold over 137.5 m (Table 13) including 9.7 g/t over 1.5 and 8.33 g/t gold over 8.33 g/t (Table 14). The hole 24ES-162 intersected 0.5 g/t gold over 115.5 m.
The 2024 Fury drilling campaign show the continuity at depth of the mineralized zone in the Cheechoo Tonalite.
Conclusion
The Éléonore South project is an early-stage exploration project with limited previous drilling and sampling completed. The drilling completed to date has confirmed the presence of a Reduced Intrusion Related Gold System (RIRGS) within the southern portion of the Cheechoo Tonalite. Additionally, surface work completed by Fury has identified several gold in soil anomalies and biogeochemical anomalies which all require additional follow up work.
Recommendations
Future exploration efforts should focus on the high-grade gold potential of the Cheechoo tonalite while also continuing to advance the identified gold in soil and biogeochemical anomalies to the drill ready stage. The recommended Phase 1 work program consists of a 5,000 – 6,000 m drilling program targeting the robust Eleonore style gold targets identified through the biogeochemical sampling program. The Phase 1 program is estimated to cost approximately $3.1 million, shown in below table.
The Phase 2 exploration program will be drill intensive. An additional 10,000 – 20,000 m of diamond and reverse circulation drilling should be completed to follow up on the results from the phase 1 program as well as within the Cheechoo Tonalite to determine if sufficient continuity of gold mineralization is present to prepare a maiden mineral resource estimate. The Phase 2 program is estimated to cost between $7.5 and $10 million, as shown below. Readers are cautioned that Fury may not carry out all or even a portion of these recommendations as they re financing and success contingent.
| Phase 1 |
|||||
| Type |
Details |
Cost Estimate (C$) |
|||
| Labour |
Staff Wages, Technical and Support Contractors |
500,000 | |||
| Assaying |
Sampling and Analytical |
400,000 | |||
| Drilling |
Diamond Drilling (5,000m at $150/m) |
750,000 | |||
| Land Management |
Consultants. Assessment Filing, Claim maintenance |
5,000 | |||
| Community Relations |
Community Tours, Outreach |
10,000 | |||
| Information Technology |
Remote site communications and IT |
5,000 | |||
| Safety |
Equipment, Training and Supplies |
5,000 | |||
| Expediting |
Expediting |
7,500 | |||
| Camp Costs |
Equipment, Maintenance, Food, Supplies |
200,000 | |||
| Freight and Transportation |
Freight, Travel, Helicopter |
600,000 | |||
| Fuel |
250,000 | ||||
| General and Administration |
100,000 | ||||
| Sub-total |
2,873,500 | ||||
| Contingency (10%) |
287,350 | ||||
| Total |
3,121,250 | ||||
| Phase 2 |
|||||
| Type |
Details |
Cost Estimate (C$) |
|||
| Labour |
Staff Wages, Technical and Support Contractors |
1,250,000 | |||
| Drilling |
Diamond Drilling (10,000 - 20,000m) |
2,000,000 | |||
| Assaying |
Sampling and Analytical |
1,000,000 | |||
| Community Relations |
Community Tours, Outreach |
25,000 | |||
| Information Technology |
Remote site communications and IT |
10,000 | |||
| Safety |
Equipment, Training and Supplies |
125,000 | |||
| Expediting |
Expediting |
150,000 | |||
| Camp Costs |
Equipment, Maintenance, Food, Supplies |
550,000 | |||
| Freight and Transportation |
Fright, Travel, Helicopter |
1,500,000 | |||
| Fuel |
600,000 | ||||
| General and Administration |
250,000 | ||||
| Sub-total |
7,460,000 | ||||
| Contingency (10%) |
746,500 | ||||
| Total |
8,206,000 | ||||
The Company expects to incur approximately $35,000 annually in project maintenance costs, including certain mineral claims payments, in order to keep the properties in good standing in 2025.
Item 4A — Unresolved Staff Comments
Not Applicable
Item 5 — Operating and Financial Review and Prospects
This section of the Annual Report will discuss the factors that have influenced the Company’s financial results and condition for the last three years. This section is supplemental to and should be read in conjunction with our Consolidated Annual Financial Statements and other financial information within this document. All $ amounts under Item 5 is expressed in thousands of Canadian Dollars.
| Operating results |
Below is selected information from the Consolidated Annual Financial Statements for the five years ended December 31, 2024:
| As at and for the year ended December 31: |
2024 |
2023 |
2022 |
|||||||||
| Revenue |
$ | - | $ | - | $ | - | ||||||
| Net loss (earnings) |
108,138 | 17,213 | (24,908 | ) | ||||||||
| Net comprehensive loss (earnings) |
108,141 | 17,219 | (24,905 | ) | ||||||||
| Basic and diluted loss (earnings) per share |
0.73 | 0.12 | (0.18 | ) | ||||||||
| Cash |
4,912 | 7,313 | 10,309 | |||||||||
| Restricted cash |
144 | 144 | 144 | |||||||||
| Marketable securities |
2,358 | 1,166 | 582 | |||||||||
| Other investments |
2,063 | - | - | |||||||||
| Other assets |
979 | 1,665 | 1,944 | |||||||||
| Mineral property interests |
45,200 | 142,639 | 145,190 | |||||||||
| Investments in associates |
29,456 | 36,248 | 42,430 | |||||||||
| Current liabilities |
1,864 | 1,732 | 1,308 | |||||||||
| Non-current liabilities |
5,045 | 4,569 | 4,498 | |||||||||
| Working capital surplus (deficit)(1) |
8,045 | 7,713 | 10,554 | |||||||||
| Accumulated deficit |
257,192 | 149,054 | 131,841 | |||||||||
| Cash used in operating activities |
(8,073 | ) | (13,060 | ) | (14,012 | ) | ||||||
| Cash provided by investing activities |
1,395 | 2,446 | 10,435 | |||||||||
| Cash provided by financing activities |
4,277 | 7,624 | 10,629 | |||||||||
(1) defined as total current assets less total current liabilities
(2) for a detailed breakdown by quarter for the two-year period ended December 31, 2024, see the Company’s Annual MD&A prepared under Canadian securities laws and included in the Company’s Form 6-K filing on March 31, 2025.
Discussion comparing the results for the year ended December 31, 2024, to the year ended December 31, 2023 and 2022:
During the year ended December 31, 2024, the Company reported a total net loss of $108,138 and loss per share of $0.73 compared to a total net loss of $17,213 and loss per share of $0.12 for the year ended December 31, 2023, and total net earnings of $24,908 and earnings per share of $0.18 for the year ended December 31, 2022.
The significant increase in net loss for 2024 was primarily due to a single mineral project impairment charge of $100,873 assessed on the Company’s mineral properties interests. Based on the Company’s assessment with respect to possible indicators of impairment, the Company concluded that as at December 31, 2024 impairment indicators exist and based on the impairment analysis performed, in conjunction with a review of a third-party’s report an impairment on its Eau Claire project of $89,263 and Committee Bay project of $11,610 was recorded. Additionally, other significant changes were as follows:
Operating expenses:
| ● |
Exploration and evaluation costs decreased from $9,217 for the year ended December 31, 2022, compared to $9,311 for the year ended December 31, 2023, and $5,512 for the year ended December 31, 2024, The decrease resulted from a break between programs in 2024, after the initial Elenore South drill program that commenced in March wrapped up; the program at Eau Claire only started during the last part of June and concluded mid-August. In comparison, during 2023, the program started at the end of March, but had to shut down during most of June due to the wildfires but was still active until the end of 2023; |
| ● |
Fees, salaries, and other employment benefits decreased to $2,202 for the year ended December 31, 2024, compared to $2,630 for the year ended December 31, 2023, and $3,199 for the year ended December 31, 2022, primarily due to a combination of lower share-based compensation and a decrease in headcount in 2024; and |
| ● |
Insurance expense decreased from $728 for the year ended December 31, 2022, to $646 for the year ended December 31, 2023, to $522 for the year ended December 31, 2024, primarily due to negotiated fees that resulted in overall lower insurance premiums. |
Other expenses (income), net:
| ● |
An impairment expense of $5,506 for the year ended December 31, 2022, arose from the sale of the 17 million common shares of Dolly Varden. There was no similar transaction in the year ended December 31, 2023, while $100,873 impairment expense for the year ended December 31, 2024, arose from the assessment of the Company’s mineral property interests; |
| ● |
Net loss from associates decreased to $3,858 for the year ended December 31, 2024, compared to $6,182 for the year ended December 31, 2023, and $5,880 for the year ended December 31, 2022, primarily due to Dolly Varden's net loss significantly decreasing from the prior year. In addition, the Company’s decreased ownership of Dolly Varden compared to 2023 and 2022 also lowered the attributed loss portion; |
| ● |
Gain on investments of $4,109 for the year ended December 31, 2024, was a result of the Company’s disposition of Dolly Varden shares in the current year, combined with the dilution gain, whereas there was no comparable transaction in the prior years; |
| ● |
Net gain from marketable securities for the year ended December 31, 2024, compared to net loss from marketable securities in 2023 and 2022 was due to an increase in fair value of securities held in 2024 compared to the fair value of securities held that plummeted in 2023; and |
| ● |
Amortization of flow-through share premium of $1,621 for the year ended December 31, 2024, compared to $3,345 for the year ended December 31, 2023, and $3,124 for the year ended December 31, 2022, reflected the smaller program at Eau Claire and Eleonor South in 2024 compared to prior years. |
| Liquidity and capital resources |
Cash flows for the year ended December 31, 2024, compared to the year ended December 31, 2023 and 2022:
During the year ended December 31, 2024, the Company used cash of $8,073 in operating activities compared to $13,060 in 2023 and $14,012 in 2022. The cash outflow for 2024 was lower primarily due to lower exploration activities and lower employee costs compared to 2023 and 2022.
During the year ended December 31, 2024, the Company generated cash from investing activities of $1,394, representing mainly the acquisition of mineral interests, marketable securities, and other investments, setting off by proceeds from the sale of some Dolly Varden shares. During the year ended December 31, 2023, the Company generated cash from investing activities of $2,446, primarily representing option payment received, interest income, and proceeds from the sale of marketable securities. During the year ended December 31, 2022, the Company generated cash from investing activities of $10,435, primarily arising from the sale of the Dolly Varden shares in October 2022 and the net cash proceeds of $4,479 from the Dolly Varden Transaction in February 2022, offset in part by the acquisition cost of the additional ESJV interest.
For the year ended December 31, 2024, cash provided by financing activities of $4,278 primarily represented the net proceeds received in respect of the June 2024 financing. For the year ended December 31, 2023, cash provided by financing activities of $7,624 primarily represented the net proceeds received in respect of the March 2023 financing. For the year ended December 31, 2022, cash provided by financing activities of $10,629 primarily represented the net proceeds received in respect of the April 2022 financing.
Capital resources
The Company proactively manages its capital resources and makes adjustments in light of changes in the economic environment and the risk characteristics of the Company’s assets. To effectively manage its capital requirements, the Company has in place a budgeting and cash management process to help determine the funds required to ensure the Company has the appropriate liquidity to meet its current project plans and achieve its growth objectives. The Company ensures that there is sufficient liquidity available to meet its short-term business requirements, including contractual commitments, taking into account its anticipated cash outflows from exploration activities and its holdings of cash and marketable securities. The Company monitors and adjusts, when required, these exploration programs as well as corporate administrative costs to ensure that adequate levels of working capital are maintained.
As at the date of this Annual Report, the Company expects its existing capital resources to support certain planned activities for the next 12 months at the Eau Claire and Éléonore South projects and short-term contractual commitments. The Company’s ability to undertake further project expansionary plans is dependent upon the Company’s ability to obtain adequate financing in the future. While the Company has been successful at raising capital in the past, there can be no assurance that the Company will have sufficient financing to meet its future capital requirements or that additional financing will be available on terms acceptable to the Company in the future.
June 2024 financing
In June 2024 the Company issued 5,320,000 flow-through shares for gross proceeds of $5,001 (“June 2024 Offering”). Share issue costs related to the June 2024 Offering totaled $533, which included $300 in commissions and $233 in other issuance costs. The proceeds of the June 2024 Offering have been used for the Company’s exploration program in Quebec.
March 2023 financing
On March 23, 2023, the Company completed a bought deal private placement financing. At the close of the financing, the Company issued 6,076,500 flow-through shares of the Company for total gross proceeds to the Company of $8,750. The proceeds of the financing have been used to advance the Company’s exploration projects in Quebec. Share issue costs totaled $912.
April 2022 financing
On April 14, 2022, the Company completed a non-brokered private placement with two investors comprised of a Canadian corporate strategic investor and a US institutional investor, for a Private Placement of 13.75 million common shares of the Company at a price of $0.80 per share for gross proceeds of $11,000. Proceeds from the Private Placement have been used to fund continued exploration at the Company’s Eau Claire project in Quebec. Share issue costs totaled $136.
Contractual Commitments
In the normal course of business, the Company enters into contracts that give rise to commitments for future minimum payments. The following table summarizes the remaining contractual maturities of the Company’s financial liabilities and commitments as at December 31, 2024, shown in contractual undiscounted cashflows:
| Within 1 year |
2 to 3 years |
Over 3 years |
At December 31 2024 |
|||||||||||||
| Accounts payable and accrued liabilities |
$ | 855 | $ | - | $ | - | $ | 855 | ||||||||
| Quebec flow-through expenditure requirements |
944 | - | - | 944 | ||||||||||||
| Undiscounted lease payments |
65 | - | - | 65 | ||||||||||||
| Total |
$ | 1,864 | $ | - | $ | - | $ | 1,864 | ||||||||
Additionally, to maintain the Company’s properties in good standing order, the Company is required to make certain mineral claims payments on an annual or bi-annual basis. The Company estimates that $361 of payments arising on mineral claims and leases will be payable during the year ended December 31, 2025.
In addition, the Company is committed to certain office rental expense in respect of shared head office premises as noted in Item 7(B).
Planned Exploration Activities
The company is still in the process of finalizing its final 2025 exploration programs while completing its first program at Eleonor South in the first half of 2025. An initial 2,000 meters drill program at its Éléonore South gold project was announced on March 20, 2024, in addition to the biogeochemical sampling program scheduled for early Summer. The following work has been budgeted for the next 12 months:
| Exploration Program |
Projected Cost |
|
| Éléonore South: | ||
| ● | Exploration Program: completion of a 4,000m – 6,000m drill program targeting an interpreted fold nose within the Low Formation sediments at Éléonore South. |
2,500 |
| ● | Objective: Maiden drill program to test 6 priority geochemical targets to determine their potential to host significant gold mineralization while continuing to advance other targets and prospects to the drill stage. | |
As at December 31, 2024, the Company had working capital surplus of approximately $8 million, which the Company defines as total current assets less total current liabilities including a cash balance of $4.9 million (which excludes $0.1 million of restricted cash). As of the date of this MD&A, the Company's working capital is estimated to have declined by approximately $2 million since December 31, 2024, to pay for general corporate costs. The Company does not include its shares in Dolly Varden (current market value $53 million) in working capital because it accounts for these shares as an affiliated entity. The Dolly Varden shares listed on a recognize stock exchange are eligible for resale and there is a reasonably liquid market for them.
Revision of Prior Period Interim Financial Statements
In preparing the consolidated financial statements for the year ended December 31, 2024, the Company identified an error in its previously issued unaudited consolidated quarterly financial statements for the periods ended March 31, 2024 and September 30, 2024. These quarterly financial statements were furnished to the SEC on Form 6-K dated May 14, 2024 and its Form 6-K dated November 12, 2024. The error resulted in a misstatement of gain/loss on investments and investments in associates relating to the Company’s investment in Dolly Varden, specifically an understatement of dilution gain on the consolidated statement of (earnings) loss and comprehensive (income) loss, as well as an understatement of our investment in associate balance on the statement of financial position.
The impact of the revisions to the periods presented in this report are as follows:
| As reported |
Adjustment |
Revised |
||||||||||
| Revised Statement of financial position as of March 31, 2024 |
||||||||||||
| Investment in Associates |
32,638 | 220 | 32,858 | |||||||||
| Total assets |
188,023 | 220 | 188,243 | |||||||||
| Deficit |
(149,988 | ) | 220 | 149,768 | ||||||||
| Total equity |
182,356 | 220 | 182,576 | |||||||||
| Revised Consolidated Statements of Loss and Comprehensive Loss for the three months ended March 31, 2024 |
||||||||||||
| Gain on Investments |
- | (220 | ) | (220 | ) | |||||||
| Net loss |
934 | (220 | ) | 714 | ||||||||
| Total comprehensive loss |
935 | (220 | ) | 715 | ||||||||
| Revised Statement of financial position as of September 30, 2024 |
||||||||||||
| Investment in Associates |
29,341 | 1,780 | 31,121 | |||||||||
| Total assets |
184,099 | 1,780 | 185,879 | |||||||||
| Deficit |
(157,932 | ) | 1,780 | (156,152 | ) | |||||||
| Total equity |
177,526 | 1,780 | 179,306 | |||||||||
| Revised Consolidated Statements of Loss and Comprehensive Loss for the three months ended September 30, 2024 |
||||||||||||
| Gain on Investments |
- | (1,780 | ) | (1,780 | ) | |||||||
| Net loss |
4,453 | (1,780 | ) | 2,673 | ||||||||
| Total comprehensive loss |
4,453 | (1,780 | ) | 2,673 | ||||||||
| Revised Consolidated Statements of Loss and Comprehensive Loss for the nine months ended September 30, 2024 |
||||||||||||
| Gain on Investments |
(538 | ) | (2,000 | ) | (2,538 | ) | ||||||
| Net loss |
8,881 | (2,000 | ) | 6,881 | ||||||||
| Total comprehensive loss |
8,883 | (2,000 | ) | 6,883 | ||||||||
| Research and development, patents and licenses, etc |
The Company has not performed any research and development activities in the last three years.
| Trend information |
Refer to Item 4.A and Item 4.B for a discussion about the historical factors influencing the business as well as current events that could impact the future operations of the Company.
| Critical Accounting Estimates |
The preparation of financial statements in conformity with IFRS Accounting Standards as issued by the International Accounting Standards Board (IASB) requires management to select accounting policies and make estimates and judgments that may have a significant impact on the consolidated financial statements. Estimates are continuously evaluated and are based on management’s experience and expectations of future events that are believed to be reasonable under the circumstances. Actual outcomes may differ from these estimates.
Critical accounting judgments exercised in applying accounting policies, apart from those involving estimates, which have the most significant effect on the amounts recognized in these consolidated financial statements are as follows:
| (a) |
Functional currency |
The functional currency for each of the Company’s subsidiaries is the currency of the primary economic environment in which the entity operates. Determination of functional currency may involve certain judgments to determine the primary economic environment and the Company reconsiders the functional currency of its entities if there is a change in events and conditions that determined the primary economic environment.
| (b) |
Economic recoverability and probability of future economic benefits of mineral property interests |
Management has determined that the acquisition of mineral properties and related costs incurred, which have been recognized on the consolidated statements of financial position, are economically recoverable. Management uses several criteria in its assessments of economic recoverability and probability of future economic benefit in addition to consideration of the Company’s market capitalization, including geological data, in-situ resources and contained metal, scoping studies, accessible facilities, and existing and future permits.
| (c) |
Indications of impairment of assets |
Assessments of impairment indicators are performed at the Cash Generating Unit (“CGU”) level and judgment is involved in assessing whether there is any indication that an asset or a CGU may be impaired. The assessment of the impairment indicators involves the application of a number of significant judgments and estimates to certain variables, including metal price trends, exploration plans for properties, and the results of exploration and evaluation to date as well as consideration of the Company’s market capitalization versus the project carrying value.
| (d) |
Income taxes |
The provision for income taxes and composition of income tax assets and liabilities requires management’s judgment. The application of income tax legislation also requires judgment in order to interpret legislation and to apply those findings to the Company’s transactions.
Credit on duties refundable for loss and refundable tax credits for resource investment
The Company is entitled to a refundable credit on duties of 12% for eligible losses under the Quebec Mining Duties Act and a refundable resource investment tax credit of 38.75% under the Quebec Income Tax Act. These credits are applicable to qualified exploration expenditures on properties located within the province of Quebec. Application for these credits is subject to verification and, as such, they are recognized only when they are received or when a notice of assessment confirming the amount to be paid is issued. During the year ended December 31, 2024, the Company received a refund of $193 (December 31, 2023 – $307, December 31, 2022 – $187) which was classified as income tax recoveries on the consolidated statements of (earnings) loss and comprehensive (income) loss.
| (e) |
Determination of control of subsidiaries and joint arrangements |
Judgement is required to determine when the Company has control of subsidiaries or joint control of joint arrangements. This requires an assessment of the relevant activities of the investee, being those activities that significantly affect the investee’s returns (including operating and capital expenditure decision-making, financing of the investee, and the appointment, remuneration, and termination of key management personnel) and when the decisions in relation to those activities are under the control of the Company or require unanimous consent from the investors.
| (f) |
Investments in associates |
The Company conducts a portion of its business through equity interests in associates. An associate is an entity over which the Company has significant influence and is neither a subsidiary nor a joint venture. The Company has significant influence when it has the power to participate in the financial and operating policy decisions of the associate but does not have control or joint control over those policy decisions.
| (g) |
Financial instruments |
Financial instruments are assessed upon initial recognition to determine whether they meet the definition of a financial asset, financial liability, or equity instrument depending on the substance of the contractual arrangement. Judgement is required in making this determination as the substance of a transaction may differ from its legal form. Once a determination is made, IFRS Accounting Standards as issued by the IASB requires that financial instruments be measured at fair value on initial recognition. For financial instruments that do not have quoted market prices or observable inputs, judgements are made in determining what are appropriate inputs and assumptions to use in calculating the fair value.
Key sources of estimation uncertainty that have significant risk of causing a material adjustment to the carrying amount of assets and liabilities are as follows:
| (h) |
Reclamation obligations |
Management assesses its reclamation obligations annually and when circumstances suggest that a material change to the obligations have occurred. Significant estimates and assumptions are made in determining the provision for site reclamation and closure because there are numerous factors that will affect the ultimate liability that becomes payable. These factors include estimates of the extent, the timing, and the cost of reclamation activities, regulatory change, cost increases, and changes in discount rates. Those uncertainties may result in actual expenditures differing from the amounts currently provided. The provision at the reporting date represents management’s best estimate of the present value of the future reclamation costs required. Changes to estimated future costs are recognized in the consolidated statements of financial position by adjusting the reclamation asset and liability.
| (i) |
Share-based compensation |
The Company determines the fair value of equity-settled share-based payments using the fair value of the equity instruments at the grant date. For options granted, the Company uses the Black‐Scholes option pricing model. This option pricing model requires the development of market-based subjective inputs, including the risk-free interest rate, expected price volatility, and expected life of the option. Changes in these inputs and the underlying assumption used to develop them can materially affect the fair value estimate.
| (j) |
Deferred tax assets and liabilities |
Management judgment and estimates are required in assessing whether deferred tax assets and deferred tax liabilities are recognized in the consolidated statements of financial position. Judgments are made as to whether future taxable profits will be available in order to recognize deferred tax assets. Assumptions about the generation of future taxable profits depend on management’s estimates of future cash flows. These depend on estimates of future production and sales volumes, commodity prices, reserves, operating costs, and other capital management transactions. These judgments and assumptions are subject to risk and uncertainty, and changes in circumstances may alter expectations which may impact the amount of deferred tax assets and deferred tax liabilities recognized on the consolidated statements of financial position and the benefit of other tax losses and temporary differences not yet recognized.
| Disclosure of a registrant’s action to recover erroneously awarded compensation. |
The Company concluded that the revisions to the Company’s interim financial statements, as discussed above under “Revisions to Prior Period Financial Statements”, did not result in any previously awarded incentive-based compensation paid to any of the Company’s executives being deemed to be erroneously awarded incentive-based compensation that would require recovery under the Company’s Policy for Recovery of Erroneously Awarded Incentive-Based Compensation.
Item 6 — Directors, Senior Management, and Employees
| Directors and senior management |
The following table sets out the names, province or state and country of residence, positions with or offices held with Fury Gold, and principal occupation for the past five years of each of Fury Gold’s directors and executive officers, as well as the period during which each has been a director of Fury Gold. The following table also identifies the members of each committee of the Board.
The term of office of each director of Fury Gold expires at the annual general meeting of shareholders each year.
| Name, Position and Province and Country of Residence |
Principal Occupation During |
Director |
| FORRESTER (TIM) A. CLARK CEO & Director Massachusetts, United States |
Mr. Clark has served as CEO since August 18, 2021 and is a director of the Company. Mr. Clark brings 23 years of global capital markets experience with numerous US, European, and Canadian banks, including Barclays Capital, National Bank Financial, Merrill Lynch, Deutsche Bank, and most recently BMO Capital Markets, where he held the role of Managing Director, Institutional Equity Sales. Over the years, he has developed strong working relationships with Tier 1 institutional investors throughout the United States providing corporate strategy, and peer and financial analysis and insights on corporates within the materials, commodities, and mining sectors. Mr. Clark holds a Bachelor of Economics from the University of Massachusetts (Amherst) and a Master of Business Administration in Finance and Accounting from Vanderbilt University. Mr. Clark serves as an independent director of Dolly Varden Silver Corporation (“Dolly Varden”) on behalf of the Company pursuant to an investor rights agreement entered into between the Company and Dolly Varden. |
March 16, 2021 |
| Name, Position and Province and Country of Residence |
Principal Occupation During |
Director |
| BRIAN CHRISTIE (1) (2)(3) Chair Ontario, Canada |
Mr. Christie currently serves as the independent Chair of the Board of the Company. Mr. Christie served as the Vice President of Investor Relations at Agnico Eagle Mines Limited (“Agnico Eagle”) for over 9 years until June 2022 until he retired, and is currently retained by Agnico Eagle as a Senior Advisor, Investor Relations. During his tenure at Agnico Eagle, the company was consistently recognized as having one of the top Investor Relations programs across all industries in Canada. From 2016 until 2021 he served as an Independent Director (including 2 years as Board Chair and Compensation Committee Chair) of the Denver Gold Group, a Colorado based not-for-profit association owned by its member gold companies who control most of the world’s precious metal output and mineral assets. Before joining Agnico Eagle, he worked for over 17 years in the investment industry, primarily as a precious and base metals mining analyst with Desjardins Securities, National Bank Financial, Canaccord Capital and HSBC Securities. Prior to this, Mr. Christie spent 13 years in the mining industry as a geologist for a variety of mining companies, including Homestake, Billiton, Falconbridge Copper and Newmont Mining. Mr. Christie holds a BSc. in Geology (University of Toronto) and an MSc. in Geology (Queen’s University) and is a member of the Canadian Investor Relations Institute (CIRI) and the National Investor Relations Institute (NIRI). Mr. Christie currently serves as a director of Wallbridge Mining Company Limited (“Wallbridge”) and Forum Energy Metals Corp; Past director of Denver Gold Group; VP, Investor Relations at Agnico Eagle. |
February 22, 2023 |
| STEVE COOK(1) (4) Director British Columbia, Canada |
Mr. Cook currently serves as an independent director of the Company. Mr. Cook is a former tax partner at the law firm of Thorsteinssons LLP, Vancouver, British Columbia, Canada. Mr. Cook received his B.Comm. and LL.B. degrees from the University of British Columbia and was called to the British Columbia Bar in 1982 and the Ontario Bar in 1992. He retired from the Ontario Bar in 2014. Mr. Cook is a specialist in corporate and international tax planning, offshore structures, representation, and civil and criminal tax litigation. Mr. Cook has served on the board of Brett Resources Ltd. prior to it being acquired by Osisko Mining Corp. and Cayden Resources Inc. prior to it being acquired by Agnico. Past Director of Torq Resources Inc.; Past Director of Tier One Silver Inc.; Past Director of Coppernico Metals; Past Director of Cayden Resources Inc; Past Director of Skeena Resources Ltd.; Past Director of SnipGold Corp; Past Director of LaSalle Exploration Corp. |
October 28, 2013 |
| Name, Position and Province and Country of Residence |
Principal Occupation During |
Director |
| MICHAEL HOFFMAN (1) (2) (3) (4) Director Ontario, Canada |
Mr. Hoffman currently serves as an independent director of the Company. Mr. Hoffman is an experienced mining executive with over 30 years of practice including engineering, mine operations, corporate development, projects, and construction. Mr. Hoffman previously served as a director of Trevali Mining from 2011 to 2019 and acted as Chair from late 2017 to early 2019. Mr. Hoffman also has direct northern Canadian mining experience including operations and projects. Mr. Hoffman is a Mining Engineering graduate from Queen’s University and is a Professional Engineer in the province of Ontario. He is also a member of the Institute of Corporate Directors. Mr. Hoffman currently serves as a director of 1911 Gold Company (“1911 Gold”), and director and chair of NiCAN Ltd (“NiCAN”); Past director of Eastmain and Velocity Minerals. |
October 9, 2020 |
| ALISON SAGA WILLIAMS (2) (4) Director Ontario, Canada |
Ms. Williams currently serves as an independent director of the Company. Ms. Williams has worked in Indigenous communities in government and corporate roles in the capacity of legal counsel, negotiations and governance, and as a strategic advisor, for over 20 years. Ms. Williams has been on negotiation teams that have successfully settled over $1 billion in agreements and has worked on Indigenous community engagement and negotiations to support national energy and mining projects. Over the last 25 years, she has also held many non-profit board positions. Ms. Williams is Anishinaabe, a member of Curve Lake First Nation, and is currently an elected official for her community. Ms. Williams has extensive experience in compensation analysis both through her involvement in non-profit boards and as an elected official for a First Nation. Ms. Williams teaches at Osgoode Hall Law School as an Adjunct Professor and supports student led negotiations focusing on consultation, Indigenous rights, and reconciliation. Ms. Williams currently serves as a director of NiCAN Ltd, Adjunct Professor at Osgoode Hall Law School; Former Elected Official for the Curve Lake First Nation. Principal of AS Williams Consulting firm |
October 5, 2020 |
| Name, Position and Province and Country of Residence |
Principal Occupation During |
Director |
| ISABELLE CADIEUX (3) (5) Director Quebec, Canada |
Ms. Cadieux currently serves as an independent director of the Company. Ms. Cadieux, a professional geologist, has more than 30 years of experience in mineral exploration and financing in the mining sector. She last held the position of Managing Director – Investment at SIDEX, a Québec institutional fund that finances exploration companies active in Québec, where she served from 2001 until 2023. Her mineral exploration experience across Canada and abroad, includes positions with AGIP (1980-1983 in Saskatchewan), AREVA (1988-1992 in Québec, Ontario, and the Northwest Territories), and Channel Resources (1996-1999 in Burkina Faso) and covers a wide range of ore deposit types and mineral commodities, in particular gold, copper, and uranium. She holds an M.Sc. in Mineral Exploration (MINEX) from McGill University and a B.Sc. in Geology from the University of Ottawa. Ms. Cadieux acted as President of the Ordre des géologues du Québec (OGQ) in 2008, sat on the Board of Directors from 2005 to 2010 and was Director of the Canadian Council of Professional Geoscientists from 2007 to 2011 where she represented the OGQ. From 2011 to 2016, she was a member of the Executive Committee of the UQAT-UQAM Chair in Mining Entrepreneurship. Throughout her career, she has been involved in various sector-related organizations, among others the Québec Mineral Exploration Association (AEMQ), the Canadian Institute of Mines and Metallurgy (CIM), Minalliance and Mine d’Avenir. |
September 5, 2023 |
| PHIL VAN STADEN Chief Financial Officer Ontario, Canada |
Mr. van Staden is a Chartered Professional Accountant with over 15 years of diverse international experience in various accounting roles and industries throughout South Africa and Canada. He obtained his BCom and BCom Honours degrees respectively from the University of Pretoria and the University of South Africa in 2007. Mr. van Staden served as head of the finance department at Arthur Kaplan, the largest Swiss watch retailer in Africa. He then moved on to become the finance and general manager of Pezula Golf and Housing Estate, a top 5 housing estate within South Africa. Mr. van Staden has been with Fury Gold since 2020. Past Controller of Fury Gold. |
N/A |
| Name, Position and Province and Country of Residence |
Principal Occupation During |
Director |
| BRYAN ATKINSON SVP, Exploration Alberta, Canada |
Mr. Atkinson has been involved in mineral exploration globally for over fifteen years with a focus on orogenic lode gold and intermediate sulphidation epithermal deposits. Most recently, his work has been with high sulphidation, intermediate sulphidation, skarn and orogoenic deposit styles throughout the Americas. Mr. Atkinson has undertaken roles varying from soil sampler to ground geophysical surveyer, through to project geologist, project manager and most recently, Exploration Manager. In his role as an Exploration Manager, he oversaw the successful completion of over 45,000 m of exploration drilling across three projects in a six-month period with an overall budget of $40M. Mr. Atkinson has also developed a valuable background in community relations as the manager of all First Nations engagement across Auryn Resources’ North American project portfolio. Past Exploration Manager of Universal Mineral Services; Past Senior Geologist of APEX Geoscience Ltd. |
N/A |
Notes:
| (1) |
Member of the Audit Committee. Effective June 26, 2024, Brian Christie was appointed to the committee, replacing the retiring Jeffrey Mason. |
| (2) |
Member of the Nominating, Compensation and Governance Committee. Effective June 26, 2024, Michael Hoffman was appointed to chair of the committee, replacing the retiring Jeffrey Mason. |
| (3) |
Member of the Technical, Safety and Risk Management Committee. |
| (4) |
Member of the Indigenous and Community Relations Committee. |
| (5) |
Ms. Cadieux resigned from the board effective March 24, 2025. |
| Compensation |
Executive Compensation
| Name and principal position |
Year |
Salary |
Share-based awards (4) |
Non-equity incentive plan compensation |
Total compensation |
||||||||||||
| $ | $ | $ | $ | ||||||||||||||
| Tim Clark, CEO (1)(2) |
2024 |
396,900 | 164,125 | 269,892 | 830,917 | ||||||||||||
| Phil van Staden, CFO(3) |
2024 |
151,200 | Nil |
64,260 | 215,460 | ||||||||||||
| Bryan Atkinson(4) |
2024 |
237,038 | Nil |
100,741 | 337,779 | ||||||||||||
| (1) |
Mr. Tim Clark’s salary and non-equity incentive plan compensation is payable in US dollars. A foreign exchange rate of 1.35 was used to calculate the CAD equivalent which was included in the table above. |
| (2) |
Mr. Tim Clark, as the Company’s nominee to the Dolly Varden board also receives remuneration from Dolly Varden equal to that of other directors |
| (3) |
Mr. Phil van Staden was appointed CFO on June 23, 2023, prior to which Mr. van Staden served as the Corporate Controller and Senior Accountant for the Company. |
| (4) |
Mr. Bryan Atkinson has served as SVP, Exploration since March 9, 2022, prior to which Mr. Atkinson was VP, Project Development of the Company since October 9, 2020. |
| (5) |
The values in this column represents the fair value of shares when they vested. |
Additional information on the compensation of our officers and directors is included in our information circular for our 2024 annual general meeting, as attached hereto as Exhibit 15.7, which information has been prepared in Canadian securities law disclosure standards.
Outstanding Share-based Awards and Option-based Awards
The following table sets out all option-based awards outstanding as at December 31, 2024, for executives:
| Option-based Awards |
||||||||||
| Name |
Number of securities underlying unexercised Options |
Option |
Option |
Value of unexercised in-the-money Options(1) |
||||||
| Tim Clark |
600,000 870,000 130,000 |
0.82 0.93 1.53 |
17-Jan-28 26-Aug-26 02-Apr-26 |
Nil Nil Nil |
||||||
| Phil van Staden |
45,000 45,000 17,500 17,500 15,000 |
0.53 0.82 1.00 1.00 1.85 |
23-Jun-28 17-Jan-28 22-Apr-27 24-Jan-27 20-Dec-25 |
1,350 Nil Nil Nil Nil |
||||||
| Bryan Atkinson |
269,000 135,000 135,000 150,000 |
0.82 1.00 1.00 2.05 |
17-Jan-28 22-Apr-27 24-Jan-27 20-Oct-25 |
Nil Nil Nil Nil |
||||||
| (1) |
Based on the closing price of the Common Shares on the TSX on December 31, 2024 of $0.56. |
The following table sets out all share-based awards outstanding as at December 31, 2024, for executives:
| Name |
Number of securities underlying unvested RSU’s |
Vesting dates |
Value of unvested securities(1) |
||||||
| Tim Clark |
105,641 105,642 105,642 |
9-Jan-25 9-Jan-26 9-Jan-27 |
59,159 59,160 59,160 |
||||||
| Phil van Staden |
15,195 15,195 15,196 |
9-Jan-25 9-Jan-26 9-Jan-27 |
8,509 8,509 8,510 |
||||||
| Bryan Atkinson |
44,990 44,991 44,991 |
9-Jan-25 9-Jan-26 9-Jan-27 |
25,194 25,195 25,195 |
||||||
| (1) |
Based on the closing price of the Common Shares on the TSX on December 31, 2024 of $0.56. |
Board Compensation
Compensation during the most recently completed fiscal year ended December 31, 2024:
| Name(1) |
Fees earned $ |
Share-based awards $ |
Non-equity incentive plan compensation $ |
Total $ |
||||||||||||
| Brian Christie |
44,701 | 37,728 | Nil |
82,429 | ||||||||||||
| Jeffrey R. Mason (2) |
10,895 | 10,029 | Nil |
20,924 | ||||||||||||
| Steve Cook |
23,940 | 20,993 | Nil |
44,933 | ||||||||||||
| Michael Hoffman |
25,640 | 19,543 | Nil |
45,183 | ||||||||||||
| Saga Williams |
22,286 | 19,543 | Nil |
41,829 | ||||||||||||
| Isabelle Cadieux |
18,980 | 16,642 | Nil |
35,622 | ||||||||||||
| (1) |
Mr. Clark is a current director and received compensation in 2024 for his service as an officer of the Company. See “Executive Compensation” table. |
| (2) |
Mr. Mason resigned as a director effective June 26, 2024. |
Outstanding Option-based Awards
The following table sets out all option-based awards outstanding as of December 31, 2024, for each director who was not an executive officer of the Company:
| Option-based Awards |
|||||||||||||
| Name |
Number of securities underlying unexercised Options |
Option |
Option |
Value of unexercised in-the-money Options(1) |
|||||||||
| Brian Christie |
40,000 156,000 |
0.82 0.85 |
15-May-28 17-Feb-28 |
Nil Nil |
|||||||||
| Steve Cook |
156,000 160,000 160,000 130,000 |
0.82 1.00 1.00 2.05 |
17-Jan-28 22-Apr-27 24-Jan-27 20-Oct-25 |
Nil Nil Nil Nil |
|||||||||
| Michael Hoffman |
156,000 80,000 80,000 130,000 35,006 |
0.82 1.00 1.00 2.05 0.86 |
17-Jan-28 22-Apr-27 24-Jan-27 20-Oct-25 23-Jan-25 |
Nil Nil Nil Nil Nil |
|||||||||
| Saga Williams |
156,000 80,000 80,000 130,000 |
0.82 1.00 1.00 2.05 |
17-Jan-28 22-Apr-27 24-Jan-27 20-Oct-25 |
Nil Nil Nil Nil |
|||||||||
| Isabelle Cadieux (2) |
156,000 | 0.55 | 21-Sep-28 |
1,365 | |||||||||
| (1) |
Based on the closing price of the Common Shares on the TSX on December 31, 2024 of $0.56. |
|
| (2) | Ms. Cadieux’s outstanding options will be exercisable up to June 23, 2025, based on her March 24, 2025 resignation. |
The following table sets out all share-based awards outstanding as of December 31, 2024, for each director who was not an executive officer of the Company:
| Name |
Number of securities underlying unvested RSU’s |
Vesting dates |
Value of unvested securities(1) |
||||||
| Brian Christie, Chair |
39,521 39,522 39,522 |
9-Jan-25 9-Jan-26 9-Jan-27 |
22,132 22,132 22,132 |
||||||
| Steve Cook, Director |
31,456 31,456 31,456 |
9-Jan-25 9-Jan-26 9-Jan-27 |
17,615 17,615 17,615 |
||||||
| Michael Hoffman, Director |
31,456 31,456 31,456 |
9-Jan-25 9-Jan-26 9-Jan-27 |
17,615 17,615 17,615 |
||||||
| Saga Williams, Director |
31,456 31,456 31,456 |
9-Jan-25 9-Jan-26 9-Jan-27 |
17,615 17,615 17,615 |
||||||
| Isabelle Cadieux (2), Director |
31,456 31,456 31,456 |
9-Jan-25 9-Jan-26 9-Jan-27 |
17,615 17,615 17,615 |
||||||
| (1) |
Based on the closing price of the Common Shares on the TSX on December 31, 2024 of $0.56. |
|
| (2) | All unvested RSU’s of Ms. Cadieux terminated on March 24, 2025. |
| Board practices |
The term of office of each director of the Company expires at the annual general meeting of shareholders each year. The board currently has 4 committees namely the Audit Committee, Nominating, Compensation and Governance Committee, the Indigenous and Community Relations Committee, and the Technical, Safety and Risk Management Committee. Each standing committee of the Board operates according to its mandate, which is approved by the Board and sets out the committee’s duties and responsibilities. Copies of the standing committee mandates are available at www.furygoldmines.com/about-us/governance/.
Audit Committee
The Company has an Audit Committee, which is currently comprised of Steve Cook (Chair), Brian Christie, and Michael Hoffman, each of whom is considered independent and financially literate in accordance with applicable securities laws. The Audit Committee has adopted a written charter that sets out its duties and responsibilities.
| o |
Steve Cook is a retired tax partner at the law firm of Thorsteinssons LLP, Vancouver, BC. Mr. Cook received his B.Comm. and LL.B. degrees from the University of BC and was called to the BC Bar in 1982 and the Ontario Bar in 1992. Mr. Cook is a specialist in corporate and international tax planning, offshore structures, representation, and civil and criminal tax litigation. |
| o | Brian Christie worked for over 17 years in the investment industry, primarily as a precious and base metals mining analyst with Desjardins Securities, National Bank Financial, Canaccord Capital and HSBC Securities. Prior to this, Mr. Christie spent 13 years in the mining industry as a geologist for a variety of mining companies, including Homestake, Billiton, Falconbridge Copper and Newmont Mining. |
| o | Michael Hoffman is an experienced mining executive with over 30 years of practice including engineering, mine operations, corporate development, projects and construction. Mr. Hoffman also has direct northern Canadian mining experience including operations and projects. |
The primary responsibility of the Audit Committee of the Company is that of oversight of the financial reporting process on behalf of the Board. This includes oversight responsibility for financial reporting and continuous disclosure, oversight of external audit activities, oversight of financial risk and financial management control, and oversight responsibility for compliance with tax and securities laws and regulations as well as whistle blowing procedures. The Audit Committee is also responsible for the other matters as set out in its charter and/or such other matters as may be directed by the Board from time to time. The Audit Committee should exercise continuous oversight of developments in these areas.
The Audit Committee has adopted specific policies and procedures for the engagement of non-audit services to be provided to the Company or any subsidiaries by the Company’s external auditor. The Chair of the Audit Committee has the authority to pre-approve in between regularly scheduled Audit Committee meetings any non-audit service of less than $50,000, however such approval will be presented to the Audit Committee at the next scheduled meeting for formal approval.
Nominating, Compensation and Governance Committee
The Nominating, Compensation and Governance Committee has the following members: Michael Hoffman (Chair), Brian Christie, and Saga Williams.
The Nominating, Compensation and Governance Committee follows both the mandate of the Charter of the Nominating and Governance Committee and the Compensation Committee Charter, both of which are included in the Company’s corporate governance material, which is posted on the Company’s website.
All members of the Nominating, Compensation and Governance Committee are independent in accordance with applicable securities laws. None of the members of the Nominating, Compensation and Governance Committee were, during the most recently completed fiscal year of the Company, an officer or employee of the Company or any of its subsidiaries.
Nominating and Governance Committee Charter
| ● |
The functions of the Nominating, Compensation and Governance Committee fall under the Nominating and Governance Committee Charter and are to provide a focus on governance that will enhance the Company’s performance, to assess and make recommendations regarding the effectiveness of the Board, and to establish and lead the process for identifying, recruiting, appointing, re-appointing, and providing ongoing development for directors. |
| ● |
The Company has formal procedures for assessing the effectiveness of Board committees as well as the Board as a whole. This function is carried out annually under the direction of the Nominating, Compensation and Governance Committee and those assessments are then provided to the Board. |
| ● |
The Nominating, Compensation and Governance Committee is responsible for developing and recommending to the Board the Company’s approach to corporate governance and assists members of the Board in carrying out their duties. The Nominating, Compensation and Governance Committee also reviews all new and modified rules and policies applicable to governance of listed corporations to ensure that the Company remains in full compliance with such requirements as are applicable. |
| ● |
In exercising its nominating function, the Nominating, Compensation and Governance Committee evaluates and recommends to the Board the size of the Board and certain persons as nominees for the position of director of the Company. |
Compensation Committee Charter
| ● |
The function of the Nominating, Compensation and Governance Committee under the Compensation Committee Charter is to consider the terms of employment of the CEO, CFO and other executive officers, and to consider the Company’s general compensation policy and its policy for granting awards under Fury Gold’s long-term incentive plan. |
| ● |
The Nominating, Compensation and Governance Committee functions include: the annual review of compensation paid to the Company’s executive officers and directors, the review of the performance of the Company’s executive officers, and the task of making recommendations on compensation to the Board. |
| ● |
The Nominating, Compensation and Governance Committee also periodically considers the grant of Options. Options have been granted to the executive officers, directors, and certain other service providers taking into account competitive compensation factors and the belief that Options help align the interests of executive officers, directors, and service providers with the interests of Shareholders. |
Other board committees with their committee members are:
Indigenous and Community Relations Committee
Saga Williams (Chair)
Michael Hoffman
Steve Cook
Technical, Safety and Risk Management Committee
Brian Christie (Chair)
Michael Hoffman
Isabelle Cadieux
Potential Conflicts of Interest
No directors or officers have any known conflicts of interest in connection with Fury Gold. Several directors serve on the boards of other publicly traded junior mining companies which can lead to potential conflicts of interest in connection with the entitlement to mineral project opportunities which may come to their attention. In response to this risk, the Company and its shared services provider, Universal Mineral Services Ltd. haves established policies to avoid these situations and to comply with legal requirements of their fiduciary obligations and the requirements of the applicable corporate laws (Business Corporations Act (British Columbia)) should such potential conflict of interest situations arise.
Whistleblower policy
The Company has adopted certain procedures to receive complaints and submissions relating to accounting matters through a whistleblower hotline email. The policy outlines procedures for financial concerns and other corporate issues. The Chair of the Audit Committee is responsible for monitoring and receiving any communication or complaints addressed in terms of the policy.
| Employees |
As at December 31, 2024, the Company had approximately 9 equivalent full-time employees located primarily in Canada. The Company shares certain technical and administrative functions provided by Vancouver-based Universal Mineral Services Ltd on a full-cost recovery basis. The Company also relies on consultants and contractors to carry on many of its business activities and, in particular, to supervise and carry out mineral exploration and drilling on its mineral properties. No management functions of Fury Gold are performed to any substantial degree by a person other than the directors or executive officers of Fury Gold.
In addition to full-time employees, the company also employed annually between 10 and 35 temporary employees over the last 3 years to assist with certain geological and administrative work out our projects.
| Share ownership |
As at March 31, 2025, the directors and officers of the Company beneficially own as a group an aggregate of 2,695,993 common shares (1.77%) of the Company.
As at March 11, 2025, the Company's directors and senior management beneficially owned the following number of the Company's common shares:
| Name |
Number of Common Shares beneficially owned |
Percentage share ownership (1) |
||||||
| Tim Clark, CEO |
1,085,521 | 0.71 | % | |||||
| Phil van Staden, CFO |
28,574 | 0.02 | % | |||||
| Bryan Atkinson, SVP, Exploration |
159,277 | 0.10 | % | |||||
| Brian Christie, Chair |
133,045 | 0.09 | % | |||||
| Steve Cook, Director |
837,266 | 0.55 | % | |||||
| Michael Hoffman, Director |
273,113 | 0.18 | % | |||||
| Saga Williams, Director |
118,543 | 0.08 | % | |||||
| Isabelle Cadieux, Director |
60,654 | 0.04 | % | |||||
| (1) |
Based on outstanding shares of 151,938,300 on March 31, 2025 |
All of the above shares held are voting shares and do not have any different voting rights other than the other outstanding shares of the Company.
As at March 31, 2025, the Company's directors and senior management beneficially held the following number of share purchase options and unvested restricted share units:
Share purchase options
| Name |
Number of securities underlying unexercised Options (#) |
Option |
Option |
||||||
| Tim Clark, CEO |
600,000 870,000 130,000 |
0.82 0.93 1.53 |
17-Jan-28 26-Aug-26 02-Apr-26 |
||||||
| Phil van Staden, CFO |
45,000 45,000 17,500 17,500 15,000 |
0.53 0.82 1.00 1.00 1.85 |
23-Jun-28 17-Jan-28 22-Apr-27 24-Jan-27 20-Dec-25 |
||||||
| Bryan Atkinson, SVP, Exploration |
269,000 135,000 135,000 150,000 |
0.82 1.00 1.00 2.05 |
17-Jan-28 22-Apr-27 24-Jan-27 20-Oct-25 |
||||||
| Brian Christie, Chair |
40,000 156,000 |
0.82 0.85 |
15-May-28 17-Feb-28 |
||||||
| Steve Cook, Director |
156,000 160,000 160,000 130,000 |
0.82 1.00 1.00 2.05 |
17-Jan-28 22-Apr-27 24-Jan-27 20-Oct-25 |
||||||
| Michael Hoffman, Director |
156,000 80,000 80,000 130,000 35,006 |
0.82 1.00 1.00 2.05 0.86 |
17-Jan-28 22-Apr-27 24-Jan-27 20-Oct-25 23-Jan-25 |
||||||
| Saga Williams, Director |
156,000 80,000 80,000 130,000 |
0.82 1.00 1.00 2.05 |
17-Jan-28 22-Apr-27 24-Jan-27 20-Oct-25 |
||||||
| Isabelle Cadieux, Director (1) |
156,000 | 0.55 | 21-Sep-28 |
||||||
| (1) |
Ms Cadieux’s outstanding options will be exercisable up to June 23, 2025, based on her March 24, 2025 resignation. |
Unvested Restricted Share Units:
| Name |
Number of unvested Restricted Share Units (#) |
Vesting date (D/M/Y) |
|||
| Tim Clark, CEO |
105,641 166,666 105,642 166,667 105,642 166,667 |
9-Jan-25 9-Jan-26 9-Jan-26 9-Jan-27 9-Jan-27 9-Jan-28 |
|||
| Phil van Staden, CFO |
15,195 60,000 15,195 60,000 15,196 60,000 |
9-Jan-25 9-Jan-26 9-Jan-26 9-Jan-27 9-Jan-27 9-Jan-28 |
|||
| Bryan Atkinson, SVP, Exploration |
44,990 66,666 44,991 66,667 44,991 66,667 |
9-Jan-25 9-Jan-26 9-Jan-26 9-Jan-27 9-Jan-27 9-Jan-28 |
|||
Unvested Deferred Share Units:
| Name |
Number of unvested Restricted or Deferred Share Units (#) |
Vesting date (D/M/Y) |
|||
| Brian Christie, Chair |
39,521 50,000 39,522 50,000 39,522 50,000 |
9-Jan-25 9-Jan-26 9-Jan-26 9-Jan-27 9-Jan-27 9-Jan-28 |
|||
| Steve Cook, Director |
31,456 36,666 31,456 36,667 31,456 36,667 |
9-Jan-25 9-Jan-26 9-Jan-26 9-Jan-27 9-Jan-27 9-Jan-28 |
|||
| Michael Hoffman, Director |
31,456 36,666 31,456 36,667 31,456 36,667 |
9-Jan-25 9-Jan-26 9-Jan-26 9-Jan-27 9-Jan-27 9-Jan-28 |
|||
| Saga Williams, Director |
31,456 36,666 31,456 36,667 31,456 36,667 |
9-Jan-25 9-Jan-26 9-Jan-26 9-Jan-27 9-Jan-27 9-Jan-28 |
|||
| Isabelle Cadieux, Director (1) |
31,456 36,666 31,456 36,667 31,456 36,667 |
9-Jan-25 9-Jan-26 9-Jan-26 9-Jan-27 9-Jan-27 9-Jan-28 |
|||
| (1) |
All unvested RSU’s of Ms Cadieux terminated on March 24, 2025. |
Long Term Incentive Plan
The following is a summary of the material terms of the Company’s Long-Term Incentive Plan (the “LTI Plan” that provides for the awards summarized below.
| A. |
General Description and Terms of Awards |
| B. |
Stock Options |
| C. |
Restricted Stock Units (RSUs) and Performance Stock Units (PSUs |
| D. |
Deferred Share Units (DSUs) |
| E. |
Additional Information regarding PSUs, RSUs and DSUs |
| F. |
Share Purchase Commitments (SPCs). |
A. General Description and Terms of Awards
| Eligible Participants |
For Options, any director, officer, or employee of the Company or of United Mineral Services Ltd., (“UMS”) the Company’s shared services provider.
For PSUs and RSUs, SPCs, directors, officers, or employees of the Company, including any subsidiary of the Company are eligible.
For DSUs, non-executive directors of the Company.
|
||
| Types of Awards |
Awards refers to Options, PSUs, RSUs and DSUs. |
||
| SPCs |
Share purchase commitments (SPCs) for service providers are allowed rather than “awarded” per se as they represent an assumption of financial risk by the participants. The extent to which a Participant agrees to purchase shares and permit a payroll of quarterly fee deduction to fund the purchase will vary by Participant. SPCs will be entered into in the discretion of the Board generally on a first come, first served basis, within the limits overall 2% and 30,000 shares per person limits in the LTI-Plan
|
||
| 10% Limit-whether settled by Shares or Cash |
The aggregate number of Shares (or cash equivalent) to be reserved and set aside for issue or settlement upon the purchase, exercise or settlement for all awards granted under the LTI Plan, together with all other security-based compensation arrangements of the Company (other than any securities issued for new-hire employment inducement pursuant to Section 613(c) of the TSX Corporation Manual), shall not exceed 10% of the issued and outstanding Shares at the time of granting the award (on a non-diluted basis); provided that, the aggregate number of Shares to be reserved and set aside for redemption and settlement in each category DSUs, RSUs PSUs and SPCs shall not exceed (in each such category), 2% of the issued and outstanding Shares outstanding (on a non-diluted basis) at the time of the granting of the DSUs, RSUs, PSUs SPCs.
|
||
| Other LTI-Plan Limits |
When combined with all of the Company’s other previously established security-based compensation arrangements, the LTI Plan shall not result in: (i) a number of Shares issued to insiders within a one- year period exceeding 5% of the issued and outstanding Shares; (ii) a number of Shares issuable to insiders at any time exceeding 5% of the issued and outstanding Shares; and (iii) a number of Shares; (i) issuable to all non-executive directors of the Company exceeding 1% of the issued and outstanding Shares at such time, or (ii) issuable to any one non-executive director within a one-year period exceeding an award value of $150,000 per such non-executive director; provided that DSUs granted in lieu of director fees payable on account of a director’s service as a member of the Board shall be excluded for purposes of the above-noted limits.
|
||
| Definition of Market Price |
“Market Price” means the volume-weighted average trading price of the Shares for the five trading days immediately preceding the applicable date as reported by the TSX.
|
||
| Assignability |
An award may not be assigned, transferred, charged, pledged or otherwise alienated, other than to a participant’s limited permitted assigns or personal representatives.
|
||
| Limits on LTI-Plan Amending Procedures |
The Board may, without Shareholder approval, amend, suspend, terminate or discontinue the LTI Plan or may amend the terms and conditions of any Awards and SPCs granted thereunder, provided that no amendment may materially and adversely affect any outstanding Award or SPC without the consent of the applicable participant. Amendments that do not require Shareholder approval and that are within the authority of the Board are limited to:
(i) amendments of a “housekeeping” nature or administrative in nature, including any amendment for the purpose of curing any ambiguity, typographical or like error or to correct or supplement any provision of the LTI Plan that conflicts with any other provision of the LTI Plan; (ii) an amendment which is necessary to comply with applicable law or the rules, regulations and policies of the TSX; (iii) amendments necessary for awards to qualify for favourable treatment under applicable tax laws; (iv) any amendment to the definition of Eligible Person or to the vesting provisions of the LTI Plan or any Award or SPC; (v) amendments necessary to suspend or terminate the plan (vi) amendments of the dates on which participants may become eligible to participate in the SPC, the minimum and maximum permitted payroll deduction rate, the term of a participant’s contributions and right to cancel the SPC, the rights of SPC holders of Shares, the rights to sell or withdraw Shares, including any holding period.
Shareholder approval at a duly convened shareholders’ meeting shall be required for any of the following amendments which may:
i. with respect to granted Options, reduce the Option Price, or cancel and reissue any Options so as to in effect reduce the Option Price; ii. extend (i) the term of an issued Option beyond its original expiry date, or (ii) the date on which a Performance Share Unit, Restricted Share Unit or Deferred Share Unit will be forfeited or terminated in accordance with its terms; iii. increase the fixed maximum percentage of Shares reserved for issuance under the Plan beyond 10% in total or effect an increase in any category of DSU,PSU,DSU or SPC beyond 2% of the issued and outstanding Shares at the time of grant; iv. remove or to exceed the insider participation; v. permit Awards granted under the Plan to be transferable or assignable other than for estate settlement purposes; vi. increase the Corporation’s contribution to an SPC or increase in the limit of number of shares allowed to be purchased by a Participant within a 12 month period; vii. change the definition of Market Price; or
delete, alter or reduce the foregoing range of amendments which require approval by the shareholders of the Corporation.
|
||
| Limited Financial Assistance |
The Corporation will only provide financial assistance to participants under the LTI Plan in respect of SPCs which financial assistance will be limited to 25% of the purchase price of the Shares.
|
||
| Other |
The LTI Plan further provides that if the expiry date or vesting date of Options is (i) during a blackout period, or (ii) within ten trading days following the end of a blackout period, the expiry date or vesting date, as applicable, will be automatically extended for a period of ten trading days following the end of the blackout period. In the case of Unit Awards, any settlement that is effected during a blackout period shall be in the form of a cash payment.
|
||
| Detailed Description of Awards |
|||
| B. Stock Options |
|||
| Stock Option Terms and Exercise Price |
A stock option is treasury security entitling the holder to purchase up to a fixed number of Shares for a fixed period at a fixed price. The number of Shares subject to each Option grant, exercise price, vesting, expiry date and other terms and conditions are determined by the Board. The exercise price shall in no event be lower than the Market Price of the Shares on the grant date.
|
||
| Term |
No Option shall have a term exceeding five years.
|
||
| Vesting |
Unless otherwise specified, each Option shall vest as to 25% upon grant and 12.5% after each quarter from the grant date.
|
||
| Exercise of Option |
A participant may exercise vested Options by (i) payment of the exercise price per Share subject to each Option, or if permitted by the Board, (ii) without payment either (A) by receiving an amount in cash per Option equal to the cash proceeds realized upon the sale of the Shares by a securities dealer in the capital markets, less the applicable exercise price and any applicable withholding taxes, or (B) by receiving the net number of Shares remaining after the sale of such number of Shares by a securities dealer in the capital markets as required to realize cash proceeds equal to the applicable exercise price and any applicable withholding taxes.
|
||
| Termination Date |
The participant’s last day of office or active employment by the Company or any subsidiary for any reason whatsoever (the “Termination Date”).
|
||
| Circumstances Causing Cessation of Entitlement |
Death |
Unvested Unvested Options automatically vest as of the date of death. |
Vested Vested Options expire on the earlier of the scheduled expiry date of the Option and one year following the date of death. |
| Disability |
Unvested Options continue to vest in accordance with their terms. |
Vested Options expire on the scheduled expiry date of the Option.
|
|
| Retirement and Early Retirement |
Unvested Options continue to vest in accordance with their terms, subject to compliance with any applicable non-compete and/or non-solicit provisions.
|
Vested Options expire on the scheduled expiry date of the Option. |
|
| For purposes of the Plan, “Early Retirement” means a participant’s resignation from employment on or after the date that the participant reaches age 60 and the participant has at least 5 years of service in the aggregate as at his or her Termination Date, other than a Retirement. |
Early Retirement If a participant retires early and subsequently commences alternative employment without having received prior written consent from the Company, unvested Options automatically terminate on the applicable commencement date. |
Early Retirement If a participant retires early and subsequently commences employment without having received prior written consent from the Company, all vested Options expire on the earlier of the scheduled expiry date of the Option and three months following the applicable commencement date.
|
|
| Resignation or loss of office |
Unvested Options are forfeited. |
Vested Options expire on the earlier of the scheduled expiry date of the Option and three months following the Termination Date.
|
|
| Termination without Cause (No Change in Control) |
Unvested Options are forfeited on the Termination Date. |
Vested Options expire on the earlier of the scheduled expiry date of the Option and three months following the Termination Date.
|
| Change in Control |
Unless otherwise provided in the participant’s service agreement or award agreement, unvested Options do not vest and become immediately exercisable upon a change in control, unless: (i) the successor fails to continue or assume the obligations under the LTI Plan or fails to provide for a substitute award, or (ii) if the Option is continued, assumed or substituted, the participant is terminated without cause or resigns for good reason in accordance with the terms of the participant’s service agreement within two years following the change in control. The Board shall have the right, but not the obligation, to permit each participant to exercise all of the participant’s outstanding Options (to the extent vested), subject to completion of the change in control.
|
Vested Options expire on the scheduled expiry date of the Option. |
|
| Termination for Cause |
Options, whether vested or unvested as of the Termination Date, automatically terminate. |
||
| C. RSUs and PSUs |
|||
| RSU and PSU Terms |
RSUs and PSUs are notional securities that entitle the recipient to receive cash or Shares at the end of a vesting period. Vesting of PSUs is contingent upon achieving certain performance criteria, thus ensuring greater alignment with the long-term interests of Shareholders. The terms applicable to RSUs and PSUs under the LTI Plan (including the vesting schedule, performance cycle, performance criteria for vesting and whether dividend equivalents will be credited to a participant’s account) are determined by the Board at the time of the grant.
|
||
| Vesting |
Unless otherwise provided, RSUs typically vest on November 30th of the third calendar year following the year in which the RSU was granted. Unless otherwise noted, PSUs shall vest as at the date that is the end of the performance cycle, subject to any performance criteria having been satisfied.
|
||
| Settlement |
On settlement, the Company shall, for each vested RSU or PSU being settled, deliver to a participant a cash payment equal to the Market Price of one Share as of the vesting date, one Share, or any combination of cash and Shares equal to the Market Price of one Share as of the vesting date, at the discretion of the Board.
Notwithstanding that the settlement may be in cash, the number of RSUs and PSUs remain governed by the 10% aggregate limit for all equity based compensation.
|
||
| D. Deferred Share Units |
|||
| DSU Terms |
A DSU is a notional security that entitles the recipient to receive cash or Shares upon resignation from the Board. The terms applicable to DSUs under the LTI Plan (including whether dividend equivalents will be credited to a participant’s DSU account) are determined by the Board at the time of the grant.
Under the LTI Plan, the Board may grant discretionary DSUs and mandatory or elective DSUs that are granted as a component of a non-executive director’s annual retainer.
Notwithstanding that the settlement may be in cash, the number of DSUs remain governed by the 10% aggregate limit for all equity based compensation.
|
||
| Vesting |
Unless otherwise provided, mandatory or elective DSUs vest immediately and the Board determines the vesting schedule for discretionary DSUs at the time of grant. The Corporation has not in the past and does not currently expect to grant discretionary DSUs in the future subject to vesting.
|
||
| Settlement |
DSUs may only be settled after the date on which the participant ceases to hold all positions with the Company or a related corporation. At the grant date, the Board shall stipulate whether the DSUs are paid in cash, Shares, or a combination of both, in an amount equal to the Market Price of the notional Shares represented by the DSUs in the participant’s DSU account.
|
||
| E. Other Information About PSUs, RSUs and DSUs |
|||
| Credit to Account |
As dividends are declared, additional PSUs, RSUs and/or DSUs may be credited to a participant in an amount equal to the greatest whole number which may be obtained by dividing (i) the value of such dividend or distribution on the payment date therefore by (ii) the Market Price of one Share on such date.
|
||
| Circumstances Causing Cessation of Entitlement |
Death |
Vested Unit Awards will be settled as of the date of death. Unvested Unit Awards (other than DSUs) will vest and be settled as of the date of death, prorated to reflect (i) for RSUs, the actual period between the grant date and date of death, and (ii) for PSUs, the actual period between the commencement of the performance cycle and the date of death, based on the achievement of the performance criteria for the applicable performance period(s) up to the date of death. Subject to the foregoing, any remaining Units Awards will terminate as of the date of death. Unvested DSUs automatically terminate on the date of death.
|
|
| Disability |
Vested Unit Awards will be settled as of the date of disability.
Unvested Unit Awards (other than DSUs) will vest and be settled in accordance with their terms as of the date of disability, and (i) PSUs will be prorated to reflect the actual period between the commencement of the performance cycle and the date of disability, based on the achievement of the performance criteria for the applicable performance period up to the date of disability, and (ii) RSUs will be prorated to reflect the actual period between the grant date and the date of disability.
Subject to the foregoing, any remaining Unit Awards (including unvested DSUs) will automatically terminate as of the date of disability.
|
||
| Retirement/ Early Retirement |
Vested Unit Awards will be settled as of the Termination Date.
Unvested PSUs will continue to vest and be settled in accordance their terms, based on the achievement of the performance criteria for the applicable performance period(s) and subject to compliance with any applicable non- compete and/or non-solicit provisions. Subject to the foregoing, any remaining PSUs will terminate as of the expiry date of the applicable performance period.
Unvested RSUs will continue to vest and be settled in accordance with their terms, subject to compliance with any applicable non-compete and/or non-solicit provisions.
Unvested DSUs automatically terminate on the Termination Date.
Early Retirement
If a participant retires early and subsequently commences alternative employment without having received prior written consent from the Company, all unvested PSUs and RSUs will automatically terminate on the applicable commencement date. |
||
| Resignation or loss of office |
Vested Unit Awards will be settled in accordance with their terms as of the Termination Date. Unvested Unit Awards automatically terminate on the Termination Date.
|
||
| Termination without Cause (No Change in Control) |
Vested Unit Awards will be settled in accordance their terms as of the Termination Date.
The following summary is in respect of the unvested Unit Awards as at the Termination Date:
Outstanding PSUs that would have vested on the next vesting date following the Termination Date are prorated to reflect the actual period between the commencement of the performance cycle and the Termination Date, based on the achievement of the performance criteria for the applicable performance period(s) up to the Termination Date, and will be settled in accordance with their terms as of such vesting date. Subject to the foregoing, any remaining PSUs will terminate as of the Termination Date.
Outstanding RSUs that would have vested on the next vesting date following the Termination Date, will vest and be settled in accordance with their terms as of such vesting date, prorated to reflect the actual period between the grant date and Termination Date.
Unvested DSUs automatically terminate on the date of termination.
|
||
| Change in Control |
Unless otherwise provided in the participant’s service agreement or award agreement, Unit Awards do not vest and become immediately settleable upon a change in control, unless: (i) the successor fails to continue or assume the obligations under the LTI Plan or fails to provide for a substitute award, or (ii) if the Unit Awards are continued, assumed or substituted, the participant is terminated without cause or resigns for good reason in accordance with the terms of the participant’s service agreement within two years following the change in control, and in each case, any outstanding PSUs will vest based on the achievement of the performance criteria for the applicable performance period(s) up to the effective date of the change in control.
The Board shall have the right, but not the obligation, to settle all of the participant’s outstanding Unit Awards (to the extent vested), subject to completion of the change in control.
|
||
| Termination with Cause |
Unit Awards, whether vested or unvested as of the Termination Date, automatically terminate. |
||
| F. Share Purchase Commitment (SPCs) |
|||
| Eligible Participants |
Any officer or employee of the Company, any subsidiary of the Company, including part time provided that the officer or employee has been actively employed by the Company, or any eligible subsidiary for at least three months.
|
||
| Maximum Number of Shares in a SPC |
The LTI Plan limits the number of Shares that any one Participant in any calendar year can acquire under a SPC to 30,000 Shares.
|
||
| Aggregate Maximum Number of Shares reserved for SPCs |
The maximum number of Shares in all SPCs is limited to 2% of the issued shares (non-diluted basis). |
||
| Administration |
The SPC will be administered by the board of directors of the Company (the “Board”). The Board can delegate a committee of the Board, such of the Board’s duties and powers relating to the SPC as the Board may see fit, subject to applicable law.
|
||
| Contributions |
Participant Contributions |
Participants may elect to contribute between one (1) and ten (10) percent of their base salary towards the purchase of Shares. The Corporation shall have no obligation to pay interest on participant contributions or to hold such amounts in a trust or in any segregated account.
A participant may not make any separate cash payment other than the participant’s contributions into the participant’s SPC account.
A participant shall be entitled to increase, decrease, suspend, terminate or resume his or her participant contributions no more than two times per calendar year, or three times per calendar year for employees returning from a leave of absence.
|
| Employer Contributions |
The Corporation will match the contribution of the participant in an amount equal to twenty-five (25) percent of the participant’s contribution. |
| Insider Participation Limits |
The SPC, when combined with all of the Company’s other established security-based compensation arrangements, shall not result at any time in: (i) a number of Shares issued to insiders within a one-year period exceeding 5% of the issued and outstanding Shares; and (ii) the number of Shares issuable to insiders at any time exceeding 5% of the issued and outstanding Shares. Additionally, in no event shall the number of Shares acquired by any one participant in any calendar year exceed thirty thousand (30,000), or such other maximum number of Shares as determined from time to time by the Company.
|
| Blackout Period |
Notwithstanding any other provision of the plan, if a blackout period is in effect, (i) an eligible participant subject to the blackout period may not enroll in the plan until after the end of the blackout period, and (ii) a participant subject to the blackout period may not increase, decrease, suspend, terminate or resume his or her participant’s contributions until after the end of the blackout period.
|
| Shares Subject to the SPC |
The aggregate number of Shares to be reserved and set aside for issue from treasury under the SPC is a maximum of 2% of the issued and outstanding Shares from time to time on a non-diluted basis. The aggregate number of Shares issued pursuant to the SPC, together with all other established security-based compensation arrangements of the Company (other than any Shares issued pursuant to Section 613(c) of the TSX Corporation Manual), shall not exceed 10% of the issued and outstanding Shares at the time the Shares are available (on a non-diluted basis). The Corporation has not issued any Shares under the SPC.
|
| Dividend Equivalents |
Dividend equivalents (generally distributions made to all holders of common shares) are credited to a participant’s SPC account as follows: (i) any cash dividends or distributions credited to the participant’s SPC account are deemed to be invested in additional Shares on the payment date established for the related dividend or distribution in an amount equal to the greatest whole number which may be obtained by dividing (a) the value of such dividend or distribution on the payment date by (b) the Market Price (as defined below) of one Share on the dividend payment date, and such additional Shares are subject to the same terms and conditions as are applicable in respect of the Shares with respect to which such dividends or distributions were payable; and (ii) if any such dividends or distributions are paid in Shares or other securities, such Shares and other securities are subject to the same holding period and the same vesting and other restrictions (if applicable) as apply to the Shares with respect to which they were paid.
|
| Financial Assistance |
Other than the Company’s 25% contribution, no financial assistance is provided to SPC participants.
|
| Assignability |
Shares acquired under the SPC may not be assigned, transferred, charged, pledged or otherwise alienated, other than to a participant’s permitted assigns or personal representatives.
|
| Market Price |
“Market Price” means the volume-weighted average trading price of the Shares for the five trading days immediately preceding the applicable date as reported by the TSX. |
| Purchase Price |
Market Purchase Shares |
For all Shares purchased in the market, the purchase price will be 100% of the average purchase price of the Shares purchased by the administrator on behalf of the participants through the facilities of the TSX or the NYSE, as applicable, on the date that such Market Purchase Shares are acquired. The Administrator will control the time, amount and manner of the purchases of any Market Purchase Shares.
|
| Treasury Purchase Shares |
For all Shares purchased and issued from treasury, the purchase price will be a price per Share equal to 100% of the Market Price on the date such Shares are issued.
|
| Vesting & Holding Period |
Shares acquired pursuant to the SPC vest immediately. Shares acquired with employer’s contributions are, subject to the cessation of a participant’s employment, subject to a 6 month holding period commencing as of the day such Shares are acquired by the participant (the “Holding Period”).
|
| Withdrawals |
Subject to compliance with applicable laws, any restrictions as may be prescribed by the Board and the Holding Period, participants are entitled to sell or withdraw some or all Shares held in their SPC account twice per calendar year. The Hold period is waived in the case of a change of control of the Corporation.
Such Shares will be sold on the TSX and/or NYSE as soon as is administratively practical after receipt of the request. The sale price for such Share shall be the prevailing market price of the Shares at the time of such sale.
|
| Termination Date |
The participant’s last day of office or active employment by the Company or any subsidiary for any reason whatsoever (the “Termination Date”).
|
| Termination of Employment |
Death |
The participant’s personal representative may elect to withdraw or sell all the Shares credited to the participant’s SPC account as of the date of death by making an election in the form and in the manner prescribed by the administrator. In the event that no such written notice of election is received by the administrator within 30 days of the participant’s date of death, the participant’s personal representative (or such other designated person) will automatically be deemed to have elected to sell the balance of Shares as of the 31st day following date of death. Thereafter, any accumulated cash and Shares credited to the participant’s SPC account as of the date of death will be delivered to, or on behalf of, the participant as soon as administratively practicable.
|
| Termination for any reason other than death |
The participant may elect to withdraw or sell all the Shares credited to the participant’s SPC account as of the Termination Date, by making an election in the form and in the manner prescribed by the administrator. In the event that no such written notice of election is received by the administrator within 30 days of the Termination Date, the participant will automatically be deemed to have elected to sell the balance of the Shares as of the 31st day following the Termination Date. Thereafter, any accumulated cash credited to the participant’s SPC account as of the Termination Date will be delivered to, or on behalf of, the participant as soon as administratively practicable. |
The LTI Plan is considered an “evergreen” plan pursuant to the rules of the TSX and consequently, the Company must obtain Shareholder approval of the unallocated awards under the LTI Plan every three years.
Item 7 — Major Shareholders and Related-Party Transactions
| Major shareholders |
The Company is a publicly held corporation, with its shares held by residents of Canada, the United States of America and other countries. To the best of the Company's knowledge, other than as noted below, no person, corporation or other entity beneficially owns, directly or indirectly, or controls more than 5% of the common shares of Fury, the only class of securities with voting rights. None of these 5%+ shareholders have different voting rights from the Company’s other shareholders. For these purposes, "beneficial ownership" means the sole or shared power to vote or direct the voting or to dispose or direct the disposition of any security:
| Name of Beneficial Owner (1) |
Number of common shares held |
Percentage of issued shares(2) |
||||||
| Fidelity Investments (3) |
10,800,000 | 7.11 | % | |||||
| (1) |
The term “beneficial owner” of securities refers to any person who, even if not the record owner of the securities, has or shares the underlying benefits of ownership. These benefits include the power to direct the voting or the disposition of the securities or to receive the economic benefit of ownership of the securities. A person also is considered to be the “beneficial owner” of securities that the person has the right to acquire within 60 days by option or other agreement. Beneficial owners include persons who hold their securities through one or more trustees, brokers, agents, legal representatives or other intermediaries, or through companies in which they have a “controlling interest,” which means the direct or indirect power to direct the management and policies of the entity. |
| (2) |
Based on outstanding shares of 151,938,300 on March 31, 2025. |
| (3) |
Acquired in a private placement transaction on April 19, 2022. |
Geographic Breakdown of Shareholders
As of March 12, 2025, Fury's register of shareholders indicates that Fury's common shares are held as follows:
| Location |
Number of registered shareholders of record |
Number of shares |
Percentage of |
|||||||||
| Canada |
175 | 147,932,760 | 97.41 | % | ||||||||
| United States |
307 | 3,464,749 | 2.23 | % | ||||||||
| Other |
9 | 540,791 | 0.36 | % | ||||||||
| TOTALS |
491 | 151,938,300 | 100 | % | ||||||||
Shares registered in intermediaries were assumed to be held by residents of the same country in which the clearing house was located.
Fury's securities are recorded on the books of its transfer agent, Odyssey Trust Company, located at Stock Exchange Tower, 1230 – 300 5th Avenue SW, Calgary, AB, T2P 3C4, Canada (888) 290-1175 in registered form. However, the majority of such shares are registered in the name of intermediaries such as brokerage houses and clearing houses (on behalf of their respective brokerage clients). Fury does not have knowledge or access to the identities of the beneficial owners of such shares registered through intermediaries.
Fury is not directly or indirectly owned or controlled by any other corporation, by any foreign government or by any other natural or legal person, severally or jointly, other than as noted above under Major Shareholders. There are no arrangements known to Fury which, at a subsequent date, may result in a change in control of Fury.
| Related-party transactions |
Except as disclosed below, the Company has not, since January 1, 2022, and does not at this time propose to:
| (1) |
enter into any transactions which are material to the Company or a related party or any transactions unusual in their nature or conditions involving goods, services or tangible or intangible assets to which The Company or any of its former subsidiaries was a party; |
| (2) |
make any loans or guarantees directly or through any of its former subsidiaries to or for the benefit of any of the following persons: |
| (a) |
enterprises directly or indirectly through one or more intermediaries, controlling or controlled by or under common control with the Company; |
| (b) |
associates of the Company (unconsolidated enterprises in which the Company has significant influence or which has significant influence over the Company) including shareholders beneficially owning 10% or more of the outstanding shares of The Company; |
| (c) |
individuals owning, directly or indirectly, shares of the Company that gives them significant influence over The Company and close members of such individuals families; |
| (d) |
key management personnel (persons having authority in responsibility for planning, directing and controlling the activities of the Company including directors and senior management and close members of such directors and senior management); or |
| (e) |
enterprises in which a substantial voting interest is owned, directly or indirectly, by any person described in (c) or (d) or over which such a person is able to exercise significant influence. |
Universal Mineral Services (“UMS”):
Under the shared services arrangements with the Company’s 25%-owned affiliate service provider company UMS, all transactions have occurred in the normal course of operations, and the shared costs are considered by management to be priced at equal to or better than would be the fair market rates for the shared services. All amounts owing to or from UMS are unsecured, non-interest bearing, and have no specific terms of settlement, unless otherwise noted.
| Years ended December 31 |
||||||||||||
| 2024 |
2023 |
2022 |
||||||||||
| Exploration and evaluation costs |
$ | 233 | $ | 872 | $ | 590 | ||||||
| General and administration |
307 | 714 | 841 | |||||||||
| Total transactions for the year |
$ | 540 | $ | 1,586 | $ | 1,431 | ||||||
The outstanding balance owing at December 31, 2024 was $90 (December 31, 2023 – $103, December 31, 2022 – $240) which is included in accounts payable.
As part of the UMS arrangement, the Company is contractually obliged to pay certain rental expenses in respect of a ten-year office lease entered into by UMS on July 1, 2021. As at December 31, 2024, the Company expects to incur approximately $91 in respect of its share of future rental expense of UMS.
The Company issues share options to certain UMS employees, including key management personnel of the Company. The Company recognized a share-based compensation recovery of $3 for the year ended December 31, 2024, in respect of share options issued to UMS employees (December 31, 2023 - $317 expense, December 31, 2022 - $483 expense) which is included within employee benefits and exploration and evaluation costs.
Dolly Varden Silver Corp (“Dolly Varden”):
Other than in respect of the Homestake Investor Rights Agreement, as described above under Item 4.A, here were no related-party transactions between the Company and our associate Dolly Varden in the last three years.
Key Management personnel compensation:
The remuneration of the Company’s key management personnel was as follows:
| Years ended December 31 |
||||||||||||
| 2024 |
2023 |
2022 |
||||||||||
| Short-term benefits provided to executives (a) |
$ | 1,306 | $ | 1,109 | $ | 1,719 | ||||||
| Directors’ fees paid to non-executive directors |
161 | 289 | 203 | |||||||||
| Share-based payments |
724 | 1,013 | 1,059 | |||||||||
| Total |
$ | 2,191 | $ | 2,411 | $ | 2,981 | ||||||
(a) Short-term employee benefits include salaries, bonuses payable within twelve months of the date of the consolidated statements of financial position, and other annual employee benefits.
| Interests of experts and counsel |
Not applicable
Item 8 — Financial Information
| Consolidated Statements and Other Financial Information |
Consolidated Statements
This Annual Report contains the audited Annual Consolidated Financial Statements which includes the consolidated statements of financial position as at December 31, 2024 and 2023 and the related consolidated statements of (earnings) loss and comprehensive (earnings) loss, consolidated statements of cash flows and consolidated statements of changes in shareholders’ equity for the years ended December 31, 2024, 2023 and 2022. These financial statements are accompanied by the appropriate PCAOB audit report issued by Deloitte LLP.
In addition to the Company’s Annual Consolidated Financial Statements, the Annual Consolidated Financial Statements of Dolly Varden in whom we are considered to have a significant influence in, has been included for the years ended December 31, 2024 and 2023 in line with Rule 3-09 of Regulation S-X. Whether an equity investee is significant, is measured through the Rule 3-09 significance tests based on investment and income thresholds which triggered the significant equity method investee disclosures. The Company acquired its initial investment in Dolly Varden on February 25, 2022 at which time it was considered to be an associate investment. Readers are referred to Note 12 of the Company’s Annual Consolidated Financial Statements that includes (i) summarized statements of financial position for Dolly Varden as at December 31, 2024 and 2023, and (ii) consolidated statements of earnings and comprehensive earnings for Dolly Varden for the years ended December 31, 2024, 2023 and 2022.
The Company’s Annual Consolidated Financial Statements as well as the Annual Consolidated Financial Statements of Dolly Varden are included as part of this Annual Report with page references F1 – F37 and F38 – F64.
Legal Proceedings
As of the date of this Annual Report, in the opinion of our management, we are not currently a party to any litigation or legal proceedings which are material, either individually or in the aggregate, and, to our knowledge, no legal proceedings of a material nature involving us currently are contemplated by any individuals, entities or governmental authorities.
Dividends
We have not paid any dividends on our common shares since in Company. Our management anticipates that we will retain all future earnings and other cash resources for the future operation and development of our business. We do not intend to declare or pay any cash dividends in the foreseeable future. Payment of any future dividends will be at the Board of Directors’ discretion, subject to applicable law, after taking into account many factors including our operating results, financial condition and current and anticipated cash needs.
| Significant changes |
There has been no significant changes since the issuance of the Annual Consolidated Financial Statements, except as disclosed in the Annual Report.
Item 9 — The Offer and Listing
| Offer and listing details |
The Company’s common shares trade on the NYSE and the TSX under the trading symbol “FURY”.
| Plan of distribution |
Not applicable
| Markets |
The Company’s common shares trade on the NYSE and the TSX under the trading symbol “FURY”.
| Selling shareholders |
Not applicable
| Dilution |
Not applicable
| Expenses of the issue |
Not applicable
Item 10 — Additional Information
| Share capital |
Not applicable.
| Memorandum and articles of association |
The Company was originally incorporated on June 9, 2008 pursuant to the British Columbia Business Corporations Act (the “Business Corporations Act”) under the name "Georgetown Capital Corp.". On October 15, 2013, the Company changed its name to "Auryn Resources Inc." and subsequently, on October 8, 2020, changed its name to Fury Gold Mines Limited. The Company’s incorporation number, as assigned by the British Columbia Registry Services, is BC0827202.
The Company’s current Notice of Articles is dated September 6, 2023 and the Company’s Articles dated effective June 24, 2021 are attached to this Annual report on Form 20-F as Exhibits 1.01 and 1.02, respectively.
The following is a summary of certain material provisions of (i) Fury’s Notice of Articles and Articles, and (ii) certain provisions of the British Columbia Business Corporations Act (the “Business Corporations Act”) applicable to Fury:
| 1. |
Objects and Purposes |
Fury's Notice of Articles and Articles do not specify objects or purposes. Fury is entitled under the Business Corporations Act to carry on all lawful businesses which can be carried on by a natural person.
| 2. |
Directors |
Director’s power to vote on a proposal, arrangement or contract in which the director is interested.
According to the Business Corporations Act, a director holds a disclosable interest in a contract or transaction if:
| 1. |
the contract or transaction is material to the company; |
| 2. |
the company has entered, or proposes to enter, into the contract or transaction, and |
| 3. |
either of the following applies to the director: |
| a. |
the director has a material interest in the contract or transaction; |
| b. |
the director is a director or senior officer of, or has a material interest in, a person who has a material interest in the contract or transaction. |
However, the Business Corporations Act also provides that in the following circumstances, a director does not hold a disclosable interest in a contract or transaction if:
| 1. |
the situation that would otherwise constitute a disclosable interest arose before the coming into force of the Business Corporations Act or, if the company was recognized under the Business Corporations Act, before that recognition, and was disclosed and approved under, or was not required to be disclosed under, the legislation that: |
| a. |
applied to the company on or after the date on which the situation arose; and |
| b. |
is comparable in scope and intent to the provisions of the Business Corporations Act; |
| 2. |
both the company and the other party to the contract or transaction are wholly owned subsidiaries of the same corporation; |
| 3. |
the company is a wholly owned subsidiary of the other party to the contract or transaction; |
| 4. |
the other party to the contract or transaction is a wholly owned subsidiary of the company; or |
| 5. |
where the director or senior officer is the sole shareholder of the company or of a corporation of which the company is a wholly owned subsidiary. |
The Business Corporations Act further provides that a director of a company does not hold a disclosable interest in a contract or transaction merely because:
| 1. |
the contract or transaction is an arrangement by way of security granted by the company for money loaned to, or obligations undertaken by, the director or senior officer, or a person in whom the director or senior officer has a material interest, for the benefit of the company or an affiliate of the company; |
| 2. |
the contract or transaction relates to an indemnity or insurance; |
| 3. |
the contract or transaction relates to the remuneration of the director or senior officer in that person's capacity as director, officer, employee or agent of the company or of an affiliate of the company; |
| 4. |
the contract or transaction relates to a loan to the company, and the director or senior officer, or a person in whom the director or senior officer has a material interest, is or is to be a guarantor of some or all of the loan; or |
| 5. |
the contract or transaction has been or will be made with or for the benefit of a corporation that is affiliated with the company and the director or senior officer is also a director or senior officer of that corporation or an affiliate of that corporation. |
Under Fury’s Articles, a director or senior officer who holds a disclosable interest (as that term is used in the Business Corporations Act) in a contract or transaction into which Fury has entered or proposes to enter:
| 1. |
is liable to account to Fury for any profit that accrues to the director or senior officer under or as a result of the contract or transaction only if and to the extent provided in the Act; |
| 2. |
is not entitled to vote on any directors’ resolution to approve that contract or transaction, unless all the directors have a disclosable interest in that contract or transaction, in which case any or all of those directors may vote on such resolution; |
| 3. |
and who is present at the meeting of directors at which the contract or transaction is considered for approval may be counted in the quorum at the meeting whether or not the director votes on any or all of the resolutions considered at the meeting. |
A director or senior officer who holds any office or possesses any property, right or interest that could result, directly or indirectly, in the creation of a duty or interest that materially conflicts with that individual’s duty or interest as a director or senior officer, must disclose the nature and extent of the conflict as required by the Business Corporations Act. No director or intended director is disqualified by his or her office from contracting with Fury either with regard to the holding of any office or place of profit the director holds with Fury or as vendor, purchaser or otherwise, and no contract or transaction entered into by or on behalf of Fury in which a director is in any way interested is liable to be voided for that reason.
Directors' power, in the absence of an independent quorum, to vote compensation to themselves or any members of their body.
The compensation of the directors is decided by the directors unless the board of directors requests approval to the compensation from the shareholders by ordinary resolution. The Business Corporations Act provides that a director of a company does not hold a disclosable interest in a contract or transaction merely because the contract or transaction relates to the remuneration of the director or senior officer in that person's capacity as director, officer, employee or agent of Fury or of an affiliate of Fury.
Borrowing powers exercisable by the directors.
Under the Articles, the directors may, on behalf of Fury:
| 1. |
borrow money in such manner and amount, on such security, from such sources and upon such terms, and conditions as they consider appropriate; |
| 2. |
issue bonds, debentures, and other debt obligations either outright or as a security for any liability or obligation of Fury or any other person and at such discounts or premiums and on such other terms as they consider appropriate; |
| 3. |
guarantee the repayment of money by any other person or the performance of any obligation of any other person; and |
| 4. |
mortgage, charge, whether by way of specific or floating charge, grant a security interest in, or give other security on, the whole or any part of the present and future assets and undertaking of Fury. |
Retirement and non-retirement of directors under an age limit requirement.
There are no such provisions applicable to Fury under its Memorandum or its Articles or the Business Corporations Act.
Number of shares required for a director’s qualification.
Directors need not own any shares of Fury in order to qualify as directors.
| 3. |
Rights, Preferences and Restrictions Attaching to Each Class of Shares |
Authorized Capital
The Company’s authorized capital consists of an unlimited number of common shares and an unlimited number of preferred shares (none of which preferred shares have been allotted or issued).
Common Shares
The rights, preferences and restrictions attached to the Company’s common shares are summarized as follows:
Dividends
Subject the provisions of the Business Corporations Act, the directors may from time to time declare and authorized payments of dividends out of available assets. Any dividends must be declared and paid according to the number of shares held. Under the Business Corporations Act, no dividend may be paid if Fury is, or would as a result of payment of the dividend become, insolvent.
Voting Rights
Each common share is entitled to one vote on matters to which common shares ordinarily vote including the annual election of directors, appointment of auditors and approval of corporate changes. Directors are elected to hold office at each annual meeting and hold office until the ensuing annual meeting. Directors automatically retire at each annual meeting. There are no staggered directorships among Fury’s directors. There are no cumulative voting rights applicable to Fury.
Rights to Profits and Liquidation Rights
All common shares of Fury participate ratably in any net profit or loss of Fury and participate ratably as to any distribution of assets in the event of a winding up or other liquidation.
Redemption
The common shares are not subject to any rights of redemption.
Sinking Fund Provisions
Fury has no sinking fund provisions or similar obligations relating to the common shares.
Shares Fully Paid
All common shares of Fury must, under the Business Corporations Act, be issued as fully paid for cash, property or services. They are therefore non-assessable and not subject to further calls for payment.
Pre-emptive Rights
Holders of common shares of Fury are not entitled to any pre-emptive rights which provide a right to any holder to participate in any further offerings of the Company’s equity or other securities.
Preferred Shares
Preferred Shares are authorized to be issued from time to time in one or more series, and the Board may fix from time to time before such issue the number of Preferred Shares, the designation, rights and privileges attached thereto including any voting rights, dividend rights, redemption, purchase or conversion rights, sinking fund or other provisions. Preferred Shares generally rank in priority over Common Shares and any other shares ranking by their terms junior to the Preferred Shares as to dividends and return of capital upon, liquidation, dissolution or winding up of the Company or any other return of capital or distribution of the assets of the Company The Articles provide that, subject to the Business Corporations Act, the Company may, by special resolution:
| 4. |
Changes to Rights and Restrictions to Shares |
| ● |
create special rights or restrictions for, and attach those special rights or restrictions to, the shares of any class or series of shares, whether or not any or all of those shares have been issued; or |
| ● |
vary or delete any special rights or restrictions attached to the shares of any class or series of shares, whether or not any or all of those shares have been issued. |
Subject to the Business Corporations Act, the Company may by directors resolution subdivide or consolidate all or any of its unissued, or fully paid issued, shares and, if applicable, alter its Notice of Articles, and, if applicable, its Articles.
The Articles provide that the Company may by directors resolution authorize an alteration of its Notice of Articles in order to change its name or adopt or change any translation of that name.
The Company’s Articles provide that, subject to the Business Corporations Act, the Company may by ordinary resolution of shareholders (or a resolution of the directors in the case of §(c) or §(f) below):
| (a) |
create one or more classes or series of shares or, if none of the shares of a class or series of shares are allotted or issued, eliminate that class or series of shares; |
| (b) |
increase, reduce or eliminate the maximum number of shares that Fury is authorized to issue out of any class or series of shares or establish a maximum number of shares that Fury is authorized to issue out of any class or series of shares for which no maximum is established; |
| (c) |
subdivide or consolidate all or any of its unissued, or fully paid issued, shares; |
| (d) |
if the Company is authorized to issue shares of a class of shares with par value: |
| o |
decrease the par value of those shares; or |
| o |
if none of the shares of that class of shares are allotted or issued, increase the par value of those shares; |
| (e) |
change all or any of its unissued, or fully paid issued, shares with par value into shares without par value or any of its unissued shares without par value into shares with par value; |
| (f) |
alter the identifying name of any of its shares; or |
| (g) |
otherwise alter its shares or authorized share structure when required or permitted to do so by the Act where it does not specify a special resolution. |
The Articles provide that a special resolution is a resolution of shareholders that is approved by two thirds (66 2/3%) of those votes cast at a properly constituted meeting of shareholders. An ordinary resolution is a resolution of shareholders that is approved by a majority of those votes cast at a properly constituted meeting of shareholders. Quorum pursuant to the Articles is two shareholders holding at least 25% of issued shares.
If special rights and restrictions are altered and any right or special right attached to issued shares is prejudiced or interfered with, then the consent of the holders of shares of that class or series by a special separate resolution will be required.
The Business Corporations Act also provides that a company may reduce its capital if it is authorized to do so by a court order, or, if the capital is reduced to an amount that is not less than the realizable value of the company's assets less its liabilities, by a special resolution or court order.
Generally, there are no significant differences between British Columbia and United States law with respect to changing the rights of shareholders as most state corporation statutes require shareholder approval (usually a majority) for any such changes that affect the rights of shareholders.
| 5. |
Meetings of Shareholders |
The Articles provide that the Company must hold its annual general meeting once in every calendar year (being not more than 15 months from the last annual general meeting) at such time and place to be determined by the directors of Fury. Shareholders meetings are governed by the Articles of Fury but many important shareholder protections are also contained in the Canadian provincial securities laws that are applicable to Fury as a reporting issuer in all of the Provinces and Territories of Canada (“Canadian Securities Laws”) and the British Columbia Corporations Act. The Articles provide that Fury will provide at least 21 days' advance written notice of any meeting of shareholders and will provide for certain procedural matters and rules of order with respect to conduct of the meeting. The directors may fix in advance a date, which is no fewer than 21 days prior to the date of the meeting for the purpose of determining shareholders entitled to receive notice of and to attend and vote at a general meeting.
Canadian Securities Law and the British Columbia Corporations Act superimpose requirements that generally provide that shareholders meetings require not less than a 60 day notice period from initial public notice and that Fury makes a thorough advanced search of intermediary and brokerage registered shareholdings to facilitate communication with beneficial shareholders so that meeting proxy and information materials can be sent via the brokerages to unregistered but beneficial shareholders. The form and content of information circulars and proxies and like matters are governed by Canadian Securities Laws and the British Columbia Corporations Act. This legislation specifies the disclosure requirements for the proxy materials and various corporate actions, background information on the nominees for election for director, executive compensation paid in the previous year and full details of any unusual matters or related party transactions. Fury must hold an annual shareholders meeting open to all shareholders for personal attendance or by proxy at each shareholder's determination.
Most state corporation statutes require a public company to hold an annual meeting for the election of directors and for the consideration of other appropriate matters. The state statutes also include general provisions relating to shareholder voting and meetings. Apart from the timing of when an annual Meeting must be held and the percentage of shareholders required to call an annual Meeting or an extraordinary meeting, there are generally no material differences between Canadian and United States law respecting annual meetings and extraordinary meetings.
| 6. |
Rights to Own Securities |
There are no limitations under Fury's Articles or in the Business Corporations Act on the right of persons who are not citizens of Canada to hold or vote common shares.
| 7. |
Restrictions on Changes in Control, Mergers, Acquisitions or Corporate Restructuring of the Company |
The Company’s Articles do not contain any provisions that would have the effect of delaying, deferring or preventing a change of control of the Company. There are no adopted provisions in the Company’s Articles triggered by or affected by a change in outstanding shares which gives rise to a change in control.
| 8. |
Ownership Threshold Requiring Public Disclosure |
The Articles of Fury do not require disclosure of share ownership. Share ownership of director nominees must be reported annually in proxy materials sent to Fury's shareholders. There are no requirements under British Columbia corporate law to report ownership of shares of Fury but Canadian Securities Law requires disclosure of trading by insiders (generally officers, directors and holders of 10% of voting shares) within 5 days of the trade. In addition, Canadian Securities Laws require disclosure of acquisition of more than 10% of the issued and outstanding shares of the Company by press release and filing of an early warning report within 2 business days of the acquisition. Canadian Securities Laws also require that we disclose in our annual general meeting proxy statement, holders who beneficially own more than 10% of our issued and outstanding shares, and United States federal securities laws require the disclosure in our annual report on Form 20-F of holders who own more than 5% of our issued and outstanding shares.
Most state corporation statutes do not contain provisions governing the threshold above which shareholder ownership must be disclosed. United States federal securities laws require a company that is subject to the reporting requirements of the Securities Exchange Act of 1934 to disclose, in its annual reports filed with the Securities and Exchange Commission those shareholders who own more than 5% of a corporation’s issued and outstanding shares.
| 9. |
Differences in Law between the US and British Columbia |
Differences in the law between United States and British Columbia, where applicable, have been explained above within each category.
| 10. |
Changes in the Capital of the Company |
There are no conditions imposed by Fury’s Notice of Articles or Articles which are more stringent than those required by the Business Corporations Act.
Limitations on Rights of Non-Canadians
The Company is incorporated pursuant to the laws of the Province of British Columbia, Canada. There is no law or governmental decree or regulation in Canada that restricts the export or import of capital, or affects the remittance of dividends, interest or other payments to a non-resident holder of common shares, other than withholding tax requirements. Any such remittances to United States residents are generally subject to withholding tax, however, no such remittances are likely in the foreseeable future. See “Canadian Federal Income Tax Considerations for United States Residents” below.
There is no limitation imposed by Canadian law or by our Articles or other constituent documents of our Company on the right of a non-resident to hold or vote common shares of our Company. However, the Investment Canada Act (Canada) (the “Investment Act”) has rules regarding certain acquisitions of shares by non-Canadians, along with other requirements under that legislation.
The following discussion summarizes the principal features of the Investment Act for a non-Canadian (as defined under the Investment Act) who proposes to acquire common shares of our Company. The discussion is general only; it is not a substitute for independent legal advice from an investor’s own advisor; and it does not anticipate statutory or regulatory amendments.
The Investment Act is a federal statute of broad application regulating the establishment and acquisition of Canadian businesses by non-Canadians, including individuals, governments or agencies thereof, corporations, partnerships, trusts or joint ventures (each an “entity”). Investments by non-Canadians to acquire control over existing Canadian businesses or to establish new ones are either reviewable or notifiable under the Investment Act. If an investment by a non-Canadian to acquire control over an existing Canadian business is reviewable under the Investment Act, the Investment Act generally prohibits implementation of the investment unless, after review, the Minister of Innovation, Science and Industry (the “Minister”) is satisfied that the investment is likely to be of net benefit to Canada.
A non-Canadian would acquire control of our Company for the purposes of the Investment Act through the acquisition of common shares if the non-Canadian acquired a majority of the voting interests in our Company.
Further, the acquisition of less than a majority but one-third or more of the voting interests in our Company by a non-Canadian would be presumed to be an acquisition of control of our Company unless it could be established that, on the acquisition, our Company was not controlled in fact by the acquirer through the ownership of such voting interests.
For a direct acquisition that would result in an acquisition of control of our Company, subject to the exception for “WTO investors” that are controlled by persons who are nationals or permanent residents of World Trade Organization (“WTO”) member nations, a proposed investment generally would be reviewable where the value of the acquired assets is $5 million or more.
For a proposed indirect acquisition by an investor other than a so-called “WTO investor” that would result in an acquisition of control of our Company through the acquisition of a non-Canadian parent entity, the investment generally would be reviewable where the value of the assets of the entity carrying on the Canadian business, and of all other entities in Canada, the control of which is acquired, directly or indirectly, is $50 million or more.
In the case of a direct acquisition by a WTO investor that is not a state-owned enterprise, the threshold is significantly higher. An investment in common shares of our Company by a WTO investor that is not a state-owned enterprise would be reviewable only if it was an investment to acquire control of the Company and the enterprise value of the assets of the Company was equal to or greater than a specified amount, which is published by the Minister after its determination for any particular year. For 2024, this amount is $1.326 billion (unless the investor is controlled by persons who are nationals or permanent residents of countries that are party to one of a list of certain free trade agreements, in which case the amount is $1.989 billion for 2024); each year, both thresholds are adjusted by a GDP (Gross Domestic Product) based index.
The higher WTO threshold for direct investments and the exemption for indirect investments do not apply where the relevant Canadian business is carrying on a “cultural business”. The acquisition of a Canadian business that is a cultural business is subject to lower review thresholds under the Investment Act because of the perceived sensitivity of the cultural sector.
If the Minister has reasonable grounds to believe that an investment by a non-Canadian “could be injurious to national security”, the Minister may send the non-Canadian a notice indicating that an order for review of the investment may be made. The review of an investment on the grounds of national security may occur whether or not an investment is otherwise subject to review on the basis of net benefit to Canada or otherwise subject to notification under the Investment Act.
Certain transactions, except those to which the national security provisions of the Investment Act may apply, relating to common shares of our Company are exempt from the Investment Act, including:
| ● |
the acquisition of our common shares by a person in the ordinary course of that person’s business as a trader or dealer in securities; |
| ● |
the acquisition of control of our Company in connection with the realization of security granted for a loan or other financial assistance and not for a purpose related to the provisions of the Investment Act, if the acquisition is subject to approval under the Bank Act, the Cooperative Credit Associations Act, the Insurance Companies Act or the Trust and Loan Companies Act; and |
| ● |
the acquisition of control of our Company by reason of an amalgamation, merger, consolidation or corporate reorganization following which the ultimate direct or indirect control in fact of our Company, through the ownership of voting interests, remains unchanged. |
| Material contracts |
Except for contracts entered into in the ordinary course of business, the following are the only material agreements to which the Company is party (the “Material Contracts”):
| (1) |
UMS is the private company through which its shareholders, including the Company, share geological, financial, and transactional advisory services as well as administrative services on a full, cost recovery basis. This allows the Company to maintain a more efficient and cost-effective corporate overhead structure by hiring fewer full-time employees and engaging outside professional advisory firms less frequently. The agreement has an indefinite term and can be terminated by either party upon providing 180 days notice. The Company is committed to certain office rental expense in respect of shared head office including after termination of the UMS agreement which the Company may terminate anytime on 180 days notice. The UMS agreement is filed as Exhibit 4.2 to this Annual Report on Form 20-F. |
| Exchange control |
The Company is incorporated pursuant to the laws of the Province of British Columbia, Canada. There is no law or governmental decree or regulation in Canada that restricts the export or import of capital, or affects the remittance of dividends, interest or other payments to a non-resident holder of common shares, other than withholding tax requirements. Any such remittances to United States residents are generally subject to withholding tax, however no such remittances are likely in the foreseeable future. See “Certain Canadian Federal Income Tax Information for United States Residents” below.
There is no limitation imposed by Canadian law or by the charter or other constituent documents of our Company on the right of a non-resident to hold or vote common shares of our Company. However, as discussed above in Item 10.B, “Memorandum and Articles of Association,” under the heading “Limitations on Rights of Non-Canadians,” the Investment Canada has rules regarding certain acquisitions of shares by non-residents, along with other requirements under that legislation.
| Taxation |
Certain United States Federal Income Tax Considerations
The following is a general summary of certain U.S. federal income tax considerations applicable to a U.S. Holder (as defined below) arising from and relating to the acquisition, ownership and disposition of the Common Shares.
This summary is for general information purposes only and does not purport to be a complete analysis or listing of all potential U.S. federal income tax considerations that may apply to a U.S. Holder as a result of the acquisition, ownership and disposition of the Common Shares. In addition, this summary does not take into account the individual facts and circumstances of any particular U.S. Holder that may affect the U.S. federal income tax consequences to such U.S. Holder, including specific tax consequences to a U.S. Holder under an applicable tax treaty. Accordingly, this summary is not intended to be, and should not be construed as, legal or U.S. federal income tax advice with respect to any particular U.S. Holder. This summary does not address the U.S. federal net investment income, U.S. federal alternative minimum, U.S. federal estate and gift, U.S. state and local, and non-U.S. tax consequences to U.S. Holders of the acquisition, ownership, and disposition of Common Shares. In addition, except as specifically set forth below, this summary does not discuss applicable tax reporting requirements. Each U.S. Holder should consult its own tax advisor regarding the U.S. federal, U.S. federal net investment income, U.S. federal alternative minimum, U.S. federal estate and gift, U.S. state and local, and non-U.S. tax consequences relating to the acquisition, ownership and disposition of Common Shares.
No opinion from legal counsel or ruling from the Internal Revenue Service (the “IRS”) has been requested, or will be obtained, regarding the U.S. federal income tax considerations applicable to U.S. Holders as discussed in this summary. This summary is not binding on the IRS, and the IRS is not precluded from taking a position that is different from, and contrary to, the positions taken in this summary. In addition, because the authorities on which this summary is based are subject to various interpretations, the IRS and the U.S. courts could disagree with one or more of the positions taken in this summary.
Scope of this Summary
Authorities
This summary is based on the Internal Revenue Code of 1986, as amended (the “Code”), Treasury Regulations (whether final, temporary, or proposed) promulgated under the Code, published rulings of the IRS, published administrative positions of the IRS, the Canada-U.S. Tax Convention (as defined below), and U.S. court decisions, that are in effect and available, as of the date of this document. Any of the authorities on which this summary is based could be changed in a material and adverse manner at any time, and any such change could be applied retroactively. This summary does not discuss the potential effects, whether adverse or beneficial, of any proposed legislation that, if enacted, could be applied on a retroactive or prospective basis.
U.S. Holders
For purposes of this summary, the term “U.S. Holder” means a beneficial owner of Common Shares that is for U.S. federal income tax purposes:
| ● |
a citizen or individual resident of the United States; |
| ● |
a corporation (or other entity treated as a corporation for U.S. federal income tax purposes) organized under the laws of the United States, any state thereof or the District of Columbia; |
| ● |
an estate whose income is subject to U.S. federal income taxation regardless of its source; or |
| ● |
a trust that (1) is subject to the primary supervision of a court within the United States and the control of one or more U.S. persons for all substantial decisions or (2) has a valid election in effect under applicable Treasury Regulations to be treated as a U.S. person. |
U.S. Holders Subject to Special U.S. Federal Income Tax Rules Not Addressed
This summary does not address the U.S. federal income tax considerations applicable to U.S. Holders that are subject to special provisions under the Code, including U.S. Holders that: (a) are tax-exempt organizations, qualified retirement plans, individual retirement accounts, or other tax- deferred accounts; (b) are financial institutions, underwriters, insurance companies, real estate investment trusts, or regulated investment companies; (c) are brokers or dealers in securities or currencies or are traders in securities that elect to apply a mark-to-market accounting method; (d) have a “functional currency” other than the U.S. dollar; (e) own Common Shares as part of a straddle, hedging transaction, conversion transaction, constructive sale, or other integrated transaction; (f) acquired Common Shares in connection with the exercise of employee stock options or otherwise as compensation for services; (g) hold Common Shares other than as a capital asset within the meaning of Section 1221 of the Code (generally, property held for investment purposes); (h) are subject to the alternative minimum tax; (i) are partnerships and other pass-through entities (and investors in such partnerships and entities); (j) are S corporations (and shareholders therein); (k) are subject to special tax accounting rules; (l) own, have owned or will own (directly, indirectly, or by attribution) 10% or more of the total combined voting power or value of our outstanding shares; (m) are U.S. expatriates or former long-term residents of the U.S.; or (n) hold Common Shares in connection with a trade or business, permanent establishment, or fixed base outside the United States. U.S. Holders that are subject to special provisions under the Code, including U.S. Holders described immediately above, should consult their own tax advisors regarding the U.S. federal, U.S. federal net investment income, U.S. federal alternative minimum, U.S. federal estate and gift, U.S. state and local, and non-U.S. tax consequences relating to the acquisition, ownership and disposition of Common Shares.
If an entity or arrangement that is classified as a partnership (or other pass-through entity) for U.S. federal income tax purposes holds Common Shares, the U.S. federal income tax consequences to such entity or arrangement and the owners of such entity or arrangement generally will depend on the activities of such entity or arrangement and the status of such partners (or other owners). This summary does not address the tax consequences to any such entity or arrangement or partner (or other owner). Partners (or other owners) of entities or arrangements that are classified as partnerships for U.S. federal income tax purposes should consult their own tax advisor regarding the U.S. federal income tax consequences arising from and relating to the acquisition, ownership, and disposition of Common Shares.
Passive Foreign Investment Company Rules
If we are considered a “passive foreign investment company” within the meaning of Section 1297 of the Code (a “PFIC”) at any time during a U.S. Holder’s holding period, the following sections will generally describe the potentially adverse U.S. federal income tax consequences to U.S. Holders of the acquisition, ownership, and disposition of Common Shares.
We believe that we were classified as a PFIC for our most recently completed tax year, and based on current business plans and financial expectations, we expect that we may be a PFIC for our current tax year and subsequent tax years. No opinion of legal counsel or ruling from the IRS concerning our status as a PFIC has been obtained or is currently planned to be requested. The determination of whether any corporation was, or will be, a PFIC for a tax year depends, in part, on the application of complex U.S. federal income tax rules, which are subject to differing interpretations. In addition, whether any corporation will be a PFIC for any tax year depends on the assets and income of such corporation over the course of each such tax year and, as a result, our PFIC status for the current year and future years cannot be predicted with certainty as of the date of this document. Accordingly, there can be no assurance that the IRS will not challenge any PFIC determination made by us. Each U.S. Holder should consult its own tax advisor regarding our status as a PFIC and the PFIC status of each of our non-U.S. subsidiaries.
In any year in which we are classified as a PFIC, a U.S. Holder will be required to file an annual report with the IRS containing such information as Treasury Regulations and/or other IRS guidance may require. In addition to penalties, a failure to satisfy such reporting requirements may result in an extension of the time period during which the IRS can assess a tax. U.S. Holders should consult their own tax advisors regarding the requirements of filing such information returns under these rules, including the requirement to file an IRS Form 8621 annually.
We generally will be a PFIC for any tax year in which (a) 75% or more of our gross income for such tax year is passive income (the “PFIC income test”) or (b) 50% or more of the value of our assets either produce passive income or are held for the production of passive income, based on the quarterly average of the fair market value of such assets (the “PFIC asset test”). “Gross income” generally includes sales revenues less the cost of goods sold, plus income from investments and from incidental or outside operations or sources, and “passive income” generally includes, for example, dividends, interest, certain rents and royalties, certain gains from the sale of stock and securities, and certain gains from commodities transactions. Active business gains arising from the sale of commodities generally are excluded from passive income if substantially all of a foreign corporation’s commodities are stock in trade or inventory, depreciable property used in a trade or business, or supplies regularly used or consumed in the ordinary course of its trade or business, and certain other requirements are satisfied.
For purposes of the PFIC income test and PFIC asset test described above, if we own, directly or indirectly, 25% or more of the total value of the outstanding shares of another corporation, we will be treated as if we (a) held a proportionate share of the assets of such other corporation and (b) received directly a proportionate share of the income of such other corporation. In addition, for purposes of the PFIC income test and PFIC asset test described above, “passive income” does not include any interest, dividends, rents, or royalties that are received or accrued by us from a “related person” (as defined in Section 954(d)(3) of the Code), to the extent such items are properly allocable to the income of such related person that is not passive income.
Under certain attribution rules, if we are a PFIC, U.S. Holders will be deemed to own their proportionate share of any of our subsidiaries which are also PFICs (each, a “Subsidiary PFIC”), and will generally be subject to U.S. federal income tax as discussed below under the heading “Default PFIC Rules Under Section 1291 of the Code” on their proportionate share of any (i) distribution on the shares of a Subsidiary PFIC and (ii) disposition or deemed disposition of shares of a Subsidiary PFIC, both as if such U.S. Holders directly held the shares of such Subsidiary PFIC. Accordingly, U.S. Holders should be aware that they could be subject to tax under the PFIC rules even if no distributions are received and no redemptions or other dispositions of Common Shares are made. In addition, U.S. Holders may be subject to U.S. federal income tax on any indirect gain realized on the stock of a Subsidiary PFIC on the sale or disposition of Common Shares.
Default PFIC Rules Under Section 1291 of the Code
If we are a PFIC, the U.S. federal income tax consequences to a U.S. Holder of the purchase of Common Shares and the acquisition, ownership, and disposition of Common Shares will depend on whether such U.S. Holder makes a “qualified electing fund” or “QEF” election under Section 1295 of the Code (a “QEF Election”) or makes a mark-to-market election under Section 1296 of the Code (a “Mark-to-Market Election”) with respect to the Common Shares. A U.S. Holder that does not make either a QEF Election or a Mark-to-Market Election (a “Non-Electing U.S. Holder”) will be subject to tax as described below.
A Non-Electing U.S. Holder will be subject to the rules of Section 1291 of the Code with respect to (a) any gain recognized on the sale or other taxable disposition of Common Shares and (b) any excess distribution received on the Common Shares. A distribution generally will be an “excess distribution” to the extent that such distribution (together with all other distributions received in the current tax year) exceeds 125% of the average distributions received during the three preceding tax years (or during a U.S. Holder’s holding period for the Common Shares, if shorter).
Under Section 1291 of the Code, any gain recognized on the sale or other taxable disposition of Common Shares of a PFIC (including an indirect disposition of shares of a Subsidiary PFIC), and any excess distribution received on such Common Shares (or a distribution by a Subsidiary PFIC to its shareholder that is deemed to be received by a U.S. Holder) must be ratably allocated to each day in a Non-Electing U.S. Holder’s holding period for the Common Shares. The amount of any such gain or excess distribution allocated to the tax year of disposition or distribution of the excess distribution and to years before the entity became a PFIC, if any, would be taxed as ordinary income (and not eligible for certain preferential tax rates, as discussed below). The amounts allocated to any other tax year would be subject to U.S. federal income tax at the highest tax rate applicable to ordinary income in each such year, and an interest charge would be imposed on the tax liability for each such year, calculated as if such tax liability had been due in each such year. A Non-Electing U.S. Holder that is not a corporation must treat any such interest paid as “personal interest,” which is not deductible.
If we are a PFIC for any tax year during which a Non-Electing U.S. Holder holds Common Shares, we will continue to be treated as a PFIC with respect to such Non-Electing U.S. Holder, regardless of whether we cease to be a PFIC in one or more subsequent tax years. If we cease to be a PFIC, a Non-Electing U.S. Holder may terminate this deemed PFIC status with respect to Common Shares by electing to recognize gain (which will be taxed under the rules of Section 1291 of the Code as discussed above) as if such Common Shares were sold on the last day of the last tax year for which we were a PFIC.
QEF Election
A U.S. Holder that makes a QEF Election for the first tax year in which its holding period of its Common Shares begins generally will not be subject to the rules of Section 1291 of the Code discussed above with respect to its Common Shares. However, a U.S. Holder that makes a QEF Election will be subject to U.S. federal income tax on such U.S. Holder’s pro rata share of (a) our net capital gain, which will be taxed as long-term capital gain to such U.S. Holder, and (b) our ordinary earnings, which will be taxed as ordinary income to such U.S. Holder. Generally, “net capital gain” is the excess of (a) net long-term capital gain over (b) net short-term capital loss, and “ordinary earnings” are the excess of (a) “earnings and profits” over (b) net capital gain. A U.S. Holder that makes a QEF Election will be subject to U.S. federal income tax on such amounts for each tax year in which we are a PFIC, regardless of whether such amounts are actually distributed to such U.S. Holder by us. However, for any tax year in which we are a PFIC and have no net income or gain, U.S. Holders that have made a QEF Election would not have any income inclusions as a result of the QEF Election. If a U.S. Holder that made a QEF Election has an income inclusion, such a U.S. Holder may, subject to certain limitations, elect to defer payment of current U.S. federal income tax on such amounts, subject to an interest charge. If such U.S. Holder is not a corporation, any such interest paid will be treated as “personal interest,” which is not deductible.
A U.S. Holder that makes a timely and effective QEF Election generally (a) may receive a tax-free distribution from us to the extent that such distribution represents “earnings and profits” that were previously included in income by the U.S. Holder because of such QEF Election and (b) will adjust such U.S. Holder’s tax basis in the Common Shares to reflect the amount included in income or allowed as a tax-free distribution because of such QEF Election. In addition, a U.S. Holder that makes a QEF Election generally will recognize capital gain or loss on the sale or other taxable disposition of Common Shares.
The procedure for making a QEF Election, and the U.S. federal income tax consequences of making a QEF Election, will depend on whether such QEF Election is timely. A QEF Election will be treated as “timely” for purposes of avoiding the default PFIC rules discussed above if such QEF Election is made for the first year in the U.S. Holder’s holding period for the Common Shares in which we were a PFIC. A U.S. Holder may make a timely QEF Election by filing the appropriate QEF Election documents at the time such U.S. Holder files a U.S. federal income tax return for such year. If a U.S. Holder owns PFIC stock indirectly through another PFIC, separate QEF Elections must be made for the PFIC in which the U.S. Holder is a direct shareholder and the Subsidiary PFIC for the QEF rules to apply to both PFICs.
A QEF Election will apply to the tax year for which such QEF Election is made and to all subsequent tax years, unless such QEF Election is invalidated or terminated or the IRS consents to revocation of such QEF Election. If a U.S. Holder makes a QEF Election and, in a subsequent tax year, we cease to be a PFIC, the QEF Election will remain in effect (although it will not be applicable) during those tax years in which we were not a PFIC. Accordingly, if we become a PFIC in another subsequent tax year, the QEF Election will be effective and the U.S. Holder will be subject to the QEF rules described above during any subsequent tax year in which we qualify as a PFIC.
U.S. Holders should be aware that there can be no assurances that we will satisfy the record keeping requirements that apply to a QEF, or that we will supply U.S. Holders with a PFIC Annual Information Statement or other information that such U.S. Holders are required to report under the QEF rules, in the event that we are a PFIC. Thus, U.S. Holders may not be able to make a QEF Election with respect to their Common Shares. Each U.S. Holder should consult its own tax advisors regarding the availability of, and procedure for making, a QEF Election.
A U.S. Holder makes a QEF Election by attaching a completed IRS Form 8621, including a PFIC Annual Information Statement, to a timely filed U.S. federal income tax return. However, if we do not provide the required information with regard to us or any Subsidiary PFICs, U.S. Holders will not be able to make a QEF Election for such entity and will continue to be subject to the rules of Section 1291 of the Code discussed above that apply to Non-Electing U.S. Holders with respect to the taxation of gains and excess distributions.
Mark-to-Market Election
A U.S. Holder may make a Mark-to-Market Election with respect to Common Shares only if the Common Shares are marketable stock. The Common Shares generally will be “marketable stock” if the Common Shares are regularly traded on (a) a national securities exchange that is registered with the SEC, (b) the national market system established pursuant to Section 11A of the U.S. Exchange Act or (c) a foreign securities exchange that is regulated or supervised by a governmental authority of the country in which the market is located, provided that (i) such foreign exchange has trading volume, listing, financial disclosure, and other requirements and the laws of the country in which such foreign exchange is located, together with the rules of such foreign exchange, ensure that such requirements are actually enforced and (ii) the rules of such foreign exchange ensure active trading of listed stocks. If such stock is traded on such a qualified exchange or other market, such stock generally will be considered “regularly traded” for any calendar year during which such stock is traded, other than in de minimis quantities, on at least 15 days during each calendar quarter. U.S. Holders should consult their own tax advisors regarding the marketable stock rules.
A U.S. Holder that makes a Mark-to-Market Election with respect to its Common Shares generally will not be subject to the rules of Section 1291 of the Code discussed above with respect to such Common Shares. However, if a U.S. Holder does not make a Mark-to-Market Election beginning in the first tax year of such U.S. Holder’s holding period for the Common Shares and such U.S. Holder has not made a timely QEF Election, the rules of Section 1291 of the Code discussed above will apply to certain dispositions of, and distributions on, the Common Shares.
A U.S. Holder that makes a timely and effective Mark-to-Market Election will include in ordinary income, for each tax year in which we are a PFIC, an amount equal to the excess, if any, of (a) the fair market value of the Common Shares, as of the close of such tax year over (b) such U.S. Holder’s tax basis in the Common Shares. A U.S. Holder that makes a Mark-to-Market Election will be allowed a deduction in an amount equal to the excess, if any, of (i) such U.S. Holder’s adjusted tax basis in the Common Shares, over (ii) the fair market value of such Common Shares (but only to the extent of the net amount of previously included income as a result of the Mark-to-Market Election for prior tax years).
A U.S. Holder that makes a timely and effective Mark-to-Market Election generally also will adjust such U.S. Holder’s tax basis in the Common Shares to reflect the amount included in gross income or allowed as a deduction because of such Mark-to-Market Election. In addition, upon a sale or other taxable disposition of Common Shares, a U.S. Holder that makes a Mark-to-Market Election will recognize ordinary income or ordinary loss (not to exceed the excess, if any, of (a) the amount included in ordinary income because of such Mark-to-Market Election for prior tax years over (b) the amount allowed as a deduction because of such Mark-to-Market Election for prior tax years).
A U.S. Holder makes a Mark-to-Market Election by attaching a completed IRS Form 8621 to a timely filed U.S. federal income tax return. A timely Mark-to-Market Election applies to the tax year in which such Mark-to-Market Election is made and to each subsequent tax year, unless the Common Shares cease to be “marketable stock” or the IRS consents to revocation of such election. Each U.S. Holder should consult its own tax advisor regarding the availability of, and procedure for making, a Mark-to-Market Election.
Although a U.S. Holder may be eligible to make a Mark-to-Market Election with respect to the Common Shares, no such election may be made with respect to the stock of any Subsidiary PFIC that a U.S. Holder is treated as owning because such stock is not marketable. Hence, the Mark-to- Market Election will not be effective to eliminate the interest charge and other income inclusion rules described above with respect to deemed dispositions of Subsidiary PFIC stock or distributions from a Subsidiary PFIC to its shareholder.
Other PFIC Rules
Under Section 1291(f) of the Code, the IRS has issued proposed Treasury Regulations that, subject to certain exceptions, would cause a U.S. Holder that had not made a timely QEF Election to recognize gain (but not loss) upon certain transfers of Common Shares that would otherwise be tax-deferred (e.g., gifts and exchanges pursuant to corporate reorganizations). However, the specific U.S. federal income tax consequences to a U.S. Holder may vary based on the manner in which Common Shares are transferred.
If finalized in their current form, the proposed Treasury Regulations applicable to PFICs would be effective for transactions occurring on or after April 1, 1992. Because the proposed Treasury Regulations have not yet been adopted in final form, they are not currently effective, and there is no assurance that they will be adopted in the form and with the effective date proposed. Nevertheless, the IRS has announced that, in the absence of final Treasury Regulations, taxpayers may apply reasonable interpretations of the Code provisions applicable to PFICs and that it considers the rules set forth in the proposed Treasury Regulations to be reasonable interpretations of those Code provisions. The PFIC rules are complex, and the implementation of certain aspects of the PFIC rules requires the issuance of Treasury Regulations which in many instances have not been promulgated and which, when promulgated, may have retroactive effect. U.S. Holders should consult their own tax advisors about the potential applicability of the proposed Treasury Regulations.
Certain additional adverse rules will apply with respect to a U.S. Holder if we are a PFIC, regardless of whether such U.S. Holder makes a QEF Election. For example under Section 1298(b)(6) of the Code, a U.S. Holder that uses Common Shares as security for a loan will, except as may be provided in Treasury Regulations, be treated as having made a taxable disposition of such Common Shares.
In addition, a U.S. Holder who acquires Common Shares from a decedent will not receive a “step up” in tax basis of such Common Shares to fair market value.
Special rules also apply to the amount of foreign tax credit that a U.S. Holder may claim on a distribution from a PFIC. Subject to such special rules, foreign taxes paid with respect to any distribution in respect of stock in a PFIC are generally eligible for the foreign tax credit. The rules relating to distributions by a PFIC and their eligibility for the foreign tax credit are complicated, and a U.S. Holder should consult with their own tax advisor regarding the availability of the foreign tax credit with respect to distributions by a PFIC.
The PFIC rules are complex, and each U.S. Holder should consult its own tax advisor regarding the PFIC rules (including the applicability and advisability of a QEF Election and Mark-to-Market Election) and how the PFIC rules may affect the U.S. federal income tax consequences of the acquisition, ownership, and disposition of Common Shares.
General Rules Applicable to the Acquisition, Ownership, and Disposition of Common Shares
The following discussion describes the general rules applicable to the ownership and disposition of the Common Shares but is subject in its entirety to the special rules described above under the heading “Passive Foreign Investment Company Rules.”
Distributions on Common Shares
We do not expect to pay dividends with respect to the Common Shares in the foreseeable future. A U.S. Holder that receives a distribution, including a constructive distribution, with respect to a Common share will be required to include the amount of such distribution in gross income as a dividend (without reduction for any Canadian income tax withheld from such distribution) to the extent of our current and accumulated “earnings and profits”, as computed under U.S. federal income tax principles. A dividend generally will be taxed to a U.S. Holder at ordinary income tax rates when we are a PFIC for the tax year of such distribution or the preceding tax year. To the extent that a distribution exceeds our current and accumulated “earnings and profits”, such distribution will be treated first as a tax-free return of capital to the extent of a U.S. Holder’s tax basis in the Common Shares and thereafter as gain from the sale or exchange of such Common Shares (refer to the “Sale or Other Taxable Disposition of Common Shares” section below). However, we may not maintain the calculations of earnings and profits in accordance with U.S. federal income tax principles, and each U.S. Holder may be required to assume that any distribution by us with respect to the Common Shares will constitute ordinary dividend income. Dividends received on Common Shares generally will not be eligible for the “dividends received deduction” generally applicable to corporations. Subject to applicable limitations and provided we are eligible for the benefits of the Canada-U.S. Tax Convention, or the Common Shares are readily tradable on a United States securities market, dividends paid by us to non-corporate U.S. Holders, including individuals, generally will be eligible for the preferential tax rates applicable to long-term capital gains for dividends, provided certain holding period and other conditions are satisfied, including that we not be classified as a PFIC in the tax year of distribution or in the preceding tax year. The dividend rules are complex, and each U.S. Holder should consult its own tax advisor regarding the application of such rules.
Sale or Other Taxable Disposition of Common Shares
Upon the sale or other taxable disposition of Common Shares, a U.S. Holder generally will recognize capital gain or loss in an amount equal to the difference between (a) the amount of cash plus the fair market value of any property received and (b) such U.S. Holder’s tax basis in such Common Shares sold or otherwise disposed of. Gain or loss recognized on such sale or other taxable disposition generally will be long-term capital gain or loss if, at the time of the sale or other taxable disposition, the Common Shares have been held for more than one year. Preferential tax rates may apply to long-term capital gain of a U.S. Holder that is an individual, estate, or trust. There are no preferential tax rates for long-term capital gain of a U.S. Holder that is a corporation. Deductions for capital losses are subject to significant limitations under the Code.
Additional Tax Considerations
Receipt of Foreign Currency
The amount of any distribution paid to a U.S. Holder in foreign currency or on the sale, exchange or other taxable disposition of Common Shares generally will be equal to the U.S. dollar value of such foreign currency based on the exchange rate applicable on the date of receipt (regardless of whether such foreign currency is converted into U.S. dollars at that time). If the foreign currency received is not converted into U.S. dollars on the date of receipt, a U.S. Holder will have a tax basis in the foreign currency equal to its U.S. dollar value on the date of receipt. Any U.S. Holder who receives payment in foreign currency and engages in a subsequent conversion or other disposition of the foreign currency may have a foreign currency exchange gain or loss that would be treated as ordinary income or loss, and generally will be U.S. source income or loss for foreign tax credit purposes. Different rules apply to U.S. Holders who use the accrual method of tax accounting. Each U.S. Holder should consult its own U.S. tax advisor regarding the U.S. federal income tax consequences of receiving, owning, and disposing of foreign currency.
Foreign Tax Credit
Dividends paid on the Common Shares will be treated as foreign-source income, and generally will be treated as “passive category income” or “general category income” for U.S. foreign tax credit purposes. Any gain or loss recognized on a sale or other disposition of Common Shares generally will be United States source gain or loss. Certain U.S. Holders that are eligible for the benefits of Canada-U.S. Tax Convention may elect to treat such gain or loss as Canadian source gain or loss for U.S. foreign tax credit purposes. The Code applies various complex limitations on the amount of foreign taxes that may be claimed as a credit by U.S. taxpayers. In addition, Treasury Regulations that apply to taxes paid or accrued (the “Foreign Tax Credit Regulations”) impose additional requirements for Canadian withholding taxes to be eligible for a foreign tax credit, and there can be no assurance that those requirements will be satisfied. The Treasury Department has recently released guidance temporarily pausing the application of certain of the Foreign Tax Credit Regulations.
Subject to the PFIC rules and the Foreign Tax Credit Regulations discussed above, a U.S. Holder that pays (whether directly or through withholding) Canadian income tax with respect to dividends paid on the Common Shares generally will be entitled, at the election of such U.S. Holder, to receive either a deduction or a credit for such Canadian income tax paid. Generally, a credit will reduce a U.S. Holder’s U.S. federal income tax liability on a dollar-for-dollar basis, whereas a deduction will reduce a U.S. Holder’s income subject to U.S. federal income tax. This election is made on a year-by-year basis and applies to all foreign taxes paid or accrued (whether directly or through withholding) by a U.S. Holder during a year. The foreign tax credit rules are complex and involve the application of rules that depend on a U.S. Holder’s particular circumstances. Accordingly, each U.S. Holder should consult its own tax advisor regarding the foreign tax credit rules.
Information Reporting; Backup Withholding Tax
Under U.S. federal income tax laws certain categories of U.S. Holders must file information returns with respect to their investment in, or involvement in, a foreign corporation. For example, U.S. return disclosure obligations (and related penalties) are imposed on U.S. Holders that hold certain specified foreign financial assets in excess of certain threshold amounts. The definition of specified foreign financial assets includes not only financial accounts maintained in foreign financial institutions, but also, unless held in accounts maintained by a financial institution, any stock or security issued by a non-U.S. person. U. S. Holders may be subject to these reporting requirements unless their Common Shares are held in an account at certain financial institutions. Penalties for failure to file certain of these information returns are substantial. U.S. Holders should consult their own tax advisors regarding the requirements of filing information returns, including the requirement to file IRS Form 8938.
Payments made within the U.S., or by a U.S. payor or U.S. middleman, of dividends on, and proceeds arising from the sale or other taxable disposition of the Common Shares generally may be subject to information reporting and backup withholding tax, currently at the rate of 24%, if a U.S. Holder (a) fails to furnish its correct U.S. taxpayer identification number (generally on Form W-9), (b) furnishes an incorrect U.S. taxpayer identification number, (c) is notified by the IRS that such U.S. Holder has previously failed to properly report items subject to backup withholding tax, or (d) fails to certify, under penalty of perjury, that it has furnished its correct U.S. taxpayer identification number and that the IRS has not notified such U.S. Holder that it is subject to backup withholding tax. However, certain exempt persons, such as U.S. Holders that are corporations, generally are excluded from these information reporting and backup withholding tax rules. Any amounts withheld under the U.S. backup withholding tax rules will be allowed as a credit against a U.S. Holder’s U.S. federal income tax liability, if any, or will be refunded, if such U.S. Holder furnishes required information to the IRS in a timely manner.
The discussion of reporting requirements set forth above is not intended to constitute a complete description of all reporting requirements that may apply to a U.S. Holder. A failure to satisfy certain reporting requirements may result in an extension of the time period during which the IRS can assess a tax and, under certain circumstances, such an extension may apply to assessments of amounts unrelated to any unsatisfied reporting requirement. Each U.S. Holder should consult its own tax advisors regarding the information reporting and backup withholding rules.
THE ABOVE SUMMARY IS NOT INTENDED TO CONSTITUTE A COMPLETE ANALYSIS OF ALL TAX CONSIDERATIONS APPLICABLE TO U.S. HOLDERS WITH RESPECT TO THE ACQUISITION, OWNERSHIP, AND DISPOSITION OF COMMON SHARES. U.S. HOLDERS SHOULD CONSULT THEIR OWN TAX ADVISORS AS TO THE TAX CONSIDERATIONS APPLICABLE TO THEM IN THEIR OWN PARTICULAR CIRCUMSTANCES.
Certain Canadian Federal Income Tax Considerations for United States Residents
The following is a summary of certain Canadian federal income tax considerations generally applicable to the holding and disposition of our securities acquired by a holder who, at all relevant times, (a) for the purposes of the Income Tax Act (Canada) (the “Tax Act”) (i) is not resident, or deemed to be resident, in Canada, (ii) deals at arm’s length with us and underwriters that we have recently used, and is not affiliated with us or the underwriters that we have recently used, (iii) holds our common shares as capital property, (iv) does not use or hold the common shares in the course of carrying on, or otherwise in connection with, a business carried on or deemed to be carried on in Canada and (v) is not a “registered non-resident insurer” or “authorized foreign bank” (each as defined in the Tax Act), or other holder of special status, and (b) for the purposes of the Canada-U.S. Tax Convention (the “Tax Treaty”), is a resident of the United States, has never been a resident of Canada, does not have and has not had, at any time, a permanent establishment or fixed base in Canada, and who otherwise qualifies for the full benefits of the Tax Treaty. Holders who meet all the criteria in clauses (a) and (b) above are referred to herein as “U.S. Holders”, and this summary only addresses such U.S. Holders.
This summary does not deal with special situations, such as the particular circumstances of traders or dealers, tax exempt entities, insurers or financial institutions, or other holders of special status or in special circumstances. Such holders, and all other holders who do not meet the criteria in clauses (a) and (b) above, should consult their own tax advisors.
This summary is based on the current provisions of the Tax Act, the regulations thereunder in force at the date hereof (the “Regulations”), the current provisions of the Tax Treaty, and our understanding of the administrative and assessing practices of the Canada Revenue Agency published in writing prior to the date hereof. This summary takes into account all specific proposals to amend the Tax Act and Regulations publicly announced by or on behalf of the Minister of Finance (Canada) prior to the date hereof (the “Proposed Amendments”) and assumes that such Proposed Amendments will be enacted in the form proposed. However, such Proposed Amendments might not be enacted in the form proposed, or at all. This summary does not otherwise take into account or anticipate any changes in law or administrative or assessing practices, whether by legislative, governmental or judicial decision or action, nor does it take into account tax laws of any province or territory of Canada or of any other jurisdiction outside Canada, which may differ significantly from those discussed in this summary.
For the purposes of the Tax Act, all amounts relating to the acquisition, holding or disposition of our securities must generally be expressed in Canadian dollars. Amounts denominated in United States currency generally must be converted into Canadian dollars using the rate of exchange that is acceptable to the Canada Revenue Agency.
This summary is of a general nature only and is not intended to be, nor should it be construed to be, legal or tax advice to any particular U.S. Holder, and no representation with respect to the Canadian federal income tax consequences to any particular U.S. Holder or prospective U.S. Holder is made. This summary is not exhaustive of all Canadian federal income tax considerations. Accordingly, all prospective purchasers (including U.S. Holders as defined above) should consult with their own tax advisors for advice with respect to their own particular circumstances.
Withholding Tax on Dividends
Amounts paid or credited or deemed to be paid or credited as, on account or in lieu of payment of, or in satisfaction of, dividends on our common shares to a U.S. Holder will be subject to Canadian withholding tax. Under the Tax Treaty, the rate of Canadian withholding tax on dividends paid or credited by us to a U.S. Holder that beneficially owns such dividends and substantiates eligibility for the benefits of the Tax Treaty is generally 15% (unless the beneficial owner is a company that owns at least 10% of our voting stock at that time, in which case the rate of Canadian withholding tax is generally reduced to 5%)
Dispositions
A U.S. Holder will not be subject to tax under the Tax Act on a capital gain realized on a disposition or deemed disposition of a security, unless the security is “taxable Canadian property” to the U.S. Holder for purposes of the Tax Act and the U.S. Holder is not entitled to relief under the Tax Treaty.
Generally, the common shares will not constitute “taxable Canadian property” to a U.S. Holder at a particular time unless, at any time during the 60 month period immediately preceding the disposition, more than 50% of the fair market value of such security was derived, directly or indirectly, from one or any combination of: (i) real or immovable property situated in Canada, (ii) “Canadian resource properties” (as defined in the Tax Act), (iii) “timber resource properties” (as defined in the Tax Act), and (iv) options in respect of, or interests in, or for civil law rights in, property described in any of the foregoing whether or not the property exists. Notwithstanding the foregoing, in certain other circumstances set out in the Tax Act, common shares could also be deemed to be “taxable Canadian property”.
Provided that the common shares are listed on a “designated stock exchange” as defined in the Tax Act (which includes the TSXV) at the time of disposition, the common shares generally will not constitute “taxable Canadian property” of a U.S. Holder at that time unless, at any time during the 60 month period immediately preceding the disposition, the following two conditions are met concurrently: (i) the U.S. Holder, persons with whom the U.S. Holder did not deal at arm’s length, partnerships in which the U.S. Holder or such non-arm’s length person holds a membership interest (either directly or indirectly through one or more partnerships), or the U.S. Holder together with all such persons, owned 25% or more of the issued shares of any class or series of shares of our company; and (ii) more than 50% of the fair market value of the shares of the company was derived directly or indirectly from one or any combination of real or immovable property situated in Canada, Canadian resource properties (as defined in the Tax Act), timber resource properties (as defined in the Tax Act) or options in respect of, or interests in, or for civil law rights in, property described in any of the foregoing whether or not the property exists. Notwithstanding the foregoing, in certain other circumstances set out in the Tax Act, common shares could also be deemed to be “taxable Canadian property”.
U.S. Holders who may hold common shares as “taxable Canadian property” should consult their own tax advisors with respect to the application of Canadian capital gains taxation, any potential relief under the Tax Treaty, and special compliance procedures under the Tax Act, none of which is described in this summary.
| Dividends and paying agents |
Not applicable
| Statement by experts |
Not applicable
| Documents on Display |
The Company is subject to the informational requirements of the Securities Exchange Act of 1934, as amended, and files reports and other information with the SEC. You may read and copy any of our reports and other information at, and obtain copies upon payment of prescribed fees from, the Public Reference Room maintained by the SEC at 100 F Street, N.E., 450 Fifth Street, N.W., Room 1024, Washington, DC 20549. In addition, the SEC maintains a web site that contains reports and other information regarding registrants that file electronically with the SEC at http://www.sec.gov. The public may obtain information on the operation of the Public Reference Room by calling the SEC at 1-800-SEC-0330.
The documents concerning our Company referred to in this Annual Report may be viewed at our principal executive offices, 401 Bay Street, 16th Floor, Toronto, ON M5H 2Y4, during normal business hours. Copies of our financial statements and other continuous disclosure documents required under the Securities Act (British Columbia) are available for viewing on SEDAR+ at www.sedarplus.com.
| Subsidiary Information |
See Item 4.C, “Organizational Structure”, for the Company’s material subsidiaries as at the date of this Annual Report.
| Annual Report to Security Holders |
Under continuous disclosure requirements under Canadian securities laws, the Company is required to file annually on SEDAR+ within 90 days following the end of each fiscal year, the following annual continuous disclosure filings (together, the “Annual Filings”):
| (i) |
Management’s Discussion and Analysis in respect of such fiscal year on Form 51-102F1 (the “Annual MD&A”), |
| (ii) |
the audited annual financial statements (the “Annual Financial Statements”) prescribed by Section 4.1 of National Instrument 51-102 – Continuous Disclosure Obligations (as adopted by the Canadian Securities Administrators), |
| (iii) |
an annual information form on Form 51-102F2 (the “AIF”), and |
| (iv) |
officer certifications on Form 52-109F1 executed by, respectively, our Chief Executive Officer and our Chief Financial Officer. |
The Company will file a 6-K that includes the Annual Filings for the year ended December 31, 2024 in accordance with the EDGAR Filer Manual.
Item 11 — Quantitative and Qualitative Disclosures About Market Risk
The Company’s financial instruments as at December 31, 2024, consisted of cash, marketable securities, accounts receivable, other investments, deposits, and accounts payable and accrued liabilities. The Company’s financial instruments measured at fair value on a recurring basis were the Company’s marketable securities which were classified as Level 1, and other investments which were classified as Level 3. There were no financial assets or financial liabilities measured and recognized in the consolidated statements of financial position at fair value that would be categorized as level 2 in the fair value hierarchy.
The Company’s financial instruments are exposed to liquidity risk, credit risk and market risks, which include currency risk, interest rate risk and price risk. Details of the primary financial risks that the Company is exposed to are available in the notes to the Company’s consolidated financial statements for the year ended December 31, 2024.
Liquidity risk
Liquidity risk is the risk that the Company will encounter difficulty in meeting obligations associated with financial liabilities. The Company proactively manages its capital resources and has in place a budgeting and cash management process to help determine the funds required to ensure the Company has the appropriate liquidity to meet its current exploration plans and achieve its growth objectives. The Company ensures that there is sufficient liquidity available to meet its short-term business requirements, taking into account its anticipated cash outflows from exploration activities, and its holdings of cash and marketable securities. The Company monitors and adjusts, when required, these exploration programs as well as corporate administrative costs to ensure that adequate levels of working capital are maintained.
As at December 31, 2024, the Company had unrestricted cash of $4,912 (December 31, 2023 – $7,313), working capital surplus of $8,045 (December 31, 2023 – $7,713), which the Company defines as current assets less current liabilities, and an accumulated deficit of $257,192 (December 31, 2023 – $149,054). During the year ended December 31, 2024, Fury Gold incurred a comprehensive loss of $108,141 (December 31, 2023 – $17,219, December 31, 2022 – income of $24,905). The Company expects to incur future operating losses in relation to exploration activities. With no source of operating cash flow, there is no assurance that sufficient funding will be available to conduct further exploration of its mineral properties.
The Company’s contractual obligations are as follows:
| Within 1 year |
2 to 3 years |
Over 3 years |
At December 31 2024 |
|||||||||||||
| Accounts payable and accrued liabilities |
$ | 855 | $ | - | $ | - | $ | 855 | ||||||||
| Quebec flow-through expenditure requirements |
944 | - | - | 944 | ||||||||||||
| Undiscounted lease payments |
65 | - | - | 65 | ||||||||||||
| Total |
$ | 1,864 | $ | - | $ | - | $ | 1,864 | ||||||||
The Company also makes certain payments arising on mineral claims and leases on an annual or bi-annual basis to ensure all the Company’s properties remain in good standing. Cash payments of $212 were made during the year ended December 31, 2024, in respect of these mineral claims (December 31, 2023 - $298, December 31, 2022 - $215), with $27 recognized in prepaid expenses as at December 31, 2024 (December 31, 2023 – $78, December 31, 2022 - $78).
Credit risk
The Company’s cash and accounts receivables are exposed to credit risk, which is the risk that the counterparties to the Company’s financial instruments will cause a loss to the Company by failing to pay their obligations. The amount of credit risk to which the Company is exposed is considered insignificant as the Company’s cash is held with highly rated financial institutions in interest-bearing accounts and the accounts receivable primarily consist of sales tax receivables and a receivable from a reputable supplier of services in Canada.
Market risk
This is the risk that the fair value or future cash flows of a financial instrument will fluctuate because of changes in market prices. Significant market risks to which the Company is exposed are as follows:
| i. |
Currency risk |
The Company is exposed to currency risk by having balances and transactions in currencies that are different from the relevant functional currency (the Canadian dollar). The Company’s foreign currency exposure related to its financial assets and liabilities held in US dollars was as follows:
| Years ended December 31 |
||||||||||||
| 2024 |
2023 |
2022 |
||||||||||
| Financial assets |
||||||||||||
| US$ bank accounts |
$ | 1 | $ | 1 | $ | 1 | ||||||
| Financial liabilities |
||||||||||||
| Accounts payable |
- | (7 | ) | (61 | ) | |||||||
| $ | 1 | $ | (6 | ) | $ | (60 | ) | |||||
A 10% increase or decrease in the US dollar to Canadian dollar exchange rate would not have a material impact on the Company’s net loss.
| ii. |
Price risk |
The Company holds certain investments in marketable securities which are measured at fair value, being the closing share price of each equity security at the date of the consolidated statements of financial position. The Company is exposed to changes in share prices which would result in gains and losses being recognized in the loss for the year. A 10% increase or decrease in the Company’s marketable securities’ share prices would not have a material impact on the Company’s net loss.
Item 12 — Description of Securities Other than Equity Securities
Not applicable
Item 13 — Defaults, Dividend Arrearages, and Delinquencies
There has not been a material default in the payment of principal, interest, a sinking or purchase fund installment, or any other material default not cured within thirty days, relating to indebtedness of the Company or any of its significant subsidiaries. There are no payments of dividends by the Company in arrears, nor has there been any other material delinquency relating to any class of preference shares of the Company.
Item 14 — Material Modifications to the Rights of Security Holders and Use of Proceeds
Not applicable
Item 15 — Controls and Procedures
| Disclosure Controls and Procedures |
Disclosure controls and procedures (“DC&P”) are defined in Rule 13a-15(e) and 15d-15(e) under the Exchange Act to mean controls and other procedures of an issuer that are designed to ensure that information required to be disclosed by the issuer in the reports that it files or submits under the Exchange Act is recorded, processed, summarized, and reported, within the time periods specified in the SEC’s rules and forms. Disclosure controls and procedures include, without limitation, controls and procedures designed to ensure that information required to be disclosed by an issuer in the reports that it files or submits under the Exchange Act is accumulated and communicated to the issuer’s management, including principal executive and principal financial officers, or persons performing similar functions, as appropriate to allow timely decisions regarding required disclosure.
As of December 31, 2024, an evaluation was carried out under the supervision of, and with the participation of, the Company's management, including the CEO and CFO, of the effectiveness of the Company's DC&P. Based on that evaluation, the CEO and CFO concluded that such DC&P were not effective at the reasonable assurance level as of December 31, 2024, due to the material weakness in our internal control over financial reporting as described below.
| Management’s annual report on internal control over financial reporting |
Internal control over financial reporting (“ICFR”)
Internal control over financial reporting includes those policies and procedures that:
| o |
pertain to the maintenance of records that in reasonable detail accurately and fairly reflect the transactions and dispositions of the assets of the Company; |
| o | provide reasonable assurance that transactions are recorded as necessary to permit preparation of consolidated financial statements in accordance with IFRS Accounting Standards as issued by the IASB, and that receipts and expenditures of the Company are being made only in accordance with authorizations of management and directors of the Company; and |
| o | provide reasonable assurance regarding prevention or timely detection of unauthorized acquisition, use, or disposition of the Company assets, or incurring liabilities or other obligations that could have a material effect on the consolidated financial statements. |
It is management’s responsibility to establish and maintain adequate ICFR to provide reasonable assurance regarding the reliability of financial reporting and the preparation of consolidated financial statements for external purposes in accordance with IFRS Accounting Standards as issued by the IASB.
Management evaluated the design and operating effectiveness of the Company’s internal control over financial reporting based on the criteria established in the Internal Control - Integrated Framework (2013) issued by the Committee of Sponsoring Organizations of the Treadway Commission. Based on that evaluation, the CEO and CFO concluded that such ICFR were not effective at the reasonable assurance level as of December 31, 2024.
Material Weakness in Internal Control Over Financial Reporting
A material weakness is a deficiency, or combination of deficiencies, in internal control over financial reporting, such that there is a reasonable possibility that a material misstatement of the annual or interim financial statements will not be prevented or detected on a timely basis.
In the fourth quarter of 2024, management determined that we had a material weakness in our internal control over financial reporting and disclosure controls and procedures related to the review of complex accounting transactions outside of the normal course of the Company’s operations. Specifically, we did not design and maintain controls to timely analyze and account for dilution gains or losses resulting from changes in ownership in associates accounted for using the equity method.
This control deficiency resulted in a misstatement of gain on investments and investments in associates relating to the Company’s investment in Dolly Varden, specifically an understatement of dilution gain on the consolidated statement of (earnings) loss and comprehensive (income) loss, as well as an understatement of our investment in associate balance on the statement of financial position, which management corrected via revision discussed above inSection 5 under “Revision of Prior Period Interim Financial Statements”.
Remediation Plan for the Material Weakness
We continue to be focused on designing and implementing effective internal controls to improve our internal control over financial reporting and remediate the material weakness. Our efforts include:
| o |
We are in the process of designing and implementing controls related to the review of complex accounting transactions outside of the normal course of the Company’s operations. Specifically, design and maintain controls to timely analyze and account for dilution gains or losses resulting from changes in ownership in associates accounted for using the equity method. |
| o |
Hiring a third-party specialist to assist with the design of these controls. |
The process of designing and maintaining effective internal control over financial reporting is a continuous effort that requires management to anticipate and react to changes in our business, economic and regulatory environments and to expend significant resources. As we continue to evaluate our internal control over financial reporting, we may take additional actions to remediate the material weakness or modify the remediation actions described above.
While we continue to devote significant time and attention to these remediation efforts, the material weakness will not be considered remediated until management completes the design and implementation of the actions described above and the controls operate for a sufficient period of time, and management has concluded, through testing, that these controls are effective.
| Attestation report of the registered public accounting firm |
The Company has concluded that, as at June 30, 2024, the Company did not qualify as either an “accelerated filer” or a “large accelerated filer”, as these terms are defined under the Exchange Act. Accordingly, the Company qualifies as a “non-accelerated filer” under the Exchange Act and, as such, management’s report on the effectiveness of the Company’s ICFR is not subject to attestation by the Company’s registered public accounting firm. Accordingly, this Annual report does not include an attestation report of the Company’s registered public accounting firm regarding internal control over financial reporting.
| Changes in internal control over financial reporting |
Other than with respect to the material weakness and remediation efforts described in “Material Weakness in Internal Control over Financial Reporting” and “Remediation Plan for the Material Weakness” above, there were no changes in our internal control over financial reporting during the year ended December 31, 2024, that has materially affected, or is reasonably likely to materially affect, our internal control over financial reporting.
Item 16A — Audit committee financial expert
The current members of the Audit Committee are Steve Cook (Chairperson), Brian Christie, and Michael Hoffman. All current members of the Audit Committee are considered financially literate, and all are independent as such terms are defined under the NYSE American Company Guide.
The Company’s Board of Directors has determined that Steve Cook, the Chair of the Audit Committee of the Board, is an audit committee financial expert (as that term is defined in Item 407 of Regulation S-K under the Exchange Act and Form 20-F) and is an independent director under applicable laws and regulations and the requirements of the NYSE American.
The Company's board of directors has adopted a Code of Business Conduct and Ethics governing directors, officers, employees and contractors. The purpose of the Code of Business Conduct and Ethics is to deter wrongdoing and promote:
| ● |
honest and ethical conduct, including the ethical handling of actual or apparent conflicts of interest between personal and professional relationships; |
| ● |
avoidance of conflicts of interest, including disclosure to an appropriate person of any material transaction or relationship that reasonably could be expected to give rise to such a conflict; |
| ● |
full, fair, accurate, timely and understandable disclosure in reports and documents that Company files with, or submits to, the securities regulators and in other public communications made by Company; |
| ● |
compliance with applicable governmental laws, rules and regulations; |
| ● |
the prompt internal reporting to an appropriate person of violations of the Code of Business Conduct and Ethics; |
| ● |
accountability for adherence to the Code of Business Conduct and Ethics; |
| ● |
guidance to employees, contractors, officers and directors to help them recognize and deal with ethical issues; provide mechanisms to report unethical conduct; and |
| ● |
the Company’s culture of honesty and accountability. |
The Code of Business Conduct and Ethics is available on the Company’s website at https://furygoldmines.com/about-us/governance/
During the most recently completed fiscal year, the Company has neither: (a) materially amended its Code of Ethics; nor (b) granted any waiver (including any implicit waiver) form any provision of its Code of Ethics.
Item 16C — Principal Accountant Fees and Services
The following table sets forth information regarding the amount billed and accrued to us by Deloitte LLP (PCAOB ID No. 1208) for the fiscal years ended December 31, 2024 and 2023:
| Nature of Services |
December 31, 2024 |
December 31, 2023 |
||||||
| Audit Fees(1) |
$ | 523,364 | $ | 425,521 | ||||
| Audit-Related Fees(2) |
Nil |
Nil |
||||||
| Tax Fees |
Nil |
Nil |
||||||
| All Other Fees |
Nil |
Nil |
||||||
| Total |
$ | 523,364 | $ | 425,521 | ||||
Notes:
| (1) |
“Audit Fees” include fees necessary to perform the annual audit and quarterly reviews of the Company’s consolidated financial statements. Audit Fees also include audit or other attest services required by legislation or regulation, such as comfort letters, consents, reviews of securities filings and statutory audits. In 2023 and 2024, the Audit Fees included fees incurred in connection with certain securities filings. |
| (2) |
“Audit-Related Fees” include services that are traditionally performed by the auditor. These audit-related services include employee benefit audits, due diligence assistance, accounting consultations on proposed transactions, internal control reviews and audit or attest services not required by legislation or regulation. |
Item 16D — Exemptions from the Listing Standards for Audit Committees.
Not applicable
Item 16E — Purchases of Equity Securities by the Issuer and Affiliated Purchasers.
Not applicable
Item 16F — Change in Registrant’s Certifying Accountant
Not applicable
Item 16G — Corporate Governance
The Company’s common shares are listed in the United States on the NYSE American stock exchange ("NYSE American"). The Company is considered a “foreign issuer” under the NYSE American Company Guide as it is incorporated under the laws of the Province of British Columbia. Section 110 of the NYSE American Company Guide permits NYSE American to consider the laws, customs and practices of foreign issuers in relaxing certain NYSE American listing criteria, and to grant exemptions from NYSE American listing criteria based on these considerations. The Company’s governance practices differ from those followed by U.S. domestic companies pursuant to NYSE American listing standards in the following manner:
| ● |
Quorum Requirements: Section 123 of the NYSE American Company Guide requires that the quorum for meetings of shareholders of a listed company be not less than 33-1/3% of the issued and outstanding shares entitled to vote at a meeting of shareholders. The Company’s quorum requirement is specified in its Articles as two shareholders, present in person or represented by proxy, who hold at least 25% of the issued shares entitled to be voted at each meeting of the shareholders of the Company. Accordingly, the Company does not satisfy the requirement of Section 123 of the NYSE American Company Guide that it have a quorum of not less than 33 1/3% of its outstanding shares. |
| ● |
Solicitation of Proxies: NYSE American requires the solicitation of proxies and delivery of proxy statements for all shareholder meetings, and requires that these proxies shall be solicited pursuant to a proxy statement that conforms to applicable SEC proxy rules. The Company is a foreign private issuer as defined in Rule 3b-4 under the the Securities Exchange Act of 1934, as amended (the “Exchange Act”), and the equity securities of the Company are accordingly exempt from the proxy rules set forth in Sections 14(a), 14(b), 14(c) and 14(f) of the Exchange Act. The Company solicits proxies in accordance with applicable rules and regulations in Canada. |
| ● |
Shareholders Approval for Dilutive Private Placement Financings: Section 713 of the NYSE American Company Guide requires that the Company obtain the approval of its shareholders for share issuances equal to 20 percent or more pre-issuance outstanding shares for a price which is less than the greater of book or market value of the shares. There is no such requirement for shareholder approval under British Columbia law or under the Toronto Stock Exchange, the Company’s home country stock exchange. However, the rules of the Toronto Stock Exchange will require shareholder approval for (i) share issuances that materially affect control of the Company, and (ii) share issuances in connection with private placement or acquisition transactions where the number of shares to be issued exceeds 25% of the pre-issuance outstanding shares of the Company, on a non-diluted basis. The Company anticipates that it would seek a waiver from NYSE American’s section 713 requirements should a proposed share issuance trigger the NYSE American shareholders’ approval requirement in circumstances where the same financing does not trigger such a shareholder approval requirement under British Columbia law or under the rules of the Toronto Stock Exchange. |
The foregoing are consistent with the laws, customs and practices in Canada.
Item 16H — Mine Safety Disclosure
Not applicable
Item 16I. Disclosure Regarding Foreign Jurisdictions that Prevent Inspections
Not applicable
Item 16J. Insider Trading Policy
The Company’s Board of Directors adopted an Insiders Trading policy on April 16, 2021 of which a copy is available on the Company’s website at https://furygoldmines.com/about-us/governance/.
We are in the process of establishing policies and processes for assessing, identifying, and managing material risks from cybersecurity threats, and plan to integrate these processes into our overall risk management systems and processes. We plan to assess material risks from cybersecurity threats, including any potential unauthorized occurrence on or conducted through our information systems that may result in adverse effects on the confidentiality, integrity, or availability of our information systems or any information residing therein.
We have engaged third-party IT consultants to complete a cybersecurity audit of the Company’s IT infrastructure and systems in past years. We plan to continue conducting annual risk assessments to identify cybersecurity threats, as well as assessments in the event of a material change in our business practices that may affect information systems and our broader enterprise IT environment. These risk assessments include identification of reasonably foreseeable internal and external risks, the likelihood and potential damage that could result from such risks, and the sufficiency of existing policies, procedures, systems, and safeguards in place to manage such risks.
Following these risk assessments, we plan to design, implement, and maintain reasonable safeguards to minimize identified risks; reasonably address any identified gaps in existing safeguards; and regularly monitor the effectiveness of our safeguards.
Our overall risk management system plans to include:
| ● |
policies, standards and processes based upon National Institute of Standards and Technology (“NIST”), the International Organization for Standardization and other applicable industry standards; |
| ● |
regular assessments and deployment technical safeguards to improve the protection of our information systems; |
| ● |
the use of external service providers, where appropriate, to assess, test or otherwise assist with aspects of our security controls; |
| ● |
cybersecurity awareness training of our employees, incident response personnel, and senior management; and |
| ● |
a cybersecurity incident response plan that includes procedures for responding to cybersecurity incidents. |
We continue to make investments to enhance the protection of our information technology systems and our business from cybersecurity incidents The Company’s Annual Consolidated Financial Statements appear on pages F1-F39 of this Annual Report and are incorporated herein by reference.
Item 17 — Financial Statements
See Item 18
Item 18 — Financial Statements
Our audited financial statements as prepared by our management and approved by the Board of Directors include:
| ● |
Consolidated Financial Statements for the Years Ended December 31, 2024, 2023 and 2022 |
| ● |
Independent Auditors’ Report |
| ● |
Consolidated Statements of Financial Position |
| ● |
Consolidated Statements of (Earnings) Loss and Comprehensive (Income) Loss |
| ● |
Consolidated Statements of Cash Flows |
| ● |
Consolidated Statements of Changes in Shareholders’ Equity |
| ● |
Notes to the Consolidated Financial Statements |
| A. |
Financial Statements |
The financial statements and the notes thereto as required under Item 18 are attached hereto and found immediately following the text of this Annual Report:
| Description | Page |
| Annual Consolidated Financial Statements of the Company | F1 - F36 |
| Annual Consolidated Financial Statements of Dolly Varden | F39 - F61 |
| B. |
Index to Exhibits |
| Exhibit No. |
Name |
| Certification of Chief Executive Officer pursuant to Section 302 of the Sarbanes-Oxley Act of 2002 |
|
| Certification of Chief Financial Officer pursuant to Section 302 of the Sarbanes-Oxley Act of 2002 |
|
| Certification of Chief Executive Officer pursuant to Section 906 of the Sarbanes-Oxley Act of 2002 |
|
| Certification of Chief Financial Officer pursuant to Section 906 of the Sarbanes-Oxley Act of 2002 |
|
| 101.INS | Inline XBRL Instance Document–the instance document does not appear in the Interactive Data File as its XBRL tags are embedded within the Inline XBRL document |
| 101.SCH | Inline XBRL Taxonomy Extension Schema Document |
| 101.CAL | Inline XBRL Taxonomy Extension Calculation Linkbase Document |
| 101.DEF | Inline XBRL Taxonomy Extension Definition Linkbase Document |
| 101.LAB | Inline XBRL Taxonomy Extension Label Linkbase Document |
| 101.PRE | Inline XBRL Taxonomy Extension Presentation Linkbase Document |
| 104 | Cover Page Interactive Data File (formatted as Inline XBRL and contained in Exhibit 101). |
SIGNATURES
The registrant hereby certifies that it meets all of the requirements for filing on Form 20-F and that it has duly caused and authorized the undersigned to sign this annual report on its behalf.
| FURY GOLD MINES LIMITED |
|||
| By: |
/s/ Phil van Staden |
||
| Name: |
Phil van Staden |
||
| Title: |
Chief Financial Officer |
||
Date: March 31, 2025

(An exploration company)
CONSOLIDATED
FINANCIAL STATEMENTS
FOR THE YEAR ENDED DECEMBER 31, 2024
REPORT OF INDEPENDENT REGISTERED PUBLIC ACCOUNTING FIRM
To the shareholders and the Board of Directors of
Fury Gold Mines Limited
Opinion on the Financial Statements
We have audited the accompanying consolidated statements of financial position of Fury Gold Mines Limited and subsidiaries (the "Company") as of December 31, 2024 and 2023, the related consolidated statements of (earnings) loss and comprehensive (income) loss, equity, and cash flows, for each of the three years in the period ended December 31, 2024, and the related notes (collectively referred to as the "financial statements"). In our opinion, the financial statements present fairly, in all material respects, the financial position of the Company as of December 31, 2024 and 2023, and its financial performance and its cash flows for each of the three years in the period ended December 31, 2024, in accordance with IFRS Accounting Standards as issued by the International Accounting Standards Board.
Basis for Opinion
These financial statements are the responsibility of the Company's management. Our responsibility is to express an opinion on the Company's financial statements based on our audits. We are a public accounting firm registered with the Public Company Accounting Oversight Board (United States) (PCAOB) and are required to be independent with respect to the Company in accordance with the U.S. federal securities laws and the applicable rules and regulations of the Securities and Exchange Commission and the PCAOB.
We conducted our audits in accordance with the standards of the PCAOB. Those standards require that we plan and perform the audit to obtain reasonable assurance about whether the financial statements are free of material misstatement, whether due to error or fraud. The Company is not required to have, nor were we engaged to perform, an audit of its internal control over financial reporting. As part of our audits, we are required to obtain an understanding of internal control over financial reporting but not for the purpose of expressing an opinion on the effectiveness of the Company’s internal control over financial reporting. Accordingly, we express no such opinion.
Our audits included performing procedures to assess the risks of material misstatement of the financial statements, whether due to error or fraud, and performing procedures that respond to those risks. Such procedures included examining, on a test basis, evidence regarding the amounts and disclosures in the financial statements. Our audits also included evaluating the accounting principles used and significant estimates made by management, as well as evaluating the overall presentation of the financial statements. We believe that our audits provide a reasonable basis for our opinion.
Critical Audit Matter
The critical audit matter communicated below is a matter arising from the current-period audit of the financial statements that was communicated or required to be communicated to the audit committee and that (1) relates to accounts or disclosures that are material to the financial statements and (2) involved our especially challenging, subjective, or complex judgments. The communication of critical audit matters does not alter in any way our opinion on the financial statements, taken as a whole, and we are not, by communicating the critical audit matter below, providing separate opinion on the critical audit matter or on the accounts or disclosures to which it relates.
Mineral property interests – Impairment analysis – Refer to Notes 3 g) and 16 to the financial statements
Critical Audit Matter Description
The Company determined that an impairment indicator existed at December 31, 2024. The recoverable amount for its cash generating units (“CGUs”) is the greater of the fair value less cost of disposal and the value in use. The fair value less cost of disposal for its CGUs was calculated using the in-situ ounce multiples method. As the carrying values exceeded the recoverable amounts, an impairment loss was recorded.
While there are several estimates and assumptions that are required to determine the recoverable amount, the estimates and assumptions with the highest degree of subjectivity are the in-situ once multiples. This required a high degree of auditor judgment and an increased extent of audit effort, including the involvement of fair value specialists.
How the Critical Audit Matter Was Addressed in the Audit
With the assistance of fair value specialists, our audit procedures related to the in-situ ounce multiples used to determine the recoverable amounts included evaluating the reasonableness of management’s determination of the in-situ ounce multiples by comparing to independent market data, among others.
/s/ Deloitte LLP
Chartered Professional Accountants
March 31, 2025
Vancouver, Canada
We have served as the Company's auditor since 2015.
| Consolidated Statements of Financial Position |
||||||||||||
| (Expressed in thousands of Canadian dollars) |
||||||||||||
| At December 31 |
At December 31 |
|||||||||||
| Note |
2024 |
2023 |
||||||||||
| Assets |
||||||||||||
| Current assets: |
||||||||||||
| Cash |
7 | $ | 4,912 | $ | 7,313 | |||||||
| Marketable securities |
8 | 2,358 | 1,166 | |||||||||
| Other investments |
9 | 2,063 | - | |||||||||
| Accounts receivable |
54 | 374 | ||||||||||
| Prepaid expenses and deposits |
522 | 592 | ||||||||||
| 9,909 | 9,445 | |||||||||||
| Non-current assets: |
||||||||||||
| Restricted cash |
7 | 144 | 144 | |||||||||
| Prepaid expenses and deposits |
77 | 111 | ||||||||||
| Property and equipment |
10 | 326 | 588 | |||||||||
| Mineral property interests |
11 | 45,200 | 142,639 | |||||||||
| Investments in associates |
12 | 29,456 | 36,248 | |||||||||
| 75,203 | 179,730 | |||||||||||
| Total assets |
$ | 85,112 | $ | 189,175 | ||||||||
| Liabilities and Equity |
||||||||||||
| Current liabilities: |
||||||||||||
| Accounts payable and accrued liabilities |
$ | 855 | $ | 1,034 | ||||||||
| Lease liability |
65 | 154 | ||||||||||
| Flow-through share premium liability |
13 | 944 | 544 | |||||||||
| 1,864 | 1,732 | |||||||||||
| Non-current liabilities: |
||||||||||||
| Lease liability |
- | 74 | ||||||||||
| Provision for site reclamation and closure |
14 | 5,045 | 4,495 | |||||||||
| Total liabilities |
$ | 6,909 | $ | 6,301 | ||||||||
| Equity: |
||||||||||||
| Share capital |
18 | $ | 312,723 | $ | 310,277 | |||||||
| Share option and warrant reserve |
19 | 22,684 | 21,660 | |||||||||
| Accumulated other comprehensive loss |
(12 | ) | (9 | ) | ||||||||
| Deficit |
(257,192 | ) | (149,054 | ) | ||||||||
| Total equity |
$ | 78,203 | $ | 182,874 | ||||||||
| Total liabilities and equity |
$ | 85,112 | $ | 189,175 | ||||||||
Commitments (notes 12(b), 13, 23); Subsequent events (note 26)
Approved on behalf of the Board of Directors:
| “Forrester A. Clark” |
“Steve Cook” |
|
| Chief Executive Officer |
Director |
The accompanying notes form an integral part of these consolidated financial statements.
| Fury Gold Mines Limited |
||||||||||||||||
| Consolidated Statements of (Earnings) Loss and Comprehensive (Income) Loss |
||||||||||||||||
| (Expressed in thousands of Canadian dollars, except per share amounts) |
||||||||||||||||
| Years ended December 31 |
||||||||||||||||
| Note |
2024 |
2023 |
2022 |
|||||||||||||
| Operating expenses: |
||||||||||||||||
| Exploration and evaluation |
15 | $ | 5,512 | $ | 9,311 | $ | 9,217 | |||||||||
| Fees, salaries and other employee benefits |
2,202 | 2,630 | 3,199 | |||||||||||||
| Insurance |
522 | 646 | 728 | |||||||||||||
| Legal and professional |
789 | 863 | 804 | |||||||||||||
| Marketing and investor relations |
677 | 737 | 809 | |||||||||||||
| Office and administration |
461 | 384 | 398 | |||||||||||||
| Regulatory and compliance |
214 | 275 | 218 | |||||||||||||
| 10,377 | 14,846 | 15,373 | ||||||||||||||
| Other (income) expense, net: |
||||||||||||||||
| Accretion on provision for site reclamation and closure |
14 | 146 | 148 | 94 | ||||||||||||
| Amortization of flow-through share premium |
13 | (1,621 | ) | (3,345 | ) | (3,124 | ) | |||||||||
| Foreign exchange loss |
13 | 13 | 9 | |||||||||||||
| Impairment expense |
16 | 100,873 | - | 5,506 | ||||||||||||
| Interest expense |
33 | 61 | 115 | |||||||||||||
| Interest income |
(300 | ) | (590 | ) | (228 | ) | ||||||||||
| Net gain on disposition of mineral interests |
6,11 | - | (468 | ) | (48,390 | ) | ||||||||||
| Net loss from associates |
12 | 3,858 | 6,182 | 5,880 | ||||||||||||
| Gain on investments |
12 | (4,109 | ) | - | - | |||||||||||
| Net (gain) loss on marketable securities |
8 | (373 | ) | 655 | 135 | |||||||||||
| Other income |
17 | (566 | ) | - | (91 | ) | ||||||||||
| 97,954 | 2,656 | (40,094 | ) | |||||||||||||
| (Earnings) loss before taxes |
108,331 | 17,502 | (24,721 | ) | ||||||||||||
| Income tax recovery |
25 | (193 | ) | (289 | ) | (187 | ) | |||||||||
| Net (earnings) loss for the year |
108,138 | 17,213 | (24,908 | ) | ||||||||||||
| Other comprehensive loss, net of tax |
||||||||||||||||
| Unrealized currency loss on translation of foreign operations |
3 | 6 | 3 | |||||||||||||
| Total comprehensive (income) loss for the year |
$ | 108,141 | 17,219 | $ | (24,905 | ) | ||||||||||
| (Earnings) loss per share: |
||||||||||||||||
| Basic and diluted (earnings) loss per share |
22 | $ | 0.73 | $ | 0.12 | $ | (0.18 | ) | ||||||||
The accompanying notes form an integral part of these consolidated financial statements.
| Fury Gold Mines Limited |
||||||||||||||||||||||||
| Consolidated Statements of Equity |
||||||||||||||||||||||||
| (Expressed in thousands of Canadian dollars, except share amounts) |
||||||||||||||||||||||||
| Number of common shares |
Share capital |
Share option and warrant reserve |
Accumulated other comprehensive loss |
Deficit |
Total |
|||||||||||||||||||
| Balance at December 31, 2021 |
125,720,950 | $ | 295,464 | $ | 18,640 | $ | - | $ | (156,749 | ) | $ | 157,355 | ||||||||||||
| Comprehensive income (loss) for the year |
- | - | - | (3 | ) | 24,908 | 24,905 | |||||||||||||||||
| Shares issued pursuant to offering, net of share issue costs |
13,750,000 | 10,864 | - | - | - | 10,864 | ||||||||||||||||||
| Share-based compensation |
- | - | 1,669 | - | - | 1,669 | ||||||||||||||||||
| Balance at December 31, 2022 |
139,470,950 | $ | 306,328 | $ | 20,309 | $ | (3 | ) | $ | (131,841 | ) | $ | 194,793 | |||||||||||
| Comprehensive loss for the year |
- | - | - | (6 | ) | (17,213 | ) | (17,219 | ) | |||||||||||||||
| Shares issued pursuant to offering, net of share issue costs |
6,076,500 | 3,949 | - | - | - | 3,949 | ||||||||||||||||||
| Share-based compensation |
197,345 | - | 1,351 | - | - | 1,351 | ||||||||||||||||||
| Balance at December 31, 2023 |
145,744,795 | $ | 310,277 | $ | 21,660 | $ | (9 | ) | $ | (149,054 | ) | $ | 182,874 | |||||||||||
| Comprehensive loss for the year |
- | - | - | (3 | ) | (108,138 | ) | (108,141 | ) | |||||||||||||||
| Shares issued pursuant to offering, net of share issue costs (note 18) |
5,320,000 | 2,446 | - | - | - | 2,446 | ||||||||||||||||||
| Share-based compensation (note 19) |
491,478 | - | 1,024 | - | - | 1,024 | ||||||||||||||||||
| Balance at December 31, 2024 |
151,556,273 | $ | 312,723 | $ | 22,684 | $ | (12 | ) | $ | (257,192 | ) | $ | 78,203 | |||||||||||
The accompanying notes form an integral part of these consolidated financial statements.
| Fury Gold Mines Limited |
||||||||||||||||
| Consolidated Statements of Cash Flows |
||||||||||||||||
| (Expressed in thousands of Canadian dollars) |
||||||||||||||||
| Years ended December 31 |
||||||||||||||||
| Note |
2024 |
2023 |
2022 |
|||||||||||||
| Operating activities: |
||||||||||||||||
| Earnings (loss) for the year |
$ | (108,138 | ) | $ | (17,213 | ) | 24,908 | |||||||||
| Adjusted for: |
||||||||||||||||
| Interest income |
(300 | ) | (590 | ) | (228 | ) | ||||||||||
| Items not involving cash: |
||||||||||||||||
| Accretion of provision for site reclamation and closure |
14 | 146 | 148 | 94 | ||||||||||||
| Amortization of flow-through share premium |
13 | (1,621 | ) | (3,345 | ) | (3,124 | ) | |||||||||
| Depreciation |
10 | 297 | 343 | 341 | ||||||||||||
| Impairment expense |
16 | 100,873 | - | 5,506 | ||||||||||||
| Interest expense |
25 | 61 | 100 | |||||||||||||
| Net gain on disposition of mineral interests |
6,11 | - | (468 | ) | (48,390 | ) | ||||||||||
| Net loss from associates |
12 | 3,858 | 6,182 | 5,880 | ||||||||||||
| Net (gain) loss on marketable securities |
8 | (373 | ) | 655 | 135 | |||||||||||
| Gain on investments |
(4,109 | ) | - | - | ||||||||||||
| Share-based compensation |
19 | 859 | 1,351 | 1,669 | ||||||||||||
| Changes in non-cash working capital |
21 | 410 | (184 | ) | (903 | ) | ||||||||||
| Cash used in operating activities |
(8,073 | ) | (13,060 | ) | (14,012 | ) | ||||||||||
| Investing activities: |
||||||||||||||||
| Acquisition of mineral interests, inclusive of transaction fees |
11 | (3,030 | ) | - | (1,281 | ) | ||||||||||
| Acquisition of Universal Mineral Services Ltd |
- | - | (1 | ) | ||||||||||||
| Increase in restricted cash |
7 | - | - | (14 | ) | |||||||||||
| Interest income |
300 | 590 | 228 | |||||||||||||
| Marketable securities additions |
8 | (1,300 | ) | - | (60 | ) | ||||||||||
| Option payment received |
11 | - | 125 | 310 | ||||||||||||
| Other investments additions |
9 | (2,063 | ) | - | - | |||||||||||
| Proceeds from disposition of mineral interests, net of transaction costs |
6 | - | 1,350 | 4,479 | ||||||||||||
| Proceeds from disposition of investment in associate, net of transaction costs |
12 | 7,042 | - | 6,774 | ||||||||||||
| Proceeds from disposition of marketable securities, net of transaction costs |
8 | 481 | 381 | - | ||||||||||||
| Property and Equipment additions |
10 | (35 | ) | - | - | |||||||||||
| Cash provided by investing activities |
1,395 | 2,446 | 10,435 | |||||||||||||
| Financing activities: |
||||||||||||||||
| Proceeds from issuance of common shares, net of costs |
18 | 4,468 | 7,838 | 10,864 | ||||||||||||
| Lease payments |
(191 | ) | (214 | ) | (235 | ) | ||||||||||
| Cash provided by financing activities |
4,277 | 7,624 | 10,629 | |||||||||||||
| Effect of foreign exchange on cash |
- | (6 | ) | (2 | ) | |||||||||||
| Increase (decrease) in cash |
(2,401 | ) | (2,996 | ) | 7,050 | |||||||||||
| Cash, beginning of the year |
7,313 | 10,309 | 3,259 | |||||||||||||
| Cash, end of the year |
7 | $ | 4,912 | $ | 7,313 | $ | 10,309 | |||||||||
Supplemental cash flow information (note 21)
The accompanying notes form an integral part of these consolidated financial statements.
Note 1: Nature of operations
Fury Gold Mines Limited (the “Company” or “Fury Gold”) was incorporated on June 9, 2008, under the Business Corporations Act (British Columbia) and is listed on the Toronto Stock Exchange and the NYSE-American, with its common shares trading under the symbol FURY. The Company’s registered and records office is at 1500-1055 West Georgia Street Vancouver, BC, V6E 4N7 and the mailing address is 401 Bay Street, 16th Floor, Toronto, Ontario, M5H 2Y4.
The Company’s principal business activity is the acquisition and exploration of resource projects in Canada. At December 31, 2024, the Company had three principal projects: Committee Bay in Nunavut, and Eau Claire and Éléonore South in Quebec, which the Company now owns 100%, after acquiring the 49.978% interest, previously held by Newmont Corporation (“Newmont”), in February 2024. Additionally, the Company holds a 16.11% common share interest in Dolly Varden Silver Corporation (“Dolly Varden”) at December 31, 2024, which owns the Kitsault project in British Columbia and a 25% interest in Universal Mineral Services Limited (“UMS”), a private shared-services provider.
Sale of Homestake Resources Corporation (“Homestake Resources”)
On December 6, 2021, the Company entered into a definitive agreement (the "Purchase Agreement") with Dolly Varden pursuant to which the Company agreed to sell to Dolly Varden a 100% interest in Fury Gold's wholly owned subsidiary, Homestake Resources, in exchange for $5,000 in cash and 76,504,590 common shares in Dolly Varden. Homestake Resources was the owner of a 100% interest in the Homestake Ridge gold-silver project which is located adjacent to the Dolly Varden Project owned by Dolly Varden in the Golden Triangle, British Columbia (“the Dolly Varden Transaction”). The Dolly Varden Transaction completed on February 25, 2022. As a result, Fury acquired the 76,504,590 Dolly Varden Shares on February 25, 2022, representing approximately 35.33% of the Dolly Varden Shares outstanding and 32.88% of Dolly Varden on a fully diluted basis as of that date.
In connection with the Dolly Varden Transaction and as contemplated in the Purchase Agreement, Dolly Varden and Fury Gold had also entered into an investor rights agreement dated February 25, 2022 (the "Investor Rights Agreement"). Pursuant to its obligations under the Investor Rights Agreement, Dolly Varden had appointed Forrester “Tim” Clark, the Chief Executive Officer (“CEO”) of Fury Gold, and Michael Henrichsen, the former Chief Geological Officer of Fury Gold, to the board of directors of Dolly Varden.
| (a) |
On October 13, 2022, the Company announced that it had completed a non-brokered sale agreement to sell 17,000,000 common shares of Dolly Varden at $0.40 per share, representing approximately 7.4% of the outstanding common shares. The net proceeds received by the Company upon close of the transaction was $6,774. |
| (b) |
On March 12, 2024, the Company sold 5,450,000 common shares of Dolly Varden at $0.735 per Share for gross proceeds of $4,006, thus reducing its position to 19.99% of Dolly Varden, and decreasing its right to one director on Dolly Varden under its Investors Rights Agreement, to which notice had been given. |
| (c) |
On October 4, 2024, the Company further sold 3,000,000 common shares of Dolly Varden at $1.119 per Share for gross proceeds of $3,356. As at December 31, 2024, the Company held a 16.11% interest in Dolly Varden. |
Acquisition of 25% equity interest in Universal Mineral Services Ltd.
On April 1, 2022, the Company purchased a 25% share interest in UMS, a private shared-services provider for nominal consideration. The remaining 75% of UMS is owned equally by three other junior resource issuers, namely Tier One Silver Inc., Coppernico Metals Inc., and Torq Resources Inc. Previously, UMS had been privately owned by a director in common, Mr. Ivan Bebek, then subsequently from January 1, 2022, by Mr. Steve Cook, another director in common, until March 31, 2022.
UMS is the private company through which its shareholders, including Fury Gold, share geological, financial, and transactional advisory services as well as administrative services on a full cost recovery basis. Having these services available through UMS, on an as needed basis, allows the Company to maintain a more efficient and cost-effective corporate overhead structure by hiring fewer full-time employees and engaging outside professional advisory firms less frequently. The agreement has an indefinite term and can be terminated by either party upon providing 180 days notice.
Increase in ownership interest of Éléonore South
On September 12, 2022, the Company and its joint operation partner Newmont, through their respective subsidiaries, completed the acquisition of the remaining approximately 23.77% participating interest of Azimut Exploration Inc. in the Éléonore South Joint Venture (“ESJV”), on a pro-rata basis. As a result of the transaction, the 100% ESJV participating interests at December 31, 2022 and 2023 were held 50.022% by the Company and 49.978% by Newmont, with Fury Gold remaining the operator under an amended and restated joint operating agreement.
On February 29, 2024, the Company and Newmont, through their respective subsidiaries, entered into a new agreement whereby the Company acquired 100% control of the interests, consolidating these properties into the Company’s portfolio and dissolving the joint venture.
Note 2: Basis of presentation
These consolidated financial statements have been prepared in accordance with IFRS® Accounting Standards as issued by the International Accounting Standards Board (“IASB”), effective for the year ended December 31, 2024. IFRS Accounting Standards as issued by the IASB comprises IFRSs, International Accounting Standards (“IASs”), and interpretations issued by the IFRS Interpretations Committee (“IFRICs”), and the former Standing Interpretations Committee (“SICs”).
These consolidated financial statements were approved and authorized for issuance by the Board of Directors of the Company on March 31, 2025.
Note 3: Material Accounting Policy Information
|
a) |
Basis of measurement |
These consolidated financial statements have been prepared on a historical cost basis, except for those assets and liabilities that are measured at revalued amounts or fair values at the end of each reporting period.
|
b) |
Currency of presentation |
The Company’s presentation currency is the Canadian (“CAD”) dollar. All amounts, with the exception of per share amounts, are expressed in thousands of Canadian dollars, unless otherwise stated. References to US$ are to United States (“US”) dollars.
| c) |
Basis of preparation and consolidation |
These consolidated financial statements include the accounts of the Company and its subsidiaries. Subsidiaries are entities controlled by the Company. Control exists when the Company has power over an investee, when the Company is exposed, or has rights, to variable returns from the investee and when the Company has the ability to affect those returns through its power over the investee. Subsidiaries are included in the consolidated financial results of the Company from the effective date of acquisition up to the effective date of disposition or loss of control. All intercompany balances and transactions have been eliminated.
The subsidiaries (with a beneficial interest of 100%) of the Company as at December 31, 2024 were as follows:
| Subsidiary |
Place of incorporation |
Functional currency |
| Eastmain Mines Inc. (“Eastmain Mines”) (a) |
Canada |
CAD |
| Eastmain Resources Inc. (“Eastmain”) |
ON, Canada |
CAD |
| Fury Gold USA Limited (“Fury Gold USA”) (b) |
Delaware, U.S.A. |
USD |
| North Country Gold Corp. (“North Country”) |
BC, Canada |
CAD |
(a) The entity is incorporated federally in Canada.
(b) Fury Gold USA provided certain administrative services with respect to employee benefits for US resident personnel.
Investments in associates
These consolidated financial statements also include the following investments in associates:
| Associates |
Ownership interest |
Location |
Classification and accounting method |
| Dolly Varden |
16.11% |
BC, Canada |
Associate; equity method |
| UMS |
25.00% |
BC, Canada |
Associate; equity method |
|
d) |
Foreign currency translation |
The financial statements of the Company and each of its subsidiaries are prepared in its functional currency determined on the basis of the currency of the primary economic environment in which such entities operate. The presentation and functional currency of the Company and each of its subsidiaries, with the exception of Fury Gold USA, is the Canadian dollar. Fury Gold USA’s functional currency has been determined to be the US dollar.
Transactions in currencies other than the functional currency are recorded at the rates of exchange prevailing at the transaction dates. At each reporting date, monetary items denominated in foreign currencies are translated into the entity’s functional currency at the then prevailing rates and non-monetary items measured at historical cost are translated into the entity’s functional currency at rates in effect at the date the transaction took place.
Exchange differences arising on the settlement of monetary items or on translating monetary items at rates different from those at which they were translated on initial recognition during the period or in previous financial statements are included in the consolidated statements of (earnings) loss and comprehensive (income) loss for the period in which they arise.
|
e) |
Cash and cash equivalents |
Cash and cash equivalents consist of cash and highly liquid short-term investments that are readily convertible to cash and have maturities with terms of less than ninety days and/or with original maturities over ninety days but redeemable on demand without penalty. As at December 31, 2024 and 2023, the Company did not have any cash equivalents.
|
f) |
Property and equipment |
Property and equipment are stated at cost less accumulated amortization and impairment losses. Amortization is calculated using the straight-line method over the estimated useful lives as follows:
| ● |
Computer equipment3 years |
| ● |
Machinery and equipment5-10 years |
| ● |
Right-of-use (“ROU”) assets the lease term, unless the transfer of the asset ownership is reasonably certain at the end of the lease term, whereupon depreciation is over the useful life. |
|
g) |
Mineral property interests and exploration expenditures |
Title to mineral properties involves certain inherent risks due to the difficulties of determining the validity of certain claims as well as the potential for problems arising from the frequently ambiguous conveyancing historical characteristic of many properties. The Company has investigated title to all of its mineral properties and, to the best of its knowledge, title to all of its properties is in good standing.
The Company accounts for mineral property interests in accordance with IFRS 6 – Exploration for and evaluation of mineral properties (“IFRS 6”).
Costs directly related to acquiring the legal right to explore a mineral property including acquisition of licenses, mineral rights, and similar acquisition costs are recognized and capitalized as mineral property interests. Acquisition costs incurred in obtaining the legal right to explore a mineral property are deferred until the legal right is granted and thereon reclassified to mineral property interests. Transaction costs incurred in acquiring an asset are deferred until the transaction is completed and then included in the purchase price of the asset acquired.
Once the legal right to explore a property has been acquired, costs directly related to exploration and evaluation activities including, but not limited to, researching and analyzing existing exploration data, conducting geological studies, exploration drilling and sampling, and payments made to contractors and consultants in connection with the exploration and evaluation of the property, are expensed in the period in which they are incurred as exploration and evaluation costs on the consolidated statements of (earnings) loss and comprehensive (income) loss.
Costs not directly attributable to exploration and evaluation activities, including general administrative overhead costs, are expensed as administrative costs in the period in which they occur.
As the Company currently has no operational income, any incidental revenues earned in connection with exploration activities are applied as a reduction to exploration and evaluation costs.
When a project is deemed to no longer have commercially viable prospects to the Company, all capitalized acquisition costs in respect of that project are deemed to be impaired. As a result, those costs, in excess of the estimated recoverable amount, are expensed to the consolidated statements of (earnings) loss and comprehensive (income) loss.
The Company considers each group of claims in close proximity to one another as individual cash-generating units (“CGU”). The Company assesses mineral property interests as a CGU for impairment when facts and circumstances suggest that the carrying amount of the asset may exceed its recoverable amount. The recoverable amount is the higher of the asset’s fair value less costs to sell and its value in use and can be determined by factors including comparable public company resources, precedent transactions and valuing the Company’s projects using a reasonable per ounce valuation.
Once the technical feasibility and commercial viability of extracting the mineral resources has been determined, the property is considered to be a mine under development at which point the assets and further related costs no longer fall under the guidance of IFRS 6.
|
h) |
Joint arrangement |
The Company conducts a portion of its business through a joint arrangement where the parties are bound by contractual arrangements establishing joint control with decisions about the relevant activities that significantly affect the returns of the investee requiring unanimous consent. A joint arrangement is classified as either a joint operation or a joint venture, subject to the terms that govern each investor's rights and obligations in the arrangement.
In a joint operation, the investor has rights and obligations to the separate assets and liabilities of the investee, therefore the Company recognizes its share of the assets, liabilities, revenue, and expenses of the joint arrangement.
|
i) |
Investments in associates |
The Company conducts a portion of its business through equity interests in associates. An associate is an entity over which the Company has significant influence and is neither a subsidiary nor a joint venture. The Company has significant influence when it has the power to participate in the financial and operating policy decisions of the associate but does not have control or joint control over those policy decisions.
The Company accounts for its investments in associates using the equity method. Under the equity method, the Company’s investment in an associate is initially recognized at cost and subsequently increased or decreased to recognize the Company's share of earnings and losses of the associate, after any adjustments necessary to give effect to uniform accounting policies, and for impairment losses after the initial recognition date. The Company’s share of an associate’s losses that are in excess of its investment in the associate are recognized only to the extent that the Company has incurred legal or constructive obligations or made payments on behalf of the associate. The Company's share of earnings and losses of its associate are recognized in net (earnings)/loss during the period.
|
j) |
Impairment of non-financial assets |
At each reporting date, the Company reviews the carrying amounts of its non-financial assets to determine whether there are any indicators of impairment. If any such indicator exists, the recoverable amount of the asset is estimated in order to determine the extent of the impairment, if any.
Where the asset does not generate cash inflows that are independent from other assets, the Company estimates the recoverable amount of the CGU to which the asset belongs. Any intangible asset with an indefinite useful life is tested for impairment annually and whenever there is an indication that the asset may be impaired. An asset’s recoverable amount is the higher of fair value less costs of disposal and value in use. In assessing value in use, the estimated future cash flows are discounted to their present value using a pre-tax discount rate that reflects current market assessments of the time value of money and the risks specific to the asset for which estimates of future cash flows have not been adjusted.
If the recoverable amount of an asset or CGU is estimated to be less than its carrying amount, the carrying amount is reduced to the recoverable amount and an impairment loss is recognized immediately in the consolidated statements of (earnings) loss and comprehensive (income) loss. Where an impairment subsequently reverses, the carrying amount is increased to the revised estimate of recoverable amount but only to the extent that this does not exceed the carrying value that would have been determined if no impairment had previously been recognized. A reversal of impairment is recognized in the consolidated statements of (earnings) loss and comprehensive (income) loss.
|
k) |
Leases |
The Company assesses if a contract is or contains a lease at inception of the contract. Control is considered to exist if the contract conveys the right to control the use of an identified asset during the term of the lease. When a lease is identified, a right-of-use asset and a corresponding lease liability are recognized, except for short-term leases (defined as leases with a lease term of 12 months or less) and leases of low value assets. For these leases, the Company recognizes the lease payments as an expense in profit or loss on a straight-line basis.
Right-of-use assets, which are included in property and equipment, are recognized at cost, which is comprised of the initial amount of the lease liability adjusted for any lease payments made at or before the commencement date, plus any initial direct costs and decommissioning and restoration costs, less any lease incentives received. Right-of-use assets are depreciated over the shorter of the asset's useful life and the lease term on a straight-line basis, except where ownership is expected to be transferred at the end of the lease, whereby the asset is depreciated over its useful life.
The lease liability is initially measured at the present value of the lease payments that are not paid at the commencement date discounted by using the rate implicit in the lease or the Company’s incremental borrowing rate, if the rate implicit in the lease cannot be determined. Lease payments included in the measurement of the lease liability are:
| ● |
fixed payments (including in-substance fixed payments), less any lease incentives receivable; |
| ● |
variable payments that depend on an index or rate; |
| ● |
amount expected to be payable by the lessee under residual value guarantees; |
| ● |
exercise price of purchase options, if the lessee is reasonably certain to exercise the options; and |
| ● |
penalties for terminations, unless the Company is reasonably certain the options will not be exercised. |
|
l) |
Provisions |
Provisions are recorded when a present legal or constructive obligation exists as a result of past events where it is probable that an outflow of resources embodying economic benefit will be required to settle the obligation, and a reliable estimate of the amount of the obligation can be made.
|
m) |
Provision for site reclamation and closure |
An obligation to incur rehabilitation and site restoration costs arises when an environmental disturbance is caused by the exploration, development, or on-going production of a mineral property interest. Such costs arising from the decommissioning of plant and other site preparation work, discounted to their net present value, are provided for and capitalized at the start of each project as soon as the obligation to incur such costs arises, as well when changes in estimates occur year over year. These costs are charged to the consolidated statements of (earnings) loss and comprehensive (income) loss over the life of the operation through amortization and the unwinding of the discount in the provision.
|
n) |
Flow-through common shares |
Canadian income tax legislation permits companies to issue flow-through instruments whereby the income tax deductions generated by eligible expenditures of the Company, defined in the Income Tax Act (Canada) as qualified Canadian exploration expenses (“CEE”), are claimed by the investors rather than by the Company. Shares issued on a flow-through basis are typically sold at a premium above the market share price which relates to the tax benefits that will flow through to the investors. The Company often issues flow-through shares as part of its equity financing transactions in order to fund its Canadian exploration activities. The Company estimates the portion of the proceeds attributable to the premium as being the excess of the flow-through share price over the market share price of the common shares without the flow-through feature at the time of issuance. The premium is recorded as a liability which represents the Company’s obligation to spend the flow-through funds on eligible expenditures and is amortized through the consolidated statements of (earnings) loss and comprehensive (income) loss as the eligible expenditures are incurred.
|
o) |
(Earnings) Loss per share |
Basic (earnings) loss per share is calculated by dividing the net (earnings) loss available to common shareholders by the weighted average number of shares outstanding during the reporting period. The diluted loss per share is calculated by dividing the net loss available to common shareholders by the weighted average number of shares outstanding on a diluted basis. The weighted average number of shares outstanding on a diluted basis takes into account the additional shares for the assumed exercise of share options and warrants, if dilutive. The number of additional shares is calculated by assuming that outstanding share options were exercised and that the proceeds from such exercises were used to acquire common shares at the average market price during the reporting period.
|
p) |
Share-based compensation |
Options
From time to time, the Company grants share options to employees and non-employees. An individual is classified as an employee, versus a non-employee, when the individual is an employee for legal or tax purposes (direct employee) or provides services similar to those performed by a direct employee.
The fair value of share options, measured using the Black-Scholes option pricing model at the date of grant, is charged to the consolidated statements of (earnings) loss and comprehensive (income) loss over the vesting period. Performance vesting conditions and forfeitures are taken into account by adjusting the number of equity instruments expected to vest at each reporting date so that, ultimately, the cumulative amount recognized over the vesting period is based on the number of options that eventually vest.
Where the terms and conditions of options are modified before they vest, any change in the fair value of the options, measured immediately before and after the modification, is also charged to the consolidated statements of (earnings) loss and comprehensive (income) loss over the remaining vesting period.
Equity instruments granted to non-employees are recorded in the consolidated statements of (earnings) loss and comprehensive (income) loss at the fair value of the goods or services received, unless they are related to the issuance of shares. Costs related to the issuance of shares are recorded as a reduction of share capital.
When the value of goods or services received in exchange for a share-based payment cannot be reliably estimated, the fair value is measured by use of a valuation model. The expected life used in the model is adjusted, based on management’s best estimate, for the effects of non-transferability, exercise restrictions, and behavioral considerations.
All equity-settled share-based payments are recorded in the share option and warrant reserve until exercised. Upon exercise, shares are issued from treasury and the amount previously recorded in share option and warrant reserve is reclassified to share capital along with any consideration paid.
Deferred, Performance and Restricted Share Units (“DSU”, “PSU” and “RSU”)
Under the Company’s Long-term incentive (“LTI”) plan, the board can issue DSU’s, PSU’s or RSU’s to eligible members of management and or the board. The fair value of these shares will be determined at the time that they are granted and will be charged to the consolidated statements of (earnings) loss and comprehensive (income) loss at the time all vesting criteria have been met.
DSU’s, PSU’s or RSU’s issued under the Company’s LTI plan vest on or before the third anniversary of the grant or as otherwise provided and may be settled in the form of the Company's common shares or, at the option of the Company, the cash equivalent based on the market price of the common shares as of the vesting date.
The Company has historically settled RSUs in common shares. The Company has no present obligation to settle these in cash.
|
q) |
Income taxes |
Income tax reported in the consolidated statements of (earnings) loss and comprehensive (income) loss for the period presented comprises current and deferred income tax. Income tax is recognized in the consolidated statements of (earnings) loss and comprehensive (income) loss except to the extent that it relates to items recognized directly in equity, in which case it is recognized in equity.
Current income tax for each taxable entity in the Company is based on the local taxable income at the local statutory tax rate enacted or, substantively enacted, at the reporting date and includes any adjustments to tax payable or recoverable with regards to previous periods.
Deferred income tax is determined using the liability method, providing for temporary differences between the carrying amounts of assets and liabilities for financial reporting purposes and the amounts used for taxation purposes. The amount of deferred income tax provided is based on the expected manner of realization or settlement of the carrying amount of assets and liabilities, using the expected future tax rates enacted or substantively enacted at the reporting date.
A deferred income tax asset is recognized only to the extent that it is probable that future taxable profits will be available against which the asset can be utilized. Deferred tax assets are reduced to the extent that it is no longer probable that the related tax benefit will be realized.
Deferred income tax assets and liabilities are offset only when there is a legally enforceable right to set off current tax assets against current tax liabilities, when they relate to income taxes levied by the same taxation authority and the Company intends to settle its tax assets and liabilities on a net basis.
| r) |
Financial instruments |
The Company recognizes financial assets and liabilities on its consolidated statements of financial position when it becomes a party to the contract creating the asset or liability.
On initial recognition, all financial assets and liabilities are recorded by the Company at fair value, net of attributable transaction costs, except for financial assets and liabilities classified as fair value through profit or loss for which transaction costs are expensed in the period in which they are incurred.
| i) |
Amortized cost |
Financial assets that meet the following conditions are measured subsequently at amortized cost:
| ● |
the financial asset is held within a business model whose objective is to hold financial assets in order to collect contractual cash flows; and |
| ● |
the contractual terms of the financial asset give rise on specified dates to cash flows that are solely payments of principal and interest on the principal amount outstanding. |
The amortized cost of a financial asset is the amount at which the financial asset is measured at initial recognition minus the principal repayments, plus the cumulative amortization using the effective interest method of any difference between that initial amount and the maturity amount, adjusted for any loss allowance. Interest income is recognized using the effective interest method.
| ii) |
Fair value through other comprehensive income (”FVTOCI") |
Financial assets that meet the following conditions are measured at FVTOCI:
| ● |
the financial asset is held within a business model whose objective is achieved by both collecting contractual cash flows and selling financial assets; and |
| ● |
the contractual terms of the financial asset give rise on specified dates to cash flows that are solely payments of principal and interest on the principal amount outstanding. |
The Company does not have any financial assets classified as FVTOCI at December 31, 2024 and 2023.
| iii) |
Financial assets measured subsequently at fair value through profit or loss (“FVTPL”) |
By default, all other financial assets are measured subsequently at FVTPL.
The Company, at initial recognition, may also irrevocably designate a financial asset as measured at FVTPL if doing so eliminates or significantly reduces a measurement or recognition inconsistency that would otherwise arise from measuring assets or liabilities or recognizing the gains and losses on them on different bases. Financial assets measured at FVTPL are measured at fair value at the end of each reporting period, with any fair value gains or losses recognized in profit or loss to the extent they are not part of a designated hedging relationship. Fair value is determined in the manner described in note 23.
| iv) |
Financial liabilities and equity |
Debt and equity instruments are classified as either financial liabilities or as equity in accordance with the substance of the contractual arrangements, and the definitions of a financial liability and an equity instrument.
An equity instrument is any contract that evidences a residual interest in the assets of the Company after deducting all its liabilities. Equity instruments issued by the Company are recognized at the proceeds received, net of direct issue costs. Repurchase of the Company’s own equity instruments is recognized and deducted directly in equity. No gain or loss is recognized in profit or loss on the purchase, sale, issue, or cancellation of the Company’s own equity instruments.
Financial liabilities that are not contingent consideration of an acquirer in a business combination, held for trading, or designated as at FVTPL, are measured at amortized cost using the effective interest method.
| v) |
Impairment |
The Company recognizes a loss allowance for expected credit losses on its financial assets. The amount of expected credit losses is updated at each reporting period to reflect changes in credit risk since initial recognition of the respective financial instruments.
| s) |
Other Comprehensive (Income) loss |
Other comprehensive (income) loss is the change in net assets arising from transactions and other events and circumstances from non-owner sources. Comprehensive (income) loss comprises net (earnings) loss and other comprehensive loss. Foreign currency translation differences arising on translation of subsidiaries with a different functional currency are also included in other comprehensive loss.
Note 4: Changes in accounting standards
Application of new and revised accounting standards:
The Company has adopted the following amended accounting standards and policies effective January 1, 2024.
Amendments to IAS 1 Presentation of Financial Statements — Classification of Liabilities as Current or Non-current
The amendments to IAS 1 published in January 2020 affect only the presentation of liabilities as current or non-current in the statement of financial position and not the amount or timing of recognition of any asset, liability, income or expenses, or the information disclosed about those items.
The amendments clarify that the classification of liabilities as current or non-current is based on rights that are in existence at the end of the reporting period, specify that classification is unaffected by expectations about whether an entity will exercise its right to defer settlement of a liability, explain that rights are in existence if covenants are complied with at the end of the reporting period, and introduce a definition of ‘settlement’ to make clear that settlement refers to the transfer to the counterparty of cash, equity instruments, other assets or services.
There was no impact to the Company’s financial statements for the year ended December 31, 2024, upon adoption.
Amendments to IAS 7 Statement of Cash Flows and IFRS 7 Financial Instruments: Disclosures — Supplier Finance Arrangements
The amendments add a disclosure objective to IAS 7 stating that an entity is required to disclose information about its supplier finance arrangements that enables users of financial statements to assess the effects of those arrangements on the entity’s liabilities and cash flows. In addition, IFRS 7 was amended to add supplier finance arrangements as an example within the requirements to disclose information about an entity’s exposure to concentration of liquidity risk.
There was no impact to the Company’s financial statements for the year ended December 31, 2024, upon adoption.
Amendment to IFRS 16 Leases — Lease Liability in a Sale and Leaseback
The amendments to IFRS 16 add subsequent measurement requirements for sale and leaseback transactions that satisfy the requirements in IFRS 15 to be accounted for as a sale. The amendments require the seller-lessee to determine ‘lease payments’ or ‘revised lease payments’ such that the seller-lessee does not recognise a gain or loss that relates to the right of use retained by the seller-lessee, after the commencement date.
There was no impact to the Company’s financial statements for the year ended December 31, 2024, upon adoption.
New and amended standards not yet effective:
The following new and amended standards, which are not yet effective, have not been applied by the Company in these financial statements.
Amendments to the Classification and Measurement of Financial Instruments (Amendments to IFRS 9 and IFRS 7)
The IASB has issued 'Amendments to the Classification and Measurement of Financial Instruments (Amendments to IFRS 9 and IFRS 7)' to address matters identified during the post-implementation review of the classification and measurement requirements of IFRS 9 'Financial Instruments'. The amendments include changes to derecognition of a financial liability settled through electronic transfer, classification of financial assets, and disclosures, and are effective for reporting periods beginning on or after January 1, 2026. The Company is currently evaluating the impact of the new standard on its financial statements.
IFRS 18 Presentation and Disclosures in Financial Statements
In April 2024, the IASB issued a new standard which replaces IAS 1. IFRS 18 Presentation and Disclosure in Financial Statements carries forward many requirements in IAS 1 and complements them with new requirements. IFRS 18 includes requirements for all entities applying IFRS for the presentation and disclosure of information in financial statements. The new standard applies to annual reporting period beginning on or after January 1, 2027. The Company is currently evaluating the impact of the new standard on its financial statements.
Note 5: Critical accounting estimates and judgments
The preparation of financial statements in conformity with IFRS Accounting Standards as issued by the IASB requires management to select accounting policies and make estimates and judgments that may have a significant impact on the consolidated financial statements. Estimates are continuously evaluated and are based on management’s experience and expectations of future events that are believed to be reasonable under the circumstances. Actual outcomes may differ from these estimates.
Critical accounting judgments exercised in applying accounting policies, apart from those involving estimates, which have the most significant effect on the amounts recognized in these consolidated financial statements are as follows:
| (a) |
Functional currency |
The functional currency for each of the Company’s subsidiaries is the currency of the primary economic environment in which the entity operates. Determination of functional currency may involve certain judgments to determine the primary economic environment and the Company reconsiders the functional currency of its entities if there is a change in events and conditions that determined the primary economic environment.
| (b) |
Economic recoverability and probability of future economic benefits of mineral property interests |
Management has determined that the acquisition of mineral properties and related costs incurred, which have been recognized on the consolidated statements of financial position, are economically recoverable. Management uses several criteria in its assessments of economic recoverability and probability of future economic benefit including geological data, scoping studies, accessible facilities, and existing and future permits.
| (c) |
Indications of impairment of assets |
Assessments of impairment indicators are performed at the CGU level and judgment is involved in assessing whether there is any indication that an asset or a CGU may be impaired. The assessment of the impairment indicators involves the application of a number of significant judgments and estimates to certain variables, including metal price trends, exploration plans for properties, and the results of exploration and evaluation to date.
| (d) |
Income taxes |
The provision for income taxes and composition of income tax assets and liabilities requires management’s judgment. The application of income tax legislation also requires judgment in order to interpret legislation and to apply those findings to the Company’s transactions.
Credit on duties refundable for loss and refundable tax credits for resource investment
The Company is entitled to a refundable credit on duties of 12% for eligible losses under the Quebec Mining Duties Act and a refundable resource investment tax credit of 38.75% under the Quebec Income Tax Act. These credits are applicable to qualified exploration expenditures on properties located within the province of Quebec. Application for these credits is subject to verification and, as such, they are recognized only when they are received or when a notice of assessment confirming the amount to be paid is issued. During the year ended December 31, 2024, the Company received a refund of $193 ( December 31, 2023 – $307, December 31, 2022 – $187) which was classified as income tax recoveries on the consolidated statements of (earnings) loss and comprehensive (income) loss.
| (e) |
Determination of control of subsidiaries and joint arrangements |
Judgment is required to determine when the Company has control of subsidiaries or joint control of joint arrangements. This requires an assessment of the relevant activities of the investee, being those activities that significantly affect the investee’s returns (including operating and capital expenditure decision-making, financing of the investee, and the appointment, remuneration, and termination of key management personnel) and when the decisions in relation to those activities are under the control of the Company or require unanimous consent from the investors.
| (f) |
Investments in associates |
The Company conducts a portion of its business through equity interests in associates. An associate is an entity over which the Company has significant influence and is neither a subsidiary nor a joint venture. The Company has significant influence when it has the power to participate in the financial and operating policy decisions of the associate but does not have control or joint control over those policy decisions.
| (g) |
Financial instruments |
Financial instruments are assessed upon initial recognition to determine whether they meet the definition of a financial asset, financial liability, or equity instrument depending on the substance of the contractual arrangement. Judgement is required in making this determination as the substance of a transaction may differ from its legal form. Once a determination is made, IFRS Accounting Standards as issued by the IASB require that financial instruments be measured at fair value on initial recognition. For financial instruments that do not have quoted market prices or observable inputs, judgements are made in determining what are appropriate inputs and assumptions to use in calculating the fair value.
Key sources of estimation uncertainty that have significant risk of causing a material adjustment to the carrying amount of assets and liabilities are as follows:
| (h) |
Reclamation obligations |
Management assesses its reclamation obligations annually and when circumstances suggest that a material change to the obligations have occurred. Significant estimates and assumptions are made in determining the provision for site reclamation and closure because there are numerous factors that will affect the ultimate liability that becomes payable. These factors include estimates of the extent, the timing, and the cost of reclamation activities, regulatory change, cost increases, and changes in discount rates. Those uncertainties may result in actual expenditures differing from the amounts currently provided. The provision at the reporting date represents management’s best estimate of the present value of the future reclamation costs required. Changes to estimated future costs are recognized in the consolidated statements of financial position by adjusting the reclamation asset and liability.
Key assumptions included in the estimate of the reclamation obligations for the Company’s properties in Quebec and Nunavut were as follows:
| Years ended December 31 |
||||||||||||
| 2024 |
2023 |
2022 |
||||||||||
| Risk-free interest rate |
3.23%-3.33 | % | 3.02 | % | 3.28 | % | ||||||
| Annual inflation |
2.29%-2.83 | % | 2.25 | % | 2.50 | % | ||||||
| (i) |
Share-based compensation |
The Company determines the fair value of equity-settled share-based payments using the fair value of the equity instruments at the grant date. For options granted, the Company uses the Black‐Scholes option pricing model. This option pricing model requires the development of market-based subjective inputs, including the risk-free interest rate, expected price volatility, and expected life of the option. Changes in these inputs and the underlying assumption used to develop them can materially affect the fair value estimate.
| (j) |
Deferred tax assets and liabilities |
Management judgment and estimates are required in assessing whether deferred tax assets and deferred tax liabilities are recognized in the consolidated statements of financial position. Judgments are made as to whether future taxable profits will be available in order to recognize deferred tax assets. Assumptions about the generation of future taxable profits depend on management’s estimates of future cash flows. These depend on estimates of future production and sales volumes, commodity prices, reserves, operating costs, and other capital management transactions. These judgments and assumptions are subject to risk and uncertainty, and changes in circumstances may alter expectations which may impact the amount of deferred tax assets and deferred tax liabilities recognized on the consolidated statements of financial position and the benefit of other tax losses and temporary differences not yet recognized.
Note 6: Sale of Homestake Resources
On February 25, 2022, the Company completed the sale of Homestake Resources to Dolly Varden for cash proceeds of $5,000 and 76,504,590 common shares of Dolly Varden (note 1). The Company’s resulting interest in Dolly Varden represented approximately 35.3% of the issued and outstanding common shares of Dolly Varden on February 25, 2022, which has been accounted for using the equity method (note 3). The Company recognized a gain of $48,390, net of transaction costs of $589, on the date of disposition, calculated as follows:
| Total |
||||
| Net assets derecognized: |
||||
| Mineral interests |
$ | 16,460 | ||
| Reclamation bond |
68 | |||
| $ | 16,528 | |||
| Net proceeds: |
||||
| Cash |
$ | 5,000 | ||
| Working capital adjustment |
68 | |||
| 76,504,590 common shares of Dolly Varden |
60,439 | |||
| Transaction costs |
(589 | ) | ||
| $ | 64,918 | |||
| Net gain on disposition |
$ | 48,390 | ||
The fair value of the common shares of Dolly Varden received on date of disposition is based on the market price of the shares at the date of disposition of $0.79 per share.
The Company had sufficient non-capital losses at December 31, 2022 to offset the capital gain arising on disposition of Homestake Resources. As such, there was nil tax payable on the sale of Homestake Resources.
Note 7: Cash and restricted cash
Cash and restricted cash held by the Company were as follows:
| At December 31 |
||||||||
| 2024 |
2023 |
|||||||
| Cash |
$ | 4,912 | $ | 7,313 | ||||
| Restricted cash |
144 | 144 | ||||||
| $ | 5,056 | $ | 7,457 | |||||
Restricted cash includes an amount of $75 ( December 31, 2023 – $75) in connection with an irrevocable standby letter of credit in favor of Kitikmeot Inuit Association in connection with the Company’s Committee Bay project. The balance are mainly GIC’s held with financial institutions as security for the Company credit cards. Restricted cash is classified as a non-current asset and is not available for use within one year of the date of the consolidated statements of financial position.
Note 8: Marketable securities
The marketable securities held by the Company were as follows:
| Total |
||||
| Balance at December 31, 2022 |
$ | 582 | ||
| Additions |
1,619 | |||
| Sale of marketable securities |
(381 | ) | ||
| Realized gain on disposition |
293 | |||
| Unrealized net loss |
(947 | ) | ||
| Balance at December 31, 2023 |
$ | 1,166 | ||
| Additions |
1,300 | |||
| Sale of marketable securities |
(481 | ) | ||
| Realized loss on disposition |
(60 | ) | ||
| Unrealized net gain |
433 | |||
| Balance at December 31, 2024 |
$ | 2,358 | ||
On February 29, 2024, the Company acquired a 10.9% common share ownership of Sirios Resources Inc. (“Sirios”) for $1,300, as part of another transaction (note 11) to consolidate its Éléonore South project ownership. The 30,392,372 Sirios common shares had been acquired for investment purposes and the Company will evaluate its investment in Sirios on an ongoing basis with respect to any possible additional purchases or dispositions, whereupon any such marketable securities transactions are accounted for as of the trade date.
During the first quarter of 2024, Fury Gold sold an aggregate of 1,514,000 Sirios common shares, lowering its holdings to less than 9.9% as at December 31, 2024.
During the year ended December 31, 2023, the Company received 3,500,000 common shares of Ophir Gold Corp in respect of the sale of certain mineral claims in Quebec. Additionally, the Company received 650,000 Q2 Metals Corp common shares as settlement for a royalty extinguishment agreement which had nil carrying value at the time of the transaction as well as 1,237,216 Benz Mining Corp common shares as part of the 3rd option payment for the Eastmain Mine property agreement.
Purchases and sales of marketable securities are accounted for as of the trade date.
Note 9: Other investments
On August 13, 2024, the Company purchased 764,993 Series C Preferred Shares of Alsym Energy Inc. for a total cash purchase price of $2,063. This investment is accounted for as an investment in equity.
This investment is classified as a Level 3 Financial Asset and is accounted for at its fair value and revalued at each reporting date through profit and loss (note 23).
Note 10: Property and equipment
Property and equipment are recorded at cost, and at December 31, 2024 and 2023, were comprised as follows:
| Machinery and equipment |
Office lease |
Other |
Total |
|||||||||||||
| Cost |
||||||||||||||||
| At December 31, 2022 and 2023 |
$ | 2,272 | $ | 531 | $ | 11 | $ | 2,814 | ||||||||
| Additions |
35 | - | - | 35 | ||||||||||||
| At December 31, 2024 |
$ | 2,307 | $ | 531 | $ | 11 | $ | 2,849 | ||||||||
| Accumulated depreciation |
||||||||||||||||
| At December 31, 2022 |
$ | (1,593 | ) | $ | (283 | ) | $ | (7 | ) | $ | (1,883 | ) | ||||
| Depreciation |
(205 | ) | (134 | ) | (4 | ) | (343 | ) | ||||||||
| At December 31, 2023 |
$ | (1,798 | ) | $ | (417 | ) | $ | (11 | ) | $ | (2,226 | ) | ||||
| Depreciation |
(207 | ) | (90 | ) | - | (297 | ) | |||||||||
| At December 31, 2024 |
$ | (2,005 | ) | $ | (507 | ) | $ | (11 | ) | $ | (2,523 | ) | ||||
| Net book value |
||||||||||||||||
| At December 31, 2023 |
$ | 474 | $ | 114 | $ | - | $ | 588 | ||||||||
| At December 31, 2024 |
$ | 302 | $ | 24 | $ | - | $ | 326 | ||||||||
Note 11: Mineral property interests
The Company’s principal resource properties are located in Canada.
Quebec
The Company maintains interests in 12 properties within the James Bay region of Quebec. The three largest projects are:
Eau Claire
The Company owns a 100% interest in the Eau Claire project located immediately north of the Eastmain reservoir, approximately 10 kilometres (km) northeast of Hydro Quebec’s EM-1 hydroelectric power facility, 80 km north of the town of Nemaska, 320 km northeast of the town of Matagami, and 800 km north of Montreal, Quebec. The property consists of map-designated claims totaling approximately 23,000 hectares.
Eastmain Mine
The Eastmain Mine project hosts the Eastmain Mine gold deposit. The past-producing Eastmain Mine project comprises 152 mineral claims and an industrial lease. Located on the eastern most part of the Upper Eastmain River Greenstone Belt of the James Bay District of northern Quebec, the property covers approximately 80 km2 of highly prospective terrain.
In 2019, Benz Mining entered into an option agreement with Eastmain to allow Benz Mining the option to earn a 75% interest in certain Eastmain Mine property in return for making option payments of $2,320 between October 2019 and October 2023, and incurring exploration expenditures of $3,500 on the property. The option payments may be settled in both cash and shares. This option agreement was subsequently amended in April 2020 to grant Benz Mining the option to earn up to 100% of the Ruby Hill properties located to the west of the Eastmain Mine project. The Company would retain 1-2% net smelter royalties in respect of the properties following completion of the option agreement requirements. During November 2023 the Company received $1,350 in cash and $396 worth of Benz Mining common shares to finalize the 75% interest acquisition. After completion of the 75% acquisition, Benz Mining may acquire the remaining 25% interest upon payment of $1,000 upon closing of project financing, and $1,500 upon commencement of commercial production.
Éléonore South
The Éléonore South project consists of two separate blocks of map-designated claims, comprising a total of 282 claims covering approximately 147 km2 of the Opinaca area of James Bay, Quebec. The Éléonore West block consists of 34 mineral claims covering approximately 18 km2, while the Éléonore South block contains 248 claims extending over an area of approximately 130 km2. The project was a joint operation, and the project ownership was based on participation in the funding of annual exploration programs. At December 31, 2023, the project was held by the partners approximately as follows: Fury Gold 50.022% and Newmont 49.978%. The Company was the operator of the project.
On February 29, 2024, the Company and Newmont, through their respective subsidiaries, entered into a new agreement whereby the Company acquired 100% control of the interests, consolidating these properties into the Company’s portfolio.
Nunavut
Committee Bay
The Company, through its wholly owned subsidiary North Country, owns a 100% interest in the Committee Bay project located in Nunavut, Canada. The Committee Bay project includes approximately 250,000 hectares situated along the Committee Bay Greenstone Belt located within the Western Churchill province of Nunavut. The Committee Bay project is subject to a 1% Net Smelter Royalty (“NSR”) on gold production, with certain portions subject to an additional 1.5% NSR. The 1.5% NSR is payable on only 7,596 hectares and can be purchased by the Company within two years of commencement of commercial production for $2,000 for each one-third (0.5%) of the 1.5% NSR.
Gibson MacQuoid
In 2017, the Company acquired a number of prospecting permits and mineral claims along the Gibson MacQuoid Greenstone Belt in Nunavut, Canada. In 2019, the Company staked additional claims, which overlapped the Company’s prospecting claims that expired in February 2020, to maintain a contiguous land package over the Company’s current areas of interest. The Company’s claims, which are located between the Meliadine deposit and Meadowbank mine, cover approximately 120 km of strike length of the prospective greenstone belt and total 51,622 hectares collectively.
A summary of the carrying amounts is as follows:
| Quebec |
Nunavut |
Total |
||||||||||
| Balance at December 31, 2022 |
$ | 125,656 | $ | 19,534 | $ | 145,190 | ||||||
| Option payment received |
(880 | ) | - | (880 | ) | |||||||
| Disposition |
(1,746 | ) | - | (1,746 | ) | |||||||
| Change in estimate of provision for site reclamation and closure (note 14) |
(52 | ) | 127 | 75 | ||||||||
| Balance at December 31, 2023 |
$ | 122,978 | $ | 19,661 | $ | 142,639 | ||||||
| Additions(a) |
3,030 | - | 3,030 | |||||||||
| Change in estimate of provision for site reclamation and closure (note 14) |
(23 | ) | 427 | 404 | ||||||||
| Impairment |
(88,885 | ) | (11,988 | ) | (100,873 | ) | ||||||
| Balance at December 31, 2024 |
$ | 37,100 | $ | 8,100 | $ | 45,200 | ||||||
(a) On February 29, 2024, the Company, and its joint operation partner Newmont, through their respective subsidiaries, closed a transaction whereby the Company acquired 100% control of the joint operation interests, the Éléonore South project, consolidating these properties into the Company’s portfolio at which time the joint venture operation was dissolved. The 49.978% that Newmont held was acquired by the Company for $3,000 while incurring $30 in transaction costs. As part of the same transaction, the Company also acquired a 10.9% interest in Sirios, as disclosed in note 8.
During the year ended December 31, 2023, the Company received settlement for the sale of claims, certain common shares of publicly traded entities. These have been classified as marketable securities (note 8).
On December 12, 2022, the Company entered into an Option Agreement (“the Ophir Agreement”), pursuant to which Ophir Gold Corp. (the “Optionee”) would acquire a 100% interest in the Radis Property through payment of certain cash and common shares over a three-year period, payments of which may be accelerated by the Optionee. The Company shall retain a 2% NSR on the property, three-quarters of which may be purchased by the Optionee for $1,500. The Agreement was subject to certain closing conditions, which were met on January 25, 2023. The first option payment, comprising a cash payment of $50 and 2,500,000 common shares of Ophir Gold with a fair value of $625, was received upon closing, while the second option payment was received during December 2023 comprising of $75 cash and 1,000,000 common shares with a fair value of $130 upon date of receipt for a total of $880. The common shares of Ophir Gold have been classified as marketable securities (note 3). During November 2024, prior to the receipt of the third option payment, the Optionee informed the Company that it is terminating the agreement.
On August 16, 2023, the Company entered into a royalty extinguishment agreement whereby certain Eastmain net smelter royalties of the Mia project were extinguished in exchange for marketable securities to the value of $468 as at the date of the agreement.
In November 2023, the Company received the final option payment of $1,725, comprising of $1,350 cash and 1,237,216 shares with a fair value upon date of receipt of $396 for a total of $1,746, from Benz Mining in respect of the option agreement to acquire 75% of certain Eastmain Mine properties and Ruby Hill properties. The transfer of the 75% ownership was accepted by the Resource Minister of Quebec on January 17, 2025.
The Company’s market capitalization has persistently been below the carrying value of its mineral properties over the last few years, and, as a consequence, the Company engaged a third-party valuation specialist to conduct a review to determine a more reflective carrying value. As a result, the report recommended an impairment charge to these properties, to better align with the market capitalization value (note 16).
Note 12: Investments in associates
| (a) |
Summarized financial information of the Company’s investments in associates: |
The carrying amounts of the Company’s investments in associates were as follows:
| Dolly Varden |
UMS |
Total |
||||||||||
| Carrying amount at December 31, 2022 |
$ | 42,303 | $ | 127 | $ | 42,430 | ||||||
| Company’s share of net loss of associates |
(6,177 | ) | (5 | ) | (6,182 | ) | ||||||
| Carrying amount at December 31, 2023 |
$ | 36,126 | $ | 122 | $ | 36,248 | ||||||
| Company’s share of net loss of associates |
(3,837 | ) | (21 | ) | (3,858 | ) | ||||||
| Disposition |
(5,017 | ) | - | (5,017 | ) | |||||||
| Dilution gain |
2,083 | - | 2,083 | |||||||||
| Carrying amount at December 31, 2024 |
$ | 29,355 | $ | 101 | $ | 29,456 | ||||||
The quoted fair market value of the Company’s equity interest in Dolly Varden at December 31, 2024 was $49,012 ( December 31, 2023 - $51,769) based on the closing share price on the TSX Venture Exchange on that date.
During the year ended December 31, 2024 the Company sold an aggregate of 8,450,000 shares of Dolly Varden for net proceeds of $7,042. The Company’s investment was also diluted through financing rounds by Dolly Varden in which the Company did not participate. As a results, the Company had a Gain on investments of $4,109 consisting of a realized gain on disposal of $2,026 and a gain on dilution of $2,083.
On October 13, 2022, the Company completed the sale of 17,000,000 common shares of Dolly Varden, comprising 22.2% of the Company’s equity interest in Dolly Varden acquired as part of the disposition of Homestake Resources (note 1), for total gross proceeds of $6,800. As at September 30, 2022, the sale was considered highly probable; therefore, the partial investment in associate represented by the 17,000,000 common shares was classified as an asset held for sale. The Company remeasured the carrying amount of the shares held for sale as the lower of cost and FVLCD and recognized an impairment expense of $5,506 in respect of the disposal.
A reconciliation of the impairment expense is as follows:
| Carrying amount, investment in Dolly Varden |
$ | 55,265 | ||
| Equity interest transferred to held for sale |
22.2 | % | ||
| Carrying amount transferred to asset held for sale |
12,280 | |||
| Less: FVLCD |
(6,774 | ) | ||
| Impairment expense recognized |
$ | 5,506 |
For the year ended December 31, 2024, the Company’s equity share of net loss of the Company’s associates on a 100% basis were as follows:
| Dolly Varden |
UMS |
Total |
||||||||||
| Cost recoveries |
$ | - | $ | (3,508 | ) | $ | (3,508 | ) | ||||
| Exploration and evaluation |
17,875 | 1,208 | 19,083 | |||||||||
| Marketing |
1,781 | 131 | 1,912 | |||||||||
| Share-based compensation |
2,601 | - | 2,601 | |||||||||
| Administrative and other |
(1,608 | ) | 2,255 | 647 | ||||||||
| Net loss of associate, 100% |
20,649 | 86 | 20,735 | |||||||||
| Average equity interest for the period |
18.58 | % | 25 | % | ||||||||
| Company’s share of net loss of associates |
$ | 3,837 | $ | 21 | $ | 3,858 | ||||||
For the year ended December 31, 2023, the Company’s equity share of net loss of the Company’s associates on a 100% basis were as follows:
| Dolly Varden |
UMS |
Total |
||||||||||
| Cost recoveries |
$ | - | $ | (5,517 | ) | $ | (5,517 | ) | ||||
| Exploration and evaluation |
24,806 | 1,907 | 26,713 | |||||||||
| Marketing |
1,409 | 464 | 1,873 | |||||||||
| Share-based compensation |
1,971 | - | 1,971 | |||||||||
| Administrative and other |
(1,536 | ) | 3,166 | 1,630 | ||||||||
| Net loss of associate, 100% |
26,650 | 20 | 26,670 | |||||||||
| Average equity interest for the period |
23.18 | % | 25 | % | ||||||||
| Company’s share of net loss of associates |
$ | 6,177 | $ | 5 | $ | 6,182 | ||||||
For the year ended December 31, 2022, the Company’s equity share of net loss of the Company’s associates on a 100% basis were as follows:
| Dolly Varden |
UMS |
Total |
||||||||||
| Cost recoveries |
$ | - | $ | (4,412 | ) | $ | (4,412 | ) | ||||
| Exploration and evaluation |
16,936 | 1,642 | 18,578 | |||||||||
| Marketing |
1,057 | 312 | 1,369 | |||||||||
| Share-based compensation |
1,786 | 2,433 | 4,219 | |||||||||
| Administrative and other |
(508 | ) | 121 | (387 | ) | |||||||
| Net loss of associate, 100% |
19,271 | 96 | 19,367 | |||||||||
| Average equity interest for the year |
30.4 | % | 25 | % | ||||||||
| Company’s share of net loss of associates |
$ | 5,856 | $ | 24 | $ | 5,880 | ||||||
The Company’s equity share of net assets of associates at December 31, 2024, is as follows:
| Dolly Varden |
UMS |
|||||||
| Current assets |
$ | 34,573 | $ | 934 | ||||
| Non-current assets |
151,170 | 2,043 | ||||||
| Current liabilities |
(4,400 | ) | (1,345 | ) | ||||
| Non-current liabilities |
- | (1,231 | ) | |||||
| Net assets, 100% |
181,343 | 401 | ||||||
| Company’s equity share of net assets of associate |
$ | 29,355 | $ | 101 | ||||
The Company’s equity share of net assets of associates at December 31, 2023, is as follows:
| Dolly Varden |
UMS |
|||||||
| Current assets |
$ | 11,468 | $ | 844 | ||||
| Non-current assets |
153,296 | 2,468 | ||||||
| Current liabilities |
(804 | ) | (1,484 | ) | ||||
| Non-current liabilities |
- | (1,340 | ) | |||||
| Net assets, 100% |
163,960 | 488 | ||||||
| Company’s equity share of net assets of associate |
$ | 36,126 | $ | 122 | ||||
| (b) |
Services rendered and balances with UMS |
| Years ended December 31 |
||||||||||||
| 2024 |
2023 |
2022 |
||||||||||
| Exploration and evaluation costs |
$ | 233 | $ | 872 | $ | 590 | ||||||
| General and administration |
307 | 714 | 841 | |||||||||
| Total transactions for the year |
$ | 540 | $ | 1,586 | $ | 1,431 | ||||||
The outstanding balance owing at December 31, 2024 was $90 ( December 31, 2023 – $103, December 31, 2022 – $240) which is included in accounts payable.
As part of the UMS arrangement, the Company is contractually obliged to pay certain rental expenses in respect of a ten-year office lease entered into by UMS on July 1, 2021. As at December 31, 2024, the Company expects to incur approximately $91 in respect of its share of future rental expense of UMS.
The Company issues share options to certain UMS employees, including key management personnel of the Company (note 20). The Company recognized a share-based compensation recovery of $3 for the year ended December 31, 2024, in respect of share options issued to UMS employees ( December 31, 2023 - $317 expense, December 31, 2022 - $483 expense) which is included within employee benefits and exploration and evaluation costs.
Note 13: Flow-through share premium liability
Flow-through shares are issued at a premium, calculated as the difference between the price of a flow-through share and the price of a common share at that date. Tax deductions generated by eligible expenditures are passed through to the shareholders of the flow-through shares once the eligible expenditures are incurred and renounced.
On March 23, 2023, the Company completed an offering (note 18) and raised $8,750 through the issuance of 6,076,500 common shares designated as flow-through shares. The flow-through proceeds were used for mineral exploration in Quebec.
On June 13, 2024, the Company completed an offering (note 18) and raised $5,001 through the issuance of 5,320,000 common shares designated as flow-through shares. The flow-through proceeds will be used for mineral exploration in Quebec. The Company is committed to incur the full exploration expenditures of $5,001 before December 31, 2025.
The flow-through share funding and expenditures along with the corresponding impact on the flow-through share premium liability were as follows:
| Flow-through funding (expenditures) |
Flow-through premium liability |
|||||||
| Balance at December 31, 2021 |
$ | 7,290 | $ | 3,124 | ||||
| Flow-through eligible expenditures |
(7,290 | ) | (3,124 | ) | ||||
| Balance at December 31, 2022 |
$ | - | $ | - | ||||
| Flow-through funds raised |
8,750 | 3,889 | ||||||
| Flow-through eligible expenditures |
(7,527 | ) | (3,345 | ) | ||||
| Balance at December 31, 2023 |
$ | 1,223 | $ | 544 | ||||
| Flow-through eligible expenditures |
(1,223 | ) | (544 | ) | ||||
| Flow-through funds raised |
5,001 | 2,022 | ||||||
| Flow-through eligible expenditures |
(2,666 | ) | (1,078 | ) | ||||
| Balance at December 31, 2024 |
$ | 2,335 | $ | 944 | ||||
Note 14: Provision for site reclamation and closure
The Company recognizes a provision for site reclamation and closure, which reflects the present value of the estimated amount of cash flows required to satisfy the asset retirement obligation in respect of the Committee Bay and Quebec properties. The components of this obligation are the removal of equipment currently being used at the site as well as costs associated with the reclamation of the camp housing and work sites on the property. The estimate of future asset retirement obligations is subject to change based on amendments to applicable laws, management’s intentions, and mining lease renewals.
The key assumptions used to calculate the present value of the future estimated cash flows of the Company’s projects are as follows:
| ■ |
Undiscounted cash flow obligation for site reclamation of $7,013 ( December 31, 2023 – $6,246, December 31, 2022 – $6,065); |
| ■ |
Expected timing of future cash flows which is between the years 2026 and 2041; |
| ■ |
Annual inflation rates of 2.29% and 2.83% ( December 31, 2023 – 2.25 and 2.61%, December 31, 2022 – 2.5%); and |
| ■ |
Risk-free interest rates of 3.33% and 3.23% ( December 31, 2023 – 3.02%, December 31, 2022 – 3.28%). |
The present value of the liability for the site reclamation and closure provision for the Company’s projects was as follows:
| Quebec |
Nunavut |
Total |
||||||||||
| Balance at December 31, 2022 |
$ | 1,567 | $ | 2,704 | $ | 4,271 | ||||||
| Accretion |
54 | 94 | 148 | |||||||||
| Change in estimate |
(52 | ) | 128 | 76 | ||||||||
| Balance at December 31, 2023 |
$ | 1,569 | $ | 2,926 | $ | 4,495 | ||||||
| Accretion |
50 | 96 | 146 | |||||||||
| Change in estimate |
(23 | ) | 427 | 404 | ||||||||
| Balance at December 31, 2024 |
$ | 1,596 | $ | 3,449 | $ | 5,045 | ||||||
Note 15: Exploration and evaluation costs
For the years ended December 31, 2024, the Company’s exploration and evaluation costs were as follows:
| Quebec |
Nunavut |
Total |
||||||||||
| Assaying |
$ | 874 | $ | 100 | $ | 974 | ||||||
| Exploration drilling |
843 | - | 843 | |||||||||
| Camp cost, equipment and field supplies |
651 | 203 | 854 | |||||||||
| Geological consulting services |
7 | 51 | 58 | |||||||||
| Permitting, environmental and community costs |
122 | 172 | 294 | |||||||||
| Expediting and mobilization |
- | 22 | 22 | |||||||||
| Salaries and wages |
1,403 | 70 | 1,473 | |||||||||
| Fuel and consumables |
182 | 10 | 192 | |||||||||
| Aircraft and travel |
456 | 208 | 664 | |||||||||
| Share-based compensation |
128 | 10 | 138 | |||||||||
| Total for year ended December 31, 2024 |
$ | 4,666 | $ | 846 | $ | 5,512 | ||||||
For the years ended December 31, 2023, the Company’s exploration and evaluation costs were as follows:
| Quebec |
Nunavut |
Total |
||||||||||
| Assaying |
$ | 1,538 | $ | 44 | $ | 1,582 | ||||||
| Exploration drilling |
2,250 | - | 2,250 | |||||||||
| Camp cost, equipment and field supplies |
936 | 194 | 1,130 | |||||||||
| Geological consulting services |
7 | 16 | 23 | |||||||||
| Geophysical analysis |
165 | - | 165 | |||||||||
| Permitting, environmental and community costs |
235 | 158 | 393 | |||||||||
| Expediting and mobilization |
17 | - | 17 | |||||||||
| Salaries and wages |
1,987 | 23 | 2,010 | |||||||||
| Fuel and consumables |
481 | - | 481 | |||||||||
| Aircraft and travel |
784 | (1 | ) | 783 | ||||||||
| Share-based compensation |
465 | 12 | 477 | |||||||||
| Total for year ended December 31, 2023 |
$ | 8,865 | $ | 446 | $ | 9,311 | ||||||
For the years ended December 31, 2022, the Company’s exploration and evaluation costs were as follows:
| Quebec |
Nunavut |
British Columbia |
Total |
|||||||||||||
| Assaying |
$ | 1,638 | $ | 50 | $ | 2 | $ | 1,690 | ||||||||
| Exploration drilling |
1,768 | - | - | 1,768 | ||||||||||||
| Camp cost, equipment and field supplies |
844 | 193 | 10 | 1,047 | ||||||||||||
| Geological consulting services |
50 | 13 | - | 63 | ||||||||||||
| Geophysical analysis |
127 | - | - | 127 | ||||||||||||
| Permitting, environmental and community costs |
163 | 164 | - | 327 | ||||||||||||
| Expediting and mobilization |
12 | - | - | 12 | ||||||||||||
| Salaries and wages |
2,330 | 45 | 1 | 2,376 | ||||||||||||
| Fuel and consumables |
537 | - | - | 537 | ||||||||||||
| Aircraft and travel |
768 | 21 | - | 789 | ||||||||||||
| Share-based compensation |
471 | 9 | 1 | 481 | ||||||||||||
| Total for year ended December 31, 2022 |
$ | 8,708 | $ | 495 | $ | 14 | $ | 9,217 | ||||||||
Note 16: Impairment
A summary of the Company’s impairment expenses is as follows:
| Years ended December 31 |
||||||||||||
| 2024 |
2023 |
2022 |
||||||||||
| Impairment on mineral properties interests |
$ | 100,873 | $ | - | $ | - | ||||||
| Impairment on assets held for sale |
- | - | 5,506 | |||||||||
| Total transactions for the year |
$ | 100,873 | $ | - | $ | 5,506 | ||||||
As required under IFRS Accounting Standards as issued by the IASB, we regularly assess whether impairment indicators are present and perform impairment testing as required.
In accordance with the Company’s accounting policies and processes, each asset or CGU is evaluated annually, to determine whether there are any indications of impairment or impairment reversal. If any such indications of impairment exist, a formal estimate of the recoverable amount is performed. Given the Company’s persistent lower market capitalization compared to its mineral properties carrying value, the Company engaged a third-party valuation specialist, in consultation with management, to assess the recoverability of the carrying value of the Company’s properties. The Company assessed the recoverable value of the CGUs based on its fair value less cost of disposal (“FVLCD”).
The Company utilized a market approach, which takes into account valuations of similar public companies and comparable transactions, to determine a recoverable amount. The recoverable amount was calculated using in situ multiples identified through independent research. This analysis along with specific attributes of the Eau Claire and Committee Bay Project was used as the basis of determining a reasonable per ounce valuation for these to projects. The Éléonore South Project which does not yet have a Mineral Resource Estimate, was valued through a primary market approach, based on its recent acquisition by the Company. The CGUs were categorised within the Level 3 of the fair value hierarchy, using a combination of inputs other than quoted prices which were observable and unobservable to determine the fair value of the assets.
Based on the Company’s assessment with respect to possible indicators of impairment, the Company concluded that as at December 31, 2024 impairment indicators exist and based on the impairment analysis performed, an impairment on its Eau Claire project of $89,263 and Committee Bay project of $11,610 totaling $100,873 was recorded. Estimating the in-situ multiples requires a significant management judgement due to the high degree of estimation uncertainty. Changes in the inputs used to determine the recoverable amount will result in a change to the valuation of the mineral properties and impairment expense. A 15% change in the in-situ values used, would give rise to a 13% change in the mineral properties values.
The result of the impairment better aligns the carrying value of these properties to the Company’s market capitalization value as per the guidance of IFRS 6.20(d).
Note 17: Other income
| Years ended December 31 |
||||||||||||
| 2024 |
2023 |
2022 |
||||||||||
| Excess fuel resold |
$ | 566 | $ | - | $ | - | ||||||
| Flow-through investors liability reversal |
- | - | 91 | |||||||||
| Total transactions for the year |
$ | 566 | $ | - | $ | 91 | ||||||
Note 18: Share capital
| (a) |
Authorized |
Unlimited common shares without par value.
Unlimited preferred shares – nil issued and outstanding.
| (b) |
Share issuances |
During the year ended December 31, 2024:
During June 2024, the Company issued 5,320,000 flow-through shares for gross proceeds of $5,001 ( “June 2024 Offering”). Share issue costs related to the June 2024 Offering totaled $533, which included $300 in commissions and $233 in other issuance costs. A reconciliation of the impact of the June 2024 Offering on share capital is as follows:
| Number of common shares |
Impact on share capital |
|||||||
| Flow-through shares issued at $0.94 per share |
5,320,000 | $ | 5,001 | |||||
| Cash share issue costs |
- | (533 | ) | |||||
| Proceeds net of share issue costs |
5,320,000 | 4,468 | ||||||
| Less: flow-through share premium liability (note 13) |
- | (2,022 | ) | |||||
| Total allocated to share capital |
5,320,000 | $ | 2,446 | |||||
During the year ended December 31, 2023:
The Company closed the “March 2023 Offering”, issuing 6,076,500 flow-through common shares for gross proceeds of $8,750. Share issue costs related to the March 2023 Offering totaled $912, which included $525 in commissions and $387 in other issuance costs. A reconciliation of the impact of the March 2023 Offering on share capital is as follows:
| Number of common shares |
Impact on share capital |
|||||||
| Flow-through shares issued at $1.44 per share |
6,076,500 | $ | 8,750 | |||||
| Cash share issue costs |
- | (912 | ) | |||||
| Proceeds net of share issue costs |
6,076,500 | $ | 7,838 | |||||
| Less: flow-through share premium liability (note 13) |
- | (3,889 | ) | |||||
| Total allocated to share capital |
6,076,500 | $ | 3,949 | |||||
During the year ended December 31, 2022:
The Company closed the “April 2022 Offering”, a non-brokered private equity placement, for gross proceeds of $11,000 which consisted of 13,750,000 common shares priced at $0.80 per share. Proceeds from the Private Placement were used to fund exploration at the Company’s Eau Claire project in Quebec and for general working capital.
Share issue costs related to the April 2022 Offering totaled $136. A reconciliation of the impact of the private placement on share capital is as follows:
| Number of common shares |
Impact on share capital |
|||||||
| Common shares issued at $0.80 per share |
13,750,000 | $ | 11,000 | |||||
| Cash share issue costs |
- | (136 | ) | |||||
| Proceeds net of share issue costs |
13,750,000 | $ | 10,864 | |||||
Note 19: Share-based compensation and warrant reserve
| (a) |
Share-based compensation expense |
The Company uses the fair value method of accounting for all share-based payments to directors, officers, employees, and other service providers. During the years ended December 31, 2024, 2023, and 2022, the Company recognized share-based compensation expense as follows:
| Years ended December 31 |
||||||||||||
| 2024 |
2023 |
2022 |
||||||||||
| Recognized in net loss (earnings) and included in: |
||||||||||||
| Exploration and evaluation costs |
$ | 138 | $ | 477 | $ | 481 | ||||||
| Fees, salaries and other employee benefits |
721 | 874 | 1,188 | |||||||||
| Total share-based compensation expense |
$ | 859 | $ | 1,351 | $ | 1,669 | ||||||
During the year ended December 31, 2024, the Company granted 245,000 share options ( December 31, 2023 – 3,134,800) to directors, officers, employees, and certain consultants who provide certain on-going services to the Company, representative of employee services. Certain of the Company’s executive officer option grants were subject to vesting restrictions, representing certain performance measures, which were met during the year ended December 31, 2024 and an expense of $177 was recognized ( December 31, 2023 and 2022 - $nil).
The weighted average fair value per option of these share options was calculated as $0.31 ( December 31, 2023 – $0.47, December 31, 2022 – $0.46) using the Black-Scholes option valuation model at the grant date.
In addition to options, the Company also granted RSU’s during the year ended December 31, 2024 to officers and employees (note 18(b)).
The fair value of the share-based options granted during the years ended December 31, 2024, 2023 and 2022 was estimated using the Black-Scholes option valuation model with the following weighted average assumptions:
| Years ended December 31 |
||||||||||||
| 2024 |
2023 |
2022 |
||||||||||
| Risk-free interest rate |
3.45 | % | 3.06 | % | 2.20 | % | ||||||
| Expected dividend yield |
Nil |
Nil |
Nil |
|||||||||
| Share price volatility |
70 | % | 68 | % | 67 | % | ||||||
| Expected forfeiture rate |
12.2 | % | 4.7 | % | 2.5 | % | ||||||
| Expected life in years |
5.0 | 5.0 | 5.0 | |||||||||
The risk-free interest rate assumption is based on the Government of Canada benchmark bond yields and treasury bills with a remaining term that approximates the expected life of the share-based options. The expected volatility assumption is based on the historical and implied volatility of the Company’s common shares. The expected forfeiture rate and the expected life in years are based on historical trends.
| (b) |
Long-term incentive plan |
On June 29, 2023, the Company adopted a Long-Term Incentive Plan (“LTI Plan”) which strives to accelerate and encourage additional share ownership by its employees, officers and directors. The LTI plan provides for the awarding of share options, performance share units, restricted share units and deferred share units. The LTI Plan limits the number of shares reserved for issuance under the LTI Plan, together with all other security-based compensation arrangements of the Company, to a maximum of 10% of the Common Shares issued and outstanding.
The number of share options issued and outstanding and the weighted average exercise price were as follows:
| Number of share options |
Weighted average exercise price ($/option) |
|||||||
| Outstanding, December 31, 2022 |
8,880,324 | $ | 1.44 | |||||
| Granted |
3,134,800 | 0.80 | ||||||
| Expired |
(1,672,087 | ) | 1.58 | |||||
| Forfeited |
(391,435 | ) | 0.95 | |||||
| Outstanding, December 31, 2023 |
9,951,602 | $ | 1.23 | |||||
| Granted |
245,000 | 0.56 | ||||||
| Expired |
(472,937 | ) | 1.92 | |||||
| Forfeited |
(1,502,487 | ) | 1.40 | |||||
| Outstanding, December 31, 2024 |
8,221,178 | $ | 1.14 | |||||
As at December 31, 2024, the number of share options outstanding was as follows:
| Options outstanding |
Options exercisable |
||||||||||||||||||||||||
| Exercise price ($/option) |
Number of shares |
Weighted average exercise price ($/option) |
Weighted average remaining life (years) |
Number of shares |
Weighted average exercise price ($/option) |
Weighted average remaining life (years) |
|||||||||||||||||||
| $0.53 – $1.00 |
3,900,506 | 0.82 | 2.74 | 3,776,631 | 0.83 | 2.69 | |||||||||||||||||||
| $1.00 – $1.85 |
2,800,672 | 1.09 | 2.03 | 2,800,672 | 1.09 | 2.03 | |||||||||||||||||||
| $2.05 | 1,520,000 | 2.05 | 0.80 | 1,520,000 | 2.05 | 0.80 | |||||||||||||||||||
| 8,221,178 | 1.14 | 2.14 | 8,097,303 | 1.15 | 2.11 | ||||||||||||||||||||
On January 9, 2024, the Company issued 1,318,623 RSU’s to directors, officers, and employees. The RSU’s were issued in accordance with the Company’s LTI plan, one third vesting annually on the anniversary and paid out as fully paid shares. The Company also approved 235,080 RSU’s to directors vesting quarterly in 2024. These RSU’s are fully vested and paid out as fully paid shares in 2024.
On January 31, 2024, the Company issued 273,542 RSU’s to an officer. The RSU’s were issued in accordance with the Company’s LTI plan, which vested on the same day and paid out as fully paid shares.
The number of RSU’S issued and outstanding and the weighted average grant date fair value were as follows:
| Number of RSU’s |
Weighted Average grant date fair value ($/ share) |
|||||||
| Outstanding, December 31, 2022 |
- | $ | - | |||||
| Granted |
197,345 | 0.60 | ||||||
| Settled |
(197,345 | ) | 0.60 | |||||
| Outstanding, December 31, 2023 |
- | $ | - | |||||
| Granted |
1,827,245 | 0.57 | ||||||
| Settled |
(491,478 | ) | 0.59 | |||||
| Forfeited |
(189,687 | ) | 0.57 | |||||
| Outstanding, December 31, 2024 |
1,146,080 | $ | 0.57 | |||||
| (c) |
Share purchase warrants |
The number of share purchase warrants outstanding at December 31, 2024 was as follows:
| Warrants outstanding |
Exercise price ($/share) |
|||||||
| Outstanding, December 31, 2022 and 2023 |
7,461,450 | $ | 1.20 | |||||
| Expired |
(7,461,450 | ) | 1.20 | |||||
| Outstanding, December 31, 2024 |
- | - | ||||||
Note 20: Key management personnel
Key management personnel include Fury Gold’s board of directors and certain executive officers of the Company, including the CEO, Chief Financial Officer (“CFO”) and Senior Vice President, Exploration.
The remuneration of the Company’s key management personnel was as follows:
| Years ended December 31 |
||||||||||||
| 2024 |
2023 |
2022 |
||||||||||
| Short-term benefits provided to executives (a) |
$ | 1,306 | $ | 1,109 | $ | 1,719 | ||||||
| Directors’ fees paid to non-executive directors |
161 | 289 | 203 | |||||||||
| Share-based payments |
724 | 1,013 | 1,059 | |||||||||
| Total |
$ | 2,191 | $ | 2,411 | $ | 2,981 | ||||||
(a) Short-term employee benefits include salaries, bonuses payable within twelve months of the date of the consolidated statements of financial position, and other annual employee benefits.
Note 21: Supplemental cash flow information
The impact of changes in non-cash working capital was as follows:
| Years ended December 31 |
||||||||||||
| 2024 |
2023 |
2022 |
||||||||||
| Accounts receivable |
$ | 321 | $ | (5 | ) | $ | (47 | ) | ||||
| Prepaid expenses and deposits |
104 | (59 | ) | (94 | ) | |||||||
| Accounts payable and accrued liabilities |
(15 | ) | (120 | ) | (762 | ) | ||||||
| Changes in non-cash working capital |
$ | 410 | $ | (184 | ) | $ | (903 | ) | ||||
Operating activities include the following cash received:
| Years ended December 31 |
||||||||||||
| 2024 |
2023 |
2022 |
||||||||||
| Income taxes refunded |
$ | (193 | ) | $ | (307 | ) | $ | (187 | ) | |||
| Income taxes paid |
- | 18 | - | |||||||||
| Income tax expense (recovery) |
$ | (193 | ) | $ | (289 | ) | $ | (187 | ) | |||
Note 22: (Earnings) loss per share
For the years ended December 31, 2024, 2023, and 2022, the weighted average number of shares outstanding and (earnings) loss per share were as follows:
| Years ended December 31 |
||||||||||||
| 2024 |
2023 |
2022 |
||||||||||
| Net loss (earnings) |
$ | 108,138 | $ | 17,213 | $ | (24,908 | ) | |||||
| Weighted average basic number of shares outstanding |
149,019,020 | 144,184,481 | 139,470,950 | |||||||||
| Basic loss (earnings) per share |
$ | 0.73 | $ | 0.12 | $ | (0.18 | ) | |||||
| Weighted average diluted number of shares outstanding |
149,019,020 | 144,184,481 | 139,481,236 | |||||||||
| Diluted loss (earnings) per share |
$ | 0.73 | $ | 0.12 | $ | (0.18 | ) | |||||
Diluted net loss per share excludes, when applicable, the potential impact of stock options and other unvested stock because their effect would be anti-dilutive due to the net loss. The Company reported a loss for the years ended December 31, 2024, 2023, the numbers of dilutive shares were 9,367,258 and 17,413,052 respectively for these years.
Note 23: Financial instruments
The Company’s financial instruments as at December 31, 2024, consisted of cash, marketable securities, accounts receivable, other investments, deposits, and accounts payable and accrued liabilities. The fair values of these financial instruments approximate their carrying values, unless otherwise noted.
| (a) |
Financial assets and liabilities by categories |
| At December 31, 2024 |
At December 31, 2023 |
|||||||||||||||||||||||
| Amortized Cost |
FVTPL |
Total |
Amortized Cost |
FVTPL |
Total |
|||||||||||||||||||
| Cash |
$ | 4,912 | $ | - | $ | 4,912 | $ | 7,313 | $ | - | $ | 7,313 | ||||||||||||
| Marketable securities |
- | 2,358 | 2,358 | - | 1,166 | 1,166 | ||||||||||||||||||
| Other investments |
- | 2,063 | 2,063 | - | - | - | ||||||||||||||||||
| Deposits |
191 | - | 191 | 100 | - | 100 | ||||||||||||||||||
| Accounts receivable |
54 | 54 | 374 | - | 374 | |||||||||||||||||||
| Total financial assets |
$ | 5,157 | $ | 4,421 | $ | 9,578 | $ | 7,787 | $ | 1,166 | $ | 8,953 | ||||||||||||
| Accounts payable and accrued liabilities |
855 | - | 855 | 1,034 | - | 1,034 | ||||||||||||||||||
| Total financial liabilities |
$ | 855 | $ | - | $ | 855 | $ | 1,034 | $ | - | $ | 1,034 | ||||||||||||
| (b) |
Financial assets and liabilities measured at fair value |
The categories of the fair value hierarchy that reflect the significance of inputs used in making fair value measurements are as follows:
Level 1 – fair values based on unadjusted quoted prices in active markets for identical assets or liabilities;
Level 2 – fair values based on inputs that are observable for the asset or liability, either directly or indirectly; and
Level 3 – fair values based on inputs for the asset or liability that are not based on observable market data.
The Company’s policy to determine when a transfer occurs between levels is to assess the impact at the date of the event or the change in circumstances that could result in a transfer. No transfers occurred between the levels during the year.
As at December 31, 2024, the Company’s financial instruments measured at fair value on a recurring basis were the Company’s marketable securities which were classified as Level 1, and other investments which were classified as Level 3. There were no financial assets or financial liabilities measured and recognized in the consolidated statements of financial position at fair value that would be categorized as level 2 in the fair value hierarchy.
The Company’s financial instruments measured at fair value on a recurring basis were as follows:
| At December 31 |
||||||||||||
| 2024 |
2023 |
|||||||||||
| Level 1 |
Level 3 |
Level 1 |
||||||||||
| Marketable securities |
$ | 2,358 | - | $ | 1,166 | |||||||
| Other investments |
- | $ | 2,063 | - | ||||||||
Other investments categorized within Level 3 of the fair value hierarchy is an investment in equity and measured subsequently at FVTPL.
During the years ended December 31, 2023, there were no financial assets or financial liabilities measured and recognized on the consolidated statements of financial position at fair value that would be categorized as level 2 or 3 in the fair value hierarchy.
| (c) |
Financial instruments and related risks |
The Company’s financial instruments are exposed to liquidity risk, credit risk and market risks, which include currency risk, interest rate risk and price risk. As at December 31, 2024, the primary risks were as follows:
Liquidity risk
Liquidity risk is the risk that the Company will encounter difficulty in meeting obligations associated with financial liabilities. The Company proactively manages its capital resources and has in place a budgeting and cash management process to help determine the funds required to ensure the Company has the appropriate liquidity to meet its current exploration plans and achieve its growth objectives. The Company ensures that there is sufficient liquidity available to meet its short-term business requirements, taking into account its anticipated cash outflows from exploration activities, and its holdings of cash and marketable securities. The Company monitors and adjusts, when required, these exploration programs as well as corporate administrative costs to ensure that adequate levels of working capital are maintained.
As at December 31, 2024, the Company had unrestricted cash of $4,912 ( December 31, 2023 – $7,313), working capital surplus of $8,045 ( December 31, 2023 – $7,713), which the Company defines as current assets less current liabilities, and an accumulated deficit of $257,192 ( December 31, 2023 – $149,054). During the year ended December 31, 2024, Fury Gold incurred a comprehensive loss of $108,141 ( December 31, 2023 – $17,219, December 31, 2022 – income of $24,905). The Company expects to incur future operating losses in relation to exploration activities. With no source of operating cash flow, there is no assurance that sufficient funding will be available to conduct further exploration of its mineral properties.
The Company’s contractual obligations are as follows:
| Within 1 year |
2 to 3 years |
Over 3 years |
At December 31 2024 |
|||||||||||||
| Accounts payable and accrued liabilities |
$ | 855 | $ | - | $ | - | $ | 855 | ||||||||
| Quebec flow-through expenditure requirements |
944 | - | - | 944 | ||||||||||||
| Undiscounted lease payments |
65 | - | - | 65 | ||||||||||||
| Total |
$ | 1,864 | $ | - | $ | - | $ | 1,864 | ||||||||
The Company also makes certain payments arising on mineral claims and leases on an annual or bi-annual basis to ensure all the Company’s properties remain in good standing. Cash payments of $212 were made during the year ended December 31, 2024, in respect of these mineral claims ( December 31, 2023 - $298), with $27 recognized in prepaid expenses as at December 31, 2024 ( December 31, 2023 – $78).
Credit risk
The Company’s cash and accounts receivables are exposed to credit risk, which is the risk that the counterparties to the Company’s financial instruments will cause a loss to the Company by failing to pay their obligations. The amount of credit risk to which the Company is exposed is considered insignificant as the Company’s cash is held with highly rated financial institutions in interest-bearing accounts and the accounts receivable primarily consist of sales tax receivables.
Market risk
This is the risk that the fair value or future cash flows of a financial instrument will fluctuate because of changes in market prices. Significant market risks to which the Company is exposed are as follows:
| i. |
Currency risk |
The Company is exposed to currency risk by having balances and transactions in currencies that are different from the relevant functional currency (the Canadian dollar). The Company’s foreign currency exposure related to its financial assets and liabilities held in US dollars was as follows:
| Years ended December 31 |
||||||||||||
| 2024 |
2023 |
2022 |
||||||||||
| Financial assets |
||||||||||||
| US$ bank accounts |
$ | 1 | $ | 1 | $ | 1 | ||||||
| Financial liabilities |
||||||||||||
| Accounts payable |
- | (7 | ) | (61 | ) | |||||||
| $ | 1 | $ | (6 | ) | $ | (60 | ) | |||||
A 10% increase or decrease in the US dollar to Canadian dollar exchange rate would not have a material impact on the Company’s net loss.
| ii. |
Price risk |
The Company holds certain investments in marketable securities (note 8) which are measured at fair value, being the closing share price of each equity security at the date of the consolidated statements of financial position. The Company is exposed to changes in share prices which would result in gains and losses being recognized in the loss for the year. A 10% increase or decrease in the Company’s marketable securities’ share prices would not have a material impact on the Company’s net loss.
Note 24: Management of capital
The Company’s objectives when managing capital are to safeguard the Company’s ability to continue as a going concern in order to pursue exploration of resource properties and to maintain a flexible capital structure which optimizes the costs of capital at an acceptable risk.
The Company manages the capital structure and makes adjustments to it in light of changes in economic conditions and the risk characteristics of the underlying assets. To maintain or adjust the capital structure, the Company may issue new shares or debt, acquire or dispose of assets, or adjust the amount of cash and investments.
In order to maximize ongoing exploration efforts, the Company does not pay out dividends, does not have any long-term debt, and is not subject to any externally imposed capital requirements. The capital of the Company was determined as follows:
| Years ended December 31 |
||||||||
| 2024 |
2023 |
|||||||
| Equity |
$ | 78,203 | $ | 182,874 | ||||
| Less: cash |
(4,912 | ) | (7,313 | ) | ||||
| $ | 73,291 | $ | 175,561 | |||||
The Company expects its capital resources to support its current forecasted project expenditures at the Eau Claire project and the Éléonore South project and other corporate activities. While the Company has been successful at raising capital in the past, there can be no assurance that the Company will have sufficient financing to meet its future capital requirements or that additional financing will be available on terms acceptable to the Company in the future.
Note 25: Income taxes
The reconciliation of the income tax recovery computed at statutory rates to the reported income tax recovery is:
| Years ended December 31 |
||||||||||||
| 2024 |
2023 |
2022 |
||||||||||
| (Earnings) Loss before income taxes |
$ | 108,331 | $ | 17,502 | $ | (24,721 | ) | |||||
| Canadian federal and provincial income tax rates |
27 | % | 27 | % | 27 | % | ||||||
| Expected income tax expense (recovery) |
(29,250 | ) | (4,725 | ) | 6,674 | |||||||
| Increase (decrease) in income tax recovery resulting from: |
||||||||||||
| Impairment |
23,555 | - | - | |||||||||
| Share-based compensation |
197 | 432 | 448 | |||||||||
| Share issuance costs |
(144 | ) | (246 | ) | (37 | ) | ||||||
| Adjustment to tax estimates |
(45 | ) | 934 | 114 | ||||||||
| Amortization of flow-through share premium |
(439 | ) | (903 | ) | (844 | ) | ||||||
| Flow-through expenditures renunciation |
1,033 | 1,995 | 1,934 | |||||||||
| Difference in future and foreign tax rates |
466 | 42 | 81 | |||||||||
| Sale of investments |
(119 | ) | - | (3,021 | ) | |||||||
| Other |
7 | 503 | 497 | |||||||||
| Increase (decrease) in unrecognized tax asset |
4,546 | 1,679 | (6,033 | ) | ||||||||
| Income tax expense (recovery) |
$ | (193 | ) | $ | (289 | ) | $ | (187 | ) | |||
Significant components of deferred tax asset and liabilities are:
| December 31 2023 |
Net loss |
December 31 2024 |
||||||||||
| Deferred income tax assets |
||||||||||||
| Non-capital losses carried forward |
$ | 14,192 | $ | 990 | $ | 15,182 | ||||||
| Capital losses carried forward |
55 | (6 | ) | 49 | ||||||||
| Share issuance costs and CEC |
356 | (66 | ) | 290 | ||||||||
| Investments |
98 | (38 | ) | 60 | ||||||||
| Investments in associates |
1,472 | 16 | 1,488 | |||||||||
| Site reclamation obligations |
1,206 | 148 | 1,354 | |||||||||
| Property and equipment |
479 | 52 | 531 | |||||||||
| Mineral property interests |
5,003 | 3,231 | 8,234 | |||||||||
| Capital lease obligation |
61 | (43 | ) | 18 | ||||||||
| $ | 22,922 | 4,284 | 27,206 | |||||||||
| Deferred income tax liabilities |
||||||||||||
| Property and equipment |
(24 | ) | 27 | 3 | ||||||||
| Mineral property interests |
(517 | ) | 235 | (282 | ) | |||||||
| Net deferred tax assets |
22,381 | 4,546 | 26,927 | |||||||||
| Unrecognized deferred tax assets |
(22,381 | ) | (4,546 | ) | (26,927 | ) | ||||||
| Net deferred tax balance |
$ | - | $ | - | $ | - | ||||||
| December 31 2022 |
Net loss |
December 31 2023 |
||||||||||
| Deferred income tax assets |
||||||||||||
| Non-capital losses carried forward |
$ | 13,635 | $ | 557 | $ | 14,192 | ||||||
| Capital losses carried forward |
73 | (18 | ) | 55 | ||||||||
| Share issuance costs and CEC |
317 | 39 | 356 | |||||||||
| Investments |
22 | 76 | 98 | |||||||||
| Investments in associates |
633 | 839 | 1,472 | |||||||||
| Site reclamation obligations |
1,145 | 61 | 1,206 | |||||||||
| Property and equipment |
427 | 52 | 479 | |||||||||
| Mineral property interests |
4,973 | 30 | 5,003 | |||||||||
| Capital lease obligation |
104 | (43 | ) | 61 | ||||||||
| 21,329 | 1,593 | 22,922 | ||||||||||
| Deferred income tax liabilities |
||||||||||||
| Property and equipment |
(53 | ) | 29 | (24 | ) | |||||||
| Mineral property interests |
(545 | ) | 28 | (517 | ) | |||||||
| Investments |
(28 | ) | 28 | - | ||||||||
| Net deferred tax assets |
20,703 | 1,678 | 22,381 | |||||||||
| Unrecognized deferred tax assets |
(20,703 | ) | (1,678 | ) | (22,381 | ) | ||||||
| Net deferred tax balance |
$ | - | $ | - | $ | - | ||||||
| December 31 2021 |
Net loss |
December 31 2022 |
||||||||||
| Deferred income tax assets |
||||||||||||
| Non-capital losses carried forward |
$ | 21,032 | $ | (7,397 | ) | $ | 13,635 | |||||
| Capital losses carried forward |
183 | (110 | ) | 73 | ||||||||
| Share issuance costs and CEC |
552 | (235 | ) | 317 | ||||||||
| Investments |
18 | 4 | 22 | |||||||||
| Investments in associates |
- | 633 | 633 | |||||||||
| Site reclamation obligations |
1,121 | 24 | 1,145 | |||||||||
| Property and equipment |
376 | 51 | 427 | |||||||||
| Mineral property interests |
5,001 | (28 | ) | 4,973 | ||||||||
| Capital lease obligation |
124 | (20 | ) | 104 | ||||||||
| Other |
63 | (63 | ) | - | ||||||||
| 28,470 | (7,141 | ) | 21,329 | |||||||||
| Deferred income tax liabilities |
||||||||||||
| Property and equipment |
(86 | ) | 33 | (53 | ) | |||||||
| Mineral property interests |
(1,606 | ) | 1,061 | (545 | ) | |||||||
| Investments |
(42 | ) | 14 | (28 | ) | |||||||
| Net deferred tax assets |
26,736 | (6,033 | ) | 20,703 | ||||||||
| Unrecognized deferred tax assets |
(26,736 | ) | 6,033 | (20,703 | ) | |||||||
| Net deferred tax balance |
$ | - | $ | - | $ | - | ||||||
The Company has accumulated non-capital tax losses of approximately $57,721 ( December 31, 2023 – $54,073, December 31, 2022 – $51,335) in Canada, which may be carried forward to reduce taxable income of future years. The non-capital tax losses will, if unused, expire between 2025 and 2044. The Company has not recognized any deferred tax assets at December 31, 2024, in respect of these non-capital losses due to the uncertainty that future operations will generate sufficient taxable income to utilize these non-capital losses.
The Company has $67 accumulated tax capital losses ( December 31, 2023 – $111, December 31, 2022 – $247) in Canada which may be carried forward indefinitely and used to reduce capital gains in future years.
Note 26: Subsequent events
| (a) |
On January 9, 2025, the Company issued 590,000 DSU’s to directors and 1,142,500 RSU’s to officers, and employees. The DSU’s and RSU’s were issued in accordance with the Company’s LTI plan (note 18), with a grant-date fair value of $0.55 per unit, one third vesting annually on anniversary. The Company also approved 80,000 stock options, vesting over 18 months with an exercise price of $0.60 per option, to certain UMS employees. |
| (b) |
On February 26, 2025, the Company announced that it has entered into an Arrangement Agreement with Quebec Precious Metals Corporation (“QPM”), whereby the Company intends to acquire all the outstanding common shares of QPM. The holders of QPM common shares will receive 0.0741 Company shares for each one QPM share held. It is expected that QPM shareholders will receive around 8.4 million Fury Gold common shares which will collectively make them 5% shareholders of the Company. The transaction is expected to close at the end of April 2025. |
| (c) |
On March 26, 2025, the Company announced that QPM has now secured the required no-objection letter from Corporations Canada as well as the interim order from the Quebec Superior Court in connection with convening the QPM shareholders meeting scheduled for April 22, 2025. The Company has also secured conditional approval of the TSX and NYSE American for the QPM transaction. The Company also announced that director Isabelle Cadieux has resigned from the Fury Board of directors to pursue other opportunities. |

CONSOLIDATED FINANCIAL STATEMENTS
FOR THE YEARS ENDED DECEMBER 31, 2024 AND 2023
(Expressed in Canadian Dollars)

REPORT OF INDEPENDENT REGISTERED PUBLIC ACCOUNTING FIRM
Board of Directors and Shareholders
Dolly Varden Silver Corporation
Opinion on the Consolidated Financial Statements
We have audited the accompanying consolidated balance sheets of Dolly Varden Silver Corporation (the “Company”) as of December 31, 2024 and 2023, and the related consolidated statements of loss and comprehensive loss, changes in shareholders’ equity, and cash flows for the years ended December 31, 2024 and 2023, and the related notes (collectively referred to as the “financial statements”). In our opinion, the financial statements present fairly, in all material respects, the financial position of the Company as of December 31, 2024 and 2023, and the results of its operations and its cash flows for the years ended December 31, 2024 and 2023 in conformity with IFRS Accounting Standards as issued by the International Accounting Standards Board.
Basis for Opinion
These financial statements are the responsibility of the Company’s management. Our responsibility is to express an opinion on these financial statements based on our audits. We are a public accounting firm registered with the Public Company Accounting Oversight Board (United States) (“PCAOB”) and are required to be independent with respect to the Company in accordance with the U.S. federal securities laws and the applicable rules and regulations of the Securities and Exchange Commission and the PCAOB.
We conducted our audits in accordance with the standards of the PCAOB and in accordance with auditing standards generally accepted in the United States of America. Those standards require that we plan and perform the audit to obtain reasonable assurance about whether the financial statements are free of material misstatement, whether due to error or fraud. The Company is not required to have, nor were we engaged to perform, an audit of its internal control over financial reporting. As part of our audits we are required to obtain an understanding of internal control over financial reporting but not for the purpose of expressing an opinion on the effectiveness of the Company’s internal control over financial reporting. Accordingly, we express no such opinion.
Our audits included performing procedures to assess the risks of material misstatements of the financial statements, whether due to error or fraud, and performing procedures that respond to those risks. Such procedures included examining, on a test basis, evidence regarding the amounts and disclosures in the financial statements. Our audits also included evaluating the accounting principles used and significant estimates made by management, as well as evaluating the overall presentation of the financial statements. We believe that our audits provide a reasonable basis for our opinion.
Critical Audit Matters
The critical audit matter communicated below is a matter arising from the current period audit of the financial statements that was communicated or required to be communicated to the audit committee and that: (1) relate to accounts or disclosures that are material to the financial statements and (2) involved our especially challenging, subjective, or complex judgments. The communication of the critical audit matter does not alter in any way our opinion on the financial statements, taken as a whole, and we are not, by communicating the critical audit matter below, providing separate opinions on the critical audit matters or on the accounts or disclosures to which it relates.
Assessment of Impairment Indicators of Exploration and Evaluation Assets (“E&E Assets”)
As described in Note 8 to the financial statements, the carrying amount of the Company’s E&E Assets was $71,329,535 as of December 31, 2024. As more fully described in Note 3 to the financial statements, management assesses E&E Assets for indicators of impairment at each reporting period.

The principal considerations for our determination that the assessment of impairment indicators of the E&E Assets is a key audit matter are that there was judgment made by management when assessing whether there were indicators of impairment for the E&E Assets, specifically relating to the assets’ carrying amount which is impacted by the Company’s intent and ability to continue to explore and evaluate these assets. This in turn led to a high degree of auditor judgment, subjectivity, and effort in performing procedures to evaluate audit evidence relating to the judgments made by management in their assessment of indicators of impairment that could give rise to the requirement to prepare an estimate of the recoverable amount of the E&E Assets.
Addressing the matter involved performing procedures and evaluating audit evidence in connection with forming our overall opinion on the financial statements. Our audit procedures included, among others:
| ● |
Evaluating management’s assessment of impairment indicators. |
| ● |
Evaluating the intent for the E&E Assets through discussion and communication with management. |
| ● |
Reviewing the Company’s recent expenditure activity. |
| ● |
Assessing compliance with agreements including reviewing option agreements and vouching cash payments and share issuances. |
| ● |
Assessing the Company’s rights to explore E&E Assets including sending a confirmation request to the optionor to ensure good standing of agreement. |
| ● |
Obtaining, on a test basis, confirmation of title to ensure mineral rights underlying the E&E Assets are in good standing. |
We have served as the Company’s auditor since 2011.
/s/ DAVIDSON & COMPANY LLP
| Vancouver, Canada | Chartered Professional Accountants |
February 28, 2025
DOLLY VARDEN SILVER CORPORATION
Consolidated Statements of Financial Position
(Expressed in Canadian Dollars)
| As at | Notes | December 31, 2024 | December 31, 2023 | |||||||||
| ASSETS | ||||||||||||
| Current | ||||||||||||
| Cash |
$ | 32,057,647 | $ | 9,982,389 | ||||||||
| Short term investment |
4 | 2,119,952 | - | |||||||||
| Prepaid expenses |
5 | 328,093 | 518,262 | |||||||||
| Amounts receivable |
6, 11 | 67,552 | 967,264 | |||||||||
| Non-current | 34,573,244 | 11,467,915 | ||||||||||
| Equipment |
7 | 191,715 | 216,056 | |||||||||
| Deposits |
8 | 159,000 | 159,000 | |||||||||
| Exploration and evaluation assets |
8 | 71,329,535 | 70,906,785 | |||||||||
| $ | 106,253,494 | $ | 82,749,756 | |||||||||
| LIABILITIES AND SHAREHOLDERS’ EQUITY | ||||||||||||
| Current Liabilities | ||||||||||||
| Accounts payable |
11 | $ | 118,521 | $ | 146,429 | |||||||
| Accrued liabilities |
11 | 802,656 | 657,623 | |||||||||
| Liability on flow-through share issuances |
9 | 3,478,712 | - | |||||||||
| 4,399,889 | 804,052 | |||||||||||
| Shareholders’ Equity |
||||||||||||
| Share capital |
9 | 224,362,471 | 184,751,037 | |||||||||
| Reserves |
9 | 12,513,816 | 11,568,202 | |||||||||
| Deficit |
(135,022,682 | ) | (114,373,535 | ) | ||||||||
| 101,853,605 | 81,945,704 | |||||||||||
| $ | 106,253,494 | $ | 82,749,756 | |||||||||
Nature of Operations (Note 1)
Subsequent Event (Note 15)
These consolidated financial statements were approved for issue by the Board of Directors on February 28, 2025 and signed on its behalf by:
| “Shawn Khunkhun” | “James Sabala” | |||
| Director | Director |
The accompanying notes are an integral part of these consolidated financial statements
DOLLY VARDEN SILVER CORPORATION
Consolidated Statements of Loss and Comprehensive Loss
(Expressed in Canadian Dollars)
| Notes |
Year Ended December 31, |
Year Ended December 31, |
||||||||||
| 2024 |
2023 |
|||||||||||
| EXPENSES | ||||||||||||
| Consulting fees |
$ | 1,275,026 | $ | 220,772 | ||||||||
| Directors’ fees |
9, 11 | 228,400 | 204,059 | |||||||||
| Exploration and evaluation |
8, 11 | 17,875,317 | 24,806,045 | |||||||||
| Management fees |
11 | 1,536,737 | 955,700 | |||||||||
| Marketing and communications |
1,477,450 | 1,409,433 | ||||||||||
| Office and administration |
250,708 | 292,291 | ||||||||||
| Professional fees |
236,947 | 305,053 | ||||||||||
| Rent and maintenance |
11 | 129,262 | 141,183 | |||||||||
| Share-based payments |
9, 11 | 2,600,955 | 1,970,683 | |||||||||
| Transfer agent and filing fees |
137,690 | 156,390 | ||||||||||
| Travel and accommodation |
207,161 | 343,036 | ||||||||||
| Operating loss |
(25,955,653 | ) | (30,804,645 | ) | ||||||||
| Recovery on flow through share premium |
9 | 4,301,284 | 3,653,886 | |||||||||
| Part XII.6 tax expense |
2,933 | (404,318 | ) | |||||||||
| Interest and other income |
1,002,289 | 904,615 | ||||||||||
| Loss and comprehensive loss for the year |
$ | (20,649,147 | ) | $ | (26,650,462 | ) | ||||||
| Basic and diluted loss per common share |
$ | (0.07 | ) | $ | (0.10 | ) | ||||||
| Weighted average number of common shares outstanding– basic and diluted |
291,754,348 | 257,129,652 | ||||||||||
The accompanying notes are an integral part of these consolidated financial statements
DOLLY VARDEN SILVER CORPORATION
Consolidated Statements of Changes in Shareholders’ Equity
(Expressed in Canadian Dollars)
| As at |
Common Shares |
Share Capital |
Reserves |
Deficit |
Total Shareholders’ Equity |
|||||||||||||||
| Balance, December 31, 2022 |
253,654,284 | $ | 173,967,990 | $ | 9,891,669 | $ | (87,723,073 | ) | $ | 96,136,586 | ||||||||||
| Exercise of stock options |
1,027,499 | 853,191 | (294,150 | ) | - | 559,041 | ||||||||||||||
| Issuance of common shares |
15,384,616 | 10,000,000 | - | - | 10,000,000 | |||||||||||||||
| Share-based payments |
- | - | 936,802 | - | 936,802 | |||||||||||||||
| Restricted share compensation |
- | - | 1,033,881 | - | 1,033,881 | |||||||||||||||
| Share issuance costs – cash |
- | (70,144 | ) | - | - | (70,144 | ) | |||||||||||||
| Loss and comprehensive loss for the year |
- | - | - | (26,650,462 | ) | (26,650,462 | ) | |||||||||||||
| Balance, December 31, 2023 |
270,066,399 | 184,751,037 | 11,568,202 | (114,373,535 | ) | 81,945,704 | ||||||||||||||
| Exercise of stock options |
3,634,334 | 2,310,602 | (990,995 | ) | - | 1,319,607 | ||||||||||||||
| Issuance of common shares for acquisition of property |
275,000 | 222,750 | - | - | 222,750 | |||||||||||||||
| Issuance of flow-through shares |
30,845,700 | 35,699,985 | - | - | 35,699,985 | |||||||||||||||
| Issuance of common shares |
11,500,000 | 11,500,000 | - | - | 11,500,000 | |||||||||||||||
| Share issuance costs – cash |
- | (3,006,253 | ) | - | - | (3,006,253 | ) | |||||||||||||
| Flow-through share premium liability |
- | (7,779,996 | ) | - | - | (7,779,996 | ) | |||||||||||||
| Share-based payments |
- | - | 1,461,500 | - | 1,461,500 | |||||||||||||||
| Restricted share compensation |
- | - | 1,139,455 | - | 1,139,455 | |||||||||||||||
| Restricted share units converted to |
||||||||||||||||||||
| common shares |
684,893 | 664,346 | (664,346 | ) | - | - | ||||||||||||||
| Loss and comprehensive loss for the year |
- | - | - | (20,649,147 | ) | (20,649,147 | ) | |||||||||||||
| Balance, December 31, 2024 |
317,006,326 | $ | 224,362,471 | $ | 12,513,816 | $ | (135,022,682 | ) | $ | 101,853,605 | ||||||||||
The accompanying notes are an integral part of these consolidated financial statements
DOLLY VARDEN SILVER CORPORATION
Consolidated Statements of Cash Flows
(Expressed in Canadian Dollars)
| Year ended December 31, |
Year ended December 31, |
|||||||
| 2024 |
2023 |
|||||||
| CASH FLOWS FROM OPERATING ACTIVITIES | ||||||||
| Loss for the year |
$ | (20,649,147 | ) | $ | (26,650,462 | ) | ||
| Items not affecting cash: Share-based payments |
1,461,500 | 1,970,683 | ||||||
| Restricted share compensation |
1,139,455 | - | ||||||
| Revaluation of deferred share units |
- | (4,041 | ) | |||||
| Recovery on flow-through share premium |
(4,301,284 | ) | (3,653,886 | ) | ||||
| Depreciation of equipment |
48,057 | 54,889 | ||||||
| Changes in non-cash working capital items: Prepaid expenses |
140,169 | (232,460 | ) | |||||
| Amounts receivable |
899,712 | (834,917 | ) | |||||
| Accounts payable and accrued liabilities |
117,125 | 362,205 | ||||||
| Cash used in operating activities | (21,144,413 | ) | (28,987, | |||||
| CASH FLOWS FROM INVESTING ACTIVITIES | ||||||||
| Acquisition of equipment |
(23,716 | ) | (14,135 | ) | ||||
| Acquisition of exploration and evaluation assets |
(150,000 | ) | - | |||||
| Short term investment |
(2,119,952 | ) | - | |||||
| Cash used in investing activities |
(2,293,668 | ) | (14,135 | ) | ||||
| CASH FLOWS FROM FINANCING ACTIVITIES | ||||||||
| Private placement, net of share issuance costs |
44,193,732 | 9,929,856 | ||||||
| Exercise of stock options |
1,319,607 | 559,041 | ||||||
| Cash provided by financing activities |
45,513,339 | 10,488,897 | ||||||
| Change in cash during the year |
22,075,258 | (18,513,227 | ) | |||||
| Cash, beginning of year |
9,982,389 | 28,495,616 | ||||||
| Cash, end of year |
$ | 32,057,647 | $ | 9,982,389 | ||||
| Supplemental disclosure with respect to cash flows: | ||||||||
| Interest income received in cash |
$ | 1,002,270 | $ | 904,615 | ||||
| Non-cash transactions: | ||||||||
| Fair value of options exercised |
$ | 990,995 | $ | 294,150 | ||||
| Fair value of shares issued for acquisition of exploration and evaluation assets |
$ | 222,750 | $ | - | ||||
| Reclassification of acquisition costs from prepaid expenses to exploration and evaluation assets |
50,000 | |||||||
| Restricted share units converted to common shares |
$ | 664,346 | $ | - | ||||
| Premium liability on flow-through shares |
$ | 7,779,996 | $ | - | ||||
The accompanying notes are an integral part of these consolidated financial statements
| 1. |
NATURE OF OPERATIONS |
Dolly Varden Silver Corporation (the “Company”) was incorporated under the Canada Business Corporations Act in the province of British Columbia on March 4, 2011 and is a public company listed on the TSX Venture Exchange (the “Exchange”) under the symbol “DV”. In addition, the Company trades on the OTCQX trading platform in the United States under the trading symbol “DOLLF”. The Company’s primary business is the acquisition and exploration of mineral properties in Canada. The Company’s head office is Suite 3123, 595 Burrard Street, Vancouver, British Columbia, Canada, V7X 1J1. The registered address and records office of the Company is located at Suite 1700, Park Place, 666 Burrard Street, Vancouver, British Columbia, Canada, V6C 2X8.
The Company owns interests in multiple mineral titles and claims in British Columbia, Canada. On February 25, 2022 the Company acquired 100% of the outstanding common stock of Homestake Resource Corporation and its wholly owned subsidiary Homestake Royalty Corporate, (collectively “Homestake”) in exchange for common shares of the Company. The recoverability of amounts shown for exploration and evaluation assets is dependent upon the discovery of economically recoverable reserves, confirmation of the Company’s interest in the underlying mineral claims, the ability of the Company to obtain necessary financing to satisfy the expenditure requirements and to complete the development of properties, as well as upon future profitable production or proceeds from the disposition thereof. Management believes that the Company has sufficient working capital to maintain its operations and activities for the next fiscal year.
| 2. |
BASIS OF PRESENTATION |
| (a) |
Statement of Compliance |
These consolidated financial statements have been prepared in accordance with International Financial Reporting Standards, as issued by the International Accounting Standards Board (“IASB”) effective for the year ended December 31, 2024.
| (b) |
Basis of Presentation |
The consolidated financial statements have been prepared on the historical cost basis, except for certain financial instruments, which are measured at fair value. In addition, these consolidated financial statements have been prepared using the accrual basis of accounting, except for cash flow information.
| 3. |
MATERIAL ACCOUNTING POLICY INFORMATION |
| (a) |
Basis of Consolidation |
These consolidated financial statements include the accounts of the Company and its wholly owned subsidiaries. The financial statements of the subsidiaries are included in the consolidated financial statements from the date that control commences until the date that control ceases. All intercompany transactions, balances, revenue and expenses are eliminated in full upon consolidation.
| 3 |
MATERIAL ACCOUNTING POLICY INFORMATION (cont’d) |
| (a) |
Basis of Consolidation (cont’d) |
The legal subsidiaries of the Company are as follows:
| Name of Subsidiary | Place of | Beneficial Ownership Interest | |
| Incorporation | December 31,2024 | December 31, 2023 | |
| Homestake Resource Corporation | British Columbia, Canada | 100% | 100% |
| Homestake Royalty Corporation | British Columbia, Canada | 100% | 100% |
| (b) |
Functional and Foreign Currency |
The consolidated financial statements are presented in Canadian dollars, which is the Company’s and its subsidiaries’ functional currency. Foreign currency transactions are translated into Canadian dollars using the exchange rates at the date of the transactions. Foreign exchange gains or losses resulting from the settlement of transactions and from the translation at year-end rates of monetary assets and liabilities denominated in foreign currencies are recognized in profit or loss.
| (c) |
Related Party Transactions |
Parties are considered to be related if one party has the ability, directly or indirectly, to control the other party or exercise significant influence over the other party in making financial and operating decisions. Related parties may be individuals or corporate entities. A transaction is considered to be a related party transaction when there is a transfer of resources or obligations between related parties.
| (d) |
Equipment |
The Company records equipment using the cost method, whereby equipment is stated at cost less accumulated depreciation and accumulated impairment losses. Depreciation is recorded over the useful lives of the assets on a declining balance basis at the following annual rates.
| Dock |
5% |
| Gas tank |
10% |
| Boat |
15% |
| Tents and trailers |
30% |
| General equipment |
20% |
| Vehicles |
30% |
An item of equipment is derecognized upon disposal or when no future economic benefits are expected to arise from the continued use of the asset. Any gain or loss arising on disposal of the asset, determined as the difference between the net disposal proceeds and the carrying amount of the asset, is recognized in profit or loss.
Where an item of equipment is composed of major components with different useful lives, the components are accounted for as separate items of equipment. Expenditures incurred to replace a component of an item of equipment that is accounted for separately including major inspection and overhaul expenditures, are capitalized.
| 3 |
MATERIAL ACCOUNTING POLIICY INFORMATION (cont’d) |
| (e) |
Exploration and Evaluation Assets |
Upon acquiring the legal right to explore a mineral property (exploration and evaluation assets), all direct costs related to the acquisition of a mineral property are capitalized. Exploration and evaluation expenditures incurred prior to the determination of the feasibility of mining operations and the decision to proceed with development are recognized in profit or loss as incurred, net of recoveries. Costs incurred before the Company has obtained the legal rights to explore an area are charged to profit or loss. Exploration and evaluation assets are assessed for impairment if (i) sufficient data exists to determine technical feasibility and commercial viability, and (ii) facts and circumstances suggest that the carrying amount exceeds the recoverable amount.
Once the technical feasibility and commercial viability of the extraction of mineral resources in an area of interest are demonstrable, exploration and evaluation assets attributable to that area of interest are first tested for impairment and then reclassified to mining property and development assets within equipment. Recoverability of the carrying amount of any exploration and evaluation assets is dependent on successful development and commercial exploitation, or alternatively, sale of the respective areas of interest.
| (f) |
Impairment of Non-Financial Assets |
Non-financial assets are evaluated at least annually by management for indicators that the carrying value is impaired and may not be recoverable. The Company’s non-financial assets are equipment and exploration and evaluation assets. When indicators of impairment are present, the recoverable amount of an asset is evaluated at the level of a cash generating unit (CGU), the smallest identifiable group of assets that generates cash inflows that are largely independent of the cash inflows from other assets or groups of assets. The recoverable amount of a CGU is the greater of the CGU’s fair value less costs to sell and its value in use. An impairment loss is recognized in profit or loss to the extent that the carrying amount exceeds the recoverable amount.
In assessing value in use, the estimated future cash flows are discounted to their present value. Estimated future cash flows are calculated using estimated recoverable reserves, estimated future commodity prices and the expected future operating and capital costs. The pre-tax discount rate applied to the estimated future cash flows reflects current market assessments of the time value of money and the risks specific to the asset for which the future cash flow estimates have not been adjusted.
Additionally, the reviews consider factors such as political, social and legal and environmental regulations. These factors may change due to changing economic conditions or the accuracy of certain assumptions and, hence, affect the recoverable amount. The Company uses its best efforts to fully understand all of the aforementioned to make an informed decision based upon historical and current facts surrounding the projects. Discounted cash flow techniques often require management to make estimates and assumptions concerning reserves and resources and expected future production revenues and expenses.
Assets that have been impaired are tested for possible reversal of the impairment whenever events or changes in circumstance indicate that the impairment may have reversed. Where an impairment loss subsequently reverses, the carrying amount of the asset or cash generating unit (“CGU”) is increased to the revised estimate of its recoverable amount, but so that the increased carrying amount does not exceed the carrying amount that would have been determined had no impairment loss been recognized for the asset or CGU in prior periods. A reversal of an impairment loss is recognized immediately in profit or loss.
| 3 |
MATERIAL ACCOUNTING POLICY INFORMATION (cont’d) |
| (g) |
Decommissioning Liabilities |
The Company recognizes a provision for statutory, contractual, constructive or legal obligations associated with decommissioning of mining operations and reclamation and rehabilitation costs arising when environmental disturbance is caused by the exploration or evaluation of exploration and evaluation assets, and equipment. Provisions for site closure and decommissioning are recognized in the period in which the obligation is incurred or acquired and are measured based on expected future cash flows to settle the obligation, discounted to their present value. The discount rate used is a pre-tax rate that reflects current market assessments of the time value of money and the risks specific to the liability including risks specific to the countries in which the related operation is located.
When an obligation is initially recognized, the corresponding cost is capitalized to the carrying amount of the related asset in exploration and evaluation assets and equipment. These costs are depreciated using either the unit of production or straight-line method depending on the asset to which the obligation relates.
The obligation is increased for the accretion and the corresponding amount is recognized as a finance expense. The obligation is also adjusted for changes in the estimated timing, amount of expected future cash flows, and changes in the discount rate. Such changes in estimates are added to or deducted from the related asset except where deductions are greater than the carrying value of the related asset in which case, the amount of the excess is recognized in profit or loss.
Due to uncertainties concerning environmental remediation, the ultimate cost to the Company of future site restoration could differ from the amounts provided. The estimate of the total provision for future site closure and decommissioning costs is subject to change based on amendments to laws and regulations, changes in technology, price increases and changes in interest rates, and as new information concerning the Company’s closure and decommissioning liabilities becomes available.
| (h) |
Use of Estimates and Judgments |
The preparation of these consolidated financial statements in conformity with IFRS requires management to make estimates and assumptions that affect the reported amounts of assets and liabilities and disclosure of contingent assets and liabilities at the date of the consolidated financial statements and the reported amounts of revenues and expenses during the period. These and other estimates are subject to measurement uncertainty and the effect on the consolidated financial statements of changes in these estimates could be material. Estimates and underlying assumptions are reviewed on an ongoing basis. Revisions to accounting estimates are recognized during the year in which the estimates are revised and in any future periods affected.
Significant Accounting Judgments
Significant accounting judgments that management has made in the process of applying accounting policies and that have the most significant effect on the amounts recognized in the consolidated financial statements include, but are not limited to, the following:
| (i) |
Recoverability of the carrying value of the Company’s exploration and evaluation assets |
Recorded costs of exploration and evaluation assets are not intended to reflect present or future values of these properties. The recorded costs are subject to measurement uncertainty and it is reasonably possible, based on existing knowledge, that a change in future conditions could require a material change in the recognized amount.
| 3 |
MATERIAL ACCOUNTING POLICY INFORMATION (cont’d) |
| (h) |
Use of Estimates and Judgments (cont’d) |
Critical Accounting Estimates
Key assumptions concerning the future and other key sources of estimation uncertainty that have a significant risk of resulting in a material adjustment to the carrying amounts of assets and liabilities include, but are not limited to, the following:
| (i) |
Share-based payments |
The fair value of share-based payments is determined using the Black-Scholes option pricing model. Such option pricing models require the input of subjective assumptions, including the expected price volatility, option life, dividend yield, risk-free rate and estimated forfeitures at the initial grant date.
| (ii) |
Estimating useful life of equipment |
Depreciation of equipment is charged to write down the value of those assets to their residual value over their respective estimated useful lives. Management is required to assess the useful economic lives and residual values of the assets such that depreciation is charged on a systematic basis to the current carrying amount. The useful lives are estimated having regard to such factors as asset maintenance, rate of technical and commercial obsolescence, and asset usage. The useful lives of key assets are reviewed annually.
| (iii) |
Deferred income taxes |
Judgment is required in determining whether deferred tax assets are recognized in the consolidated statement of financial position. Deferred tax assets, including those arising from unutilized tax losses require management to assess the likelihood that the Company will generate taxable earnings in future periods, in order to utilize recognized deferred tax assets. Estimates of future taxable income are based on forecast cash flows from operations and the application of existing tax laws in each jurisdiction. To the extent that future cash flows and taxable income differ significantly from estimates, the ability of the Company to realize the net deferred tax assets recorded at the date of the consolidated statements of financial position could be impacted.
| (iv) |
Accrual of British Columbia Mineral Exploration Tax Credit (“BC METC”) |
The provincial government of British Columbia provides for a refundable tax on net qualified mining exploration expenditures incurred in British Columbia. The credit is calculated as 20% of qualified mining exploration expenses less the amount of any assistance received or receivable. The determination of the expenditures that would qualify as mining exploration expenses was based on the previous years’ tax filings and subsequent reviews by government auditors. BC METC will be recorded in profit or loss upon cash receipt or when reasonable assurance exists that the tax filings are assessed and the expenditures are qualified as mining exploration expenses.
| 3 |
MATERIAL ACCOUNTING POLICY INFORMATION (cont’d) |
| (i) |
Financial Instruments |
| (i) |
Classification and measurement of financial assets and liabilities |
Under IFRS 9, Financial assets, on initial recognition, are recognized at fair value and subsequently classified and measured at: amortized cost; fair value through other comprehensive income (FVOCI) or fair value through profit or loss (FVTPL). The classification of financial assets depends on the purpose for which the financial assets were acquired. The Company’s financial assets which consist of cash and cash equivalents, short term investment, deposits and amounts receivable, are classified as amortized cost.
Under IFRS 9, financial liabilities, on initial recognition, are measured at fair value and subsequently measured at FVTPL or amortized cost. The Company's financial liabilities which consist of accounts payable and accrued liabilities are classified as amortized cost.
| (ii) |
Impairment of financial assets |
An ‘expected credit loss’ (ECL) model applies to financial assets measured at amortized cost, contract assets and debt investments at FVOCI, but not to investments in equity instruments. The ECL model requires a loss allowance to be recognized based on expected credit losses. The estimated present value of future cash flows associated with the asset is determined and an impairment loss is recognized for the difference between this amount and the carrying amount as follows: the carrying amount of the asset is reduced to estimated present value of the future cash flows associated with the asset, discounted at the financial asset’s original effective interest rate, either directly or through the use of an allowance account and the resulting loss is recognized in profit or loss for the period. In a subsequent period, if the amount of the impairment loss related to financial assets measured at amortized cost decreases, the previously recognized impairment loss is reversed through the statement of loss and comprehensive loss to the extent that the carrying amount of the investment at the date the impairment is reversed does not exceed what the amortized cost would have been had the impairment not been recognized. The Company's financial assets measured at amortized cost are subject to the ECL model.
| (j) |
Share capital |
Common shares are classified as equity. Transaction costs directly attributable to the issue of common shares are recognized as a deduction from equity, net of any tax effects.
Flow-through common shares are a type of common share and are securities permitted by Canadian Income Tax Legislation whereby the investor can claim the tax deductions arising from the renunciation of the related resource expenditures. The Company accounts for flow-through shares whereby any premium paid for the flow-through shares in excess of the market value of the common shares without flow-through features at the time of issue is credited to flow-through premium liability. The flow-through premium liability is included in profit or loss as the qualifying expenditures are incurred on a pro-rata basis.
The Company may issue units consisting of common shares and common share purchase warrants. The Company estimates the fair value of the common shares based on their market price on the share issuance date. The residual difference, if any, between the unit price and the fair value of each common share represents the fair value attributable to each warrant.
| 3 |
MATERIAL ACCOUNTING POLICY INFORMATION (cont’d) |
| (k) |
Income taxes |
Current income taxes
Income tax assets and liabilities for the current period are measured at the amount expected to be recovered from or paid to the taxation authorities. The tax rates and tax laws used to compute the amount are those that are enacted or substantively enacted, at the reporting date. Current income tax relating to items recognized directly in other comprehensive income or equity is recognized in other comprehensive income or equity and not in profit or loss. Management periodically evaluates positions taken in the tax returns with respect to situations in which applicable tax regulations are subject to interpretation and establishes provisions where appropriate.
Deferred income tax
Deferred income tax is recognized as the temporary differences at the reporting date between the tax bases of assets and liabilities and their carrying amounts for financial reporting purposes. The carrying amount of deferred income tax assets is reviewed at the end of each reporting period and recognized only to the extent that it is probable that sufficient taxable profit will be available to allow all or part of the deferred income tax asset to be utilized. Deferred income tax assets and liabilities are measured at the tax rates that are expected to apply to the year when the asset is realized, or the liability is settled, based on tax rates (and tax laws) that have been enacted or substantively enacted by the end of the reporting period. Deferred income tax assets and deferred income tax liabilities are offset, if a legally enforceable right exists to set off current tax assets against current income tax liabilities and the deferred income taxes relate to the same taxable entity and the same taxation authority.
| (l) |
Foreign currency translation |
Transactions denominated in foreign currencies are translated using the exchange rate in effect on the transaction date or at an average rate. Monetary assets and liabilities denominated in foreign currencies are translated at the rate of exchange in effect at the statement of financial position date. Non-monetary items are translated using the historical rate on the date of the transaction. Revenue and expenses are translated at the exchange rates approximating those in effect on the date of the transactions. Foreign exchange gains and losses are included in profit or loss.
| (m) |
Loss per share |
Basic loss per share is calculated by dividing the loss attributable to common shareholders of the Company by the weighted average number of common shares outstanding during the period. Diluted loss per share amounts are calculated assuming that the proceeds received from the exercise of stock options and warrants would be used to repurchase shares at the prevailing market rate. When a loss is incurred during the period, this calculation is considered to be anti-dilutive.
| (n) |
Comprehensive income (loss) |
Comprehensive income (loss) is the change in the Company’s net assets that results from transactions, events and circumstances from sources other than the Company’s shareholders and includes items that are not included in profit or loss. The Company currently has incurred no comprehensive income or loss.
| 3 |
MATERIAL ACCOUNTING POLICY INFORMATION (cont’d) |
| (o) |
Share-based payments |
The Company grants share-based awards to employees, directors and consultants as an element of compensation. The fair value of the awards is recognized over the vesting period as share-based compensation expense offset by reserves. The fair value of share-based compensation is determined using the Black-Scholes option pricing model. At each reporting date prior to vesting, the cumulative expense representing the extent to which the vesting period has expired and management’s best estimate of the awards that are ultimately expected to vest is computed. No expense is recognized for awards that do not ultimately vest. When stock options are exercised, the proceeds received, together with any related amount in the reserves, are credited to share capital.
In situations where equity instruments are issued to non-employees and some or all of the goods or services received by the entity as consideration cannot be specifically identified, they are measured at the fair value of the equity instruments. Otherwise, share based compensation are measured at the fair value of the goods or the services received.
| (p) |
Leases |
At inception of a contract, the Company assesses whether a contract is, or contains, a lease. A contract is, or contains, a lease if the contract conveys the right to control the use of an identified asset over a period of time in exchange for consideration. The Company assesses whether the contract involves the use of an identified asset, whether it has the right to obtain substantially all of the economic benefits from the use of the asset during the term of the contract and it has the right to direct the use of the asset.
The right-of-use asset is subsequently depreciated from the commencement date to the earlier of the end of the lease term, or the end of the useful life of the asset. The right-of-use asset may be reduced due to impairment losses, if any, and adjusted for certain remeasurements of the lease liability.
A lease liability is initially measured at the present value of the lease payments that are not paid at the commencement date discounted by the interest rate implicit in the lease or, if that rate cannot be readily determined the incremental borrowing rate. The lease liability is subsequently measured at amortized cost using the effective interest method. Lease payments included in the measurement of the lease liability comprise of fixed payments, variable lease payments, and amounts expected to be payable at the end of the lease term.
The Company has elected not to recognize the right-of-use assets and lease liabilities for short-term leases that have a lease term of twelve months or less. The lease payments associated with these leases are charged directly to income on a straight-line basis over the lease term.
| 3 |
MATERIAL ACCOUNTING POLICY INFORMATION (cont’d) |
| (q) |
Application of New and Revised Accounting Standards |
New standards, interpretations and amendments
Classification of Liabilities as Current or Non-current (Amendments to IAS 1)
The amendments to IAS 1 provide a more general approach to the classification of liabilities based on the contractual arrangements in place at the reporting date. These amendments are effective for reporting periods beginning on or after January 1, 2024. Implementation of this new standard did not significantly impact the financial statements.
Future standards not yet adopted
IFRS 18 Presentation and Disclosure in Financial Statements
In April 2024, the IASB issued IFRS 18 Presentation and Disclosure in Financial Statements ("IFRS 18") which replaces IAS 1 Presentation of Financial Statements. This standard aims to improve how companies communicate in their financial statements, with a focus on information about financial performance in the statement of profit or loss, in particular additional defined subtotals, disclosures about management-defined performance measures and new principles for aggregation and disaggregation of information. IFRS 18 is accompanied by limited amendments to the requirements in IAS 7 Statement of Cash Flows. IFRS 18 is effective from January 1, 2027. Companies are permitted to apply IFRS 18 before that date. The Company is currently assessing the impact the new standard will have on its consolidated financial statements.
| 4 |
SHORT TERM INVESTMENT |
As at December 31, 2024, the Company held a $2,100,000 ($nil – December 31, 2023) guaranteed investment certificate maturing April 7, 2025. The investment has an annualized interest rate of 4.00% and earned interest of $19,952.
| 5 |
PREPAID EXPENSES |
| Prepaid expenses consist of: |
||||||||
| December 31, 2024 |
December 31, 2023 |
|||||||
| Advances for exploration expenditures |
$ | 59,942 | $ | 273,000 | ||||
| Insurance and other administrative expenses |
268,151 | 245,262 | ||||||
| $ | 328,093 | $ | 518,262 | |||||
| 6 | AMOUNTS RECEIVABLE |
| Amounts receivable consists of: |
||||||||
| December 31, 2024 |
December 31, 2023 |
|||||||
| Goods and Services Tax receivable |
$ | 67,332 | $ | 850,864 | ||||
| Other |
220 | 116,400 | ||||||
| $ | 67,552 | $ | 967,264 | |||||
| 7 | EQUIPMENT |
Equipment consists of:
| Dock | Tents and Trailers | Equipment | Vehicles | Gas Tank | Boat | Office Furniture | Total | |||||||||||||||||||||||||
| Cost: | ||||||||||||||||||||||||||||||||
| At December 31, 2022 |
$ | 15,571 | $ | 203,315 | $ | 175,166 | $ | 39,936 | $ | 40,000 | $ | 91,755 | $ | - | $ | 565,743 | ||||||||||||||||
| Additions |
- | - | 14,135 | - | - | - | - | 14,135 | ||||||||||||||||||||||||
| At December 31, 2023 |
15,571 | 203,315 | 189,301 | 39,936 | 40,000 | 91,755 | - | 579,878 | ||||||||||||||||||||||||
| Additions |
- | - | 18,778 | - | - | - | 4,938 | 23,716 | ||||||||||||||||||||||||
| At December 31, 2024 |
$ | 15,571 | $ | 203,315 | $ | 208,079 | $ | 39,936 | $ | 40,000 | $ | 91,755 | $ | 4,938 | $ | 603,594 | ||||||||||||||||
| Accumulated Depreciation: | ||||||||||||||||||||||||||||||||
| At December 31, 2022 |
$ | 8,262 | $ | 155,050 | $ | 64,714 | 24,080 | $ | 27,999 | $ | 28,828 | $ | - | $ | 308,933 | |||||||||||||||||
| Depreciation |
365 | 14,478 | 24,650 | 4,757 | 1,200 | 9,439 | - | 54,889 | ||||||||||||||||||||||||
| At December 31, 2023 |
8,627 | 169,528 | 89,364 | 28,837 | 29,199 | 38,267 | - | 363,822 | ||||||||||||||||||||||||
| Depreciation |
347 | 10,135 | 23,759 | 3,330 | 1,080 | 8,023 | 1,383 | 48,057 | ||||||||||||||||||||||||
| At December 31, 2024 |
$ | 8,974 | $ | 179,663 | $ | 113,123 | $ | 32,167 | $ | 30,279 | $ | 46,290 | $ | 1,383 | $ | 411,879 | ||||||||||||||||
| Net Book Value: | ||||||||||||||||||||||||||||||||
| At December 31, 2023 |
$ | 6,944 | $ | 33,787 | $ | 99,937 | $ | 11,099 | $ | 10,801 | $ | 53,488 | $ | - | $ | 216,056 | ||||||||||||||||
| At December 31, 2024 |
$ | 6,597 | $ | 23,652 | $ | 94,956 | $ | 7,769 | $ | 9,721 | $ | 45,465 | $ | 3,555 | $ | 191,715 | ||||||||||||||||
| 8 |
EXPLORATION AND EVALUATION ASSETS |
Title to exploration and evaluation assets involves certain inherent risks due to the difficulties of determining the validity of certain claims, as well as the potential for problems arising from the frequently ambiguous conveyancing history characteristic of many exploration and evaluation assets. The Company has investigated title to all of its exploration and evaluation assets and, to the best of its knowledge, title to all of its properties is in good standing.
Exploration and evaluation asset acquisition costs are set out below:
| Balance, December 31, 2022 and 2023 |
$ | 70,906,785 | ||
| Additions |
422,750 | |||
| Balance, December 31, 2024 |
$ | 71,329,535 |
Kitsault Valley (“KV”) Project
During the years ended December 31, 2011 to 2018, the Company purchased the Dolly Varden (or “DV”) property, consisting of fee simple titles, mineral claims and mineral tenures in respect of certain lands located in the Kitsault area of British Columbia. The property is subject to a 2% net smelter return royalty (“NSR”) of which one-half (or 1%) of the NSR can be repurchased by the Company for $2,750,000 at any time.
During the year ended December 31, 2020, the Company acquired additional surface rights and fee simple lands. The total package had been previously leased annually by the Company from private owners. The transaction involved a payment of $153,000 in cash and issuance of 192,061 common shares of the Company for a value of $149,808.
On February 25, 2022, the Company completed the acquisition of a 100% interest in the Homestake Ridge property pursuant to a purchase agreement with Fury Gold Mines Ltd. (“Fury”). The Homestake Ridge property is located adjacent to the Company’s DV property. The Homestake Ridge property is subject to a 2% NSR applicable to certain claims (the “Crown Grants”). The 2% NSR on the Crown Grants includes an annual advanced minimum royalty of $50,000 yearly payment obligations. Ten business days after commencement of commercial production, approximately 17,300 shares of the Company are to be issued to the NSR holders. Additionally, a small area of the Homestake Ridge property is subject to a 3% royalty. The Company refers to the combination of its Homestake Ridge and DV properties as the Kitsault Valley Project (the “KV Project”). As of December 31, 2024, the Company has deposits totaling $159,000 (December 31, 2023 - $159,000) as reclamation bonds for the KV Project.
Big Bulk Property
On December 19, 2023, the Company entered into an assignment and assumption agreement (the "Assignment Agreement") with Libero Copper & Gold Corporation ("Libero") pursuant to which the Company was assigned the rights to an option agreement (the “Option Agreement”) to earn a 100% interest in certain claims known as the Big Bulk property. As consideration for the Assignment Agreement the Company issued Libero 275,000 common shares of the Company valued at $222,750, on January 9, 2024 (Note 9).
| 8. |
EXPLORATION AND EVALUATION ASSETS (cont’d) |
In connection with this acquisition, the Company also entered into an amended agreement with LCT Holdings Inc., the owner of the Big Bulk property and optionor under the Option Agreement. The amended Option Agreement provides that the Company may earn-in a 100% undivided interest in the Big Bulk property by completing the following payments:
| a) |
$50,000 in cash on or before December 31, 2023; (cash paid) |
| b) |
$150,000 in cash on or before December 31, 2024; (cash paid) |
| c) |
$250,000 in cash or common shares on or before December 31, 2025; |
| d) |
$500,000 in cash or common shares on or before December 31, 2026; and |
| e) |
$500,000 in cash or common shares on or before December 31, 2027. |
The Company has the right to elect to issue common shares instead of a cash payment only when the market price of the common shares at the time is equal or greater than to the ten day volume weighted average price of the common shares of the Company, subject to such exchange’s minimum pricing rules and further provided that the common shares may only be issued by the Company if the deemed price is equal to or greater than $0.64 per Common share, otherwise the Company may only satisfy such payment in cash.
Exploration And Evaluation Expenses
The following table summarizes the exploration and evaluation expenses incurred during the years ended December 31, 2024 and 2023.
| December 31, 2024 |
December 31, 2023 |
|||||||
| Analytical and sample related |
$ | 1,127,904 | $ | 1,898,610 | ||||
| Camp, food, supplies and related |
1,988,143 | 2,312,427 | ||||||
| Claim maintenance |
80,012 | 59,030 | ||||||
| Community relations and related |
82,385 | 102,420 | ||||||
| Depreciation |
48,057 | 54,889 | ||||||
| Drilling |
9,800,110 | 13,720,520 | ||||||
| Equipment and warehouse rental |
822,228 | 751,388 | ||||||
| Fuel |
738,856 | 967,412 | ||||||
| Geological and geoscience |
1,619,939 | 2,879,962 | ||||||
| Mapping and modelling |
165,618 | 123,840 | ||||||
| Project supervision |
602,500 | 399,138 | ||||||
| Resource and metallurgy |
- | 238 | ||||||
| Drill pad preparation |
830,720 | 1,246,252 | ||||||
| Transport, travel and related |
87,057 | 289,919 | ||||||
| Cost recovery: BC METC |
(118,212 | ) | - | |||||
| Total |
$ | 17,875,317 | $ | 24,806,045 | ||||
| 9. |
SHARE CAPITAL |
Authorized: Unlimited number of common shares without par value.
Issued:
On September 27, 2024, the Company closed the second and final tranche of a bought deal financing for additional gross proceeds of $4,500,000 from the issuance of 3,600,000 flow through (“FT”) common shares at price of $1.25 per FT common share. In connection with the closing of the first tranche of the Offering, a finders’ fee of $225,000 was paid representing 5.0% of the gross proceeds.
On September 4, 2024, the Company closed the first tranche of a bought deal financing for aggregate gross proceeds to the Company of $27,700,000. Pursuant to the close of first tranche of this financing, the Company sold 11,500,000 common shares of the Company at a price of $1.00 per common share for gross proceeds of $11,500,000 and it also sold 12,960,000 FT common shares at a price of $1.25 per FT common share for gross proceeds of $16,200,000. In connection with the closing of the first tranche of this financing, a finders’ fee of $1,385,000 was paid representing 5.0% of the gross proceeds.
On March 26, 2024, the Company closed a bought deal financing for gross proceeds to the Company of $14,999,985. Pursuant to this financing, the Company sold 14,285,700 FT common shares on a charitable basis at a price of $1.05 per FT common share. Underwriter fees of $749,999 were paid in relation to this financing.
On January 9, 2024, the Company issued to Libero 275,000 common shares of the Company valued at $222,750 in relation to the Assignment Agreement (Note 8).
On November 1, 2023, the Company completed the sale of 15,384,616 common shares of the Company to Hecla Canada Ltd. (“Hecla”) at a price of $0.65 per common share for gross proceeds of $10,000,000.
During the year ended December 31, 2024, the Company issued 684,893 shares pursuant to conversion of restricted share units (“RSUs”). The value of the settled units adjusted the share capital reserve account by $664,346 (2023 - $nil).
During the year ended December 31, 2024, the Company issued 3,634,334 (2023 – 1,027,499) common shares pursuant to the exercise of stock options for proceeds of $1,319,607 (2023 - $559,041).
Restricted Share Units
The Company adopted a RSU plan during the year ended December 31, 2022 after the shareholders approved a new rolling 10% RSU plan (the “RSU Plan”) at its annual general meeting on June 24, 2024. The maximum number of common shares issuable upon the vesting of RSUs granted pursuant to the RSU Plan combined with other share-based compensation arrangements is set at 10% of the total issued common shares. The RSU Plan is an evergreen plan meaning any vesting of an RSU will, subject to the overall limit described above, allow new grants available under the RSU Plan resulting in a reloading of the number of RSUs available for grant. On April 2, 2024, the Company granted 1,183,000 RSUs to various directors with vesting equally spread over 3 years with the first vesting occurring after one year. The Company expensed $1,139,455 included in share-based compensation expense during the year ended December 31, 2024 (December 31, 2023 - $727,051).
| Number of RSUs |
||||
| Balance, December 31, 2022 |
- | |||
| Granted |
2,054,678 | |||
| Balance, December 31, 2023 |
2,054,678 | |||
| Granted |
1,183,000 | |||
| Settlement upon vesting |
(684,893 | ) | ||
| Balance, December 31, 2024 |
2,552,785 | |||
| 9 |
SHARE CAPITAL (cont’d) |
Stock Options
The Company has a stock option plan under which it is authorized to grant share purchase options to executive officers, directors, employees and consultants enabling the holder to acquire up to 10% of the issued and outstanding common shares of the Company. Under the plan, the exercise price of each option shall be no less than the discounted market price of the Company's shares prior to the grant in accordance with Exchange policies. Options are granted for a maximum term of 10 years.
Vesting is at the discretion of the Board of Directors. In the absence of a vesting schedule, such options shall vest immediately.
| Number of Options |
Weighted Average Exercise Price $ |
|||||||
| Balance, December 31, 2022 |
11,103,250 | 0.59 | ||||||
| Granted |
800,000 | 0.97 | ||||||
| Exercised |
(1,027,499 | ) | 0.54 | |||||
| Forfeited/expired |
(5,000 | ) | 0.40 | |||||
| Balance, December 31, 2023 |
10,870,751 | 0.62 | ||||||
| Granted |
2,824,000 | 0.85 | ||||||
| Exercised |
(3,634,334 | ) | 0.36 | |||||
| Forfeited/ Expired |
(466,667 | ) | 0.64 | |||||
| Balance, December 31, 2024 |
9,593,750 | 0.78 | ||||||
As at December 31, 2024, the Company had outstanding stock options enabling the holders to acquire common shares as follows:
| Date of Expiry |
Exercise Price $ |
Number of Stock Options Outstanding as at December 31, 2024 |
||||||
| February 18, 2025 |
0.25 | 30,000 | ||||||
| March 17, 2025 |
0.25 | 206,250 | ||||||
| March 25, 2026 |
0.71 | 2,025,000 | ||||||
| February 25, 2027 |
0.79 | 3,550,000 | ||||||
| August 19, 2027 |
0.71 | 424,500 | ||||||
| February 24, 2028 |
0.97 | 600,000 | ||||||
| March 28, 2029 |
0.84 | 2,583,000 | ||||||
| May 22, 2029 |
1.06 | 100,000 | ||||||
| June 24, 2029 |
1.00 | 75,000 | ||||||
| Total Outstanding |
0.78 | 9,593,750 | ||||||
| Total Exercisable |
0.76 | 7,523,583 | ||||||
During the year ended December 31, 2024, the Company recognized a total of $1,461,500 (December 31, 2023 - $936,802) in share-based payments expense for the options granted and vested during the year. The fair value of options granted during the year ended December 31, 2024 was $0.62 (2023 - $0.66) per option. The weighted average remaining life of the stock options as of December 31, 2024 is 2.60 (December 31, 2023 – 2.44) years.
| 9. |
SHARE CAPITAL (cont’d) |
The following weighted average assumptions were used for the Black-Scholes valuation of stock options granted:
| For the year ended |
December 31, 2024 |
December 31, 2023 |
||||||
| Risk-free interest rate |
3.68 | % | 3.71 | % | ||||
| Expected dividend yield |
0 | % | 0 | % | ||||
| Annualized stock price volatility |
83 | % | 83 | % | ||||
| Expected life of options (in years) |
5 |
5 |
||||||
| Expected forfeiture rate |
0 | % | 0 | % | ||||
Flow-through Premium Liability
The following is a continuity of the liability portion of the flow-through share issuances:
| Balance, December 31, 2022 |
$ | 3,653,886 | ||
| Settlement of flow-through share premium liability pursuant to qualifying expenditures |
(3,653,886 | ) | ||
| Balance, December 31, 2023 |
- | |||
| Flow-through premium liability additions |
7,779,996 | |||
| Settlement of flow-through share premium liability pursuant to qualifying expenditures |
(4,301,284 | ) | ||
| Balance, December 31, 2024 |
$ | 3,478,712 |
Anti-dilution rights agreements
In September 2012, the Company entered into an ancillary rights agreement with Hecla, whereby as long as Hecla holds a pro-rata interest of 10%, it reserves the right to maintain its ownership interest in the event the Company issues any equity securities. In February 2022, the Company entered into an investor rights agreement in relation to the acquisition of Homestake with Fury whereby as long as Fury holds a pro-rata interest of 10%, it reserves the right to maintain its ownership interest in the event the Company issues any equity securities for cash. At December 31, 2024 each of Hecla and Fury owned greater than 10% of the Company.
| 10. |
CAPITAL MANAGEMENT |
The Company’s objectives when managing capital are to safeguard its ability to continue as a going concern to pursue other business opportunities and to maintain a flexible capital structure that optimizes the cost of capital within a framework of acceptable risk. The capital of the Company consists of items within shareholders’ equity.
The Company manages the capital structure and makes adjustments to it in light of changes in economic conditions and the risk characteristics of the underlying assets. To maintain or adjust its capital structure, the Company may issue new shares, issue new debt, or acquire or dispose of assets.
The Company is dependent on the capital markets as its main source of operating capital. The Company’s capital resources are largely determined by the strength of the junior public markets, by the status of the Company’s projects in relation to these markets and its ability to compete for investor support of its projects. There have been no changes to the Company’s approach to capital management during the year ended December 31, 2024. The Company has no capital restrictions other than an anti-dilution right in favor of Hecla and Fury whereby both parties have the right to maintain their equity holdings in the Company (Note 9).
| 11. |
RELATED PARTY TRANSACTIONS |
During the years ended December 31, 2024 and 2023, the Company incurred the following amounts charged by officers and directors (being key management personnel) and companies controlled and/or owned by officers and directors of the Company in addition to the related party transactions disclosed elsewhere in these consolidated financial statements:
| Year ended | ||||||||
| December 31, |
December 31, |
|||||||
| 2024 |
2023 |
|||||||
| Directors’ fees |
$ | 228,400 | $ | 208,100 | ||||
| Exploration and evaluation (3,4) |
722,500 | 567,138 | ||||||
| Management fees (1)(2) |
1,442,200 | 956,200 | ||||||
| Share-based payments (1)(2) |
2,026,036 | 1,380,274 | ||||||
| Total |
$ | 4,419,136 | $ | 3,111,712 | ||||
| (1) |
The Company entered into a consulting service agreement with S2K Capital Corp. and Shawn Khunkhun, Chief Executive Officer and director of the Company. Pursuant to this consulting agreement, Mr. Khunkhun is compensated at a rate of $30,000 (2023 - $28,333) per month, where the increase was effective April 1, 2024. The Company is required to pay an equivalent to 24 months’ pay plus an average of any cash performance bonus paid in the previous two completed financial years if the consulting agreement is terminated by either party absent an event of default during the twelve-month period following the date of a change in control of the Company. During the year ended December 31, 2024, the Company paid a $300,000 bonus related to the year ended December 31, 2023 and made an allowance of $360,000 for amounts expected to be paid in 2025 that relate to the year ended December 31 2024. If the agreement is terminated for reasons other than event of default, the Company is required to pay a sum equal to 12 months’ pay. |
| (2) |
The Company entered into a consulting service agreement with Fehr & Associates and Ann Fehr, Chief Financial Officer (“CFO”) for full outsourced accounting and corporate secretary services. During the year ended December 31 2024 the Company paid an average of $25,144 (2023 - $19,067) per month for CFO and costs related to the controller, bookkeeper and administrative services. Of the amounts paid to Fehr & Associates, $16,667 per month was deemed to be related to CFO services and included in management fees expense, effective April 1, 2024. During the year ended December 31, 2024, the Company paid a $120,000 bonus related to the year ended December 31, 2023 and made an allowance of $100,000 for amounts expected to be paid in 2025 that relate to the year ended December 31 2024. The Company is required to pay an equivalent to 12 months’ pay if the consulting agreement is terminated by either party absent an event of default during the twelve-month period following the date of a change in control of the Company. |
| (3) |
The Company entered into a consulting service agreement with Robert van Egmond, VP Exploration of the Company. Pursuant to this consulting agreement, Mr. van Egmond is compensated at a rate of $22,500 (2023 - $21,667) per month, where the increase was effective April 1, 2024. During the year ended December 31, 2024, the Company paid a $200,000 bonus related to the year ended December 31, 2023 and made an allowance of $135,000 for amounts expected to be paid in 2025 that relate to the year ended December 31 2024. The Company is required to pay the equivalent to 12 months’ pay if the consulting agreement is terminated by either party, absent an event of default, during the twelve-month period following the date of a change in control of the Company. |
| (4) |
The Company paid $120,000 (2023- $168,000) in exploration and evaluation expenses to a company controlled by a director. |
Other related party transactions are as follows:
At December 31, 2024, included in accounts payable is $10,640 (December 31, 2023 - $3,196) owed to officers of the Company.
At December 31, 2024 included in accrued liabilities is $686,750 (December 31, 2023 – $120,000) accrued to officers and directors of the Company.
During the year ended December 31, 2024, $94,537 (September 30, 2023 - $nil) in fees were paid to Fehr & Associates, a corporation controlled by the CFO, that were attributable to costs directly associated with office space, accounting services and administration staff used by the Company.
| 12. |
FINANCIAL INSTRUMENTS AND RISK MANAGEMENT |
The Company’s financial instruments recorded at fair value require disclosure as to how the fair value was determined based on significant levels of input described in the following hierarchy:
| ● |
Level 1 – quoted prices (unadjusted) in active markets for identical assets or liabilities; |
| ● |
Level 2 – inputs other than quoted prices included in Level 1 that are observable for the asset or liability, either directly (i.e., as prices) or indirectly (i.e., derived from prices); and |
| ● |
Level 3 – inputs for the asset or liability that are not based on observable market data (unobservable inputs). |
The Company’s financial instruments include cash and cash equivalents, short term investment, amounts receivable, deposits, accounts payable and accrued liabilities, all of which are measured at amortized cost.
Financial Instruments
The carrying values of cash and cash equivalents, short term investment, amounts receivable, deposits, accounts payable and accrued liabilities approximate fair values due to the short-term nature of these instruments or market rates of interest. The Company's risk exposures and the impact on the Company's financial instruments are summarized below.
Credit Risk
The Company's credit risk is primarily attributable to cash and cash equivalents, short term investment, deposits and amounts receivable. The Company has no significant concentration of credit risk arising from operations. Cash and cash equivalents consists of bank balances and demand guaranteed investment certificates at reputable financial institutions, from which management believes the risk of loss to be remote. Amounts receivable and deposits are due from government agencies.
The Company limits its exposure to credit risk for cash by placing it with high quality financial institutions.
Liquidity Risk
The Company’s ability to remain liquid over the long term depends on its ability to obtain additional financing through the issuance of additional securities, entering into credit facilities, or entering into joint ventures, partnerships or other similar arrangements. The Company’s ability to continue as a going concern is dependent upon its ability to continue to raise adequate financing in the future to meet its obligations and repay its liabilities arising from normal business operations when they come due. As at December 31, 2024, the Company had cash and cash equivalents and short term investment of $34,177,599 to settle current liabilities of $913,177 (excluding liability on flow-through share issuances).
Interest Rate Risk
The Company has cash and cash equivalent balances subject to fluctuations in the prime rate. The Company periodically monitors the investments it makes and is satisfied with the credit ratings of its banks. Management believes that interest rate risk is remote, as investments are redeemable at any time and interest can be earned up to the date of redemption.
Price Risk
The Company is exposed to price risk with respect to commodity prices. The Company’s future mining operations will be significantly affected by changes in the market price for silver. Precious metal prices fluctuate daily and are affected by numerous factors beyond the Company’s control. The supply and demand for commodities, level of interest rates, rate of inflation, investment decisions by large holders of commodities and stability of exchange rates can all cause significant fluctuations in commodity prices.
| 13. |
SEGMENTED INFORMATION |
The Company operates in one reportable segment, the exploration and development of unproven exploration and evaluation assets. The Company’s primary exploration and evaluation assets are located in British Columbia, and its corporate assets, comprising mainly of cash, are located in Canada. The Company is in the exploration stage and has no reportable segment revenues or operating results. All corporate expenses are incurred in Canada.
| 14. |
INCOME TAX |
A reconciliation of income taxes at statutory rates with the reported taxes is as follows:
| Year ended December 31, 2024 |
Year ended December 31, 2023 |
|||||||
| Loss for the year |
$ | (20,649,147 | ) | $ | (26,650,462 | ) | ||
| Expected income tax recovery |
(5,575,000 | ) | (7,196,000 | ) | ||||
| Change in statutory rates and other |
- | 256,000 | ||||||
| Permanent difference |
(407,000 | ) | (445,000 | ) | ||||
| Impact of flow through share issuance |
4,355,000 | 5,553,000 | ||||||
| Share issuance costs |
(812,000 | ) | (19,000 | ) | ||||
| Adjustment to prior years provision versus statutory tax returns and expiry of non-capital losses | 196,000 | (284,000 | ) | |||||
| Change in unrecognized deductible temporary differences |
2,243,000 | 2,135,000 | ||||||
| Total income tax expense (recovery) |
$ | - | $ | - | ||||
The significant components of the Company’s unrecorded deferred tax assets and liabilities are as follows:
| Year ended December 31, 2024 |
Year ended December 31, 2023 |
|||||||
| Deferred tax assets: |
||||||||
| Exploration and evaluation assets |
$ | 8,451,000 | $ | 7,557,000 | ||||
| Property and equipment |
245,000 | 194,000 | ||||||
| Share issuance costs |
933,000 | 513,000 | ||||||
| Non-capital losses available for future periods |
13,622,000 | 12,744,000 | ||||||
| $ | 23,251,000 | $ | 21,008,000 | |||||
| Unrecognized deferred tax assets |
(23,251,000 | ) | (21,008,000 | ) | ||||
| Net deferred tax assets |
$ | - | $ | - | ||||
| 14. | INCOME TAX (cont’d) |
The Company’s unrecognized deductible temporary differences, tax credits and tax losses are as follows:
| As at December 31, |
As at December 31, |
|||||||||||
| 2024 |
2023 |
|||||||||||
| Temporary Differences: |
||||||||||||
| Investment tax credit |
$ | 711,000 | 2032 -2040 | $ | 711,000 | |||||||
| Property and equipment |
$ | 905,000 | No expiry date |
$ | 718,000 | |||||||
| Exploration and evaluation assets |
$ | 29,378,000 | No expiry date |
$ | 26,068,000 | |||||||
| Share issuance costs |
$ | 3,454,000 | 2045 to 2048 | $ | 1,902,000 | |||||||
| Non-capital losses available for future periods |
$ | 50,453,000 | 2026 to 2044 | $ | 47,200,000 | |||||||
| 15. |
SUBSEQUENT EVENT |
Subsequent to December 31, 2024, the Company issued 236,250 common shares pursuant to the exercise of stock options for proceeds of $128,062.
Exhibit 8.1 - List of Subsidiaries of Fury Gold Mines Limited
The subsidiaries (with a beneficial interest of 100%) of the Company as at December 31, 2024 were as follows:
|
Subsidiary |
Place of incorporation |
Functional currency |
|
Eastmain Mines Inc. (“Eastmain Mines”) (a) |
Canada |
CAD |
|
Eastmain Resources Inc. (“Eastmain”) |
ON, Canada |
CAD |
|
Fury Gold USA Limited (“Fury Gold USA”) (b) |
Delaware, U.S.A. |
USD |
|
North Country Gold Corp. (“North Country”) |
BC, Canada |
CAD |
(a) The entity is incorporated federally in Canada.
(b) Fury Gold USA provided certain administrative services with respect to employee benefits for US resident personnel.
Exhibit 11.1
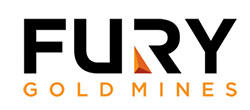
FURY GOLD MINES LIMITED
CODE OF BUSINESS CONDUCT AND ETHICS
(Effective January 1, 2025)
|
1. |
PURPOSE OF THIS CODE |
1.1 This Code of Business Conduct and Ethics (“Code”) is intended to document the principles of conduct and ethics to be followed by employees, contractors, officers and directors of Fury Gold Mines Limited (the “Company”). Its purpose is to:
|
(a) |
promote honest and ethical conduct, including the ethical handling of actual or apparent conflicts of interest between personal and professional relationships; |
|
(b) |
promote avoidance of conflicts of interest, including disclosure to an appropriate person of any material transaction or relationship that reasonably could be expected to give rise to such a conflict; |
|
(c) |
promote full, fair, accurate, timely and understandable disclosure in reports and documents that the Company files with, or submits to, the securities regulators and in other public communications made by the Company; |
|
(d) |
promote compliance with applicable governmental laws, rules and regulations; |
|
(e) |
promote the prompt internal reporting to an appropriate person of violations of this Code; |
|
(f) |
promote accountability for adherence to this Code; |
|
(g) |
provide guidance to employees, contractors, officers and directors to help them recognize and deal with ethical issues; |
|
(h) |
provide mechanisms to report unethical conduct; and |
|
(i) |
help foster the Company’s culture of honesty, integrity and accountability. |
1.2 The Company expects all its employees, contractors, officers and directors to comply at all times with the principles in this Code. Violations of this Code are grounds for disciplinary action up to and including immediate termination of employment and possible legal prosecution. For the purpose of this Code, the Company’s Chief Risk Officer shall be its Chief Financial Officer.
|
2. |
RESPONSIBILITY |
2.1 This Code outlines a framework of guiding principles. As with any statement of policy, the exercise of judgment is required in determining the applicability of this Code to each individual situation.
2.2 It is the responsibility of every Company employee, contractor, officer and director to read and understand the Code. Individuals must comply with the Code in both letter and spirit. Ignorance of the Code will not excuse individuals from its requirements.
|
3. |
COMPLIANCE WITH LAW |
3.1 Each employee, contractor, officer and director must at all times comply fully with applicable laws and avoid any situation that could be perceived as improper, unethical or indicate a casual attitude towards compliance with the law.
3.2 No employee, contractor, officer or director shall commit or condone an illegal act or instruct another employee to do so.
3.3 Employees, contractors, officers and directors are expected to be sufficiently familiar with any legislation that applies to their circumstances and shall recognize potential liabilities, seeking advice where appropriate.
3.4 When in doubt, employees, contractors, officers and directors are expected to seek clarification from their immediate supervisor or the Chief Risk Officer.
3.5 Where it is not possible for the employee, contractor officer or director to address a particular concern in consultation with his/her immediate supervisor or the Chief Risk Officer, they may seek clarification from the Audit Committee Chairperson. An email may be sent via confidential e-mail to the Audit Committee Chairperson at auditcommchair@furygoldmines.com.
|
4. |
CONFLICTS OF INTEREST |
4.1 Employees, contractors, officers, and directors shall avoid situations in which their personal interests could conflict with, or appear to conflict with, the interests of the Company and its shareholders.
4.2 Conflicts of interest arise where an individual’s position or responsibilities with the Company present an opportunity for personal gain apart from the normal rewards of employment to the detriment of the Company. They also arise where an individual’s personal interests are inconsistent with those of the Company and create conflicting loyalties. Such conflicting loyalties can cause an individual to give preference to personal interests in situations where corporate responsibilities should come first. Employees, contractors, officers and directors, shall perform the responsibilities of their positions on the basis of what is in the best interests of the Company and free from the influence of personal considerations and relationships.
4.3 If a potential conflict of interest arises and the individual involved is an employee of the Company, the individual involved must immediately notify their immediate supervisor and the Company’s Chief Risk Officer or the Audit Committee Chairperson as defined in the Audit Committee Charter, in writing and no further action may be taken unless authorized in writing by the individual’s immediate supervisor and by the Company’s Chief Risk Officer, or the Audit Committee Chairperson. If such individual is an officer or director of the Company, a Board member of the Company as appointed from time to time, (the “Lead Independent Director/Chair”) as well as the Company’s Chief Risk Officer must be immediately notified in writing and no further action may be taken until authorized in writing by the Lead Independent Director/Chair and by the Company’s Chief Risk Officer.
4.4 The requirement of freedom from conflict of interest applies with equal force to the spouse, children and other close relatives of each employee, contractor, officer and director. This policy applies to all employees, contractors, officers and directors of the Company with respect to all of the affairs of the Company.
4.5 While it is not possible to detail every situation where conflicts of interest may arise, the following policies cover the areas that have the greatest potential for conflict:
|
(a) |
Speculation in Company Securities and Use of Inside Information |
Numerous laws, both federal and provincial, regulate transactions in corporate securities and the securities industry. Violation of these laws may lead to civil and criminal actions against the individual and the company involved. All employees, contractors, officers and directors will take all steps to be in compliance with such laws and in order to do so will adhere to the Disclosure, Confidentiality and Insider Trading Policy.
|
(b) |
Personal Financial Interest |
Employees, contractors, officers and directors, should avoid any outside financial interests which might influence their corporate decisions or actions. An employee of the Company whose corporate duties bring them into business dealings with a business in which they or a member of their family has a financial interest or to which they or a member of their family has an indebtedness, or a business employing a relative or close friend, must immediately notify his or her immediate supervisor and the Company’s Chief Risk Officer in writing, and a transaction may not be completed unless properly authorized in writing by both the employee’s immediate supervisor and the Company’s Chief Risk Officer, after full disclosure of the relationship in writing. An officer or director of the Company whose corporate duties bring them into business dealings with a business in which they or a member of their family has a financial interest or to which they or a member of their family has an indebtedness, or a business employing a relative or close friend, must immediately notify the Lead Independent Director/Chair of the Company as well as the Company’s Chief Risk Officer and a transaction may not be completed unless properly authorized in writing by both the Lead Independent Director/Chair and the Company’s Chief Risk Officer, after full disclosure of the relationship in writing.
An employee, officer or director may not perform work or services for an organization doing or seeking to do business with the Company without appropriate prior written approval of such individual’s immediate supervisor and the Company’s Chief Risk Officer in the case of an employee, and of the Lead Independent Director/Chair and the Company’s Chief Risk Officer, in the case of an officer or director of the Company. An employee, officer or director may not be a director, officer, partner or consultant of an organization (other than an organization in which the Company holds an interest or in which the Company has the right to nominate a director, officer, partner or consultant) doing or seeking to do business with the Company, nor may they permit their name to be used in any way indicating a business connection with such an organization, without appropriate prior written approval of their immediate supervisor and the Chief Risk Officer in the case of an employee, and of the Lead Independent Director/Chair and the Company’s Chief Risk Officer in the case of an officer or director of the Company.
An employee shall not accept for themselves, or for the benefit of any relative or friend, any payments, loans, services, favours involving more than ordinary social amenity, or gifts of more than nominal value from any organization doing or seeking to do business with the Company, except in accordance with this Code and within normal business practices.
|
(c) |
Outside Activities |
Employees and officers of the Company should avoid outside activities which would impair the effective performance of their responsibilities to the Company, either because of demands on their time, or because the outside commitments can be contrary to their obligations to the Company.
|
(d) |
Protection and Proper Use of Company Assets |
All employees, contractors, officers and directors have an obligation to protect the Company’s assets, including opportunity, information and the Company’s name, and ensure their efficient use. Theft, carelessness and waste have a direct impact on the Company’s profitability. All of the Company’s assets must be used only for legitimate business purposes and not for personal use.
|
(e) |
Corporate Opportunities |
Officers and directors will not (a) take for themselves personally, opportunities that are discovered through the use of corporate property, information or position; (b) use corporate property, information, or position for personal gain; or (c) compete with the Company, in a manner which conflicts with fiduciary and other duties under the Canada Business Corporations Act and other applicable law. Officers and directors owe a duty to the Company to advance its legitimate interests when the opportunity to do so arises.
Employees will not (a) take for themselves personally opportunities that are discovered through the use of corporate property, information or position; (b) use corporate property, information, or position for personal gain; or (c) compete with the Company, without appropriate prior written approval of such individual’s immediate supervisor and the Company’s Chief Risk Officer.
|
5. |
FAIR DEALING |
5.1 Directors, management and employees should endeavour to deal fairly with the Company’s clients, service providers, suppliers, and employees. No director should take unfair advantage of anyone through manipulation, concealment, abuse of privileged information, misrepresentation of material facts or any unfair dealing practice.
|
6. |
COMPETITIVE PRACTICES |
6.1 Management of the Company firmly believes that fair competition is fundamental to continuation of the free enterprise system. The Company complies with and supports laws of all countries which prohibit restraints of trade, unfair practices, or abuse of economic power.
6.2 The Company will not enter into arrangements which unlawfully restrict its ability to compete with other businesses, or the ability of any other business organization to compete freely with the Company. Company policy also prohibits employees, officers and directors from entering into, or even discussing, any unlawful arrangement or understanding.
6.3 These principles of fair competition are basic to all the Company’s operations. They are integral parts of the following sections that cover the Company’s dealings with suppliers and public officials.
|
7. |
DEALING WITH SUPPLIERS |
7.1 The Company is a valuable customer for many suppliers of goods, services and facilities. People who want to do business, or to continue to do business, with the Company must understand that all purchases by the Company will be made exclusively on the basis of price, quality, service and suitability to the Company’s needs.
|
7.2 |
“Kickbacks” and Rebates. |
7.2.1 Purchases of goods and services by the Company must not lead to employees, contractors, officers or directors, or their families, receiving any type of personal kickbacks or rebates. Employees, contractors, officers or directors, or their families, must not accept any form of “under-the-table” payment.
|
7.3 |
Receipt of Gifts and Entertainment. |
7.3.1 Even when gifts and entertainment are exchanged out of the purest motives of personal friendship, they can be misunderstood. They can appear to be attempts to bribe the Company’s employees, officers or directors into directing business of the Company to a particular supplier. To avoid both the reality and the appearance of improper relations with suppliers or potential suppliers, the following standards will apply to the receipt of gifts and entertainment by employees, officers and directors of the Company:
|
(a) |
Gifts |
(i) Employees, officers and directors are prohibited from soliciting gifts, gratuities, or any other personal benefit or favor of any kind from suppliers or potential suppliers. Gifts include not only merchandise and products but also personal services and tickets to sports or other events. The Company acknowledges however that as part of normal good business relationships, suppliers may offer tickets to sports and other events, meals and other forms of normal client development gifts or services. Employees, officers and directors are prohibited from accepting gifts of money.
(ii) Employees, officers and directors may accept unsolicited non- monetary gifts provided:
|
(A) |
they are items of nominal intrinsic value; |
|
(B) |
they are appropriate and customary client development gifts for the industry, and they may not reasonably be considered extravagant for such employee, officer or director; or |
|
(C) |
they are advertising and promotional materials, clearly marked with the company or brand names. |
(iii) Any gift falling outside of the above guidelines must be reported to the Company’s Chief Risk Officer to determine whether it can be accepted.
(iv) In the transaction of some international business, it is lawful and customary for business leaders in some countries to give unsolicited gifts to employees, officers or directors of the Company. These gifts can be of more than nominal value. Moreover, under the circumstances, returning the gifts or payment for them may constitute an affront to the giver. In such cases, the gift must be reported to the Company’s Chief Risk Officer who may permit the retaining of the gifts.
(v) In all other instances where gifts cannot be returned or may adversely affect the Company’s continuing business relationships, the Company’s Chief Risk Officer must be notified. The Company’s Chief Risk Officer can require employees, officers and directors to transfer ownership of such gifts to the Company.
|
(b) |
Entertainment |
(i) Employees, officers and directors shall not encourage or solicit entertainment from any individual or company with whom the Company does business. Entertainment includes, but is not limited to, activities such as dining, attending sporting or other special events, and travel.
(ii) From time to time employees, officers and directors may accept unsolicited entertainment, but only under the following conditions:
|
(A) |
the entertainment occurs infrequently; |
|
(B) |
it arises out of the ordinary course of business; |
|
(C) |
it involves reasonable expenditures (the amounts involved should be ones employees, officers and directors are accustomed to normally spending for their own business or personal entertainment); and |
|
(D) |
the entertainment takes place in settings that also are reasonable, appropriate, and fitting to employees, officers and directors, their hosts, and their business at hand. |
|
8. |
DEALING WITH PUBLIC OFFICIALS |
8.1 Domestic and foreign laws and regulations require the Company to be in contact with public officials on a wide variety of matters. Employees, officers and directors who regularly make these contacts have special responsibilities for upholding the Company’s good name.
8.2 No employee shall make any form of payment, direct or indirect, to any public official as inducement to procuring or keeping business or having a law or regulation enacted, defeated, or violated.
8.3 When not prohibited by law, employees, officers and directors are allowed to give to public officials gifts where the presentation and acceptance of gifts is an established custom and a normal business practice. All such gifts shall be of reasonable value and the presentation approved in advance by the Company’s Chief Risk Officer. Moreover, such gifts must be presented in a manner that clearly identifies the Company and the occasion that warrants the presentation.
8.4 On special ceremonial occasions, senior officers of the Company may publicly give gifts of more than nominal value to public institutions and public bodies, these gifts must be approved in advance by the Company’s Chief Risk Officer. Such gifts can commemorate special events or milestones in the Company’s history.
8.5 From time to time employees, officers and directors may entertain public officials, but only under the following conditions:
|
(a) |
it is legal and permitted by the entity represented by the official; |
|
(b) |
the entertainment is not solicited by the public official; |
|
(c) |
the entertainment occurs infrequently; |
|
(d) |
it arises out of the ordinary course of business; |
|
(e) |
it does not involve lavish expenditures, considering the circumstances; and |
|
(f) |
the settings and types of entertainment are reasonable, appropriate and fitting to the Company’s employees, officers or directors, their guests, and the business at hand. |
|
9. |
POLITICAL ACTIVITIES AND CONTRIBUTIONS |
|
(a) |
Canada |
|
(i) |
Employees, contractors, officers and directors who participate in political activities must make every effort to ensure that they do not leave the impression that they speak or act for the Company. |
|
(ii) |
The Company encourages its employees, officers and directors to participate in political activities in their own time and at their sole expense. No corporate action, direct or indirect, will be allowed that infringes on the right of any employee individually to decide whether, to whom, and in what amount, they will make personal political contributions. The same is true of volunteer political donations of personal service time, so long as it does not interfere with the working status of employees, officers or directors. |
|
(b) |
Outside Canada |
|
(i) |
No employees, officers and directors are permitted to use the Company’s funds, facilities, or other assets, to support either directly or indirectly any political candidates or political parties, without advance authorization in writing from the Company’s Chief Risk Officer. The policy of the Company is that officers, directors and employees should not participate in political activities in countries of which they are not nationals. However, such persons, of course, are free to participate in political activities in countries of which they are nationals in their own time and at their own expense. |
|
10. |
EQUAL OPPORTUNITY |
10.1 The Company supports the principle that every individual must be accorded an equal opportunity to participate in the free enterprise system and to develop their ability to achieve their full potential within that system.
10.2 There shall be no discrimination against any employee, contractor or applicant because of race, religion, color, sex, sexual orientation, age, national or ethnic origin, or physical handicap (unless demands of the position are prohibitive). All employees, contractors, officers and directors will be treated with equality during their employment without regard to their race, religion, color, sex, sexual orientation, age, national or ethnic origin, or physical handicap, in all matters, including employment, upgrading, promotion, transfer, layoff, termination, rates of pay, selection for training and recruitment. The Company will maintain a work environment free of discriminatory practice of any kind.
10.3 No employee, contractor, officer or director shall have any authority to engage in any action or course of conduct or to condone any action or course of conduct by any other person which shall in any manner, directly or indirectly, discriminate or result in discrimination in the course of employment, termination of employment, or any related matter where such discrimination is, directly or indirectly, based upon race, religion, color, sex, sexual orientation, age, national or ethnic origin, or physical handicap.
|
11. |
HEALTH, SAFETY, AND ENVIRONMENTAL PROTECTION |
11.1 It is the Company’s policy to pay due regard to the health and safety of its employees, contractors, officers and directors and others and to the state of the environment. There are federal, provincial, state and local workplace safety and environmental laws which through various governmental agencies regulate both physical safety of employees, contractors, officers and directors and their exposure to conditions in the workplace. Should an employee, contractor, officer or director be faced with an environmental health issue or have a concern about workplace safety, they should contact the Technical, Health, Safety & Environment Committee (“THSE”) immediately. Any violations of laws or regulations governing workplace safety and the environment must be reported as soon as practicable, and it is the observer’s responsibility to do so.
11.2 Many countries and their regional and local governments now have complex legislation to protect the health and safety of employees, or the general public, and to prevent pollution and protect the environment. These laws often provide penalties both for the companies involved and executive personnel in case of violation. The THSE Committee should always be consulted when necessary to understand or comply with such laws.
|
12. |
WORK ENVIRONMENT |
12.1 The Company is committed to ensuring and promoting a safe and healthy working environment for all employees, free from violent threats, behaviour and actions and of harassment by another employee, contractor or visitor. Employees, officers and directors must treat each other with professional courtesy, dignity and respect at all times. Employees, contractors, officers and directors must read and abide by the provided Company Anti-Harassment Policy.
|
13. |
INTEGRITY OF RECORDS AND FINANCIAL REPORTS |
13.1 As a public company, it is of critical importance that the Company’s filings with the appropriate regulatory authorities be accurate and timely. Depending on their position with the Company, an employee, contractor, officer or director may be called upon to provide necessary information to ensure that the Company’s public reports are complete, fair and understandable. The Company expects employees, contractors, officers and directors to take this responsibility very seriously and to provide prompt accurate answers to inquiries related to the Company’s public disclosure requirements.
13.2 The integrity of the Company’s record keeping systems will be respected at all times. Employees, contractors, officers and directors are forbidden to use, authorize, or condone the use of “off-the-books” bookkeeping, secret accounts, unrecorded bank accounts, “slush” funds, falsified books, or any other devices that could be utilized to distort records or reports of the Company’s true operating results and financial condition or could otherwise result in the improper recordation of funds or transactions.
|
14. |
USE OF AGENTS AND NON-EMPLOYEES, OFFICERS AND DIRECTORS |
14.1 Agents or other non-employees cannot be used to circumvent the law. Employees, contractors, officers and directors will not retain agents or other representatives to engage in practices that run contrary to this Code.
|
15. |
INTERNATIONAL OPERATIONS |
15.1 Corporate employees, contractors, officers and directors operating outside of Canada have a special responsibility to know and obey the laws and regulations of countries where they act for the Company. Customs vary throughout the world, but all employees, contractors, officers and directors must diligently uphold the integrity of the Company in other nations.
|
16. |
PROFESSIONALISM AND REPUTATION |
16.1 Employees are expected to act in a professional manner at all times, both in the workplace and in any external or public-facing contexts. This includes refraining from any actions or communications that may harm the reputation or integrity of the company. Employees must avoid engaging in behavior, including but not limited to, posting on social media platforms, making public statements, or participating in activities that reflect negatively on the company’s image, values, or business interests. This expectation extends to all forms of communication, whether online or offline, and applies during both work and personal time when representing or associating with the company. Any behavior that damages the company's reputation may result in disciplinary action.
|
17. |
CONFIDENTIALITY |
17.1 Employees, contractors, officers and directors will comply with the Disclosure, Confidentiality and Insider Trading Policy of the Company (the “Policy”). Employees, contractors, officers and directors should review and become thoroughly familiar with the Policy and are encouraged to review the Policy throughout the year.
|
18. |
STANDARDS OF COMPLIANCE |
|
(a) |
Initial Distribution |
|
(i) |
Current employees, contractors, officers and directors designated to receive the Code will receive their copies immediately after publication. |
|
(ii) |
Future employees, contractors, officers and directors designated to receive the Code will receive their copies at the time they are hired. |
|
(b) |
Initial Verification |
|
(i) |
Upon receiving their copy of this Code, current and future employees, contractors, officers and directors will: |
|
(ii) |
Become thoroughly familiar with this Code. |
|
(iii) |
Resolve any doubts or questions about the Code with their supervisors or the Chief Risk Officer. |
|
(iv) |
Inform their supervisors and the Chief Risk Officer, or the Audit Committee Chairperson, of any existing holdings or activities that might be, or appear to be, at variance with this Code. |
|
(v) |
Prepare written disclosures of such information, if requested, by supervisors or the Chief Risk Officer. |
|
(vi) |
Take steps to correct existing situations and bring holdings and activities into full compliance with this Code. |
|
(c) |
Maintaining Compliance |
|
(i) |
Employees, contractors, officers and directors have the responsibility to maintain their understanding of this Code. |
|
(ii) |
Supervisors have the responsibility to maintain an awareness on the part of their employees of the importance of their adhering to this Code and for reporting deviations to management. |
|
(iii) |
As requested by the Board of Directors or senior management, employees, contractors, officers and directors will be asked to re-verify their understanding of this Code and their compliance with this Code from time to time. |
|
(iv) |
Employees, contractors, officers and directors must inform their supervisors or the Chief Risk Officer of any changes in their holdings or activities that might be, or appear to be in non-compliance with this Code. |
|
(v) |
Employees, contractors, officers and directors must prepare written disclosure of such information, if requested. |
|
(vi) |
Employees, contractors, officers and directors must take steps to correct any such changes, if necessary, to bring holdings and activities into full compliance with this Code. Such steps will be approved in writing and will be based on the written disclosures submitted by employees, contractors, officers and directors. |
|
(d) |
Audits of Compliance |
|
(i) |
Regular audits of the Company will include procedures to test compliance with this Code. |
|
19. |
VIOLATIONS OF STANDARDS |
19.1 Employees, contractors, officers and directors must immediately report any violations of this Code. Failure to do so can have serious consequences for the employees, contractors, officers or directors and the Company.
19.2 Reports of violations should be made by employees and contractors to their immediate supervisor and to the Company’s Chief Risk Officer, or the Audit Committee Chairperson, and by officers and directors to the Lead Independent Director and/or Chair of the Board and to the Company’s Chief Risk Officer.
19.3 After a violation is investigated, appropriate action will be taken. Management has the right to determine the appropriate disciplinary action for a violation up to and including termination of employment. All proposed disciplinary action is subject to review by senior management.
19.4 Employees, contractors, officers and directors should be aware that in addition to any disciplinary action taken by the Company, violations of some of this Code may require restitution and may lead to civil or criminal action against individual employees, contractors, officers and directors and any company involved.
19.5 Supervisors have the responsibility of taking remedial steps to correct any operating procedures that may contribute to violations of this Code.
19.6 Retaliation in any form against an individual who reports a violation of this Code or who assists in the investigation of a reported violation, is itself a serious violation of this policy. Acts of retaliation should be reported immediately to their supervisor and the Chief Risk Officer, or the Audit Committee Chairperson.
|
20. |
AMENDMENT, MODIFICATION AND WAIVER |
20.1 The Company will periodically review this Code. This Code may be amended, modified or waived by the Board of Directors and waivers may also be granted by the Audit Committee, provided that any waivers granted to directors or executive officers of the Company by the Audit Committee must also be approved by the Board. Employees, contractors, officers and directors will be fully informed of any material revisions to the Code.
|
21. |
COMMITMENT |
21.1 To demonstrate its determination and commitment, the Company asks each employee and contractor to review the Code periodically throughout the year and discuss with management any circumstances that may have arisen that could be an actual or potential violation of these ethical standards of conduct.
21.2 Directors and officers are required to acknowledge they have read this Code annually. Employees and contractors are required to sign the Code when they are engaged or when the Code is introduced.
21.3 The director/officer/employee understands the policies and procedures relating to the ECOLOGO® UL2723 / UL2724 certification program and commits to ensure that they are respected and applied.
SCHEDULE “A”
|
Certification – Code of Business Conduct and Ethics of Fury Gold Mines Limited |
||||
|
The undersigned hereby certifies that they have read and understand the Company’s Code of Business Conduct and Ethics, a copy of which is attached hereto, and agree to promote and comply with the principles, procedures, and terms and conditions set forth therein. |
||||
|
Date: |
Signature: |
|||
|
Name: |
||||
|
(please print) |
||||
Exhibit 11.2
FURY GOLD MINES LIMITED
INSIDER TRADING POLICY
(Effective January 1, 2025)
|
1. |
INTRODUCTION |
Fury Gold Mines Limited (the “Company”) encourages all employees, officers and directors to become shareholders of the Company on a long-term investment basis. These individuals will from time to time become aware of corporate developments or plans or other information that may affect the value of the Company’s securities before these developments, plans and/or information are made public. Trading securities of the Company while in possession of such information before it is generally disclosed (known as “insider trading”), or disclosing such information to third parties before it is generally disclosed (known as “tipping”), is against the law and may expose an individual to criminal prosecution or civil lawsuits. Such action will also result in a lack of confidence in the market for the Company’s securities, harming both the Company and its shareholders. Accordingly, the Company has established this Insider Trading Policy (the “Policy”) to assist its employees, consultants, service providers, officers and directors in complying with the prohibitions against insider trading and tipping.
The Company is a publicly traded company listed on the Toronto Stock Exchange (the “TSX”) and the NYSE American LLC (the “NYSE American”, and together with the TSX, the “Exchanges”). As such, trades in the Company’s securities are subject to Canadian and U.S. securities laws, rules and regulations, as well as the rules and regulations of the Exchanges (collectively, “Securities Laws”).
The procedures and restrictions set forth in this Policy are only a general framework to assist Company Personnel, as defined below, in ensuring that any purchase or sale of securities occurs without actual or perceived violation of applicable Securities Laws. Company Personnel have the ultimate responsibility for complying with applicable Securities Laws and should obtain additional guidance, including independent legal advice, as may be appropriate for their own circumstances.
The Company’s Board of Directors (the “Board”) will designate one or more individuals from time to time as insider trading policy administrators (the “Insider Policy Administrator”) for the purpose of administering this Policy. At the date hereof, the designated Insider Trading Policy Administrators are the Chief Executive Officer and the Chief Financial Officer. This Policy has been reviewed and approved by the Company’s Board of Directors and may be reviewed and updated periodically by the Disclosure Committee and the Nominating, Compensation and Governance Committee. Any amendments to this Policy shall be subject to approval by the Company’s Board of Directors.
|
2. |
APPLICATION |
|
2.1 |
Persons that are Subject to this Policy |
The following persons are required to observe and comply with this Policy:
|
(a) |
all directors, officers and employees of the Company or its subsidiaries; |
|
(b) |
any other person retained by or engaged in business of professional activity with or on behalf of the Company or any of its subsidiaries (such as a consultant, independent contractor, adviser or other service provider); |
|
(c) |
any family member, spouse or other person living in the household or a dependent child of any of the individuals referred to in Sections 2.1(a) and (b) above; and |
|
(d) |
partnerships, trusts, corporations, R.R.S.P.’s, T.F.S.A.’s and similar entities over which any of the above-mentioned individuals exercise control or direction. |
For the purposes of this Policy, the persons listed above are collectively referred to as “Company Personnel”. Sections 2.1(c) and (d) should be carefully reviewed by Company Personnel; those sections have the effect of making various family members or holding companies or trusts of the persons referred to in Sections 2.1(a) and (b) subject to the Policy.
|
2.2 |
Trades that are Subject to this Policy |
Under this Policy, all references to trading in securities of the Company include: (a) any sale or purchase of securities of the Company, including the exercise of stock options granted under the Company’s stock option plan and the acquisition of shares or any other securities pursuant to any Company benefit plan or arrangement, and (b) any derivatives-based or other transaction or arrangement that would be required to be reported by insiders in accordance with applicable laws or regulations relating to derivatives or equity monetization transactions (including Multilateral Instrument 55-103 – Insider Reporting for Certain Derivative Transactions (Equity Monetization (“MI 55-103”)).
|
3. |
INSIDE INFORMATION |
“Inside Information” means:
|
(a) |
a change in the business, operations or capital of the Company that would reasonably be expected to have a significant effect on the market price or value of the securities of the Company (which includes any decision to implement such a change by the Company’s Board of Directors or by senior management who believe that confirmation of the decision by the Company’s Board of Directors is probable); |
|
(b) |
a fact that significantly affects, or would reasonably be expected to have a significant effect on, the market price or value of the securities of the Company; and |
|
(c) |
any information which is not generally available to the public if there is a substantial likelihood that a reasonable shareholder would consider it important in making an investment decision or the reasonable investor would view the information as having significantly altered the ‘total mix’ of information available. |
In each case, information which has not been generally disclosed. Examples of information that may constitute Inside Information are set out in Schedule “A” attached hereto. It is the responsibility of any Company Personnel contemplating a trade in securities of the Company to determine prior to such trade whether he or she is aware of any information that constitutes Inside Information. If in doubt, the individual should consult with an Insider Trading Policy Administrator, the CFO or the CEO. In addition, Section 6.2 of this Policy requires that certain Personnel pre-clear trades in securities of the Company.
|
4. |
PROHIBITION AGAINST TRADING ON INSIDE INFORMATION |
Company Personnel must not purchase, sell or otherwise trade securities of the Company with the knowledge of Inside Information until:
|
(a) |
Two full trading days after the disclosure to the public of the Inside Information, whether by way of press release or a filing made with securities regulatory authorities; or |
|
(b) |
the Inside Information ceases to be material (e.g. a potential transaction that was the subject of the information is abandoned, and either Company Personnel are so advised by the Insider Trading Policy Administrators or such abandonment has been generally disclosed). |
In addition, Company Personnel must not make any trades in securities of the Company during the black-out periods described in Section 6 of this Policy.
5. PROHIBITION AGAINST SPECULATING, SHORT-SELLING, PUTS AND CALLS
Certain types of trades in securities of the Company by Company Personnel can raise particular concerns about potential breaches of applicable securities law or that the interests of the persons making the trade are not aligned with those of the Company. Company Personnel are therefore prohibited at any time from, directly or indirectly, undertaking any of the following activities:
|
(a) |
speculating in securities of the Company, which may include buying with the intention of quickly reselling such securities, or selling securities of the Company with the intention of quickly buying such securities (other than in connection with the acquisition and sale of shares issued under the Company’s stock option plan or any other Company benefit plan or arrangement); |
|
(b) |
buying the Company’s securities on margin; |
|
(c) |
short selling a security of the Company or any other arrangement that results in a gain only if the value of the Company’s securities declines in the future; |
|
(d) |
selling a “call option” giving the holder an option to purchase securities of the Company; and |
|
(e) |
buying a “put option” giving the holder an option to sell securities of the Company. |
|
6. |
RESTRICTIONS ON TRADING OF COMPANY SECURITIES |
|
6.1 |
Black-out Periods and Notice |
Black-out periods may be prescribed from time to time by the Disclosure Committee and or the Board at any time at which it is determined there may be undisclosed Inside Information concerning the Company that makes it inappropriate for Company Personnel to be trading. In such circumstances, the Insider Trading Policy Administrators will issue a notice instructing these individuals not to trade in securities of the Company until further notice. This notice will contain a reminder that the fact that there is a restriction on trading may itself constitute Inside Information or information that may lead to rumours and must be kept confidential. If persons who are subject to this policy are ever in any doubt as to whether or not they are able to trade, they should confer with the Insider Trading Policy Administrator, the CFO or CEO prior to trading.
The Insider Trading Policy Administrator or an authorized representative of the Company as designated by the Chief Executive Officer from time to time will keep a record of the individuals who are subject to the conditions of the black-out.
Protocol for Dealing in the Company’s Securities
In order to enhance compliance with insider trading legislation, the Company has made the following provision for black-out periods during which Company Personnel are prohibited from trading.
Unscheduled developments include but are not limited to Insider Information such as significant corporate acquisitions, divestitures, contract negotiations, material new information regarding Company’s resources, reserves and activity, asset write downs or transactions that will generally result in a material change in the affairs of the Company.
|
(a) |
The black-out period begins as soon as management is aware of a development that has been confirmed and continues until material information has been publicly disseminated, terminating after four hours for release of exploration results and after one day for material transactions or other material corporate information after the disclosure to the public of the Inside Information, whether by way of press release or a filing made with securities regulatory authorities; which minimum period is subject to increase at the discretion of the board of directors from time to time. |
|
6.2 |
Exemptions |
Individuals subject to a black-out period who wish to trade securities of the Company may apply to an Insider Trading Policy Administrator for approval to trade securities of the Company during the black-out period. Any such request should describe the nature of and reasons for the proposed trade. The Insider Trading Policy Administrator will consider such requests and inform the requisitioning individual whether or not the proposed trade may be made. The requisitioning individual may not make any such trade until he or she has received the specific approval from an Insider Trading Policy Administrator.
|
7. |
PROHIBITION AGAINST TIPPING |
Company Personnel are prohibited from communicating Inside Information to any person outside the Company, unless: (a) disclosure is in the necessary course of the Company’s business provided that the person receiving such information first enters into a confidentiality agreement in favour of the Company (which should contain, among other things, an acknowledgement by the recipient of the requirements of applicable securities laws relating to such recipient trading securities with knowledge of a material fact or material change in respect of the Company that has not been generally disclosed and to such recipient disclosing information to another person or company such material fact or material change) and the disclosure is made pursuant to the proper performance by such Company Personnel of his or her duties on behalf of the Company; (b) disclosure is compelled by judicial process; and or (c) disclosure is expressly authorized by the Disclosure Committee.
Subject to the above, Inside Information is to be kept strictly confidential by all Company Personnel until after it has been generally disclosed plus four hours for release of exploration results and one day for material transactions or other material corporate information after the disclosure to the public of the Inside Information, whether by way of press release or a filing made with securities regulatory authorities. Discussing Inside Information within the hearing of, or leaving it exposed to, any person who has no need to know is to be avoided at all times. Company Personnel with knowledge of Inside Information shall not encourage any other person or company to trade in the securities of the Company, regardless of whether the Inside Information is specifically communicated to such person or company.
If any Company Personnel has any doubt with respect to whether any information is Inside Information or whether disclosure of Inside Information is in the necessary course of business, the individual is required to contact an Insider Trading Policy Administrator.
|
8. |
SECURITIES OF OTHER COMPANIES |
In the course of the Company’s business, Company Personnel may obtain information about another publicly traded company that has not been generally disclosed and or is under discussion with the Company. Securities laws generally prohibit such Company Personnel from trading in securities of that other company while in possession of such information or communicating such information to another person. The restrictions set out in this Policy apply to all Company Personnel with respect to both trading in the securities of another company while in possession of such information, and communicating such information.
|
9. |
REPORTING REQUIREMENTS |
The directors, certain officers and certain other employees of the Company and its subsidiaries are “Reporting Insiders” under applicable securities laws. Reporting Insiders are required to file reports with Canadian provincial securities regulators, pursuant to the electronic filing system known as SEDI, of any direct or indirect beneficial ownership of, or control or direction over, securities of the Company and of any change in such ownership, control or direction. In addition, Reporting Insiders must also include in their reports any monetization, non-recourse loan or similar arrangement, trade or transaction that changes the Reporting Insider’s economic exposure to or interest in securities of the Company and which may not necessarily involve a sale, whether or not required under applicable law.
It is the responsibility of each Insider (and not the Company) to comply with these reporting requirements. The Company will assist any Insider in their preparation and filing of insider reports upon request.
Some officers of the Company or its subsidiaries may be eligible to be exempted by applicable securities law from the requirements to file insider reports.
A person that is uncertain as to whether he or she is a Reporting Insider or whether he or she may be eligible to be exempted from these requirements should contact an Insider Trading Policy Administrator. Reporting Insiders who are exempted from these requirements remain subject to all of the other provisions of applicable securities law and this Policy.
|
10. |
PENALTIES AND CIVIL LIABILITY |
The applicable securities laws that impose insider trading and tipping prohibitions also impose substantial penalties and civil liability for any breach of those prohibitions. Where a company is found to have committed an offence, the directors, officers and supervisory Company Personnel of the company may be subject to the same or additional penalties.
|
11. |
ENFORCEMENT |
All directors, officers, employees, consultants and certain service providers, as determined by the Insider Trading Policy Administrator of the Company and its subsidiaries will be provided with a copy of this Policy, and shall execute the certification set out in Schedule “B” regarding acknowledgement of and compliance with the procedures and restrictions set forth in this Policy. It is a condition of their appointment, employment or engagement that each of these persons at all times abide by the standards, requirements and procedures set out in this Policy unless a written authorization to proceed otherwise is received from an Insider Trading Policy Administrator. Any such person who violates this Policy may face disciplinary action up to and including termination of his or her employment or appointment with or engagement by the Company without notice. The violation of this Policy may also violate certain securities laws. If it appears that a director, officer, employee, consultant or certain service provider may have violated such securities laws, the Company reserves the right to refer the matter to the appropriate regulatory authorities, which could lead to penalties, fines or imprisonment.
Should you have any questions or wish information concerning the above, please contact an Insider Trading Policy Administrator.
SCHEDULE “A”
|
Common Examples of Inside Information |
|
The following examples are not exhaustive. |
|
☐ Proposed changes in capital structure including stock splits and stock dividends |
|
☐ Proposed or pending financings |
|
☐ Material increases or decreases in the amount of outstanding securities or indebtedness |
|
☐ Proposed changes in corporate structure including amalgamations and reorganizations |
|
☐ Proposed acquisitions of other companies including take-over bids or mergers |
|
☐ Material acquisitions or dispositions of assets |
|
☐ Material changes or developments in products or contracts which would materially affect earnings upwards or downwards |
|
☐ Material changes in the business of the Company |
|
☐ Changes in senior management or control of the Company |
|
☐ Bankruptcy or receivership |
|
☐ Changes in the Company’s auditors |
|
☐ Financial condition and results of operations of the Company |
|
☐ Indicated changes in revenues or earnings upwards or downwards of more than recent average size |
|
☐ Material legal proceedings |
|
☐ Defaults in material obligations |
|
☐ Results of the submission of matters to a vote of securityholders |
|
☐ Transactions with directors, officers or principal securityholders |
|
☐ Granting of options or payment of other compensation to directors or officers |
SCHEDULE “B”
|
Certification – Insider Trading Policy of Fury Gold Mines Limited |
||||
|
The undersigned hereby certifies that he/she has read and understands the Company’s Insider Trading Policy, a copy of which is attached hereto, and agrees to comply with the procedures and restrictions set forth therein. |
||||
|
Date: |
Signature: |
|||
|
Name: |
||||
|
(please print) |
||||
Exhibit 12.1
CERTIFICATION REQUIRED BY RULE 13a-14(a) UNDER THE SECURITIES EXCHANGE ACT OF 1934
I Forrester Clark, of Fury Gold Mines Ltd. Certify that:
|
1. |
I have reviewed this annual report on Form 20-F of Fury Gold Mines Ltd. (the “Issuer”); |
|
2. |
Based on my knowledge, this report does not contain any untrue statement of a material fact or omit to state a material fact necessary to make the statements made, in light of the circumstances under which such statements were made, not misleading with respect to the period covered by this report; |
|
3. |
Based on my knowledge, the financial statements, and other financial information included in this report, fairly present in all material respects the financial condition, results of operations and cash flows of the Issuer as of, and for, the periods presented in this report; |
|
|
4. |
The Issuer’s other certifying officer and I are responsible for establishing and maintaining disclosure controls and procedures (as defined in Exchange Act Rules 13a-15(e) and 15d-15(e)) and internal control over financial reporting (as defined in Exchange Act Rules 13a-15(f) and 15d-15(f)) for the Issuer and have: |
|
(a) |
Designed such disclosure controls and procedures, or caused such disclosure controls and procedures to be designed under our supervision, to ensure that material information relating to the Issuer, including its consolidated subsidiaries, is made known to us by others within those entities, particularly during the period in which this report is being prepared; |
|
(b) |
Designed such internal control over financial reporting, or caused such internal control over financial reporting to be designed under our supervision, to provide reasonable assurance regarding the reliability of financial reporting and the preparation of financial statements for external purposes in accordance with generally accepted accounting principles; |
|
(c) |
Evaluated the effectiveness of the Issuer’s disclosure controls and procedures and presented in this report our conclusions about the effectiveness of the disclosure controls and procedures, as of the end of the period covered by this report based on such evaluation; and |
|
(d) |
Disclosed in this report any change in the Issuer’s internal control over financial reporting that occurred during the period covered by the annual report that has materially affected, or is reasonably likely to materially affect, the Issuer’s internal control over financial reporting. |
|
5. |
The Issuer’s other certifying officer and I have disclosed, based on our most recent evaluation of internal control over financial reporting, to the Issuer’s auditor and the audit committee of the Issuer’s board of directors (or persons performing the equivalent functions): |
|
(a) |
All significant deficiencies and material weaknesses in the design or operation of internal control over financial reporting which are reasonably likely to adversely affect the Issuer’s ability to record, process, summarize and report financial information; and |
|
|
(b) |
Any fraud, whether or not material, that involves management or other employees who have a significant role in the Issuer’s internal control over financial reporting. |
Date: March 31, 2025

Forrester A. Clark
Chief Executive Officer
Exhibit 12.2
CERTIFICATION REQUIRED BY RULE 13a-14(a) UNDER THE SECURITIES EXCHANGE ACT OF 1934
I Phil van Staden, of Fury Gold Mines Ltd. Certify that:
|
1. |
I have reviewed this annual report on Form 20-F of Fury Gold Mines Ltd. (the “Issuer”); |
|
2. |
Based on my knowledge, this report does not contain any untrue statement of a material fact or omit to state a material fact necessary to make the statements made, in light of the circumstances under which such statements were made, not misleading with respect to the period covered by this report; |
|
3. |
Based on my knowledge, the financial statements, and other financial information included in this report, fairly present in all material respects the financial condition, results of operations and cash flows of the Issuer as of, and for, the periods presented in this report; |
|
4. |
The Issuer’s other certifying officer and I are responsible for establishing and maintaining disclosure controls and procedures (as defined in Exchange Act Rules 13a-15(e) and 15d-15(e)) and internal control over financial reporting (as defined in Exchange Act Rules 13a-15(f) and 15d-15(f)) for the Issuer and have: |
|
(a) |
Designed such disclosure controls and procedures, or caused such disclosure controls and procedures to be designed under our supervision, to ensure that material information relating to the Issuer, including its consolidated subsidiaries, is made known to us by others within those entities, particularly during the period in which this report is being prepared; |
|
(b) |
Designed such internal control over financial reporting, or caused such internal control over financial reporting to be designed under our supervision, to provide reasonable assurance regarding the reliability of financial reporting and the preparation of financial statements for external purposes in accordance with generally accepted accounting principles; |
|
(c) |
Evaluated the effectiveness of the Issuer’s disclosure controls and procedures and presented in this report our conclusions about the effectiveness of the disclosure controls and procedures, as of the end of the period covered by this report based on such evaluation; and |
|
(d) |
Disclosed in this report any change in the Issuer’s internal control over financial reporting that occurred during the period covered by the annual report that has materially affected, or is reasonably likely to materially affect, the Issuer’s internal control over financial reporting. |
|
5. |
The Issuer’s other certifying officer and I have disclosed, based on our most recent evaluation of internal control over financial reporting, to the Issuer’s auditor and the audit committee of the Issuer’s board of directors (or persons performing the equivalent functions): |
|
(a) |
All significant deficiencies and material weaknesses in the design or operation of internal control over financial reporting which are reasonably likely to adversely affect the Issuer’s ability to record, process, summarize and report financial information; and |
|
(b) |
Any fraud, whether or not material, that involves management or other employees who have a significant role in the Issuer’s internal control over financial reporting. |
Date: March 31, 2025

Phil van Staden
Chief Financial Officer
Exhibit 13.1
CERTIFICATION PURSUANT TO 18 U.S.C. §1350,
AS ADOPTED PURSUANT TO
SECTION 906 OF THE SARBANES-OXLEY ACT OF 2002
In connection with the Annual Report of Fury Gold Mines Ltd. (the “Company”) on Form 20-F for the period ended December 31, 2024 as filed with the Securities and Exchange Commission on the date hereof (the “Report”), I, Forrester Clark, Chief Executive Officer of the Company, certify, pursuant to 18 U.S.C. §1350, as adopted pursuant to Section 906 of the Sarbanes-Oxley Act of 2002, that:
|
1. |
The Report fully complies with the requirements of Section 13(a) or 15(d) of the Securities Exchange Act of 1934, as amended; and |
|
2. |
The information contained in this Report fairly presents, in all material respects, the financial condition and results of operations of the Company. |
Date: March 31, 2025

Forrester A. Clark
Chief Executive Officer
A signed original of this written statement required by Section 906 has been provided to Fury Gold Mines Ltd. and will be retained by Fury Gold Mines Ltd. and furnished to the Securities and Exchange Commission or its staff upon request.
Exhibit 13.2
CERTIFICATION PURSUANT TO 18 U.S.C. §1350,
AS ADOPTED PURSUANT TO
SECTION 906 OF THE SARBANES-OXLEY ACT OF 2002
In connection with the Annual Report of Fury Gold Mines Ltd. (the “Company”) on Form 20-F for the period ended December 31, 2024 as filed with the Securities and Exchange Commission on the date hereof (the “Report”), I, Phil van Staden, Chief Financial Officer of the Company, certify, pursuant to 18 U.S.C. §1350, as adopted pursuant to Section 906 of the Sarbanes-Oxley Act of 2002, that:
|
1. |
The Report fully complies with the requirements of Section 13(a) or 15(d) of the Securities Exchange Act of 1934, as amended; and |
|
2. |
The information contained in this Report fairly presents, in all material respects, the financial condition and results of operations of the Company. |
Date: March 31, 2025

Phil van Staden
Chief Financial Officer
A signed original of this written statement required by Section 906 has been provided to Fury Gold Mines Ltd. and will be retained by Fury Gold Mines Ltd. and furnished to the Securities and Exchange Commission or its staff upon request.
Exhibit 15.1
CONSENT OF INDEPENDENT REGISTERED PUBLIC ACCOUNTING FIRM
We consent to the incorporation by reference in Registration Statement No. 333-272658 on Form F-10 of our report dated March 31, 2025, relating to the financial statements of Fury Gold Mines Limited appearing in this Annual Report on Form 20-F for the year ended December 31, 2024.
/s/ Deloitte LLP
Chartered Professional Accountants
Vancouver, Canada
March 31, 2025
Exhibit 15.2
S-K 1300 TECHNICAL REPORT SUMMARY ON THE EAU CLAIRE PROJECT
QUEBEC, CANADA
Prepared for Fury Gold Mines Ltd.
Qualified Persons:
Valerie Doyon, P. Geo.
Senior Project Geologist, Fury Gold Mines Limited
Effective as of: December 31, 2024
|
Contents |
|||||
|
1 |
Executive Summary |
6 |
|||
|
1.1 |
Overview |
6 |
|||
|
1.2 |
Conclusions |
9 |
|||
|
1.3 |
Recommendations |
10 |
|||
|
2 |
Introduction and Terms of Reference |
12 |
|||
|
2.1 |
Sources of Information |
12 |
|||
|
2.2 |
Personal Inspection |
12 |
|||
|
3 |
Property Description |
12 |
|||
|
3.1 |
Location |
12 |
|||
|
3.2 |
Project Ownership |
13 |
|||
|
3.3 |
Mineral Tenure |
13 |
|||
|
3.4 |
Royalties and Encumbrances |
13 |
|||
|
3.5 |
Permitting |
13 |
|||
|
3.6 |
First Nations Rights |
14 |
|||
|
4 |
Accessibility, Climate, Local Resources, Infrastructure and Physiography |
16 |
|||
|
4.1 |
Accessibility |
16 |
|||
|
4.2 |
Climate |
16 |
|||
|
4.3 |
Local resources & Infrastructure |
16 |
|||
|
4.4 |
Physiography |
16 |
|||
|
4.5 |
Conclusions |
17 |
|||
|
5 |
History |
17 |
|||
|
5.1 |
Pre 2002 Exploration |
17 |
|||
|
5.2 |
2002 – 2019 Eastmain Resources Exploration |
19 |
|||
|
5.3 |
Previous Resource Estimates |
19 |
|||
|
5.3.1 |
Discussion on Previous Resource Estimates |
20 |
|||
|
5.4 |
Historical Drilling |
20 |
|||
|
5.5 |
Past Production |
20 |
|||
|
6 |
Geological Setting and Mineralization |
20 |
|||
|
6.1 |
Geology |
20 |
|||
|
6.2 |
Structure |
23 |
|||
|
6.3 |
Mineralization |
25 |
|||
|
6.4 |
Alteration |
25 |
|||
|
6.5 |
Deposit Types |
26 |
|||
|
7 |
Exploration |
29 |
|||
|
7.1 |
Percival Biogeochemical Sampling |
29 |
|||
|
7.2 |
Geophysical Surveys |
31 |
|||
|
7.2.1 |
2020 Gradient Array Induced Polarization Survey |
31 |
|||
|
7.2.1.1 |
Methodology |
31 |
|||
|
7.2.2 |
2022 DCIP Survey |
32 |
|||
|
7.2.2.1 |
Methodology |
32 |
|||
|
7.3 |
Drilling |
34 |
|||
|
7.3.1 |
2002 – 2013 Drilling |
34 |
|||
|
7.3.2 |
2015 Drilling |
34 |
|||
|
7.3.3 |
2016-2017 Drill Program |
35 |
|||
|
7.3.4 |
2018 – 2019 Drill Program |
38 |
|||

|
7.3.5 |
Discussion on Drilling Completed Prior to 2020 |
38 |
|||
|
7.3.6 |
Fury Gold Mines Drilling 2020-2024 |
38 |
|||
|
7.3.7 |
Eau Claire Drilling |
39 |
|||
|
7.3.8 |
Percival Drilling |
41 |
|||
|
7.3.9 |
Methodology |
43 |
|||
|
8 |
Sample Preparation, Analyses, and Security |
46 |
|||
|
8.1 |
Diamond Drilling |
46 |
|||
|
8.1.1 |
QC Sampling |
48 |
|||
|
8.2 |
Summary |
48 |
|||
|
9 |
Data Verification |
49 |
|||
|
9.1 |
Database Verification |
49 |
|||
|
9.2 |
2020 through 2024 Quality Assurance and Quality Control |
49 |
|||
|
9.2.1 |
Certified Reference Material |
50 |
|||
|
9.3 |
Conclusions |
50 |
|||
|
10 |
Mineral Processing and Metallurgical Testing |
51 |
|||
|
10.1 |
2001 COREM Metallurgical Testing |
51 |
|||
|
10.2 |
2010 SGS Minerals Metallurgical Testing |
51 |
|||
|
10.3 |
2017 SGS Minerals Metallurgical Testing |
53 |
|||
|
10.4 |
Conclusions |
56 |
|||
|
11 |
Mineral Resource Estimate |
56 |
|||
|
11.1 |
Summary |
56 |
|||
|
11.2 |
Drill Hole Database |
57 |
|||
|
11.3 |
Mineral Resource Modelling and Wireframes |
58 |
|||
|
11.4 |
Composites |
60 |
|||
|
11.5 |
Grade Capping |
62 |
|||
|
11.6 |
Specific Gravity |
62 |
|||
|
11.7 |
Block Model Parameters |
63 |
|||
|
11.8 |
Grade Interpolation |
64 |
|||
|
11.9 |
Mineral Resource Classification Parameters |
64 |
|||
|
11.10 |
Reasonable Prospects of Eventual Economic Extraction |
66 |
|||
|
11.11 |
Mineral Resource Statement |
68 |
|||
|
11.12 |
Model Validation and Sensitivity Analysis |
73 |
|||
|
11.12.1 |
Sensitivity to Cut-off Grade |
75 |
|||
|
12 |
Mineral Reserve Estimates |
77 |
|||
|
13 |
Mining Methods |
77 |
|||
|
14 |
Processing and Recovery Methods |
78 |
|||
|
15 |
Infrastructure |
78 |
|||
|
16 |
Market Studies |
78 |
|||
|
17 |
Environmental Studies, Permitting, and Plans, Negotiations, or Agreements with Local Individuals or Groups |
78 |
|||
|
18 |
Capital and Operating Costs |
78 |
|||
|
19 |
Economic Analysis |
78 |
|||
|
20 |
Adjacent Properties |
78 |
|||
|
21 |
Other Relevant Data and Information |
78 |
|||
|
22 |
Interpretation and Conclusions |
78 |
|||
|
23 |
Recommendations |
81 |
|||
|
24 |
References |
83 |
|||
|
25 |
Reliance on Information Provided by the Registrant |
84 |
|||
|
26 |
DATE AND SIGNATURE PAGE |
85 |
|||
Tables
| Table 1: |
Eau Claire Gold Deposit Mineral Resource Estimate Effective as of December 31, 2024 |
8 |
| Table 2: |
Eau Claire Project Exploration Budget |
11 |
| Table 3: |
Summary of Drilling Completed by Fury |
39 |
| Table 4: |
Eau Claire area significant intercepts |
39 |
| Table 5: |
Percival area significant intercepts |
42 |
| Table 6: |
QC Sample Statistics for Core Sampling 2020 - 2023 |
49 |
| Table 7: |
Fury Internal CRMs for Diamond Drilling |
50 |
| Table 8: |
Total Drill Hole and Channel Sample Database for the Eau Claire Project |
57 |
| Table 9: |
Eau Claire Deposit Zone and Domain Summary |
60 |
| Table 10: |
Statistical Analysis of the Drill and Channel Assay Data from Within the Eau Claire and Percival Deposit Mineral Domains |
61 |
| Table 11: |
Statistical Analysis of the 1.00 m Composite Data from Within the Deposit Mineral Domains |
61 |
| Table 12: |
Deposit Block Model Geometry |
63 |
| Table 13: |
Parameters used for Whittle™ pit optimization and Calculation of In-pit and Underground Base-case Cut-off Grades |
67 |
| Table 14: |
Combined Mineral Resource Estimate for the Eau Claire Project |
68 |
| Table 15: |
Eau Claire Deposit Mineral Resource Estimate |
68 |
| Table 16: |
Percival Deposit Mineral Resource Estimate |
69 |
| Table 17: |
Comparison of Average Assay and Composite Grades with Global Block Model Grades |
73 |
| Table 18: |
Eau Claire In-Pit and Underground Mineral Resource Estimate, at Various Au Cut-off Grades |
75 |
| Table 19: |
Percival In-Pit and Underground Mineral Resource Estimate, at Various Au Cut-off Grades |
77 |
| Table 20: |
Eau Claire Project Exploration Budget |
81 |
Figures
|
Figure 1: |
Property Location and Claims |
15 |
|
Figure 2: |
Eau Claire Deposit Stratigraphy |
21 |
|
Figure 3. |
Regional Geology |
24 |
|
Figure 4: |
Percival Biogeochemical Sampling |
30 |
|
Figure 5: |
Gradient Array DCIP defined structural intersections to the north of the Snake Lake mineralized structure as well the convergence of the Eau Claire and South Tonalite structures. |
32 |
|
Figure 6: |
2022 Percival DCIP IP Survey area depicting the identified resistivity anomalies in relation to the biogeochemical anomalies. |
33 |
|
Figure 7: |
Fury Diamond Drilling Methodology Flow Sheet |
45 |
|
Figure 8: |
Diamond Drilling Sample Preparation and Analysis Flow Sheet - ALS |
47 |
|
Figure 9: |
Oblique view looking NW depicting all drilling and channel sampling utilized in the 2024 Mineral Resource Estimation. |
59 |
|
Figure 10: |
Oblique view looking NE depicting all drilling and wireframes utilized in the 2024 Mineral Resource Estimation. |
59 |
|
Figure 11: |
Plan View: Eau Claire Mineral Resource Blocks by Grade and Revenue Factor 0.52 Pit Surface (dark grey) (NAD83 UTM Zone 18) |
71 |
|
Figure 12: |
Isometric View Looking North: Eau Claire Mineral Resource Blocks by Grade and Revenue Factor 0.52 Pit Surface (dark grey) (NAD83 UTM Zone 18) |
71 |
|
Figure 13: |
Plan View: Percival Inferred Mineral Resource Blocks by Grade and Revenue Factor 1.0 Pit Surface (dark grey) (NAD83 UTM Zone 18) |
72 |
|
Figure 14: |
Plan View: Percival Inferred Mineral Resource Blocks by Grade and Revenue Factor 1.0 Pit Surface (dark grey) (NAD83 UTM Zone 18) |
72 |
|
Figure 15 |
Comparison of ID3 (MRE), ID2 & NN Models for the Eau Claire Deposit |
74 |
|
Figure 16: |
Comparison of ID3 (MRE), ID2 & NN Models for the Percival Deposit |
74 |
Appendices
|
1 |
Executive Summary |
|
1.1 |
Overview |
Fury is a Vancouver based Canadian public company involved in mineral exploration and development. Fury is listed on the Toronto Stock Exchange and the NYSE American Stock Exchange.
Appendix 1 – Eau Claire Claims List This Technical Report Summary (TRS) conforms to United States Securities and Exchange Commission’s (SEC) Modernized Property Disclosure Requirements for Mining Registrants as described in Subpart 229.1300 of Regulation S-K, Disclosure by Registrants Engaged in Mining Operations (S-K 1300) and Item 601 (b)(96) Technical Report Summary. The purpose of this TRS is to support the disclosure of the Eau Claire Property Mineral estimates with an effective date of December 31, 2024.
The Eau Claire Project (The Project), 100% held by Fury, comprises 446 claims, totaling 23,284 hectares(ha). Located in 1:50,000 scale NTS map sheets 33B04 and 33B05, approximately 320 km northwest of the town of Chibougamau and 800 km north of Montreal. The property is accessible, year-round, by the Route du Nord and is located 100 km north of Nemaska, serviced by commercial flights twice per week. The centre of the property is located at approximately 75.78 degrees longitude west and 52.22 degrees latitude north.
The Project is north of the 52nd parallel (52ºN) and as such is subject to the provisions of the James Bay and Northern Quebec Agreement (1975), and the Paix des Braves Agreement (2002). The Project falls within the Eeyou Istchee Territory of the Eastmain Cree First Nation, including trap line VC36 held by Dr. Ted Moses as the Cree Tallyman, and on Category III lands, as established under the James Bay and Northern Quebec Agreement.
The Project is located in the La Grande volcanic subprovince (2800 to 2738 Ma), east the Opinaca metasedimentary subprovince (2703 to 2674 Ma) and lies within the Eastmain Greenstone Belt (2752 to 2696 Ma). The Eau Claire gold deposit and the Percival prospect occur within a few kilometres of the Cannard Deformation Zone, a crustal scale structural break and is hosted in the Natel Formation (2739 to 2720 Ma), which is made up of komatiites, komatiitic basalt, massive to pillowed basaltic and andesitic flows of tholeiitic affinity (magnesian tholeiites and iron tholeiites), with interbedded sequences of mudstone, wacke and iron formation.
The majority of the gold mineralization identified to date at Eau Claire occurs as stacked late quartz tourmaline veining (VQTL) within interbedded mafic volcanics and volcaniclastic sequences proximal to regional D2 shear zones. Gold mineralization also occurs within altered host rock without veining occurring as centimetre to several metre wide tourmaline-actinolite ± biotite ± calcite replacement zones around vein selvages. A third style of gold mineralization recently identified in silicified breccias and quartz veins hosted in sediments and volcanic rocks proximal to iron formation on the eastern side of the Project. Eau Claire hosts over 12 showings, the most advanced being the Eau Claire deposit and the Percival prospect.
From 2020 through to 2024, Fury completed a total of 120 diamond drill holes for approximately 75,654.3 m on the Project. The drill program consisted of i) an extension phase focused on extensions to the known vein corridors along strike from the previous resource (“Extension Program”); ii) an exploration phase designed to test targets along the 4.5 km long deposit trend (“Exploration Program”) and iii) an exploration phase of drilling designed to test targets at the Percival and Serendipity prospects 14 km east and 20 km northeast respectively of the Eau Claire Deposit. Large step out drilling in 2022 increased the mineralized footprint of the Eau Claire deposit by over 450 m to the west. At Percival Fury drilling returned intersections up to 13.5 metres at 8.05 g/t gold and outlined a 500x100x300 m zone of gold mineralization. 2024 drilling at Serendipity intercepted a previously unknown mineralized structure that returned an assay od 12.16 g/t gold over 3.0m. The 2020 through 2023 drilling has expanded the footprint of the Eau Claire mineralization and drilling was completed outside of the previous Eau Claire resource area. This new extension drilling by Fury has now been included in the current Mineral Resource Estimate.
The 2024 Mineral Resource estimate is summarized in Table 1. Mineral Resources have been classified in accordance with the definitions for Mineral Resources in S-K 1300, which are consistent with Canadian Institute of Mining, Metallurgy and Petroleum (CIM) Definition Standards for Mineral Resources and Mineral Reserves dated May 10, 2014 (CIM (2014) definitions).
Table 1: Eau Claire Gold Deposit Mineral Resource Estimate Effective as of December 31, 2024
|
Category |
Tonnes |
Au g/t |
Contained Au (oz) |
|
Measured |
1,612,000 |
5.67 |
294,000 |
|
Indicated |
4,781,000 |
5.64 |
866,000 |
|
Measured & Indicated |
6,393,000 |
5.65 |
1,160,000 |
|
Inferred |
5,445,000 |
4.13 |
723,000 |
Notes:
|
(1) |
The Mineral Resource Estimates were initially reported by Dupere, Eggers and Dean (2024) with an effective date of May 10, 2024. |
|
(2) |
The resources reported above are reviewed in detail within this Report and are accepted as current by the Qualified Person, Ms. Valerie Doyon P. Geo, Senior Project Geologist of the Company. |
|
(3) |
The classification of the current Mineral Resource Estimate into Measured, Indicated and Inferred has been completed in accordance with the definitions for mineral resources in S-K 1300, which are consistent with current 2014 CIM Definition Standards - For Mineral Resources and Mineral Reserves. |
|
(4) |
All figures are rounded to reflect the relative accuracy of the estimate and numbers may not add due to rounding. |
|
(5) |
The mineral resources are presented undiluted and in situ, constrained by continuous 3D wireframe models, and are considered to have reasonable prospects for eventual economic extraction. |
|
(6) |
Mineral resources which are not mineral reserves do not have demonstrated economic viability. An Inferred Mineral Resource has a lower level of confidence than that applying to an Indicated Mineral Resource and must not be converted to a Mineral Reserve. It is reasonably expected that most Inferred Mineral Resources could be upgraded to Indicated Mineral Resources with continued exploration. |
|
(7) |
The Project mineral resource estimates are based on a validated database which includes data from 1202 surface diamond drill holes totalling 406,431 m, and 426 surface channels (Eau Claire deposit) for 1,345 m. The resource database totals 273,402 drill hole assay intervals representing 267,721 m of data and 2,254 channel assays for 1,316 m. |
|
(8) |
The MRE for the Eau Claire deposit is based on 280 three-dimensional (“3D”) resource models representing the 450, 850 and hinge zones. The MRE for the Percival deposit is based on 29 3D resource models representing high grade and lower grade halo zones. |
|
(9) |
Grades for Au were estimated for each mineralization domain using 1.0 metre capped composites assigned to that domain. To generate grade within the blocks, the inverse distance cubed (ID3) interpolation method was used for all domains of the Eau Claire deposit and ID2 for Percival deposit. An average density value was assigned to each domain. |
|
(10) |
Based on the location, surface exposure, size, shape, general true thickness, and orientation, it is envisioned that parts of the Eau Claire and Percival deposits may be mined using open-pit mining methods. In-pit mineral resources are reported at a base case cut-off grade of 0.5 g/t Au. The in-pit resource grade blocks are quantified above the base case cut-off grade, above the constraining pit shell, below topography and within the constraining mineralized domains (the constraining volumes). |
|
(11) |
The pit optimization and base-case cut-off grade consider a gold price of $1,900/oz and considers a gold recovery of 95%. The pit optimization and base case cut-off grade also considers a mining cost of US$2.80/t mined, pit slope of 55⁰ degrees, and processing, treatment, refining, G&A and transportation cost of USD$19.00/t of mineralized material. |
|
(12) |
The results from the pit optimization, using the pseudoflow optimization method in Whittle 4.7.4, are used solely for the purpose of testing the “reasonable prospects for economic extraction” by an open pit and do not represent an attempt to estimate mineral reserves. There are no mineral reserves on the Property. The results are used as a guide to assist in the preparation of a Mineral Resource statement and to select an appropriate resource reporting cut-off grade. A Whittle pit shell at a revenue factor of 0.52 was selected as the ultimate pit shell for the purposes of this mineral resource estimate. |
|
(13) |
Based on the size, shape, general true thickness, and orientation, it is envisioned that parts of the Eau Claire and Percival deposits may be mined using underground mining methods. Underground mineral resources are reported at a base case cut-off grade of 2.5 g/t Au. The mineral resource grade blocks were quantified above the base case cut-off grade, below surface/pit surface and within the constraining mineralized wireframes (considered mineable shapes). Based on the size, shape, general thickness, and orientation of the mineralized structures, it is envisioned that the deposits may be mined using a combination of underground mining methods including sub-level stoping (SLS) and/or cut and fill (CAF) mining. |
|
(14) |
The underground base case cut-off grade of 2.5 g/t Au considers a mining cost of US$65.00/t mined, and processing, treatment, refining, G&A and transportation cost of USD$19.00/t of mineralized material. |
|
(15) |
The estimate of Mineral Resources may be materially affected by environmental, permitting, legal, title, taxation, socio-political, marketing, or other relevant issues. |
The author is of the view that there are no environmental, permitting, legal, title, taxation, socio-economic, marketing, political, or other relevant factors applicable to the Project that could be seen as precluding mineral production once normal compliance with the many environmental and other governmental requirements are met. Accordingly, none of the foregoing factors are such that they could be said to materially adversely affect the 2023 Mineral Resource estimate.
|
1.2 |
Conclusions |
The Eau Claire and Percival deposits contain within-pit and underground Measured, Indicated and Inferred Mineral Resources that are associated with well-defined mineralized trends and models. The deposits are open along strike and at depth. Project geologists have a good understanding of the regional, local, and deposit geology and controls on mineralization. The geological models are reasonable and plausible interpretations of the drill results.
Mineral Resources for the Eau Claire deposit were estimated assuming combined open pit and underground mining methods. At cut-off grades of 0.5 g/t Au for open pit and 2.5 g/t Au for underground, Measured Mineral Resources are estimated to total 1.61 Mt at an average grade of 5.67 g/t Au containing 294,000 ounces gold. At the same cut-off grades, Indicated Mineral Resources are estimated to total 4.78 Mt at an average grade of 5.64 g/t Au containing 860,000 ounces gold. At the same cut-off grades, Inferred Mineral Resources are estimated to total 5.44 Mt at an average grade of 4.13 g/t Au containing 723,000 ounces gold. The open pit resources were constrained by a preliminary pit shell generated in Whittle software.
The limited metallurgical testwork conducted so far suggests that the gold can be recovered by conventional means, such as a combination of gravity followed by cyanide leaching of the concentrate. Additional metallurgical testwork will be warranted if further exploration increases the size of the resource.
The Author considers that the Project has potential for delineation of additional Mineral Resources and that further exploration is warranted. Given the prospective nature of the Property, it is the Author’s opinion that the Property merits further exploration and that a proposed plan for further work by Fury is justified. The Author is recommending Fury conduct further exploration, subject to funding and any other matters which may cause the proposed exploration program to be altered in the normal course of its business activities or alterations which may affect the program as a result of exploration activities themselves.
|
1.3 |
Recommendations |
Fury’s intentions are to continue exploration on the Property in 2025 and onwards. The proposed work program consists of a regional portion focused on refining known gold occurrences within the Percival – Serendipity trend, 14km to the east of Eau Claire, and attempting to define new prospects in areas with favourable geological and structural settings. In addition to the regional program, a drill program focused on the Eau Claire deposit is planned to tie-in the mineralization identified 450m west of the current resource with the aim of updating the current mineral resource. Additional drilling would focus on the Percival prospect and other nearby geochemical anomalies to determine the continuity and scale of gold mineralization.
Fury has gained a better understanding of the combination of pathfinder elements and structural controls on the gold mineralization at Percival. The broad low-grade gold mineralization occurs along a well-defined east–west trending structural splay of the Cannard Deformation Zone. Certain elemental associations, most notably Arsenic, Bismuth, and Tungsten, are proving to be important pathfinders for the gold mineralization. Higher-grade gold within the broader corridor is controlled by secondary shearing and is identified by the high degree of silicification. With this knowledge, the Company has refined their targeting along the Percival to Serendipity Trend identifying ten priority targets for 2024. These identified targets lie within the same stratigraphic package as Percival Main and have undergone varying degrees of deformation. The proximity of the main Cannard and Hashimoto Deformation Zones varies from one target to the other and may have a significant impact on the gold mineralization. Fury believes the varying degrees of deformation are an important control on both gold mineralization and the potential preservation of a sizeable, mineralized body.
The proposed work program is anticipated to include the collection of 15,000 infill till and biogeochemical samples and 30,000 m of diamond drilling. Drilling would be allocated with 2,000 m to 7,500 m focused on testing biogeochemical anomalies within the Percival – Serendipity trend, approximately 20,000 m at the Eau Claire deposit for resource expansion, and 2,500 m to 8,000 m at Percival for resource expansion. Subsequent to the completion of additional drilling on the Property, updated MREs are planned which will form the basis of an updated engineering study in the form of an updated Preliminary Economic Assessment.
The total cost of the planned work program by Fury is estimated at $14.2 M (Table 2).
Table 2: Eau Claire Project Exploration Budget
|
Item |
Details |
Cost (C$) |
|
Labour |
Staff Wages, Technical and Support Contractors |
1,750,000 |
|
Assaying |
Sampling and Analytical |
750,000 |
|
Drilling |
Diamond Drilling (30,000m at $175/m) |
5,250,000 |
|
Till Sampling |
Detailed sampling program |
1,500,000 |
|
Land Management |
Consultants. Assessment Filing, Claim maintenance |
750,000 |
|
Community Relations |
Community Tours, Outreach |
75,000 |
|
Information Technology |
Remote site communications and IT |
35,000 |
|
Safety |
Equipment, Training and Supplies |
75,000 |
|
Expediting |
Expediting |
150,000 |
|
Camp Costs |
Equipment, Maintenance, Food, Supplies |
250,000 |
|
Freight and Transportation |
Freight, Travel, Helicopter |
450,000 |
|
Fuel |
1,200,000 |
|
|
General and Administration |
100,000 |
|
|
Update MRE and PEA |
600,000 |
|
|
Sub-total |
12,935,000 |
|
|
Contingency (10%) |
1,293,500 |
|
|
Total |
14,228,500 |
|
|
2 |
Introduction and Terms of Reference |
This Technical Summary Report on the Eau Claire Project (the Project), located in the Eeyou Istchee James Bay Territory of Northern Quebec, Canada is authored by Valerie Doyon, Senior Project Geologist at Fury. The purpose of this report is to document the current Mineral Resource estimate of the Eau Claire deposit and to outline the work completed by Fury on the Project. Fury is a Vancouver-based exploration company formed in June 2008 which is engaged in acquiring, exploring, and evaluating natural resource properties in Canada. It is a reporting issuer in British Columbia whose common shares trade on the Toronto Stock Exchange (TSX: FURY) and the NYSE-American (NYSE: FURY).
On October 9, 2020, the Company acquired all the issued and outstanding shares of Eastmain Resources Inc. (“Eastmain”) in accordance with the terms and conditions of the arrangement agreement dated August 10, 2020 (the “Arrangement Agreement”). In accordance with the terms of the Arrangement Agreement, the Company changed its name to “Fury Gold Mines Limited” pursuant to a certificate of change of name dated October 8, 2020.
The Project represents a strategic land position covering prospective lithologies and structures for gold deposits. The Project hosts the Eau Claire deposit, which is at the resource definition stage, as well as a large land position which merits additional exploration.
|
2.1 |
Sources of Information |
The Eau Claire Project has been the subject of several prior NI43-101 Technical Reports. The most recent prepared by Maxime Dupéré, Ben Eggers and Sarah Dean Geologists with SGS Geological Services entitled “Mineral Resource Estimate Update for the Eau Claire Project, Eeyou Istchee James Bay Region of Quebec, Canada” dated June 25th, 2024 with an effective date of May 10th, 2024.
The documentation reviewed by the Authors, and other sources of information, are listed in Section 24 of this report.
|
2.2 |
Personal Inspection |
Ms. Doyon has been involved in all exploration programs on the Project since 2020 and was last on site from June to August 2024.
|
3 |
Property Description |
|
3.1 |
Location |
The Project is located in the Eeyou Istchee James Bay Territory of Northern Quebec, approximately 320 km northwest of the town of Chibougamau and 800 km north of Montreal. The property is accessible, year-round, by the Route du Nord and is located 100 km north of Nemaska, serviced by commercial flights twice per week.
The approximate centre of the Project is located at Universal Transverse Mercator (UTM) co-ordinates 5,786,800m N and 453,000m E (NAD 83, Zone 18N). The approximate UTM co-ordinates for the centre of the currently defined Eau Claire deposit are 5,785,100m N and 444,600m E. The Project is located within National Topographic System (NTS) 1:50,000 scale map-areas; 33B04 and 33B05.
|
3.2 |
Project Ownership |
The Project consists of 446 map designated claims covering 23,284.5 ha, (Figure 1, Appendix 1) 100% owned by Eastmain Resources Inc., a wholly owned subsidiary of Fury. Appendix 1 lists all the claims along with the relevant tenure information including their designation number, registration and expiry dates, area, assessment work credits and work requirements for renewal. The boundaries of the claims have not been legally surveyed. The mineral rights exclude surface rights, which belong to the Quebec government.
|
3.3 |
Mineral Tenure |
Under the Quebec Mining Act, claims or cells are map staked. The map-designated coordinates of the cells are the legal limits of said claims, the physical limits can be verified by consulting the Government of Quebec’s Ministère de Ressources Naturelles et des Forets (MERN) GESTIM website.
In Quebec, available mining lands are defined as geo-referenced polygons which can be applied for by holders of Quebec prospecting licenses through an online portal. The person identifies the claim (‘clicking’) and pays the required fee online. In the case of mining claims that are expiring or to be cancelled, these lands are made available for acquisition at a designated future date and time, allowing for all interested parties to become aware when these lands are available. In the case of open lands or re-opened lands, the first person to complete the transaction receives the mineral tenure. Funds to for transactions with MERN such as claim acquisition and renewal may be deposited in advance in a dedicated account with the Ministry.
Under the current Quebec Mining Act claims are required to be renewed every two years for a fee of $170. Work requirements are based on the number of hectares in each claim and increase each 2-year term to a maximum reached at the 7th term (14th year). Work requirements also vary on whether the claim is located north or south of the 52nd parallel. The Eau Claire Project claims require expenditures equivalent to $978,765.00 every two years to remain in good standing, currently there is over $70 million in excess expenditures registered on the Property (Appendix 1).
|
3.4 |
Royalties and Encumbrances |
There are no Royalties applicable to the Eau Claire Project claims.
|
3.5 |
Permitting |
A forest intervention permit is required for any logging activity, Including clearing for roads, camps, and drill pads. Documentation for such a permit must be submitted by a forest engineer to the Chibougamau or Amos forest management unit, part of the MERN. In accordance with the Paix des Braves protocols, a representative from the MERN will contact the Cree Tallyman who owns the trap line where logging is needed; the Tallyman then has 45 days to provide his approval. A small logging royalty, stumpage fee, is deemed payable to the Ministry.
A “special intervention permit” is required to conduct drilling. This permit is very similar to and replaces the forest intervention permit. Road construction necessitating any earthmoving requires authorization from the MERN. This request is made concomitantly with the forest intervention permit request and may take a few months to be approved.
Installation of a temporary or permanent camp requires a permit to be issued by the Municipalité de la Baie-James, from Matagami. Installation must comply with municipal regulations as well as the Ministry of the Environment and the Fight against Climate Change (Ministère de l'Environnement et Lutte contre les changements climatiques – MELCC), especially concerning wastewater management.
No specific permit is required to conduct geophysics, line cutting, or other activities not requiring significant logging.
Based on personal visits and given that the Project is exploration stage, Ms. Doyon is of the view that other than camp site rehabilitation there are no material environmental liabilities associated with the Project. Fury has all required permits to conduct the proposed work on the Project. Ms. Doyon is not aware of any other significant factors and risks that may affect access, title, or the right or ability to perform the proposed work program on the Project.
|
3.6 |
First Nations Rights |
The Project is located north of the 52nd parallel (52ºN) and as such is subject to the provisions of the James Bay and Northern Quebec Agreement (1975), and the Paix des Braves Agreement (2002). The Project falls within the Eeyou Istchee Territory of the Eastmain Cree First Nation, including trap lines held by Dr. Ted Moses (tallyman).
The Eau Claire project is located on Category III lands, as established under the James Bay and Northern Quebec Agreement. Category III lands are administered by the province of Quebec and they do not have any substantial restrictions on mineral exploration. A notice of work must be forwarded to the Eastmain Community and the tallyman prior to initiating exploration activities. The Project is located within the traditional territories of the Cree Nation of Eastmain. The entire Project lies on trapline VC-37, currently assigned to Dr. Ted Moses.
Figure 1: Property Location and Claims
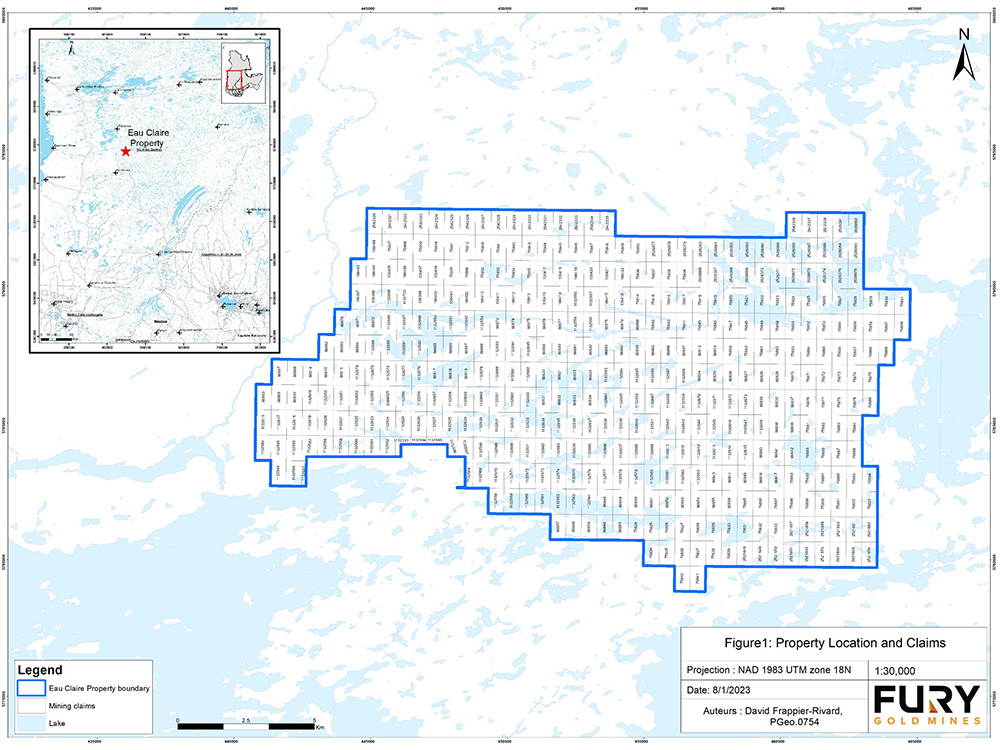
|
4 |
Accessibility, Climate, Local Resources, Infrastructure and Physiography |
|
4.1 |
Accessibility |
The Project is located 350 kilometres north of the town of Chibougamau and borders the northern shore of the EM-1 Hydro Quebec reservoir in the James Bay region (NTS Map sheet 33B04 and 33B05). The exploration camp is located 2.5 kilometres east of the Eau Claire deposit at 52.22 degrees north and 75.79 degrees west.
The property is accessible, year-round, by the Route du Nord and is located 100 km north of Nemaska, serviced by commercial flights twice per week. The Route du Nord from the town of Chibougamau is a 350- kilometre long all-season gravel road extending from the town of Chibougamau to the Cree village of Nemaska (and onto Hydro Québec's installation at EM-1). Beyond EM-1, road access to the project involves crossing the Eastmain Reservoir and the EM-1 spillway via an all-season road installed by Hydro Québec.
|
4.2 |
Climate |
The climate is typical of northern Quebec and is characterized by temperate to subarctic conditions. The average summer temperatures vary from 10 to 25 degrees Celsius during the day and 5 to 15 degrees Celsius at night (June to September). Winter temperatures range from -35 to -10 degrees Celsius. Winter season can start in late October and can continue until May. Precipitation varies during the year reaching an average of 2 metres annually and is characterized by snow cover in the winter months and moderate rainfall in the summer months. Exploration activities can be carried out year-round.
|
4.3 |
Local resources & Infrastructure |
Fury, through its Eastmain subsidiary, maintains forty-person camp to support exploration activities at the Eau Claire project. The closest infrastructures to the Eau Claire deposit include a number of hydroelectric complexes and associated infrastructure, including the EM-1 hydroelectric complex. The EM-1 complex is located within 15 kilometres of the Eau Claire gold deposit. Hydro Québec has established a 600-person camp at EM-1 that includes fuel and medical services. More major necessities such as skilled labour and specialized equipment are sourced from Val-d’Or or Chibougamau. Many services are now available through numerous Cree owned businesses and partnerships in Mistissini, Eastmain and Nemaska.
|
4.4 |
Physiography |
The property is located within the Canadian Shield and is characterized by many lakes, swamps, rivers, and low-lying terrain. The project is located in the boreal forest where forest fires are common. Vegetation is typical of taiga, including areas dominated by sparse black spruce, birch, and poplar forests, in addition to large areas of peat bog devoid of trees.
Overburden is typically 3 to 4 metres thick, with the exception of isolated areas where overburden thickness can reach 20 m. Numerous glacial eskers often reaching tens of kilometres in length can be seen of satellite images.
Rock outcrops are sparse due to the abundance of quaternary deposits and swamps. The topography of the area is subdued and characterized dominantly by lowlands, with few hills that attain elevations up to 330 metres above sea level. The area is drained by the Eastmain River, which now drains the Eastmain Reservoir located near the southern margin of the property.
|
4.5 |
Conclusions |
The Eau Claire Project is a remote greenfields site with limited existing roads, no power or water. Development of the project will require:
|
● |
Upgrading of the current road access to allow for drive in / drive out operations on a scale suitable to development. |
|
● |
Connecting to the nearby Hydro Quebec renewables grid. |
|
● |
Upgrading of the current camp |
|
● |
Development of local water resources for potable and non-potable water consumption. |
In the opinion Ms. Doyon, the Eau Claire Project site offers, subject to customary environmental and other regulatory compliance, adequate surface rights and land suitable for the construction of a processing plant, tailings facility, waste rock dumps, and mining camp. The project site has several suitable sources of water pending the necessary approvals.
|
5 |
History |
The following is taken from Armitage and Hafez (2017) and describes work completed in the general vicinity of the Project prior to 2017. Work completed after 2017 is summarized from previously submitted assessment reports.
|
5.1 |
Pre 2002 Exploration |
Exploration on the Project dates back to the early 1970s when SEREM Quebec Inc. (SEREM) and Société de Développement de la Baie-James (SDBJ) completed airborne electromagnetic surveys and limited core drilling in search for volcanogenic massive base metal sulphide deposits (SRK, 2015).
In 1984, Westmin and Eastmain initiated a comprehensive gold and base metal exploration program that covered the former Eastmain Greenstone Belt. From 1984 through 1989, Westmin and Eastmain completed a multi-staged exploration program which included airborne geophysical surveys, line cutting, geochemical rock and soil surveys, ground geophysical surveys, prospecting, geological mapping, and core drilling.
A property-wide airborne electromagnetic and magnetic survey contracted by Westmin formed the basis of a comprehensive exploration program that led to the discovery of the Eau Claire gold deposit in 1987. The joint venture conducted a systematic soil sampling program over all known electromagnetic anomalies on the property. Flagged and cut grids were completed on isolated electromagnetic anomalies along with prospecting, geological mapping, and rock sampling. A large gold-in-soil geochemical anomaly was detected in the south-western portion of the property proximal to the outcropping gold-bearing quartz- tourmaline vein, currently identified as the B Vein in the 450 West zone.
Sampling and mapping were conducted on local area cut grids focussing on short strike-length airborne geophysical conductors. Westmin collected 1,036 rock samples that were assayed for gold only. The rock sample data ranges from less than 5 parts per billion to 22.2 g/t Au.
Soil surveys were completed over small, localized grids using a grub hoe to sample the soil’s B-horizon. Samples were assayed for gold only.
Westmin completed a total of 54 core boreholes (5,922 metres) from 1987 to 1989, which resulted in the discovery of several gold-bearing quartz-tourmaline veins. The presence of these veins (including veins currently known as VEIN B, C, D, F and G) demonstrated continuity in three dimensions within the upper portion of the Eau Claire gold deposit.
The property was dormant from 1990 to 1995.
From 1996 through 2001, SOQUEM managed the exploration activities on the Clearwater property, which included ground geophysical surveys, line cutting, prospecting, geological mapping, trenching and core drilling. A comprehensive soil sampling program covered the entire property on a 100 by 500 metre grid. In 1996, SOQUEM commissioned Sigma Geophysics Inc. (Sigma) to complete ground magnetic and induced polarization (IP) surveys over four grid areas. The surveys were completed over the Rosemary, Eau Claire, Aupapiskach, and Natel areas. In total, Sigma completed 168.5 line kilometres of ground magnetic survey and 130.9 line kilometres of IP surveys. The magnetic data were collected on 100 metre line and 12.5 metre station spacing using an EDA Omniplus instrument.
Magnetic, resistivity, and chargeability data were presented on 1:5,000 scale map sheets for each grid area. The Eau Claire Deposit was not detected from the geophysical surveys.
Between 1996 and 2001, SOQUEM collected 556 rock samples for analysis. The principal area of interest defined by the SOQUEM rock sampling was the surface expression of the 450 West Zone. SOQUEM also found gold-bearing quartz-tourmaline veins 2 kilometres east of Eau Claire at the Snake Lake prospect.
In 1999, a backhoe was brought to the property to expedite surface trenching. Extensive surface trenching in 1999 exposed multiple high-grade, quartz-tourmaline veins (currently known as VEIN P, JQ, R, and S) at the 450 West zone. Surface stripping demonstrated lateral continuity of these veins for up to 200 metres and variable thicknesses, from less than 0.5 metres to 3.2 metres. Systematic channel sampling across these veins at 5- to 10-metre intervals yielded gold intercepts ranging from less than 1.0 to 406.5 g/t Au. SOQUEM completed 95 core boreholes (19,639 metres) on the property between 1996 and 2001.
|
5.2 |
2002 – 2019 Eastmain Resources Exploration |
Eastmain completed campaign style ground exploration programs from 2002 through to 2013. Little ground work aside from drilling was completed post 2013. The ground work completed by Eastmain included outcrop and trench mapping, soil sampling, ground and airborne geophysical surveying and trenching.
Soil sampling across the Project identified a number of anomalous targets. Several of these targets; Rosemary, Spider, Boomerang, Snake Lake and Clovis are located along the Cannard Deformation Zone within the Eau Claire deposit trend. On the eastern side of the property the Natel, Knight and Serendipity prospects were identified early on. The Percival prospect was not identified until 2018 through prospecting. Percival does not have a gold in soil anomaly associated with the near surface gold mineralization from the historical Eastmain work.
Airborne geophysical surveys were completed in 2005 (VTEM and magnetics with 100m line spacing), 2012 (Magnetics with 25 – 50m line spacing) across the entire property. A VTEM and magnetics grid targeting the Knight – Serendipity trend which includes Percival was completed in 2019. The airborne geophysical data was utilised to refine the structural and geologic models for the entire property.
In 2012 an airborne light detection and ranging (LiDAR) and aerial photography survey was flown over the entire Project. Digital elevation models and high resolution orthophoto imagery was provided. The LiDAR survey identified several new structural and stratigraphic features while also providing confirmation of the structural interpretations based off of the airborne geophysical data.
The combined LiDAR and magnetics interpretation showed the main stratigraphic units within the Project area are controlled by east-west oriented D2 structures.
|
5.3 |
Previous Resource Estimates |
In 2002, SOQUEM reported an Indicated mineral resource of 258,678 ounces of gold contained within 972,900 tonnes grading 8.27 g/t Au (9.62 g/t Au uncut), and an Inferred resource of 60,233 ounces of gold contained within 508,665 tonnes grading 3.68 g/t Au (3.79 g/t Au uncut).
In 2015 SRK completed a Mineral Resource Estimate reporting a combined open pit and underground resource of 0.97 Mt grading 7.29 g/t Au for 227koz Au in the Measured Category, 6.26Mt grading 3.60 g/t Au for 724koz Au in the Indicated category and 5.07Mt grading 3.88 g/t Au for 633koz Au in the inferred category. Open pit mineral resources were reported at a cut-off grade of 0.5 g/t gold and underground mineral resources were reported at a cut-off grade of 2.5 g/t gold. The cut-off grades consider a gold price of US$1,300 per ounce of gold and a gold recovery of 95%.
In 2018 an Updated Mineral Resource Estimate and Preliminary Economic Assessment on the Eau Claire Gold Deposit, Clearwater Property, Quebec, Canada” dated July 3rd, 2018, and with an effective date of February 4th, 2018, was prepared by Eugene Puritch, P.Eng., FEC, CET, Antoine Yassa, P.Geo., Andrew Bradfield, P.Eng. of P&E Mining Consultants Inc. and Allan Armitage, Ph.D., P. Geo of SGS Canada Inc.
In 2023 the 2018 Resource was restated by David Frappier-Rivard, P.Geo., of Fury Gold Mines and Maxime Dupere, P.Geo. of SGS Geological Services.
|
5.3.1 |
Discussion on Previous Resource Estimates |
The historical Mineral Resource Estimates summarized above are superseded by the 2024 Mineral Resources Estimate. Additional drilling, interpretation and modeling has been completed subsequent to the historical resource estimates. The historical resource estimates summarized above show a linear progression through time as more data and information was added at the Eau Claire Deposit and in the opinion of Ms. Doyon were reasonable with the information available at the time the resource estimates were completed. The only current mineral resource estimate for the Eau Claire Project is Ms Doyon’s 2024 Mineral Resource Estimate discussed in Section 11 of this report.
|
5.4 |
Historical Drilling |
Drilling completed on the Project supports the 2024 Mineral Resource Estimate and is described in Section 7 of this report.
|
5.5 |
Past Production |
There has been no previous production from the Project.
|
6 |
Geological Setting and Mineralization |
|
6.1 |
Geology |
The Eau Claire project is contained within the La Grande volcano-plutonic Subprovince (2,752 to 2,696 Ma) of the Superior Province approximately 30 kilometres south of the contact with the metasedimentary Opinaca Subprovince (2700 to 2648 Ma). Portions of the La Grande Subprovince were formerly referred to as the Eastmain Greenstone Belt. Depending on the literature, the Eastmain Greenstone Belt has retained its title as a distinct greenstone belt lying within the La Grande Subprovince.
The La Grande Subprovince consists of four volcanic cycles erupted between 2,752 and 2,705 Ma (Kauputauch, Natel, Anatacau-Pivert, and Komo-Kasak formations). The supracrustal rocks of the region are intruded by syn-volcanic (2747 to 2710 Ma) and post- or late-tectonic (2,697 to 2,618 Ma) tonalite- trondhjemite-granodiorite (TTG) suites.
The Eastmain Greenstone Belt consists of a 5- to 10-kilometre wide by 150-kilometre long succession of Archean bimodal volcanic rocks (Figures 2 and 3). The volcanic sequence includes lowermost mafic volcanic rocks overlain by felsic pyroclastic to volcaniclastic rocks, intercalated facies of iron formation, shaly and graphitic sedimentary units.

Figure 2: Eau Claire Deposit Stratigraphy
Metamorphic grade varies on a regional scale within the La Grande Subprovince from greenschist to amphibolite facies.
Geological studies completed throughout the region show evidence of multiple deformation events, including:
|
● |
A D1 event characterized by a penetrative foliation axial-planar to east-northeast- to northwest- trending F1 folds |
|
● |
A D2 event characterized by an east-trending crenulation cleavage axial-planar to moderately- plunging F2 folds |
Eau Claire is underlain by a bimodal volcanic sequence of mafic volcanic flows, felsic volcaniclastic rocks, sulphide iron formation, and graphitic metasedimentary rocks, intruded by a variety of felsic sub-volcanic plutons and dikes. The volcano-sedimentary sequence has been folded into an east-west-trending, west-plunging anticline, located at the western end of the Clearwater property.
The Eau Claire deposit straddles the contact on the south limb of an anticline between lowermost felsic volcaniclastic rocks overlain by mafic volcanic flows. Gold-bearing quartz-tourmaline veins from the Eau Claire deposit crosscut the volcanic/sedimentary rock contact and in turn are crosscut by late northeast- trending mafic dikes. The contact between volcanic and sedimentary rocks is a marker horizon that forms a broad open fold along the north limb and a tight fold closure immediately west of the deposit, as well as an east-west trending south limb that has been traced for several kilometres. Iron formation occurs along the southern limb of the antiform east of Eau Claire and is locally isoclinally folded.
The Eau Claire deposit is principally contained within a thick sequence of massive and pillowed mafic volcanic flows and felsic volcaniclastic rocks intruded by multiple phases of tonalite and felsic (quartz- feldspar) porphyry stocks, sills, and dikes (Figure 2).
A crescent-shape felsic porphyry dike swarm referred to as the Campbell Porphyry bounds the hanging wall (south) contact of the Eau Claire gold deposit. The overall shape of the Eau Claire gold deposit follows the contour of the felsic porphyry dike swarm. A second felsic porphyry dike swarm intruded the western end of the Eau Claire deposit coincident with the F2 fold nose.
The footwall rocks at the deposit consist of a thick sequence of east-west-trending, south-dipping volcaniclastic, ash to lapilli tuff and sedimentary rocks including greywacke, siltstone, mudstone, and conglomerate and felsic quartz-feldspar porphyry dykes. These rocks predominate throughout the central portion of the property and are locally intercalated with mini-cycles of mafic volcanic rock and amphibolite (mafic metavolcanic) alternating with felsic volcaniclastic rocks.
Gold mineralization at the Eau Claire gold deposit is generally located within approximately EW trending structurally-controlled, high-grade en-echelon quartz-tourmaline veins and adjacent altered wall rocks, as well as variable width ESE trending sheared and foliated alteration zones. The alteration zones are parallel to the overall foliation and are thus believed to represent an altered stratigraphic unit. The vein systems are predominantly hosted within a thick sequence of massive and locally pillowed mafic volcanic flows, interbedded with narrow intervals of volcaniclastic meta-sedimentary rocks. Both gold bearing vein sets may occur with as narrow intervals with tourmaline and develop into thick quartz-tourmaline veins with zoned tourmaline+/-actinolite+/-biotite+/-carbonate alteration halos which can measure up to several metres in thickness.
|
6.2 |
Structure |
Due to the complex structural geology of the Eau Claire project complete property and deposit-scale structural studies were completed by SRK in 2012 and 2014. Field-based studies reported evidence of four deformation episodes at the Clearwater property:
|
● |
D1 deformation characterized by S1 penetrative foliation, high strain zones, and isoclinal F1 folds |
|
● |
D2 deformation characterized by S2 crenulation cleavage, southwest-plunging F2 folds, east- trending and northeast-trending shear zones |
|
● |
D3 deformation characterized by northwest-trending crenulation cleavage, east-northeast-plunging F3 folds (only documented in the eastern part of the property), and northwest-trending shear zones |
|
● |
D4 deformation characterized by two sets of brittle faults including northeast-trending sinistral and northwest-trending dextral strike-slip faults |
A geological interpretation of aeromagnetic data over the Project revealed the following additional structural information:
Kilometre-scale fold interference patterns occur on the Project
|
● |
D1, D2, and D3 shear zones occur, and are preferentially developed, in mixed volcaniclastic and mafic volcanic rock sequences |
|
● |
A major D2 east-west-trending structure, known as the Cannard Deformation Zone, occurs approximately 1 kilometre south of the Eau Claire gold deposit and can be traced laterally for more than 100 kilometres based on regional airborne magnetic survey data |
|
● |
Several gold occurrences including the Eau Claire deposit and the Spider, Snake Lake, and Percival showings are distributed within or immediately adjacent to the Cannard Deformation Zone |
Figure 3. Regional Geology
|
6.3 |
Mineralization |
The Eau Claire deposit is a structurally-controlled gold deposit. Mineralization occurs primarily in a series of sheeted en-echelon quartz-tourmaline veins and associated metre scale alteration zones. Carbonate within the veins is associated with gold mineralization. The overall trend of the mineralized veins is controlled by a structural corridor sub-parallel to the D2 Cannard Deformation Zone. Individual veins are up to 1 metre thick and extent for at least 100 metres along strike.
Veins are composed of quartz and tourmaline; the ratio between quartz with accessory calcite to tourmaline can vary from 100 percent quartz to 100 percent tourmaline. The quartz-tourmaline veins are massive, banded and/or brecciated. Pyrite, pyrrhotite, chalcopyrite and rare molybdenite generally constitute less than 1.5 percent of the composition of these veins but can be upwards of 20% locally. Commonly, brecciated veins contain angular blocks of tourmaline, ranging in size from less than one to more than 25 centimetres in size. Fragments are cemented by a quartz-carbonate matrix. Breccia textures locally form a “piano key” pattern with angular tourmaline blocks aligned perpendicular to the vein walls. This texture is due to protracted deformation that affected already formed veins and generated new veins (tension gash veins developed on pre-existing laminated veins). The piano-key breccia has been observed throughout the deposit at all scales in tourmaline veins of less than 1 centimetre to more than 1 metre thick. A “ladder vein” texture has also been observed in outcrop at the 450 West Zone consisting of massive tourmaline layers with quartz-carbonate “ladders” aligned perpendicular to the vein walls.
Gold occurs as isolated grains or as clusters of fine-grained particles. Irregular to sub-angular shaped gold grains range in size from less than 10 micrometres to 1 millimetre. In rare instances, grains up to 1 centimetre in size have been observed. Locally, veins contain micrometre-size clusters of visible gold particles. Tellurobismuthite (Bi2Te3) occurs throughout the deposit. Gold and tellurides occur within micro fractures in quartz, interstitial to granular tourmaline grains, at the contact between massive aphanitic tourmaline and quartz bands, and along tourmaline laminations.
Gold mineralization also occurs within altered host rock without veining occurring as centimetre to several metre wide tourmaline-actinolite ± biotite ± calcite replacement zones around vein selvages.
The two major vein areas discovered to date in the resource area (the 450 West and 850 West zones) form a crescent-shaped mineralized, surface projected footprint 1.8 kilometres long by more than 100 metres wide, which has been traced to date to a vertical depth of 900 metres. Veins within the 450 West zone typically strike 85 degrees and dip 50 to 65 degrees to the south. Veins within the 850 West zone typically strike 60 degrees and dip subvertically.
|
6.4 |
Alteration |
Alteration zones associated with gold mineralization are often wider and volumetrically more extensive than the veins (SRK, 2015). The alteration halo ranges from 1 centimetre to several metres wide. Composition and mineralogy of the alteration zones bordering the veins varies according to the bulk composition of the host lithology. Where the veins are hosted by felsic to intermediate volcanic rocks or felsic porphyry, the alteration occurs as silicified and tourmaline-rich replacement zones, and as massive bands along the foliation. Veins hosted within the mafic volcanic rocks are characterized by a symmetrically zoned alteration pattern with an internal actinolite-tourmaline dominant mineral assemblage, and an external biotite- carbonate dominant assemblage. These alteration zones range from centimetre to several metres in thickness.
Both actinolite and tourmaline occur as non-foliated radiating prismatic and or fibrous aggregates and/or bands of acicular euhedral crystals. Biotite-carbonate assemblages occur more often as foliated, fine-grained aggregates. Actinolite-tourmaline alteration enveloping veins may be gradational with the quartz- tourmaline veins and contain gold. It is common to observe significant amounts of gold within tourmaline and/or actinolite and/or biotite altered rock with little or no visible vein material. Wide intervals of biotite-carbonate rock often form an external alteration zone to the sheeted quartz-tourmaline veins within mafic volcanic host lithologies. Both actinolite-tourmaline and biotite-carbonate alteration assemblages represent the strike and dip continuation of the quartz-tourmaline vein system where structural attenuation may have boudinaged the veins.
|
6.5 |
Deposit Types |
Gold mineralization at Eau Claire is structurally controlled and exhibits similar geological, structural and metallogenic characteristics to Archean Greenstone-hosted quartz-carbonate vein (lode) deposits. These deposits are also known as mesothermal, orogenic, lode gold, shear-zone-related quartz- carbonate or gold-only deposits (Dubé and Gosselin, 2007).
The following description of Greenstone-hosted quartz–carbonate vein deposits is extracted from Dubé and Gosselin (2007).
Greenstone-hosted quartz-carbonate vein deposits are structurally controlled, complex epigenetic deposits that are hosted in deformed and metamorphosed terranes. They consist of simple to complex networks of gold-bearing, laminated quartz-carbonate fault-fill veins in moderately to steeply dipping, compressional brittle-ductile shear zones and faults, with locally associated extensional veins and hydrothermal breccias. They are dominantly hosted by mafic metamorphic rocks of greenschist to locally lower amphibolite facies and formed at intermediate depths (5-10 km). Greenstone-hosted quartz-carbonate vein deposits are typically associated with iron-carbonate alteration. The relative timing of mineralization is syn- to late- deformation and typically post-peak greenschist-facies or syn-peak amphibolite facies metamorphism.
Gold is mainly confined to the quartz-carbonate vein networks but may also be present in significant amounts within iron-rich sulphidized wall rock. Greenstone-hosted quartz-carbonate vein deposits are distributed along major compressional to transpressional crustal-scale fault zones in deformed greenstone terranes of all ages, but are more abundant and significant, in terms of total gold content, in Archean terranes. However, a significant number of world-class deposits (>100 t Au) are also found in Proterozoic and Paleozoic terranes.
The main gangue minerals in greenstone-hosted quartz-carbonate vein deposits are quartz and carbonate (calcite, dolomite, ankerite, and siderite), with variable amounts of white micas, chlorite, tourmaline, and sometimes scheelite. The sulphide minerals typically constitute less than 5 to 10% of the volume of the orebodies. The main ore minerals are native gold with, in decreasing amounts, pyrite, pyrrhotite, and chalcopyrite and occur without any significant vertical mineral zoning. Arsenopyrite commonly represents the main sulphide in amphibolite-facies rocks and in deposits hosted by clastic sediments. Trace amounts of molybdenite and tellurides are also present in some deposits.
This type of gold deposit is characterized by moderately to steeply dipping, laminated fault-fill quartz- carbonate veins in brittle-ductile shear zones and faults, with or without fringing shallow-dipping extensional veins and breccias. Quartz vein textures vary according to the nature of the host structure (extensional vs. compressional). Extensional veins typically display quartz and carbonate fibres at a high angle to the vein walls and with multiple stages of mineral growth, whereas the laminated veins are composed of massive, fine-grained quartz. When present in laminated veins, fibres are subparallel to the vein walls.
Individual vein thickness varies from a few centimetres up to 5 metres, and their length varies from 10 up to 1000 m. The vertical extent of the orebodies is commonly greater than 1 km and reaches 2.5 km in a few cases.
The gold-bearing shear zones and faults associated with this deposit type are mainly compressional and they commonly display a complex geometry with anastomosing and/or conjugate arrays. The laminated quartz-carbonate veins typically infill the central part of, and are subparallel to slightly oblique to, the host structures. The shallow-dipping extensional veins are either confined within shear zones, in which case they are relatively small and sigmoidal in shape, or they extend outside the shear zone and are planar and laterally much more extensive.
Stockworks and hydrothermal breccias may represent the main mineralization styles when developed in competent units such as the granophyric facies of differentiated gabbroic sills, especially when developed at shallower crustal levels. Ore-grade mineralization also occurs as disseminated sulphides in altered (carbonatized) rocks along vein selvages. Due to the complexity of the geological and structural setting and the influence of strength anisotropy and competency contrasts, the geometry of vein networks varies from simple (e.g. Silidor deposit), to fairly complex with multiple orientations of anastomosing and/or conjugate sets of veins, breccias, stockworks, and associated structures. Layer anisotropy induced by stiff differentiated gabbroic sills within a matrix of softer rocks, or, alternatively, by the presence of soft mafic dykes within a highly competent felsic intrusive host, could control the orientation and slip directions in shear zones developed within the sills; consequently, it may have a major impact on the distribution and geometry of the associated quartz-carbonate vein network. As a consequence, the geometry of the veins in settings with large competence contrasts will be strongly controlled by the orientation of the hosting bodies and less by external stress. The anisotropy of the stiff layer and its orientation may induce an internal strain different from the regional one and may strongly influence the success of predicting the geometry of the gold-bearing vein network being targeted in an exploration program.
The veins in greenstone-hosted quartz-carbonate vein deposits are hosted by a wide variety of host rock types; mafic and ultramafic volcanic rocks and competent iron-rich differentiated tholeiitic gabbroic sills and granitoid intrusions are common hosts. However, there are commonly district-specific lithological associations acting as chemical and/or structural traps for the mineralizing fluids as illustrated by tholeiitic basalts and flow contacts within the Tisdale Assemblage in Timmins. A large number of deposits in the Archean Yilgarn craton are hosted by gabbroic (“dolerite”) sills and dykes as illustrated by the Golden Mile dolerite sill in Kalgoorlie, whereas in the Superior Province, many deposits are associated with porphyry stocks and dykes. Some deposits are also hosted by and/or along the margins of intrusive complexes (e.g. Perron-Beaufort/North Pascalis deposit hosted by the Bourlamaque batholith in Val d’Or. Other deposits are hosted by clastic sedimentary rocks (e.g. Pamour, Timmins).
The metallic geochemical signature of greenstone-hosted quartz-carbonate vein orebodies is Au, Ag, As, W, B, Sb, Te, and Mo, typically with background or only slightly anomalous concentrations of base metals (Cu, Pb, and Zn). The Au/Ag ratio typically varies from 5 to 10. Contrary to epithermal deposits, there is no vertical metal zoning. Palladium may be locally present.
At a district scale, greenstone-hosted quartz-carbonate vein deposits are associated with large-scale carbonate alteration commonly distributed along major fault zones and associated subsidiary structures. At a deposit scale, the nature, distribution, and intensity of the wall-rock alteration is controlled mainly by the composition and competence of the host rocks and their metamorphic grade.
Typically, the proximal alteration haloes are zoned and characterized – in rocks at greenschist facies – by iron-carbonatization and sericitization, with sulphidation of the immediate vein selvages (mainly pyrite, less commonly arsenopyrite).
Altered rocks show enrichments in CO2, K2O, and S, and leaching of Na2O. Further away from the vein, the alteration is characterized by various amounts of chlorite and calcite, and locally magnetite. The dimensions of the alteration haloes vary with the composition of the host rocks and may envelope entire deposits hosted by mafic and ultramafic rocks. Pervasive chromium- or vanadium-rich green micas (fuchsite and roscoelite) and ankerite with zones of quartzcarbonate stockworks are common in sheared ultramafic rocks. Common hydrothermal alteration assemblages that are associated with gold mineralization in amphibolite-facies rocks include biotite, amphibole, pyrite, pyrrhotite, and arsenopyrite, and, at higher grades, biotite/phlogopite, diopside, garnet, pyrrhotite and/or arsenopyrite, with variable proportions of feldspar, calcite, and clinozoisite. The variations in alteration styles have been interpreted as a direct reflection of the depth of formation of the deposits.
The alteration mineralogy of the deposits hosted by amphibolite-facies rocks, in particular the presence of diopside, biotite, K-feldspar, garnet, staurolite, andalusite, and actinolite, suggests that they share analogies with gold skarns, especially when they (1) are hosted by sedimentary or mafic volcanic rocks, (2) contain a calc-silicate alteration assemblage related to gold mineralization with an Au-As-Bi-Te metallic signature, and (3) are associated with granodiorite-diorite intrusions.
Canadian examples of deposits hosted in amphibolite-facies rocks include the replacement-style Madsen deposit in Red Lake and the quartz-tourmaline vein and replacement-style Eau Claire deposit in the James Bay area.
|
7 |
Exploration |
From 2020 to 2024, Fury Gold has completed systematic disciplined exploration programs with the goals of advancing known prospects through to the drill stage and identifying new prospects. The Company deployed biogeochemical sampling techniques to image the Percival mineralization, completed ground geophysical surveys at the Eau Claire Deposit Trend and along the Percival trend. Additionally, Fury compiled all historic exploration data into a single accessible database, reprocessed and reinterpreted the historical property scale geophysics data. The work completed by Fury to date has resulted in a refined targeting process and identification of areas and targets overlooked by previous explorers. The Company continues to explore through the testing of regional targets like Percival, Serendipity and Agua Clara and with a view to seeking to expand the Eau Claire deposit area which remains open along strike and to depth.
|
7.1 |
Percival Biogeochemical Sampling |
The Percival prospect did not provide a gold response from the historical soil sampling data that covered the mineralization, leading the Company to conduct various orientation geochemical surveys over the zone in an attempt to obtain a direct high contrast gold response from the mineralized bedrock overlain by shallow tills. The 2020 orientation survey was able to successfully detect the gold mineralization at Percival through biogeochemistry sampling.
Subsequent to the results of the orientation study at Percival the Company completed a biogeochemical survey covering 6.5km of prospective stratigraphy along the Percival trend. The survey identified 15 discrete gold anomalies with associated pathfinder elements (+/- As, Pb, Zn) (Figure 4). Two of these anomalies were previously known prospects, Percival and Carodoc, the remaining 13 anomalies are new occurrences of gold and associated pathfinder mineralization.
Through the combined interpretation of the magnetics data and results from the biogeochemical survey a NNW trending structural corridor was recognized. This structural trend is parallel to the regional fold hinge axis that links the Percival and Serendipity prospects. Gold mineralization appears to be concentrated along these newly identified structures where they intersect folded mafic volcanic stratigraphy along the east west limb of the regional fold proximal to the Cannard deformation zone.
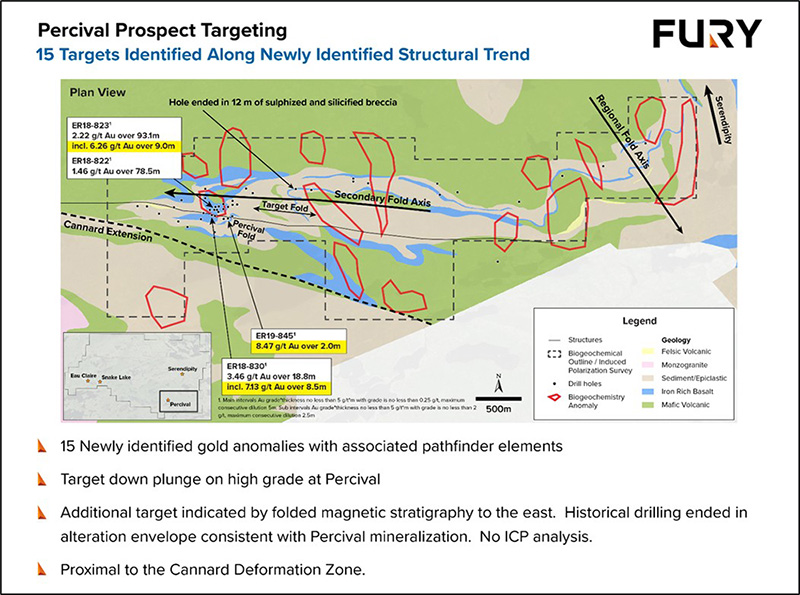
Figure 4: Percival Biogeochemical Sampling
|
7.1.1 |
Biogeochemical Methodology |
Biogeochemical samples were collected approximately every 50 m, over 100 m spaced traverse lines. The sampling grids were oriented perpendicular to the trend of the prospective lithologies. Approximately 200 g of black spruce twigs was collected at each sample site by hand. Samples were collected preferentially from healthy trees approximately of the same age and height. Samples were placed in a numbered cloth sample bag, with a sample tag placed inside the bag. The bags were tied shut. Sample data was recorded in field data loggers. At camp, samples were organized and hung to dry prior to shipping to ALS in Vancouver for gold and multi-element analysis.
|
7.2 |
Geophysical Surveys |
|
7.2.1 |
2020 Gradient Array Induced Polarization Survey |
During late 2020 the Company completed a gradient array direct current induced polarization (DCIP) survey over the Eau Claire deposit trend. The gradient array DCIP survey data was collected over four survey blocks using 12.5m receiver dipole spacing. A total of 12.86km2 was covered with the survey. This survey method was selected to assist in discriminating low sulphide/low conductivity targets such as the Eau Claire deposit Quartz-Tourmaline vein and High-Grade Schist systems. The gradient array DCIP survey identified a series of related primary and secondary shear zones controlling gold mineralization at the Eau Claire deposit (Figure 5).
|
7.2.1.1 |
Methodology |
Including overlapping regions, the total survey consists of 116.5 line-km of data covering a 7.0 km long and 1.5 km wide grid of 100 m spaced lines. This survey design uses fixed A-B current electrodes outside the survey area, with a gap of distance L. The M-N potential electrodes are displaced in lines parallel to the alignment formed by A and B. The Mi Ni spacing is equal to l. The gap between M and N depends on the desired resolution. The L/l ratio is typically between 40 and 120. In the case of this survey, L is 3000 m, and l is 12.5 m, so the L/l ratio is 240.
The distance between current electrodes for each block is as follows: Block A, 2933 m; Block B, 2929m; Block C, 2937 m; Block D and D’, 3005 m; Block E, 2977 m. The MN separation was 12.5 m. Block A covered 2.38 km2; Block B covered 1.94 km2; Block C covered 2.03 km2; Block D covered 1.98 km2; Block E covered 2.39 km2; Block BC covered 1.46 km2; and Block D’ covered 0.68 km2, for a total of 12.86 km2.
For quality control and leveling purposes, several repeat readings were measured, and a complete block, Block B, was resurveyed during the second phase of the program.
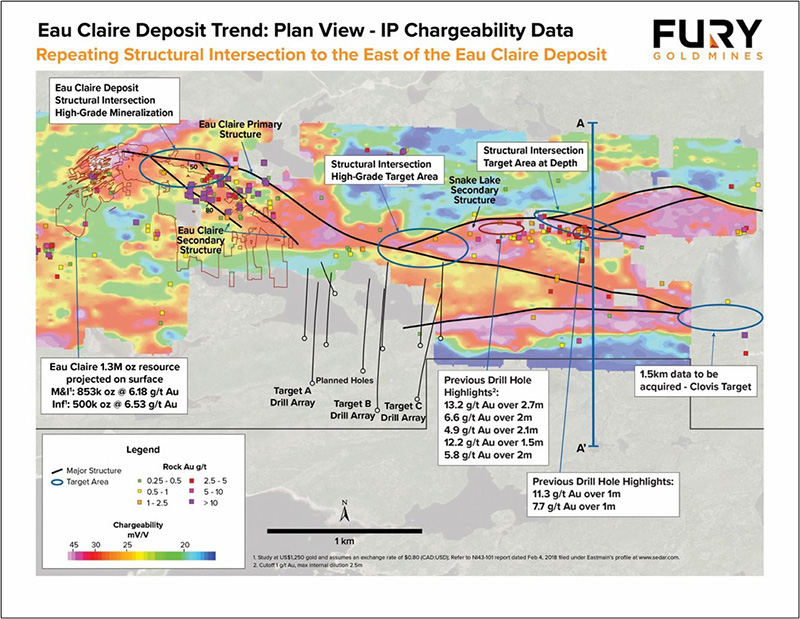
Figure 5: Gradient Array DCIP defined structural intersections to the north of the Snake Lake mineralized structure as well the convergence of the Eau Claire and South Tonalite structures.
|
7.2.2 |
2022 DCIP Survey |
A 29 line-km Induced Polarization ground geophysical survey along the Percival trend was completed in 2022. The survey targeted the strongly silicified core of the Percival mineralization and was able to identify a number of strong resistive anomalies that coincide with previously identified biogeochemical anomalies (Figure 6).
|
7.2.2.1 |
Methodology |
The IP survey was achieved on 3 distinct locations of the main grid that was implemented for this campaign. Overall, 18 N/S irregularly spaced profiles ranging in length between 0.975 and 2.025 km were read by IP. These lines were implemented over a distance of 6.5 km from the same base line (LB 0+00) oriented E/W, the latter being used by snowmobile to travel within the survey area.
The chaining was done every 25 m and wooden pickets were used. On each of these pickets, the line and station numbers were indicated with a marker every 25 m and an aluminum tag every 100 m. The location for some of the pickets along the baseline and tie lines was determined with a Garmin non-differential hand-held GPS receiver. This information was ultimately used to geo-reference the IP database to the UTM18N_NAD83 coordinate system.
The IP survey was carried out by using the pole-dipole electrode array with a nominal ‘‘a’’ spacing of 37.5 m and a separation factor (n) ranging from 1 to 20.
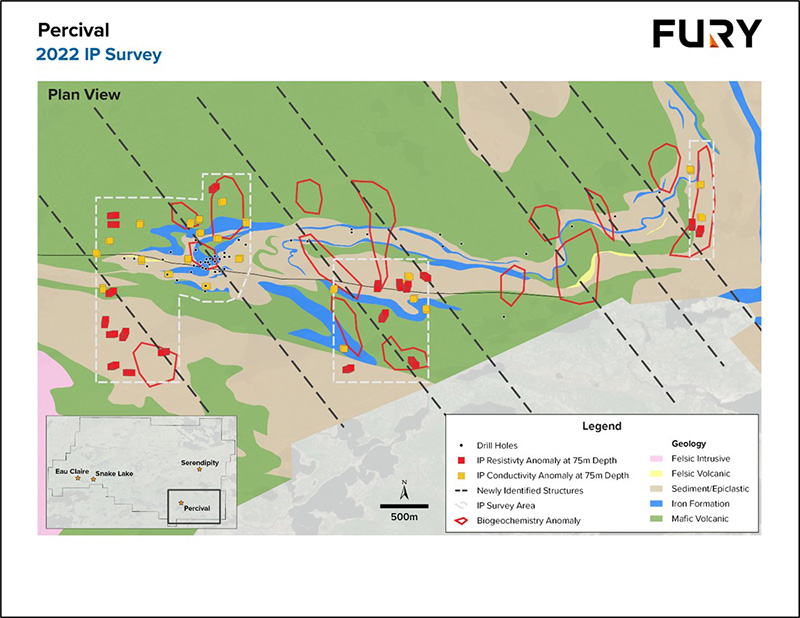
Figure 6: 2022 Percival DCIP IP Survey area depicting the identified resistivity anomalies in relation to the biogeochemical anomalies.
|
7.3 |
Drilling |
Drilling throughout the Eau Claire Project has taken place intermittently from 1972 through to 2024. A total of 410,253.8 m of drilling has been completed in 1,214 diamond drill holes across the entire Project area.
|
7.3.1 |
2002 – 2013 Drilling |
Between 2002 and 2013 Eastmain completed 177,713m of diamond core drilling in 534 drill holes. The drilling was completed within an area measuring approximately 2,200 metres east-west and 900 metres north-south has. The drilling pattern was designed to intersect the gold-tellurium mineralization. The majority of boreholes were drilled with a dip between 45 and 60 degrees, and an azimuth of 355 degrees.
The 2007 and 2009 drill campaign focussed on tightly spaced, 12.5m infill drilling at the 450 West Zone.
2010 drilling successfully confirmed the lateral continuity of the 850 West Zone underneath surface quartz-tourmaline veining identified in surface trenching. Regional drilling at Boomerang and Snake Lake was also completed in 2010. Broad zones of ,1 g/t Au were intersected from the 2010 regional program.
Drilling in 2011 through to 2013 focussed on the 450 West Zone and proximal strike extensions.
|
7.3.2 |
2015 Drilling |
Eastmain completed 29 drill holes (ER15-553 to -581) totalling 12,898 metres at Eau Claire in 2015. The drilling was focused on expanding Measured & Indicated Open Pit and Ramp Accessible Underground gold resources, within the upper portion (top third) of the Eau Claire Deposit.
Assay data from holes 553 to 573 confirms 45 gold-bearing intercepts ranging from 0.50 to 25.6 grams gold per tonne (g/t) over widths ranging from 2.0 to 11.5 metres (see Eastmain news release dated December 22, 2015 posted on SEDAR). Nineteen assay intervals exceeded cut-off grade for underground resources (2.5 g/t Au) at Eau Claire, with an average grade of 8.78 grams gold per tonne over an average width of 2.78 metres.
2015 drilling confirmed the continuation of gold mineralization laterally to the east Measured and Indicated gold resources identified in the SRK Report at Eau Claire. Several half-metre-wide high-grade vein intersections from ten of the drill holes reported herein contain very-fine-grade visible gold and range in grade from 24.5 to 98.8 g/t.
Infill core sampling of previous drill holes was also completed. Infill sampling confirmed a high-grade interval from hole ER08-131, which assayed 6.65 g/t Au over 5.0 metres, from within the JQ Vein at a depth of 66.0 metres. When combined with assay results from the adjacent P Vein, the intersection provides a composite interval grading 6.75 g/t Au across 13.8 metres, lying within the 450 West Zone. A total of 1,438 infill core samples were taken during the 2015 exploration program. Infill sampling of near-surface intervals within potential open-pit areas may contribute to current mineral resources.
|
7.3.3 |
2016-2017 Drill Program |
The 2016 through 2017 drilling program was designed to improve upon the resource classification of the 2015 SRK Mineral Resource Estimation as well as testing the Snake Lake prospect to the east of the Eau Claire deposit. A total of 90,448.9m was drilled in 236 drill holes. Of the total 2016-2017 drilling, 82,180m in 206 drill holes targeted the Eau Claire deposit, the remaining 30 holes tested the Snake Lake prospect.
Significant drill intercepts of the 2016-2017 drilling campaign are summarized below:
| ● |
ER16-583 |
10.2 g/t Au over 1.0m |
||
| ● |
ER16-584 |
79.7 g/t Au over 0.5m and |
||
|
11.5 g/t Au over 13.5m, incl. 21.3 g/t Au over 5m |
||||
| ● |
ER16-606 |
43.1 g/t Au over 2.0m |
||
|
incl. 96.8 g/t Au over 1.0m |
||||
| ● |
ER16-602 |
35.3 g/t Au over 0.7m |
||
| ● |
ER16-608 |
67.7 g/t Au over 2.4m and |
||
|
6.17 g/t Au over 5.3m |
||||
| ● |
ER16-617 |
15.8 g/t Au over 3.5m |
||
|
incl. 66.6 g/t Au over 0.7m |
||||
| ● |
ER16-620 |
6.74 g/t Au over 6.6m |
||
|
incl. 31.3 g/t over 1.0m |
||||
| ● |
ER16-621 |
20.2 g/t Au over 1.5m, |
||
|
incl. 49.1 g/t Au over 0.5m |
||||
| ● |
ER16-632 |
5.79 g/t Au over 4.1m, |
||
|
incl. 11.9 g/t Au over 1.6m |
||||
| ● |
ER16-645 |
14.6 g/t Au over 1.7 m, |
||
|
incl. 12.4 g/t Au over 1.0m |
||||
| ● |
ER16-648 |
29.3 g/t Au over 1.0m. |
||
| ● |
ER16-658 |
5.6 g/t Au over 11.3 m, |
||
|
incl. 11.9 g/t Au over 2.3m and |
||||
|
incl. 7.82 g/t Au over 3.9m |
||||
| ● |
ER16-666 |
8.95 g/t Au over 4.6m, |
||
|
incl. 20.4 g/t Au over 1.8m |
||||
| ● |
ER17-674 |
8.31 g/t Au over 13.3m, |
||
|
incl. 11.4 g/t Au over 8.8m; |
||||
|
4.28 g/t Au over 2.3m |
|
11.4 g/t Au over 2.5m, |
||||
|
incl. 45.5 g/t Au over 0.5m |
||||
| ● |
ER17-681 |
3.02 g/t Au over 11.0m, |
||
|
incl. 4.48 g/t Au over 6.0m |
||||
| ● |
ER17-686 |
4.89 g/t Au over 4.5m and |
||
|
3.50 g/t Au over 2.0m |
||||
| ● |
ER17-689 |
47.4 g/t Au over 1.5m |
||
| ● |
ER16-695 |
14.1 g/t Au over 6.2m |
||
|
incl. 73.1 g/t Au over 1.0m |
||||
| ● |
ER17-696 |
26.8 g/t Au over 2.5m, |
||
|
incl. 54.9 g/t Au over 1.0 m, 19.5 g/t Au over 1.3m |
||||
| ● |
ER17-697 |
43.7 g/t Au over 2.0m, |
||
|
incl. 73.4 g/t Au over 1.0m |
||||
| ● |
ER17-700 |
4.80 g/t Au over 4.0m and |
||
|
6.29 g/t Au over 0.5m |
||||
| ● |
ER17-703 |
9.77 g/t Au over 3.5m, |
||
|
7.78 g/t Au over 2.9m, and |
||||
|
70.7 g/t Au over 0.6m |
||||
| ● |
ER17-705 |
16.2 g/t Au over 1.6m |
||
| ● |
ER17-706 |
6.54 g/t Au over 9.0m, |
||
|
incl. 16.7 g/t Au over 2.5m, incl. 66.6 g/t Au over 0.5m |
||||
| ● |
ER17-708 |
20.0 g/t Au over 2.1m, and |
||
|
63.4 g/t Au over 0.5m |
||||
| ● |
ER17-711 |
9.98 g/t Au over 5.0m, |
||
|
incl. 33.7 g/t Au over 1.0m, |
||||
|
11.9 g/t Au over 1.0m |
||||
| ● |
ER17-712 |
4.37 g/t Au over 5.0m, and |
||
|
10.1 g/t Au over 1.0m |
||||
| ● |
ER17-713 |
20.7 g/t Au over 2.2m, and |
||
|
46.4 g/t Au over 0.7m |
||||
| ● |
ER17-717 |
37.7 g/t Au over 0.9m, |
||
|
32.8 g/t Au over 0.5m, and |
||||
|
3.44 g/t Au over 4.3m |
||||
| ● |
ER17-718 |
30.6 g/t Au over 4.9m, |
||
|
incl. 254 g/t Au over 0.5m, |
||||
| ● |
ER17-720 |
10.2 g/t Au over 8.5m, |
||
|
incl. 24.3 g/t Au over 2.0m |
||||
| ● |
ER17-723 |
42.3 g/t Au over 3.7 m, |
||
|
incl. 206 g/t Au over 0.5m |
| ● |
ER17-723 |
51.8 g/t Au over 0.5m |
||
| ● |
ER17-725 |
63.4 g/t Au over 0.5m, |
||
|
31.6 g/t Au over 0.7m |
||||
| ● |
ER17-727 |
34.5 g/t Au over 1.5m, |
||
|
incl. 50.0 g/t Au over 0.5m |
||||
| ● |
ER17-729 |
6.10 g/t Au over 3.5 m, |
||
|
incl. 10.8 g/t Au over 1.5m |
||||
| ● |
ER17-730 |
48.8 g/t Au over 0.5 m |
||
| ● |
ER17-734 |
5.66 g/t Au over 6.8m, |
||
|
incl. 17.9 g/t Au over 1.0m |
||||
| ● |
ER17-744 |
5.36 g/t Au over 5.4m, |
||
|
incl. 13.3 g/t Au over 1.9m |
||||
| ● |
ER17-757 |
21.8 g/t Au over 1.1m, |
||
|
incl. 37.4 g/t Au over 0.6m. |
||||
| ● |
ER17-774 |
30.8 g/t Au over 4.1 m (intersected a HGS Vein) |
||
The continuity of the High-Grades schists (“HGS”) was also drill tested by drilling down-strike of the structure over 143m, intersecting multiple major intercepts:
| ● |
ER17-776 |
6.25 g/t Au over 4.5m, incl. 9.36 g/t Au over 1.5m |
||
|
15.3 g/t Au over 6.0m, incl. 41.6 g/t Au over 2.0m |
||||
|
3.98 g/t Au over 8.3m, incl. 8.70 g/t Au over 2.5m |
||||
|
7.09 g/t Au over 35.8m, incl. 9.23 g/t Au over 13.7m |
||||
|
incl. 12.8 g/t Au over 4.5m. |
|
7.3.4 |
2018 – 2019 Drill Program |
The 2018 and 2019 drilling programs were mostly focus on the newly discovered Percival Prospect. A total of 16,468.6m was drilled in 53 drill holes. Of the total 2018-2019 drilling, 13,182.6m in 47 drill holes targeted the Percival Prospect. The remaining drilling were collared in the Serendipity area (3 DDH) and the Eau Claire deposit (3 DDH). The best results were from Hole ER18-822, ER18-823 ER19-832 returned broad intercepts of respectively 78.5m of 1.456 g/t Au, including 8.2m of 4.45 g/t Au, 87.0m of 2.35 g/t Au, including 31.5m of 3.13 g/t Au and 52.75m of 1.8 g/t Au, including 22.0m of 3.21 g/t Au. ER18-829 with 34.1m of 2.05 g/t Au, including 4.5m of 11.95 g/t Au, ER19-839 with 12.0m of 3.04 g/t Au, including 7.0m of 4.66 g/t Au, ER19-845 with 7.0m of 3.13 g/t Au, including 2.0m of 8.47 g/t Au, ER19-852 with 22.85m of 1.18 g/t Au, including 14.85m of 2.05 g/t Au
|
7.3.5 |
Discussion on Drilling Completed Prior to 2020 |
It is the opinion of Ms. Doyon that the diamond drilling conducted prior to 2020 at the Eau Claire Project meets or exceeds current industry best practices. Ms. Doyon is unaware of any drilling or recovery issues that may impact upon the accuracy and reliability of the results. In the opinion of Ms. Doyon the results generated from the pre 2020 drill programs are suitable for use in a Mineral Resource Estimation.
|
7.3.6 |
Fury Gold Mines Drilling 2020-2024 |
From 2020 through to 2024, Fury completed a total of 120 diamond drill holes for approximately 75,654.3 m on the Project. The drill program consisted of i) an extension phase focused on extensions to the known vein corridors along strike from the current resource (“Extension Program”); ii) an exploration phase designed to test targets along the 4.5km long deposit trend (“Exploration Program”) and iii) an exploration phase of drilling designed to test targets at the Percival and Serendipity prospects 14km east and 20 km northeast of the Eau Claire Deposit respectively. Large stepout drilling in 2022 increased the mineralized footprint of the Eau Claire deposit by over 450m to the west. At Percival Fury intercepted 13.5 metres (m) of 8.05 g/t gold (Au) outlining a 500x100x300m zone of gold mineralization.
The 2023 drilling campaign focused on the Hinge Target, which is located west of the deposit, adjacent to the 850 W zone, and the at Percival prospect area. Results from the 2023 Hinge drilling expanded the Hinge Target gold mineralization 50m up-dip and 75m to the west respectively, over 450m from the defined Eau Claire Resource as well as intercepting high grade shallow mineralization on the eastern edge of the Hinge target.
Table 3: Summary of Drilling Completed by Fury
|
Target |
Type |
Core size |
Number of holes |
Metres drilled (m) |
Years |
|
Deposit Extension stepouts |
DDH |
NQ and HQ |
27 |
12,721.8 |
2020-2022 |
|
Western Hinge |
DDH |
NQ and HQ |
33 |
21,307.1 |
2021-2023 |
|
Gap |
DDH |
HQ |
3 |
2,020.0 |
2022 |
|
Western Limb |
DDH |
HQ |
7 |
7,498.5 |
2021 |
|
North Limb |
DDH |
HQ |
3 |
1,615.5 |
2022 |
|
Down plunge East Extension |
DDH |
NQ |
9 |
9,186.0 |
2020-2021 |
|
Snake Lake |
DDH |
NQ and HQ |
10 |
5,922.1 |
2021 |
|
Percival |
DDH |
NQ |
18 |
11,497.8 |
2022 and 2023 |
|
Serendipity |
DDH |
NQ |
10 |
3880 |
2024 |
|
Total: |
110 |
71771.3 |
|
7.3.7 |
Eau Claire Drilling |
The Extension Program at the Eau Claire deposit was designed to target strike extensions of the known vein corridors to the west and southeast of the current mineral resource. To date, Fury Gold has drilled twenty one holes targeting the southeast extension of the Eau Claire Resource with intercepts including: 23.27 g/t Au over 7.09m, 11.56 g/t Au over 6.04m, 59.3 g/t Au over 0.96m and 4.89 g/t Au over 2.94m. Results from the four holes completed in the second quarter of 2022 were released on August 3, 2022 including 4.43 g/t Au over 1.43m and 4.60 g/t Au over 1.25m. Two additional holes were completed in October 2022 with results released on January 23, 2023 including 3.91 g/t Au over 2.50m.
The exploration drilling program along the Eau Claire deposit trend continues to demonstrate the potential to significantly expand the Eau Claire deposit to the west. The focus has been on the Western Hinge, and Gap Zone as well as along the north limb of the anticline. All exploration targets within the Deposit Trend have the potential to significantly expand the Eau Claire mineralized footprint. To date the footprint of gold mineralization has been increased by over 455m or 25% at the Hinge Target alone and remains open to further expansion to the West.
Table 4 Eau Claire area significant intercepts
|
hole ID |
from |
to |
Au (ppm) |
true length (m) |
Including |
|
20EC-002 |
399.9 |
403.7 |
4.89 |
2.94 |
2.47 m at 5.4 g/t (399.9-403.1 m) |
|
20EC-003 |
377.5 |
384 |
4.45 |
5.43 |
2.51 m at 8.9 g/t (381-384 m) |
|
20EC-003 |
391 |
393 |
8.84 |
1.68 |
|
|
20EC-004 |
451 |
457 |
3.06 |
5.1 |
3.4 m at 3.5 g/t (451-455 m) |
|
20EC-005 |
312 |
319 |
11.56 |
6.04 |
3.45 m at 18.5 g/t (313-317 m) |
|
21EC-013 |
597 |
600 |
8.87 |
2.88 |
|
21EC-013 |
612 |
613 |
59.3 |
0.96 |
|
|
21EC-022 |
319 |
327.5 |
23.27 |
7.09 |
|
|
21EC-025 |
362.5 |
364 |
9.37 |
1.33 |
|
|
21EC-026 |
663 |
668 |
2.71 |
4.96 |
1.49 m at 6 g/t (663-664.5 m) |
|
21EC-026 |
720 |
721.5 |
7.3 |
1.49 |
|
|
21EC-026 |
747.5 |
751 |
3.21 |
3.49 |
|
|
21EC-028 |
586 |
591 |
2.6 |
4.97 |
|
|
21EC-028 |
637 |
638.5 |
7.77 |
1.49 |
|
|
21EC-030 |
379.5 |
381 |
14.27 |
1.29 |
|
|
21EC-032 |
9.5 |
11 |
8.5 |
1.5 |
|
|
21EC-032 |
608.5 |
609.5 |
12.81 |
1 |
0.5 m at 22.4 g/t (609-609.5 m) |
|
21EC-041 |
237.5 |
240.5 |
3.38 |
3 |
|
|
21EC-041 |
314 |
317 |
9.36 |
3 |
|
|
22EC-047 |
393 |
401 |
1.81 |
8 |
|
|
22EC-048 |
445 |
448.5 |
4.79 |
3.5 |
1 m at 11.9 g/t (445-446 m) |
|
22EC-048 |
468 |
469 |
14.19 |
1 |
0.5 m at 27.2 g/t (468.5-469 m) |
|
22EC-048 |
522 |
525.5 |
5.86 |
3.5 |
|
|
22EC-048 |
536 |
541.5 |
2.5 |
5.5 |
1 m at 9.84 g/t (537.5-538.5 m) |
|
22EC-048 |
663 |
664 |
20.6 |
1 |
|
|
22EC-048 |
671 |
674 |
3.36 |
3 |
|
|
22EC-048 |
681 |
684.5 |
3.73 |
3.5 |
|
|
22EC-048 |
692 |
709.5 |
1.29 |
17.5 |
|
|
22EC-055 |
651 |
655 |
5.75 |
4 |
2 m at 9.03 g/t (651.0-653.0 m) |
|
22EC-058 |
352.5 |
353.5 |
45 |
1 |
|
|
22EC-059 |
181.5 |
183 |
22.77 |
1.5 |
|
|
22EC-059 |
380 |
381.5 |
15.3 |
1.5 |
|
|
23EC-062 |
451 |
452 |
10.35 |
1 |
|
|
|
493 |
507 |
2.37 |
14 |
Including 5m at 3.6 g/t (499-504m) |
|
23EC-062 |
622 |
628 |
2.77 |
6 |
Including 1m at 7.61 g/t (622-623m) |
|
23EC-063 |
684.5 |
691 |
2.66 |
6.5 |
Including 1.5m at 5.49 g/t (688-689.5m) |
|
23EC-063 |
708 |
719 |
1.23 |
11 |
|
|
23EC-065 |
663.5 |
666 |
5.90 |
2.5 |
Including 1m at 13.95 g/t (665-666m) |
|
23EC-065 |
674.5 |
678 |
5.73 |
3.5 |
Including 1m at 18.5 g/t (677-678m) |
|
|
694 |
698.5 |
4.65 |
4.5 |
Including 2.5m at 7.43 g/t (696-698.5m) |
|
|
724 |
729.5 |
1.94 |
5.5 |
|
|
|
350 |
351 |
19.55 |
1 |
|
|
|
702.5 |
706 |
3.82 |
3.5 |
Including 1.5m at 6.05 g/t (704.5-706m) |
|
23EC-068 |
387 |
392 |
2.62 |
5 |
Including 1.5m at 4.83 g/t (389.5-391m) |
|
23EC-068 |
435 |
442.5 |
2.56 |
7.5 |
Including 1.5m at 4.83 g/t (441-442.5m) |
|
23EC-069 |
643.5 |
646.5 |
3.34 |
3 |
|
|
23EC-069 |
650 |
655.5 |
4.52 |
5.5 |
Including 4m at 5.71 g/t (650-654m) |
|
23EC-070 |
480.5 |
484 |
3.51 |
3.5 |
Including 1.0m at 8.04 g/t (481.5-482.5m) |
|
23EC-073 |
214.5 |
218.5 |
3.83 |
4 |
Including 1.0m at 11.6 g/t (217.5-218.5m) |
|
23EC-073 |
248.5 |
250 |
8.30 |
1.5 |
meets sub-interval criteria as well |
|
23EC-074 |
486 |
486.5 |
65.30 |
0.5 |
meets sub-interval criteria as well |
|
23EC-074 |
522 |
523 |
14.25 |
1 |
meets sub-interval criteria as well |
|
23EC-075 |
419 |
422 |
3.83 |
3 |
Including 1.0m at 8.94 g/t (421-422m) |
|
23EC-075 |
478 |
483 |
2.37 |
5 |
|
|
23EC-075 |
487.5 |
494 |
3.41 |
6.5 |
|
|
23EC-075 |
592.5 |
596 |
5.00 |
3.5 |
Including 1.0m at 15.15 g/t (592.5-593.5m) |
|
23EC-076 |
295.5 |
300 |
2.84 |
4.5 |
|
|
23EC-077 |
290 |
293.5 |
31.77 |
3.5 |
meets sub-interval criteria as well |
|
23EC-078 |
371.5 |
375 |
5.49 |
3.5 |
meets sub-interval criteria as well |
|
23EC-078 |
697 |
706.5 |
1.88 |
9.5 |
Including 1.5m at 6.31 g/t (703.5-705.0m) |
|
23EC-079 |
271 |
279.5 |
3.35 |
8.5 |
Including 3.0m at 5.7 g/t (275-278m) |
|
23EC-079 |
321 |
328.5 |
2.24 |
7.5 |
|
|
23EC-082 |
182.5 |
186 |
17.62 |
3.5 |
Including 2.0m at 29.8 g/t (182.5-184.5m) |
|
23EC-082 |
366.5 |
367 |
22.20 |
0.5 |
meets sub-interval criteria as well |
|
Main intervals - Au grade*thickness no less than 2g/t*m with grade is no less than 1g/t, maximum consecutive dilution 2m |
|||||
|
Including intervals - Au grade*thickness no less than 7g/t*m with grade is no less than 3.5g/t, maximum consecutive dilution 2m |
|||||
|
True thickness calculation based on dip of 55° and dip azimuth of 191.5° |
|||||
|
True thickness calculation based on dip of 43° and dip azimuth of 180° |
|||||
|
Downhole thickness was used due to the unknown zone orientations |
|
7.3.8 |
Percival Drilling |
The Company completed 11,497.8m in 18 diamond drill holes in 2022 and 2023 at Percival. Five holes targeted the parallel hinge 500m to the east of Percival proper. All holes intercepted silicified sulphide rich breccias, however only narrow low grade gold values were returned. The remainder of the drilling tested extensions of the historical gold mineralization at Percival proper. The results from the Percival proper drilling program confirm that the high-grade core of the Percival mineralization plunges steeply to the west and remains open in all directions. Highlights included an 85m step out from historical high-grade mineralization which intercepted 13.5m of 8.05 g/t Au, (including 3.00m of 25.8 g/t Au) in drill hole 22KP-008 and a 150m step out which intercepted 7.5m of 4.38 g/t Au, (including 3m of 8.7 g/t Au, and 3m of 5.5 g/t Au) in drill hole 22KP-005. As well as 279 g/t Au over 1.5m along the eastern edge of the defined mineralization. With the recent drilling the gold mineralization at Percival Main is represented by a 500 m by 100 m footprint with high-grade gold being defined to 300 m below surface hosted within folded sulphidized, silicified, and brecciated sediments.
Table 5 Percival area significant intercepts
|
Hole ID |
From (m) |
To (m) |
Au (ppm) |
Length (m) |
|
22KP-001 |
236 |
240.5 |
0.49 |
4.5 |
|
22KP-001 |
347 |
356 |
0.25 |
9 |
|
22KP-004 |
331.5 |
339 |
1.23 |
7.5 |
|
22KP-004 |
351 |
360 |
0.32 |
9 |
|
22KP-004 |
367.5 |
370.5 |
0.78 |
3 |
|
22KP-004 |
378 |
408 |
0.71 |
30 |
|
22KP-004 |
429 |
430.5 |
2.86 |
1.5 |
|
22KP-004 |
439.5 |
444 |
1.49 |
4.5 |
|
22KP-004 |
537 |
543 |
0.39 |
6 |
|
22KP-005 |
358.5 |
390 |
1.39 |
31.5 |
|
22KP-005 |
408 |
412.5 |
0.92 |
4.5 |
|
22KP-005 |
447 |
457.5 |
0.63 |
10.5 |
|
22KP-005 |
468 |
472.5 |
3.88 |
4.5 |
|
22KP-006 |
223.5 |
231 |
1.51 |
7.5 |
|
22KP-006 |
247.5 |
250.5 |
1.34 |
3 |
|
22KP-006 |
267 |
270 |
0.78 |
3 |
|
22KP-006 |
328.5 |
343.5 |
1.81 |
15 |
|
22KP-007 |
61.5 |
66 |
1.76 |
4.5 |
|
22KP-008 |
193.5 |
210 |
0.45 |
16.5 |
|
22KP-008 |
234 |
261 |
4.34 |
27 |
|
22KP-008 |
277.5 |
282 |
0.50 |
4.5 |
|
22KP-008 |
379.5 |
394.5 |
1.16 |
15 |
|
22KP-008 |
465 |
468 |
0.83 |
3 |
|
23KP-009 |
221 |
243.5 |
0.52 |
22.5 |
|
23KP-010 |
268.5 |
288 |
0.66 |
19.5 |
|
23KP-010 |
432 |
442 |
0.31 |
10 |
|
23KP-010 |
472.5 |
483 |
0.32 |
10.5 |
|
23KP-011 |
399 |
406 |
1.00 |
7 |
|
23KP-011 |
624 |
676.5 |
0.34 |
52.5 |
|
23KP-011 |
691 |
701.5 |
0.40 |
10.5 |
|
23KP-012 |
310 |
358.5 |
0.86 |
48.5 |
|
23KP-012 |
373.5 |
390 |
1.42 |
16.5 |
|
23KP-012 |
441 |
455 |
1.09 |
14 |
|
23KP-012 |
591 |
600 |
0.43 |
9 |
|
23KP-012 |
660 |
666 |
0.54 |
6 |
|
23KP-013 |
529.5 |
544 |
1.05 |
14.5 |
|
23KP-013 |
677.5 |
678.5 |
4.78 |
1 |
|
23KP-013 |
687 |
717 |
0.30 |
30 |
| Hole ID | From (m) | To (m) | Au (ppm) | Length (m) |
|
23KP-014 |
378 |
396 |
0.50 |
18 |
|
23KP-014 |
549 |
566.5 |
0.29 |
17.5 |
|
23KP-014 |
639 |
643.5 |
0.33 |
4.5 |
|
23KP-015 |
344 |
348.5 |
93.09 |
4.5 |
|
23KP-015 |
412.5 |
432.5 |
1.20 |
20 |
|
23KP-015 |
449 |
456.5 |
0.64 |
7.5 |
|
23KP-015 |
497 |
507 |
1.88 |
10 |
|
23KP-015 |
564 |
567 |
0.99 |
3 |
|
23KP-016 |
412.5 |
433.5 |
0.27 |
21 |
|
23KP-016 |
451 |
464.5 |
0.49 |
13.5 |
|
23KP-016 |
482.5 |
497.5 |
0.88 |
15 |
|
23KP-016 |
504 |
532.5 |
0.42 |
28.5 |
|
23KP-017 |
469.5 |
472.5 |
0.77 |
3 |
|
Intervals - Au grade*thickness no less than 0.25g/t*m with grade is no less than 0.25g/t, maximum consecutive dilution 6m |
||||
|
Downhole thickness was used due to the unknown zone orientations |
||||
|
7.3.9 |
Methodology |
Diamond drilling was contracted to Youdin Rouillier Drilling Inc from Amos (Rouillier), Qc. Rouiller used helicopter portable VersaDrill at Percival and VersaDrill on skid around the Eau Claire deposit. Rouiller partnered with RJLL Dlilling Inc, who used a helicopter portable DrillCo drill at Persival and a conventional mobile drill HTM 2500 around the Eau Claire deposit. The conventional drills produced NQ size (47.6 mm diameter) and/or HQ size (63.5 mm diameter) core, while the helicopter supported rigs produced NQ size core. The conventional drills were moved between drill sites with a D6R dozer, while the helicopter supported drills were moved and supported by Astar 350 B3 helicopters provided by Panorama helicopters from Alma, Qc (2022) or a Bell 407 provided by HTS Héli-Transport from Trois-Rivières, Qc.
The locations of drill hole pads were initially marked using a handheld GPS instrument and the azimuth of the holes was established by compass. Once the pad was built and the drill moved onto it, an Azimuth Aligner instrument manufactured by Minnovare Pty. Ltd., or an APS manufactured by Reflex was used to establish the azimuth. An inclinometer was used to establish the dip.
The attitude of the hole with depth was determined using a DeviShot instrument manufactured by Devico AS or a Sprint-IQ instrument manufactured by Reflex in single shot mode with readings taken by the drillers. The initial reading was taken at a depth 15 m with subsequent readings taken nominally at 15 m intervals. An OGQ registered geologist checked the core before making the decision to terminate the holes. Upon completion of the hole, the casings were left in place and covered with a casing cap, marked with the casing’s coordinated. Subsequently all hole locations were surveyed with differential GPS.
Drill core was placed sequentially in wooden core boxes at the drill by the drillers and sealed with top covers and ties before transport. The core boxes were transported by ATV and/or Pickup trucks on a twice daily basis for the conventional drill and one time a day for the helicopter supported drill. The core was transported to the camp where depth markers and box numbers were checked and the core was carefully reconstructed in a secure core facility. The core was logged geotechnically on a 3 m run by run basis including, core recovery, RQD. Magnetic susceptibility and XRF measurements were taken every metres.
The core was descriptively logged and marked for sampling by an OGQ registered geologist or geologist in-training, paying particular attention to lithology, structure, alteration, veining/brecciation, and sulphide mineralization.
Logging and sampling information was entered into MX Deposit cloud-based core logging application by MINALYTIX INC. which allowed for the integration of the data into the project database.
The core was photographed both wet and dry after logging but prior to sampling.
Figure 7 depicts the flow sheet for Fury’s Diamond drilling methodology.
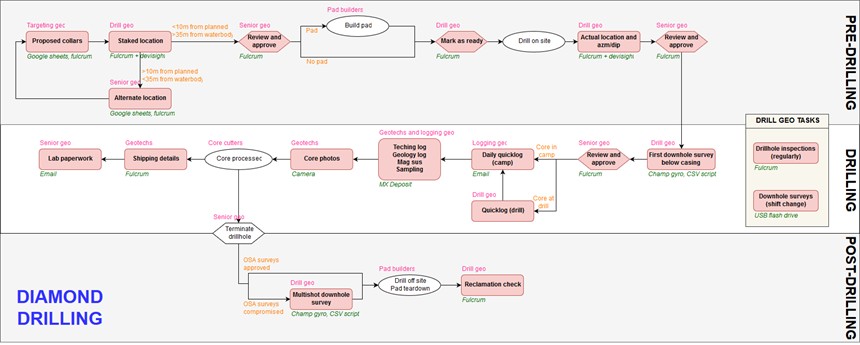
Figure 7: Fury Diamond Drilling Methodology Flow Sheet
|
8 |
Sample Preparation, Analyses, and Security |
|
8.1 |
Diamond Drilling |
Core recovery is generally very good to excellent, allowing for representative samples to be taken and accurate analyses to be performed. Half-core samples, 0.5 metre to 1.5 metre long, were taken where the rock was mineralized and/or altered. In the case of the Snake Lake and Percival holes, the core was sampled along the entire length of each hole.
Individual core samples were placed in rice bags which were sealed using uniquely numbered zip ties. Completed sample shipments for the Extension Program in 2020 and early 2021 and all 2022 drilling were sent to ALS Lab in Val d’Or, QC (ISO/IEC 17025:2017 and ISO 9001:2015 accredited facility) for preparation and analysis. Preparation included crushing core samples to 90% < 2mm and pulverizing 1000g of the crushed material to better than 85% < 75 microns. All samples are assayed using 50 g nominal weight fire assay with atomic absorption finish (Au-AA24) and multi-element four acid digest ICP-AES/ICP-MS method (ME-MS61). In 2020-2021, where Au-AA24 results are greater than 5 ppm Au the assay are repeated with 50 g nominal weight fire assay with gravimetric finish (Au-GRA22), the 5 ppm threshold was change for 10 ppm in 2022. QA/QC programs using internal and lab standard and blank samples, field and lab duplicates and re-assay indicate good overall accuracy and precision.
Sample shipments from the exploration program in 2021 were sent to Actlabs in Val d’Or, QC for preparation and then to Actlabs in Thunder Bay, ON for analysis. All samples are assayed using 50 g nominal weight fire assay with atomic absorption finish (1A2B-50) and multi-element four acid digest ICP-AES/ICP-MS method (1F2). Where 1A2B-50 results were greater than 5 ppm Au the assay were repeated with 50 g nominal weight fire assay with gravimetric finish (1A3-50). QA/QC programs using internal standard samples, field and lab duplicates and blanks indicate good.
Analytical samples for the Extension Program from March 2021 through to October 2021 were sent to Bureau Veritas (BV) lab in Timmins, ON (ISO/IEC 17025 accredited facility) for preparation and analysis. Preparation included crashing core sample to 90% < 2mm and pulverizing 1000g of crushed material to better than 85% < 75 microns. All samples are assayed using 50 g nominal weight fire assay with atomic absorption finish (BV code FA450) and multi-element four acid digest ICP-AES/ICP-MS method (BV code MA200). Where FA450 results are greater than 5 ppm Au the assay is repeated with 50 g nominal weight fire assay with gravimetric finish (FA550-Au). QA/QC programs using internal and lab standard and blank samples, field and lab duplicates and re-assay indicate good overall accuracy and precision.
Figure 8 depicts the Sample preparation and analyses undertaken by Fury for Diamond drill samples.
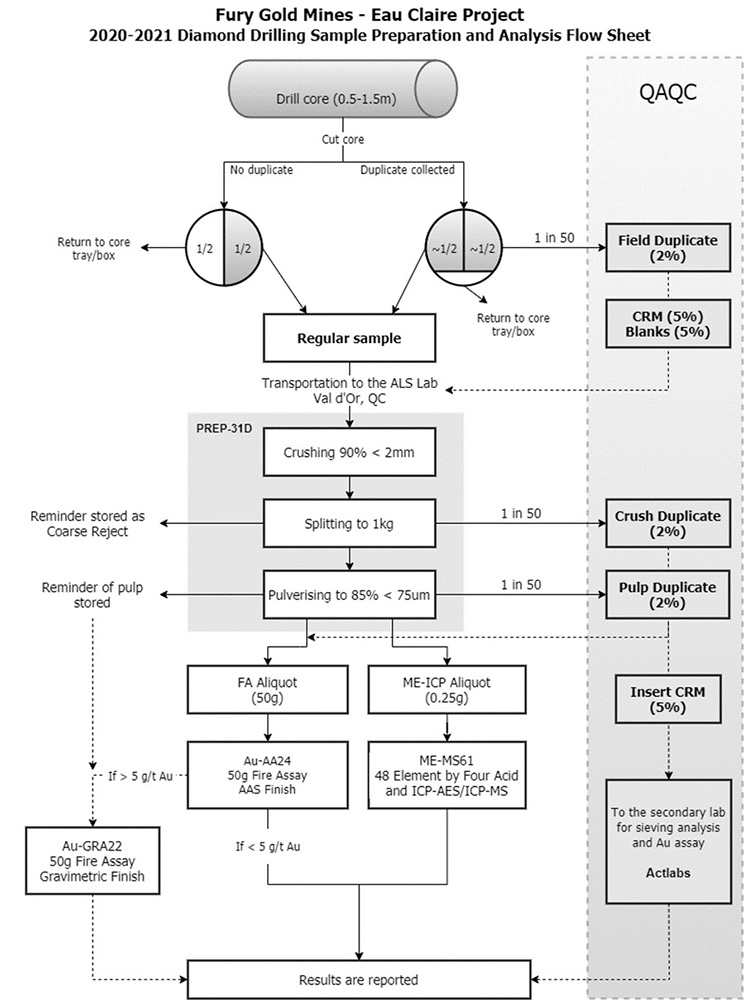
Figure 8: Diamond Drilling Sample Preparation and Analysis Flow Sheet - ALS
|
8.1.1 |
QC Sampling |
QC protocols were established in 2002 and carried through with minor refinements through the current drilling program.
Quality Control (QC) samples are introduced into the sample stream at a rate of 5% for both blank samples and CRM samples. Field duplicates in the form of quarter sawn core samples, are introduced into the sample stream at a rate of 1 in 50 samples.
|
8.2 |
Summary |
In the opinion of Ms. Doyon the logging, sampling, assaying, and chain of custody protocols practiced through the history of the Project meet or exceed industry standards. The drill programs have been configured and carried out in a manner that is appropriate for the geometry of the deposit. Drill holes are oriented perpendicular to strike and aimed to intersect the zones at an angle generally greater than 45°. As such, the samples should be representative of the deposit as it is presently known, and suitable for use in Mineral Resource estimation.
Ms. Doyon reviewed the QC reports and files, as well as the laboratory procedures undertaken and conclude that the QC program for the Project is sufficient to support a Mineral Resource estimate. QC sample failures were dealt with on a case by case basis and were documented with commentary in the Dispatch Returns table within the database.
|
9 |
Data Verification |
|
9.1 |
Database Verification |
Comprehensive data verification was performed by SRK (2015) and Allan Armitage, Ph. D., P.Geo. and Sabry Hafez, Ph. D., P.Eng, with SGS Canada Inc, as part of the 2017 Mineral Resource Estimate and again by Dupere et al. (2024) as part of the 2024 Updated Mineral Resource Estimate as outlined in supporting NI43-101 reports (Armitage and Hafez, 2017 and Dupere et al., 2024). These included checks against original data sources, standard database checks such as from/to errors and basic visual checks for discrepancies with respect to topography and drillhole deviations.
Ms. Doyon has been personally involved in the integration and merging of the historical drill data into the current database. This work included relogging of historical holes to provide consistency of logging codes across all generations of drilling, as well as spot checks of drill core versus drill logs to verify the geologic model. During this process sample intervals were verified. Lastly, the assay database was compared to original assay certificates. No errors were found within the geologic or assay databases.
|
9.2 |
2020 through 2024 Quality Assurance and Quality Control |
The QA/QC program comprises the systematic insertion of standards or CRMs, blanks, as well as field, coarse reject, and pulp duplicates. QC samples have been inserted into the sample sequence at a frequency of approximately 1 sample per 25 samples for CRMs and blanks, 1 sample per 50 samples for field duplicate samples, 1 sample per 75 samples for coarse reject duplicates, and 1 sample per 25 samples for pulp duplicates. Approximately 15.1% of samples assayed have been QC samples in the drilling programs from 2020 to 2023. Combined QC sample statistics for this period are presented in (Table 11‑5). All QC samples listed were analyzed by the primary analytical lab (ALS). Check sampling of selected rejects and pulps has also been completed at both ALS and ACT laboratories in 2022 through 2024.
Table 6: QC Sample Statistics for Core Sampling 2020 - 2023
|
Original Samples |
Standards |
Blanks |
Field Duplicates |
Coarse Reject Duplicates |
Pulp Duplicates |
QC Sample Total |
QC Sample % |
|
49,628 |
2,395 |
2,070 |
1,113 pairs |
779 pairs |
2,440 pairs |
8,797 |
15.1% |
Sample batches with suspected cross-sample contamination or certified reference materials returning assay values outside of the mean ± 3SD control limits are considered analytical failures by the Company and assay reruns were requested when deemed warranted.
ALS has its own internal QA/QC program, which is reported in the assay certificates, including the coarse reject and pulp duplicate assays. The Fury QA/QC program includes monitoring of laboratory internal QC results.
|
9.2.1 |
Certified Reference Material |
Internal Certified Reference Materials (CRMs) were inserted into the sample stream at a rate of 3%. The tolerance limits for accuracy were considered to be two standard deviations above or below the expected value. CRMs returning values outside of the defined tolerance limits were marked as failed and Fury requested the analytical laboratory to re-assay the analytical batch that contained the failed standard. Table 7 summarizes the CRMs utilized during Fury’s drilling programs.
Table 7: Fury Internal CRMs for Diamond Drilling
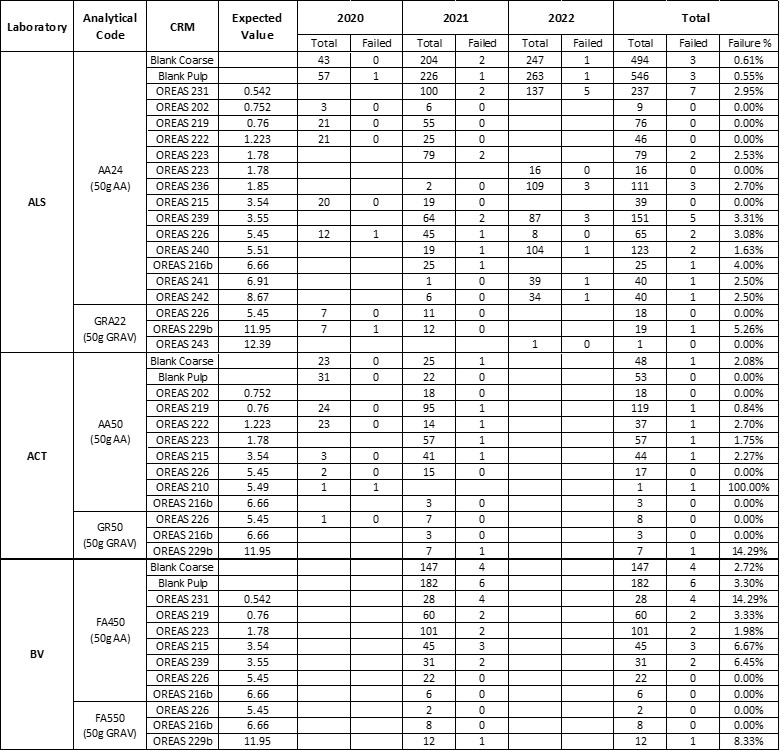
|
9.3 |
Conclusions |
It is the opinion of Ms. Doyon that the data verification and QA/QC procedures being implemented by Fury meet or in most cases exceed industry best practices. The Eau Claire Project has seen consistent implementation of these practices from early in the Project’s history.
Since acquiring the Project, Fury has implemented strict scrutiny of the QA/QC results and has dealt with any notable issues directly with the analytical laboratory in a timely fashion.
The geological and assay databases are well maintained and the current protocols in place should ensure the database remains reasonably error free. The database in its present form is suitable for use in a Mineral Resource Estimation.
|
10 |
Mineral Processing and Metallurgical Testing |
Metallurgical testing was previously completed on Eau Claire mineralization by COREM in 2001 and by SGS in 2010 and 2017.
|
10.1 |
2001 COREM Metallurgical Testing |
Four 25-kilogram composite samples were taken separately from the P, JQ, R, and V16 veins and sent to COREM for metallurgical testing. This sampling provided preliminary information on density, grinding characteristics, grade, gold fineness, and gravimetric- and total gold recovery. The average specific gravity values of the stock samples varied between 2.87 and 2.99.
COREM completed a series of crushing, milling and flotation tests. A suite of accessory elements was found to be associated with the gold, which included silver, tellurium, bismuth and molybdenum. Results indicated that on average 63 to 79 percent (%) of the gold in the samples could be extracted by gravity circuit and that 95.7% to 98.6% of the gold could be recovered by conventional cyanide extraction methods. The studies also indicated that most gold grains were extremely fine thereby necessitating a finer mill-grind for full recoveries.
|
10.2 |
2010 SGS Minerals Metallurgical Testing |
In 2010 SGS Mineral Services (Lakefield Research) evaluated the ore characteristics through mineralogy, chemical analyses and comminution testing. A secondary goal of the testwork was to explore several processing avenues for the purpose of establishing a preliminary gold recovery flowsheet. The deportment and recovery of tellurium was also monitored in the program.
Four vein composites representing the P, JQ, R, and S veins and one master composite (an equally weighted blend of the four vein composites) were subjected to ore characterization, metallurgical and environmental testing. These composites were prepared from assay reject material in freezer storage at SGS (Lakefield) from analytical work completed in 2008.
The SGS test work completed on the master and vein composite samples indicated the following:
Mineralization Characterization
|
● |
Calculated and direct gold grades showed significant variation in the master and vein composites ranging from approximately 11 g/t Au in Vein JQ and R to approximately 38 g/t Au in Vein S. |
|
● |
In terms of acid generating potential, the samples indicated very low risk. |
|
● |
The Bond ball mill work indices ranged from 10.2 (Vein S) to 11.1 (Vein P). These samples are considered to be soft in ball mill grindability terms. |
|
● |
A brief mineralogical examination of the four vein composites revealed that pyrrhotite is the principal sulphide mineral with minor amounts of pyrite and chalcopyrite. |
Metallurgical Testing:
|
● |
Gravity separation will generate significant gold recovery in an industrial setting. Gold recoveries ranged from 30 to 45% in the master composite and up to 74% from the S vein composite. |
|
● |
Tellurium did concentrate to some extent along with the gold in the gravity separation. Approximately 7% recovery in the JQ vein composite up to a maximum of 25% in the S vein composite. |
|
● |
Flotation of the master composite gravity separation tailings, at grind sizes ranging from 121 to 65 μm, resulted in excellent gold recovery for all of the tests conducted. Approximately 94% gold recovery was achieved at a P80 of 121μm while ~96% was achieved at P80 = 65 μm. |
|
● |
Gold recovery by gravity separation plus flotation ranged from 92% to 97% in the variability tests completed for the vein composites. |
|
● |
Further development of the flotation option, including optimizing primary grind size, improving conditions to achieve higher tellurium recovery, further investigating rougher concentrate cleaning and the impact of regrinding on cleaner circuit performance is strongly recommended. |
|
● |
Tellurium recovery was significant in rougher flotation, ranging from a low of 77% from the JQ vein composite to a maximum of 87% from the S vein composite. |
|
● |
Cyanide leaching of gravity separation tailing yielded an excellent gold response in all tests completed with approximately 95.7% of the gold being recovered in the gravity plus cyanidation flowsheet at 121 μm for the master composite. Gold recoveries ranged from 95.6% from the R vein composite to 98.2% from the S vein composite. |
|
● |
Flotation concentrate cyanidation yielded a unit gold extraction of 98.3% at a grind size of 121 μm. Overall circuit gravity separation + flotation concentrate cyanidation yielded a gold extraction of 92.8%. |
Environmental:
|
● |
The acid-base accounting and net acid generation tests completed on the various feed and tailing streams generated in the program clearly indicate that the samples will not generate acid mine drainage. |
|
10.3 |
2017 SGS Minerals Metallurgical Testing |
In 2017 SGS Mineral Services (Lakefield Research) completed additional metallurgical test work. The test program was completed on a single metallurgical composite comprising both ore and waste-rock (mining dilution) representative of the Eau Claire Deposit (SGS, 2017). Ore characterization testing including broad spectrum chemical analysis, baseline acid mine drainage testing, comminution (ball mill grindability) testing, mineralogy, bulk mineralogy by QEM-RMS (QEMSCAN) rapid mineral scan), and chemical head analysis. Metallurgical testing included gravity separation and investigation of flotation and cyanide leaching. A waste rock sample was subjected to baseline acid mine drainage testing. The following is a summary of the conclusions and recommendations of SGS (2017) as presented in the executive summary. The summary by SGS includes comparisons to the 2010 test work.
The testwork encompassed:
|
● |
The chemical and mineralogical characterization of ore and potential dilution from hanging wall and foot wall (HW-FW) contact areas; |
|
● |
The chemical, comminution, and metallurgical evaluation of a 4:1 blend of ore and HW-FW dilution material (Master Composite); and |
|
● |
The environmental characterization of waste rock (herein referred to as the ARD Composite) and process tailing solids (cyanide leached Master Composite). |
2017 test material returned gold grades of 6.56 g/t, 0.08 g/t, and 4.98 g/t, were reported for the Ore, HW- FW, and Master Composite, respectively, in the 2017 program. Silver reported as <2 g/t in all samples.
Sulphide sulphur grades were 0.99%, 0.28%, and 0.84% in the Ore, HW-FW, and Master Composite, respectively.
Gold grades in the 2010 testwork were 18.6 g/t in the Master Composite and 11.1 g/t, 14.0 g/t, 10.9 g/t, and
37.7 g/t in the JQ, P, R, and S Vein Composites, respectively. Silver grades averaged approximately 5 g/t in the Vein and Master Composites. Sulphide sulphur grade ranged from approximately 0.5% in Vein S to approximately 0.9% in Vein R.
Acid mine drainage testing in the 2017 program (acid-base accounting {ABA} and net acid generation {NAG}), indicated that the ARD (waste rock) Composite may be net acid generating and that the Master Composite process tailing is likely not an acid generator. The results were not absolute in either case. The tests completed on the Vein Composites in 2010 indicated very low potential for acid generation, however, based on the visuals presented above and selectivity in the 2010 material, these samples should not be considered representative of the entire resource.
The 2017 Bond ball mill work index of the Master Composite of 11.2 kWh/t (metric), fell into the moderately soft category of hardness in terms of ball mill grindability. The Vein Composites tested in 2010 ranged from 10.2-11.1 kWh/t, putting all material tested at the 33rd percentile of hardness or lower, according to an SGS database of similar tests.
Mineralogical data generated for the Ore and HW-FW Composites compared well with the similar studies completed in 2010 on the Vein Composites. In most cases, pyrrhotite was identified as the primary sulphide, with accompanying lesser amounts of pyrite and much less chalcopyrite. The Ore Composite contained approximately 1.5% pyrrhotite and approximately half as much pyrite, while the HW-FW Composite had approximately equal masses of pyrrhotite and pyrite, at 0.22% and 0.28%, respectively.
An FL Smidth (Knelson) gravity recoverable gold (GRG) test indicated a reasonably high GRG value for the Master Composite at 39%. Batch gravity separation testing on the composite yielded 24% gold recovery. Batch gravity separation testing in the 2010 program gave generally higher gold recoveries, ranging from 37% (R Vein) to approximately 74% (S Vein). The 2010 Master Composite yielded an average gold recovery of 37.6%. The likely reasons for the better performance of the vein samples in the 2010 testwork are their much higher gold grades and their greater proportion of coarse gold as indicated in the comparative screened metallic sieve oversize (about 18.5% in the 2010 testwork and approximately 4% in the 2017 Master Composite). Further gravity separation testing is recommended to generate data which may be used in a circuit modelling exercise as well as a preliminary design exercise.
All flotation and cyanidation testwork was conducted on gravity separation tailing.
Rougher flotation testing in the 2017 program indicated a significant issue with slimes generation in grinding, leading to fouling of the rougher concentrates. The slimes, which had the visual appearance of talc, are thought to be related to the amphibole content of the material. It should be noted that, while the amphibole content of the 2010 material was similar, the slimes issue was not observed. Master Composite mass pulls were significantly higher in the 2017 program (approximately 18-25% at P80’s in the 94-107 μm range) than in the 2010 testwork (approximately 5-10% at P80’s in the 81-121 μm range). The Vein Composites (2010) yielded approximately 11% or less mass pull in all cases. The addition of carboxymethyl cellulose (CMC) reduced mass pull to a more reasonable 7.5-9.5%. Reagent schemes in the two programs were otherwise the same.
A primary grind P80 of approximately 100-110 μm was selected as optimal for flotation in the 2010 program. Overall (gravity + flotation) gold recoveries of approximately 93% or higher were typically achieved with the 2010 Master Composite when ground to that size range. Vein Composite gold recoveries were similar. In the 2017 program, however, the new Master Composite yielded overall gravity plus flotation gold recoveries of only approximately 80-85%, at the same grind same size range. Grinding to P80 = 58 μm or finer was required to achieve overall gold recoveries of >90%.
Cleaner flotation tests in the 2017 program yielded excellent final concentrate gold grades (approximately 120 g/t) and mass rejection. Final mass recovery, in three cleaning stages, was in the 2.1-2.4% range. In tests without rougher concentrate regrinding prior to cleaning, gold recoveries to the third cleaner concentrate were approximately 78% (overall gravity + cleaner flotation), and these improved to approximately 83% with regrinding. In similar tests completed in 2010, gravity + cleaner flotation gold recoveries, at similar mass pulls were in the 88-91% range, albeit from much higher grade feed material.
Given the comparatively disappointing flotation performance observed in the 2017 program versus the 2010 work, and considering the relatively high value of the ore, attention was refocused on whole ore cyanide leaching of Master Composite gravity separation tailing.
In tests completed at primary grind P80 sizes ranging from of 95 to 49 μm, applying conditions as in the 2010 testwork, gold extractions of 92-95% (gravity + cyanidation) were achieved in 48 hours. There appeared to be no clear correlation between P80 and gold extraction. All subsequent testwork was conducted at the approximately 48 μm P80 grind size.
Additional tests evaluating preparation, lead nitrate addition, higher cyanide dosage (0.75 g/L versus 0.5 g/L NaCN), and high free lime (2 g/L CaO) concentration were completed. Increasing cyanide concentration had a positive effect on final gold extraction. Preparation with lead nitrate had a positive effect on leach kinetics, with leaching being essentially complete sometime between 8 and 24 hours. In tests without preparation and lead nitrate, leaching appeared to continue beyond 24 hours. Increasing cyanide concentration, from 0.5 to 0.75 g/L NaCN, following preparation with lead nitrate, resulted in the maximum gold extraction (96-97%) being achieved, in only 8 hours of leaching. Tests completed with preparation and lead nitrate resulted in significant reductions in cyanide consumption, from approximately 1.3 - 0.2 kg/t (NaCN per tonne of leach feed basis). A similar effect was noted in the 2010 testwork, with even lower consumptions being noted (0.10 - 0.14 kg/t).
Leach kinetics were dramatically reduced in the high CaO tests using the baseline 0.5 g/L NaCN concentration (i.e. 87% leach extraction after 24 hours). Increasing the cyanide concentration to 0.75 g/L NaCN, following preparation with lead nitrate, in a test with high CaO, resulted in leach kinetics and a final gold extraction similar to the tests with high cyanide and preparation with lead nitrate. The high CaO protocol appeared to offer no benefit. This procedure was tested because the Clearwater material is known to contain tellurium mineralisation and high solution CaO has been shown to enhance gold leaching from telluride minerals in some cases. The evidence suggests that the gold in the Clearwater ore is probably not materially associated with tellurium minerals. It should be noted that tellurium assayed at 8 g/t in the 2017 Master Composite and, owing to limitations in the analytical method or matrix interference from the material, at <50 g/t in the 2010 samples.
Overall gold recovery by gravity separation + gravity tailing cyanidation yielded results in the 2017 program that compared very well to parallel testwork completed in 2010. Gold recovery from the 2010 Master Composite (at a 14.8 g/t Au head grade) was 95.7% with a final tailing grade of 0.66 g/t Au. In 2017 overall gold recovery from a head grade of 4.85 g/t Au was approximately 96%, with a final tailing grade of approximately 0.20 g/t Au.
Despite the head analyses that indicated <0.05% graphitic carbon (C(g)) in the samples, it was noted that gold extraction appeared to decrease somewhat as leach retention times were extended. Literature on the subject describes other potential preg-robbing constituents, including certain clay species and sulphide surfaces. The observed effect was not detected in all tests and so cannot be absolutely verified. It is recommended that the preg-robbing potential of the Clearwater material be evaluated.
|
10.4 |
Conclusions |
Work performed in the SGS 2017 study was performed essentially on a single master sample. The sample included appropriate vein and mining dilution from the hanging wall and footwall. This sample was well documented and traceable.
The 2017 metallurgical testing indicated that gravity concentration with cyanide leaching outperformed production of a gold bearing flotation concentrate. The reported gold recoveries of 95 percent are supported by testing performed. The process was very simple with a primary grind size and reagent consumption levels that are typical for this style of deposit.
The limited metallurgical testwork conducted to date suggests that a high proportion of the gold can be recovered by conventional means and the Eau Claire material is relatively free-milling. Additional metallurgical testwork is recommended particularly to optimize leach parameters and investigate variability of the mineralization with respect to comminution requirements.
|
11 |
Mineral Resource Estimate |
Maxime Dupéré, Geologist at SGS Geological Services completed an updated MRE at Fury’s Eau Claire Project as part of the June 25, 2024 Technical Report (Dupéré, et al., 2024). The below is a direct excerpt from the current NI43-101 Technical Report.
A Mineral Resource Estimate was first disclosed in a 2015 Technical Report (SRK, 2015) and updated in 2017 (Armitage and Hafez, 2017). The 2017 updated Mineral Resource Estimate was subsequently updated for use in a 2018 preliminary economic assessment (2018 PEA) study (Puritch et. al. 2018). No updated economic study was conducted on the 2023 Mineral Resource Estimate and the 2018 PEA is no longer current and should not be relied upon. The 2024 Mineral Resource Estimate included the addition of Fury’s 2020 through 2023 drilling to update the resource wireframes and block model.
Ms. Doyon has been involved in the exploration programs at Eau Claire since 2020 and has reviewed and audited the resource models and resulting Mineral Resource Estimate included within the June 25, 2024 NI43-101 compliant technical Report and has concluded they meet the requirements set out in SK-1300 and as such takes responsibility for the resource statement.
|
11.1 |
Summary |
Completion of the MREs involved the assessment of a validated drill hole and channel sample database, which included all data for surface drilling and surface and channel sampling completed through the end of 2023. Completion of the MREs also included the assessment of updated three-dimensional (3D) mineral resource models (mineral resource domains), 3D topographic surface models and 3D overburden surface models.
The Inverse Distance Cubed (“ID3”) and Inverse Distance Squared (“ID2”) calculation methods restricted to the mineral resource domains were used to interpolate grades for Au (g/t) into block models for all deposit areas. Measured, Indicated, and Inferred mineral resources are reported in the summary tables in Section 11.11. The MREs presented below takes into consideration that the deposits may be mined by either open pit or underground mining methods.
|
11.2 |
Drill Hole Database |
To complete the current MREs for the Project, a database comprising a series of comma delimited spreadsheets containing surface diamond drill hole information was provided by Fury. The database included hole location information, down-hole survey data, assay data, lithology data and density data. After review of the database, the validated data was then imported into GEOVIA GEMS version 6.8.3 software (“GEMS”) for statistical analysis, block modeling and resource estimation. No errors were identified when importing the data. The data was validated in GEMS and no erroneous data, data overlaps or duplication of data was identified.
The database provided by Fury and used for the MREs included data for 1,202 surface diamond drill holes totalling 406,431 m, and 426 surface channels (Eau Claire deposit) for 1,345 m (Table 8). The resource database totals 273,402 drill hole assay intervals representing 267,721 m of data and 2,254 channel assays for 1,316 m. The average assay sample length from drilling is 0.98 m, and from channel sampling is 0.58 m.
Table 8: Total Drill Hole and Channel Sample Database for the Eau Claire Project
|
Eau Claire Project Drill Hole Database |
|
|
Coordinate System |
NAD83 UTM Zone 18 |
|
Total Number of drill holes (diamond) |
1,202 |
|
Total metres of drilling |
406,431 m |
|
Total number of drill assay samples |
273,402 |
|
Total drill assay sample length |
267,721 m |
|
Average drill assay sample length |
0.98 m |
|
Total Number of channels (Eau Claire) |
426 |
|
Total metres of channels |
1,345 m |
|
Total number of channel assay samples |
2,254 |
|
Total channel assay sample length |
1,316 m |
|
Average channel sample length |
0.58 m |
|
Total number of SG Samples |
649 |
|
11.3 |
Mineral Resource Modelling and Wireframes |
For the current MRE for the Eau Claire deposit, Fury provided the author with a total of 22 three-dimensional (“3D”) geological models for the Eau Claire deposit area, 280 3D resource models (mineral resource domains), representing the 450, 850 and Hinge Zones (Table 10) (Figures 9 and 10) and a digital elevation surface model (LiDAR) for the Eau Claire area. The geological models were constructed in Leapfrog 3D Geological Modelling Software (“Leapfrog”) and the resource domains were modeled in either GEMS or Leapfrog. All 3D geological and resource models were clipped to topography.
The Eau Claire mineral resource domains were modeled considering geology and structure and considering an approximate 1.0 g/t cut-off grade based on assay samples and a minimum mining width of ~ 2.0 metres. For those intersections that did not meet the minimum mining width requirement, the solid outline was drawn to take in waste (internal dilution) from either side of intersections. The models were extended 12.5 to 25 metres beyond the last known intersection along strike and 25 – 50 metres down dip.
The 280 vein structures defining the Eau Claire deposit extend for approximately 1,900 metres along strike and to depths of up to 900 metres in the eastern end of the deposit area.
The Eau Claire deposit is subdivided into three zones: the 450, 850 and Hinge zones. In the 450 zone, modelling defined three general orientations of primary quartz-tourmaline vein sets. A well-defined east-west trending and moderately south dipping high grade vein system (450HGV) and steeper dipping high grade veins (450HGVST), a series northwest-southeast trending, moderately southwest-dipping veins (450NW, 450HGS), and a series of west-northwest-trending, moderately south-southwest dipping veins (450WNW).
Vein modelling in the 850 and Hinge zones defined three primary vein systems: a distinct steep northeast-southwest primary vein set (850HG) that crosscuts older shallow-to-moderately dipping northwest-southeast trending vein sets (850SHLOW and 850HINGE).
In addition to the primary vein systems discussed above, a secondary set of mineral resource domains referred to as 450EXTRA and 850EXTRA (previously referred to as “vein swarm domains”) are defined as zones of intermittent veining and alteration, where drilling density is insufficient to model individual veins with confidence. Like the primary veins, the secondary veins were modelled using an approximate 1.0 g/t cut-off grade based on assay samples and a minimum mining width of ~ 2.0 metres. As well, intersections that did not meet the minimum mining width requirement, the solid outline was drawn to take in waste from either side of intersections.
The vein structures of the Eau Claire deposit are mainly hosted within the iron (Fe) and magnesium (Mg) rich basalts.
For the current MRE for the Percival deposit, Fury provided the author with a total of 5 3D geological models, 29 3D resource models (mineral resource domains), representing the higher grade (PERCIVHG) and lower grade halo (PERCIVLG) mineralization (Figure 10), a 3D model of the overburden, and a digital elevation surface model (LiDAR). The geological models and 3D resource models were constructed in Leapfrog. All 3D geological and resource models were clipped to topography.
The 29 vein structures defining the Percival deposit extend for approximately 600 metres along strike (~175⁰) and to depths of up to 500 metres, dipping ~85⁰ south.
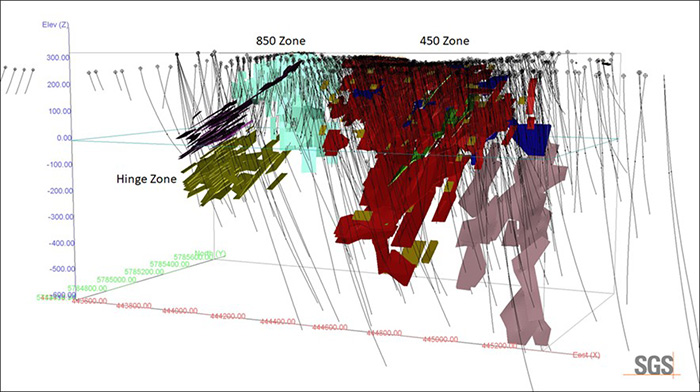
Figure 9: Oblique view looking NW depicting all drilling and channel sampling utilized in the 2024 Mineral Resource Estimation.
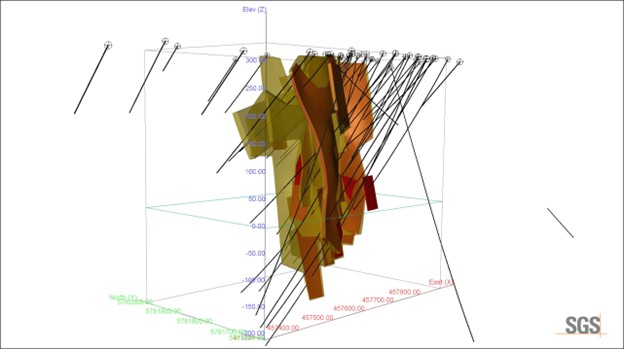
Figure 10: Oblique view looking NE depicting all drilling and wireframes utilized in the 2024 Mineral Resource Estimation.
Table 9: Eau Claire Deposit Zone and Domain Summary
|
Deposit |
Area |
ROCK CODE (GEMS) |
# of Domains |
BLOCK ROCK CODE (GEMS) |
SG |
|
Eau Claire |
450 Zone |
450HGVST |
18 |
80 |
2.92 |
|
450 Zone |
450EXTRA |
1 (series of small domains) |
90 |
2.92 |
|
|
450 Zone |
450HGV |
142 |
100 |
2.92 |
|
|
450 Zone |
450HGS |
4 |
110 |
2.92 |
|
|
450 Zone |
450WNW |
3 |
120 |
2.92 |
|
|
450 Zone |
450NW |
6 |
130 |
2.92 |
|
|
850 Zone |
850HG |
46 |
140 |
2.92 |
|
|
Hinge Zone |
850HINGE |
37 |
160 |
2.92 |
|
|
Hinge Zone |
850SHLOW |
23 |
150 |
2.92 |
|
|
Total |
262 |
||||
|
Eau Claire Waste Models |
Eau Claire |
Various |
22 |
200 - 240 |
2.75 – 3.00 |
|
Percival |
Percival |
PERCIVHG |
18 |
300 |
2.95 |
|
PERCIVLG |
11 |
310 |
2.95 |
||
|
Percival Waste Models |
Percival |
Various (incl. OB) |
5 |
400 – 430 (1 – OB) |
2.80 – 2.95 (1.80 OB) |
|
11.4 |
Composites |
The database provided by Fury and used for the Eau Claire and Percival MREs included assay data for 1,202 surface drill holes totalling 406,431 m and 426 short channels totalling 426 m (Eau Claire) (Table 10). The assay database totals 273,402 drill samples and 2,254 channel samples. The assay database was sub-divided into assay samples restricted to within the mineral resource domains.
A statistical analysis of the assay data from within the Eau Claire and Percival resource domains is presented in Table 11.
Table 10: Statistical Analysis of the Drill and Channel Assay Data from Within the Eau Claire and Percival Deposit Mineral Domains
|
Variable |
Deposit |
|
|
Eau Claire |
Percival |
|
|
Total # of Assays |
12,261 |
1,097 |
|
Sample Length Range |
0.10 – 2.00 |
0.35 – 1.60 |
|
Average Sample Length |
0.63 |
1.23 |
|
Minimum Grade |
0.00 |
0.00 |
|
Maximum Grade |
2,540 |
2.79 |
|
Mean |
5.01 |
1.45 |
|
Standard Deviation |
27.9 |
8.67 |
|
Coefficient of variation |
5.56 |
5.99 |
|
97.5 Percentile |
38.0 |
7.22 |
Table 11: Statistical Analysis of the 1.00 m Composite Data from Within the Deposit Mineral Domains
|
Variable |
Eau Claire Deposit |
||||||||
|
450HGVST |
450HGV |
450EXTRA |
450HGS |
450WNW |
450NW |
850HG |
850HINGE |
850SHLOW |
|
|
Total # of Composites |
202 |
4,286 |
311 |
567 |
642 |
96 |
1,073 |
338 |
508 |
|
Minimum Grade |
0.00 |
0.00 |
0.00 |
0.00 |
0.00 |
0.00 |
0.00 |
0.00 |
0.00 |
|
Maximum Grade |
63.4 |
252 |
202 |
70.7 |
1263 |
31.9 |
372 |
36.5 |
67.8 |
|
Mean |
6.82 |
4.84 |
4.41 |
5.04 |
5.14 |
1.30 |
5.32 |
2.33 |
1.94 |
|
Standard Deviation |
11.2 |
13.2 |
12.5 |
7.92 |
50.2 |
6.19 |
21.8 |
3.60 |
4.23 |
|
Coefficient of variation |
1.64 |
2.73 |
2.83 |
1.57 |
9.77 |
1.72 |
4.10 |
1.54 |
2.18 |
|
97.5 Percentile |
43.2 |
33.4 |
20.0 |
27.0 |
22.0 |
30.5 |
28.6 |
12.6 |
9.78 |
|
Variable |
Percival Deposit |
|
|
PERCIVHG |
PERCIVLG |
|
|
Total # of Composites |
567 |
777 |
|
Minimum Grade |
0.00 |
0.00 |
|
Maximum Grade |
279 |
3.86 |
|
Mean |
3.02 |
0.39 |
|
Standard Deviation |
13.3 |
0.36 |
|
Coefficient of variation |
4.40 |
0.92 |
|
97.5 Percentile |
11.5 |
1.36 |
|
11.5 |
Grade Capping |
A statistical analysis of the composite database within the resource models (the “resource” population) was conducted to investigate the presence of high-grade outliers which can have a disproportionately large influence on the average grade of a mineral deposit. High grade outliers in the composite data were investigated using statistical data, histogram plots, and cumulative probability plots of the 1.5 m composite data.
After review, it is the opinion that capping of high-grade composites to limit their influence during the grade estimation is necessary for Au. The capping analysis was done based on vein orientation. A summary of grade capping values within the mineralized domains. The capping applied to the deposit composites has had the desired effect of limiting the influence of high-grade outliers on the global MREs. The capped composites are used for grade interpolation into the deposit block models.
There is a high proportion of composites capped in the 450HGV domains. Most of the capped composites are channel samples. The strict capping of the channel samples was done to limit their influence on the Eau Claire MRE.
|
11.6 |
Specific Gravity |
The author was provided with a limited database of 649 SG measurements previously collected and used for previous and current mineral resources for the Eau Claire deposit. The 646 SG measurements, collected from 450 vein structures and waste, ranged from a value of 2.56 to 3.24 and averaged 2.92. After a review of the database, it was decided that 3 anomalously low samples (< 2.50) be removed from the database, bringing the total to 646 samples. The average grade of the 646 samples averaged 5.76 g/t Au and there appears to be little correlation of density value and gold grade.
The data was subdivided into samples from within the revised 450 vein domains and samples from outside the 450 vein domains. Of the 646 samples, 364 samples are from with the 450 vein domains. The average SG of these samples is 2.92 with a range of 2.56 to 3.21; the average grade of these samples is 9.1 g/t Au. A total of 282 samples are from outside the vein domains and average 2.93 with a range of 2.63 to 3.24.
Due to the lack of data, it was decided that a fixed SG value be used for the resource models and for waste. The average SG values used by mineralization and waste domain for the current MRE for the Eau Claire deposit are presented in Table 14‑2 above. A value of 2.92 was assigned to the 450 vein domains as well to the 850 and Hinge Zone vein domains as veins in the three areas are mineralogically similar. Waste domain SG values range from 2.75 to 3.00 for the intrusive, metasedimentary and metavolcanic host rocks.
It is strongly recommended that Fury collect additional data from past drilling from the 450 as well as 850 and Hinge zones and implement a sampling protocol for SG data collection for future drilling.
For the Percival Zone, data is limited to 11 SG samples from the mineralized zone, which range from a value of 2.67 to 3.87 (massive sulphide sample). The 11 samples averaged an SG of 2.96 and 11.5 g/t Au.
For the Percival deposit, a value of 2.95 was assigned to the mineralized domains. Waste domain SG values range from 2.80 to 2.95 for the metasedimentary and metavolcanic host rocks. As for the Eau Claire deposit, it is strongly recommended that Fury collect additional data from past drilling from the Percival deposit and implement a sampling protocol for SG data collection for future drilling.
|
11.7 |
Block Model Parameters |
The deposit mineral resource domains are used to constrain composite values chosen for interpolation, and the mineral blocks reported in the estimates of the mineral resources. Block models within UTM coordinate space, were created for each deposit area (Table 12). Block model dimensions, in the x (east m), y (north m) and z (level m) directions were placed over the domains with only that portion of each block inside the shell recorded (as a percentage of the block) as part of the MREs (% Block Model). The block size for each block model was selected based on drillhole spacing, composite length, the shape and orientation of the resource domains, and the selected mining methods (open pit vs underground). At the scale of the deposit models, the selected block size for each model provides a reasonable block size for discerning grade distribution, while still being large enough not to mislead when looking at higher cut-off grade distribution within the model. The models were intersected with surface topography to exclude blocks, or portions of blocks, that extend above the bedrock surface.
Table 12: Deposit Block Model Geometry
|
Block Model |
Eau Claire |
||
|
X (East) |
Y (North) |
Z (Level) |
|
|
Corner Origin (NAD 83) |
443400 |
5784550 |
340 m |
|
Extent (block count) |
400 |
240 |
195 |
|
Block Size |
5 m |
5 m |
5 m |
|
Rotation (counterclockwise) |
0° |
||
|
Block Model |
Percival |
||
|
X (East) |
Y (North) |
Z (Level) |
|
|
Corner Origin (NAD 83) |
457200 |
5781570 |
370 m |
|
Extent (block count) |
260 |
180 |
200 |
|
Block Size |
3 m |
3 m |
3 m |
|
Rotation (counterclockwise) |
0° |
||
|
11.8 |
Grade Interpolation |
Gold grades were estimated into the blocks for the deposit block models. Blocks within each mineralized domain were interpolated using composites assigned to that domain. To generate grade within the blocks, the inverse distance cubed (ID3) interpolation method was used for all domains for the Eau Claire deposit and ID2 for the Percival deposit.
For all domains, the search ellipse used to interpolate grade into the resource blocks was interpreted based on orientation and size of the mineralized domain. The search ellipse axes are generally oriented to reflect the observed preferential long axis (geological trend) of the domain and the observed trend of the mineralization down dip/down plunge.
Three to four passes were used to interpolate grade into all the blocks in the grade shells; interpolation parameters varied by deposit area. All blocks were classified as Measured for Pass 1, Indicated for Pass 2 and Inferred for Pass 3 and 4.
|
11.9 |
Mineral Resource Classification Parameters |
The classification of the current MREs into Measured, Indicated and Inferred resources is consistent with current 2014 CIM Definition Standards - For Mineral Resources and Mineral Reserves, including the critical requirement that all mineral resources “have reasonable prospects for eventual economic extraction”.
An Inferred Mineral Resource has a lower level of confidence than that applied to an Indicated Mineral Resource. An Indicated Mineral Resource has a higher level of confidence than an Inferred Mineral Resource but has a lower level of confidence than a Measured Mineral Resource.
A Mineral Resource is a concentration or occurrence of solid material of economic interest in or on the Earth’s crust in such form, grade or quality and quantity that there are reasonable prospects for eventual economic extraction.
Interpretation of the word ‘eventual’ in this context may vary depending on the commodity or mineral involved. For example, for some coal, iron, potash deposits and other bulk minerals or commodities, it may be reasonable to envisage ‘eventual economic extraction’ as covering time periods more than 50 years. For many gold or base metal deposits, application of the concept would normally be perhaps 10 to 15 years.
The location, quantity, grade or quality, continuity and other geological characteristics of a Mineral Resource are known, estimated, or interpreted from specific geological evidence and knowledge, including sampling.
Inferred Mineral Resource
An Inferred Mineral Resource is that part of a Mineral Resource for which quantity and grade or quality are estimated based on limited geological evidence and sampling. Geological evidence is sufficient to imply but not verify geological and grade or quality continuity.
An Inferred Mineral Resource has a lower level of confidence than that applying to an Indicated Mineral Resource and must not be converted to a Mineral Reserve. It is reasonably expected that the majority of Inferred Mineral Resources could be upgraded to Indicated Mineral Resources with continued exploration.
An Inferred Mineral Resource is based on limited information and sampling gathered through appropriate sampling techniques from locations such as outcrops, trenches, pits, workings, and drill holes. Inferred Mineral Resources must not be included in the economic analysis, production schedules, or estimated mine life in publicly disclosed Pre-Feasibility or Feasibility Studies, or in the Life of Mine plans and cash flow models of developed mines. Inferred Mineral Resources can only be used in economic studies as provided under NI 43-101.
There may be circumstances, where appropriate sampling, testing, and other measurements are sufficient to demonstrate data integrity, geological and grade/quality continuity of a Measured or Indicated Mineral Resource, however, quality assurance and quality control, or other information may not meet all industry norms for the disclosure of an Indicated or Measured Mineral Resource. Under these circumstances, it may be reasonable for the Qualified Person to report an Inferred Mineral Resource if the Qualified Person has taken steps to verify the information meets the requirements of an Inferred Mineral Resource.
Indicated Mineral Resource
An ‘Indicated Mineral Resource’ is that part of a Mineral Resource for which quantity, grade or quality, densities, shape and physical characteristics can be estimated with a level of confidence sufficient to allow the appropriate application of technical and economic parameters, to support mine planning and evaluation of the economic viability of the deposit.
Geological evidence is derived from adequately detailed and reliable exploration, sampling and testing and is sufficient to assume geological and grade or quality continuity between points of observation.
An Indicated Mineral Resource has a lower level of confidence than that applying to a Measured Mineral Resource and may only be converted to a Probable Mineral Reserve.
Mineralization may be classified as an Indicated Mineral Resource by the Qualified Person when the nature, quality, quantity and distribution of data are such as to allow confident interpretation of the geological framework and to reasonably assume the continuity of mineralization. The Qualified Person must recognize the importance of the Indicated Mineral Resource category to the advancement of the feasibility of the project. An Indicated Mineral Resource Estimate is of sufficient quality to support a Preliminary Feasibility Study which can serve as the basis for major development decisions.
Measured Mineral Resource
A Measured Mineral Resource is that part of a Mineral Resource for which quantity, grade or quality, densities, shape, and physical characteristics are estimated with confidence sufficient to allow the application of Modifying Factors to support detailed mine planning and final evaluation of the economic viability of the deposit.
Geological evidence is derived from detailed and reliable exploration, sampling and testing and is sufficient to confirm geological and grade or quality continuity between points of observation.
A Measured Mineral Resource has a higher level of confidence than that applying to either an Indicated Mineral Resource or an Inferred Mineral Resource. It may be converted to a Proven Mineral Reserve or to a Probable Mineral Reserve.
Mineralization or other natural material of economic interest may be classified as a Measured Mineral Resource by the Qualified Person when the nature, quality, quantity and distribution of data are such that the tonnage and grade or quality of the mineralization can be estimated to within close limits and that variation from the estimate would not significantly affect potential economic viability of the deposit. This category requires a high level of confidence in, and understanding of, the geology and controls of the mineral deposit.
|
11.10 |
Reasonable Prospects of Eventual Economic Extraction |
The general requirement that all Mineral Resources have “reasonable prospects for eventual economic extraction” implies that the quantity and grade estimates meet certain economic thresholds and that the Mineral Resources are reported at an appropriate cut-off grade considering extraction scenarios and processing recoveries. To meet this requirement, based on the location, depth from surface and depth extent, size, shape, general true thickness, and orientation of the deposits of the Project, the Author considers that the Eau Claire and Percival deposit mineralization is amenable for open pit and underground extraction.
To determine the quantities of material offering reasonable prospects for eventual economic extraction by open pit mining methods, reasonable mining assumptions to evaluate the proportions of the block model (Measured, Indicated, and Inferred blocks) that could be “reasonably expected” to be mined from open pit are used. The open pit optimization parameters used are summarized in Table 13. A Whittle (GEOVIA Whittle™ 2022) pit shell at a revenue factor of 0.52 was selected as the ultimate pit shell for reporting the Eau Claire in-pit MRE; a Whittle pit shell at a revenue factor of 1.0 was selected as the ultimate pit shell for reporting the Percival in-pit MRE.
The reader is cautioned that the results from the pit optimization are used solely for the purpose of testing the reasonable prospects for eventual economic extraction by an open pit and do not represent an attempt to estimate mineral reserves. There are no mineral reserves on the Property. The results are used as a guide to assist in the preparation of a Mineral Resource statement and to select an appropriate resource reporting cut-off grade. A selected base case cut-off grade of 0.5 g/t Au is used to determine the in-pit MREs for the Eau Claire property.
The reporting of the in-pit MREs are presented undiluted and in situ, constrained by continuous 3D wireframe models, and are considered to have reasonable prospects for eventual economic extraction. The in-pit mineral resource grade blocks were quantified above the base case cut-off grade, below topography/overburden and within the 3D constraining mineralized wireframes (the constraining volumes).
To determine the quantities of material offering reasonable prospects for economic extraction by underground mining methods, reasonable mining assumptions to evaluate the proportions of the Eau Claire and Percival block models (Measured, Indicated and Inferred blocks) that could be reasonably expected to be mined from underground are used. Based on the location, size, shape, general thickness, and orientation of the of both the Eau Claire and Percival deposits, it is envisioned that the deposits may be mined using a combination of underground mining methods including sub-level stoping (SLS) and/or cut and fill (CAF) mining. The underground parameters used, based on these potential mining methods, are summarized in Table 14‑8. Underground Mineral Resources are reported at a base case cut-off grade of 2.50 g/t Au. A base case cut-off grade of 2.50 g/t is applied to identify blocks that will have reasonable prospects of eventual economic extraction by underground mining methods.
The reporting of the underground resources is presented undiluted and in situ, constrained by continuous 3D wireframe models, and are considered to have reasonable prospects for eventual economic extraction. The underground mineral resource grade blocks were quantified above the base case cut-off grade, below topography/pit surface and within the 3D constraining mineralized wireframes (the constraining volumes).
Table 13: Parameters used for Whittle™ pit optimization and Calculation of In-pit and Underground Base-case Cut-off Grades
|
Parameter |
USD |
Unit |
|
Gold Price |
1,900.00 |
$ per ounce |
|
In-Pit Mining Cost |
2.80 |
$ per tonne mined |
|
Underground Mining Cost |
65.00 |
$ per tonne mined |
|
Processing Cost |
12.50 |
$ per tonne milled |
|
General and Administrative (open pit and underground) |
4.00 |
$ tonne of feed |
|
Transport cost |
2.50 |
$ per tonne milled |
|
Overall Pit Slope |
55.00 |
Degrees |
|
Gold Recovery |
95.00 |
Percent (%) |
|
Mining loss / Dilution (open pit) |
5/5 |
Percent (%) / Percent (%) |
|
Mining loss/Dilution (underground) |
10/10 |
Percent (%) / Percent (%) |
|
In-pit cut-off grade |
0.50 |
g/t Au |
|
Underground cut-off grade |
2.50 |
g/t Au |
|
11.11 |
Mineral Resource Statement |
The MREs for the Project are presented in Table 14 to Table 16 and includes MREs for the Eau Claire and Percival deposits (Figures 11 - 14).
The Eau Claire project contains a combined Mineral Resource of 1,160,000 oz of Au at a grade of 5.65 g/t in the Measured and Indicated category, and an additional 723,000 oz of Au at a grade of 4.13 g/t Au in the Inferred Category (Table 14).
Table 14: Combined Mineral Resource Estimate for the Eau Claire Project
|
Category |
Tonnes |
Au g/t |
Contained Au (oz) |
|
Measured |
1,612,000 |
5.67 |
294,000 |
|
Indicated |
4,781,000 |
5.64 |
866,000 |
|
Measured & Indicated |
6,393,000 |
5.65 |
1,160,000 |
|
Inferred |
5,445,000 |
4.13 |
723,000 |
Highlights of the Eau Claire Mineral Resource Estimate are as follows (Table 14):
|
● |
The Eau Claire deposit contains mineral resources of 1,160,000 oz of gold (6.39 million tonnes at an average grade of 5.65 g/t Au) in the Measured and Indicated category, and 512,000 ounces of gold (2.64 million tonnes at an average grade 6.04 g/t Au) in the Inferred category. |
|
● |
The open pit mineral resource includes, at a base case cut-off grade of 0.5 g/t Au, 367,000 ounces of gold (2.45 million tonnes at an average grade of 4.66 g/t Au) in the Measured and Indicated category, and 10,000 ounces of gold (69 thousand tonnes at an average grade of 4.39 g/t Au) in the Inferred category. |
|
● |
The underground mineral resource includes, at a base case cut-off grade of 2.5 g/t Au, 793,000 ounces of gold (3.95 million tonnes at an average grade of 6.25 g/t Au) in the Measured and Indicated category, and 502,000 ounces of gold (2.57 million tonnes at an average grade of 6.08 g/t Au) in the Inferred category. |
Table 15: Eau Claire Deposit Mineral Resource Estimate
|
Category |
Tonnes |
Au g/t |
Contained Au (oz) |
|
|
Open Pit (base case cut-off grade of 0.5 g/t Au) |
Measured |
1,157,000 |
5.19 |
193,000 |
|
Indicated |
1,291,000 |
4.19 |
174,000 |
|
|
Measured & Indicated |
2,448,000 |
4.66 |
367,000 |
|
|
Inferred |
69,000 |
4.39 |
10,000 |
|
|
Underground (base case cut-off grade of 2.5 g/t Au) |
Measured |
455,000 |
6.90 |
101,000 |
|
Indicated |
3,490,000 |
6.17 |
692,000 |
|
|
Measured & Indicated |
3,945,000 |
6.25 |
793,000 |
|
|
Inferred |
2,566,000 |
6.08 |
502,000 |
|
|
Combined open pit and Underground |
Measured |
1,612,000 |
5.67 |
294,000 |
|
Indicated |
4,781,000 |
5.64 |
866,000 |
|
|
Measured & Indicated |
6,393,000 |
5.65 |
1,160,000 |
|
|
Inferred |
2,635,000 |
6.04 |
512,000 |
Highlights of the Percival Mineral Resource Estimate are as follows (Table 15):
|
● |
The Percival deposit contains an inferred mineral resource of 211,000 oz of gold (2.81 million tonnes at an average grade of 2.34 g/t Au) |
|
● |
The open pit inferred mineral resource includes, at a base case cut-off grade of 0.5 g/t Au, 131,000 ounces of gold (2.25 million tonnes at an average grade of 1.81 g/t Au). |
|
● |
The underground inferred mineral resource includes, at a base case cut-off grade of 2.5 g/t Au, 80,000 ounces of gold (557,000 tonnes at an average grade of 4.47 g/t Au). |
Table 16: Percival Deposit Mineral Resource Estimate
|
Category |
Tonnes |
Au g/t |
Contained Au (oz) |
|
|
Open Pit (base case cut-off grade of 0.5 g/t) |
Inferred |
2,253,000 |
1.81 |
131,000 |
|
Underground (base case cut-off grade of 2.5 g/t Au) |
Inferred |
557,000 |
4.47 |
80,000 |
|
Combined open pit and Underground |
Inferred |
2,810,000 |
2.34 |
211,000 |
Notes:
|
(1) |
The Mineral Resource Estimates were initially reported by Dupere, Eggers and Dean (2024) with an effective date of May 10, 2024. |
|
(2) |
The resources reported above are reviewed in detail within this Report and are accepted as current by the Qualified Person, Ms. Valerie Doyon P. Geo, Senior Project Geologist of the Company. |
|
(3) |
The classification of the current Mineral Resource Estimate into Measured, Indicated and Inferred has been completed in accordance with the definitions for mineral resources in S-K 1300, which are consistent with current 2014 CIM Definition Standards - For Mineral Resources and Mineral Reserves. |
|
(4) |
All figures are rounded to reflect the relative accuracy of the estimate and numbers may not add due to rounding. |
|
(5) |
The mineral resources are presented undiluted and in situ, constrained by continuous 3D wireframe models, and are considered to have reasonable prospects for eventual economic extraction. |
|
(6) |
Mineral resources which are not mineral reserves do not have demonstrated economic viability. An Inferred Mineral Resource has a lower level of confidence than that applying to an Indicated Mineral Resource and must not be converted to a Mineral Reserve. It is reasonably expected that most Inferred Mineral Resources could be upgraded to Indicated Mineral Resources with continued exploration. |
|
(7) |
The Project mineral resource estimates are based on a validated database which includes data from 1202 surface diamond drill holes totalling 406,431 m, and 426 surface channels (Eau Claire deposit) for 1,345 m. The resource database totals 273,402 drill hole assay intervals representing 267,721 m of data and 2,254 channel assays for 1,316 m. |
|
(8) |
The MRE for the Eau Claire deposit is based on 280 three-dimensional (“3D”) resource models representing the 450, 850 and hinge zones. The MRE for the Percival deposit is based on 29 3D resource models representing high grade and lower grade halo zones. |
|
(9) |
Grades for Au were estimated for each mineralization domain using 1.0 metre capped composites assigned to that domain. To generate grade within the blocks, the inverse distance cubed (ID3) interpolation method was used for all domains of the Eau Claire deposit and ID2 for Percival deposit. An average density value was assigned to each domain. |
|
(10) |
Based on the location, surface exposure, size, shape, general true thickness, and orientation, it is envisioned that parts of the Eau Claire and Percival deposits may be mined using open-pit mining methods. In-pit mineral resources are reported at a base case cut-off grade of 0.5 g/t Au. The in-pit resource grade blocks are quantified above the base case cut-off grade, above the constraining pit shell, below topography and within the constraining mineralized domains (the constraining volumes). |
|
(11) |
The pit optimization and base-case cut-off grade consider a gold price of $1,900/oz and considers a gold recovery of 95%. The pit optimization and base case cut-off grade also considers a mining cost of US$2.80/t mined, pit slope of 55⁰ degrees, and processing, treatment, refining, G&A and transportation cost of USD$19.00/t of mineralized material. |
|
(12) |
The results from the pit optimization, using the pseudoflow optimization method in Whittle 4.7.4, are used solely for the purpose of testing the “reasonable prospects for economic extraction” by an open pit and do not represent an attempt to estimate mineral reserves. There are no mineral reserves on the Property. The results are used as a guide to assist in the preparation of a Mineral Resource statement and to select an appropriate resource reporting cut-off grade. A Whittle pit shell at a revenue factor of 0.52 was selected as the ultimate pit shell for the purposes of this mineral resource estimate. |
|
(13) |
Based on the size, shape, general true thickness, and orientation, it is envisioned that parts of the Eau Claire and Percival deposits may be mined using underground mining methods. Underground mineral resources are reported at a base case cut-off grade of 2.5 g/t Au. The mineral resource grade blocks were quantified above the base case cut-off grade, below surface/pit surface and within the constraining mineralized wireframes (considered mineable shapes). Based on the size, shape, general thickness, and orientation of the mineralized structures, it is envisioned that the deposits may be mined using a combination of underground mining methods including sub-level stoping (SLS) and/or cut and fill (CAF) mining. |
|
(14) |
The underground base case cut-off grade of 2.5 g/t Au considers a mining cost of US$65.00/t mined, and processing, treatment, refining, G&A and transportation cost of USD$19.00/t of mineralized material. |
|
(15) |
The estimate of Mineral Resources may be materially affected by environmental, permitting, legal, title, taxation, socio-political, marketing, or other relevant issues. |
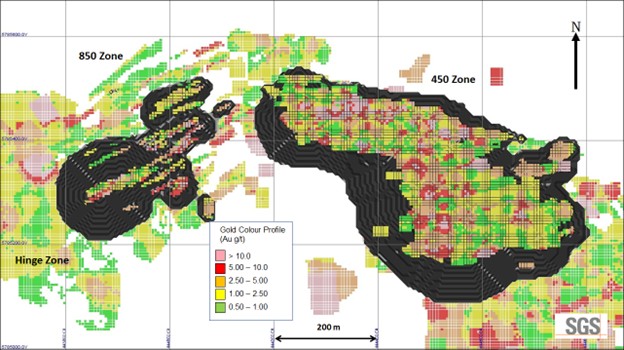
Figure 11: Plan View: Eau Claire Mineral Resource Blocks by Grade and Revenue Factor 0.52 Pit Surface (dark grey) (NAD83 UTM Zone 18)
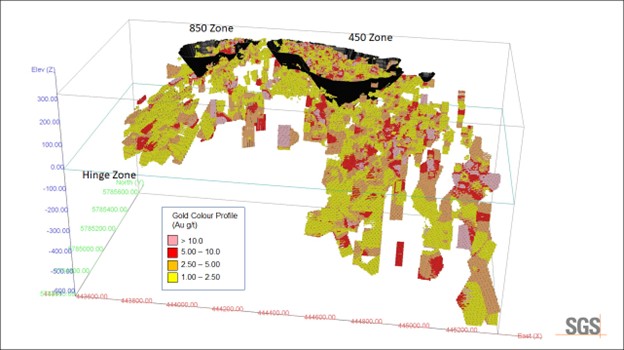
Figure 12: Isometric View Looking North: Eau Claire Mineral Resource Blocks by Grade and Revenue Factor 0.52 Pit Surface (dark grey) (NAD83 UTM Zone 18)
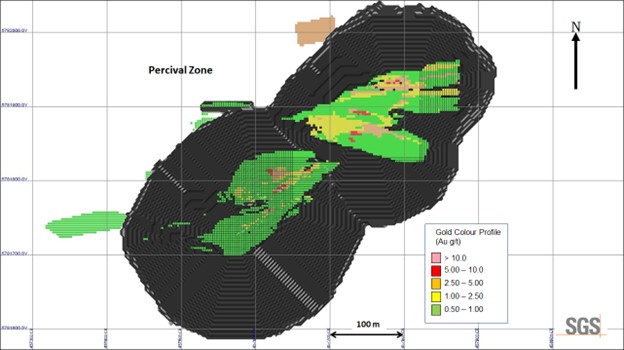
Figure 13: Plan View: Percival Inferred Mineral Resource Blocks by Grade and Revenue Factor 1.0 Pit Surface (dark grey) (NAD83 UTM Zone 18)
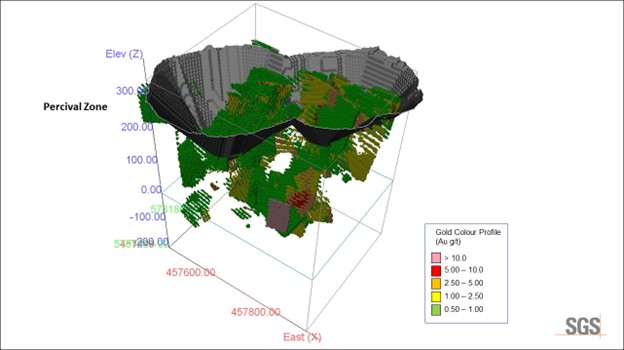
Figure 14: Plan View: Percival Inferred Mineral Resource Blocks by Grade and Revenue Factor 1.0 Pit Surface (dark grey) (NAD83 UTM Zone 18)
|
11.12 |
Model Validation and Sensitivity Analysis |
Visual checks of block grades against the composite data and assay data on vertical section showed good correlation between block grades and drill intersections.
A comparison of the average capped composite grades and average assay grades by domain with the average grades of all the blocks in the block model at a 0.00 g/t Au cut-off grade was completed and is presented in Table 17.
For comparison purposes, additional grade models for the Eau Claire and Percival deposits were generated using a varied inverse distance weighting (ID2) and nearest neighbour (NN) interpolation methods. The results of these models are compared to the chosen models (ID3) at various cut-off grades in a grade/tonnage graph shown in Figure 15 and Figure 16. In general, for the Eau Claire deposit the ID2 and ID3 models show similar results, and both are more conservative and smoother than the NN model. For models well-constrained by wireframes and well-sampled (close spacing of data), ID3 should yield very similar results to other interpolation methods such as ID2 or Ordinary Kriging.
For the Percival deposit, the ID2, ID3 and NN models show similar results, likely due the limited drilling and available data.
Table 17 Comparison of Average Assay and Composite Grades with Global Block Model Grades
|
Deposit |
Variable |
Au g/t |
|
Eau Claire Deposit |
Assays |
5.01 |
|
Composites Capped |
4.08 |
|
|
Blocks |
3.30 |
|
|
Percival Deposit |
Assays |
1.45 |
|
Composites Capped |
1.23 |
|
|
Blocks |
0.98 |
|

Figure 15 Comparison of ID3 (MRE), ID2 & NN Models for the Eau Claire Deposit The Eau Claire and Percival deposit MREs have been estimated at a range of cut-off grades to demonstrate the sensitivity of the resources to cut-off grades.
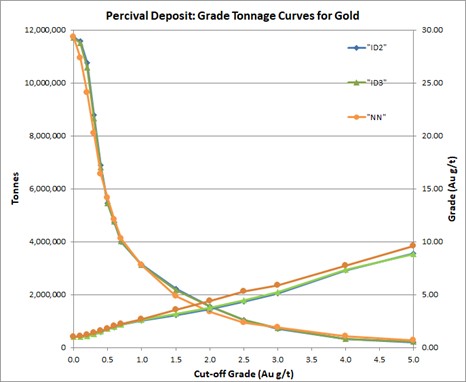
Figure 16: Comparison of ID3 (MRE), ID2 & NN Models for the Percival Deposit
|
11.12.1 |
Sensitivity to Cut-off Grade |
For the Eau Claire deposit the current in-pit MREs are reported at a base-case cut-off grade of 0.50 g/t Au (highlighted) within conceptual pit shells, and the current underground MREs are reported at a base-case cut-off grade of 2.50 g/t Au (Table 18). For the Percival deposit the current in-pit MREs are reported at a base-case cut-off grade of 0.50 g/t Au (highlighted) within conceptual pit shells, and the current underground MREs are reported at a base-case cut-off grade of 2.50 g/t Au (Table 19).
Values in these tables reported above and below the base-case cut-off grades for in-pit MREs and for underground MREs should not be misconstrued with a Mineral Resource statement. The values are only presented to show the sensitivity of the block model estimates to the selection of the base case cut-off grade. All values are rounded to reflect the relative accuracy of the estimate and numbers may not add due to rounding.
Table 18: Eau Claire In-Pit and Underground Mineral Resource Estimate, at Various Au Cut-off Grades
|
In Pit |
|||||||||
|
Measured |
Indicated |
Inferred |
|||||||
|
Cut-off (Au g/t |
Tonnes |
Au (g/t) |
Contained Au (oz) |
Tonnes |
Au (g/t) |
Contained Au (oz) |
Tonnes |
Au (g/t) |
Contained Au (oz) |
|
0.30 |
1,204,000 |
5.00 |
194,000 |
1,358,000 |
4.00 |
175,000 |
70,000 |
4.32 |
10,000 |
|
0.40 |
1,183,000 |
5.08 |
193,000 |
1,329,000 |
4.08 |
174,000 |
70,000 |
4.32 |
10,000 |
|
0.50 |
1,157,000 |
5.19 |
193,000 |
1,291,000 |
4.19 |
174,000 |
69,000 |
4.39 |
10,000 |
|
0.60 |
1,125,000 |
5.32 |
192,000 |
1,258,000 |
4.28 |
173,000 |
69,000 |
4.40 |
10,000 |
|
0.70 |
1,096,000 |
5.44 |
192,000 |
1,212,000 |
4.42 |
172,000 |
68,000 |
4.42 |
10,000 |
|
1.00 |
995,000 |
5.91 |
189,000 |
1,084,000 |
4.84 |
169,000 |
66,000 |
4.52 |
10,000 |
|
Underground |
|||||||||
|
Measured |
Indicated |
Inferred |
|||||||
|
Cut-off (Au g/t |
Tonnes |
Au (g/t) |
Contained Au (oz) |
Tonnes |
Au (g/t) |
Contained Au (oz) |
Tonnes |
Au (g/t) |
Contained Au (oz) |
|
1.50 |
638,000 |
5.51 |
113,000 |
5,423,000 |
4.66 |
813,000 |
4,073,000 |
4.55 |
596,000 |
|
2.00 |
538,000 |
6.24 |
108,000 |
4,288,000 |
5.43 |
749,000 |
3,194,000 |
5.33 |
547,000 |
|
2.50 |
455,000 |
6.90 |
101,000 |
3,490,000 |
6.17 |
692,000 |
2,566,000 |
6.08 |
502,000 |
|
3.00 |
397,000 |
7.52 |
96,000 |
2,861,000 |
6.92 |
637,000 |
2,068,000 |
6.89 |
458,000 |
|
4.00 |
293,000 |
9.02 |
85,000 |
2,001,000 |
8.41 |
541,000 |
1,372,000 |
8.64 |
381,000 |
|
5.00 |
232,000 |
10.19 |
76,000 |
1,492,000 |
9.76 |
468,000 |
1,036,000 |
10.00 |
333,000 |
Table 19: Percival In-Pit and Underground Mineral Resource Estimate, at Various Au Cut-off Grades
|
In Pit |
|||
|
Inferred |
|||
|
Cut-off (Au g/t |
Tonnes |
Au (g/t) |
Contained Au (oz) |
|
0.30 |
3,375,000 |
1.34 |
146,000 |
|
0.40 |
2,752,000 |
1.57 |
139,000 |
|
0.50 |
2,253,000 |
1.81 |
131,000 |
|
0.60 |
2,008,000 |
1.97 |
127,000 |
|
0.70 |
1,798,000 |
2.12 |
123,000 |
|
1.00 |
1,351,000 |
2.55 |
111,000 |
|
Underground |
|||
|
Inferred |
|||
|
Cut-off (Au g/t |
Tonnes |
Au (g/t) |
Contained Au (oz) |
|
1.50 |
1,273,000 |
3.05 |
125,000 |
|
2.00 |
859,000 |
3.69 |
102,000 |
|
2.50 |
557,000 |
4.47 |
80,000 |
|
3.00 |
381,000 |
5.31 |
65,000 |
|
4.00 |
145,000 |
8.58 |
40,000 |
|
5.00 |
97,000 |
10.58 |
33,000 |
|
12 |
Mineral Reserve Estimates |
Due to the early stage of the Project there are no mineral reserve estimates.
|
13 |
Mining Methods |
Due to the early stage of the Project no studies regarding mining methodology have been completed.
|
14 |
Processing and Recovery Methods |
Due to the early stage of the Project no studies regarding recovery methods have been completed.
|
15 |
Infrastructure |
Due to the early stage of the Project no studies regarding the required infrastructure for future development have been completed.
|
16 |
Market Studies |
Due to the early stage of the Project no Market studies have been completed.
|
17 |
Environmental Studies, Permitting, and Plans, Negotiations, or Agreements with Local Individuals or Groups |
Due to the early stage of the Project this section is not applicable.
|
18 |
Capital and Operating Costs |
Due to the early stage of the Project this section is not applicable.
|
19 |
Economic Analysis |
Due to the early stage of the Project this section is not applicable.
|
20 |
Adjacent Properties |
None of the adjacent claims are known to host mineralized zones comparable to the Eau Claire deposit. No reliance was placed on any information from adjacent properties in the estimation and preparation of the resources reported in this technical report. Adjacent properties are therefore not deemed material to this report.
|
21 |
Other Relevant Data and Information |
Ms Doyon is not aware of any additional data or information available for disclosure.
|
22 |
Interpretation and Conclusions |
The Project is located in the La Grande volcanic subprovince (2800 to 2738 Ma), east the Opinaca metasedimentary subprovince (2703 to 2674 Ma) and lies within the Eastmain Greenstone Belt (2752 to 2696 Ma). The Eau Claire gold deposit and the Percival Prospect occur within a few kilometres of the Cannard Deformation Zone, a crustal scale structural break and is hosted in the Natel Formation (2739 to 2720 Ma), which is made up of komatiites, komatiitic basalt, massive to pillowed basaltic and andesitic flows of tholeiitic affinity (magnesian tholeiites and iron tholeiites), with interbedded sequences of mudstone, wacke and iron formation.
The majority of the gold mineralization identified to date at Eau Claire occurs as stacked late quartz tourmaline veining (VQTL) within interbedded mafic volcanics and volcaniclastic sequences proximal to regional D2 shear zones. Gold mineralization also occurs within altered host rock without veining occurring as centimetre to several metre wide tourmaline-actinolite ± biotite ± calcite replacement zones around vein selvages. A third style of gold mineralization recently identified in silicified breccias and quartz veins hosted in sediments and volcanic rocks proximal to iron formation on the eastern side of the Project. Eau Claire hosts over 12 showings, the most advanced being the Eau Claire deposit and the Percival prospect.
Since acquiring the Project, Fury has initiated systematic exploration programs consisting of geological mapping, biogeochemical sampling, reinterpretation of historical geophysical data, ground based geophysical studies and diamond drilling. Drilling has focussed on exploring for extensions to the known gold mineralization at the Eau Claire deposit, and the Snake Lake and Percival prospects. Large stepout drilling in 2022 increased the mineralized footprint of the Eau Claire deposit by over 450m to the west. At Percival Fury intercepted 13.5 metres (m) of 8.05 g/t gold (Au) outlining a 500x100x300m zone of gold mineralization.
Drilling at the Eau Claire deposit has identified gold mineralization with suitable continuity, grade and size to be potentially economically extracted.
The 2028 Mineral Resource Estimate (2024 MRE) follows the 2019 CIM Best Practice Guidelines for mineral resource estimation. The wireframe grade shell models represent the drilled mineralization and are suitable for use in block model estimations. The Eau Claire and Percival deposits meet the criteria of reasonable prospects for eventual economic extraction in the combined open pit and underground portions of the MRE.
The 2024 Eau Claire Mineral Resource Estimation is representative of the known mineralization. No additional drilling or work has been carried out within the defined resource area. From 2020 through to 2024, Fury completed a total of 120 diamond drill holes for approximately 75,651.3 m on the Project. The drill program consisted of i) an extension phase focused on extensions to the known vein corridors along strike from the current resource (“Extension Program”); ii) an exploration phase designed to test targets along the 4.5km long deposit trend (“Exploration Program”) and iii) an exploration phase of drilling designed to test targets at the Percival and Serendipity prospects 14km east and 20km northeast of the Eau Claire Deposit respectively.
The Mineral Resources at the Eau Claire Deposit are estimated to be approximately 1.61 Mt of Measured Mineral Resources grading 5.67 g/t Au containing 294,000 ounces gold, Indicated Mineral Resources of 4.78 Mt grading 5.64 g/t Au containing 866,000 ounces gold and 5.44 Mt of inferred Mineral Resources at an average grade of 4.13 g/t Au containing 723,000 ounces gold.
The preliminary metallurgical work completed to date indicates that gold can be recovered using conventional methods utilizing combined gravity followed by a cyanide leach.
The Author considers that the Project has potential for delineation of additional Mineral Resources and that further exploration is warranted. Given the prospective nature of the Property, it is the Author’s opinion that the Property merits further exploration and that a proposed plan for further work by Fury is justified. The Author is recommending Fury conduct further exploration, subject to funding and any other matters which may cause the proposed exploration program to be altered in the normal course of its business activities or alterations which may affect the program as a result of exploration activities themselves
|
23 |
Recommendations |
Fury’s intentions are to continue exploration on the Property in 2025 and onwards. The proposed work program consists of a regional portion focused on refining known gold occurrences within the Percival – Serendipity trend, 14km to the east of Eau Claire, and attempting to define new prospects in areas with favourable geological and structural settings. In addition to the regional program, a drill program focused on the Eau Claire deposit is planned to tie-in the mineralization identified 450m west of the current resource with the aim of updating the current mineral resource. Additional drilling would focus on the Percival prospect and other nearby geochemical anomalies to determine the continuity and scale of gold mineralization.
Fury has gained a better understanding of the combination of pathfinder elements and structural controls on the gold mineralization at Percival. The broad low-grade gold mineralization occurs along a well-defined east–west trending structural splay of the Cannard Deformation Zone. Certain elemental associations, most notably Arsenic, Bismuth, and Tungsten, are proving to be important pathfinders for the gold mineralization. Higher-grade gold within the broader corridor is controlled by secondary shearing and is identified by the high degree of silicification. With this knowledge, the Company has refined their targeting along the Percival to Serendipity Trend identifying ten priority targets for 2024. These identified targets lie within the same stratigraphic package as Percival Main and have undergone varying degrees of deformation. The proximity of the main Cannard and Hashimoto Deformation Zones varies from one target to the other and may have a significant impact on the gold mineralization. Fury believes the varying degrees of deformation are an important control on both gold mineralization and the potential preservation of a sizeable, mineralized body.
The proposed work program is anticipated to include the collection of 15,000 infill till and biogeochemical samples and 30,000 m of diamond drilling. Drilling would be allocated with 2,000 m to 7,500 m focused on testing biogeochemical anomalies within the Percival – Serendipity trend, approximately 20,000 m at the Eau Claire deposit for resource expansion, and 2,500 m to 8,000 m at Percival for resource expansion. Subsequent to the completion of additional drilling on the Property, updated MREs are planned which will form the basis of an updated engineering study in the form of an updated Preliminary Economic Assessment.
The total cost of the planned work program by Fury is estimated at $14.2 M (Table 20).
Table 20: Eau Claire Project Exploration Budget
|
Item |
Details |
Cost (C$) |
|
Labour |
Staff Wages, Technical and Support Contractors |
1,750,000 |
|
Assaying |
Sampling and Analytical |
750,000 |
|
Drilling |
Diamond Drilling (30,000m at $175/m) |
5,250,000 |
|
Till Sampling |
Detailed sampling program |
1,500,000 |
|
Land Management |
Consultants. Assessment Filing, Claim maintenance |
750,000 |
|
Community Relations |
Community Tours, Outreach |
75,000 |
|
Information Technology |
Remote site communications and IT |
35,000 |
|
Safety |
Equipment, Training and Supplies |
75,000 |
|
Expediting |
Expediting |
150,000 |
|
Camp Costs |
Equipment, Maintenance, Food, Supplies |
250,000 |
|
Freight and Transportation |
Freight, Travel, Helicopter |
450,000 |
|
Fuel |
1,200,000 |
|
|
General and Administration |
100,000 |
|
|
Update MRE and PEA |
600,000 |
|
|
Sub-total |
12,935,000 |
|
|
Contingency (10%) |
1,293,500 |
|
|
Total |
14,228,500 |
|
|
24 |
References |
Armitage, A.E., and Hafez, S.A., 2017, Technical Report on the Updated Mineral Resource Estimate for the Eau Claire Gold Deposit, Clearwater Project, Québec, Canada dated October 25, 2017 for Eastmain Resources Inc., 156 p.
Dubé, B. and Gosselin, P. 2007. Greenstone-hosted quartz-carbonate vein deposits. In Goodfellow, W.D., ed. Mineral Deposits of Canada: A Synthesis of Major Deposit-Types, District Metallogeny, the Evolution of Geological Provinces, and Exploration Methods. Geological Association of Canada, Mineral Deposits Division, Special Publication No. 5, pp.49-73.
Dupere, M., Eggers, B., Dean, S., 2024, Mineral Resource Estimate Update for the Eau Claire Project, Eeyou Istchee James Bay Region of Quebec, Canada dated June 25, 2024 with an effective date of May 10, 2024 for Fury Gold Mines Ltd., 167p.
Frappier-Rivard, D., Dupéré, M., 2023, Technical Report on the Eau Claire Project, Quebec, Canada dated August 30, 2023 for Fury Gold Mines Ltd.
Puritch, E., Yassa, A., Bradfield, A. and Armitage, A., 2018, Technical Report, Updated Mineral Resource and Preliminary Economic Assessment on the Eau Claire Gold Deposit, Clearwater Property, Quebec, Canada dated July 3rd, 2018 for Eastmain Resources Inc., 298 p.
SGS Mineral Services, 2010. An Investigation of The Recovery of Gold and Tellurium from Clearwater Project Samples, prepared for Eastmain Resources Inc. Project 12228-001 – Final Report October 4, 2010, 102 p.
SGS Mineral Services, 2017. An Investigation into Gold Recovery from Clearwater Project Samples, prepared for Eastmain Resources Inc. Project 15524-001 – Final Report September 27, 2017, 133 p.
SRK Consulting (Canada) Inc., 2017. Technical Report for the Eau Claire Gold Deposit, Clearwater Project, Quebec, Report Prepared for Eastmain Resources Inc. June 11, 2015, 143 p.
|
25 |
Reliance on Information Provided by the Registrant |
Ms Doyon as a full time employee of the Registrant, Fury, does not claim reliance on any other party with respect to the information provided or the opinions expressed herein, having reviewed, and found satisfactory such corporate and other documentation as deemed necessary to assume responsibility for such information and opinions as are expressed herein.
|
26 |
DATE AND SIGNATURE PAGE |
This report entitled “S-K 1300 Technical Report Summary on the Eau Claire Project, Quebec, Canada” with an effective date of December 31, 2023 was prepared and signed by:
Signed: _________________________________
Valerie Doyon, P. Geo.
Senior Project Geologist, Fury Gold Mines Limited
Appendix 1 – Eau Claire Claims List
Exhibit 15.3
S-K 1300 TECHNICAL REPORT SUMMARY ON THE ÉLÉONORE
SOUTH PROJECT
QUEBEC, CANADA
Prepared for Fury Gold Mines Ltd.

Qualified Persons:
Valérie Doyon, P. Geo.
Senior Project Geologist, Fury Gold Mines Limited
Information Current as of: December 20, 2024
|
Contents |
||||
|
1 |
Executive Summary |
5 |
||
|
1.1 |
Overview |
5 |
||
|
1.2 |
Conclusions |
6 |
||
|
1.3 |
Recommendations |
6 |
||
|
2 |
Introduction and Terms of Reference |
9 |
||
|
2.1 |
Sources of Information |
9 |
||
|
2.2 |
Personal Inspection |
9 |
||
|
3 |
Property Description |
9 |
||
|
3.1 |
Location |
9 |
||
|
3.2 |
Project Ownership |
9 |
||
|
3.3 |
Mineral Tenure |
10 |
||
|
3.4 |
Royalties and Encumbrances |
10 |
||
|
3.5 |
Permitting |
10 |
||
|
3.6 |
First Nations Rights |
11 |
||
|
4 |
Accessibility, Climate, Local Resources, Infrastructure and Physiography |
13 |
||
|
4.1 |
Accessibility |
13 |
||
|
4.2 |
Climate |
13 |
||
|
4.3 |
Local resources & Infrastructure |
13 |
||
|
4.4 |
Physiography |
13 |
||
|
4.5 |
Conclusions |
14 |
||
|
5 |
History |
14 |
||
|
5.1 |
Historical Drilling |
21 |
||
|
5.2 |
Past Production |
21 |
||
|
6 |
Geological Setting and Mineralization |
21 |
||
|
6.1 |
Regional Geology |
21 |
||
|
6.2 |
Property Geology |
25 |
||
|
6.3 |
Mineralization |
27 |
||
|
6.3.1 |
Regional Mineralization |
27 |
||
|
6.3.2 |
Property Mineralization |
28 |
||
|
6.4 |
Deposit Types |
28 |
||
|
6.4.1 |
Reduced Intrusion-Related Gold Deposits |
28 |
||
|
6.4.2 |
Greenstone-hosted Quartz Carbonate Vein Deposits |
30 |
||
|
7 |
Exploration |
33 |
||
|
7.1 |
Soil Sampling |
33 |
||
|
7.1.1 |
Soil Sampling Methodology |
34 |
||
|
7.2 |
Biogeochemical Sampling |
35 |
||
|
7.2.1 |
Biogeochemical Methodology |
35 |
||
|
7.3 |
Drilling |
36 |
||
|
7.3.1 |
2008 – 2010 Eastmain Resources Inc. Drilling |
36 |
||
|
7.3.2 |
2016 - 2018 Azimut Exploration Inc. Drilling |
40 |
||
|
7.3.3 |
2018 – 2019 Eastmain Resources Inc. Drilling |
42 |
||
|
7.3.4 |
2024 – Fury Gold Mines Drilling |
44 |
||
|
7.3.5 |
Discussion on Drilling Completed |
46 |
||
|
7.3.6 |
Methodology |
46 |
||
|
8 |
Sample Preparation, Analyses, and Security |
46 |
||

|
8.1 |
2008 – 2010 Eastmain Resources Diamond Drilling |
48 |
||
|
8.2 |
2016 – 2018 Azimut Exploration Diamond Drilling |
51 |
||
|
8.3 |
2018 – 2019 Eastmain Resources Diamond Drilling |
54 |
||
|
8.4 |
2024 – Fury Gold Mines Diamond Drilling |
55 |
||
|
8.5 |
Summary |
59 |
||
|
9 |
Data Verification |
60 |
||
|
9.1 |
Site Inspection |
60 |
||
|
9.2 |
Database Verification |
60 |
||
|
9.3 |
2020 through 2024 Quality Assurance and Quality Control |
60 |
||
|
9.3.1 |
Certified Reference Material |
60 |
||
|
9.4 |
Conclusions |
61 |
||
|
10 |
Mineral Processing and Metallurgical Testing |
61 |
||
|
11 |
Mineral Resource Estimate |
61 |
||
|
12 |
Mineral Reserve Estimates |
61 |
||
|
13 |
Mining Methods |
61 |
||
|
14 |
Processing and Recovery Methods |
61 |
||
|
15 |
Infrastructure |
61 |
||
|
16 |
Market Studies |
61 |
||
|
17 |
Environmental Studies, Permitting, and Plans, Negotiations, or Agreements with Local Individuals or Groups |
62 |
||
|
18 |
Capital and Operating Costs |
62 |
||
|
19 |
Economic Analysis |
62 |
||
|
20 |
Adjacent Properties |
62 |
||
|
20.1 |
Cheechoo Project – Sirios |
62 |
||
|
20.2 |
Éléonore Mine – Newmont |
62 |
||
|
21 |
Other Relevant Data and Information |
62 |
||
|
22 |
Interpretation and Conclusions |
63 |
||
|
23 |
Recommendations |
63 |
||
|
24 |
References |
65 |
||
|
25 |
Reliance on Information Provided by the Registrant |
69 |
||
|
26 |
DATE AND SIGNATURE PAGE |
70 |
||
|
Tables |
||
| Table 1 - |
Recommended Work Programs for 2025 and beyond |
8 |
| Table 2 - |
Characteristics of Mineralization Identified at Éléonore South |
28 |
| Table 3 - |
Summary of drilling on the Éléonore South Project |
36 |
| Table 4 - |
2008-2010 Eastmain Resources Inc. Drilling - JT Gold Composite |
38 |
| Table 5 - |
2008-2010 - Eastmain Resources Inc. Drilling -JT assays (5 g/t and more) |
38 |
| Table 6 - |
2008-2010 – Eastmain Resources Inc. Drilling - Moni composite |
38 |
| Table 7 - |
2016 - 2018 - Azimuth Exploration - Moni composite |
40 |
| Table 8 - |
2016 – 2018 - Azimuth Exploration - Moni assays (5 g/t and more) |
41 |
| Table 9 - |
2018 - 2019 Eastmain Resources - JT composite |
42 |
| Table 10 - |
2018 - 2019 - Eastmain Resources - JT assays (5 g/t and more) |
42 |
| Table 11 - |
2018 – 2019 – Eastmain Resources - Moni composite |
43 |
| Table 12 - |
2018 - 2019 Eastmain Resources - Moni assays (5 g/t and more) |
43 |
| Table 13 - |
2024 – Fury Gold Mines - Moni composite |
44 |
| Table 14 - |
2024 - Fury Gold Mines - Moni assays (5 g/t and more) |
44 |
| Table 15 - |
Method of analysis of the different drilling campaigns |
47 |
| Table 16 - |
Conceptual pit-constrained Indicated and Inferred Resource Estimate for the Cheechoo Project |
62 |
| Table 17 - |
Recommended Work Programs for 2025 and beyond |
64 |
|
Figures |
||
| Figure 1: |
Property Location and Claims |
12 |
| Figure 2: |
Regional stratigraphic column after Ravenelle et al., 2010. |
23 |
| Figure 3: |
Strategic location of several projects according to the proximity with the Opinaca boundary. |
24 |
| Figure 4: |
Property Geology |
26 |
| Figure 5: |
Geochemical Targets situated along deep-rooted structures. |
34 |
| Figure 6: |
Biogeochemical Sampling Results |
35 |
| Figure 7: |
Drilling Map Localization by Year and Operator. |
39 |
| Figure 8: |
Fury 2024 Drilling Campaign Hole Location and Highlights |
45 |
| Figure 9 - |
Fury Gold Mines - Sample preparation and analysis flow |
57 |
|
Appendices |
||
|
Appendix 1 – Éléonore South Claims List |
||
|
1 |
Executive Summary |
|
1.1 |
Overview |
Fury is a Vancouver based Canadian public company involved in mineral exploration and development. Fury is listed on the Toronto Stock Exchange and the NYSE American Stock Exchange.
This Technical Report Summary (TRS) conforms to United States Securities and Exchange Commission’s (SEC) Modernized Property Disclosure Requirements for Mining Registrants as described in Subpart 229.1300 of Regulation S-K, Disclosure by Registrants Engaged in Mining Operations (S-K 1300) and Item 601 (b)(96) Technical Report Summary. The purpose of this TRS is to support the disclosure of the Éléonore South Project exploration stage with an effective date of December 31, 2024.
The Project, 100% held by Fury, comprises 282 claims, totaling 14,760 hectares (ha). Located in 1:50,000 scale NTS map sheets 33B12 and 33C09, approximately 200 km east of the Cree community of Wemindji, 330 km northwest of the town of Chibougamau and 800 km north of Montreal. The property is accessible, year-round, by either the James Bay Highway or Route du Nord and is located 100 km north of Nemaska, serviced by commercial flights twice per week. The centre of the property is located at approximately 75.98 degrees longitude west and 52.58 degrees latitude north.
Of the 282 claims that make up the Project, 116 of the claims are subject to an escalating Net Smelter Royalty (NSR) held by Osisko Royalties (Osisko Royalty). The Osisko Royalty is tied to overall production from these claims as well as from the Éléonore Mine held by Dhilmar Corporation. The royalty amounts to 2% on the first 3M oz of gold production and tops out at 3.5% after 8M oz Au production. The royalty increases by 10% for gold prices above US $550/oz Au – again topping out at 3.5%. The claims are in good standing as of the date hereof.
Fury acquired 100% interest in the Project claims through purchasing Newmont Corporations 49.978% interest for $3.0M on March 1st, 2024. Prior to this the claims were held under a joint venture agreement with Fury acting as the operator.
The Project is north of the 52nd parallel (52ºN) and as such is subject to the provisions of the James Bay and Northern Quebec Agreement (1975), and the Paix des Braves Agreement (2002). The Project falls within the Eeyou Istchee Territory straddling the border between the Wemindji Cree First Nation and Eastmain Cree First Nation, including trap lines VC29 held by Angus Mayappo and VC35 held by Roderick Mayappo as the Cree Tallymen, and on Category III lands, as established under the James Bay and Northern Quebec Agreement.
The Project is located on along the contact between the La Grande volcanic subprovince (2,800 to 2,738 Ma) and the Opinaca metasedimentary subprovince (2,703 to 2,674 Ma) and lies within the Eastmain Greenstone Belt (2,752 to 2,696 Ma). The area is characterized by a vast batholithic complex essentially composed of synvolcanic intrusions (2,747-2,710 Ma) of the trondhjemite-tonalite-granodiorite (TTG) suite and syntectonic intrusions (2,710-2,697 Ma) of the tonalite-granodiorite-granite-monzodiorite (TGGM) suite, indicative of a voluminous and long-lived magmatic activity covering a span of 50 Ma (Moukhsil et al., 2003).
Gold mineralization identified to date at Éléonore South occurs within the Cheechoo Tonalite on the western side of the property. The gold mineralization occurs as fine-grained disseminations within the Tonalite as well as within structurally controlled quartz vein stockworks. The remainder of the property is prospective for gold bearing quartz tourmaline veins hosted within folded sedimentary rocks.
Since October 2020, Fury has carried out limited exploration programs consisting of geological mapping, soil geochemical sampling, biogeochemical sampling, reinterpretation of historical geophysical data, and limited diamond drilling within the Cheechoo Tonalite. The soil geochemical sampling program successfully defined nine discrete targets within a broad 5.5 km long historical gold-in-soil anomaly. The biogeochemical sampling program was designed to test an interpreted folded sequence of sedimentary rocks in an area of the property dominated by swamp and bog where conventional soil sampling was not possible. The biogeochemical sampling identified a six robust gold anomalies associated with an interpreted fold nose within Low Formation sedimentary rocks similar in geological setting to the Roberto Deposit of Newmont’s Eleonore mine. The 2024 diamond drilling program, comprised approximately 2,300 m focussed on the Moni Prospect trend following up on previous drilling intercepts of 53.25 m of 4.22 g/t gold (Au); 6.0 m of 49.50 g/t Au including 1.0 m of 294 g/t Au and 23.8 m of 3.08 g/t Au including 1.5 m of 27.80 g/t Au. The 2024 drilling intercepted 137.5 m of 0.44 g/t Au and 18.7 m of 0.97 g/t Au from drillhole 24ES-161; 115.5 m of 0.50 g/t Au from drillhole 24ES-162; and 28.0 m of 0.47 g/t Au from drillhole 24ES-160.
The Author is of the view that there are no environmental, permitting, legal, title, taxation, socio-economic, marketing, political, or other relevant factors applicable to the Project that could be seen as precluding mineral production once normal compliance with the many environmental and other governmental requirements are met.
|
1.2 |
Conclusions |
The Éléonore South project is an early-stage exploration project with limited previous drilling and sampling completed. The drilling completed to date has confirmed the presence of a Reduced Intrusion Related Gold System (RIRGS) within the southern portion of the Cheechoo Tonalite. Additionally, surface work completed by Fury has identified several gold in soil anomalies and biogeochemical anomalies which require additional follow up work.
|
1.3 |
Recommendations |
Future exploration efforts should focus on the high-grade gold potential of the Cheechoo tonalite while also continuing to advance the identified gold in soil and biogeochemical anomalies to the drill ready stage. The recommended Phase 1 work program consists of a 5,000 – 6,000 m drilling program targeting the robust Eleonore style gold targets identified through the biogeochemical sampling program. The Phase 1 program is estimated to cost approximately $3.1 million (Table 1).
The Phase 2 exploration program will be drill intensive. An additional 10,000 – 20,000 m of diamond and reverse circulation drilling should be completed to follow up on the results from the phase 1 program as well as within the Cheechoo Tonalite to determine if sufficient continuity of gold mineralization is present to prepare a maiden mineral resource estimate. The Phase 2 program is estimated to cost between $7.5 and $10 million (Table 1).
Table 1 - Recommended Work Programs for 2025 and beyond
|
Phase 1 |
||
|
Type |
Details |
Cost Estimate (C$) |
|
Labour |
Staff Wages, Technical and Support Contractors |
500,000 |
|
Assaying |
Sampling and Analytical |
400,000 |
|
Drilling |
Diamond Drilling (5,000m at $150/m) |
750,000 |
|
Land Management |
Consultants. Assessment Filing, Claim maintenance |
5,000 |
|
Community Relations |
Community Tours, Outreach |
10,000 |
|
Information Technology |
Remote site communications and IT |
5,000 |
|
Safety |
Equipment, Training and Supplies |
5,000 |
|
Expediting |
Expediting |
7,500 |
|
Camp Costs |
Equipment, Maintenance, Food, Supplies |
200,000 |
|
Freight and Transportation |
Freight, Travel, Helicopter |
600,000 |
|
Fuel |
250,000 |
|
|
General and Administration |
100,000 |
|
|
Sub-total |
2,873,500 |
|
|
Contingency (10%) |
287,350 |
|
|
Total |
3,121,250 |
|
|
Phase 2 |
||
|
Type |
Details |
Cost Estimate (C$) |
|
Labour |
Staff Wages, Technical and Support Contractors |
1,250,000 |
|
Drilling |
Diamond Drilling (10,000 - 20,000m) |
2,000,000 |
|
Assaying |
Sampling and Analytical |
1,000,000 |
|
Community Relations |
Community Tours, Outreach |
25,000 |
|
Information Technology |
Remote site communications and IT |
10,000 |
|
Safety |
Equipment, Training and Supplies |
125,000 |
|
Expediting |
Expediting |
150,000 |
|
Camp Costs |
Equipment, Maintenance, Food, Supplies |
550,000 |
|
Freight and Transportation |
Fright, Travel, Helicopter |
1,500,000 |
|
Fuel |
600,000 |
|
|
General and Administration |
250,000 |
|
|
Sub-total |
7,460,000 |
|
|
Contingency (10%) |
746,500 |
|
|
Total |
8,206,000 |
|
|
2 |
Introduction and Terms of Reference |
This Technical Summary Report on the Éléonore South Project (the Project), located in the Eeyou Istchee James Bay Territory of Northern Quebec, Canada is authored by Valérie Doyon, Senior Project Geologist at Fury. The purpose of this report is to document the current exploration status of the Project and to outline the exploration work completed to date. Fury is a Toronto-based exploration company formed in June 2008 which is engaged in acquiring, exploring, and evaluating natural resource properties in Canada. It is a reporting issuer in British Columbia whose common shares trade on the Toronto Stock Exchange (TSX: FURY) and the NYSE-American (NYSE: FURY).
On October 9, 2020, the Company acquired all the issued and outstanding shares of Eastmain Resources Inc. (“Eastmain”) which formerly operated the Project.
The Project represents a strategic land position covering prospective lithologies and structures for gold deposits. The Éléonore South project is an early-stage exploration project with limited previous drilling and sampling completed. The drilling completed to date has confirmed the presence of a Reduced Intrusion Related Gold System (RIRGS) within the southern portion of the Cheechoo Tonalite. Additionally, surface work completed by Fury has identified several gold in soil anomalies and biogeochemical anomalies which all require additional follow up work.
|
2.1 |
Sources of Information |
The documentation reviewed by the Author, and other sources of information, are listed in Section 24 of this report.
|
2.2 |
Personal Inspection |
The Author prepared has been involved in all exploration programs on the Project since October 2020 and was last on site in August 2024.
|
3 |
Property Description |
|
3.1 |
Location |
The Project is located in the Eeyou Istchee James Bay Territory of Northern Quebec, approximately 200 km east of the Cree community of Wemindji, 330 km northwest of the town of Chibougamau and 800 km north of Montreal. The property is accessible, year-round, by either the James Bay Highway or Route du Nord and is located 100 km north of Nemaska, serviced by commercial flights three times per week.
The approximate centre of the Project is located at Universal Transverse Mercator (UTM) co-ordinates 5,826,400m N and 430,700m E (NAD 83, Zone 18N). The Project is located within National Topographic System (NTS) 1:50,000 scale map-areas; 33B12 and 33C09.
|
3.2 |
Project Ownership |
The Project consists of 282 map designated claims covering 14,760.46 ha in two non-contiguous blocks, (Figure 1, Appendix 1). Fury acquired 100% interest in the Project claims through purchasing Newmont Corporations 49.978% interest for $3.0M on March 1, 2024. Prior to this the claims were held under a joint venture agreement with Fury acting as the operator. The claims are registered 100% to Eastmain Resources Inc., a wholly owned subsidiary of Fury. Appendix 1 lists all the claims along with the relevant tenure information including their designation number, registration and expiry dates, area, assessment work credits and work requirements for renewal. The boundaries of the claims have not been legally surveyed. The mineral rights exclude surface rights, which belong to the Quebec government.
|
3.3 |
Mineral Tenure |
Under the Quebec Mining Act, claims or cells are map staked. The map-designated coordinates of the cells are the legal limits of said claims, the physical limits can be verified by consulting the Government of Quebec’s Ministère de Ressources Naturelles et des Forêts (MRNF) GESTIM website.
In Quebec, available mining lands are defined as geo-referenced polygons which can be applied for by holders of Quebec prospecting licenses through an online portal. The person identifies the claim (‘clicking’) and pays the required fee online. In the case of mining claims that are expiring or to be cancelled, these lands are made available for acquisition at a designated future date and time, allowing for all interested parties to become aware when these lands are available. In the case of open lands or re-opened lands, the first person to complete the transaction receives the mineral tenure. Funds to for transactions with MRNF such as claim acquisition and renewal may be deposited in advance in a dedicated account with the Ministry.
Under the current Quebec Mining Act claims are required to be renewed every two years for a fee of $170. Work requirements are based on the number of hectares in each claim and increase each 2-year term to a maximum reached at the 7th term (14th year). Work requirements also vary on whether the claim is located north or south of the 52nd parallel. The Éléonore South Project claims require expenditures equivalent to $705,000.00 every two years to remain in good standing, currently there is over $15.5 million in excess expenditures registered on the Property (Appendix 1).
|
3.4 |
Royalties and Encumbrances |
116 of the claims are subject to an escalating Net Smelter Royalty (NSR) held by Osisko Royalties (Osisko Royalty) (Figure 1). The Osisko Royalty is tied to overall production from these claims as well as from the Éléonore Mine property claims held by Newmont Corporation. The royalty amounts to 2% on the first 3 Moz of gold production and tops out at 3.5% after 8 Moz Au production. The royalty increases by 10% for gold prices above US$550/oz Au – again topping out at 3.5%. The remaining 166 claims are free of any royalty.
|
3.5 |
Permitting |
A forest intervention permit is required for any logging activity, Including clearing for roads, camps, and drill pads. Documentation for such a permit must be submitted by a forest engineer to the Chibougamau or Amos forest management unit, part of the MRNF In accordance with the Paix des Braves protocols, a representative from the MRNF will contact the Cree Tallyman who owns the trap line where logging is needed; the Tallyman then has 45 days to provide his approval. A small logging royalty, stumpage fee, is deemed payable to the Ministry.
A “special intervention permit” is required to conduct drilling. This permit is very similar to and replaces the forest intervention permit. Road construction necessitating any earthmoving requires authorization from the MRNF. This request is made concomitantly with the forest intervention permit request and may take a few months to be approved.
Installation of a temporary or permanent camp requires a permit to be issued by the Municipalité de la Baie-James, from Matagami. Installation must comply with municipal regulations as well as the Ministry of the Environment and the Fight against Climate Change (Ministère de l'Environnement, de la Lutte contre les changements climatiques, de la Faune et des Parcs – MELCCFP), especially concerning wastewater management.
No specific permit is required to conduct geophysics, line cutting, or other activities not requiring significant logging.
Based on personal visits and given that the Project is exploration stage, The Author is of the view that other than camp site rehabilitation there are no material environmental liabilities associated with the Project. Fury has all required permits to conduct the current and proposed work on the Project. The Author is not aware of any other significant factors and risks that may affect access, title, or the right or ability to perform the proposed work program on the Project.
|
3.6 |
First Nations Rights |
The Project is located north of the 52nd parallel (52ºN) and as such is subject to the provisions of the James Bay and Northern Quebec Agreement (1975), and the Paix des Braves Agreement (2002). The Project falls within the Eeyou Istchee Territory and straddles the boundary between the Cree Nations of Wemindji and Eastmain, including trap lines held by Angus Mayappo and Roderick Mayappo (tallyman).
The Éléonore South project is located on Category III lands, as established under the James Bay and Northern Quebec Agreement. Category III lands are administered by the province of Quebec, and they do not have any substantial restrictions on mineral exploration. A notice of work must be forwarded to the Wemindji and Eastmain Communities and the tallyman prior to initiating exploration activities. The Project straddles the traditional territories of the Cree Nations of Wemindji and Eastmain (Figure 1) and lies on traplines VC-29, VC-35 and VC-36.
Figure 1: Property Location and Claims
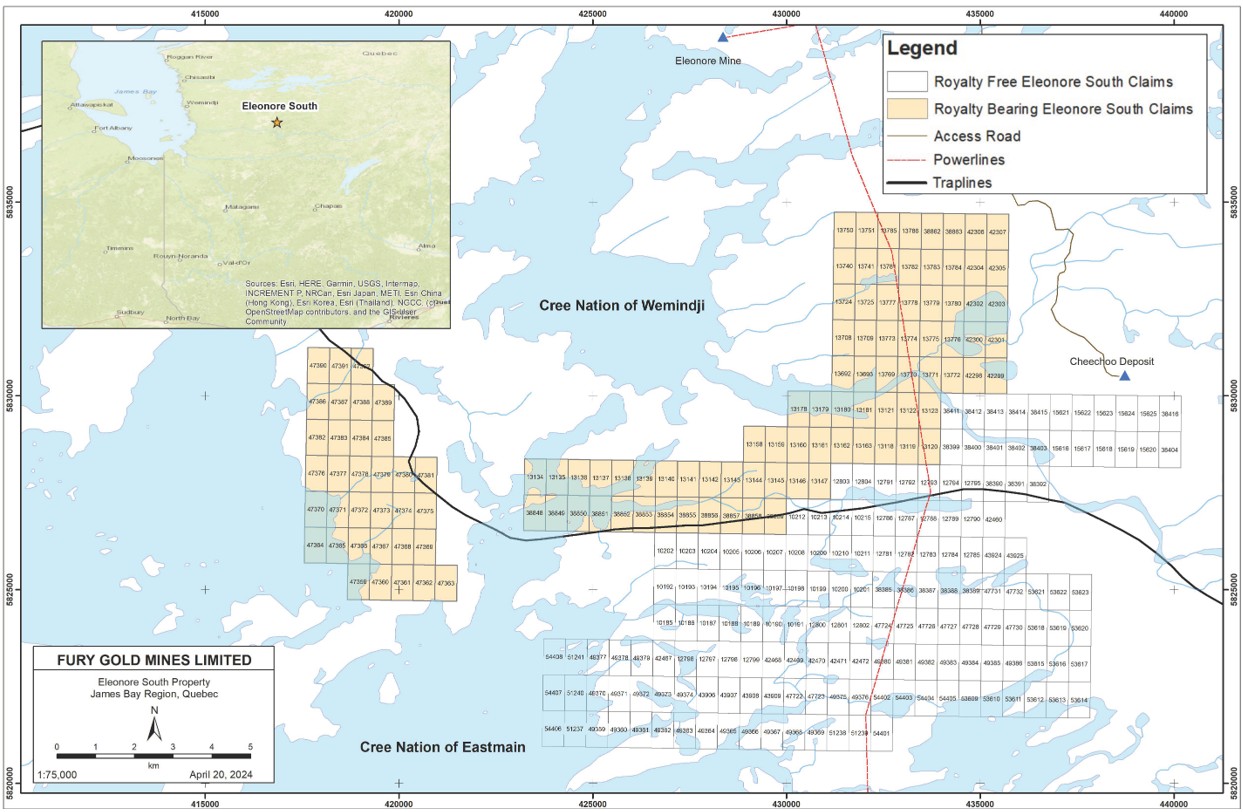
|
4 |
Accessibility, Climate, Local Resources, Infrastructure and Physiography |
|
4.1 |
Accessibility |
The Project is located in the Eeyou Istchee James Bay Territory of Northern Quebec, approximately 200 km east of the Cree community of Wemindji, 330 km northwest of the town of Chibougamau and 800 km north of Montreal (NTS Map sheet 33B12 and 33C09). The Project is 15 km southeast of Newmont Corporation’s Éléonore Mine (Figure 1). The property is accessible, year-round, by either the James Bay Highway or Route du Nord and is located 100 km north of Nemaska, serviced by commercial flights twice per week.
The property is accessible, year-round through a combination of the Billy Diamond (James Bay) Highway, the Route du Nord and Hydro-Quebec’s Sarcelle road. Sirios Resources has constructed a resource access road which leads to the Cheechoo Deposit within the Cheechoo Tonalite along the central east portion of the Property. Éléonore South is located 100 km north of Nemaska, serviced by commercial flights twice per week.
|
4.2 |
Climate |
The climate is typical of northern Quebec and is characterized by temperate to subarctic conditions. The average summer temperatures vary from 10 to 25 degrees Celsius during the day and 5 to 15 degrees Celsius at night (June to September). Winter temperatures range from -35 to -10 degrees Celsius. Winter season can start in late October and can continue until May. Precipitation varies during the year reaching an average of 2 m annually and is characterized by snow cover in the winter months and moderate rainfall in the summer months. Exploration activities can be carried out year-round.
|
4.3 |
Local resources & Infrastructure |
Fury, through its Eastmain subsidiary, maintains a 20-person camp to support exploration activities at the Éléonore South project. The hydroelectric power line that feeds Newmont’s Éléonore Mine transects the Éléonore South property (Figure 1). Newmont’s Éléonore mine complex, including a private airport are located 15 km to the northwest. Necessities such as skilled labour and specialized equipment are sourced from Val-d’Or or Chibougamau. Many services are now available through numerous Cree owned businesses and partnerships in Wemindji, Eastmain and Nemaska.
|
4.4 |
Physiography |
The property is located within the Canadian Shield and is characterized by many lakes, swamps, rivers, and low-lying terrain. The Property is bordered to the west by the Opinaca Reservoir. The Gipouloux River flows westward through the northern portion of the Property. The Éléonore South project is located in the boreal forest where forest fires are common. Vegetation is typical of taiga, including areas dominated by sparse black spruce, birch, and poplar forests, in addition to large areas of peat bog devoid of trees.
Overburden is typically 3 to 4 m thick, with the exception of isolated areas where overburden thickness can reach 20 m. Numerous glacial eskers often reaching tens of km in length can be seen of satellite images.
Rock outcrops are sparse due to the abundance of quaternary deposits and swamps. The topography of the area is subdued and characterized dominantly by lowlands, with few hills that attain elevations up to 300 m above sea level.
|
4.5 |
Conclusions |
The Éléonore South Project is a remote greenfields site with limited existing roads, no power or water. Development of the project will require:
|
● |
Upgrading of the current road access to allow for drive in / drive out operations on a scale suitable to development. |
|
● |
Connecting to the nearby Hydro Quebec renewables grid. |
|
● |
Upgrading of the current camp |
|
● |
Development of local water resources for potable and non-potable water consumption. |
In the opinion The Author, the Éléonore South Project site offers, subject to customary environmental and other regulatory compliance, adequate surface rights and land suitable for the construction of a processing plant, tailings facility, waste rock dumps, and mining camp. The project site has several suitable sources of water pending the necessary approvals.
|
5 |
History |
Regional exploration work was undertaken in the 1970s to evaluate the mineral economic potential of the area in anticipation of the flooding· resulting from the construction of the James Bay hydroelectric projects. Lake bottom sediment and geophysical surveys were conducted as well as regional geological mapping. Systematic and focused exploration work on the property started in 2005.
1970
In 1970’s, Société de Développement de la Baie James (SDBJ) did an evaluation of the mineral endowment of the area in anticipation of the flooding that was planned with the building of the James Bay hydroelectric projects (GM 34000, 34001, 34002 and 38167).
1976
In 1976 Quebec Government (MRNF) carried out a geological compilation of the James Bay area (DP 358 - Dube & al.,1976).
1977
In 1977 Quebec Government (MRNF) carried out a geological mapping covering the western part of the NTS 32/C09 (DPV 446 - Remick, 1976).
1999
In 1999 Quebec Government (MRNF) carried out a geological reconnaissance which covered the eastern part of the NTS 33/B12 (Simard & Gosselin, 1999).
2002
In 2002 Quebec Government (MRNF) worked on a geological synthesis report by Moukshil et al., 2002 - ET2002-06.
2003
In 2003, Azimut Exploration Inc. acquires by map designation the Opinaca C Property. The property counts 99 claims, (news release from 2003, November 24th).
2004
In 2004, Viriginia Gold mines discovered the Roberto gold deposit located 15 km north and adjacent to the Eastmain's Éléonore South Property (Robinson & Tolhurst, 2011).
Following the discovery of Roberto deposits, Azimut Exploration Inc. increases its holding near the area of Éléonore discovery and add 67 map designated claims to Opinaca C property. The property totalized at this time 166 conjugate claims owns at 100% by Azimut (news release from 2004 November 22nd).
2005
In March 2005, Azimut Exploration Inc. and Eastmain Resources Inc. signed an agreement for the Opinaca C property (news release from 2005, March 30th). Eastmain could acquire a 50% interest from Azimut Exploration during a 5-year period for certain payments of cash and shares.
In the summer of 2005, Eastmain Resources contracted Geotech Limited to carried out a helicopter-borne geophysical survey. It included a time domain electromagnetic and magnetic survey. A total of 1021-line km were flown on a 100 m spacing. Several EM anomaly groupings were identified (GM 62241).
Groundwork was conducted by Eastmain Resources for 2005 summer. A geochemical soil survey was completed over the entire property on a 100 m by 500 m grid alongside a prospecting and reconnaissance mapping survey. A total of 2118 soil samples (B-horizon) were collected and confirmed a large gold arsenic anomaly. A total of 202 rocks samples were collected and selected grab samples assayed up to 3390 ppb gold and 4170 ppm arsenic. The prospecting/mapping work confirmed underlying rock and alteration (aluminosilicate) are comparable to Roberto Gold Deposit (GM 62732).
2006
In March 2006, an interpretation of the airborne geophysical surveys flown by Geotech in 2005 was done by Eastmain. A total of 6 areas of interest were identified from the electromagnetic data (GM 62242).
In April 2006, Azimut, Goldcorp and Eastmain sign a Three-Way Joint Venture agreement to merge the 166 claims from Opinaca C block (azimuth and Eastmain) to 116 additional claims (Goldcorp) located north and west of the property. This new merged will become the Éléonore South property and count 282 claims in total split in two blocs (the main block with 248 claims and the west block with 34 claims). Eastmain was appointed the Project operator. Eastmain had the option to earn 33% of the property by funding certain exploration work.
In summer/fall 2006, Eastmain continue to work on the Éléonore South property, and 318.8-line km of grid was cut over 40% of the property. The grid line was completed with a north-south orientation at 200 m spacing and 50 m station. A regional geochemistry soil sampling (O, A and B-horizon) was executed and a total of 8639 samples were harvested and 688 samples from 2005 survey were re-assayed to obtain more precise multi-element values. Several km-size multi-element (Au-As-Sb) Roberto-type geochemical anomalies were detected. A geological mapping and prospecting survey were completed at 200 m line intervals. A total of 675 rock samples were collected from outcrops and boulders. From this number, 11 outcrops assayed between 100 to 1,915 ppb and 9 boulders assayed between 100 to 4,750 ppb. Details mapping and trenching were carried out to follow-up on 7 anomaly areas from 2005 campaign and geophysical survey. A total of 19 trenches were excavated totalizing 3,580 linear m and 380 rock samples were collected (331 grabs and 49 of 1 m intervals channel samples). Several trenches (9) assayed at least one value between 100 to 12,950 ppb. The best value was found in trench 1A (2,090 ppb gold with and > 10,000 ppm arsenic) and in trench 1E (one grab of 12,950 ppb gold and 527 ppm arsenic and a channel composite of 1.4 g/t Au across 16 m). Trench 1A is associated with the WB showing and trench 1E is associated with the JT Prospect (GM 63371).
Eastmain contracted Geotech Limited to carried out a helicopter-borne geophysical survey on the new claims added to the property. It included a time domain electromagnetic and magnetic survey. A total of 814.6-line km were flown on a 100 m spacing. Several EM anomaly groupings were identified (GM 63373).
2007
In 2007, Eastmain Resources contracted Abitibi Geophysics to complete a resistivity/induced polarization survey. A total of 267-line km was surveyed over the central area of the main grid and over JT Prospect. A gradient IP survey and a dipole-dipole configuration was carried out. The resistivity signature showed two distinctive resistivity unit split by a very conductive lineament interpreted as a major shear zone corridor (GM 64031).
A 9.2-line km grid was cut over JT to facilitate the IP survey. A mapping and prospecting survey was carried out on the property. The goal was to complete the regional mapping, to visit the previous gold and arsenic soil anomalies and the preliminary IP conductors. A total of 387 grabs were assayed and 10 samples return values between 30 and 1,130 ppb gold. Trenches was excavated to investigate firstly the JT Prospect and then to investigate geochemical, geophysical and geological target across the property. Several trenches were excavated for a total of 5,074-line-m split in 28 trenches and 3,391 channel samples. Visible gold was identified first the first time at JT (trench 1E) and some of the best channel composite graded 10.98 g/t over 3.0 m and 15.73 g/t over 2.0 m, 20.0 g/t over 2.0 m. Trench 1A (WB showing) return 7,950 ppb Au over 1.0 m (GM 64030).
Eastmain contracted L.E. Reed Geophysical Consultant Inc to interpret the VTEM and mag survey done on the property in the year 2005 and 2006. The interpretation confirms the existence of several conductor with some associated to mag anomalies (GM 64032).
Eastmain contracted Mehmet F. Taner to conduct a petrographic and mineralogical study. A total of 18 grab samples were analyzed under the microscope. The study confirmed the presence of alumino silicate as alteration in the metasediment. A brief look at the metamorphism mineralogy indicates an upper greenschist to amphibolite metamorphic grade on the property. No gold was found in the thin section and the assays return all below detection limit for those grab samples (GM 64033).
2008
In 2008, Eastmain began a drilling campaign on the Éléonore South property. A total of 3,129 m of drilling were done in 16 drill holes. From this number, 1,275 m were completed on the JT Prospect and 1,854 m were complete on other anomalies. A total of 2,750 core samples were collected and assayed for gold. Holes ES08-09 to ES08-13 drilled the JT Prospect and all intercepted gold value. Several assays return between 500 to 18,400 ppb gold. Holes ES08-15 and ES08-16 were drilled 4 km southeast of JT and tested anomalous rocks trenched and return few values between 550 to 4,980 pbb (GM 64367).
In 2008, Goldcorp mandated Inlandsis Consultant s.e.n.c. to carried a till survey to cover the whole Éléonore Property and part of the Éléonore South Property. Samples were collected at 100 m to 200 m spacing along lines distributed at every 1 km to 1.5 km. A total of 32 samples were collected on the north-west side of the property. Several anomalies of more than 0.1 ppm gold were identified (GM 65193).
2009
In 2009, Eastmain drilled a total of 3,697 m on the Éléonore South property split in 14 drill holes. Drilling was divided in 3 parts focusing on JT and WB showing and on regional geological, geophysical and geochemical anomalies. Multiple broad zones of anomalous gold and arsenic were intersected, and one composite calculated 0.54 g/t over 14 m gold. Total of 28 assayed intervals return more than 1 g/t gold with 2 samples over 9 g/t gold. Drilling on the WB showing confirm the continuation of the mineralization and one composite return 0.37 g/t over 24 m of gold. Two drill holes tested regional anomalies. One of the holes drilled at 2.5 km southeast of JT return a composite value of 0.93 g/t over 4 m with a peak value of 1.64 g/t over 1 m gold. During fall, Eastmain also completed a mapping and prospecting survey. A total of 64 grabs were collected and 2 samples return assays over 500 ppb (GM 65239).
2010
In 2010, Eastmain drilled a total of 3,622 m on the Éléonore South property split in 17 drill holes. Drilling was divided in 3 parts focusing on JT and WB showing and on regional geological, geophysical and geochemical anomalies. Drilling on JT intersected 15 intervals which contain greater than 1.0 g/t, with a maximum of 3.81 g/t gold. The JT Prospect remain open to the west, south and north. One hole was testing the south extension of the WB showing. Hole return one value of 0.79 g/t over 1.0 m. Three holes from the regional targeting located approximatively at 2.5 km and 4.5 km southeast of JT return value up to 2.41 g/t gold. A total of 90 grabs were collected during a mapping and prospecting campaign. Best value from the prospection survey returns 61 ppb gold (GM 65891).
2012
In the summer of 2012, Eastmain contracted Eagle Mapping from Coquitlam, British Columbia to conduct an aerial Light Detection and Ranging (LiDAR) survey over the Éléonore South property. The survey permits to delineate some structure to be tested in the future (GM 68093).
2016
In 2016, Azimut Exploration Inc. performed a prospection program to test several previously uncovered geochemical soil anomalies. Prospecting focused on the soil anomalies localized in the northern sector of the property and on the southeast side of JT just south of the Cheechoo discovery. A total of 448 samples were collected including 432 grabs samples from outcrops and boulders and 16 channel samples. Results return 48 samples with values over 1.0 g/t (grabs and channel). A total of 12 grab samples returned values between 11.65 to 247.0 g/t. The best channel composite return results of 19.22 g/t Au over 3.8 m, 7.85 g/t Au over 3.4 m, 49.18 g/t Au over 4.0 m and 50.37 g/t Au over 3.50m Gold is found in pegmatite and tonalite rocks and all the gold value but one were found east of the JT Prospect identified as the Moni Prospect (GM 71311).
In fall 2016, Azimut conducted a first phase drilling campaign and 2,509.6 m was drilled split in 12 holes. Drill holes were mostly targeting the Moni Prospect and the Cheechoo extension all return value values over 0.5 g/t with 10 assays over 2.5 g/t gold. Some of the calculated composites give value of 8.88 g/t gold over 2.5m, 0.83 g/t gold over 12.0 m, 5.0 g/t gold over 4.0 m and 0.76 g/t gold over 21.58 m. Two drill holes were targeting a linear high mag anomaly, and one assay return 0.1 g/t gold (GM 71346).
2017
In 2017, Azimut carried out a drilling program (second phase) contemporary to a prospecting and mapping survey. Phase 2 drilling program consists of 32 drill holes totalizing 7,176.2 m. Drill targets were selected from coincident geochemical and geophysical anomalies in the vicinity of the Cheechoo extension and Moni Prospect. All drill holes but 2 return gold values over 0.5 g/t and the best assay up to 68.8 g/t gold. Some of the best calculated composites give value of 4.74 g/t gold over 6.0 m and 3.75 g/t gold over 23.25 m (GM 71346).
In 2017, Azimut carried out a prospection survey and a total of 458 surface samples were collected and comprises 313 grabs samples, 82 channels on 17 trenches and 63 soil samples. The exploration program focused on the soil anomalies localized in the northern sector of the property and on the southeast side of JT just south of the Cheechoo discovery (on Moni Prospect and Cheechoo extension). The exploration program confirmed the presence of gold in many areas of the property. The best gold results returned 96.6 g/t Au over 1.0m from the Moni Prospect in a quartz-feldspar vein / Tonalite (channel R16) and 1,500 g/t Au from the Trench prospect from an angular boulder of quartz-feldspar±biotite and pegmatitic vein with native gold. The Trench prospect is situated just southwest of the Moni Prospect (GM 71972).
2018
In winter 2018, Azimut drilled 30 holes (28 new holes and 2 extension holes) for a total drilled of 5,448.6 m. Drill targets were collared on coincident geochemical and geophysical anomalies and based on the results from the 2017 prospection campaign. A total of 3,940 core samples were assayed for gold. Drilling campaign focused on the southwestern extension of the Cheechoo discovery, the Moni Prospect discovered in the Summer 2016 campaign, the Trench Prospect Iocated southwest of the Moni Prospect and an elongated E-W trending magnetic high to the south. Drilling from the southwestern Cheechoo extension return 32 values over 1.0 g/t. The best calculated composite in the tonalite assayed value of 2.02 g/t over 4.4 m, 2.50 g/t over 3.05 m and 2.44 g/t over 7.10 m. Drilling on the Moni Prospect return 100 values over 1.0 g/t. Some of the best intersect were obtained in the tonalite with calculated composite of 13.58 g/t over 2.5 m, 8.46 g/t over 8.4 m and 2.58 g/t over 7.8 m (GM 71647).
In the summer of 2018, Eastmain Resources Inc. carried out a stripping program to extend the exposure of the Moni Prospect and to expose the under explored west-south-west extension of Moni. A total of 9 trenches were dug and 2,352 m2 of rock were exposed and 225 samples were collected. Only 5 trenches on 9 were sampled due to lack of pegmatite dykes in some trenches. A total of 23 samples graded over 0.1 g/t gold and 2 graded over 1.0 g/t gold. Those 2 samples are found in trench TRES18-01 at the Moni Extension and return value of 2.18 g/t gold over 0.9 m and 2.5 g/t gold over 1.0 m (GM 73120).
In fall 2018, Eastmain conducted a first phase of drilling. A total of 7,216.4 m was drilled split in 27 holes. All drill holes return values over 0.1 g/t gold and 26 of them return value over 0.5 g/t gold. The campaign tested the JT Prospect with 4 holes and the others tested the Cheechoo southeast extension. In JT, the hole ES18-140 return one value of 28.3 g/t gold over 0.5 m in wacke and the hole ES18-141 return the best composite calculated of 0.64 g/t over 6.9 m. The Cheechoo Southeast Extension return value up to 84.0 g/t gold over 1.0 m and some of the best calculated composite return 3.8 g/t gold over 3.9 m, 3.5 g/t gold over 3.5 m and 22.4 g/t gold over 4.0 m (GM 73121).
In 2018, Les Mines Opinacas mandated Ios Services Géoscientifiques to carried a till survey to cover between the 2008 lines to evaluate the mineral potential in the Roberto deposit neighbourhood. Samples were collected at 200 m to 250 m spacing along lines distributed at every 1 km to 1.5 km. A total of 27 samples were collected on the north-west side of the property and 6 in the north-north-west side of the property. Gold grains count varied from 4 to 16 in the north-north-west side of the property and varied from 17 to 66 in the north-west side of the property both on normalized on 10 kg samples (GM 71452).
2019
In winter 2019, Eastmain conducted a second phase of drilling. A total of 4,708.5 m was drilled split in 14 holes and hole extension. The drilling campaign was achieved on the Cheechoo southeastern extension. All drill hole return value over 0.1 g/t gold and best assay graded 63.2 g/t gold on 1.0 m. Some of the best calculated composite return 8.7 g/t gold over 8.2 m and 12.7 g/t gold over 3.5 m (GM 73121).
In summer 2019, Eastmain carried out a field work survey with mapping, rock sampling, soil sampling and channel sampling. No excavator was available on-site in 2019. Chennel sampling was executed on 2018 trenches and on outcrops. The objective of the campaign was to identify new prospective areas for further work. In total, 1,299 rock samples, 130 channel samples and 1,744 A-B-C-horizon soil samples were collected. The soil samples were collected every 50 m with an interline spacing of 400 m and were then analyzed by XRF at the Eastmain Éléonore South coreshack. The XRF study permit to identified 5 geochemical signature and a new geological map was interpreted. A total of 9 rocks sample return values between 0.114 and 0.828 ppm gold. Sample are found in the extreme north, West, and south-west of the property and south of the Cheechoo tonalite. Mapping on the property permit to recognize several geological units as felsic intrusion, sediments and mafic volcanic. The channel sampling was done in the Moni trend to follow-up on 2018 anomalies. In total 57 samples return values over 0.1 g/t and 6 return value over a 1 g/t. The best values are associated with the Bill zone and the 101 zone and vary between 1.285 and 5.426 g/t (GM 73381).
|
5.1 |
Historical Drilling |
All drilling on the Project to date has been completed to an acceptable standard following CIM guidelines and industry best practices including the use of a robust QA/QC program. Thus, the drilling is discussed in detail in Section 7 of this report.
|
5.2 |
Past Production |
There has been no previous production from the Project.
|
6 |
Geological Setting and Mineralization |
|
6.1 |
Regional Geology |
The Éléonore South property is in the northeastern part of the Archean Superior Province (4.3-2.6 Ga; Percival et al., 2012), in a region comprising both the La Grande and Opinaca Subprovinces. Both subprovinces were largely constructed and metamorphosed during a series of micro-continent collisions formerly known as the “Kenoran Orogeny” (ca. 2,720-2,660 Ma; Card, 1990; Percival et al., 2012). The property is entirely enclosed in the southwestern part of the La Grande Subprovince known as the Eastmain River domain at proximity of the boundary with the Opinaca Subprovince. This proximity with the Opinaca boundary is considered highly prospective for various types of gold mineralization along both north and south portions of the contact exemplified by the Éléonore and Eastmain mines, and several exploration projects such as Corvet Est, Poste Lemoyne and La Grande Sud (Figure 3).
The La Grande Subprovince (LGSP) is a volcano-plutonic ensemble consisting of an ancient gneissic tonalite-trondhjemite-granodiorite basement (3.45-2.75 Ga), upon which developed supracrustal sequences (2.88-2.69 Ga) and important felsic to intermediate plutonism, generally late to post-volcanism (ca. 2.72-2.67 Ga; Parent, 2011). Volcano-sedimentary sequences are intercalated and crosscut by syn- to post-volcanic ultramafic to felsic dykes and sills. The subprovince is characterized by E-W trending planar fabrics and dome and basin structures locally controlled by large competent felsic intrusions. South-verging east-plunging folds affect structures. Metamorphic conditions in the LGSP locally vary from the green schist facies in the west to the granulite facies in its eastern end, bordering the Ashuanipi Subprovince. Regionally, lower to middle amphibolite conditions are most prominent (e.g. Gauthier et al., 2007; Percival et al., 2012). The LGSP is further subdivided in a northern La Grande River Domain and southern Eastmain River Domain, which comprises the Éléonore South project. The Eastmain River Domain supracrustal rocks consist of four distinct volcanic cycles of tholeiitic to locally calc-alkaline affinity (2,752-2,703 Ma; Moukhsil et al., 2003; Bandyayera et al., 2010) overlain by wacke, conglomerate and iron-rich bands. Late-tectonic pegmatites and small felsic plutons are ubiquitous in low volumes throughout the subprovince (ca. 2,620-2,600 Ma) (Figure 2).
The Opinaca Subprovince (OPSP) is a meta-sedimentary and plutonic ensemble that originated as a large Neoarchean clastic basin deposited shortly after 2.70 Ga (e.g. Davis et al., 1990; Percival et al., 1992; Morfin et al., 2013, 2014) at the margins of the LGSP, and rapidly buried. It is dominated by high metamorphic grade meta-wacke with minor meta-pelite bands having undergone various degrees of partial melting, while simultaneously being injected by syn- to late-tectonic granitic (to tonalitic and monzonitic) intrusions. It also contains rare mafic meta-volcanites and tonalitic basement in its core and intermediate volcanites, conglomerates and iron formations at its margins. The OPSP is in general distinctly younger, but some of its deposition is coeval to late volcano-sedimentary activity in the LGSP. It is a structural ensemble of ovoid domes and basins (Bandyayera et al., 2010) and east-plunging south-verging open folds (Goutier et al., 2002). High metamorphic conditions (upper amphibolites to granulites) have prevailed and anatexis is widespread. The prevalence of partial melting has largely obliterated primary structures, polarity and early to syn-anatexis deformation structures. Neoarchean and Paleoproterozoic mafic dyke swarms (< 2,515 Ma; Hamilton, 2009) cut both LGSP and OPSP lithologies in a N-S to NW-SE fashion (Figure 2).
The nature of the boundary between the LGSP and OPSP varies according to location from sheared and thrusted to discordant, or heavily intruded. It is defined by a variably steep increase in metamorphic grade which is reflected by high aeromagnetic anomalies and the onset/spread of migmatization. It is not clear whether this transition corresponds to a gap in metamorphic grade along the boundary, to a gradual steep variation, to a change to more fertile protolith composition, or a combination thereof. In the close vicinity of the property, the contact is heavily intruded by the late granite-granodiorite-pegmatite of the Janin Suite (Bandyayera & Fliszár, 2007).
Present day structures and mineral assemblages are the result of polyphase metamorphism and tectonism in the region. Pre-volcanism amphibolite-grade metamorphism has affected the TTG-suite gneisses of the LGSP. However, a later regional amphibolite-grade metamorphism responsible for the main fabrics must postdate volcano-sedimentary belts (2,880-2,690 Ma), while predating cross-cutting intrusions (among which the Duncan Suite, 2,716-2,709 Ma; Goutier et al., 2002). All evidence points towards this main episode being a continuous process ranging at least ca. 2.72-2.69 Ga, and possibly before. Metamorphism in the OPSP corresponds to a long-lived anatexis event (ca. 2,670-2,640 Ma), interpreted as bipulsive, and coeval with heavy leuco-granite intrusion (Wodicka et al., 2009; Morfin et al., 2013, 2014). The main source of granite is likely partial melting from other sediments. High-temperature, low-pressure metamorphic assemblages are consistent with underplated thinned lower-crust conditions. Syn-metamorphic felsic intrusions have commonly mingled with in situ leucosomes, making the subprovince a melt-enriched granulite terrane, i.e. an injection complex (Simard & Gosselin, 1999; Morfin et al., 2013). There is evidence for subsequent late lower-grade metamorphism in the LGSP (ca. 2,620 – 2,600 Ma), coeval with late plutonism. Final cooling is estimated around 2,600 Ma (Goutier et al., 2002), synchronous to the last generation of pegmatite dykes. “Successive” phases in volcanism, sedimentation and tectono-metamorphism are commonly shown to overlap and to be long-lasting, implying a complex protracted history. Gold mineralizing events seem widespread throughout this history.
These main events and the processes that lead to the current juxtaposition of the LGSP and OPSP have been linked to different tectonic models by various authors: (i) collisions between early continents through north-dipping subduction zones separated by accretion prisms (Card, 1990; Percival et al., 2012), (ii) thrusting over the OPSP sediments of its depositional basement (Gauthier et al., 1996, Gauthier & Larocque, 1998), (iii) an extensive basin affected by metamorphism via heat from underplating and final thrusting of the OPSP over the LGSP (Cadéron et al, 2003) and (iv) large scale exhumation of a metamorphic core complex (Sawyer & Barnes, 1994; Bandyayera et al., 2010).
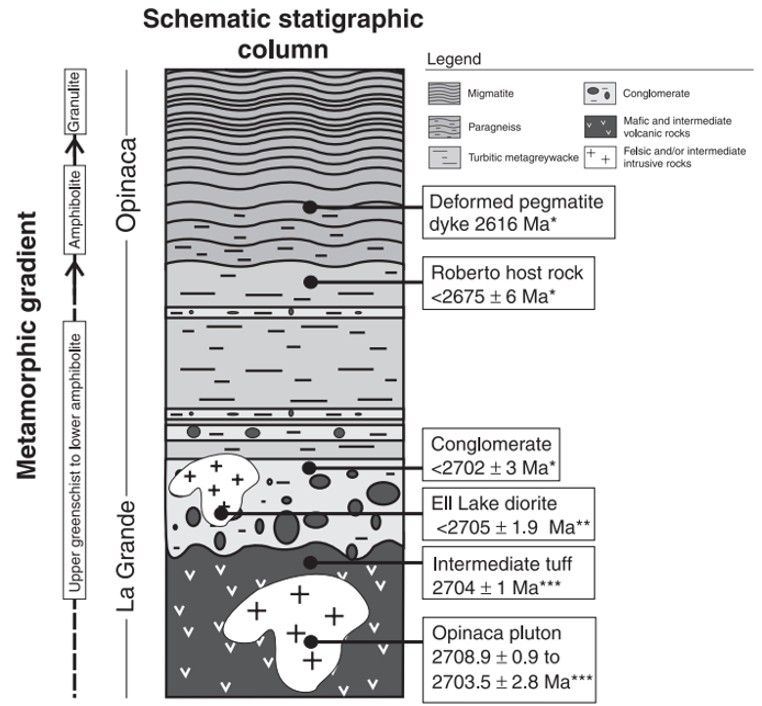
Figure 2: Regional stratigraphic column after Ravenelle et al., 2010.
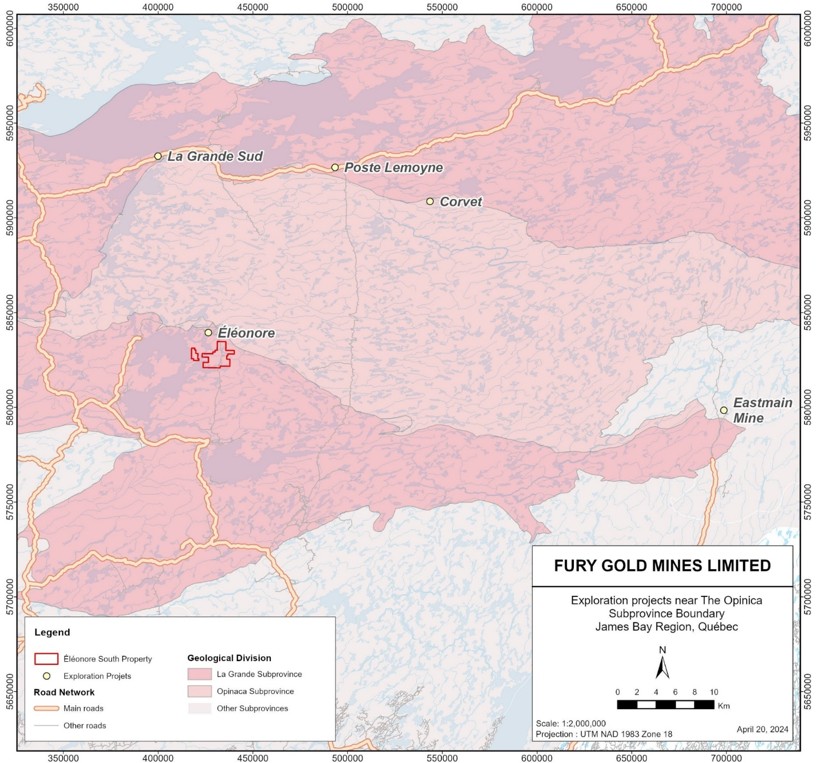
Figure 3: Strategic location of several projects according to the proximity with the Opinaca boundary.
|
6.2 |
Property Geology |
The Éléonore South property is characterized by the widespread presence of metasedimentary rocks and felsic intrusions. (Figure 3) The northern part of the main block consists almost exclusively of the LGSP Low Formation (which has in the past been attributed to the OPSP). The Low Formation comprises essentially variably recrystallized tubiditic biotite meta-wacke along with minor aluminous porphyroblasts bearing meta-pelite bands, conglomerates and iron formations. Its deposition is poorly constrained due to a complex history resulting in apparently conflicting dates. The Ell Lake diorite (2,706±2 Ma, Fontaine et al., 2017) intrudes the sediments, setting a local minimum age for consolidation, while sedimentation is locally thought to have kept going well after 2,700 Ma (Bandyayera et al., 2010; Ravenelle, 2013). However, some parts were deposited as early as shortly after 2,714 Ma. (Bandyayera et al., 2010) The sediments were therefore likely deposited in a tectonically active basin with magma intruding barely consolidated sedimentary rocks, while some parts were still sedimenting. Proximity and similarity in composition and chronology suggest that the Low Formation could represent a more proximal lower grade extension of the Laguiche basin (OPSP).
The Low Formation in the northern part of the property hosts various late felsic intrusions, most notoriously the Au-mineralized Cheechoo tonalite (2,612±1 Ma; Fontaine et al., 2015), which covers approximately 4 km2. Many pegmatitic dykes and plutons also intrude the property, such as the Asimwakw pegmatite (2,616±6 Ma; Ravenelle et al., 2010). Many smaller scale dykes may intrude any lithology. Similar pegmatite dykes to those observed throughout the property have been dated 15 km north at Éléonore Mine over a timespan covering 2,620-2,603 Ma (Dubé et al., 2011). A portion of the pegmatites are syn- to post-mineralization as many dykes intrude the Cheechoo tonalite. The southern part of the main block consists mainly of felsic intrusions representing the different facies of the tonalitic to granodioritic Uskawasis Pluton (Moukhsil et al., 2003; Bandyayera et al., 2010). The smaller western block is characterized by mafic volcanic rocks of the Kasak Formation (2,704±1 Ma; David et al., 2010) wrapping around the eastern end of the coeval Opinaca Pluton (2,703-2,708 Ma; Bandyayera et al, 2010).
The metamorphic grade on the property increases towards the contact with the Opinaca Subprovince to the east. The greywackes are observed evolving to paragneiss then to migmatites with increasing metamorphic grade. On the property the general metamorphic grade is attributed to the Iower amphibolite facies.
Figure 4: Property Geology
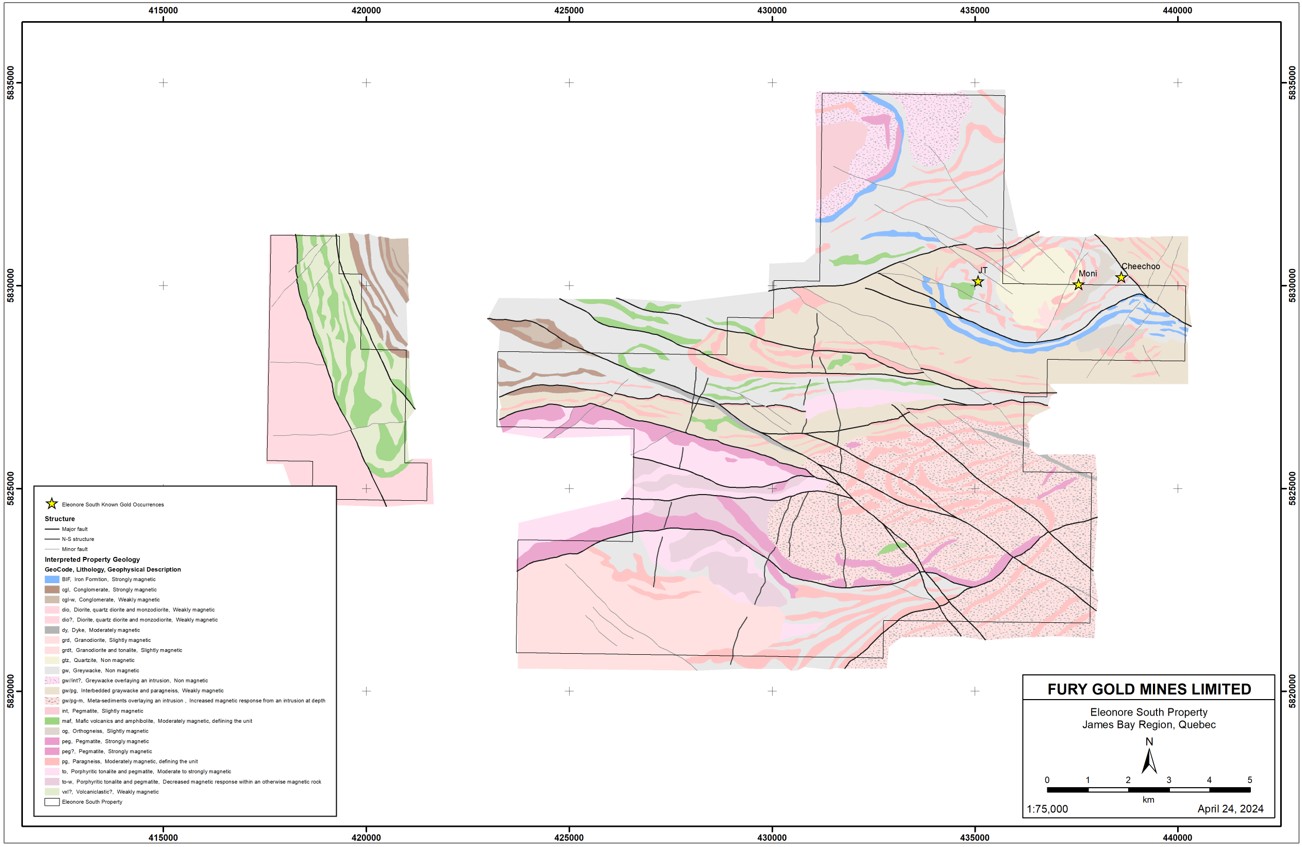
|
6.3 |
Mineralization |
|
6.3.1 |
Regional Mineralization |
Fontaine et al. (2017) indicate that: "The Eeyou Istchee James Bay municipality was always considered less prolific for major gold discoveries than the Abitibi region mainly because of the scarcity of greenstone belts and presence of high-grade metamorphism. Conceptual models, including potentiel for porphyry systems, and influence of metamorphic gradients on hydrothermal fluid circulation were tested by Virginia Gold Mines near a Cu-Ag-Au-Mo showing hosted by the Ell Lake diorite and discovered by Noranda in 1964. A trail of mineralized boulders, including one that provided a grab sample at 22.9 g/t Au, was identified in 2002, and followed up-ice to the source area, leading to the discovery of the Roberto deposit (Éléonore Mine) in 2004 (Figure 2).
The Roberto gold deposit is hosted in overturned turbidic sedimentary rocks of the Low Formation that are intruded by a series of syn- to post-tectonic intrusions, including pegmatites. The sedimentary rocks and most probably the ore, are metamorphosed to amphibolite facies. Some horizons in the sequence are interpreted as metasomatic replacement; diopside, tourmaline, microcline and alumino-silicates are typical proximal alteration minerals.
Gold mineralization is mainly hosted by thin-bedded greywacke at the stratigraphic top of the Low Formation and is characterized by potassium and magnesium-bearing metasomatic alteration halo and an outer calcium-bearing halo. The main ore zones are deformed, and the bulk of the mineralization occurred before the emplacement of the pegmatite. The main style of mineralization (up to 25.0 g/t Au over 20.0m) consists of a stockwork of quartz-sulphide veinlets and reddish-brown replacement zones, other styles of mineralization and alteration also occur. Gold has been intersected in pegmatite at depth.
Since the discovery of the Roberto deposit in 2004, the turbidite succession of the Low Formation and the La Grande — Opinaca Subprovinces litho-tectonic contact have become prime exploration targets in the James Bay region.
The structural, magmatic and metamorphic history interpreted at the deposit support a long-lived hydrothermal and mineralizing event occurred. The Éléonore South property is located in a similar geological setting.
The Cheechoo gold discovery of Sirios Resources is located approximately 200 m from the Éléonore South's northeastern property boundary. The tonalite which hosts the gold mineralization at Cheechoo is silicified and albite rich, with moderate to strong parallel quartz veining (cm-sized veins or veinlets), and very low sulphide content (< 1%, pyrrhotite-arsenopyrite-pyrite). It shows variable amounts of amphibole, biotite, chlorite, diopside, and tourmaline. Scheelite also occurs along fractures in the tonalite. Free gold occurs in both silicified tonalite and in the metasedimentary host rocks. This tonalite body and its contact with the encasing metasedimentary rocks extends onto the Éléonore South property.
The Cheechoo Deposit is host to an Indicated resource of 1.4Moz Au at a grade of 0.94 g/t Au as well as an inferred resource of 0.49Moz Au at a grade of 0.73 g/t Au (Richard et. Al., 2022) resulting in an average grade of 0.87 g/t Au.
|
6.3.2 |
Property Mineralization |
Two distinct styles of mineralization have been identified to date; structurally controlled quartz veins hosted within sedimentary rocks similar to the high-grade mineralization observed at the Éléonore Mine; and intrusion-related disseminated gold mineralization similar to that seen at the low-grade bulk tonnage Cheechoo deposit with higher grade potential as seen at the JT and Moni Prospects on the project (Table 3).
Table 2 - Characteristics of Mineralization Identified at Éléonore South
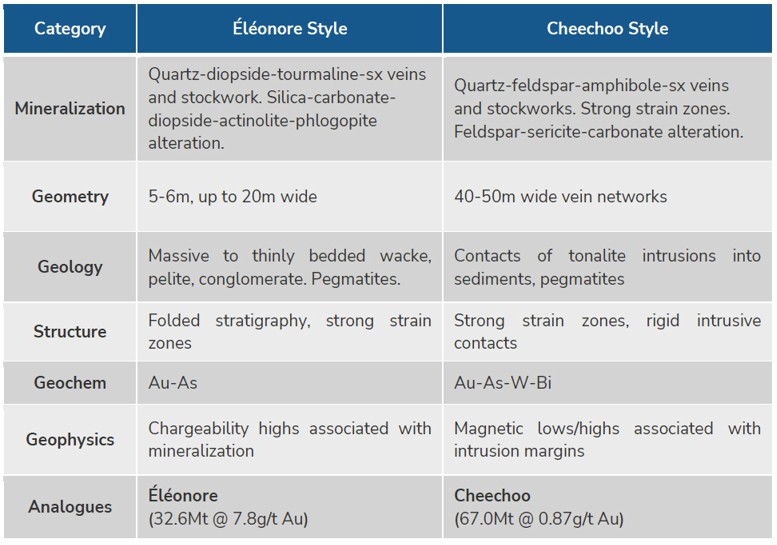
|
6.4 |
Deposit Types |
|
6.4.1 |
Reduced Intrusion-Related Gold Deposits |
Hart, 2007, described Reduced Intrusion Related Gold Systems (RIRGS) as:
RIRGS are distinct from intrusion-related Au deposits as defined by Sillitoe (1991,1995). The RIRGS are a distinct class that lacks anomalous Cu, have associated W, low sulphide volumes, and a reduced sulphide mineral assemblage, and that are associated with felsic, moderately reduced (ilmenite-series) plutons; whereas oxidized intrusion-related Au deposits are mostly Au-rich (or relatively Cu-poor) variants of the porphyry Cu deposit model associated with mafic, oxidized, magnetite-series plutons. Therefore, within the intrusion-related clan, two different types of Au mineralizing systems can be identified using the prefixes “reduced” and “oxidized”.
The magmas have a reduced primary oxidation state that forms ilmenite-series plutons. This reduced state causes associated sulphide assemblages to be characterized by pyrrhotite, and quartz veins that host methane-rich inclusions. RIRGS mostly form at a depth of 5 km to 7 km and generate mineralizing fluids that are low salinity, aqueous carbonic in composition and are, therefore, unlike typical porphyry Cu deposits.
The grades of individual veins are 5 g/t Au to 50 g/t Au within otherwise barren host rocks, thus yielding ~1 g/t. Gold grade is, therefore, mainly controlled by vein density. Whereas Fort Knox and Dublin Gulch have similar overall grades, The low-grade mineralization at Fort Knox is enriched by higher-grade and overprinting, late-stage quartz shear veins. Sheeted vein arrays also occur at deposits such as Brewery Creek (Classic Zone), Dolphin, Shotgun, and Gil, but are not the main mineralization hosts because each deposit has other features that control grade distribution.
The RIRGS are best developed in and surrounding the apices of small, cylindrical-shaped plutons that intruded sedimentary or metasedimentary country rocks. Intrusion-hosted mineralization is preferentially sited in tensional zones that develop in the pluton’s brittle carapace near the country rock contact.
Pluton size is important because batholiths are unlikely to develop into mineralizing systems. The RIRGS are generally well developed, surrounding small (< 2 km2) isolated plutons with mineralization in the intrusion and in the hornfelsed thermal aureole. Larger plutons (2–10 km2) may have apophyses or later phases that are preferentially mineralized. Roof zones immediately above plutons may also be mineralized, in particular where there is a large surface area of contact between the pluton and reactive country rocks.
Pluton geometry is also important. Elongate plutons reflect structural controls on pluton emplacement and indicate a dominant extensional direction that may be important for localizing later mineralization. Cylinder-shaped plutons with steep sides and domed or cupola-like roofs are preferred geometries because these features enhance fluid focusing. Sharp shoulders also provide regions of structural and rheological contrast that may enhance development of fluid focusing structures (Stephens et al., 2004).
Depth of pluton emplacement may be a feature critical to RIRGS formation. These systems generally lack multidirectional, interconnected vein stockworks that are characteristic of porphyry deposits. This is likely due to their deeper levels of emplacement (5-9 km; Baker and Lang, 2001; Mair et al., 2006a), whereby the increased confining pressure prevents rapid fluid exsolution and explosive pressure release, and the development of high permeability stockworks and breccias. As well, the depth precludes the entraining of significant volumes of meteoric water and the formation of broad alteration haloes. As a result, fluid flow and mineralization in most RIRGS systems is largely controlled by structural features that impinge on the thermally driven hydrothermal system (Hart et al., 2000b; Stephens et al., 2004; Mair, 2004).
The dominant structural control on RIRGS is a weak extension that forms arrays of parallel fractures in the brittle carapace, filled with thin (0.1–5 cm), auriferous, low-sulphide quartz veins that form extensive, intrusion-hosted sheeted arrays. Hornfels quartzite forms a brittle host lithology for mineralized quartz veins that range from shattered “stockworky” fractures to veins several m in width (O’Dea et al., 2000). Solitary fracture, fissure, and shear-hosted veins occur in the pluton, in the hornfels, and as far as several kilometres from the pluton, and may fill structures that were active while creating space during pluton emplacement (Stephens et al., 2004).
The RIRGS genetic model requires that the mineralization-generating cooling pluton reach volatile saturation and that a fluid exsolve from the melt. Metals and volatiles such as sulphur and halogens presumably preferentially partition from the melt into an exsolving aqueous-carbonic mineralized fluid phase. Pressure, or depth of emplacement, exerts the greatest control on volatile saturation, particularly because volatiles are easily dissolved in felsic melts under higher pressures (Burnham and Ohmoto, 1980). However, volatile saturation is also induced by magmatic processes such as fractional crystallization, magma mixing, or simple cooling. Pluton emplacement depth appears, therefore, to be critical and explains why RIRGS are typically associated with a specific suite of plutons distributed over a broad area; such plutons likely represent melt crystallization at the same general crustal level.
At the pluton scale, mineralization is limited to regions above and outward from the site of volatile saturation. Being less dense than the melt, fluids will migrate to the uppermost parts of the less viscous portion of the magma chamber, which is usually the volatile-rich magmatic cupola immediately under the earlier-formed carapace (Candela and Blevin, 1995). Fluids will invade fractures in the carapace and opportunistically leak into and react with adjacent country rocks. Mineral occurrences are, therefore, most commonly sited at the pluton’s apex, in the igneous carapace, or in hornfelsed country rocks adjacent to and above the pluton. The host plutons to many RIRGS likely have magma volumes that are too small to provide the large amount of metals and volatiles contained in these deposits, thereby suggesting the participation of larger volumes of primary magmatic fluids and metals (Candela and Piccoli, 2005). These could include deeper unexposed batholiths or mafic lamprophyric melts.
|
6.4.2 |
Greenstone-hosted Quartz Carbonate Vein Deposits |
The following description of Greenstone-hosted quartz–carbonate vein deposits is extracted from Dubé and Gosselin (2007).
Greenstone-hosted quartz-carbonate vein deposits are structurally controlled, complex epigenetic deposits that are hosted in deformed and metamorphosed terranes. They consist of simple to complex networks of gold-bearing, laminated quartz-carbonate fault-fill veins in moderately to steeply dipping, compressional brittle-ductile shear zones and faults, with locally associated extensional veins and hydrothermal breccias. They are dominantly hosted by mafic metamorphic rocks of greenschist to locally lower amphibolite facies and formed at intermediate depths (5-10 km). Greenstone-hosted quartz-carbonate vein deposits are typically associated with iron-carbonate alteration. The relative timing of mineralization is syn- to late- deformation and typically post-peak greenschist-facies or syn-peak amphibolite facies metamorphism.
Gold is mainly confined to the quartz-carbonate vein networks but may also be present in significant amounts within iron-rich sulphidized wall rock. Greenstone-hosted quartz-carbonate vein deposits are distributed along major compressional to transpressional crustal-scale fault zones in deformed greenstone terranes of all ages, but are more abundant and significant, in terms of total gold content, in Archean terranes. However, a significant number of world-class deposits (>100 t Au) are also found in Proterozoic and Paleozoic terranes.
The main gangue minerals in greenstone-hosted quartz-carbonate vein deposits are quartz and carbonate (calcite, dolomite, ankerite, and siderite), with variable amounts of white micas, chlorite, tourmaline, and sometimes scheelite. The sulphide minerals typically constitute less than 5 to 10% of the volume of the orebodies. The main ore minerals are native gold with, in decreasing amounts, pyrite, pyrrhotite, and chalcopyrite and occur without any significant vertical mineral zoning. Arsenopyrite commonly represents the main sulphide in amphibolite-facies rocks and in deposits hosted by clastic sediments. Trace amounts of molybdenite and tellurides are also present in some deposits.
This type of gold deposit is characterized by moderately to steeply dipping, laminated fault-fill quartz- carbonate veins in brittle-ductile shear zones and faults, with or without fringing shallow-dipping extensional veins and breccias. Quartz vein textures vary according to the nature of the host structure (extensional vs. compressional). Extensional veins typically display quartz and carbonate fibres at a high angle to the vein walls and with multiple stages of mineral growth, whereas the laminated veins are composed of massive, fine-grained quartz. When present in laminated veins, fibres are subparallel to the vein walls.
Individual vein thickness varies from a few centimetres up to 5 m, and their length varies from 10 up to 1,000 m. The vertical extent of the orebodies is commonly greater than 1 km and reaches 2.5 km in a few cases.
The gold-bearing shear zones and faults associated with this deposit type are mainly compressional and they commonly display a complex geometry with anastomosing and/or conjugate arrays. The laminated quartz-carbonate veins typically infill the central part of, and are subparallel to slightly oblique to, the host structures. The shallow-dipping extensional veins are either confined within shear zones, in which case they are relatively small and sigmoidal in shape, or they extend outside the shear zone and are planar and laterally much more extensive.
Stockworks and hydrothermal breccias may represent the main mineralization styles when developed in competent units such as the granophyric facies of differentiated gabbroic sills, especially when developed at shallower crustal levels. Ore-grade mineralization also occurs as disseminated sulphides in altered (carbonatized) rocks along vein selvages. Due to the complexity of the geological and structural setting and the influence of strength anisotropy and competency contrasts, the geometry of vein networks varies from simple (e.g. Silidor deposit), to fairly complex with multiple orientations of anastomosing and/or conjugate sets of veins, breccias, stockworks, and associated structures. Layer anisotropy induced by stiff differentiated gabbroic sills within a matrix of softer rocks, or, alternatively, by the presence of soft mafic dykes within a highly competent felsic intrusive host, could control the orientation and slip directions in shear zones developed within the sills; consequently, it may have a major impact on the distribution and geometry of the associated quartz-carbonate vein network. As a consequence, the geometry of the veins in settings with large competence contrasts will be strongly controlled by the orientation of the hosting bodies and less by external stress. The anisotropy of the stiff layer and its orientation may induce an internal strain different from the regional one and may strongly influence the success of predicting the geometry of the gold-bearing vein network being targeted in an exploration program.
The veins in greenstone-hosted quartz-carbonate vein deposits are hosted by a wide variety of host rock types; mafic and ultramafic volcanic rocks and competent iron-rich differentiated tholeiitic gabbroic sills and granitoid intrusions are common hosts. However, there are commonly district-specific lithological associations acting as chemical and/or structural traps for the mineralizing fluids as illustrated by tholeiitic basalts and flow contacts within the Tisdale Assemblage in Timmins. A large number of deposits in the Archean Yilgarn craton are hosted by gabbroic (“dolerite”) sills and dykes as illustrated by the Golden Mile dolerite sill in Kalgoorlie, whereas in the Superior Province, many deposits are associated with porphyry stocks and dykes. Some deposits are also hosted by and/or along the margins of intrusive complexes (e.g. Perron-Beaufort/North Pascalis deposit hosted by the Bourlamaque batholith in Val d’Or. Other deposits are hosted by clastic sedimentary rocks (e.g. Pamour, Timmins).
The metallic geochemical signature of greenstone-hosted quartz-carbonate vein orebodies is Au, Ag, As, W, B, Sb, Te, and Mo, typically with background or only slightly anomalous concentrations of base metals (Cu, Pb, and Zn). The Au/Ag ratio typically varies from 5 to 10. Contrary to epithermal deposits, there is no vertical metal zoning. Palladium may be locally present.
At a district scale, greenstone-hosted quartz-carbonate vein deposits are associated with large-scale carbonate alteration commonly distributed along major fault zones and associated subsidiary structures. At a deposit scale, the nature, distribution, and intensity of the wall-rock alteration is controlled mainly by the composition and competence of the host rocks and their metamorphic grade.
Typically, the proximal alteration haloes are zoned and characterized – in rocks at greenschist facies – by iron-carbonatization and sericitization, with sulphidation of the immediate vein selvages (mainly pyrite, less commonly arsenopyrite).
Altered rocks show enrichments in CO2, K2O, and S, and leaching of Na2O. Further away from the vein, the alteration is characterized by various amounts of chlorite and calcite, and locally magnetite. The dimensions of the alteration haloes vary with the composition of the host rocks and may envelope entire deposits hosted by mafic and ultramafic rocks. Pervasive chromium- or vanadium-rich green micas (fuchsite and roscoelite) and ankerite with zones of quartz-carbonate stockworks are common in sheared ultramafic rocks. Common hydrothermal alteration assemblages that are associated with gold mineralization in amphibolite-facies rocks include biotite, amphibole, pyrite, pyrrhotite, and arsenopyrite, and, at higher grades, biotite/phlogopite, diopside, garnet, pyrrhotite and/or arsenopyrite, with variable proportions of feldspar, calcite, and clinozoisite. The variations in alteration styles have been interpreted as a direct reflection of the depth of formation of the deposits.
The alteration mineralogy of the deposits hosted by amphibolite-facies rocks, in particular the presence of diopside, biotite, K-feldspar, garnet, staurolite, andalusite, and actinolite, suggests that they share analogies with gold skarns, especially when they (1) are hosted by sedimentary or mafic volcanic rocks, (2) contain a calc-silicate alteration assemblage related to gold mineralization with an Au-As-Bi-Te metallic signature, and (3) are associated with granodiorite-diorite intrusions.
Canadian examples of deposits hosted in amphibolite-facies rocks include the replacement-style Madsen deposit in Red Lake and the quartz-tourmaline vein and replacement-style Eau Claire deposit in the James Bay area.
|
7 |
Exploration |
|
7.1 |
Soil Sampling |
The soil sampling program was designed to define discrete targets within the broad historic five and a half kilometer gold in soil anomaly. The survey successfully identified nine discrete gold and associated pathfinder element anomalies (Figure 5).
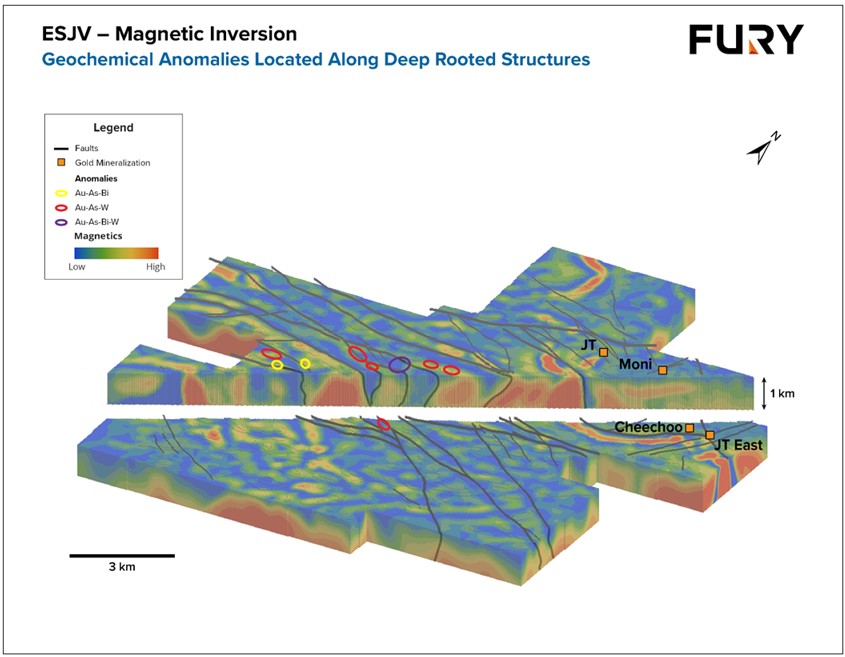
Figure 5: Geochemical Targets situated along deep-rooted structures.
As part of the 2021 exploration program, the Company reinterpreted and inverted historical magnetic geophysical surveys that demonstrated the nine discrete gold in soil anomalies were centered on an east-west structural corridor that separates intrusives to the south and sediments to the north. The importance of this new structural framework is that the newly defined discrete gold in soil anomalies are located along deep-rooted structures clearly visible in the geophysical data (Figure 5).
|
7.1.1 |
Soil Sampling Methodology |
Soil samples were collected for the B-horizon within a predefined grid with a spacing of 50 metres along 100 metre spaced line for overall coverage of 50 x 100 metres. Samples are screened using 180um screen analyzed for gold and multi-element using 50g (or 25g where is not enough material) nominal weight trace level method by aqua regia extraction and ICP-MS finish method (AuME-TL44 or AuME-TL44) on a -180um fraction. QA/QC programs using internal standard samples, field and lab duplicates, re-assays, and blanks indicate good accuracy and precision in a large majority of standards assayed.
|
7.2 |
Biogeochemical Sampling |
A biogeochemical sampling survey designed to target an interpreted fold nose within the Low Formation sediments in an area where conventional soil or till sampling was not possible due to the ground conditions was completed in the summer of 2024. The targeted area exhibited similar geological, geophysical, and structural characteristics to those present at the nearby Éléonore Mine. Six priority drill targets across over 3 kilometres (km) of prospective folded sedimentary stratigraphy have been identified (Figure 6). These six targets encompass multi point gold anomalies above the 90th percentile of the data and correlate with moderate pathfinder elemental anomalies, most notably arsenic which is associated with gold mineralization at the Éléonore Mine.
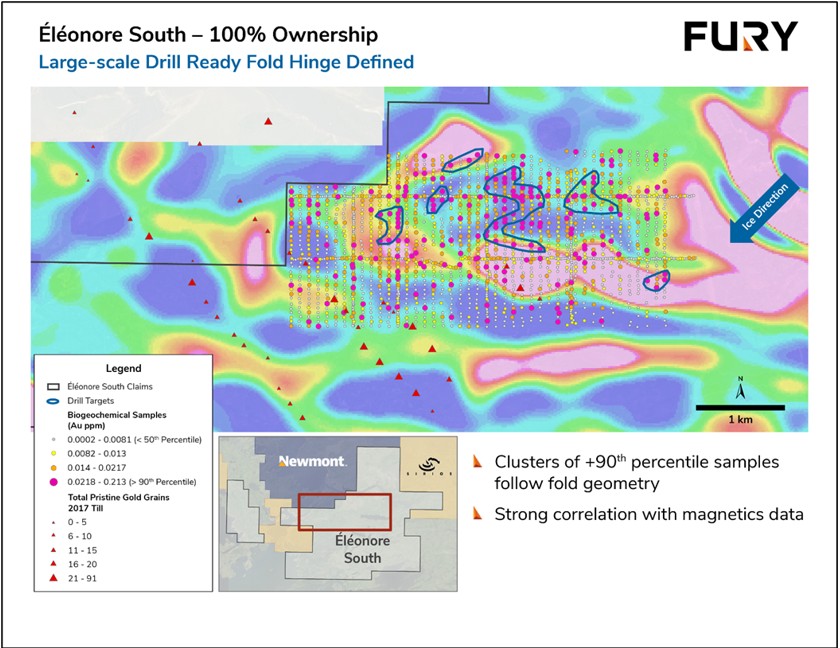
Figure 6: Biogeochemical Sampling Results
|
7.2.1 |
Biogeochemical Methodology |
A total of 2,106 biogeochemical samples were collected at 50 m intervals along 100 m spaced north-south oriented survey lines covering an area of 4.2 x 1.9 km. The survey was designed to infill on anomalies identified in an orientation level survey announced earlier this year as well as to test the core of the interpreted fold. The sampling lines were oriented perpendicular to the trend of the prospective lithologies and structures to determine the applicability of the technique in a swamp covered area. Approximately 200 g of black spruce twigs was collected at each sample site by hand. Samples were collected preferentially from healthy trees approximately of the same age and height. Samples were placed in a numbered cloth sample bag, with a sample tag placed inside the bag. The bags were tied shut. Sample data was recorded in field data loggers. At camp, samples were organized and hung to dry prior to shipping to ALS in Vancouver for gold and multi-element analysis.
|
7.3 |
Drilling |
At total of 37,816 m of drilling in 164 drill holes has been completed on the Property (Table 4). Drilling has largely focussed on the Moni - JT trend and successfully defined two zones, 2,000 m x 750 m at Moni and 1,200 m x 500 m at JT, of lower-grade intrusion related gold mineralization similar to that of the Cheechoo gold deposit. The Moni trend comprises the Cheechoo Southwest Extension and JT Prospect comprises the WB Prospect. Within the lower-grade gold mineralization halo, there are a series of structurally controlled quartz vein stockworks which host significantly higher grades of gold.
Table 3 - Summary of drilling on the Éléonore South Project
|
Year |
Company |
Hole Type |
Drillhole Count |
Lenght Drilled (m) |
Sample Count |
|
2008 |
Eastmain |
DDH |
16 |
3,131 |
3,158 |
|
2009 |
Eastmain |
DDH |
14 |
3,697 |
3,709 |
|
2010 |
Eastmain |
DDH |
17 |
3,581 |
3,476 |
|
2016 |
Azimut |
DDH |
12 |
2,510 |
1,470 |
|
2017 |
Azimut |
DDH |
32 |
7,179 |
4,889 |
|
2018 |
Azimut |
DDH |
31 |
5,793 |
3,938 |
|
2018 |
Eastmain |
DDH |
27 |
7,216 |
5,247 |
|
2019 |
Eastmain |
DDH |
15 |
4,709 |
2,859 |
|
2024 |
Fury |
DDH |
7 |
2,331 |
1,712 |
|
Total |
164 |
37,816 |
28,746 |
||
|
Fury total |
7 |
2,331 |
1,712 |
|
7.3.1 |
2008 – 2010 Eastmain Resources Inc. Drilling |
Between 2008 and 2010 Eastmain completed 10,409 m of diamond core drilling in 47 drill holes (table 4). Hole identification is from ES08-001 to ES10-047. The drilling was completed on the JT Prospect within an area measuring approximately 2,200 m north-south and 800 m east-west on Moni Trend (3 holes) and on the regional anomalies east and north of the property (Figure 5). At JT, the drilling pattern was designed to intersect gold mineralization intersected in the JT trenches. The majority of boreholes were drilled with a dip of 45 degrees and rarely between -45 to -75 degrees, and an azimuth between 85 to 110 degrees on JT, 315 degrees on Moni and various direction on the regional drilling.
The JT spacing drilling is variable between 50 to 200 m. Mineralization is found on a 1.2 km trend north-south and still open at depth. Example of open zone at depth are intersected in hole ES09-023 with a composite of 1.50 g/t gold avec 9.0 m (Table 5) and included 9.22 g/t over 0.5 m (table 6), ES09-022 with a composite of 1.18 g/t gold and included 9.08 g/t over 0.5 m).
From the first 3 holes drilled in the Moni trend (Figure 6) one returns a composite of 0.74 g/t over 5.0 m (Table 7)
Table 4 - 2008-2010 Eastmain Resources Inc. Drilling - JT Gold Composite
|
Drill Hole |
From (m) |
To (m) |
Length (m) |
Au (g/t) |
|
ES08-007 |
4.5 |
21.0 |
16.5 |
0.51 |
|
ES08-008 |
99.4 |
105.1 |
5.7 |
1.53 |
|
ES08-009 |
84.8 |
94.8 |
10.0 |
0.62 |
|
ES08-011 |
66.4 |
71.4 |
5.0 |
0.78 |
|
ES08-011 |
135.3 |
149.0 |
13.7 |
0.31 |
|
ES08-012 |
63.5 |
66.5 |
3.0 |
0.75 |
|
ES08-012 |
73.0 |
77.0 |
4.0 |
0.92 |
|
ES08-012 |
140.0 |
159.0 |
19.0 |
1.64 |
|
ES08-013 |
65.5 |
67.5 |
2.0 |
2.23 |
|
ES08-013 |
93.6 |
94.6 |
1.0 |
5.53 |
|
ES08-013 |
127.7 |
135.9 |
8.2 |
0.45 |
|
ES09-018 |
162.8 |
168.0 |
5.2 |
0.62 |
|
ES09-019 |
117.0 |
122.0 |
5.0 |
1.03 |
|
ES09-020 |
147.5 |
162.0 |
14.5 |
0.76 |
|
ES09-020 |
199.0 |
210.5 |
11.5 |
0.36 |
|
ES09-021 |
187.0 |
198.5 |
11.5 |
0.36 |
|
ES09-022 |
222.9 |
230.0 |
7.1 |
1.18 |
|
ES09-023 |
186.0 |
195.0 |
9.0 |
1.50 |
|
ES09-025 |
71.0 |
82.0 |
11.0 |
0.56 |
|
ES09-029 |
128.0 |
133.0 |
5.0 |
0.63 |
|
ES09-029 |
162.0 |
179.0 |
17.0 |
0.47 |
Table 5 - 2008-2010 - Eastmain Resources Inc. Drilling -JT assays (5 g/t and more)
|
Drill Hole |
From (m) |
To (m) |
Length (m) |
Au (g/t) |
|
ES08-008 |
101.5 |
102.0 |
0.5 |
10.80 |
|
ES08-012 |
76.5 |
77.0 |
0.5 |
7.06 |
|
ES08-012 |
146.0 |
147.0 |
1.0 |
7.02 |
|
ES08-012 |
157.0 |
158.0 |
1.0 |
18.40 |
|
ES08-013 |
93.6 |
94.1 |
0.5 |
10.35 |
|
ES09-019 |
121.0 |
121.5 |
0.5 |
5.81 |
|
ES09-022 |
228.0 |
228.5 |
0.5 |
9.08 |
|
ES09-023 |
187.5 |
188.0 |
0.5 |
9.22 |
Table 6 - 2008-2010 – Eastmain Resources Inc. Drilling - Moni composite
|
Drill Hole |
From (m) |
To (m) |
Length (m) |
Au (g/t) |
|
ES10-033 |
146.0 |
151.0 |
5.0 |
0.74 |
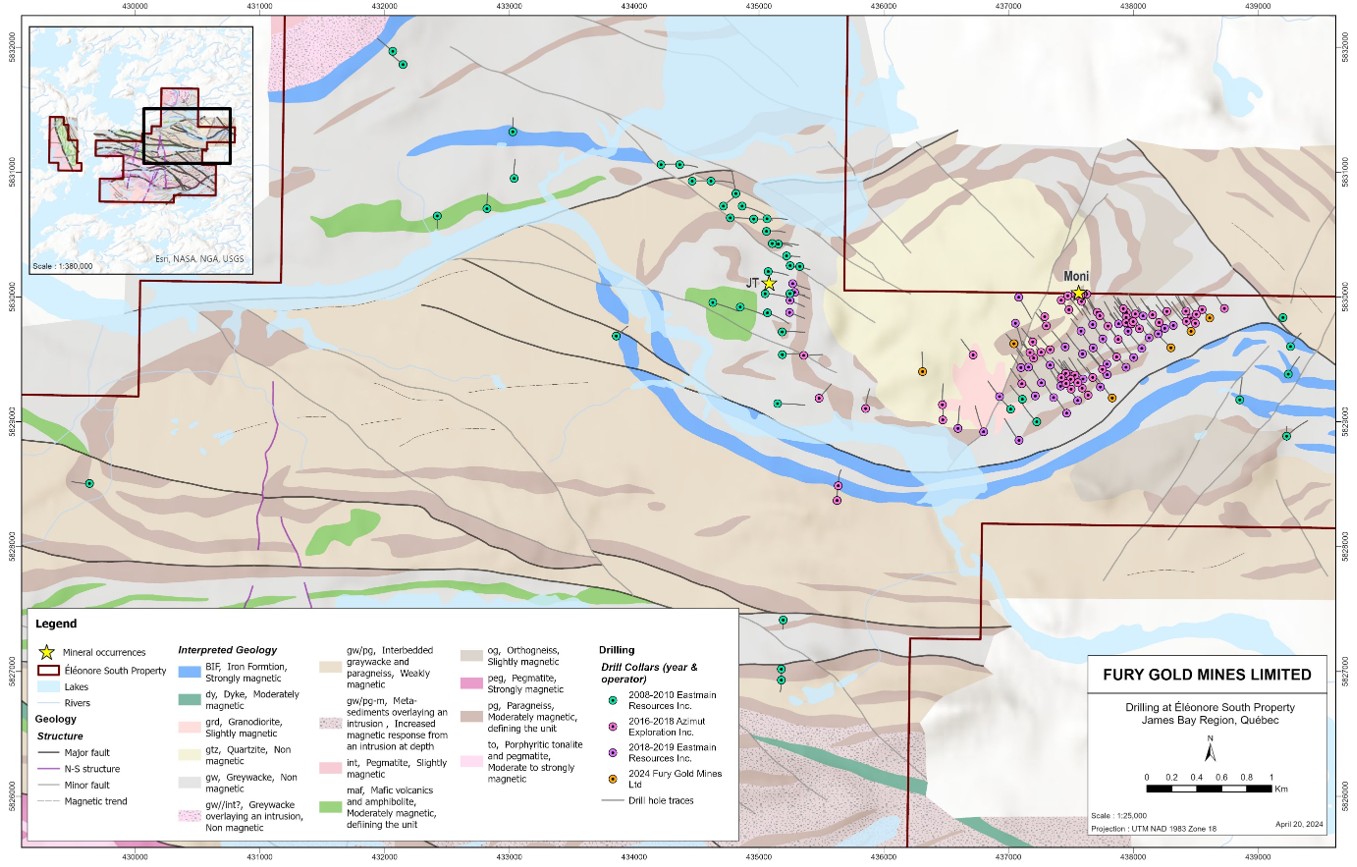
Figure 7: Drilling Map Localization by Year and Operator.
|
7.3.2 |
2016 - 2018 Azimut Exploration Inc. Drilling |
Between 2016 to 2018 Azimut completed 15,482 m of diamond core drilling in 75 holes (table 4). Hole identification is from ES16-048 to ES18-119. The drilling was completed on the Moni Trend within an area approximately 3,700 m northeast-southwest and 1,000 m northwest-southeast and one on JR Prospect. Most boreholes were drilled with a dip of 50 degrees, and an azimuth of 320 and 140 degrees and rarely through north and west.
Spacing is variable and increases toward southwest direction with up to 600-700 m distance between holes. The closest drill holes from Moni and the Cheechoo tonalite boundary are mostly 100 m space with local cluster holes varying from 20 to 60 m spacing.
Gold at Moni is found in broad low grade alteration zone with very rich thin quartz veins in the tonalite. The hole ES16-051 return 3.21 g/t gold over 6.4 m (table 8) included 14.05 g/t over 1.0 m (table 9), ES17-060 return 1.55 g/t over 27.0 m, ES17-088 return 3.15 g/t over 24.0 m and included 22.4 g/t over 1.15 m, 24.2 m over 1.5 m and 19.3 g/t over 1.5 m and ES18-100 return 49.39 g/t over 6.0 m. Gold values in veins can reach up to 294.0 g/t (ES18-100).
Table 7 - 2016 - 2018 - Azimuth Exploration - Moni composite
|
Drill Hole |
From (m) |
To (m) |
Length (m) |
Au (g/t) |
|
ES16-048 |
6.1 |
8.6 |
2.5 |
8.88 |
|
ES16-051 |
178.5 |
184.9 |
6.4 |
3.21 |
|
ES16-051 |
195.5 |
250.1 |
54.6 |
0.47 |
|
ES16-055 |
147.0 |
159.0 |
12.0 |
1.58 |
|
ES16-055 |
174.0 |
198.0 |
24.0 |
0.73 |
|
ES16-057 |
153.0 |
154.5 |
1.6 |
76.10 |
|
ES17-060 |
85.2 |
142.5 |
57.3 |
0.51 |
|
ES17-060 |
151.5 |
166.5 |
15.0 |
0.74 |
|
ES17-060 |
181.5 |
208.5 |
27.0 |
1.55 |
|
ES17-061 |
154.7 |
195.0 |
40.3 |
0.59 |
|
ES17-064 |
167.3 |
220.5 |
53.3 |
4.21 |
|
ES17-064 |
228.0 |
252.0 |
24.0 |
0.48 |
|
ES17-070 |
72.5 |
103.5 |
31.0 |
0.88 |
|
ES17-074 |
199.9 |
250.5 |
50.6 |
0.54 |
|
ES17-075 |
169.7 |
210.0 |
40.3 |
0.56 |
|
ES17-077 |
142.5 |
195.5 |
53.0 |
1.29 |
|
ES17-077 |
204.5 |
266.0 |
61.5 |
0.43 |
|
ES17-077 |
295.6 |
309.0 |
13.4 |
1.67 |
|
ES17-080 |
139.5 |
179.0 |
39.5 |
1.55 |
|
ES17-085 |
184.4 |
187.8 |
3.4 |
7.66 |
|
ES17-087 |
86.0 |
162.5 |
76.5 |
0.50 |
|
ES17-088 |
183.5 |
207.5 |
24.0 |
3.15 |
|
ES17-090 |
92.0 |
96.5 |
4.5 |
4.45 |
|
ES18-092a |
6.3 |
9.2 |
2.9 |
5.70 |
|
ES18-093 |
7.7 |
11.9 |
4.2 |
3.80 |
|
ES18-095 |
20.5 |
23.0 |
2.5 |
13.58 |
|
ES18-098 |
8.1 |
22.5 |
14.4 |
5.05 |
|
ES18-099 |
11.2 |
19.0 |
7.8 |
2.58 |
|
ES18-100 |
14.0 |
20.0 |
6.0 |
49.39 |
|
ES18-101 |
143.5 |
147.0 |
3.5 |
6.06 |
|
ES18-108a |
208.0 |
232.5 |
24.6 |
1.46 |
|
ES18-108a |
273.8 |
370.5 |
96.8 |
0.65 |
|
ES18-109 |
142.8 |
258.0 |
115.2 |
0.45 |
|
ES18-111 |
267.3 |
296.0 |
28.8 |
0.69 |
|
ES18-112 |
108.2 |
140.1 |
31.9 |
0.86 |
|
ES18-118 |
284.6 |
309.7 |
25.1 |
0.64 |
|
ES18-119 |
165.5 |
168.5 |
3.0 |
5.33 |
Table 8 - 2016 – 2018 - Azimuth Exploration - Moni assays (5 g/t and more)
|
Drill Hole |
From (m) |
To (m) |
Length (m) |
Au (g/t) |
|
ES16-048 |
6.1 |
7.35 |
1.25 |
17.30 |
|
ES16-051 |
180.9 |
181.9 |
1.0 |
14.05 |
|
ES16-055 |
151.8 |
153.0 |
1.2 |
6.75 |
|
ES16-057 |
152.95 |
154.5 |
1.55 |
76.10 |
|
ES17-060 |
151.5 |
153.0 |
1.5 |
5.59 |
|
ES17-060 |
198.0 |
199.5 |
1.5 |
16.45 |
|
ES17-064 |
172.5 |
174.0 |
1.5 |
13.40 |
|
ES17-064 |
180.0 |
181.5 |
1.5 |
29.00 |
|
ES17-064 |
204.0 |
205.5 |
1.5 |
68.80 |
|
ES17-064 |
205.5 |
207.0 |
1.5 |
6.91 |
|
ES17-064 |
211.5 |
213.0 |
1.5 |
9.32 |
|
ES17-070 |
72.5 |
73.4 |
0.9 |
21.40 |
|
ES17-077 |
12.0 |
12.6 |
0.6 |
5.88 |
|
ES17-077 |
186.5 |
188.0 |
1.5 |
23.10 |
|
ES17-077 |
308.0 |
309.0 |
1.0 |
16.10 |
|
ES17-080 |
174.5 |
176.0 |
1.5 |
22.90 |
|
ES17-080 |
177.5 |
179.0 |
1.5 |
6.10 |
|
ES17-081 |
53.5 |
55.0 |
1.5 |
5.93 |
|
ES17-085 |
184.35 |
185.5 |
1.15 |
22.40 |
|
ES17-088 |
185.0 |
186.5 |
1.5 |
24.20 |
|
ES17-088 |
204.5 |
206.0 |
1.5 |
19.30 |
|
ES17-090 |
93.5 |
95.0 |
1.5 |
12.35 |
|
ES18-092a |
8.15 |
9.15 |
1.0 |
15.60 |
|
ES18-093 |
9.75 |
10.4 |
0.65 |
20.10 |
|
ES18-095 |
20.5 |
21.5 |
1.0 |
33.00 |
|
ES18-098 |
8.85 |
9.8 |
0.95 |
71.40 |
|
ES18-099 |
13.8 |
14.7 |
0.9 |
17.40 |
|
ES18-100 |
17.0 |
18.0 |
1.0 |
294.00 |
|
ES18-101 |
145.45 |
146.95 |
1.5 |
13.60 |
|
ES18-102 |
133.85 |
134.4 |
0.55 |
15.70 |
|
ES18-108a |
231.0 |
232.5 |
1.5 |
18.50 |
|
ES18-111 |
271.05 |
272.05 |
1.0 |
5.64 |
|
ES18-112 |
137.0 |
138.0 |
1.0 |
10.20 |
|
ES18-113 |
140.5 |
141.0 |
0.5 |
7.65 |
|
ES18-113 |
152.0 |
153.0 |
1.0 |
5.92 |
|
ES18-119 |
165.5 |
167.0 |
1.5 |
10.40 |
|
7.3.3 |
2018 – 2019 Eastmain Resources Inc. Drilling |
During late 2018 through 2019 Eastmain completed 11,925 m of diamond core drilling in 42 holes (Table 4) Hole identification is ES18-120 to ES19-159. The drilling was mostly completed on the Moni Trend and 4 drillholes on JT Prospect (figure 5). Moni drilling was achieved in a corridor of approximatively 600 m northwest-southeast and 1,400 m northeast-southwest. The JT Prospect area is approximatively 300 m north-south and 200 m east-west. The JT Prospect drillholes were drilled at 110 degrees azimuth and -50 degrees dip. The Moni Trend drillholes were mostly drilled at 320 and some at 140 degrees azimuth and -50 degrees dip. Spacing between drillholes were approximately 50 m by 150 to 300 m.
Holes drilled at JT confirm the presence of gold and 3 from 4 holes return composite. The hole ES18-120 return 0.33 g/t gold over 18.0 m (Table 10) included 28.3 g/t gold over 0.5 m (Table 11).
Table 9 - 2018 - 2019 Eastmain Resources - JT composite
|
Drill Hole |
From (m) |
To (m) |
Length (m) |
Au (g/t) |
|
ES18-139 |
163.5 |
165.0 |
1.5 |
2.44 |
|
ES18-140 |
95.8 |
113.8 |
18.0 |
0.33 |
|
ES18-141 |
17.5 |
24.4 |
6.9 |
0.64 |
Table 10 - 2018 - 2019 - Eastmain Resources - JT assays (5 g/t and more)
|
Drill Hole |
From (m) |
To (m) |
Length (m) |
Au (g/t) |
|
ES18-140 |
57.4 |
57.9 |
0.5 |
28.3 |
The infill drilling at Moni continue to return interesting gold intersection in the Trend. ES18-121A return 2.14 g/t gold over 7.4 m (Table 12) and included 9.8 g/t over 1.0 m (Table 13). ES18-133 return 14.68 g/t over 6.2 m and included 80.4 g/t over 1.0 m). ES19-157 return 1.32 g/t over 66.9 m and included 27.8 g/t over 1.0 m and 13.35 g/t over 0.8 m).
Table 11 - 2018 – 2019 – Eastmain Resources - Moni composite
|
Drill Hole |
From (m) |
To (m) |
Length (m) |
Au (g/t) |
|
ES18-121A |
57.3 |
64.7 |
7.4 |
2.14 |
|
ES18-121A |
78.6 |
112.5 |
33.9 |
0.66 |
|
ES18-122 |
57.9 |
83.0 |
25.2 |
0.81 |
|
ES18-123 |
342.5 |
354.0 |
11.5 |
1.74 |
|
ES18-124 |
116.0 |
134.0 |
18.0 |
0.68 |
|
ES18-124 |
295.0 |
306.0 |
11.0 |
1.35 |
|
ES18-126 |
141.0 |
149.0 |
8.0 |
2.08 |
|
ES18-127 |
266.7 |
290.2 |
23.5 |
0.72 |
|
ES18-129 |
143.5 |
153.5 |
10.0 |
1.51 |
|
ES18-129 |
164.0 |
180.5 |
16.5 |
1.08 |
|
ES18-132 |
39.5 |
49.0 |
9.5 |
1.45 |
|
ES18-133 |
164.8 |
171.0 |
6.2 |
14.68 |
|
ES18-143 |
238.5 |
240.0 |
1.5 |
8.12 |
|
ES19-147 |
150.0 |
151.5 |
1.5 |
15.65 |
|
ES19-156 |
140.3 |
150.0 |
9.7 |
7.44 |
|
ES19-156 |
378.0 |
403.5 |
25.5 |
0.56 |
|
ES19-157 |
157.0 |
223.9 |
66.9 |
1.32 |
Table 12 - 2018 - 2019 Eastmain Resources - Moni assays (5 g/t and more)
|
Drill Hole |
From (m) |
To (m) |
Length (m) |
Au (g/t) |
|
ES18-121A |
59.0 |
60.0 |
1.0 |
9.80 |
|
ES18-121A |
78.6 |
79.5 |
0.9 |
9.06 |
|
ES18-123 |
241.4 |
242.55 |
1.15 |
7.08 |
|
ES18-123 |
348.4 |
349.4 |
1.0 |
13.75 |
|
ES18-124 |
298.0 |
299.0 |
1.0 |
12.30 |
|
ES18-126 |
141.0 |
142.5 |
1.5 |
8.22 |
|
ES18-127 |
281.1 |
281.8 |
0.7 |
5.05 |
|
ES18-127 |
281.8 |
282.5 |
0.7 |
5.25 |
|
ES18-128 |
148.0 |
148.7 |
0.7 |
9.08 |
|
ES18-129 |
143.5 |
144.5 |
1.0 |
12.65 |
|
ES18-129 |
179.0 |
180.5 |
1.5 |
8.02 |
|
ES18-132 |
43.9 |
44.7 |
0.8 |
13.00 |
|
ES18-133 |
167.0 |
168.0 |
1.0 |
80.40 |
|
ES18-133 |
169.5 |
171.0 |
1.5 |
5.94 |
|
ES18-143 |
238.5 |
240.0 |
1.5 |
8.12 |
|
ES19-147 |
150.0 |
151.5 |
1.5 |
15.65 |
|
ES19-156 |
140.3 |
141.1 |
0.8 |
12.20 |
|
ES19-156 |
144.7 |
145.5 |
0.8 |
63.20 |
|
ES19-157 |
181.0 |
182.5 |
1.5 |
27.80 |
|
ES19-157 |
186.4 |
187.2 |
0.8 |
13.35 |
|
7.3.4 |
2024 – Fury Gold Mines Drilling |
In winter 2024, Fury carried out a drilling campaign to focus on Moni Trend structural corridors and following up on previous drill intercepts of 53.25 m of 4.22 g/t Au; 6.2 m of 14.7 g/t Au and 23.8 m of 3.08 g/t Au (figure 6). In total, 2,331 m of were drilled in 7 holes. A total of 1,704 core samples were sent to the lab to be tested for gold. The drilling campaign work area was 2,500 m east-west by 800 m north-south. Most holes were drilled at 320 degrees azimuth and one at 140 degrees and one through north. All holes dip at -50 degrees.
The holes intersected broad gold zone with local gold peak value. The hole 24ES-161 intersected 0.44 g/t gold over 137.5 m (Table 13) including 9.7 g/t over 1.5 and 8.33 g/t gold over 8.33 g/t (Table 14). The hole 24ES-162 intersected 0.5 g/t gold over 115.5 m.
The 2024 Fury drilling campaign show the continuity at depth of the mineralized zone in the Cheechoo Tonalite.
Table 13 - 2024 – Fury Gold Mines - Moni composite
|
Drill Hole |
From (m) |
To (m) |
Length (m) |
Au (g/t) |
|
24ES-160 |
219.5 |
247.5 |
28.0 |
0.47 |
|
24ES-161 |
238.0 |
375.5 |
137.5 |
0.44 |
|
24ES-161 |
447.5 |
466.2 |
18.7 |
0.97 |
|
24ES-162 |
207.5 |
323.0 |
115.5 |
0.50 |
Table 14 - 2024 - Fury Gold Mines - Moni assays (5 g/t and more)
|
Drill Hole |
From (m) |
To (m) |
Length (m) |
Au (g/t) |
|
24ES-161 |
274.0 |
275.5 |
1.5 |
9.70 |
|
24ES-161 |
460.0 |
461.0 |
1.0 |
8.33 |
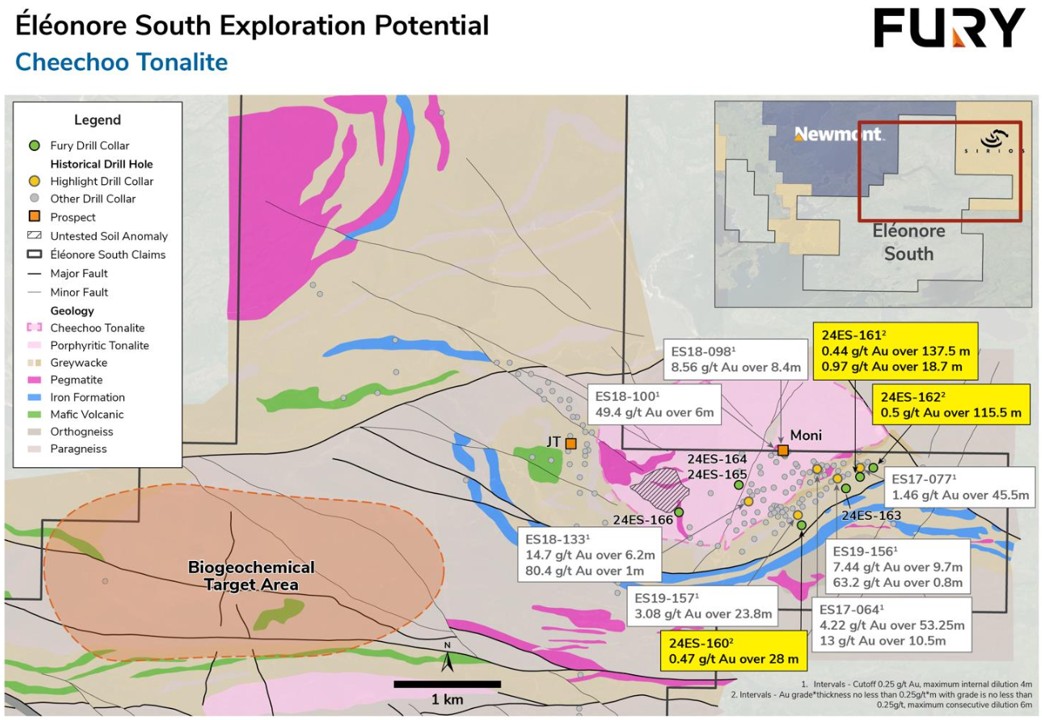
Figure 8: Fury 2024 Drilling Campaign Hole Location and Highlights
|
7.3.5 |
Discussion on Drilling Completed |
It is the opinion of The Author that the diamond drilling conducted prior to 2024 at the Éléonore South Project meets or exceeds current industry best practices. The Author is unaware of any drilling or recovery issues that may impact upon the accuracy and reliability of the results.
|
7.3.6 |
Methodology |
The 2024 diamond drilling program was contracted to Pelletier Drilling Inc (Pelletier) from Val-d’Or, Qc. Pelletier used an in-house designed tracked diamond drill. The drill produced NQ size (47.6 mm diameter) core.
The locations of drill hole pads were initially marked using a handheld GPS instrument and the azimuth of the holes was established by compass. Once the pad was built and the drill moved onto it, an Azimuth Aligner instrument manufactured by Minnovare Pty. Ltd., or an APS manufactured by Reflex was used to establish the azimuth. An inclinometer was used to establish the dip.
The attitude of the hole with depth was determined using a Sprint-IQ instrument manufactured by Reflex in single shot mode with readings taken by the drillers. The initial reading was taken at a depth 15 m with subsequent readings taken nominally at 15 m intervals. An OGQ registered geologist checked the core before making the decision to terminate the holes. Upon completion of the hole, the casings were left in place and covered with a casing cap, marked with the hole name and coordinated. Subsequently all hole locations were surveyed with hand GPS.
Drill core was placed sequentially in wooden core boxes at the drill by the drillers and sealed with top covers and ties before transport. The core boxes were transported by an argo Centaur vehicule on a twice daily basis. The core was transported to the camp where depth markers and box numbers were checked, and the core was carefully reconstructed in a secure core facility. The core was logged geotechnically on a 3 m run by run basis including, core recovery, RQD.
The core was descriptively logged and marked for sampling by an OGQ registered geologist or geologist in-training, paying particular attention to lithology, structure, alteration, veining/brecciation, and sulphide mineralization.
Logging and sampling information was entered into MX Deposit cloud-based core logging application by MINALYTIX INC. which allowed for the integration of the data into the project database.
The core was photographed both wet and dry after logging and sampling.
|
8 |
Sample Preparation, Analyses, and Security |
Method of analysis varied since the beginning of the project and are summarise in Table 16 below. QC protocols were established in 2008 and carried through with minor refinements through the current drilling program.
Quality Control (QC) samples were introduced into the sample stream at a rate of 4% for both blank samples and CRM samples. Fury increases this rate to 5% and add field duplicates in the form of quarter sawn core samples introduced into the sample stream at a rate of 1 in 50 samples.
Table 15 - Method of analysis of the different drilling campaigns
|
Year |
Company |
Hole Prefix |
Lab & Location |
Prep Code |
Fire Assay Method |
Fire Assay Code |
|
2008 |
Eastmain Resources |
ES08 |
ALS Chemex Lab, ON, Sudbury (prep) |
ALS: |
ALS 50g: Fire Assay AAS / Gravimetric / ICP-AES |
ALS: Au-AA24, Au-GRA-22, ME-ICP41 |
|
2009 |
Eastmain Resources |
ES09 |
ALS Chemex Lab, ON, Sudbury (prep) |
ALS: |
ALS 50g: Fire Assay AAS / Gravimetric / Metallic screen / ICP-AES |
ALS : Au-AA24, Au-GRA-22, Au-SCR24, Au-AA26 and Au-AA26D, ME-MS61 |
|
2010 |
Eastmain Resources |
ES10 |
ALS Chemex Lab, ON, Sudbury (prep) |
ALS: |
ALS 50g: Fire Assay AAS / Gravimetric / Metallic screen / ICP-AES |
ALS : Au-AA24, Au-GRA-22, Au-SCR24, Au-AA26 and Au-AA26D, ME-MS61 |
|
2016-2017 |
Azimuth Exploration |
ES16 |
ALS Minerals Lab, QC, Val-d'Or (prep and analytical) |
ALS: |
ALS 50g: Fire Assay AAS / Gravimetric / ICP-AES |
ALS: Au-AA24, Au-GRA22, ME-MS61 |
|
2018 |
Azimuth Exploration |
ES18 |
ALS Minerals Lab, QC, Val-d'Or (prep and analytical) |
ALS: |
ALS 50g: Fire Assay AAS / Gravimetric / ICP-AES |
ALS: Au-AA24, Au-GRA22, ME-MS61 |
|
2018-2019 |
Eastmain Resources |
ES18 |
ALS Mineral Lab, QC, Rouyn Noranda (prep) |
ALS: |
ALS 50g: Fire Assay AAS / Gravimetric / ICP-AES |
ALS: Au-AA24, Au-GRA22, ME-MS61 |
|
2024 |
Fury Gold Mines |
24ES |
ALS Lab, QC, Rouyn Noranda & Val d'Or (prep) |
ALS: |
ALS 50g: Fire Assay AAS / Gravimetric / ICP-AES |
ALS: Au-AA24, Au-GRA22, ME-MS62 |
|
8.1 |
2008 – 2010 Eastmain Resources Diamond Drilling |
|
a) |
Preparation Method |
Samples intervals were recorded with red grease pencil on the drill core during logging. Each sample, generally a half metre or one metre in length whenever possible, was assigned a laboratory sample number for analytical purposes. Although most samples were restricted to a particular unit some intervals occasionally cross lithological boundaries to maintain consistent sampling intervals. Any intervals with sediments were sampled with one metre samples. Intervals displaying alteration, quartz flooding or veining, shearing and sulphide mineralization were sampled with half metre samples.
Drill core was split with a diamond-bladed tile saw. To prevent any contamination between split samples a concrete construction brick was cut between each sample interval. One-half of each core sample was consistently returned to the core box with a duplicate sample identifier tag. Core boxes were then cross piled on-site for future reference.
The other half of the split core was placed in a plastic sample bag with a corresponding duplicate sample tag as supplied by ALS Chemex and sealed with black electrical tape. The exterior of each plastic sample bag was also labeled with its sample number.
Sample bags were then placed into standard fiber rice shipping bags, which were also sealed for shipment with cable ties and fiber tape. Samples from 2008 campaign were then flown out of camp internally on a helicopter to Opinaca Airport, Quebec. From Opinaca Airport the samples were picked up by a local expediter employed by Eastmain for delivery to ALS Chemex Labs, Sudbury, Ontario, for crushing, and sample preparation. Samples from 2009 campaign were then flown out of camp via float plane to Chibougamau, were they were placed on a bus for shipment to ALS Chemex Labs,Sudbury, Ontario, for crushing, and sample preparation.Samples from 2010 campaign were then flown out of camp via float plane to the Temiskami River, were they were placed on a bus for shipment to ALS Chemex Labs, Sudbury, Ontario, for crushing, and sample preparation.
|
b) |
Method of analysis |
All samples were sent to ALS Chemex in Sudbury for preparation and then analyzed at the Vancouver facility. Rock sample preparation involved the entire sample being passed through a primary crusher to yield a crushed product in which 70% of the sample passes through a 2 mm (-10 mesh) screen. Some large samples require division of one or more size fraction into representative splits. The entire sample is transferred to a tray and then repeatedly passed through a riffle splitter until a split size of up to 1,000 g has been obtained. Sample reject is returned to its original package or, if necessary, to a more suitable container. The crushed sample split, up to 1,000 g, is ground using a ring mill pulverizer using a chrome steel ring set. All samples are pulverized to at least 95% of the ground material passing through a 75 μm screen.
All samples were analyzed for gold. 50-g (rock) samples were analyzed for gold using Fire Assay with Atomic Absorption finish (Au-AA24), giving a lower limit of detection of 5 ppb and an upper limit of detection of 10,000 ppb Au. For samples > 500 ppb Au, a 50-g (rock) sample was re-assayed using Fire Assay methods with Gravimetric finish (Au-GRA22), giving a lower detection limit of 0.05 g/t and an upper limit of 1,000 g/t.
In 2009 and 2010, for samples with visible gold a combined Fire Assay with Gravimetric and Atomic Absorption finish (Au-SCR24) The sample pulp is passed through a 100μm (Tyler 150 mesh) stainless steel screen. Any material remaining on the screen (+) 100μm is retained and analyzed in its entirety by fire assay with gravimetric finish (Au-GRA22) and reported as the Au (+) fraction. The material passing through the screen (-) 100 μm fraction) is homogenized and two sub-samples (50g) are analyzed by fire assay with AAS finish (Au-AA26 and Au-AA26D), giving a lower detection limit of 0.01 g/t, and an upper limit of 100 g/t. The average of the two AAS results is taken and reported as the Au (-) fraction result. All three values are used in calculating the combined gold content of the plus and minus fractions. The gold values for both the (+) 100 and (-) 100 μm fractions are reported together with the weight of each fraction as well as the calculated total gold content of the sample. The final gold total has a lower detection limit of 0.05 g/t and an upper limit of 1,000 g/t.
In 2008, all rock samples were analyzed for a suite of 35 trace elements using Inductively Coupled Plasma (ME-ICP41) methods with various detection limits. A prepared sample (0.50 g) is digested with aqua regia for 45 minutes in a graphite heating block. After cooling, the resulting solution is• diluted to 12.5 mL with demineralized water, mixed and analyzed by Inductively Coupled Plasma-Atomic Emission Spectrometry. The analytical results are corrected for inter element spectral interferences.
In 2009 and 2010, all rock samples were analyzed for a suite of 48 trace elements using Inductively Coupled Plasma (ME-MS61) methods with various detection limits. A prepared sample (0.25 g) is digested with perchloric, nitric, hydrofluoric and hydrochloric acids. The residue is topped up with dilute hydrochloric acid and analyzed by inductively coupled plasma-atomic emission spectrometry. Following this analysis, the results are reviewed for high concentrations of bismuth, mercury, molybdenum, silver and tungsten and diluted accordingly. Samples meeting this criterion are then analyzed by inductively coupled plasma-mass spectrometry. Results are corrected for spectral interelement interferences.
|
c) |
QAQC |
2008 campaign
Eastmain completed its own quality control check sampling during the 2008 drill program. Four referenced standards supplied by Analytical Solutions Ltd. ("ASL"), one of low-grade, one moderate-grade, and two high-grade as well as blank samples, were incorporated into the core sampling stream. The sixty-seven blanks submitted for assay with core samples during the 2008 drilling program were obtained from concrete building bricks obtained locally. Forty-seven of the reference material standards supplied by ASL were used. The blanks and certified standard samples 10Pb, 53Pb, 7Pb and 62Pa containing 7.15, 0.623, 2.77 and 9.64g/t Au respectively were introduced in a random order every 25th sample. ALS results of standards appear to indicate that the lab analysis reporting is a bit on the low side for the higher gold grades (10Pb, 62Pa) and a bit on the high side for lower gold grades (53Pb, 7Pb) but that the low number of individual QC standard sample types analyzed, 6 to 15, may to too small to determine an accurate statistical average. Results do fall within acceptable industry parameters.
The results from analysis of blank samples submitted by Eastmain to ALS fall within the 95% confidence interval, except for sample E244600 (Certificate #SD08043399) with a reported concentration of 0.273 g/t Au. Another blank sample reported on the same certificate contained <0.005 g/t Au, and two standards on the same certificate while slightly elevated occur within acceptable ranges
Overall results indicate that the concentrations of gold reported are within acceptable industry standards.
2009 campaign
Eastmain completed its own quality control check sampling during the 2009 drill program. Four referenced standards supplied by Analytical Solutions Ltd. ("ASL"), one of low-grade, one moderate-grade, and two high-grade as well as blank samples, were incorporated into the core sampling stream. The ninety-nine blanks submitted for assay with core samples during the 2009 drilling program were obtained from concrete building bricks obtained locally. Forty-seven of the reference material standards supplied by ASL were used. The blanks and certified standard samples 10Pb, 53Pb, 7Pb and 62Pa containing 7.15, 0.623, 2.77 and 9.64g/t Au respectively were introduced in a random order every 25th sample.
ALS results of standards appear to indicate that the lab analysis reporting is a bit on the low side. Results generally fall within acceptable industry parameters.
The results from analysis of blank samples submitted by Eastmain to ALS generally fall within the 95% confidence interval, with a strong outlier of 0.079 g/t Au from sample H927800 (Certificate #SD09113604). Another blank sample reported on the same certificate contained <0.005 g/t Au, and one standard on the same certificate, while slightly elevated occur within acceptable ranges. Of the 15 blanks and standards utilized in ALS's internal quality control, one standard (CDN-CGS-19) lies above, another (SJ39) lies below acceptable target ranges. Results do fall within acceptable industry parameters. Overall results indicate that the concentrations of gold reported are within acceptable industry standards.
2010 campaign
Eastmain completed its own quality control check sampling during the 2010 drill program. Six referenced standards supplied by Analytical Solutions Ltd. ("ASL"), two of low-grade, two moderate-grade, and two high-grade as well as blank samples, were incorporated into the core-sampling stream. The ninety-nine blanks submitted for assay with core samples during the 2010 drilling program were obtained from concrete building bricks obtained locally. Sixty-five of the reference material standards supplied by ASL were used. The blanks and certified standard samples 10Pb, 53Pb, 62Pa, 7Pb, 60b, and 2Pd containing 7.15, 0.623, 9.64, 2.77, 2.57 and 0.885 g/t Au respectively were introduced in a random order every 25th sample.
ALS results of standards appear to indicate that the lab analysis reporting is a bit on the high side. Results generally fall within acceptable industry parameters. Higher error is seen in the GRA22 versus the AA24 method, though this is mostly seen in the low to medium grade standards, which is an expected result.
The results from analysis of blank samples submitted by Eastmain to ALS generally fall within the 95% confidence interval. Overall results indicate that the concentrations of gold reported are within acceptable industry standards.
|
8.2 |
2016 – 2018 Azimut Exploration Diamond Drilling |
|
a) |
Preparation method |
The entire drill core was generally sampled by a geologist in 1.5 m intervals with shorter intervals used to separate lithological boundaries. Saw the core along the cutting line or at a small distance from the core orientation line, if indicated, starting and stopping at the marked red arrows on the core. Place one half of the core in the bag and place the other half back in the core box with the cut face upwards. He/she is to place the sample end pieces (the core marked with red arrows) cut face side up, with the arrows pointing in the appropriate direction.
Samples with native gold were identified. This was to make sure the core cutting blade was cleaned before and after each of these mineralized samples by cutting through a concrete block.
For dispatch of samples to the lab, the technician will mark rice bags with the dispatch number and bag number. It is suggested the tech will generate a unique dispatch number for cross reference per drill hole. The minimum is one dispatch number per shipment. Samples will be packed in marked rice bags, which will weigh 40 lbs (less chances of injuries, facilitate the weight estimation for helicopter transportation.
|
b) |
Method of analysis |
Samples from 2016 to 2018 drilling campaign were sent to ALS Minerals in Val-d’Or for preparation and then analyzed. Rock sample preparation involved the entire sample being passed through a primary crusher to yield a crushed product in which 70% of the sample passes through a 2 mm (-10 mesh) screen. Some large samples require division of one or more size fraction into representative splits. The entire sample is transferred to a tray and then repeatedly passed through a riffle splitter until a split size of up to 1,000 g has been obtained. Sample reject is returned to its original package or, if necessary, to a more suitable container. The crushed sample split, up to 1,000 g, is ground using a ring mill pulverizer using a chrome steel ring set. All samples are pulverized to at least 85% of the ground material passing through a 75 μm screen.
Samples were assayed by Au-AA24, which is a gold analysis by fire assay and AAS finish, on 50 g nominal weight. Samples returning values >10.0 g/t Au for Fall 2016 and >3 g/t Au for 2017, were re-assayed by Au-GRA22: Au by fire assay and gravimetric finish.
All samples were also analyzed for a 48-element package by four acid digestion and ICP-AES and ICP-MS finish (ICP ME-MS61). Results are corrected for spectral interelement interferences. Samples containing visible gold were flagged to the lab and some quartz washes were requested.
|
c) |
QAQC method |
2016-2017 campaign
In 2016-2017 quality control samples were inserted in the sample stream at a frequency allowing regular analysis of approximately two standards (or certified reference materials), two blanks and one field duplicate per lab batch. This is in addition to the lab's own QAQC samples. A typical batch. size comprises of approximately 75 samples.
A total of 58 standards, 55 blanks and 47 field duplicates were sent for assay, for a total of 160 QAQC samples.
Standards were inserted approximately every 33 samples. Specific selection of standards was based on the expected grade of neighboring samples. Most of the assay results were within 1 to 1.5 times their published standard deviation, well within accepted ranges.
Only one standard sample exceeded 2 times the standard deviation: sample #S656600 assayed 1.125 g/t Au while its certified value is listed at 1.043 g/t Au. This results in a spread approximately 2.5 times the standard deviation for that standard, or 7.78 %. This result is still within the lab's accepted 10 % precision.
One standard (#S656799) had insufficient material to get fire assayed. Sample S657031 was mis-labelled in the data base as a duplicate, it is in fact a standard OREAS 209 and is included here.
Blanks consisted of coarse crushed Quartzite purchased in 20-30 lbs pouches from the ALS assay lab in Val d'Or. This same material is used by the lab to clean their grinding equipment and has been repeatedly analyzed to ensure it is absence of gold.
A total of 55 blanks were sent for assays. They were inserted very frequently to minimize the potential of contamination, as visible gold was known to occur and could potentially smear at different stages in the sampling/analysis protocol. Blanks were therefore inserted in the sample stream after each occurrence of visible gold and after each section of potentially mineralized rock. In cases of highest potential mineralization, blanks were inserted in between each sample; blanks were also inserted after high grade standards. In extensive zones without obvious mineralization, approximately two blanks per 75 samples were inserted in the sample string.
Despite these precautions, blank sample #S656556 assayed 0.05 g/t Au. This sample came right after #S656555 which contained visible gold and assayed 14.05 g/t Au. Re-analysis of this sample gave a lower grade, at 0.028 g/t Au, but the fact that some gold was still detected confirms that there has been carryover from the previous sample in the sample preparation stage. The lab calculated the carry-over to be ῀0.1 % and indicated that they consider values <1 % as acceptable.
The next sample in the sequence, S656557, assayed 3.39 g/t Au, and it was itself followed by a blank (#S656558) that assayed below detection limit for gold, therefore indicating that at this point the sample stream was free of contamination. All the other blanks assayed less than the detection limit for gold (<0.005 g/t). All the lab blanks also assayed <0.005 g/t Au, for both gold analysis methods. A total of 120 blanks were analyzed by the lab, 57 of which were analyzed for gold.
A total of 47 field duplicates, consisting of quarter core, were sent for assay. This type of sample is an industry standard even though it does not conclusively test the lab accuracy, due to inherent nonhomogeneous distribution of gold in the core. But for this same reason, it can help characterize the distribution of the mineralization.
Most of the samples were at relatively low gold grade, only two of the samples were >0.5 g/t. Field duplicate analyses show several samples with variations of >10 %, which can be expected for low grades. Therefore, such variability of samples assaying <0.05 g/t (SO ppb), or ten times the detection limit, is deemed inconclusive. One sample pair at medium grade (#S656597 at 1.050 g/t Au and #S656598 at 0.870 g/t Au) show relatively good reproducibility at 4.69 % difference between the two samples. Another pair (#S657442 at 0.055 g/t Au and S657443 at 0.218 g/t Au) shows poor reproducibility at 29.85 % difference indicating non-homogeneous gold distribution.
2018 campaign
Quality control samples were inserted in the sample stream at a frequency allowing regular analysis of approximately two standards (or certified reference materials), two blanks and one field duplicate per lab batch. This is in addition to the lab's own QAQC samples. A typical batch size comprises of approximately 75 samples.
A total of 175 standards, 175 blanks and 87 field duplicates were sent for assay, for a total of 437 QAQC samples.
Standards were inserted approximately every 33 samples. Specific selection of standards was based on the expected grade of neighboring samples. Most of the assay results were within 1 to 1.5 times their published standard deviation, well within accepted ranges.
Blanks consisted of coarse crushed Quartzite purchased in 20-30 lbs pouches from the ALS Canada laboratories in Val-d'Or. This same material is used by the lab to clean their grinding equipment and has been repeatedly analyzed to ensure it is absence of gold.
A total of 175 blanks were sent for assays. They were inserted very frequently to minimize the potential of contamination, as visible gold was known to occur and could potentially smear at different stages in the sampling/analysis protocol. Blanks were therefore inserted in the sample stream after each occurrence of visible gold and after each section of potentially mineralized rock. In cases of highest potential mineralization, blanks were inserted in between each sample; blanks were also inserted after high grade standards. In extensive zones without obvious mineralization, approximately two blanks per 75 samples were inserted in the sample string.
A total of 87 field duplicates, consisting of quarter core, were sent for assay. This type of sample is an industry standard even though it does not conclusively test the lab accuracy, due to inherent nonhomogeneous distribution of gold in the core. But for this same reason, it can help characterize the distribution of the mineralization.
|
8.3 |
2018 – 2019 Eastmain Resources Diamond Drilling |
|
a) |
Preparation Method |
Samples intervals were recorded with red grease pencil on the drill core during logging. Each sample, generally a half metre or one metre in length whenever possible, was assigned a laboratory sample number for analytical purposes. Although most samples were restricted to a particular unit some intervals occasionally cross lithological boundaries to maintain consistent sampling intervals. Any intervals with sediments were sampled with one metre samples. Intervals displaying alteration, quartz flooding or veining, shearing and sulphide mineralization were sampled with half metre samples.
Drill core was split with a diamond-bladed tile saw. To prevent any contamination between split samples a concrete construction brick was cut between each sample interval. One-half of each core sample was consistently returned to the core box with a duplicate sample identifier tag. Core boxes were then cross piled on-site for future reference.
The other half of the split core was placed in a plastic sample bag with a corresponding duplicate sample tag as supplied by ALS lab and sealed with black electrical tape. The exterior of each plastic sample bag was also labeled with its sample number.
Sample bags were then placed into standard fiber rice shipping bags, which were also sealed for shipment with cable ties and fiber tape. Samples bags were sent to the lab securely.
|
b) |
Method of analysis |
Samples for the 2018-2019 drilling campaign were sent to ALS Minerals in Rouyn Noranda for preparation and then analyzed at the Vancouver facility. Rock sample preparation involved the entire sample being passed through a primary crusher to yield a crushed product in which 70% of the sample passes through a 2 mm (-10 mesh) screen. Some large samples require division of one or more size fraction into representative splits. The entire sample is transferred to a tray and then repeatedly passed through a riffle splitter until a split size of up to 1,000 g has been obtained. Sample reject is returned to its original package or, if necessary, to a more suitable container. The crushed sample split, up to 1,000 g, is ground using a ring mill pulverizer using a chrome steel ring set. All samples are pulverized to at least 85% of the ground material passing through a 75 μm screen.
Samples were assayed by Au-AA24, which is a gold analysis by fire assay and AAS finish, on 5O g nominal weight. Samples returning values >3 g/t Au, were re-assayed by Au-GRA22: Au by fire assay and gravimetric finish. All samples were also analyzed for a 48-element package by four acid digestion and ICP-AES and ICP-MS finish (ICP ME-MS61). Results are corrected for spectral interelement interferences.
|
c) |
QAQC |
Quality control samples were inserted in the sample stream. They inserted one of the three standards, one of the two blanks (brick or gravel) and field duplicate. Standards and blank were inserted into the core sampling sequence and underwent the same preparation and analysis as these.
Standards have different gold values and are Oreas 217 (0.337 g/t Au), 214 (3.03 g/t Au) and 220 (0.866 g/t Au) and are made by Ore & Research Exploration Pty Ltd (ORE), specialist in the development of certified materials of reference.
For this campaign:
|
- |
Standards were attributed to the samples ending by 10, 40, 60, 90 |
|
- |
Blanks to the samples ending by 00, 20, 50, 70 |
|
- |
Samples terminated by 29 or 79 have a duplicate (sample’s number ending by 30 or 80). |
QA/QC programs using internal and lab standard and blank samples, field and lab duplicates and indicate good overall accuracy and precision.
For the Oreas 214, there is one outside value for the Au-AA24 analysis (#X470091). For the Oreas 214, there are two outside values for the gravimetric finish analysis (#X470091 and #X469140). For the Oreas 220, there is two outside values (#X463660 and #X470210). For the Oreas 217, there are five outside values (#X466840, #X467140, #X467190, #X468290, #X470340). Despite theses values, the overall values indicate a good accuracy and precision for the standards.
For the brick blanks, there is one outside value (# X467570) and for the gravel blanks, there are four outside values (#X462370, #X465426, #X465820, #X470070). Despite theses values, the overall values indicate a good accuracy and precision for the blanks.
|
8.4 |
2024 – Fury Gold Mines Diamond Drilling |
|
a) |
Preparation method |
Core recovery is generally very good to excellent, allowing for representative samples to be taken and accurate analyses to be performed. Half-core samples, 0.5 m to 1.5 m long, were taken. The core was sampled along the entire length of each hole. Samples intervals were recorded with red grease pencil on the drill core during logging. Each sample was assigned a laboratory sample number for analytical purposes.
The sample is split along the cutting line and starting and stopping at the marked red arrows on the core. Place one half of the core in the bag and place the other half back in the core box with the cut face upwards. He/she is to place the sample end pieces (the core marked with red arrows) cut face side up, with the arrows pointing in the appropriate direction.
Samples with native gold were identified. This was to make sure the core cutting blade was cleaned before and after each of these mineralized samples by cutting through a concrete block.
Split core samples were placed in fiber rice bags in batches and labelled for shipment to ALS laboratories (ISO/IEC 17025:2017 and ISO 9001:2015 accredited facility) for preparation and analysis. These sacks were sealed with cable ties and fiber tape and shipped by commercial transport companies directly to the lab. A control file, the laboratory sample dispatch form, includes the sample-bag numbers in each shipment. The laboratory sample dispatch form accompanies the sample shipment and is used to control and monitor the shipment. The lab sends a confirmation email with detail of samples received upon delivery.
The Fury sample preparation and analysis methodology flow sheet, with ALS method codes, is depicted graphically in Figure 8.
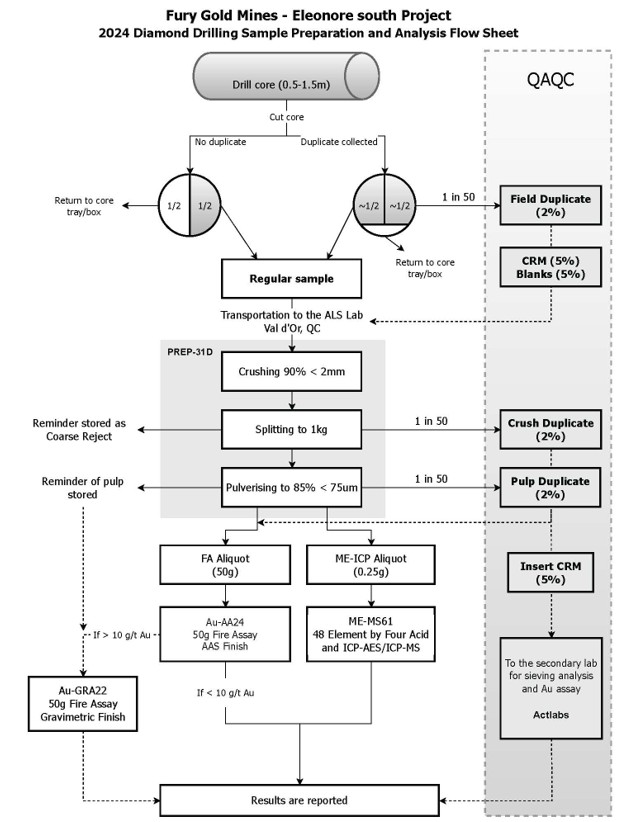
Figure 9 - Fury Gold Mines - Sample preparation and analysis flow
All drilling assay samples were collected by Fury personnel. Once verified, samples were kept in the exploration camp.
Assay samples were collected by appropriately qualified staff at the laboratories. Sample security involved two aspects: maintaining the chain of custody of samples to prevent inadvertent contamination or mixing of samples and rendering active tampering as difficult as possible.
|
d) |
Method of analysis |
All sample from 2024 drilling campaign were sent to ALS Lab in Rouyn-Noranda, Val d’Or, QC, and Sudbury, ON for preparation and analysis. All samples are assayed using 50 g nominal weight fire assay with atomic absorption finish (Au-AA24) and multi-element four acid digest ICP-AES/ICP-MS method (ME-MS61). Where Au-AA24 results were greater than 3 ppm Au the assay was repeated with 50 g nominal weight fire assay with gravimetric finish (Au-GRA22).
QA/QC programs using internal standard samples, field and lab duplicates and blanks indicate good accuracy and precision in a large majority of standards assayed. True widths of mineralization are unknown based on current geometric understanding of the mineralized intervals.
|
e) |
QAQC |
Quality Control (QC) samples are introduced into the sample stream at a rate of 5% for both blank samples and CRM samples. Field duplicates in the form of quarter sawn core samples, are introduced into the sample stream at a rate of 1 in 50 samples.
Standards have different gold values and are Oreas 250b (0.32 g/t Au), 230 (0.337 g/t Au) and 256b (7.84 g/t Au) and are made by Ore & Research Exploration Pty Ltd (ORE), specialist in the development of certified materials of reference.
Standards and blank were inserted into the core sampling sequence and underwent the same preparation and analysis as these. Coarses blank (silica blank) were inserted also, to verify the crushing and preparation. Duplicates were inserted also to have an estimation of the reproducibility linked to the uncertainties inherent in the analysis method and the homogeneity of the pulps.
For this campaign:
|
- |
Standards were attributed to the samples ending by 13, 53 and 93 |
|
- |
Blanks to the samples ending by 33 and 73 |
|
- |
Duplicates were introduced at a rate of 1 in 50 samples (preferentially in mineralized areas). |
In mineralized areas or likely to have high contents of gold, a blank was added to clean and estimate the potential contamination. Moreover, each mineralized areas must have a standard if none is present following the previous distribution.
QA/QC programs using internal and lab standard and blank samples, field and lab duplicates and re-assay indicate good overall accuracy and precision.
|
8.5 |
Summary |
In the opinion of The Author, the logging, sampling, assaying, and chain of custody protocols practiced through the history of the Project meet or exceed industry standards. The drill programs have been configured and carried out in a manner that is appropriate for the geometry of the known mineralization. Drill holes are oriented perpendicular to strike and aimed to intersect the zones at an angle generally greater than 45°. As such, the samples should be representative of the mineralization as it is presently known.
The Author has reviewed the QC reports and files, as well as the laboratory procedures undertaken and conclude that the QC program for the Project is sufficient to support the current level of exploration. QC sample failures were dealt with on a case-by-case basis and were documented with commentary in the Dispatch Returns table within the database.
|
9 |
Data Verification |
|
9.1 |
Site Inspection |
The Author has been involved in all exploration programs on the Project since 2020 and was last on-site August 2024.
|
9.2 |
Database Verification |
Comprehensive data verification was performed by Fury Gold Mines. These included checks against original data sources, standard database checks such as from/to errors and basic visual checks for discrepancies with respect to topography and drillhole deviations.
The Author has been personally involved in the integration and merging of the historical drill data into the current database. This work included relogging of historical holes to provide consistency of logging codes across all generations of drilling, as well as spot checks of drill core versus drill logs to verify the geologic model. During this process sample intervals were verified. Lastly, the assay database was compared to original assay certificates. No errors were found within the geologic or assay databases.
|
9.3 |
2020 through 2024 Quality Assurance and Quality Control |
Exploration work completed by Fury was conducted using documented procedures and protocols involving extensive exploration data verifications and validation. During drilling, experienced Fury geologists implemented industry standard best practices designed to ensure the reliability and trustworthiness of the exploration data.
Fury monitored the analytical quality control data on a regular basis. Failures of quality control samples were investigated, and appropriate actions taken, including re-assaying of samples within batches containing a failure. Results from re-assayed batches replace the original assay of the failed batch.
Fury’s internal QA/QC procedures include the insertion of Certified Reference Materials (CRMs), field blanks and duplicates representing a minimum of 7% of samples assayed. When visible gold was observed additional CRMs and blanks were inserted immediately following the suspected high-grade to test lab contamination.
Analytical results for duplicate samples were reviewed and compared for any extreme outliers. Given the highly variable nature of gold mineralization duplicate analyses were used qualitatively to determine the degree of variance within the particular prospect being drilled.
|
9.3.1 |
Certified Reference Material |
Internal Certified Reference Materials (CRMs) were inserted into the sample stream at a rate of 3%. The tolerance limits for accuracy were considered to be two standard deviations above or below the expected value. CRMs returning values outside of the defined tolerance limits were marked as failed and Fury requested the analytical laboratory to re-assay the analytical batch that contained the failed standard. The CRMs utilized during Fury’s drilling programs are Oreas 230 (certified value of 0.337 ppm), Oreas 250b (certified value of 0.332 ppm) and Oreas 256b (certified 7.84 ppm).
|
9.4 |
Conclusions |
It is the opinion of The Author that the data verification and QA/QC procedures implemented by Fury and its predecessor operators of the Project meet or in most cases exceed industry best practices. The Éléonore South Project has seen consistent implementation of these practices from early in the Project’s history.
Since acquiring the Project, Fury has implemented strict scrutiny of the QA/QC results and has dealt with any notable issues directly with the analytical laboratory in a timely fashion.
The geological and assay databases are well maintained and the current protocols in place should ensure the database remains reasonably error free. The database in its present form is suitable for use in a Mineral Resource Estimation.
|
10 |
Mineral Processing and Metallurgical Testing |
There has been no metallurgical testing completed on the Éléonore South project.
|
11 |
Mineral Resource Estimate |
There are no Mineral Resource Estimates for the Éléonore South Project.
|
12 |
Mineral Reserve Estimates |
Due to the early stage of the Project there are no mineral reserve estimates.
|
13 |
Mining Methods |
Due to the early stage of the Project no studies regarding mining methodology have been completed.
|
14 |
Processing and Recovery Methods |
Due to the early stage of the Project no studies regarding recovery methods have been completed.
|
15 |
Infrastructure |
Due to the early stage of the Project no studies regarding the required infrastructure for future development have been completed.
|
16 |
Market Studies |
Due to the early stage of the Project no Market studies have been completed.
|
17 |
Environmental Studies, Permitting, and Plans, Negotiations, or Agreements with Local Individuals or Groups |
Due to the early stage of the Project this section is not applicable.
|
18 |
Capital and Operating Costs |
Due to the early stage of the Project this section is not applicable.
|
19 |
Economic Analysis |
Due to the early stage of the Project this section is not applicable.
|
20 |
Adjacent Properties |
|
20.1 |
Cheechoo Project – Sirios |
The northeast side of the Éléonore South Property is adjacent to The Cheechoo Project held by Sirios. In July 2022 Sirios mandated BBA Inc. (BBA) to perform a Mineral Resources Estimate (MRE) on the Cheechoo gold deposit host by the Cheechoo Tonalite. The updated resource estimate based on an open pit development model, includes indicated resource of 1.4 million ounces of gold contained in 46.3 million tonnes at an average grade of 0.94 g/t Au, and an inferred resource of 0.5 million ounces of gold contained in 21.1 million tonnes at an average grade of 0.73 g/t Au (see Sirios 2022, December 06th News Release).
Table 16 - Conceptual pit-constrained Indicated and Inferred Resource Estimate for the Cheechoo Project
|
Indicated |
Inferred |
|||||
|
Cut-off Grade |
Tonnage |
Au |
Au |
Tonnage |
Au |
Au |
| (Au g/t) |
(Mt) |
(g/t) |
(oz) |
(Mt) |
(g/t) |
(oz) |
|
0.35 |
46.3 |
0.94 |
1,404,000 |
21.1 |
0.73 |
494,000 |
|
20.2 |
Éléonore Mine – Newmont |
The northwest side of the Éléonore South Property is adjacent to the Éléonore Mine Project held by Newmont. The Éléonore Mine is host of the Roberto Gold Deposit. The mine is an underground operation and started its activity in 2015. Newmont state an annual production of 215 Koz. Gold comes from the Roberto Deposit, which is marked by complex folding and faulting. To this day, the Roberto ore deposit is still open down plunge. The ore is mined from four horizons using sill and stope techniques, then processed on site using a conventional circuit that includes crushing, grinding, gravity, flotation and cyanidation (Newmont Website).
|
21 |
Other Relevant Data and Information |
The Author is not aware of any additional data or information available for disclosure.
|
22 |
Interpretation and Conclusions |
The Éléonore South project is an early-stage exploration project with limited previous drilling and sampling completed. The drilling completed to date has confirmed the presence of a Reduced Intrusion Related Gold System (RIRGS) within the southern portion of the Cheechoo Tonalite. Additionally, surface work completed by Fury has identified several gold in soil anomalies and biogeochemical anomalies which all require additional follow up work.
|
23 |
Recommendations |
Future exploration efforts should focus on the high-grade gold potential of the Cheechoo tonalite while also continuing to advance the identified gold in soil and biogeochemical anomalies to the drill ready stage. The recommended Phase 1 work program consists of a 5,000 – 6,000 m drilling program targeting the robust Eleonore style gold targets identified through the biogeochemical sampling program. The Phase 1 program is estimated to cost approximately $3.1 million (Table 18).
The Phase 2 exploration program will be drill intensive. An additional 10,000 – 20,000 m of diamond and reverse circulation drilling should be completed to follow up on the results from the phase 1 program as well as within the Cheechoo Tonalite to determine if sufficient continuity of gold mineralization is present to prepare a maiden mineral resource estimate. The Phase 2 program is estimated to cost between $7.5 and $10 million (Table 18).
Table 17 - Recommended Work Programs for 2025 and beyond
|
Phase 1 |
||
|
Type |
Details |
Cost Estimate (C$) |
|
Labour |
Staff Wages, Technical and Support Contractors |
500,000 |
|
Assaying |
Sampling and Analytical |
400,000 |
|
Drilling |
Diamond Drilling (5,000m at $150/m) |
750,000 |
|
Land Management |
Consultants. Assessment Filing, Claim maintenance |
5,000 |
|
Community Relations |
Community Tours, Outreach |
10,000 |
|
Information Technology |
Remote site communications and IT |
5,000 |
|
Safety |
Equipment, Training and Supplies |
5,000 |
|
Expediting |
Expediting |
7,500 |
|
Camp Costs |
Equipment, Maintenance, Food, Supplies |
200,000 |
|
Freight and Transportation |
Freight, Travel, Helicopter |
600,000 |
|
Fuel |
250,000 |
|
|
General and Administration |
100,000 |
|
|
Sub-total |
2,873,500 |
|
|
Contingency (10%) |
287,350 |
|
|
Total |
3,121,250 |
|
|
Phase 2 |
||
|
Type |
Details |
Cost Estimate (C$) |
|
Labour |
Staff Wages, Technical and Support Contractors |
1,250,000 |
|
Drilling |
Diamond Drilling (10,000 - 20,000m) |
2,000,000 |
|
Assaying |
Sampling and Analytical |
1,000,000 |
|
Community Relations |
Community Tours, Outreach |
25,000 |
|
Information Technology |
Remote site communications and IT |
10,000 |
|
Safety |
Equipment, Training and Supplies |
125,000 |
|
Expediting |
Expediting |
150,000 |
|
Camp Costs |
Equipment, Maintenance, Food, Supplies |
550,000 |
|
Freight and Transportation |
Fright, Travel, Helicopter |
1,500,000 |
|
Fuel |
600,000 |
|
|
General and Administration |
250,000 |
|
|
Sub-total |
7,460,000 |
|
|
Contingency (10%) |
746,500 |
|
|
Total |
8,206,000 |
|
|
24 |
References |
Abitibi Geophysics. (2007). Logistics and Interpretation Report, Resistivity / Induced Polarization Survey, Éléonore South, Azimut C Project. GM 64031
Bandyayera, D., Fliszár, A., (2007). Géologie de la région de la baie Kasipasikatch (33C09) et du lac Janin (33C16), MRNF, RP 2007-05.
Bandyayera, D., Rhéaume, P., Maurice, C., Bédard, É., Morfin, S., Sawyer, E., (2010). Synthèse géologique du secteur du réservoir Opinaca, Baie-James, MRNF, RG 2010-02.
Barr, H.W., Buxbaum, W., Farkas, M.S., Rainey, K.D., and Lund, J., (1974). Summary report on mineral resource studies in the James Bay Region. SDBJ. 294 pages. GM 34002
Boudrias, G., Tuchscherer, M. G., Bissonnette, F., (2019). Report on Exploration Work, Éléonore South Property, Summer-Fall 2016, Eeyou Istchee James Bay, Quebec, 20 pages. GM 71311
Boudrias, G., Tuchscherer, M. G., Bissonnette, F., (2019). Report on Drilling Program, Éléonore South Property, Summer-Fall 2016 and Year 2017, Eeyou Istchee James Bay, Quebec, 43 pages. GM 71346
Boudrias, G., Tuchscherer, M. G., Bissonnette, F., (2019). Report on Exploration Work, Éléonore South Property, Summer-Fall 2017, Eeyou Istchee James Bay, Quebec, 24 pages. GM 71972
Boudrias, G., Tuchscherer, M. G., Bissonnette, F., (2019). Report on Drilling Program, Éléonore South, Winter of 2018. GM 71647
Cadéron Sandrine. (2003). Interprétation tectonométamorphique du nord de la province du Supérieur, Québec, Canada. Thèse de doctorat, Université du Québec à Montréal, 343 pages
Canova, E., Farkas, A., Tolhurst, J., (2010). Éléonore South Project, Report on 2009 drill and mapping programs for Eastmain Resources inc. NI 43-101 Report. 1,337 pages. GM 65239
Caron, Dufour, Seguin et Associes, (1972). Evaluation du potentiel minier du bassin de la Baie James. SDBJ. 1,224 pages. GM 34000
Card, K., (1990). A review of the Superior Province of the Canadian Shield, a product of Archean accretion. Precambrian Research 48(1-2): pp. 99-156.
Charbonneau, R. (lnlandsis Consultants}, (2010). Till sampling 2008, Éléonore project. Eastmain Resources Inc., Exploration Azimut Inc., Les Mines Opinaca Ltee, Wemindji Exploration Inc. 256 pages. GM 65193
David, J., Parent, M., (1997). Géochronologie U-Pb du Projet Moyen-nord, 88 pages. GM59903
David, J., Vaillancourt, D., Bandyayera, D., Simard, M., Dion, C., Goutier, J., Barbe, P., (2010). Datations U-Pb effectuées dans les sous provinces d’Ashuanipi, de La Grande, d’Opinaca et d’Abitibi en 2008–2009, MRNF, Québec, RP 11, 37 pages.
Dubé et al., (1976). Compilation géologique du territoire de la baie James. DP 358
Dubé, B. and Gosselin, P. (2007). Greenstone-hosted quartz-carbonate vein deposits. In Goodfellow, W.D., ed. Mineral Deposits of Canada: A Synthesis of Major Deposit-Types, District Metallogeny, the Evolution of Geological Provinces, and Exploration Methods. Geological Association of Canada, Mineral Deposits Division, Special Publication No. 5, pp.49-73.
Doyon V., (2022). Rapport de travaux statutaires: décapage, propriété ESJV. GM 73120
Doyon V., Leghay S., (2024). Travaux statutaires Éléonore Sud, campagne de forage et de biogéochimie 2024. Not published yet.
Fontaine, A., Dubé, B., Malo, M., McNicoll, V., Brisson, T., Doucet, D., Goutier, J., (2015). Geology of the metamorphosed Roberto gold deposit (Éléonore mine), Baie-James region, Québec: diversity of mineralization styles in a polyphase tectono-metamorphic setting, in Targeting Geoscience Initiative 4, Geological Survey of Canada Open File 7852.
Fontaine, A., Dubé, B., Malo, M., Ravenelle, J-F., Fournier, E., McNicoll, V.J., Beausoleil, C., Prud’homme, N., Goutier, J., (2017). The Éléonore gold mine: Exploration, Discovery and Understanding of an emerging gold district in Eeyou Istchee James Bay, Superior Province, Northern Québec, Canada; in Proceedings of Exploration 17: Sixth Decennial International Conference on Mineral Exploration, (ed.) V. Tschirhart and M.D. Thomas; Decennial Minerals Exploration Conferences, Toronto, Ontario, pp. 601-617.
Gauthier, M., et Larocque, M., (1996). Style et répartition des minéralisations métalliques sur la Basse et la Moyenne‐Eastmain, Territoire de la Baie‐James. « Vers de nouvelles découvertes » séminaire d’information sur la recherche géologique, 15 pages.
Gauthier, M. et Laroque, M., 1998. Cadre géologique, style et répartition des minéralisations métalliques de la basse et de la moyenne-Eastmain, Territoire de la Baie James. Ministère des ressources naturelles du Québec, MB 98-10, 85 pages.
Gauthier, M., Trépanier, S., Gardoll, S., (2007). Metamorphic gradient: A regional-scale area selection criterion for gold in the northeastern Superior province, eastern Canadian Shield. Society of Economic Geologists Newsletter 69: pp. 10-15.
Goutier J., Dion c., Oullette M.C.., Davis D.W.., David J., Parent M. (2002). Géologie de la région du lac Guyer (33G/05, 33G/06 ET 33G/11), Géologie Québec, RG 2001‐15.
Geotech Ltd., (2005). Report on a helicopter-borne time domain electromagnetic geophysical survey, Azimut C block. Eastmain Resources inc. 40 pages. GM 62241
Geotech Ltd., (2006). Report on a helicopter-borne time domain electromagnetic geophysical survey, Éléonore North, Éléonore West blocks, James Bay, Quebec, Canada. Eastmain Resources Ltd. 30 pages. GM 63373
Hamilton, M.A., (2009). Datation isotopique (U-Pb) d’un diabase de l’Essaim de dykes de Mistassini. Rapport statutaire déposé au Ministère de l’Énergie et des Ressources naturelles, Québec; MB 2009-17, 13 pages.
Jourdain, V. (2006). Interpretation of geophysical survey Azimut Block. GM 62242
Kendle, F.R., Tolhurst, J., (2007). Éléonore South Project, Report on exploration activities in 2006 for Eastmain Resources Inc., Vol. 1, NI 43-101 Report, 2,642 pages. GM 63371
Kendle, F.R., Tolhurst, J., Perkins, M. (2008). Report on exploration activities in 2007, Éléonore South Project, Eastmain Resources. 1,337 pages. GM 64030
Kendle, F.R., (2009). Éléonore South Project, Report on 2008 drill program for Eastmain Resources Inc., NI 43-101 Report, Vol. 1 of 7). 1,590 pages. GM 64367
Marleau, R.A., (1979). Etude préliminaire du potentiel en minéraux industriels et certains métalliques du territoire. SDBJ. 128 pages. GM 38167
Morfin, S., Sawyer, E., Bandyayera, D., (2013). Large volumes of anatectic melt retained in granulite facies migmatites: An injection complex in northern Québec. Lithos 168: pp. 200-218.
Morfin, S., Sawyer, E.W., Bandyayera, D., (2014). The geochemical signature of a felsic injection complex in the continental crust: Opinaca Subprovince, Québec. Lithos 196: pp. 339-355.
Moukhsil, A., Legault, M., Baily, M., Doyon, J. Sawyer, E., Davis, D.W., (2003). Synthèse géologique et metallogénique de la ceinture de roches vertes de la Moyenne et Basse-Eastmain (Baie James). MERN. 57 pages. ET 2002-06
Parent M (2011) Compilation géochronologique U-Pb des sous-provinces d'Ashuanipi, d'Opinaca, d'Opatica et de La Grande, GM65524
Percival, J.A., Mortensen, J.K., Stern, R.A., Card, K.D.,Begin, N.J., (1992). Giant granulite terrane of northeastern Superior Province: The Ashuanipi Complex and Minto block; Canadian Journal of Earth Sciences, volume 29, pages 2287-2308.
Percival, J.A., Skulski, T., Sanborn-Barrie, M., Stott, G.M., Leclair, A.D., Corkery, M.T., Boily, M., (2012). Geology and tectonic evolution of the Superior Province, Canada. Tectonic Styles in Canada: The LITHOPROBE Perspective. Edited by JA Percival, FA Cook, and RM Clowes. Geological Association of Canada Special Paper 49: pp. 321-378.
Piché M., (2022). Rapport de travaux de sondage au diamant sur la propriété Éléonore-Sud, Baie-James -2018-2019. GM 73121
Ravenelle, J.-F., Dubé, B., Malo, M., Mcnicoll, V., Simoneau, J., (2010). Insights of the geology of the World-class Roberto gold deposit, Eleonore property, James Bay, Québec. Geological Survey of Canada, Current Research 2010-1
Ravenelle J-F (2013) Amphibolite facies gold mineralization: an exemple from the Roberto deposit, Eleonore property, James Bay, Quebec, Université du Québec, Institut national de la recherche scientifique, 325 pages.
Reed, L. (2007). Report on Exploration Activity in 2007 VTEM interpretation and mineralogy. GM 64032
Remick, J.H., (1976). Wemindji area (Municipalité de la Baie James) - Preliminary report. DPV 446. 57 pages.
Richard, P.L., Evangelista, D., Ford K., (2022). Mineral Resource Estimate Update for the Cheechoo Project, Eeyou Istchee James Bay, Québec, Canada, dated July 20, 2022. Prepared by BBA for Sirios Resources Inc. 213 pages.
Robinson, D., and Tolhurst, J. (2011). Report on 2010 Drill and Mapping Programs, Éléonore South Project, Eastmain Resources. 3,377 pages. GM 65891
Robinson, D. (2014). Evaluation of 2012 LIDAR Surveys, Clearwater, Éléonore South and Reservoir blocks. GM 68093
Sawyer, E.W., and Barnes, S.-J., (1994). Thrusting, magmatic intraplating, and metamorphic core complex development in the Archaean Belleterre-Angliers Greenstone Belt, Superior Province, Quebec, Canada: Precambrian Research, v. 68, p. 183-200.
Simard, M., Gosselin, C., (1999). Géologie de la région du Lac Lichteneger. MERN. 26 pages. RG 98-15.
Taner, M. (2007). Report on the Petrographic and Mineralogical Study of Samples from the Opinaca Area. GM 64033
Tremblay, M., Marleau, R.A., (1973). Etude de la géologie et du potentiel minéral du territoire de la Baie James. SDBJ. 1,146 pages. GM 34001
Turgeon, D., Comeau, M-J., Mailloux J., Rheaume Ouellet, A., McGuinty, B., (2019). Summary of 2019 Exploration Field Work, Éléonore South Joint-Venture. GM 73381
Wodicka N, Lamothe D, Leclair A (2009). Géochronologie U-Pb du Projet Ashuanipi, Ministère des Ressources naturelles.
Azimuth News release
November 24, 2003, Azimut stakes seven Au and Ni-Cu-PGE exploration projects in Quebec following mineral potential modeling of two regions.
November 22, 2004. Azimut increases its holdings near the Éléonore Gold Discovery.
March 30, 2005. Azimut and Eastmain sign agreements for two claim blocks near the Éléonore gold discovery in James Bay, Quebec.
April 27, 2006. Azimut signs a Three-Way Joint Venture with Goldcorp and Eastmain for the Éléonore South Property, James Bay.
|
25 |
Reliance on Information Provided by the Registrant |
The author as a full time employee of the Registrant, Fury, does not claim reliance on any other party with respect to the information provided or the opinions expressed herein, having reviewed, and found satisfactory such corporate and other documentation as deemed necessary to assume responsibility for such information and opinions as are expressed herein.
|
26 |
DATE AND SIGNATURE PAGE |
This report entitled “S-K 1300 Technical Report Summary on the Eleonore South Project, Quebec, Canada” with an effective date of March 20, 2025 was prepared and signed by:
| Signed: |
 |
Valerie Doyon, P. Geo.
Senior Project Geologist, Fury Gold Mines Limited
Appendix 1 –Eleanore South Claims List
Exhibit 15.4
CONSENT OF EXPERT
March 31, 2025
VIA EDGAR
UNITED STATES SECURITIES AND EXCHANGE COMMISSION
| Re: |
Fury Gold Mines Limited (the “Company”) |
I, Bryan Atkinson, P. Geol, Senior Vice-President, Exploration of the Company, in connection with the Form 20-F, hereby consent to:
|
● |
the public filing by the Company and the use of the technical report titled “S-K 1300 Technical Report Summary on the Committee Bay Project, Nunavut Territory, Canada, with an effective date of December 31, 2023 and an issue date of March 13, 2024 (the “Technical Report Summary”) that was prepared in accordance with Subpart 1300 of Regulation S-K (“S-K 1300”) promulgated by the United States Securities and Exchange Commission (the “SEC”), as an exhibit to and as referenced in the Form 20-F; |
|
● |
consent to the incorporation by reference of the Form 20-F and references to the Technical Report Summary and to my status as “qualified person” in the registration statement on Form F-10 of the Company (333-272658) (the “Form F-10”); |
|
● |
the use of and reference to my name, including my status as an expert or “qualified person”, as defined in S-K 1300 in connection with the Form 20-F, the Form F-10 and the Technical Report Summary; and |
|
● |
any extracts from or a summary of the Technical Report Summary included or incorporated by reference in the Form 20-F and the Form F-10 and the use of any information derived, summarized, quoted or referenced from the Technical Report Summary included or incorporated by reference in the Form 20-F and the Form F-10. |
Yours truly,
/S/Bryan Atkinson
Bryan Atkinson, P.Geol.
Senior Vice-President, Exploration of the Company
Exhibit 15.5
CONSENT OF EXPERT
March 31, 2025
VIA EDGAR
UNITED STATES SECURITIES AND EXCHANGE COMMISSION
|
Re:
|
Fury Gold Mines Limited (the “Company”) Annual Report on Form 20-F for the year ended December 31, 2024 (the “Form 20-F”) |
I, Valerie Doyon, P. Geo, Senior Project Geologist of the Company, in connection with the Form 20-F, hereby consent to:
|
● |
the public filing by the Company and the use of the technical report titled “S-K 1300 Technical Report Summary on the Eau Claire Project, Quebec, Canada, with an effective date of December 31, 2024 and the technical report titled “S-K 1300 Technical Report Summary on the Eleonore South, Quebec, Canada, with an effective date of December 31, 2024 (together the “Technical Report Summaries”) that was prepared in accordance with Subpart 1300 of Regulation S-K (“S-K 1300”) promulgated by the United States Securities and Exchange Commission (the “SEC”), as an exhibit to and as referenced in the Form 20-F; |
|
● |
consent to the incorporation by reference of the Form 20-F and references to the Technical Report Summaies and to my status as “qualified person” in the registration statement on Form F-10 of the Company (333-272658) (the “Form F-10”); |
|
● |
the use of and reference to my name, including my status as an expert or “qualified person”, as defined in S-K 1300 in connection with the Form 20-F, the Form F-10 and the Technical Report Summaries; and |
|
● |
any extracts from or a summary of the Technical Report Summaries included or incorporated by reference in the Form 20-F and the Form F-10 and the use of any information derived, summarized, quoted or referenced from the Technical Report Summaries included or incorporated by reference in the Form 20-F and the Form F-10. |
Yours truly,
/s/ Valerie Doyon
Valerie Doyon, P.Geo
Senior Project Geologist of the Company
Exhibit 15.6

CONSENT OF INDEPENDENT REGISTERED PUBLIC ACCOUNTING FIRM
We hereby consent to the inclusion in the Annual Report on Form 20-F for the year ended December 31, 2024 of Fury Gold Mines Limited of our report dated February 28, 2025, relating to the consolidated financial statements of Dolly Varden Silver Corporation, which appears in this Annual Report.
/s/ DAVIDSON & COMPANY LLP
| Vancouver, Canada | Chartered Professional Accountants |
March 31, 2025
Exhibit 15.7
FURY GOLD MINES LIMITED
NOTICE OF ANNUAL GENERAL MEETING OF SHAREHOLDERS
TO BE HELD ON JUNE 26, 2024
AND
MANAGEMENT INFORMATION CIRCULAR
May 14, 2024

Suite 1630, 1177 West Hastings Street
Vancouver, British Columbia, Canada, V6E 2K3
Telephone No.: +1 844-601-0841
NOTICE OF ANNUAL GENERAL MEETING OF SHAREHOLDERS
NOTICE IS HEREBY GIVEN that the annual general meeting (the “Meeting”) of the holders (“Shareholders”) of common shares (“Common Shares”) of Fury Gold Mines Limited (“Fury Gold” or the “Company”) will be held virtually at www.agmconnect.com/Fury2024 on June 26, 2024 at 11:00 a.m. (Toronto time) for the following purposes:
|
1. |
to receive and consider the recently filed audited consolidated audited financial statements of the Company for its fiscal year ended December 31, 2023; |
|
2. |
to elect directors of the Company for the ensuing year; |
|
3. |
to appoint auditors of the Company for the ensuing year; |
|
4. |
to transact such other business, if any, as may properly come before the Meeting. |
The Company’s Management Information Circular (the “Information Circular”) dated May 14, 2024, accompanies this Notice of Annual General Meeting (the “Notice”). The Information Circular contains further particulars of matters to be considered at the Meeting. The Meeting may also consider any permitted amendment to or variation of any matter identified in this Notice, and may transact such other business as may properly come before the Meeting or any adjournment thereof. The Annual Financial Statements are available for download from the Company’s website and its SEDAR+ profile at www.sedarplus.ca and at www.agmconnect.com/fury2024. Paper copies can be requested by contacting AGM Connect by emailing support@agmconnect.com. Shareholders will require their voter ID and meeting code to be verified. As of the date of this Information Circular, the Company does not anticipate that any other matters will come before the Meeting and the Company would be required to make additional disclosure should it later decide that any material matter needs to be brought before shareholders.
Fury Gold is conducting the Meeting online by virtual webcast. Shareholders and duly appointed proxyholders must register to attend the Meeting and should review the section “Attending the Meeting” in the Information Circular which section has the instructions on how to register to attend the Meeting online at www.agmconnect.com/fury2024 where they can participate, vote, or submit questions during the Meeting’s live webcast.
The Company has elected to use the notice-and-access model set out in National Instrument 51-102 – Continuous Disclosure Obligations and National Instrument 54-101 – Communications with Beneficial Owners of Securities of a Reporting Issuer (together “Notice-and-Access Provisions”) for delivery of proxy materials relating to this Meeting. The Notice-and-Access Provisions allow the Company to reduce the volume of materials to be physically mailed to Shareholders by posting the Information Circular and any additional annual meeting materials (together, the “Proxy Materials”) online on the Company’s website. Under Notice-and-Access Provisions, instead of receiving paper copies of this Notice and the Information Circular, registered Shareholders of the Company will receive the form of Notice and Access Notification (the “Notification”) and the form of proxy (the “Proxy”) relevant for the Meeting. In the case of the Company’s non-registered (beneficial) Shareholders, they will receive the Notification and a voting instruction form (the “VIF”). The Proxy/VIF enables Shareholders to vote by proxy. Before voting, Shareholders are reminded to review the Information Circular online by logging onto the website access page via the URL address provided and following the instructions set out below. Shareholders may also choose to receive a printed copy of the Information Circular by following the procedures set out below.
Copies of the Proxy Materials and the Annual Financial Statements and Annual MD&A are posted on the Company’s website at https://furygoldmines.com/investors/agmmaterials/ and are filed on SEDAR+ under the Company’s profile at www.sedarplus.ca.
If you do not wish to download information, paper copies of the Information Circular and Financial Statements can be obtained on request through the below contact information.
Any Shareholder unable to download a copy from www.sedarplus.ca may request a paper copy of the Information Circular and form of proxy and Financial Statements be mailed to them, at no cost by: contacting the Company at Suite 1630 – 1177 West Hastings Street, Vancouver, British Columbia, V6E 2K3 or by calling Tel: +1 844-601-0841. All Shareholders may email AGM Connect at support@agmconnect.com in order to obtain additional information relating to the Notice-and-Access Provisions or to obtain a paper copy of the Information Circular, up to and including the date of the Meeting, including any adjournment of the Meeting.
To allow adequate time for a Shareholder to receive and review a paper copy of the Information Circular and then to submit their vote by 11:00 a.m. (Toronto Time) on June 24, 2024 (the “Proxy Deadline”), a Shareholder requesting a paper copy of the Information Circular as described above, should ensure such request is received by the Company no later than June 17, 2024. Under Notice-and-Access Provisions, Proxy Materials must be available for viewing from the date of posting and for 1 year following the Meeting. Shareholders may request a paper copy of the Information Circular from the Company at any time during this period. To obtain a paper copy of the Information Circular after the Meeting date, please contact the Company.
The Company will not use a procedure known as ‘stratification’ in relation to its use of Notice-and-Access. Stratification occurs when a reporting issuer, while using Notice-and-Access Provisions, also provides a paper copy of the Information Circular to some of its shareholders with the notice package. In relation to the Meeting, all Shareholders will receive only the notice package, which must be mailed to them pursuant to Notice-and-Access Provisions, and which will not include a paper copy of the Information Circular.
The Information Circular contains details of matters to be considered and voted on at the Meeting. Please review the Information Circular before voting.
This year, the Company will be holding the Meeting by live audio webcast only. Shareholders will be able to participate in the Meeting and vote their Common Shares while the virtual Meeting is being held. Shareholders will not be able to attend the meeting in person. The Company hopes that hosting the Meeting using the AGM Connect platform will help enable greater participation by allowing Shareholders from all geographical locations to attend the meeting.
Shareholders who are unable to attend the Meeting and who wish to ensure that their Common Shares will be voted at the Meeting are asked to complete, date, and sign the form of proxy enclosed with the Notice-and-Access Notification mailed to them, or another suitable form of proxy, and physically or electronically deliver it, for receipt by 11:00 a.m. (Toronto time) on June 24, 2024, in accordance with the instructions set out in the form of proxy and in the Circular.
Non-registered Shareholders who plan to attend the Meeting must follow the instructions set out in the VIF enclosed with the Notice-and-Access Notification mailed to them to ensure that their Common Shares will be voted at the Meeting. If you hold your Common Shares in a brokerage account or through another intermediary, you are a non-registered Shareholder.
Dated at Vancouver, British Columbia, May 14, 2024.
BY ORDER OF THE BOARD
“Forrester (“Tim”) Clark”
Tim Clark
Chief Executive Officer (“CEO”) and Director
INFORMATION CIRCULAR CONTENTS
Suite 1630, 1177 West Hastings Street
Vancouver, British Columbia, Canada, V6E 2K3
Telephone No.: +1 844-601-0841
MANAGEMENT INFORMATION CIRCULAR
This management information circular (this “Circular”) is furnished in connection with the solicitation of proxies by the management of Fury Gold Mines Limited (the “Company”) for use at the annual general and meeting (the “Meeting”) of the holders of common shares (“Common Shares”) in the capital of Fury Gold (the “Shareholders”) to be held on June 26, 2024, at the time and place and for the purposes set forth in the accompanying Notice of Meeting. The information herein as of May 14, 2024, unless otherwise indicated.
In this Information Circular, references to “Fury Gold”, “the Company”, “we” and “our” refer to Fury Gold Mines Limited. “Common Shares” means common shares without par value in the capital of the Company. “Beneficial Shareholders” means Shareholders who do not hold Common Shares in their own name and “intermediaries” refers to brokers, investment firms, clearing houses and similar entities that hold securities on behalf of Beneficial Shareholders. All dollar amounts presented in this Information Circular are expressed in Canadian dollar amounts, unless otherwise stated that they are in United States dollars (“US$”).
The solicitation of proxies will primarily be by mail, subject to the use of Notice-and-Access Provisions (as defined below) in relation to delivery of the Information Circular, but proxies may be solicited personally or by telephone by directors, officers and regular employees of the Company. The Company will bear all costs of this solicitation. We have arranged for intermediaries to forward the meeting materials to beneficial owners of the Common Shares held of record by those intermediaries and we may reimburse the intermediaries for their reasonable fees and disbursements in that regard.
Notice-and-Access
The Company has chosen to deliver the Notice and this management information circular (together, the “Circular”) and form of proxy (the “Proxy” and, together with the Circular, the “Proxy Materials”) using notice-and-access provisions, which govern the delivery of proxy-related materials to Shareholders utilizing the internet. The notice-and-access provisions are found in section 9.1.1 of National Instrument 51-102 – Continuous Disclosure Obligations (“NI 51-102”) for delivery to registered Shareholders and in section 2.7.1 of National Instrument 54-101 – Communication with Beneficial Owners of Securities of a Reporting Issuer (“NI 54-101”) for delivery to Beneficial Shareholders (together, the “Notice-and-Access Provisions”).
The Notice-and-Access Provisions allow the Company to choose to deliver Proxy Materials to Shareholders by posting them on a non-SEDAR+ website (https://furygoldmines.com/investors/agmmaterials/), provided that the conditions of NI 51-102 and NI 54-101 are met, rather than by printing and mailing the Circular document together with the Proxy. Notice-and-Access Provisions can be used to deliver materials for both special and general meetings of shareholders. The Company may still choose to continue to deliver the Circular by mail under standard mailing provisions, and, pursuant to the Notice-and-Access Provisions, Shareholders are entitled to request a paper copy of the Circular document be mailed to them at the Company’s expense.
Use of the Notice-and-Access Provisions reduces paper waste and the Company’s printing and mailing costs. Under the Notice-and-Access Provisions, the Company must send a notice confirming internet availability (the “N&A Notification”) and a form of proxy (together, the “notice package”) to each Shareholder, including registered and Beneficial Shareholders, indicating that the Proxy Materials have been posted on the Company’s website and explaining how a Shareholder can access them or how they may obtain a paper copy of the Circular from the Company. The Circular has been posted in full, together with the Notification and the Proxy, on the Company’s website at https://furygoldmines.com/investors/agmmaterials/ and under the Company’s SEDAR+ profile at www.sedarplus.ca.
This Information Circular contains details of matters to be considered at the Meeting. Please review the Information Circular before voting.
How to Obtain Paper Copies of the Information Circular
Any Shareholder may request a paper copy of the Information Circular be mailed to them, at no cost by: contacting the Company at Suite 1630 – 1177 West Hastings Street, Vancouver, British Columbia, V6E 2K3 or by calling Tel: +1 844-601-0841. All Shareholders may call 1-855-839-3715 (toll-free) within North America, or from outside of North America +1-416-222-4202 in order to obtain additional information relating to the Notice-and-Access Provisions or to obtain a paper copy of the Information Circular, up to and including the date of the Meeting, including any adjournment of the Meeting. Shareholders should note the telephone toll-free number will not be available after the Meeting.
To allow adequate time for a Shareholder to receive and review a paper copy of the Information Circular and then to submit their vote by 11:00 a.m. (Toronto time) on June 24, 2024 (the “Proxy Deadline”), a Shareholder requesting a paper copy of the Information Circular as described above, should ensure such request is received by the Company no later than June 17, 2024. Under Notice-and-Access, Proxy Materials must be available for viewing from the date of posting and for one year following the Meeting. Shareholders may request a paper copy of the Information Circular from the Company at any time during this period. To obtain a paper copy of the Information Circular after the Meeting date, please contact the Company.
Pursuant to Notice-and-Access Provisions, the Company has set the record date for the Meeting to be at least 40 days prior to the Meeting in order to ensure there is sufficient time for the Proxy Materials to be posted on the applicable website and for them to be delivered to Shareholders. The form of Notification in the Company’s notice package (i) provides basic information about the Meeting and the matters to be voted on; (ii) explains how Shareholders can obtain a paper copy of the Information Circular and the related Annual Financial Statements and Annual MD&A; (iii) explains the Notice-and-Access Provisions process. The notice package which is being mailed to Shareholders by the Company in each case includes the applicable voting document: the Proxy for Registered Shareholders or a voting information form (“VIF”) in the case of Beneficial Shareholders.
The Company will not rely upon the use of ‘stratification’. Stratification occurs when a reporting issuer using Notice-and-Access Provisions provides a paper copy of the information circular with the notice to be provided to shareholders as described above. Instead, all Shareholders will receive only the notice package, which must be mailed to them under Notice-and-Access Provisions. All Proxy Materials, which have the information Shareholders require to vote in respect of all resolutions to be voted on at the Meeting, will be posted online. Shareholders will not receive a paper copy of the Information Circular from the Company, or from any intermediary, unless a Shareholder specifically requests one.
The Company will pay intermediaries, including Broadridge Financial Solutions (“Broadridge”), to deliver proxy-related materials to NOBOs (as defined below under Beneficial Shareholders) and the Company will not pay for delivery of proxy-related materials to OBOs (as defined below under Beneficial Shareholders).
The board of directors (the “Board”) has fixed May 10, 2024 as the record date (the “Record Date”) for the purpose of determining which Shareholders are entitled to receive the Notice of Meeting and vote at the Meeting or any adjournment(s) thereof. No person acquiring Common Shares after that date shall, in respect of such Common Shares, be entitled to receive the Notice of Meeting and vote at the virtual Meeting or any adjournment(s) thereof.
A quorum for the transaction of business at the Meeting is at least two (2) persons who are, or who represent by proxy, two (2) or more Shareholders who, in the aggregate, hold at least 25% of the issued Common Shares entitled to be voted at the Meeting.
VOTE USING THE FOLLOWING METHODS PRIOR TO THE MEETING
|
IF YOU HAVE RECEIVED PROXY FROM WITH A VOTER ID and MEETING ACCESS CODE FROM AGM CONNECT |
IF YOU HAVE RECEIVED A PROXY OR VIF WITH A 16-DIGIT CONTROL NUMBER FROM AN INTERMEDIARY |
||
|
Voting Method |
Registered Shareholders (your securities are held in your name in a physical certificate or DRS statement) |
Non-Registered Shareholders (your shares are held with a broker, bank or other intermediary) |
Non-Registered Shareholders (your shares are held with a broker, bank or other intermediary) |
|
Internet |
Login to https://app.agmconnect.com Using the Meeting Access Code and Voter ID provided to you complete the form to Submit Proxy |
Go to www.proxyvote.com Enter the 16- digit control number printed on the VIF and follow the instructions on screen |
|
|
|
Complete, sign and date the proxy form and email to: voteproxy@agmconnect.com |
N/A |
|
|
Telephone |
Call1-855-839-3715 to register your vote for the Fury Gold Mines AGM. |
N/A |
|
|
|
Enter your voting instructions, sign, date and return the form to AGM Connect in the enclosed envelope |
Enter your voting instructions, sign, date and return completed VIF in the enclosed postage paid envelope |
|
JOIN THE MEETING VIA THE FOLLOWING METHODS
|
IF YOU HAVE RECEIVED PROXY FROM WITH A VOTER ID and MEETING ACCESS CODE FROM AGM CONNECT |
IF YOU HAVE RECEIVED A PROXY OR VIF WITH A 16-DIGIT CONTROL NUMBER FROM AN INTERMEDIARY |
||
|
Registered Shareholders (your securities are held in your name in a physical certificate or DRS statement) |
Non-Registered Shareholders (your shares are held with a broker, bank or other intermediary) |
Non-Registered Shareholders (your shares are held with a broker, bank or other intermediary) |
|
|
PRIOR TO THE |
- |
Appoint yourself as proxyholder on your proxy and follow the instructions at www.agmconnect.com/fury2024 |
Appoint yourself as proxyholder as instructed herein and on the VIF. |
|
Following the proxy cut-off date, your appointed proxyholder will be provided with an AGM Connect Voter ID and Meeting Access Code |
AFTER submitting your proxy appointment, you MUST contact AGM Connect to obtain a Voter ID and Meeting Access Code at Call1-855-839-3715 or email voteproxy@agmconnect.com |
||
|
JOINING THE VIRTUAL MEETING (at least 15 minutes prior to start of the Meeting) |
Register and login at http://app.agmconnect.com Registered Shareholders or validly appointed Proxyholders will need to provide an email address, AGM Connect Voter ID and the Meeting Access Code |
||
In order to participate and vote at the Meeting, non-registered Shareholders must appoint themselves as a proxyholder. Non-registered Shareholders who have not duly appointed themselves as proxyholder will be able to attend the Meeting as guests but will not be able to participate or vote at the Meeting. See further information on how non-registered Shareholders can vote at the Meeting under the subheading “How to Vote Your Shares – How to Vote If You Are a Non-Registered Shareholder” below.
Shareholders who wish to appoint a proxyholder to represent them at the online meeting must submit their proxy or voting instruction form (as applicable) prior to registering and must then also register their proxyholder. Registering the proxyholder is an additional step a Shareholder must take following the submission of their proxy or voting instruction form. To register a proxyholder, Shareholders MUST visit www.agmconnect.com/fury2024 at least 48 hours before the Meeting which is 11:00 a.m. (Toronto Time) on June 24, 2024 and provide AGM Connect with their proxyholder’s contact information so that AGM Connect may provide the proxyholder with a username via email. Failure to register a duly appointed proxyholder will result in the proxyholder not receiving a username to participate in the Meeting.
It is important that you are connected to the internet at all times during the meeting in order to vote when balloting commences. In order to participate online, registered Shareholders must have a valid email address, Voter Id and Meeting Code provided by AGM Connect.
How to Vote if You Are a Registered Shareholder
You are a registered Shareholder if your name appears on a share certificate representing your Common Shares or if you are registered as the holder of your Common Shares in book-entry form. In either case, your name will be shown on the list of Shareholders kept by AGM Connect, the registrar and transfer agent of the Company. If you are not sure whether you are a registered Shareholder, please contact AGM Connect using the contact information set forth herein.
If you are a registered Shareholder, you will be able to cast an online vote for each Common Share registered in your name. If you are a registered Shareholder and you do not wish or are unable to attend the Meeting, you can appoint someone who will be entitled to attend the Meeting and act as your proxy to vote in accordance with your instructions. Voting by proxy is the easiest way to vote. Voting by proxy means that you are giving the person or people named on your form of proxy (the “Proxyholder”) the authority to vote your Common Shares for you at the Meeting or any adjournment there of. If you are a registered Shareholder, you will receive a form of proxy from AGM Connect with this Circular.
Each of the persons named on the enclosed form of proxy is a director or an officer of Fury Gold. If you are a registered Shareholder entitled to vote at the Meeting, you have the right to appoint a Proxyholder other than either of the persons designated on the form of proxy. A registered Shareholder who wishes to appoint a different Proxyholder may do so by crossing out the names pre-printed on the form of proxy and inserting the name and valid email of the proposed Proxyholder in the blank space provided. Registered Shareholders can also appoint a different Proxyholder electronically after logging in to the AGM Connect voting platform and completing the proxy appointment form. Such other Proxyholder need not be a registered Shareholder.
Regardless of who you appoint as your Proxyholder, you can instruct that Proxyholder how you want to vote, or you can let your Proxyholder decide for you. If you do not give any instructions as to how to vote on a particular issue to be decided at the Meeting, your Proxyholder can vote your Common Shares as he or she thinks fit. If you have appointed the persons designated in the form of proxy as your Proxyholder they will, unless you give contrary instructions, vote FOR each of the resolutions set out in the form of proxy provided by management for the Meeting and for each of the nominees named in this Circular for election as directors of Fury Gold. Further details about these matters are set out in this Circular. The enclosed form of proxy gives the persons named on it the authority to use their discretion in voting on amendments or variations to matters identified on the Notice of Meeting. At the time of printing this Circular, the management of Fury Gold is not aware of any other matter to be presented for action at the Meeting other than those specified in the Notice of Meeting. If, however, other matters do properly come before the Meeting, the Proxyholder will vote on them in accordance with his or her best judgment, pursuant to the discretionary authority conferred by the form of proxy with respect to such matters.
How To Change Your Vote/Revoke Your Proxy if You Are a Registered Shareholder
You can revoke your vote by proxy as follows:
|
■ |
attending the virtual Meeting and voting your Common Shares at the Record Date; |
|
■ |
submitting your replacement vote online at least 48 hours before the Meeting (excluding Saturdays, Sundays, and holidays); |
|
■ |
completing a form of proxy that is dated after the form of proxy previously submitted and ensuring AGM Connect receives it before 11:00 a.m. (Toronto time) on June 24, 2024; or |
|
■ |
in any other manner permitted by law. |
Your proxy will only be revoked if a revocation is received by 11:00 a.m. (Toronto time) on June 24, 2024, or, if the Meeting is adjourned, at least 48 hours (excluding Saturdays, Sundays, and holidays) before the start of the reconvened Meeting or delivered to the person presiding at the Meeting before it commences. Registered Shareholders who revoke their proxy and do not replace it with another that is deposited with AGM Connect or the Company before the deadline may still vote their Common Shares, but to do so, they must attend the Meeting.
How to Vote if You Are a Non-Registered Shareholder
You are a non-registered Beneficial Shareholder if your broker or another intermediary (a “Nominee”) holds your Common Shares for you. If you are a Beneficial Shareholder, the Company will not have any record of your ownership and so the only way that you can vote your Common Shares is by instructing your Nominee. Your Nominee is required to ask for your voting instructions before the Meeting.
In most cases, you will receive a VIF from your Nominee that allows you to provide your voting instructions by telephone, on the internet, or by mail. You should complete the VIF and sign and return it in accordance with the directions on that form. The majority of intermediaries now delegate responsibility for obtaining instructions from Beneficial Shareholders to Broadridge Financial Services, Inc. (“Broadridge”). Broadridge typically mails a scannable VIF to Beneficial Shareholders and asks them to return the VIF to Broadridge. Alternatively, the Beneficial Shareholder may call a toll-free number or go online to www.proxyvote.com to vote. The Company may utilize the Broadridge QuickVoteTM service to assist Beneficial Shareholders with voting their shares.
Beneficial Shareholders cannot use the VIF provided to vote directly at the Meeting. If you would like to attend and vote at the Meeting, it will be necessary for you to appoint yourself as proxyholder of your Common Shares. You can do this by printing your name in the space provided on the voting instruction form and submitting it as directed. You will also need to contact AGM Connect as an additional step through the methods listed above, and provide your required shareholder information. Beneficial Shareholders who have not appointed themselves as proxyholder but who wish to attend the Meeting will only be able to attend as a guest and will not be able to vote.
How to Change Your Vote if You Are a Non-Registered Holder
A non-registered Shareholder may revoke previous voting instructions by contacting his or her Nominee and complying with any applicable requirements imposed by such Nominee. A Nominee may not be able to revoke voting instructions if it receives insufficient notice of revocation.
VOTES NECESSARY TO PASS RESOLUTIONS
If the number of nominees for election or appointment is equal to the number of vacancies to be filled, all such nominees will be declared elected by acclamation. If, as a result of nominations received in compliance with the Advance Notice Provisions (see “Advance Notice Provisions” below), there are more nominees for election as directors than there are vacancies to fill, those nominees receiving the greatest number of votes will be elected.
If an auditor is nominated in addition to Management’s nominee (Deloitte LLP) the nominee auditor receiving the greatest number of votes will be appointed.
You can choose to vote your Common Shares “FOR” or to “AGAINST” your Common Shares from voting on the following resolutions:
|
■ |
the election of each person nominated as a director of the Company |
You can choose to vote your Common Shares “FOR” or to “WITHHOLD” your Common Shares from voting on the following resolutions:
|
■ |
the appointment of the auditor |
Your Common Shares represented by proxy will be voted or withheld from voting in accordance with your instructions on any ballot that may be called, and if you specify a choice with respect to any matter to be acted upon, the Common Shares will be voted accordingly.
If you are an individual, you, or your authorized attorney must sign the form of proxy. If you are a corporation or other legal entity, an authorized officer or attorney must sign the form of proxy. A form of proxy signed by a person acting as attorney or in some other representative capacity (including a representative of a corporate Shareholder) should indicate that person’s capacity (following their signature) and should be accompanied by the appropriate instrument evidencing qualification and authority to act (unless such instrument has previously been filed with Fury Gold).
If you need help completing your proxy form, please contact AGM Connect at 1-855-839-3715 or +1-416-222-4202 (toll-free in Canada and the United States).
Shareholders who wish to appoint a proxyholder to represent them at the Meeting must submit their form of proxy or voting instruction form (if applicable) and must then register their proxyholder. Registering a proxyholder is an additional step a Shareholder must take following submission of the Shareholder’s form of proxy or voting instruction form.
To register a proxyholder, Shareholders MUST visit www.agmconnect.com/fury2024 at least 48 hours before the meeting and provide AGM Connect with their proxyholder’s contact information so that AGM Connect may provide the proxyholder with a username via email. Failure to register the proxyholder will result in the proxyholder not receiving a username to participate in the Meeting.
When you sign the proxy form, you authorize Mr. Tim Clark, CEO, or failing him, Mr. Brian Christie, Chair of the Board, or failing him, Mr. Phil van Staden, Chief Financial Officer (“CFO”) or your specified Proxyholder to vote your Common Shares for you at the Meeting according to your instructions. If you return your form of proxy and do not provide instructions on how you want to vote your Common Shares, the nominees named in the form of proxy intend to vote your Common Shares:
|
■ |
FOR electing each of the individuals nominated as a director who are listed in this Circular; and |
|
■ |
FOR the appointment of Deloitte LLP as auditor. |
Your Proxyholder will also be entitled to vote your Common Shares as he or she sees fit in respect of amendments to matters identified in the Notice of Meeting and on any other item of business that may properly come before the Meeting or any adjournment(s) thereof. At the date of this Circular, the directors and management of the Company are not aware that any such amendments or other matters are expected to be submitted to the Meeting.
Shareholders Can Choose any Person or Company as their Proxyholder
You have the right to appoint a person other than the persons designated in the proxy form to represent you at the Meeting. Such right may be exercised by inserting the name of the person or company in the blank space provided in the enclosed form of proxy or by completing another form of proxy. If you do not specify how you want your Common Shares voted, your Proxyholder will vote your Common Shares as he or she sees fit on any matter that may properly come before the Meeting.
NOTICE TO SHAREHOLDERS IN THE UNITED STATES
The solicitation of proxies involves securities of an issuer located in Canada and is being effected in accordance with the corporate laws of the Province of British Columbia, Canada, and applicable Canadian securities laws. The proxy solicitation rules under the United States Securities Exchange Act of 1934, as amended, are not applicable to the Company or this solicitation, and this solicitation has been prepared in accordance with the disclosure requirements of Canadian securities laws. Shareholders should be aware that disclosure requirements under Canadian securities laws differ from the disclosure requirements under United States securities laws.
The enforcement by Shareholders of civil liabilities under United States federal securities laws may be affected adversely by the fact that the Company is incorporated under the BCBCA, as amended, and by the fact that five (5) of its six (6) directors and all of its executive officers, other than Mr. Clark, are residents of Canada or elsewhere outside the United States; and all of the Company’s assets and the assets of such persons are located outside the United States. Shareholders may not be able to sue a foreign company or its officers or directors in a foreign court for violations of United States federal securities laws. It may be difficult to compel a foreign company and its officers and directors to subject themselves to a judgment by a United States court.
VOTING SECURITIES AND PRINCIPAL HOLDERS
The Company is authorized to issue an unlimited number of Common Shares. As of the Record Date, there were 146,077,103 Common Shares issued and outstanding, each carrying the right to one (1) vote. There are no Common Shares held in escrow. No group of Shareholders has the right to elect a specified number of directors nor are there cumulative or similar voting rights attached to the Common Shares. The Company is also authorized to issue an unlimited number of preferred shares. There were no preferred shares issued and outstanding as at the Record Date.
To the knowledge of the directors and executive officers of the Company, as of the Record Date, no person or company beneficially owned, or controlled or directed, directly or indirectly, securities carrying 10% or more of the voting rights attached to the Company’s Common Shares.
The audited consolidated financial statements of the Company for its fiscal year ended December 31, 2023, together with the report of the auditor thereon, will be presented at the Meeting and have been filed with the securities commissions or similar regulatory authorities in each of the provinces and territories of Canada. Shareholders may review or download the financial statements via the Internet on SEDAR+ at www.sedarplus.ca.
Shareholders will elect the directors of the Company at the Meeting to hold office until the next annual general meeting of the Company. The term of office of each of the current directors will end at the conclusion of the Meeting. Unless the director’s office is vacated earlier in accordance with the provisions of the BCBCA, each director elected at the Meeting will hold office until the conclusion of the next annual general meeting of the Company, or if no director is then elected, until a successor is elected.
The Company’s Articles include advance notice provisions (the “Advance Notice Provisions”) with respect to the election of directors. The Advance Notice Provisions provide shareholders, directors and management of the Company with a clear framework for nominating directors. Among other things, the Advance Notice Provisions fix a deadline by which holders of Common Shares must submit director nominations to the Company prior to any annual or special meeting of shareholders and sets forth the minimum information that a Shareholder must include in such notice to the Company for the notice to be in proper written form.
As of the date hereof, the Company has not received notice of any additional director nomination in compliance with the Advance Notice Provisions of the Company’s Articles. If no nominations are received by the Company in compliance with these provisions prior to the Meeting, any nominations which are not nominations by or at the direction of the Board, or an authorized officer of the Company, will be disregarded at the Meeting.
Pursuant to the Articles of the Company and the BCBCA, the Board has determined that the number of directors on the Board for the ensuing year shall be six (6) directors.
Under the Articles of the Company, the Board will have the authority to increase the number of directors between annual general meetings by up to 1/3 of the directors elected at the Meeting and may appoint additional directors to fill the new positions. Accordingly, the Board may be increased by up to two persons to eight (8) directors.
Mr. Jeffrey Mason who currently serves (since February 7, 2019) on the Board of Directors, will be retiring on June 26, 2024, and as of the date hereof, the Company is in discussions with Mr. Mason in connection with regards to his proposed appointment to the Company’s Advisory Board, which will involve non-cash, equity-based compensation for a renewable one-year term. The following tables set forth profiles of the six (6) individuals who are nominated by the Governance and Nominating Committee and the Board for election as directors, including the positions and offices with the Company now held by each nominee, the present principal occupation or employment of each nominee, the business experience over the last five (5) years of each nominee, the period during which each nominee has served as a director, and the number of securities of the Company (including Common Shares and incentive options to purchase Common Shares through stock options (“Options”), Restricted Share Units (“RSU”) to convert each RSU into one common share, and share purchase warrants (“Warrants”), if applicable) beneficially owned, or controlled or directed, directly or indirectly, by each nominee as at the date of this Circular. The information as to securities beneficially owned, or controlled or directed, directly or indirectly, by each nominee has been furnished by the respective proposed nominees individually.
The Board has determined that five (5) of the six (6) individuals nominated for election as a director of the Company, at the Meeting are independent. The one (1) non-independent member of the Board is Mr. Tim Clark, who is the CEO of the Company. All of the members of the Nominating, Compensation and Governance Committee and the Audit Committee are independent directors. For more information on the Company’s independence standards and assessments, see the section of this Circular entitled “Corporate Governance – Composition of the Board”. For information on compensation paid to non-management directors, see the section of this Circular entitled “Statement of Executive Compensation – Director Compensation”. In addition, a description of the role of the Board is included in the section of this Circular entitled “Corporate Governance – Mandate of the Board of Directors”.
|
FORRESTER A. CLARK
Non-Independent Director Director since: March 16, 2021 Age: 56 |
Mr. Clark has served as CEO since August 18, 2021 and is a director of the Company. Mr. Clark brings 23 years of global capital markets experience with numerous US, European, and Canadian banks, including Barclays Capital, National Bank Financial, Merrill Lynch, Deutsche Bank, and most recently BMO Capital Markets, where he held the role of Managing Director, Institutional Equity Sales. Over the years, he has developed strong working relationships with Tier 1 institutional investors throughout the United States providing corporate strategy, and peer and financial analysis and insights on corporates within the materials, commodities, and mining sectors. Mr. Clark holds a Bachelor of Economics from the University of Massachusetts (Amherst) and a Master of Business Administration in Finance and Accounting from Vanderbilt University. Mr. Clark serves as an independent director of Dolly Varden Silver Corporation (“Dolly Varden”) on behalf of the Company pursuant to an investor rights agreement entered into between the Company and Dolly Varden. |
|
|
Board Committee Membership |
||
|
None |
||
|
Securities of the Company beneficially owned, or controlled or directed, directly or indirectly |
||
|
Common Shares |
Options |
RSUs (#) |
|
923,542 |
1,600,000 |
316,925 |
|
BRIAN CHRISTIE
Chair of the Board Director since: February 22, 2023 Age: 67 |
Mr. Christie currently serves as the independent Chair of the Board of the Company. Mr. Christie served as the Vice President of Investor Relations at Agnico Eagle Mines Limited (“Agnico Eagle”) for over 9 years until retiring in June 2022, and is currently retained by Agnico Eagle as a Senior Advisor, Investor Relations. During his tenure at Agnico Eagle, the company was consistently recognized as having one of the top Investor Relations programs across all industries in Canada. From 2016 until 2021 he served as an Independent Director (including 2 years as Board Chair and Compensation Committee Chair) of the Denver Gold Group, a Colorado based not-for-profit association owned by its member gold companies who control most of the world’s precious metal output and mineral assets. Before joining Agnico Eagle, he worked for over 17 years in the investment industry, primarily as a precious and base metals mining analyst with Desjardins Securities, National Bank Financial, Canaccord Capital and HSBC Securities. Prior to this, Mr. Christie spent 13 years in the mining industry as a geologist for a variety of mining companies, including Homestake, Billiton, Falconbridge Copper and Newmont Mining. Mr. Christie holds a BSc. in Geology (University of Toronto) and an MSc. in Geology (Queen’s University) and is a member of the Canadian Investor Relations Institute (CIRI) and the National Investor Relations Institute (NIRI). Mr. Christie currently serves as a director of Wallbridge Mining Company Limited (“Wallbridge”), and as a director of Forum Energy Metals Corp. (“Forum”); Past director of Denver Gold Group; VP, Investor Relations at Agnico Eagle. |
|
|
Board Committee Membership |
||
|
Technical, Safety and Risk Management Committee (Chair) Nominating, Compensation and Governance Committee |
||
|
Securities of the Company beneficially owned, or controlled or directed, directly or indirectly |
||
|
Common Shares |
Options |
RSUs (#) |
|
66,547 |
196,000 |
168,208 |
|
STEVE COOK
Independent Director Director since: October 28, 2013 Age: 69 |
Mr. Cook currently serves as an independent director of the Company. Mr. Cook is a former tax partner at the law firm of Thorsteinssons LLP, Vancouver, British Columbia, Canada. Mr. Cook received his B.Comm. and LL.B. degrees from the University of British Columbia and was called to the British Columbia Bar in 1982 and the Ontario Bar in 1992. He retired from the Ontario Bar in 2014. Mr. Cook is a specialist in corporate and international tax planning, offshore structures, representation, and civil and criminal tax litigation. Mr. Cook has served on the board of Brett Resources Ltd. prior to it being acquired by Osisko Mining Corp. and Cayden Resources Inc. prior to it being acquired by Agnico Eagle. Mr. Cook currently serves as a director of Torq, and Tier One. |
||
|
Board Committee Membership |
|||
|
Audit Committee (Chair) Indigenous and Community Relations Committee |
|||
|
Securities of the Company beneficially owned, or controlled or directed, directly or indirectly |
|||
|
Common Shares |
Warrants |
Options (#) |
RSUs (#) |
|
794,485 |
30,000 |
606,000 |
121,992 |
|
MICHAEL HOFFMAN
Independent Director Director since: October 9, 2020 Age: 65 |
Mr. Hoffman currently serves as an independent director of the Company. Mr. Hoffman is an experienced mining executive with over 40 years of practice including engineering, mine operations, corporate development, projects, and construction. Mr. Hoffman previously served as a director of Trevali Mining from 2011 to 2019 and acted as Chair from late 2017 to early 2019. Mr. Hoffman also has direct northern Canadian mining experience including operations and projects. Mr. Hoffman is a Mining Engineering graduate from Queen’s University and is a Professional Engineer in the province of Ontario. He is also a member of the Institute of Corporate Directors. Mr. Hoffman currently serves as a director of director of 1911 Gold Company (“1911 Gold”), d director and chair of NiCAN Ltd (“NiCAN”); director of Volta Metals Inc ; Past director of Eastmain, Silver X and Velocity. |
||
|
Board Committee Membership |
|||
|
Technical, Safety and Risk Management Committee Audit Committee Indigenous and Community Relations Committee |
|||
|
Securities of the Company beneficially owned, or controlled or directed, directly or indirectly |
|||
|
Common Shares |
Warrants |
Options (#) |
RSUs (#) |
|
233,019 |
66,667 |
481,006 |
120,084 |
|
ALISON SAGATEH (“SAGA”) WILLIAMS
Independent Director Director since: October 9, 2020 Age: 51 |
Ms. Williams currently serves as an independent director of the Company. Ms. Williams has worked in Indigenous communities in government and corporate roles in the capacity of legal counsel, negotiations and governance, and as a strategic advisor, for over 20 years. Ms. Williams has been on negotiation teams that have successfully settled over $1 billion in agreements and has worked on Indigenous community engagement and negotiations to support national energy and mining projects. Over the last 25 years, she has also held many non-profit board positions. Ms. Williams is Anishinaabe, a member of Curve Lake First Nation, and is currently an elected official for her community. Ms. Williams has extensive experience in compensation analysis both through her involvement in non-profit boards and as an elected official for a First Nation, serving one term as Councillor. Ms. Williams teaches at Osgoode Hall Law School as an Adjunct Professor and supports student led negotiations focusing on consultation, Indigenous rights, and reconciliation. Ms. Williams currently serves as a director of NiCAN Ltd (“NiCAN”), director of Volta Metals Inc (“Volta”) director of Nations Royalty. |
|
|
Board Committee Membership |
||
|
Indigenous and Community Relations Committee (Chair) Nominating, Compensation and Governance Committee |
||
|
Securities of the Company beneficially owned, or controlled or directed, directly or indirectly |
||
|
Common Shares |
Options |
RSUs (#) |
|
61,371 |
446,000 |
120,084 |
|
ISABELLE CADIEUX
Independent Director Director since: September 5, 2023 Age: 66 |
Ms. Cadieux currently serves as an independent director of the Company. Ms. Cadieux, a professional geologist, has more than 30 years of experience in mineral exploration and financing in the mining sector. She last held the position of Managing Director – Investment at SIDEX, a Québec institutional fund that finances exploration companies active in Québec, where she served from 2001 until 2023. Her mineral exploration experience across Canada and abroad, includes positions with AGIP (1980-1983 in Saskatchewan), AREVA (1988-1992 in Québec, Ontario, and the Northwest Territories), and Channel Resources (1996-1999 in Burkina Faso) and covers a wide range of ore deposit types and mineral commodities, in particular gold, copper, and uranium. She holds an M.Sc. in Mineral Exploration (MINEX) from McGill University and a B.Sc. in Geology from the University of Ottawa.
Ms. Cadieux acted as President of the Ordre des géologues du Québec (OGQ) in 2008, sat on the Board of Directors from 2005 to 2010 and was Director of the Canadian Council of Professional Geoscientists from 2007 to 2011 where she represented the OGQ. From 2011 to 2016, she was a member of the Executive Committee of the UQAT-UQAM Chair in Mining Entrepreneurship. Throughout her career, she has been involved in various sector-related organizations, among others the Québec Mineral Exploration Association (AEMQ), the Canadian Institute of Mines and Metallurgy (CIM), Minalliance and Mine d’Avenir. |
|
|
Board Committee Membership |
||
|
Technical, Safety and Risk Management Committee |
||
|
Securities of the Company beneficially owned, or controlled or directed, directly or indirectly |
||
|
Common Shares |
Options |
RSUs (#) |
|
7,299 |
156,000 |
116,267 |
None of the proposed nominees for election as a director of the Company are proposed for election pursuant to any arrangement or understanding between the nominee and any other person, except the directors and senior officers of the Company acting solely in such capacity.
Cease Trade Orders and Bankruptcy
Except as set out below, within the last 10 years before the date of this Circular, to the knowledge of the Company, no proposed nominee for election as a director of the Company was a director or executive officer of any company (including the Company in respect of which this Circular is prepared) or acted in that capacity for a company that was:
|
(a) |
subject to a cease trade or similar order or an order denying the relevant company access to any exemptions under securities legislation, for more than 30 consecutive days; |
|
(b) |
subject to an event that resulted, after the director or executive officer ceased to be a director or executive officer, in the company being the subject of a cease trade or similar order or an order that denied the relevant company access to any exemption under the securities legislation, for a period of more than 30 consecutive days; |
|
(c) |
within a year of that person ceasing to act in that capacity, became bankrupt; made a proposal under any legislation relating to bankruptcy or insolvency or was subject to or instituted any proceedings, arrangement, or compromise with creditors or had a receiver, receiver manager or trustee appointed to hold its assets; or has become bankrupt; made a proposal under any legislation relating to bankruptcy or insolvency, or become subject to or instituted any proceedings, arrangement or compromise with creditors; or had a receiver, receiver manager or trustee appointed to hold the assets of the proposed director; |
|
(d) |
subject to any penalties or sanctions imposed by a court relating to securities legislation or by a securities regulatory authority or has entered into a settlement agreement with a securities regulatory authority; or |
|
(e) |
subject to any other penalties or sanctions imposed by a court or a regulatory body that would likely be considered important to a reasonable securityholder in deciding whether to vote for a proposed director. |
It is proposed that Deloitte LLP, Chartered Professional Accountants, of 939 Granville Street, Vancouver, British Columbia, Canada, V6Z 1L3, the current auditor of the Company, be appointed as auditor of the Company to hold office until the close of the next annual meeting of the Shareholders. The audit committee has recommended to the Board, and the Board has approved, the nomination of Deloitte LLP for such appointment. Deloitte LLP has been the auditor of the Company since 2015. The directors are authorized under the Articles of the Company to set the remuneration of the auditor.
Deloitte LLP is independent with respect to the Company within the meaning of the Code of Professional Conduct of the Chartered Professional Accountants of British Columbia and within the applicable rules and regulations of the Securities and Exchange Commission (“SEC”) and the Public Company Accounting Oversight Board (United States).
Audit Committee and Relationship with Auditor
Under National Instrument 52-110 Audit Committees (“NI 52-110”), the Company is required to including information regarding its Audit Committee in its annual information form (“AIF”). The AIF is available on SEDAR+ at www.sedarplus.ca and contains information concerning the Audit Committee, including the text of the Audit Committee Charter. The Charter of the Audit Committee can also be viewed at https://www.furygoldmines.com/corporate/corporate-governance-1/.
The Board is committed to sound corporate governance practices and believes that such practices are in the interests of Shareholders and help to contribute to effective and efficient decision-making.
Mandate of the Board of Directors
The board guidelines are the Board’s formal mandate (the “Board Guidelines”) and can be accessed on the Company’s website at www. https://furygoldmines.com/about-us/governance/ and are attached herein as Schedule A.
The Board Guidelines mandate the Board to:
|
(a) |
assume responsibility for the overall stewardship and development of the Company and the monitoring of its business decisions; |
|
(b) |
identify the principal risks and opportunities of the Company’s business and ensure the implementation of appropriate systems to manage these risks; |
|
(c) |
oversee ethical management and succession planning, including appointing, training, and monitoring of senior management and directors; and |
|
(d) |
oversee the integrity of the Company’s internal financial controls and management information systems. |
Board of Directors and Board Committees
The Board is responsible for corporate governance and establishes the overall policies and standards of the Company. The Board meets on a regularly scheduled basis. In addition to these meetings, the directors are kept informed of the Company’s operations through reports and analyses by, and discussions with, management.
The governance policies include written charters for each of the Board committees and include a Code of Business Conduct and Ethics (the “Code of Ethics”), policies dealing with the issuance of news releases, and also disclosure documents. The Company’s Code of Ethics provides a framework for undertaking ethical conduct in employment, and pursuant to the Code of Ethics, the Company will not tolerate any form of discrimination or harassment in the workplace.
Regulatory policies require that a listed issuer’s board of directors determine the status of each director as independent or not, based on each director’s interest in or other relationship with the Company. Such policies recommend that a board of directors be constituted with a majority of directors who qualify as independent directors (as defined below). A board of directors should also examine its size with a view to determining the impact of the number of directors upon its effectiveness and should implement a system enabling an individual director to engage an outside advisor at the expense of the corporation in appropriate circumstances. The Company has policies that allow for retention of independent advisors by members of the Board when they consider it advisable.
A director is “independent” if he or she does not have, directly or indirectly, a financial, legal, or other relationship with the Company that would interfere with his or her exercise of independent judgment. Generally speaking, a director is independent if he or she is free from any employment, business, or other relationship which could, or could reasonably be expected to, materially interfere with the exercise of the director’s independent judgment.
The Board is proposing six (6) nominees for election to the office of director, all of whom are currently Board members and of whom five (5) are considered independent directors. The independent nominees are Mr. Brian Christie, Mr. Steve Cook, Mr. Michael Hoffman, Ms. Saga Williams and Ms. Isabelle Cadieux. The non-independent member of the Board is Mr. Tim Clark, who is the CEO of the Company. All members of the Audit Committee and the Nominating, Compensation and Governance Committee are independent directors.
The Board monitors the activities of senior management through regular meetings and discussions amongst the Board members, and between the Board and senior management. The Board is of the view that the communication between senior management, members of the Board, and Shareholders is open and transparent, with meetings of the independent directors being held after each board meeting. In addition, communication among this group occurs on an ongoing basis and as needs arise from regularly scheduled meetings of the Board or otherwise. The Board also encourages independent directors to bring up and discuss any issues or concerns, and the Board is advised of and addresses any such issues or concerns raised thereby. The Board believes that adequate structures and processes are in place to facilitate the functioning of the Board with a sufficient level of independence from the Company’s management. The Board is satisfied with the integrity of the Company’s internal control and financial management information systems.
The nominated directors currently serving on boards of other reporting issuers (or equivalent) are set out below:
|
Name of Director |
Name of Reporting Issuer2 |
Exchange |
|
Tim Clark |
Dolly Varden Silver Corporation |
TSXV, OTCQX |
|
Brian Christie |
Wallbridge Mining Company Ltd. Forum Energy Metals Corp. |
TSX, OTCQX TSXV, OTCQB |
|
Steve Cook |
Torq Resources Inc. Tier One Silver Inc. |
TSXV, OTCQX TSXV, OTCQB |
|
Michael Hoffman |
1911 Gold Corporation Volta Metals Ltd. NiCAN Ltd. LiCAN |
TSXV, OTCQB CSE TSXV Not exchange listed |
|
Saga Williams |
NiCAN Ltd. Volta Metals Ltd. Nations Royalty |
TSXV CSE TSX |
|
Isabelle Cadieux |
N/A |
The Board has established four committees. These include an audit committee (“Audit Committee”), an Indigenous and community relations committee (“Indigenous and Community Relations Committee”), a nominating, compensation and governance committee (“Nominating, Compensation and Governance Committee”), and a joint Board/management technical, safety and risk management committee (“Technical, Safety and Risk Management Committee”).
Audit Committee
Composition of the Audit Committee
The Audit Committee has the following current members: Mr. Steve Cook (Chair), Mr. Jeffrey R. Mason, and Mr. Michael Hoffman.
The function of the Audit Committee is to: (a) meet with the financial officers of Fury Gold and its independent auditor to review matters affecting financial reporting, the system of internal accounting and financial controls and procedures, and the audit procedures and audit plans; (b) appoint the auditor, subject to Shareholder approval; and (c) review and recommend to the Board for approval Fury Gold’s financial statements and certain other documents required by regulatory authorities.
All members of the Audit Committee are independent and financially literate within the meaning of such terms in NI 52-110. None of the members of the Audit Committee was, during the most recently completed fiscal year of the Company, an officer or employee of the Company or any of its subsidiaries.
The Company refers the reader to its 2024 AIF, dated April 2, 2024, which is available under the Company’s SEDAR+ profile on www.sedarplus.ca for current information concerning the Audit Committee.
Indigenous and Community Relations Committee
Composition of the Indigenous and Community Relations Committee
The Indigenous and Community Relations Committee has the following independent board members: Ms. Saga Williams (Chair), Mr. Steve Cook, and Mr. Michael Hoffman.
The function of the Indigenous and Community Relations Committee is to provide oversight and direction to the Company in relation to the establishment and cultivation of respectful and positive relationships with Indigenous and local communities and to ensure that management adheres to the set-out values and social expectations. The Indigenous and Community Relations Committee supports management to identify partnerships and create mutually beneficial opportunities to advance the Company’s objectives around corporate social responsibility. Further, the Indigenous and Community Relations Committee will assess and make recommendations regarding education opportunities, investments, and community initiatives to the Board pertaining to Indigenous and local affairs and investments. All members of the Indigenous and Community Relations Committee are independent.
Nominating, Compensation and Governance Committee
Composition of the Nominating, Compensation and Governance Committee
The Nominating, Compensation and Governance Committee has the following current members: Mr. Jeffrey R. Mason (Chair), Mr. Brian Christie, and Ms. Saga Williams.
The Nominating, Compensation and Governance Committee follows both the mandate of the Charter of the Nominating and Governance Committee and the Compensation Committee Charter, both of which are included in the Company’s corporate governance material, which is posted on the Company’s website at http://www.furygoldmines.com/corporate/corporate-goverance-1/.
All members of the Nominating, Compensation and Governance Committee are independent in accordance with applicable securities laws. None of the members of the Nominating, Compensation and Governance Committee were, during the most recently completed fiscal year of the Company, an officer or employee of the Company or any of its subsidiaries.
Nominating and Governance Committee Charter
|
■ |
The functions of the Nominating, Compensation and Governance Committee fall under the Nominating and Governance Committee Charter and are to provide a focus on governance that will enhance the Company’s performance, to assess and make recommendations regarding the effectiveness of the Board, and to establish and lead the process for identifying, recruiting, appointing, re-appointing, and providing ongoing development for directors. |
|
■ |
The Company has formal procedures for assessing the effectiveness of Board committees as well as the Board as a whole. This function is carried out annually under the direction of the Nominating, Compensation and Governance Committee and those assessments are then provided to the Board. |
|
■ |
The Nominating, Compensation and Governance Committee is responsible for developing and recommending to the Board the Company’s approach to corporate governance and assists members of the Board in carrying out their duties. The Nominating, Compensation and Governance Committee also reviews all new and modified rules and policies applicable to governance of listed corporations to ensure that the Company remains in full compliance with such requirements as are applicable. |
|
■ |
In exercising its nominating function, the Nominating, Compensation and Governance Committee evaluates and recommends to the Board the size of the Board and certain persons as nominees for the position of director of the Company. |
Compensation Committee Charter
|
■ |
The function of the Nominating, Compensation and Governance Committee under the Compensation Committee Charter is to consider the terms of employment of the CEO, CFO and other executive officers, and to consider the Company’s general compensation policy and its policy for granting awards under Fury Gold’s long-term incentive plan. |
|
■ |
The Nominating, Compensation and Governance Committee functions include: the annual review of compensation paid to the Company’s executive officers and directors, the review of the performance of the Company’s executive officers, and the task of making recommendations on compensation to the Board. |
|
■ |
The Nominating, Compensation and Governance Committee also periodically considers the grant of Options and or RSUs. Options and or RSUs have been granted to the executive officers, directors, and certain other service providers taking into account competitive compensation factors and the belief that Options and or RSUs help align the interests of executive officers, directors, and service providers with the interests of Shareholders. |
Technical, Safety and Risk Management Committee
Composition of the Technical, Safety and Risk Management Committee
The Technical, Safety and Risk Management Committee has the following members: Mr. Brian Christie (Chair), Mr. Michael Hoffman and Ms. Isabelle Cadieux.
The function of the Technical, Safety and Risk Management Committee is to analyze, consider, and develop recommendations to the Board regarding the technical mission and future direction of the Company over the next one (1) to five (5) years, and to develop an ongoing process for the review and revision of these recommendations. The Technical, Safety and Risk Management Committee may also act on behalf of the Board with respect to analyzing any specific technical decisions and make recommendations to the Board.
To supplement Board succession planning and its efforts to ensure Board renewal, the Nominating, Compensation and Governance Committee carries out an annual assessment of the Board members and the various committees in order to assess the overall effectiveness of the Board.
The evaluation process assists the Board in:
|
■ |
assessing its overall performance and measuring the contributions made by the Board as a whole and by each committee; |
|
■ |
evaluating the mechanisms in place for the Board and each committee to operate effectively and make decisions in the best interests of the Company; |
|
■ |
improving the overall performance of the Board by assisting individual directors to build on his or her strengths; |
|
■ |
identifying gaps in skills and educational opportunities for the Board and individual directors in the coming year; and |
|
■ |
developing the Board’s succession plan and recruitment efforts. |
The Nominating, Compensation and Governance Committee annually reviews the adequacy of the evaluation process and recommends any changes to the Board for approval. Each director completes certain surveys and provides suggestions for improvement regarding the effectiveness of the Board and each committee of the Board of which each director is a member, including their processes and their relationship with management. This assessment process also assists the Nominating, Compensation and Governance Committee in determining the financial literacy of each director and topics for continuing education.
The Company has not adopted term limits or other mechanisms to force Board renewal. Given the normal process of annual elections of individual directors by the Shareholders and the fact that individual directors also undertake annual director assessments, the Board has determined that term limits or a mandatory retirement is not required. Directors who have served on the Board for an extended period of time are in a unique position to provide valuable insight into the operations and future of the Company based on their experience with the Company’s history, performance, and objectives. From time to time, Board renewal is facilitated by introducing new director appointments to the Board with fresh perspectives to facilitate a balance between Board refreshment and continuity.
Representation of Women on the Board and Senior Management
The Company adopted a diversity policy on November 14, 2018, and amended it February 18, 2021 (as so amended, the “Diversity Policy”). The Diversity Policy outlines the Company’s commitment to diversity, which includes, but is not limited to, business experience, education, geography, age, gender, ethnicity, and Indigenous background. The Diversity Policy provides, among other things, that the Board should appoint a certain number of women directors to the Board to encourage a diversity of experience and backgrounds in Board members. Diversity promotes the inclusion of different perspectives and ideas, mitigates against group think, and ensures that the Company has the opportunity to benefit from all available talent. The Board believes that the promotion of a diverse Board makes prudent business sense and promotes better corporate governance.
Annually, the Company’s Nominating, Compensation and Governance Committee conducts a review of the Diversity Policy and reports to the Board on its effectiveness in promoting a diverse board of directors, which includes an appropriate number of women directors. In connection with such review, the Nominating, Compensation and Governance Committee recommends to the Board any changes that it thinks appropriate. The Nominating, Compensation and Governance Committee is responsible for reviewing the Company’s public disclosure with respect to diversity.
In 2024, two (2) female candidates, one of whom is Indigenous, will stand for re-election to the Board out of a total of six (6) directors, representing 40% of the five (5) independent Directors. We believe the ongoing process the Board is engaged in will identify and foster the development of suitable candidates for nomination or appointment and, over time, will achieve even greater diversity.
In considering potential candidates for executive appointments, Fury Gold identifies talent available internally and externally and the core competencies and characteristics that are desired for promotion to higher levels within the organization. The Board does not set specific gender representation targets when identifying and considering candidates for executive positions. However, diversity, including, but not limited to, gender, Indigenous peoples, persons with disabilities, and members of visible minorities, is considered in identifying the group of top talent candidates.
The Board has adopted written Board guidelines that set out limits to management’s responsibilities. In the management of the Company, any responsibility which is not delegated to senior management or to a Board committee remains with the full Board. The Board has also adopted written position descriptions for the Chair of each Board committee, the CEO, and the CFO.
The Company’s Chair, Mr. Brian Christie has the authority to call meetings of the independent Directors. He serves as the principal liaison between the executive management team and the independent Directors.
Director Meeting Attendance Record
The following table sets forth the record of attendance of each Board member to the Board and Committee meetings during the year ended December 31, 2023, during the year in which they served as directors of the Company:
|
Director |
Board of Directors |
Board Committee |
|||
|
Audit |
Indigenous and Community Relations |
Nominating, Compensation and Governance |
Technical, Safety and Risk Management |
||
|
Current Directors |
|||||
|
Tim Clark |
6/6 |
- |
- |
- |
- |
|
Jeffrey R. Mason (1) |
6/6 |
4/4 |
- |
5/5 |
- |
|
Steve Cook (2) |
6/6 |
4/4 |
4/4 |
- |
- |
|
Michael Hoffman (2) |
6/6 |
4/4 |
4/4 |
2/2 |
4/4 |
|
Saga Williams |
6/6 |
- |
4/4 |
5/5 |
- |
|
Brian Christie (1)(2) |
5/5 |
- |
- |
3/3 |
4/4 |
|
Isabelle Cadieux(3) |
2/2 |
- |
- |
0/0 |
|
|
(1) |
Mr. Christie was appointed to the Board on February 22, 2023, and elected Chair on May 15, 2023, replacing Mr. Mason. |
|
(2) |
Effective March 15, 2023, Mr. Christie was appointed to the Nominating, Compensation and Governance Committee, replacing Mr. Hoffman; Mr Christie was also appointed to the Technical, Safety and Risk Committee, replacing Mr. Cook. |
|
(3) |
Ms. Cadieux was appointed to the Board on September 5, 2023, and appointed to the Technical, Safety and Risk Committee on November 8, 2023. |
Orientation and Continuing Education
The Board and the Company’s senior management conduct orientation programs for new directors as soon as possible after their appointment or election as directors. The orientation programs include presentations by management to familiarize new directors with the Company’s projects and strategic plans, its significant financial, accounting, and risk management issues, its compliance programs, its Code of Ethics, its principal officers, its internal and independent auditors, and its outside legal advisors. In addition, the orientation programs include a review of the Company’s expectations of its directors in terms of time and effort, a review of the directors’ fiduciary duties, and, where applicable, visits to Company headquarters and, to the extent practical, the Company’s significant facilities.
To enable each director to better perform his or her duties and to recognize and deal appropriately with issues that arise, the Company will provide the directors with appropriate education programs and/or suggestions to undertake continuing director education, the cost of which will be borne by the Company.
Each member of the Board and a number of employees took part in a multi-module accredited in-house learning program to facilitate the building of Indigenous cultural competency.
The Board has adopted a code of business conduct and ethics (the “Code of Ethics”), a copy of which is available on the Company’s website at https://furygoldmines.com/about-us/governance/ is the Board’s responsibility to oversee compliance with the Code of Ethics. The Board has implemented an annual procedure whereby directors, officers, and employees of the Company sign off on and certify that they have read and understand the Code of Ethics and that they are unaware of any violation thereof. Any change in or waiver of any provision of the Code of Ethics shall require approval of the applicable Board committee and shall be publicly disclosed in the time period and manner as required by law or regulation.
The Board also believes that the fiduciary duties placed on individual directors by the Company’s governing corporate policies and common law, and the restrictions placed by applicable corporate legislation on an individual directors’ participation in decisions of the Board in which the director has an interest, have been sufficient to ensure the Board operates independently of management and in the best interests of the Company.
The Board considers its size each year when it considers the number of directors to recommend to Shareholders for election at the annual general meeting, taking into account the number required to carry out the Board’s duties effectively and to maintain a diversity of views and experience. See “Nominating, Compensation and Governance Committee” above.
The Board monitors the adequacy of information given to directors, communication between the Board and management, and the strategic direction and processes of the Board and its committees. The Nominating, Compensation and Governance Committee oversees an annual formal assessment of the Board and its four (4) main committees, namely the Audit Committee, the Nominating, Compensation and Governance Committee, Indigenous and Community Relations Committee, and the Technical, Safety and Risk Management Committee. The Board completed self-assessments of their performance during the most recent fiscal year ended December 31, 2023. The Board members are satisfied with the overall mineral projects and corporate achievements of the Company while acknowledging the share performance variability mainly due to volatile capital markets, including less than the Shareholder return on the S&P/TSX Composite Index.
The Board believes that each of its members should carry the confidence and support of its Shareholders. To this end, on April 12, 2017, the Board adopted a majority voting policy for the election of directors (the “Majority Voting Policy”). The Majority Voting Policy provides that if a nominee for election as director receives a greater number of “against” votes than “for” votes, that nominee will tender a resignation to the Chair of the Board following the meeting of Shareholders at which the director is elected. The Board will consider the offer of resignation and announce its decision on whether to accept it in a press release within 90 days following the Shareholder meeting.
In its deliberations, the Board will consider all factors it deems relevant including any stated reasons why Shareholders “against” votes from the election of that director; the length of service and the qualifications of the director; the director’s contributions to the Company; the effect such resignation may have on the Company’s ability to comply with any applicable governance rules and policies and the dynamics of the Board; and whether the resignation would be in the best interests of the Company. The Board will be expected to accept the resignation except in situations where extenuating circumstances would warrant the director to continue to serve.
This Majority Voting Policy only applies in circumstances involving an uncontested election of directors, being those where the number of director nominees is the same as the number of directors to be elected to the Board. This Majority Voting Policy is now part of the governance policies on the Company’s website at https://furygoldmines.com/about-us/governance/.
Fury Gold adheres to a comprehensive disclosure, confidentiality, and insider trading policy, adopted on June 11, 2018, and amended/updated on January 12, 2021, March 8, 2022 and May 10, 2023 (the “Disclosure Policy”), that governs communication and information management by Company personnel. The Disclosure Policy sets out specific procedures for reviewing and approving the dissemination of company information to the public. The Company has a management disclosure committee that is responsible for the administration of this policy and its compliance with legal statutes, policies, and procedures regarding disclosure of Company information.
The Disclosure Policy includes, but is not limited to, the following basic elements:
|
■ |
Confidentiality: In carrying out the Company’s business activities, employees, officers, and directors often learn confidential or proprietary information about the Company, suppliers, or joint venture parties. Confidentiality of such information must be respected except when disclosure is authorized or legally mandated. Confidential or proprietary information includes any non-public information that would be harmful to the Company, useful or helpful to competitors if disclosed, or would provide unfair advantage within the capital markets. |
|
■ |
Securities Law and Insider Trading: Fury Gold complies with all applicable securities laws and regulations to ensure that material non-public information (“Inside Information”) is disclosed using proper authority and in accordance with the law. Only those personnel who have a need to know receive inside information before it is released to the public. Company insiders must not use Inside Information for personal profit and must not take advantage of Inside Information by trading or providing Inside Information to others to trade in the securities of the Company. |
STATEMENT OF EXECUTIVE COMPENSATION
In this section “Named Executive Officer” or “NEO” means the CEO as at December 31, 2023, the CFO as at December 31, 2023, each individual who served as CEO or CFO of the Company during the fiscal year ended December 31, 2023, and each of the three (3) most highly compensated executive officers, other than the CEO and CFO, who were serving as executive officers at the end of the most recently completed fiscal year and whose total compensation in 2023 exceeded $150,000, and any other individuals for whom disclosure would have been provided except that the individual was not serving as an officer of the Company at the end of the most recently completed fiscal year.
Current Officers
The current officers of the Company are: Mr. Tim Clark, CEO, Mr. Phil van Staden, CFO, Mr. Bryan Atkinson, Senior Vice President, Exploration (“SVP, Exploration”).
Former Officers
Mr. Michael Henrichsen resigned as the Company’s Chief Geological Officer (“CGO”) on May 15, 2023, and was engaged as a geological consultant to the Company until March 25, 2024. The Company has not determined to either appoint another person to the CGO office or decide whether it will continue to use such title at all. Ms. Lynsey Sherry, who had been the Chief Financial Officer (“CFO”) since November 2020, resigned as the Company’s Chief Financial Officer effective June 23, 2023. Mr. van Staden, having previously served as the Company’s Corporate Controller since 2020, was appointed Interim Chief Financial Officer on June 23, 2023, and was promoted to CFO effective January 1, 2024.
Compensation Discussion and Analysis
The Board assumes responsibility for reviewing and monitoring the long-range compensation strategy for the senior management of the Company although the Nominating, Compensation and Governance Committee advises and guides the Board in this role. The Company’s Nominating, Compensation and Governance Committee receives and reviews independent competitive market information on compensation levels for executives as well as their performance.
The Board assesses the Company’s compensation plans and programs for its executive officers to ensure alignment with the Company’s business plan and to evaluate the potential risks associated with those plans and programs. The Board has concluded that the compensation policies and practices do not create any risks that are reasonably likely to have a material adverse effect on the Company. The Board considers the risks associated with executive compensation and corporate incentive plans when designing and reviewing such plans and programs.
Philosophy and Objectives
The Company’s senior management compensation program is designed to ensure that the level and form of compensation achieves certain objectives including:
|
(a) |
attracting and retaining talented, qualified, and effective executives; |
|
(b) |
motivating the short-term and long-term performance of these executives; and |
|
(c) |
aligning their interests with those of the Company’s Shareholders. |
In compensating its senior management, the Company employs a combination of base salary, bonus compensation, and equity participation through its Option Plan.
Base Salary
In the Board’s view, paying base salaries or fees competitive in the markets in which the Company operates is a first step in attracting and retaining talented, qualified, and effective executives. Competitive salary information on comparable companies within the industry is compiled from a variety of sources including surveys conducted by independent consultants and national and international publications. Comparable companies include, but are not limited to: Falco Resources Ltd; Galway Metals Inc; Integra Resources Corp.; International Tower Hill Mines Ltd.; Amex Exploration Inc.; O3 Mining Inc; Mayfair Gold Corp.; Westhaven Gold Corp.; Signal Gold Inc.; Walbridge Mining Company Limited; Nighthawk Gold Corp and Treasury Metals Inc. The Company’s peer group was determined by identifying other mining issuers listed on both the TSX and the NYSE American with comparable market capitalizations and businesses.
Bonus Incentive Compensation
The Company’s objective in implementing bonus incentive compensation is to achieve certain strategic objectives and milestones by motivating the short-term and long-term performance of its senior management. The Board will consider executive bonus compensation dependent upon the Company meeting those strategic objectives and milestones and sufficient cash resources being available for the granting of bonuses. The Board approves executive bonus compensation based on recommendations of the Nominating, Compensation and Governance Committee. Amounts recommended by the Nominating, Compensation and Governance Committee and approval by the Board are entirely at their discretion based on performance assessments.
Equity Participation
The Company believes that encouraging its executives and employees to become Shareholders is the best way of aligning their interests with those of its Shareholders. Equity participation is accomplished through the Company’s Long-Term Equity Based Incentive Plan (“LTI Plan). Options to purchase and or RSUs to exchange for Common Shares in the Company are granted to executives and employees taking into account a number of factors including, but not limited to, the number and term of Options and RSUs previously granted, base salary and bonuses, and competitive factors. The number and terms of Option and RSU grants are reviewed and recommended by the Nominating, Compensation and Governance Committee and determined by the sole discretion of the Board.
Given the evolving nature of the Company’s business as a mineral exploration company, the Board periodically reviews and as necessary redesigns the overall compensation plan for senior management to continue to address the objectives identified above.
Long-Term Equity Based Incentive Plan (“LTI Plan”)
The Company’s LTI Plan was adopted by the Board on May 10, 2023, and approved by shareholders on June 29, 2023. The LTI Plan is limited to equity-based compensation which together with all previous and still outstanding awards under the 2017 Plan is limited to 10% of the Company’s issued common shares on a rolling basis.
The LTI Plan provides for awards of stock options (“Options”), performance share units (“PSUs”), restricted share units (“RSUs”) and deferred share units (“DSUs” and together with PSUs and RSUs, the “Unit Awards”). The LTI Plan also contains additional incentive provisions to create participant share purchase commitments (“SPCs), which allow the Company to contribute up to 25% of the cost buying Shares (either directly from the Company’s treasury or from the market through a stock exchange) which Participants commit to purchase by way of regular payroll deductions.
10% Aggregate Limit (of the rolling number of issued Shares) for all Elements of the LTI Plan
The LTI Plan limits the number of Shares reserved for issuance under the LTI Plan, together with all other security-based compensation arrangements of the Company (other than any securities issued pursuant to Section 613(c) of the TSX Company Manual) to 10% of the issued and outstanding Shares (on a non-diluted basis), with a sub-limit share reserve in respect of DSUs, RSUs, PSUs and SPC(s) equal to 2% each of the issued and outstanding Shares outstanding at the time of the granting of the DSUs, RSUs and PSUs and SPC(s) (on a non-diluted basis), and provides for the cessation of entitlement provisions as well as disability and retirement treatment under the plan and including an early retirement benefit, settlement procedures relating to RSUs, PSUs and DSUs, SPCs and qualifies up to 3,000,000 Options and Unit Awards for favourable tax treatment under United States Internal revenue Code (“IRC”). The LTI Plan includes change in control provision to remove the Board’s ability to accelerate awards in connection with a change in control in accordance with corporate governance best practices.
The LTI Plan provides DSUs, PSUs and RSUs which do not require payment by the Participant of a fixed amount at the time of exercise based on the market price of the Shares when the incentive grant was made. The LTI Plan also contains elements that are often referred to as “employee share purchase plan” and that make up the SPCs.
The full text of the LTI Plan is attached to the June 29, 2023 information circular and was filed on SEDAR+ under the Company’s adjacent profile.
General
The Nominating, Compensation and Governance Committee considered the implications of the risks associated with the Company’s compensation policies and practices and concluded that, given the nature of the Company’s business and the role of the Nominating, Compensation and Governance Committee in overseeing the Company’s executive compensation practices, the compensation policies and practices do not serve to encourage any NEO or individual at a principal business unit or division to take inappropriate or excessive risks, and no risks were identified arising from the Company’s compensation policies and practices that are reasonably likely to have a material adverse effect on the Company.
There is a restriction on NEOs or directors regarding the purchase of financial instruments including prepaid variable forward contracts, equity swaps, collars, or units of exchange funds that are designed to hedge or offset a decrease in market value of equity securities granted as compensation or held, directly or indirectly, by the NEO or director. For the year ended December 31, 2023, no NEO or director, directly or indirectly, employed a strategy to hedge or offset a decrease in market value of the Company’s equity securities granted as compensation or held.
The following graph compares the cumulative Shareholder return on an investment of $100 in the Common Shares of the Company for the past five (5) years on the TSX and TSXV with a cumulative total Shareholder return on the S&P/TSX Composite Index and a cumulative total Shareholder return on the GDJX.
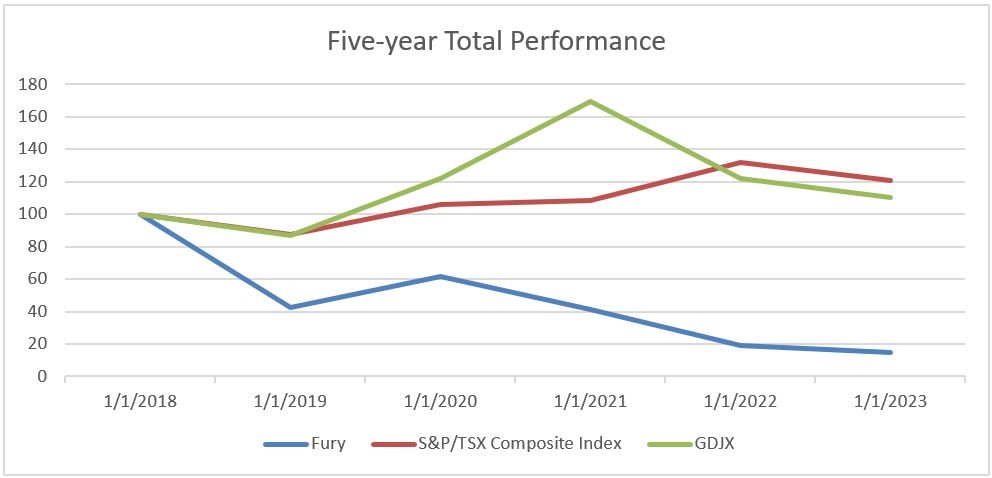
The compensation earned by the NEOs during the Company’s most recently completed fiscal years ended December 31, 2023, December 31, 2022, and December 31, 2021, is set out below. There were no long-term incentive plans or pension value payments paid to NEOs during these periods. The NEO compensation for the fiscal year 2024 is expected to remain comparable with 2023.
It should be noted that the annual incentive plan amounts are typically paid in the year subsequent to the year of evaluation by the Nominating, Compensation and Governance Committee and as approved by the Board. Accordingly, the Company reports annual incentive plan payments in the year it was earned by the NEO.
|
Name and principal position |
Year |
Salary |
Option-based awards (6) |
Share-based awards (7) |
Non-equity incentive plan compensation |
Total compensation |
|
($) |
($) |
($) |
($) |
($) |
||
|
Current Officers |
||||||
|
Tim Clark, CEO (1) |
2023 2022 2021 |
378,000 378,000 138,532 |
144,300 Nil 551,273 |
164,125 Nil Nil |
164,125 290,250 44,800 |
850,550 668,250 734,605 |
|
Phil van Staden(3) CFO |
2023 |
69,575 |
14,333 |
13,425 |
13,425 |
110,758 |
|
Bryan Atkinson(5) SVP, Exploration |
2023 2022 2021 |
225,750 208,000 175,000 |
97,042 123,000 Nil |
39,506 Nil Nil |
39,506 75,250 61,250 |
401,804 406,250 236,250 |
|
Other NEO’s |
||||||
|
David Frappier-Rivard, Exploration Manager(6) |
2023 |
70,000 |
Nil |
25,200 |
25,200 |
120,400 |
|
Former Officers |
||||||
|
Lynsey Sherry(2) Former CFO |
2023 2022 2021 |
119,444 250,000 250,000 |
112,734 143,500 Nil |
Nil Nil Nil |
Nil 87,500 87,500 |
232,178 481,000 337,500 |
|
Michael Henrichsen CGO (4) |
2023 2022 2021 |
22,422 92,600 200,000 |
43,290 143,500 Nil |
Nil Nil Nil |
Nil 25,200 70,000 |
65,712 261,300 270,000 |
|
(1) |
Mr. Tim Clark’s non-equity incentive plan compensation is payable in US dollars. A foreign exchange rate of 1.35 was used to calculate the CAD equivalent which was included in the table above. |
|
(2) |
Dr. Sherry was appointed CFO of the Company effective November 9, 2020. Subsequently, Dr Sherry was also appointed Corporate Secretary on September 3, 2021. Dr Sherry resigned as Corporate Secretary, effective March 1, 2023 and as CFO, effective June 23, 2023. |
|
(3) |
Mr. van Staden, having previously served as the Company’s Corporate Controller since 2020, was appointed Interim Chief Financial Officer on June 23, 2023, and further appointed CFO effective January 1, 2024. |
|
(4) |
Mr. Henrichsen resigned as CGO, effective May 15, 2023, and continued as a geological advisor to the Company until his resignation effective March 25, 2024. |
|
(5) |
Mr. Atkinson has served as SVP, Exploration since March 9, 2022, prior to which Mr. Atkinson was VP, Project Development of the Company since October 9, 2020. Mr. Atkinson was previously employed by a shared service provider described elsewhere herein, Universal Mineral Services Ltd., in a non-executive functional role; the compensation disclosure in the above table includes compensation from the date of hire of Mr. Atkinson by the Company in an executive role. |
|
(6) |
Mr Frappier-Rivard became an NEO on July 31, 2023 |
|
(7) |
The values in this column represent the fair value of share options granted on the date of grant. The fair value of the share options granted in 2022 was estimated using the Black-Scholes option valuation model with the following weighted assumptions: risk-free interest rate: 2.20%; expected dividend yield: Nil; stock price volatility: 66.6%; and expected life in years: 5.0. The fair value of the share options granted in 2023 was estimated using the Black-Scholes option valuation model with the following weighted assumptions: risk-free interest rate: 3.06%; expected dividend yield: Nil; stock price volatility: 68.3%; and expected life in years: 5.0. |
|
(8) |
The values in this column represents the fair value of shares when they vested. |
Outstanding Share-based Awards and Option-based Awards
The following table sets out all option-based awards outstanding as at December 31, 2023, for each NEO:
|
Option-based Awards |
||||
|
Name |
Number of securities underlying unexercised Options |
Option |
Option |
Value of unexercised in-the-money Options(1) |
|
Current Officers |
||||
|
Tim Clark |
600,000 870,000 130,000 |
0.82 0.93 1.53 |
17-Jan-28 26-Aug-26 02-Apr-26 |
Nil Nil Nil |
|
Phil van Staden(3) |
45,000 45,000 17,500 17,500 15,000 |
0.53 0.82 1.00 1.00 1.85 |
23-Jun-28 17-Jan-28 22-Apr-27 24-Jan-27 10-Dec-25 |
3,150 Nil Nil Nil Nil |
|
Bryan Atkinson |
269,000 135,000 135,000 150,000 |
0.82 1.00 1.00 2.05 |
17-Jan-28 22-Apr-27 24-Jan-27 20-Oct-25 |
Nil Nil Nil Nil |
|
Other NEO’s |
||||
|
David Frappier-Rivard(5) |
150,000 112,500 112,500 110,000 |
0.82 1.00 1.00 2.05 |
17-Jan-28 22-Apr-27 24-Jan-27 20-Oct-25 |
Nil Nil Nil Nil |
|
Former Officers |
||||
|
Lynsey Sherry(2) |
Nil |
Nil |
Nil |
Nil |
|
Michael Henrichsen(4) |
Nil |
Nil |
Nil |
Nil |
|
(1) |
Based on the closing price of the Common Shares on the TSX on December 30, 2023 of $0.67. |
|
(2) |
Dr. Lynsey Sherry resigned as CFO, effective June 23, 2023. Subsequently, her options expired on September 21, 2023. |
|
(3) |
Mr. van Staden, having previously served as the Company’s Corporate Controller since 2020, was appointed Interim Chief Financial Officer on June 23, 2023, and further appointed CFO effective January 1, 2024. |
|
(4) |
Mr. Henrichsen resigned as CGO, effective May 15, 2023, and continued as a geological advisor to the Company until his resignation, effective March 25, 2024. 120,937 unvested options were cancelled on March 25, 2024, and 584,063 vested options are set to expire on June 23, 2024. |
|
(5) |
Mr Frappier-Rivard became an NEO on July 31, 2023 |
Incentive Plan Awards – Value Vested or Earned During the Year
The following table sets out the value vested or earned under incentive plans during the fiscal year ended December 31, 2023, for each NEO:
|
Name |
Option-based awards – Value vested during the year |
Share-based awards – Value vested during the year |
Non-equity incentive plan compensation – Value earned during the year |
|
Current Officers |
|||
|
Tim Clark (1) |
Nil |
164,125 |
164,125 |
|
Phil van Staden(3) |
3,150 |
13,425 |
13,425 |
|
Bryan Atkinson |
Nil |
39,506 |
39,506 |
|
Other NEO’s |
|||
|
David Frappier-Rivard(5) |
Nil |
25,200 |
25,200 |
|
Former Officers |
|||
|
Lynsey Sherry(2) |
Nil |
Nil |
Nil |
|
Michael Henrichsen(4) |
Nil |
Nil |
Nil |
|
(1) |
Mr Tim Clark’s non-equity incentive plan compensation is payable in US dollars. A foreign exchange rate of 1.35 was used to calculate the CAD equivalent which was included in the table above. |
|
(2) |
Dr. Sherry was appointed CFO of the Company effective November 9, 2020. Subsequently, Dr Sherry was also appointed Corporate Secretary on September 3, 2021. Dr Sherry resigned as Corporate Secretary, effective March 1, 2023 and as CFO, effective June 23, 2023. |
|
(3) |
Mr. van Staden, having previously served as the Company’s Corporate Controller since 2020, was appointed Interim Chief Financial Officer on June 23, 2023, and further appointed CFO effective January 1, 2024. |
|
(4) |
Mr. Henrichsen resigned as CGO, effective May 15, 2023, and continued as a geological advisor to the Company until his resignation effective March 25, 2024.See “Securities Authorized for Issuance under Equity Compensation Plans” for further information on the Company’s Share Option Plan. |
|
(5) |
Mr Frappier-Rivard became an NEO on July 31, 2023 |
The Company has no pension plans for its directors, officers, or employees.
Termination and Change of Control Benefits
Capitalized terms used but not otherwise defined in this Section “Termination and Change of Control Benefits” shall have the meanings ascribed to such terms in each of the respective employment agreements noted below.
Each of Tim Clark, Phil van Staden, and Bryan Atkinson (each an “Executive”) has an Executive Employment Agreement whereby, in the event the Company experiences a change of control, such NEO shall have a special right to resign for good reason at any time within 24 months after a Change in Control as defined in the relevant employment agreement of the Company. An NEO sending notice of resignation under this section must provide one month’s notice of such resignation.
In the event the NEO is terminated without just cause or resignation for good reason after change in control, within 24 months after a Change in Control, the Company shall provide the NEO with the following, with all cash compensation payable within five business days of the NEO’s last day of employment (the “Termination Date”):
|
Name |
Executives |
Other NEO’s |
|
Salary and Bonus (less required statutory deductions) |
Annual salary and vacation pay earned to Termination Date; and the aggregate of: i) 2 years of Annual Compensation(1); and (ii) a bonus for the year prorated to Termination Date, with personal or functional performance prorated to the assessed at not less than target. |
Annual salary and vacation pay earned to Termination Date; and the aggregate of: i) 1 year of Annual Compensation(1); and (ii) a bonus for the year prorated to Termination Date, with personal or functional performance prorated to the assessed at not less than target. |
|
Benefits (excluding Disability Insurance) |
Continuation of benefits, at cost of Company until the earlier of 24 months from the Termination Date or the NEO obtaining comparable benefits through other employment |
None |
|
Disability Insurance |
Amount equal to 24 months of NEO’s then prevailing premiums |
None |
|
Options |
Unvested Options vest immediately; exercisable until earlier of normal expiry date or 1 year after Termination Date |
Unvested Options vest immediately; exercisable until earlier of normal expiry date or 1 year after Termination Date |
|
RSUs, PSUs and DSU’s |
All outstanding RSUs, PSUs and DSUs to vest immediately (with outstanding Performance Share Units vesting based on the achievement of the performance criteria for the applicable performance period(s) up to the effective date of the Change in Control) |
All outstanding RSUs, PSUs and DSUs to vest immediately (with outstanding Performance Share Units vesting based on the achievement of the performance criteria for the applicable performance period(s) up to the effective date of the Change in Control) |
|
Placement Services |
Maximum of $5,000 |
None |
|
(1) |
“Annual Compensation” means the sum of: (a) the greater of (i) the base salary of the Executive, paid or payable by the Company, calculated as at the end of the month immediately preceding the month in which insolvency or a Change of Control occurs, and (ii) the annual base salary of the Executive, paid or payable by the Company, calculated as at the end of the month immediately preceding the month in which the Date of Termination occurs; and (b) an amount equal to the greater of: (i) the average of the annual bonus paid to the Executive for the previous three years, if any, or such lesser number of years that the Executive has been employed by the Company and (ii) 100% of the Executive’s earned annual performance bonus for the current fiscal year of the Company. |
|
(2) |
If no such amount for the year in which termination occurs has been established as at the Termination Date, the amount paid as an incentive bonus for the immediately preceding year shall be used. |
In the event the triggering event took place on the last business day of the Company’s most recently completed fiscal year, the following gross payments would have become payable:
|
Name |
Gross termination and change of control benefit |
|
Tim Clark |
1,418,000 |
|
Phil van Staden |
327,200 |
|
Bryan Atkinson |
614,524 |
|
David Rivard |
218,200 |
Compensation during the most recently completed fiscal year ended December 31, 2023:
|
Name(1) |
Fees earned |
Option-based awards (5) |
Non-equity incentive plan compensation |
Share-based awards |
Other Compensation |
Total |
|
($) |
($) |
($) |
($) |
($) |
($) |
|
|
Current Directors |
||||||
|
Isabelle Cadieux(2) |
11,795 |
41,886 |
Nil |
Nil |
Nil |
53,681 |
|
Brian Christie(3) |
60,310 |
93,188 |
Nil |
Nil |
Nil |
153,498 |
|
Steve Cook(4) |
45,600 |
75,036 |
Nil |
Nil |
12,500 |
133,136 |
|
Michael Hoffman |
43,763 |
75,036 |
Nil |
Nil |
Nil |
118,799 |
|
Jeffrey R. Mason |
57,262 |
94,276 |
Nil |
Nil |
Nil |
151,538 |
|
Saga Williams |
42,450 |
75,036 |
Nil |
Nil |
Nil |
117,486 |
|
(1) |
Mr. Clark is a current director and received compensation in 2023 for his service as an officer of the Company. See “Statement of Executive Compensation” |
|
(2) |
Ms. Cadieux was appointed to the Board effective September 5, 2023. |
|
(3) |
Mr. Christie was appointed to the Board effective February 22, 2023 and elected Chair on May 15, 2023. |
|
(4) |
Mr. Cook received certain fees paid in respect of his additional duties as managing director of Universal Mineral Services Ltd, the shared service provider in which the Company holds a 25% equity interest. |
|
(5) |
The values in this column represent the fair value of share options granted on the date of grant. The fair value of the share options granted in 2023 was estimated using the Black-Scholes option valuation model with the following weighted assumptions: risk-free interest rate: 3.06%; expected dividend yield: Nil; stock price volatility: 68.3%; and expected life in years: 5.0. |
Incentive Plan Awards – Value Vested or Earned During the Year
The following table sets out the value vested or earned under incentive plans during the fiscal year ended December 31, 2023, for each director, excluding a director who serves as an executive officer:
|
Name of Current Directors |
Option-based awards – Value vested during the year ($) |
Non-equity incentive plan compensation – Value earned during the year ($) |
|
Isabelle Cadieux |
Nil |
Nil |
|
Brian Christie |
Nil |
Nil |
|
Steve Cook |
Nil |
Nil |
|
Michael Hoffman |
Nil |
Nil |
|
Jeffrey R. Mason |
Nil |
Nil |
|
Saga Williams |
Nil |
Nil |
Outstanding Option-based Awards
The following table sets out all option-based awards outstanding as of December 31, 2023, for each director who was not an executive officer of the Company:
|
Option-based Awards |
||||
|
Name |
Number of securities underlying unexercised Options |
Option |
Option |
Value of unexercised in-the-money Options(1) |
|
Current Directors |
||||
|
Isabelle Cadieux (2) |
156,000 |
0.55 |
25-Sept-28 |
7,020 |
|
Brian Christie (3) |
40,000 156,000 |
0.82 0.85 |
15-May-28 17-Feb-28 |
Nil Nil |
|
Steve Cook |
156,000 160,000 160,000 130,000 |
0.82 1.00 1.00 2.05 |
17-Jan-28 22-Apr-27 24-Jan-27 20-Oct-25 |
Nil Nil Nil Nil |
|
Michael Hoffman |
156,000 80,000 80,000 130,000 35,006 |
0.82 1.00 1.00 2.05 0.86 |
17-Jan-28 22-Apr-27 24-Jan-27 20-Oct-25 23-Jan-25 |
Nil Nil Nil Nil Nil |
|
Jeffrey R. Mason |
196,000 135,000 135,000 130,000 |
0.82 1.00 1.00 2.05 |
17-Jan-28 22-Apr-27 24-Jan-27 20-Oct-25 |
Nil Nil Nil Nil |
|
Saga Williams |
156,000 80,000 80,000 130,000 |
0.82 1.00 1.00 2.05 |
17-Jan-28 22-Apr-27 24-Jan-27 20-Oct-25 |
Nil Nil Nil Nil |
|
(1) |
Based on the closing price of the Common Shares on the TSX on December 31, 2023 of $0.67. |
|
(2) |
Ms. Cadieux was appointed to the Board effective September 5, 2024. |
|
(3) |
Mr. Christie was appointed to the Board effective February 22, 2023. |
Securities Authorized for Issuance Under Current Equity Compensation Plan
The Company currently has two equity compensation plans, its 2017 Incentive Option Plan (“2017 Plan”), and the LTI Plan which was approved by shareholders on June 29, 2023. The LTI Plan is a rolling plan pursuant to which Options and RSUs totalling a maximum of 10% of the Common Shares issued and outstanding from time to time are available for grant.
Options Available under 2023 LTI Plan
The 2023 Plan is a rolling plan therefore the number of issued and outstanding Common Shares of the Company increases, the number of Options available for granting to eligible Canadian resident optionees (“Canadian Optionees”) optionees and US resident optionees (“US Optionees”) also increases. As at the date hereof, there are 301,000 Options and 1,494,937 RSUs outstanding to purchase an aggregate of 1,795,937 Common Shares under the 2023 LTI Plan, (representing approximately 1.2% of the 146,077,103 Common Shares outstanding). In addition, there are 9,121,900 Options outstanding under the 2017 Plan to purchase an aggregate of 9,121,900 Common Shares (representing approximately 6.2% of the 146,077,103 Common Shares outstanding). There are also Eastmain Replacement Options arising out of the 2020 merger with Eastmain Resources Inc. to purchase an aggregate of 35,006 Common Shares (.02% of issued Common Shares), and which are excluded from the total options available under the 2017 Plan as was expressly disclosed to shareholders in the September 3, 2020 management information circular filed on www.sedarplus.ca on September 8, 2020.
In addition, there are currently 3,259,989 Common Shares (2.2% of issued Common Shares) available for grant of Options or RSUs pursuant to the LTI Plan. For purposes of the United States Internal Revenue Code, (“IRC”), US taxpayer optionees will not receive favourable tax treatment for Options or RSUs unless the aggregate number of Options or RSUs available for grant to US taxpayers is fixed in the relevant plan. Accordingly, this number was fixed in the 2023 LTI Plan to 3,000,000. As of the date hereof, there were 1,725,000 Options granted to US optionees which are intended to qualify as “incentive stock options” (as defined by IRC, all of which are included in the total Options and RSUs of 11,347,721). There remain a further 1,275,000 Common Shares available for grant of Incentive Stock Options to US Optionees within the 3,000,000 maximum available pursuant to the Option Plan. If these options expire unexercised, they will be available for grant to eligible persons who are not US taxpayers.
The following table sets out equity compensation plan information as at the fiscal year ended December 31, 2023:
|
Plan Category |
Number of securities to be issued upon exercise of a) outstanding Options, and b) vested RSUs (percentage of outstanding Common Shares)(1) |
Weighted-average exercise price of outstanding Options ($) |
Number of securities remaining available for future issuance under equity compensation plans (excluding securities reflected in column (a)) (percentage of outstanding Common Shares) |
|
2017 Option Plan |
9,760,596 (6.7%) |
1.23 |
Nil |
|
2023 Long Term Incentive Plan (“LTIP”) stock options(2) |
156,000 (.1%) |
0.55 |
4,657,883 |
|
2023 Long Term Incentive Plan (“LTIP”) RSUs(2) |
Nil |
||
|
Equity compensation plans not approved by securityholders |
Nil |
Nil |
Nil |
|
Eastmain Replacement Options (2) |
35,006 (.02%) |
Nil |
|
|
Total |
9,951,6022,3(6.8%) |
4,657,883 (3.2%) |
Notes:
|
(1) |
Number of securities to be issued upon exercise of outstanding Options includes 35,006 Eastmain share Options which are excluded from the total reserved options with the TSX. |
|
(2) |
The Long-Term Incentive Plan was approved by shareholders on June 29, 2023 |
|
(3) |
As of the date hereof this figure has increased to 11,382,727 or 7.8% of the currently issued Shares. |
The following table sets out the annual burn rate (1) for the Company’s 2017 Option and 2023 LTI plans:
|
|
Fiscal year ended December 31 |
||
|
2023 |
2022 |
2021 |
|
| Option/LTIP Plans |
2.5% |
2.5% |
1.2%(2) |
Note:
|
(1) |
The annual burn rate is calculated as the number of securities granted under the arrangement during the applicable fiscal year divided by the weighted average number of outstanding common shares for the applicable fiscal year. |
|
(2) |
This figure is corrected from previously disclosed burn rates of 0.19 (2021). |
Indebtedness of Directors and Executive Officers
No directors, proposed nominees for election as directors, executive officers or their respective associates or affiliates, or other management of the Company were indebted to the Company as of the most recently completed fiscal year ended December 31, 2023, or as at the date hereof.
Interest of Informed Persons in Material Transactions
To the knowledge of management of the Company, no informed person of the Company (a director, officer or holder of 10% or more of the Common Shares) or proposed director of the Company, or any associate or affiliate of any informed person or proposed director, had any interest in any transaction since the commencement of the Company’s most recently completed fiscal year or in any proposed transaction which has materially affected or would materially affect the Company or any of its subsidiaries.
Management Contracts and Universal Mineral Services Ltd
There are no management functions of the Company which are to any substantial degree performed by a person or company other than the directors or executive officers of the Company. As disclosed in the Company’s 2023 Annual information Form filed at www.sedarplus.ca on April 2, 2024, it shares some administrative personnel services under a Shared Services Agreement with Universal Mineral Services Ltd. but these services are in support of the management personnel disclosed herein and not in lieu of them.
The Company owns a 25% share interest in UMS which it acquired for nominal consideration. The remaining 75% of UMS is owned equally by three other junior resource issuers, namely Tier One Silver Inc, Coppernico Metals Inc, and Torq Resources Inc. who share a head office location in Vancouver, BC. Previously, UMS provides geological, financial, and transactional advisory services as well as administrative services to the Company on an ongoing, full cost recovery basis. Management believes that having these services available through UMS, on a shared and as-needed basis, allows the Company to maintain a more efficient and cost-effective corporate overhead structure by hiring fewer full-time employees and engaging outside professional advisory firms less frequently. The agreement has an indefinite term and can be terminated by either party upon providing 180 days’ notice although the Company will, in the event of termination of the shared services arrangements, remain liable for its share of the UMS premises lease unless and until a replacement subtenant is found. Under the shared services agreement, the Company’s CFO, SVP, Exploration, and CGO previously provided their services through direct employment with UMS for the Company, under a secondment employment arrangement between the Company and UMS. During 2023 the CFO and SVP, Exploration terminated their employment with UMS, while becoming direct employees of the Company. The CGO ceased employment with both UMS and the Company in 2024. As UMS indirect service providers to the Company, employees of UMS are eligible for participation in the Company’s 2017 option plan but not the 2023 LTI Plan.
Financial information is provided in the audited financial statements of the Company for the fiscal year ended December 31, 2023, and the related management discussion and analysis, both of which were filed under the Company’s SEDAR+ profile at www.sedarplus.ca on April 2, 2024. See also the Company’s 2023 Annual Information Form filed at www.sedarplus.ca on April 2, 2024. A copy of LTI Plan was filed with the Information Circular dated May 18, 2023, at www.sedarplus.ca.
A Shareholder may obtain additional information upon request without charge from the Company’s Chief Financial Officer & Corporate Secretary at Suite 1630, 1177 West Hastings Street, Vancouver. British Columbia, Canada, V6E 2K3, telephone: 1-800-863-8655 and is also available via the Internet on SEDAR+ at www.sedarplus.ca. The Company may require payment of a reasonable charge from any person or company who is not a securityholder of the Company, who requests a copy of any such document.
The Board is not aware of any other matters which it anticipates will come before the Meeting as of the date of mailing of this Circular.
The contents of this Circular and its distribution to Shareholders have been approved by the Board of the Company.
DATED at Vancouver, British Columbia, May 14, 2024.
BY ORDER OF THE BOARD
“Tim Clark”
Forrester A. Clark
Chief Executive Officer and Director