| Arkansas | 001-41093 | 71-0682831 | ||||||
| (State or Other Jurisdiction of Incorporation) | (Commission File Number) | (IRS Employer Identification No.) | ||||||
| ☐ | Written communications pursuant to Rule 425 under the Securities Act (17 CFR 230.425) | ||||
| ☐ | Soliciting material pursuant to Rule 14a-12 under the Exchange Act (17 CFR 240.14a-12) | ||||
| ☐ | Pre-commencement communications pursuant to Rule 14d-2(b) under the Exchange Act (17 CFR 240.14d-2(b)) | ||||
| ☐ | Pre-commencement communications pursuant to Rule 13e-4(c) under the Exchange Act (17 CFR 240.13e-4(c)) | ||||
| Title of each class | Trading Symbol(s) | Name of each exchange on which registered | ||||||||||||
| Common Stock, par value $0.01 per share | HOMB | New York Stock Exchange | ||||||||||||
| 99.1 | |||||
| 99.2 | |||||
| 104 | Cover Page Interactive Data File (embedded within the Inline XBRL document) | ||||
| Home BancShares, Inc. | |||||||||||
| Date: | October 15, 2025 | By: | /s/ Jennifer C. Floyd | ||||||||
| Jennifer C. Floyd | |||||||||||
| Chief Accounting Officer | |||||||||||

| For Immediate Release: | October 15, 2025 | ||||
| Metric | Q3 2025 | Q2 2025 | Q1 2025 | Q4 2024 | Q3 2024 | ||||||||||||
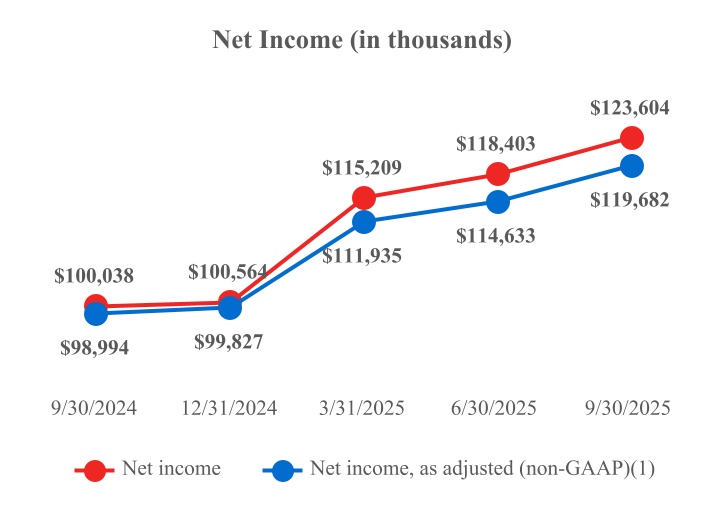
| Net income | $123.6 million |
$118.4 million |
$115.2 million |
$100.6 million |
$100.0 million |
||||||||||||
Net income, as adjusted (non-GAAP)(1) |
$119.7 million |
$114.6 million |
$111.9 million |
$99.8 million |
$99.0 million |
||||||||||||
| Total revenue (net) | $277.7 million |
$271.0 million |
$260.1 million |
$258.4 million |
$258.0 million |
||||||||||||
| Income before income taxes | $159.3 million |
$152.0 million |
$147.2 million |
$129.5 million |
$129.1 million |
||||||||||||
Pre-tax, pre-provision, net income (PPNR) (non-GAAP)(1) |
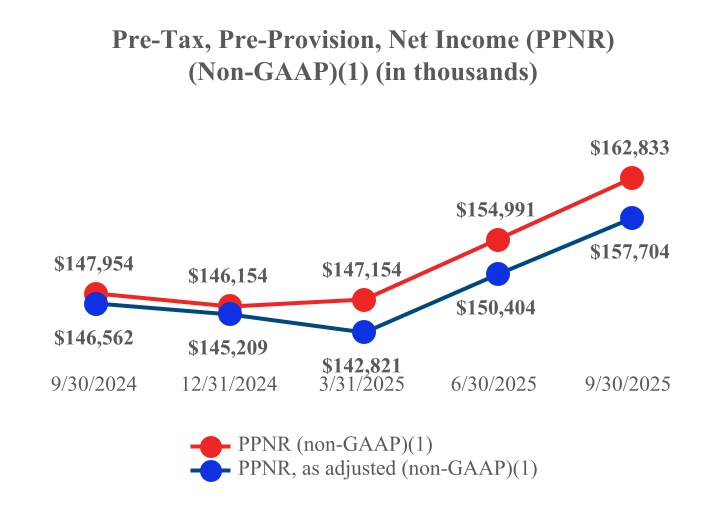
$162.8 million |
$155.0 million |
$147.2 million |
$146.2 million |
$148.0 million |
||||||||||||
PPNR, as adjusted (non-GAAP)(1) |
$157.7 million |
$150.4 million |
$142.8 million |
$145.2 million |
$146.6 million |
||||||||||||
| Pre-tax net income to total revenue (net) | 57.38% |
56.08% |
56.58% | 50.11% |
50.03% | ||||||||||||
Pre-tax net income, as adjusted, to total revenue (net) (non-GAAP)(1) |
55.53% | 54.39% | 54.91% | 49.74% |
49.49% | ||||||||||||
P5NR (Pre-tax, pre-provision, profit percentage) (PPNR to total revenue (net)) (non-GAAP)(1) |
58.64% |
57.19% |
56.58% | 56.57% |
57.35% | ||||||||||||
P5NR, as adjusted (non-GAAP)(1) |
56.80% | 55.49% | 54.91% | 56.20% |
56.81% | ||||||||||||
| ROA | 2.17% |
2.08% |
2.07% | 1.77% | 1.74% | ||||||||||||
ROA, as adjusted (non-GAAP)(1) |
2.10% | 2.02% | 2.01% | 1.76% | 1.72% | ||||||||||||
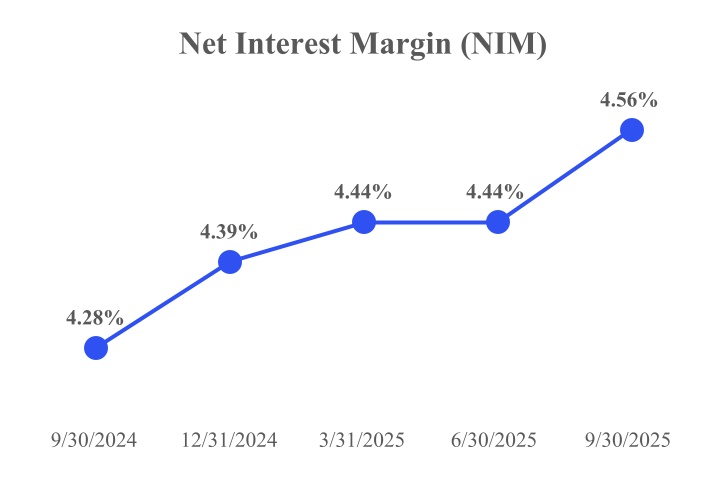
| NIM | 4.56% |
4.44% |
4.44% | 4.39% | 4.28% | ||||||||||||
| Purchase accounting accretion | $1.3 million |
$1.2 million |
$1.4 million |
$1.6 million |
$1.9 million |
||||||||||||
| ROE | 11.91% |
11.77% |
11.75% | 10.13% | 10.23% | ||||||||||||
ROE, as adjusted (non-GAAP)(1) |
11.54% | 11.39% | 11.41% | 10.05% | 10.12% | ||||||||||||
ROTCE (non-GAAP)(1) |
18.28% |
18.26% |
18.39% | 15.94% | 16.26% | ||||||||||||
ROTCE, as adjusted (non-GAAP)(1) |
17.70% | 17.68% | 17.87% | 15.82% | 16.09% | ||||||||||||
| Diluted earnings per share | $0.63 |
$0.60 |
$0.58 | $0.51 | $0.50 | ||||||||||||
Diluted earnings per share, as adjusted (non-GAAP)(1) |
$0.61 | $0.58 | $0.56 | $0.50 | $0.50 | ||||||||||||
| Non-performing assets to total assets | 0.56% |
0.60% |
0.56% | 0.63% | 0.63% | ||||||||||||
| Common equity tier 1 capital | 16.1% | 15.6% | 15.4% | 15.1% | 14.7% | ||||||||||||
| Leverage | 13.8% | 13.4% | 13.3% | 13.0% | 12.5% | ||||||||||||
| Tier 1 capital | 16.1% | 15.6% | 15.4% | 15.1% | 14.7% | ||||||||||||
| Total risk-based capital | 18.9% | 19.3% | 19.1% | 18.7% | 18.3% | ||||||||||||
| Allowance for credit losses to total loans | 1.87% |
1.86% |
1.87% | 1.87% | 2.11% | ||||||||||||
| Book value per share | $21.41 | $20.71 | $20.40 | $19.92 | $19.91 | ||||||||||||
Tangible book value per share (non-GAAP)(1) |
$14.13 | $13.44 | $13.15 | $12.68 | $12.67 | ||||||||||||
Dividends per share |
$0.20 | $0.20 | $0.195 | $0.195 | $0.195 | ||||||||||||
Shareholder buyback yield(2) |
0.18% | 0.49% | 0.53% | 0.05% | 0.56% | ||||||||||||
Financial Performance Trends | ||||||||
The chart below illustrates Home BancShares’ consistent improvement in profitability over the past five quarters. Net income reached a record $123.6 million in Q3 2025, while net income, as adjusted (non-GAAP)(1), also set a new high at $119.7 million. This sustained upward trend reflects the Company’s strong operational performance and effective management of one-time expenses. |
The chart below demonstrates Home BancShares’ robust operational performance as measured by pre-tax, pre-provision, net income (PPNR) (non-GAAP)(1) over the past five quarters. PPNR is a key indicator of the Company’s earnings power, as it reflects revenue generation and expense management before the impact of credit loss provisions and taxes. |
|||||||
 |
 |
|||||||
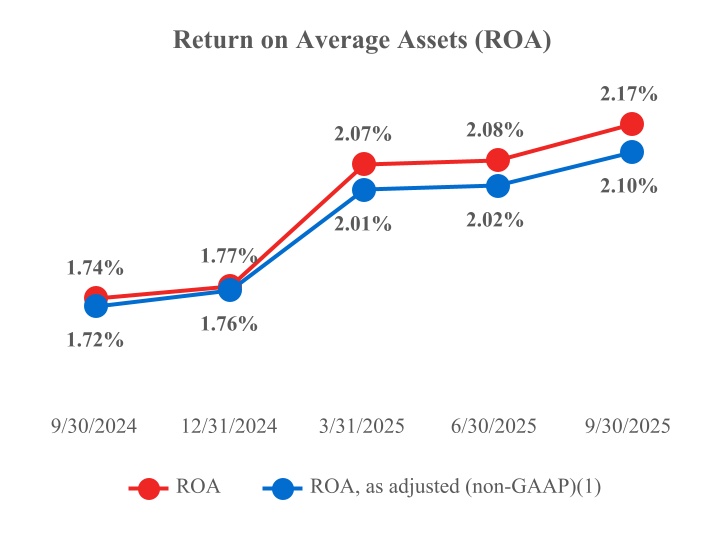
The chart below highlights Home BancShares’ strong and consistent return on average assets (ROA) over the past five quarters. ROA, a key measure of how efficiently the Company utilizes its assets to generate net income, has demonstrated a steady upward trend, reaching 2.17% in Q3 2025. This improvement reflects the Company’s disciplined approach to asset management, prudent lending practices, and ongoing focus on operational efficiency. |
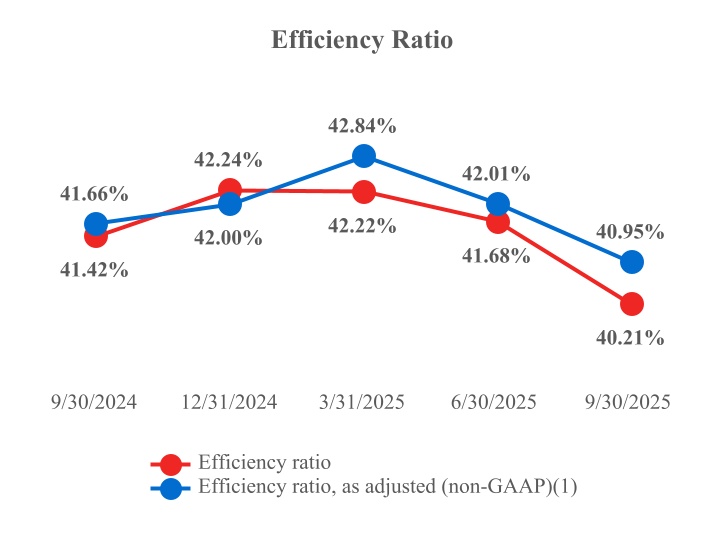
The chart below underscores Home BancShares’ strong and consistent performance in managing operating expenses, as reflected in its efficiency ratio over the past five quarters. The efficiency ratio is a key metric that measures how effectively the Company converts its revenue into net income by comparing non-interest expenses to total revenue. A lower efficiency ratio indicates greater operational efficiency and cost discipline, which are essential for sustaining profitability and enhancing shareholder value. |
|||||||
 |
 |
|||||||
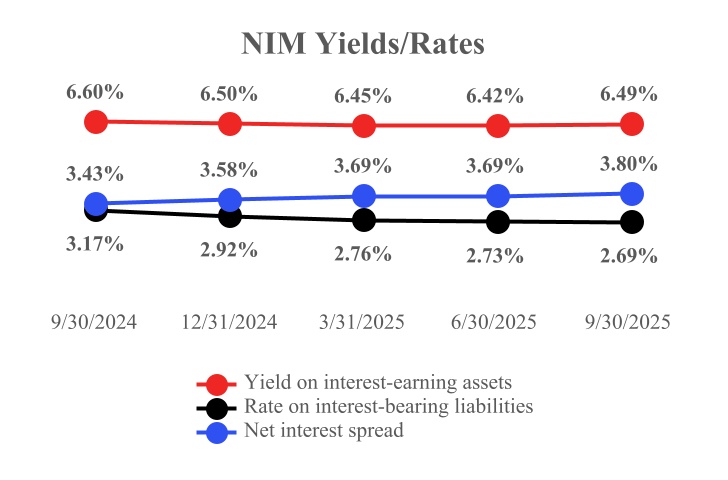
The tables below present additional key financial metrics over the past five quarters, including net interest margin (NIM), yield on interest-earning assets, rate on interest-bearing liabilities, and net interest spread. These metrics are fundamental indicators of the Company’s profitability and operational efficiency. | ||||||||
 |
 |
|||||||
| For the Three Months Ended September 30, 2025 | ||||||||||||||||||||||||||||||||||||||||||||
| (in thousands) | Texas | Arkansas | Centennial CFG | Shore Premier Finance | Florida | Alabama | Total | |||||||||||||||||||||||||||||||||||||
| Charge-offs | $ | 2,496 | $ | 605 | $ | — | $ | 735 | $ | 807 | $ | 8 | $ | 4,651 | ||||||||||||||||||||||||||||||
| Recoveries | (1,451) | (225) | — | (5) | (47) | (3) | (1,731) | |||||||||||||||||||||||||||||||||||||
| Net charge-offs (recoveries) | $ | 1,045 | $ | 380 | $ | — | $ | 730 | $ | 760 | $ | 5 | $ | 2,920 | ||||||||||||||||||||||||||||||
| For the Three Months Ended June 30, 2025 | ||||||||||||||||||||||||||||||||||||||||||||
| (in thousands) | Texas | Arkansas | Centennial CFG | Shore Premier Finance | Florida | Alabama | Total | |||||||||||||||||||||||||||||||||||||
| Charge-offs | $ | 2,588 | $ | 462 | $ | 181 | $ | 582 | $ | 245 | $ | 13 | $ | 4,071 | ||||||||||||||||||||||||||||||
| Recoveries | (2,172) | (223) | — | (22) | (577) | (2) | (2,996) | |||||||||||||||||||||||||||||||||||||
| Net (recoveries) charge-offs | $ | 416 | $ | 239 | $ | 181 | $ | 560 | $ | (332) | $ | 11 | $ | 1,075 | ||||||||||||||||||||||||||||||
| (in thousands) | Texas | Arkansas | Centennial CFG | Shore Premier Finance | Florida | Alabama | Total | |||||||||||||||||||||||||||||||||||||
| Non-accrual loans | 25,701 | 19,102 | 787 | 10,472 | 24,867 | 158 | 81,087 | |||||||||||||||||||||||||||||||||||||
| Loans 90+ days past due | 3,167 | 704 | — | — | 254 | — | 4,125 | |||||||||||||||||||||||||||||||||||||
| Total non-performing loans | 28,868 | 19,806 | 787 | 10,472 | 25,121 | 158 | 85,212 | |||||||||||||||||||||||||||||||||||||
| Foreclosed assets held for sale | 16,711 | 972 | 22,812 | — | 768 | — | 41,263 | |||||||||||||||||||||||||||||||||||||
| Total other non-performing assets | 16,711 | 972 | 22,812 | — | 768 | — | 41,263 | |||||||||||||||||||||||||||||||||||||
| Total non-performing assets | 45,579 | 20,778 | 23,599 | 10,472 | 25,889 | 158 | 126,475 | |||||||||||||||||||||||||||||||||||||
| (in thousands) | Texas | Arkansas | Centennial CFG | Shore Premier Finance | Florida | Alabama | Total | |||||||||||||||||||||||||||||||||||||
| Non-accrual loans | 22,487 | 16,276 | 787 | 11,716 | 37,833 | 162 | 89,261 | |||||||||||||||||||||||||||||||||||||
| Loans 90+ days past due | 3,557 | 2,341 | — | — | 1,133 | — | 7,031 | |||||||||||||||||||||||||||||||||||||
| Total non-performing loans | 26,044 | 18,617 | 787 | 11,716 | 38,966 | 162 | 96,292 | |||||||||||||||||||||||||||||||||||||
| Foreclosed assets held for sale | 17,259 | 863 | 22,842 | — | 565 | — | 41,529 | |||||||||||||||||||||||||||||||||||||
| Total other non-performing assets | 17,259 | 863 | 22,842 | — | 565 | — | 41,529 | |||||||||||||||||||||||||||||||||||||
| Total non-performing assets | 43,303 | 19,480 | 23,629 | 11,716 | 39,531 | 162 | 137,821 | |||||||||||||||||||||||||||||||||||||
| (In thousands) | Sep 30, 2025 |
Jun 30, 2025 |
Mar 31, 2025 |
Dec 31, 2024 |
Sep 30, 2024 |
|||||||||||||||||||||||||||
| ASSETS | ||||||||||||||||||||||||||||||||
| Cash and due from banks | $ | 284,750 | $ | 291,344 | $ | 319,747 | $ | 281,063 | $ | 265,408 | ||||||||||||||||||||||
| Interest-bearing deposits with other banks | 516,170 | 809,729 | 975,983 | 629,284 | 752,269 | |||||||||||||||||||||||||||
| Cash and cash equivalents | 800,920 | 1,101,073 | 1,295,730 | 910,347 | 1,017,677 | |||||||||||||||||||||||||||
| Federal funds sold | 3,625 | 2,600 | 6,275 | 3,725 | 6,425 | |||||||||||||||||||||||||||
| Investment securities - available-for-sale, net of allowance for credit losses |
2,924,496 | 2,899,968 | 3,003,320 | 3,072,639 | 3,270,620 | |||||||||||||||||||||||||||
| Investment securities - held-to-maturity, net of allowance for credit losses |
1,264,200 | 1,265,292 | 1,269,896 | 1,275,204 | 1,277,090 | |||||||||||||||||||||||||||
| Total investment securities | 4,188,696 | 4,165,260 | 4,273,216 | 4,347,843 | 4,547,710 | |||||||||||||||||||||||||||
| Loans receivable | 15,285,972 | 15,180,624 | 14,952,116 | 14,764,500 | 14,823,979 | |||||||||||||||||||||||||||
| Allowance for credit losses | (285,649) | (281,869) | (279,944) | (275,880) | (312,574) | |||||||||||||||||||||||||||
| Loans receivable, net | 15,000,323 | 14,898,755 | 14,672,172 | 14,488,620 | 14,511,405 | |||||||||||||||||||||||||||
| Bank premises and equipment, net | 374,515 | 379,729 | 384,843 | 386,322 | 388,776 | |||||||||||||||||||||||||||
| Foreclosed assets held for sale | 41,263 | 41,529 | 39,680 | 43,407 | 43,040 | |||||||||||||||||||||||||||
| Cash value of life insurance | 219,075 | 218,113 | 221,621 | 219,786 | 219,353 | |||||||||||||||||||||||||||
| Accrued interest receivable | 110,702 | 107,732 | 115,983 | 120,129 | 118,871 | |||||||||||||||||||||||||||
| Deferred tax asset, net | 155,963 | 174,323 | 170,120 | 186,697 | 176,629 | |||||||||||||||||||||||||||
| Goodwill | 1,398,253 | 1,398,253 | 1,398,253 | 1,398,253 | 1,398,253 | |||||||||||||||||||||||||||
| Core deposit intangible | 34,231 | 36,255 | 38,280 | 40,327 | 42,395 | |||||||||||||||||||||||||||
| Other assets | 380,236 | 383,400 | 376,030 | 345,292 | 352,583 | |||||||||||||||||||||||||||
| Total assets | $ | 22,707,802 | $ | 22,907,022 | $ | 22,992,203 | $ | 22,490,748 | $ | 22,823,117 | ||||||||||||||||||||||
LIABILITIES AND SHAREHOLDERS' EQUITY |
||||||||||||||||||||||||||||||||
| Deposits: | ||||||||||||||||||||||||||||||||
| Demand and non-interest-bearing | $ | 3,880,101 | $ | 4,024,574 | $ | 4,079,289 | $ | 4,006,115 | $ | 3,937,168 | ||||||||||||||||||||||
| Savings and interest-bearing transaction accounts
|
11,500,921 | 11,571,949 | 11,586,106 | 11,347,850 | 10,966,426 | |||||||||||||||||||||||||||
| Time deposits | 1,946,674 | 1,891,909 | 1,876,096 | 1,792,332 | 1,802,116 | |||||||||||||||||||||||||||
| Total deposits | 17,327,696 | 17,488,432 | 17,541,491 | 17,146,297 | 16,705,710 | |||||||||||||||||||||||||||
| Securities sold under agreements to repurchase | 145,998 | 140,813 | 161,401 | 162,350 | 179,416 | |||||||||||||||||||||||||||
| FHLB and other borrowed funds | 550,500 | 550,500 | 600,500 | 600,750 | 1,300,750 | |||||||||||||||||||||||||||
| Accrued interest payable and other liabilities | 189,551 | 203,004 | 207,154 | 181,080 | 238,058 | |||||||||||||||||||||||||||
| Subordinated debentures | 279,093 | 438,957 | 439,102 | 439,246 | 439,394 | |||||||||||||||||||||||||||
| Total liabilities | 18,492,838 | 18,821,706 | 18,949,648 | 18,529,723 | 18,863,328 | |||||||||||||||||||||||||||
| Shareholders' equity | ||||||||||||||||||||||||||||||||
| Common stock | 1,969 | 1,972 | 1,982 | 1,989 | 1,989 | |||||||||||||||||||||||||||
| Capital surplus | 2,214,211 | 2,221,576 | 2,246,312 | 2,272,794 | 2,272,100 | |||||||||||||||||||||||||||
| Retained earnings | 2,181,911 | 2,097,712 | 2,018,801 | 1,942,350 | 1,880,562 | |||||||||||||||||||||||||||
| Accumulated other comprehensive loss | (183,127) | (235,944) | (224,540) | (256,108) | (194,862) | |||||||||||||||||||||||||||
| Total shareholders' equity | 4,214,964 | 4,085,316 | 4,042,555 | 3,961,025 | 3,959,789 | |||||||||||||||||||||||||||
| Total liabilities and shareholders' equity | $ | 22,707,802 | $ | 22,907,022 | $ | 22,992,203 | $ | 22,490,748 | $ | 22,823,117 | ||||||||||||||||||||||
| Quarter Ended | Nine Months Ended | |||||||||||||||||||||||||||||||||||||||||||
| (In thousands) | Sep 30, 2025 |
Jun 30, 2025 |
Mar 31, 2025 |
Dec 31, 2024 |
Sep 30, 2024 |
Sep 30, 2025 |
Sep 30, 2024 |
|||||||||||||||||||||||||||||||||||||
| Interest income: | ||||||||||||||||||||||||||||||||||||||||||||
| Loans | $ | 283,165 | $ | 276,041 | $ | 270,784 | $ | 278,409 | $ | 281,977 | $ | 829,990 | $ | 821,595 | ||||||||||||||||||||||||||||||
| Investment securities | ||||||||||||||||||||||||||||||||||||||||||||
| Taxable | 26,326 | 26,444 | 27,433 | 28,943 | 31,006 | 80,203 | 96,822 | |||||||||||||||||||||||||||||||||||||
| Tax-exempt | 7,743 | 7,626 | 7,650 | 7,704 | 7,704 | 23,019 | 23,276 | |||||||||||||||||||||||||||||||||||||
| Deposits - other banks | 6,242 | 8,951 | 6,620 | 7,585 | 12,096 | 21,813 | 35,188 | |||||||||||||||||||||||||||||||||||||
| Federal funds sold | 56 | 53 | 55 | 73 | 62 | 164 | 182 | |||||||||||||||||||||||||||||||||||||
| Total interest income | 323,532 | 319,115 | 312,542 | 322,714 | 332,845 | 955,189 | 977,063 | |||||||||||||||||||||||||||||||||||||
| Interest expense: | ||||||||||||||||||||||||||||||||||||||||||||
| Interest on deposits | 87,962 | 88,489 | 86,786 | 90,564 | 97,785 | 263,237 | 286,074 | |||||||||||||||||||||||||||||||||||||
| Federal funds purchased | — | — | — | — | 1 | — | 1 | |||||||||||||||||||||||||||||||||||||
| FHLB and other borrowed funds | 5,378 | 5,539 | 5,902 | 9,541 | 14,383 | 16,819 | 42,914 | |||||||||||||||||||||||||||||||||||||
| Securities sold under agreements to repurchase
|
1,019 | 1,012 | 1,074 | 1,346 | 1,335 | 3,105 | 4,102 | |||||||||||||||||||||||||||||||||||||
| Subordinated debentures | 3,007 | 4,123 | 4,124 | 4,121 | 4,121 | 11,254 | 12,340 | |||||||||||||||||||||||||||||||||||||
| Total interest expense | 97,366 | 99,163 | 97,886 | 105,572 | 117,625 | 294,415 | 345,431 | |||||||||||||||||||||||||||||||||||||
| Net interest income | 226,166 | 219,952 | 214,656 | 217,142 | 215,220 | 660,774 | 631,632 | |||||||||||||||||||||||||||||||||||||
| Provision for credit losses on loans | 6,700 | 3,000 | — | 16,700 | 18,200 | 9,700 | 31,700 | |||||||||||||||||||||||||||||||||||||
| (Recovery of) provision for credit losses on unfunded commitments
|
(1,000) | — | — | — | 1,000 | (1,000) | — | |||||||||||||||||||||||||||||||||||||
| Recovery of credit losses on investment securities
|
(2,194) | — | — | — | (330) | (2,194) | (330) | |||||||||||||||||||||||||||||||||||||
| Total credit loss expense | 3,506 | 3,000 | — | 16,700 | 18,870 | 6,506 | 31,370 | |||||||||||||||||||||||||||||||||||||
| Net interest income after credit loss expense | 222,660 | 216,952 | 214,656 | 200,442 | 196,350 | 654,268 | 600,262 | |||||||||||||||||||||||||||||||||||||
| Non-interest income: | ||||||||||||||||||||||||||||||||||||||||||||
| Service charges on deposit accounts | 10,486 | 9,552 | 9,650 | 9,935 | 9,888 | 29,688 | 29,288 | |||||||||||||||||||||||||||||||||||||
| Other service charges and fees | 12,130 | 12,643 | 10,689 | 11,651 | 10,490 | 35,462 | 31,358 | |||||||||||||||||||||||||||||||||||||
| Trust fees | 4,600 | 5,234 | 4,760 | 4,526 | 4,403 | 14,594 | 14,191 | |||||||||||||||||||||||||||||||||||||
| Mortgage lending income | 4,691 | 4,780 | 3,599 | 3,518 | 4,437 | 13,070 | 12,271 | |||||||||||||||||||||||||||||||||||||
| Insurance commissions | 574 | 589 | 535 | 483 | 595 | 1,698 | 1,668 | |||||||||||||||||||||||||||||||||||||
| Increase in cash value of life insurance | 1,404 | 1,415 | 1,842 | 1,215 | 1,161 | 4,661 | 3,635 | |||||||||||||||||||||||||||||||||||||
| Dividends from FHLB, FRB, FNBB & other | 2,658 | 2,657 | 2,718 | 2,820 | 2,637 | 8,033 | 8,642 | |||||||||||||||||||||||||||||||||||||
| Gain on SBA loans | 46 | — | 288 | 218 | 145 | 334 | 399 | |||||||||||||||||||||||||||||||||||||
| (Loss) gain on branches, equipment and other assets, net |
(66) | 972 | (163) | 26 | 32 | 743 | 2,076 | |||||||||||||||||||||||||||||||||||||
| (Loss) gain on OREO, net | (1) | 13 | (376) | (2,423) | 85 | (364) | 151 | |||||||||||||||||||||||||||||||||||||
| Fair value adjustment for marketable securities
|
1,020 | (238) | 442 | 850 | 1,392 | 1,224 | 2,121 | |||||||||||||||||||||||||||||||||||||
| Other income | 13,963 | 13,462 | 11,442 | 8,403 | 7,514 | 38,867 | 21,552 | |||||||||||||||||||||||||||||||||||||
| Total non-interest income | 51,505 | 51,079 | 45,426 | 41,222 | 42,779 | 148,010 | 127,352 | |||||||||||||||||||||||||||||||||||||
| Non-interest expense: | ||||||||||||||||||||||||||||||||||||||||||||
| Salaries and employee benefits | 63,804 | 64,318 | 61,855 | 60,824 | 58,861 | 189,977 | 180,198 | |||||||||||||||||||||||||||||||||||||
| Occupancy and equipment | 14,828 | 14,023 | 14,425 | 14,526 | 14,546 | 43,276 | 43,505 | |||||||||||||||||||||||||||||||||||||
| Data processing expense | 8,871 | 8,364 | 8,558 | 9,324 | 9,088 | 25,793 | 27,170 | |||||||||||||||||||||||||||||||||||||
| Other operating expenses | 27,335 | 29,335 | 28,090 | 27,536 | 27,550 | 84,760 | 83,853 | |||||||||||||||||||||||||||||||||||||
| Total non-interest expense | 114,838 | 116,040 | 112,928 | 112,210 | 110,045 | 343,806 | 334,726 | |||||||||||||||||||||||||||||||||||||
| Income before income taxes | 159,327 | 151,991 | 147,154 | 129,454 | 129,084 | 458,472 | 392,888 | |||||||||||||||||||||||||||||||||||||
| Income tax expense | 35,723 | 33,588 | 31,945 | 28,890 | 29,046 | 101,256 | 91,211 | |||||||||||||||||||||||||||||||||||||
| Net income | $ | 123,604 | $ | 118,403 | $ | 115,209 | $ | 100,564 | $ | 100,038 | $ | 357,216 | $ | 301,677 | ||||||||||||||||||||||||||||||
| Quarter Ended | Nine Months Ended | |||||||||||||||||||||||||||||||||||||||||||
| (Dollars and shares in thousands, except per share data) | Sep 30, 2025 | Jun 30, 2025 | Mar 31, 2025 | Dec 31, 2024 | Sep 30, 2024 | Sep 30, 2025 | Sep 30, 2024 | |||||||||||||||||||||||||||||||||||||
| PER SHARE DATA | ||||||||||||||||||||||||||||||||||||||||||||
| Diluted earnings per common share | $ | 0.63 | $ | 0.60 | $ | 0.58 | $ | 0.51 | $ | 0.50 | $ | 1.80 | $ | 1.51 | ||||||||||||||||||||||||||||||
|
Diluted earnings per common share, as adjusted
(non-GAAP)(1)
|
0.61 | 0.58 | 0.56 | 0.50 | 0.50 | 1.75 | 1.51 | |||||||||||||||||||||||||||||||||||||
| Basic earnings per common share | 0.63 | 0.60 | 0.58 | 0.51 | 0.50 | 1.81 | 1.51 | |||||||||||||||||||||||||||||||||||||
| Dividends per share - common | 0.20 | 0.20 | 0.195 | 0.195 | 0.195 | 0.595 | 0.555 | |||||||||||||||||||||||||||||||||||||
Shareholder buyback yield(2) |
0.18% | 0.49% | 0.53% | 0.05% | 0.56% | 1.19% | 1.64% | |||||||||||||||||||||||||||||||||||||
| Book value per common share | $ | 21.41 | $ | 20.71 | $ | 20.40 | $ | 19.92 | $ | 19.91 | $ | 21.41 | $ | 19.91 | ||||||||||||||||||||||||||||||
|
Tangible book value per common share
(non-GAAP)(1)
|
14.13 | 13.44 | 13.15 | 12.68 | 12.67 | 14.13 | 12.67 | |||||||||||||||||||||||||||||||||||||
| STOCK INFORMATION | ||||||||||||||||||||||||||||||||||||||||||||
| Average common shares outstanding | 197,078 | 197,532 | 198,657 | 198,863 | 199,380 | 197,750 | 200,300 | |||||||||||||||||||||||||||||||||||||
| Average diluted shares outstanding | 197,288 | 197,765 | 198,852 | 198,973 | 199,461 | 197,952 | 200,430 | |||||||||||||||||||||||||||||||||||||
| End of period common shares outstanding | 196,889 | 197,239 | 198,206 | 198,882 | 198,879 | 196,889 | 198,879 | |||||||||||||||||||||||||||||||||||||
| ANNUALIZED PERFORMANCE METRICS | ||||||||||||||||||||||||||||||||||||||||||||
| Return on average assets (ROA) | 2.17 | % | 2.08 | % | 2.07 | % | 1.77 | % | 1.74 | % | 2.11 | % | 1.77 | % | ||||||||||||||||||||||||||||||
|
Return on average assets, as adjusted:
(ROA, as adjusted) (non-GAAP)(1)
|
2.10 | 2.02 | 2.01 | 1.76 | 1.72 | 2.04 | 1.77 | |||||||||||||||||||||||||||||||||||||
|
Return on average assets excluding intangible
amortization (non-GAAP)(1)
|
2.34 | 2.25 | 2.24 | 1.92 | 1.88 | 2.28 | 1.92 | |||||||||||||||||||||||||||||||||||||
|
Return on average assets, as adjusted, excluding
intangible amortization (non-GAAP)(1)
|
2.27 | 2.18 | 2.18 | 1.91 | 1.86 | 2.21 | 1.92 | |||||||||||||||||||||||||||||||||||||
| Return on average common equity (ROE) | 11.91 | 11.77 | 11.75 | 10.13 | 10.23 | 11.81 | 10.53 | |||||||||||||||||||||||||||||||||||||
|
Return on average common equity, as adjusted:
(ROE, as adjusted) (non-GAAP)(1)
|
11.54 | 11.39 | 11.41 | 10.05 | 10.12 | 11.45 | 10.55 | |||||||||||||||||||||||||||||||||||||
|
Return on average tangible common equity
(ROTCE) (non-GAAP)(1)
|
18.28 | 18.26 | 18.39 | 15.94 | 16.26 | 18.31 | 16.91 | |||||||||||||||||||||||||||||||||||||
|
Return on average tangible common equity, as adjusted:
(ROTCE, as adjusted) (non-GAAP)(1)
|
17.70 | 17.68 | 17.87 | 15.82 | 16.09 | 17.75 | 16.94 | |||||||||||||||||||||||||||||||||||||
|
Return on average tangible common equity excluding
intangible amortization (non-GAAP)(1)
|
18.51 | 18.50 | 18.64 | 16.18 | 16.51 | 18.55 | 17.18 | |||||||||||||||||||||||||||||||||||||
|
Return on average tangible common equity, as adjusted,
excluding intangible amortization (non-GAAP)(1)
|
17.93 | 17.92 | 18.12 | 16.07 | 16.34 | 17.98 | 17.20 | |||||||||||||||||||||||||||||||||||||
| Quarter Ended | Nine Months Ended | |||||||||||||||||||||||||||||||||||||||||||
| (Dollars in thousands) | Sep 30, 2025 | Jun 30, 2025 | Mar 31, 2025 | Dec 31, 2024 | Sep 30, 2024 | Sep 30, 2025 | Sep 30, 2024 | |||||||||||||||||||||||||||||||||||||
| Efficiency ratio | 40.21 | % | 41.68 | % | 42.22 | % | 42.24 | % | 41.42 | % | 41.35 | % | 42.91 | % | ||||||||||||||||||||||||||||||
Efficiency ratio, as adjusted (non-GAAP)(1) |
40.95 | 42.01 | 42.84 | 42.00 | 41.66 | 41.91 | 42.87 | |||||||||||||||||||||||||||||||||||||
| Net interest margin - FTE (NIM) | 4.56 | 4.44 | 4.44 | 4.39 | 4.28 | 4.48 | 4.23 | |||||||||||||||||||||||||||||||||||||
| Fully taxable equivalent adjustment | $ | 2,916 | $ | 2,526 | $ | 2,534 | $ | 2,398 | $ | 2,616 | $ | 7,976 | $ | 6,136 | ||||||||||||||||||||||||||||||
| Total revenue (net) | 277,671 | 271,031 | 260,082 | 258,364 | 257,999 | 808,784 | 758,984 | |||||||||||||||||||||||||||||||||||||
|
Pre-tax, pre-provision, net income (PPNR)
(non-GAAP)(1)
|
162,833 | 154,991 | 147,154 | 146,154 | 147,954 | 464,978 | 424,258 | |||||||||||||||||||||||||||||||||||||
PPNR, as adjusted (non-GAAP)(1) |
157,704 | 150,404 | 142,821 | 145,209 | 146,562 | 450,929 | 422,176 | |||||||||||||||||||||||||||||||||||||
| Pre-tax net income to total revenue (net) | 57.38 | % | 56.08 | % | 56.58 | % | 50.11 | % | 50.03 | % | 56.69 | % | 51.76 | % | ||||||||||||||||||||||||||||||
Pre-tax net income, as adjusted, to total revenue (net) (non-GAAP)(1) |
55.53 | 54.39 | 54.91 | 49.74 | 49.49 | 54.95 | 51.49 | |||||||||||||||||||||||||||||||||||||
P5NR ((Pre-tax, pre-provision, profit percentage) (PPNR to total revenue (net)) (non-GAAP)(1) |
58.64 | 57.19 | 56.58 | 56.57 | 57.35 | 57.49 | 55.90 | |||||||||||||||||||||||||||||||||||||
P5NR, as adjusted (non-GAAP)(1) |
56.80 | 55.49 | 54.91 | 56.20 | 56.81 | 55.75 | 55.62 | |||||||||||||||||||||||||||||||||||||
| Total purchase accounting accretion | $ | 1,272 | $ | 1,233 | $ | 1,378 | $ | 1,610 | $ | 1,878 | $ | 3,883 | $ | 6,523 | ||||||||||||||||||||||||||||||
| Average purchase accounting loan discounts | 15,009 | 16,219 | 17,493 | 19,090 | 20,832 | 16,257 | 22,813 | |||||||||||||||||||||||||||||||||||||
| OTHER OPERATING EXPENSES | ||||||||||||||||||||||||||||||||||||||||||||
| Advertising | $ | 2,149 | $ | 2,054 | $ | 1,928 | $ | 1,941 | $ | 1,810 | $ | 6,131 | $ | 5,156 | ||||||||||||||||||||||||||||||
| Amortization of intangibles | 2,024 | 2,025 | 2,047 | 2,068 | 2,095 | 6,096 | 6,375 | |||||||||||||||||||||||||||||||||||||
| Electronic banking expense | 3,357 | 3,172 | 3,055 | 3,307 | 3,569 | 9,584 | 10,137 | |||||||||||||||||||||||||||||||||||||
| Directors' fees | 405 | 431 | 452 | 356 | 362 | 1,288 | 1,283 | |||||||||||||||||||||||||||||||||||||
| Due from bank service charges | 404 | 283 | 281 | 271 | 302 | 968 | 860 | |||||||||||||||||||||||||||||||||||||
| FDIC and state assessment | 3,245 | 1,636 | 3,387 | 3,216 | 3,360 | 8,268 | 12,172 | |||||||||||||||||||||||||||||||||||||
| Insurance | 1,110 | 1,049 | 999 | 900 | 926 | 3,158 | 2,734 | |||||||||||||||||||||||||||||||||||||
| Legal and accounting | 1,061 | 2,360 | 3,641 | 2,361 | 1,902 | 7,062 | 6,600 | |||||||||||||||||||||||||||||||||||||
| Other professional fees | 2,083 | 2,211 | 1,947 | 1,736 | 2,062 | 6,241 | 6,406 | |||||||||||||||||||||||||||||||||||||
| Operating supplies | 773 | 711 | 711 | 711 | 673 | 2,195 | 1,969 | |||||||||||||||||||||||||||||||||||||
| Postage | 538 | 488 | 503 | 518 | 522 | 1,529 | 1,542 | |||||||||||||||||||||||||||||||||||||
| Telephone | 367 | 419 | 436 | 438 | 455 | 1,222 | 1,369 | |||||||||||||||||||||||||||||||||||||
| Other expense | 9,819 | 12,496 | 8,703 | 9,713 | 9,512 | 31,018 | 27,250 | |||||||||||||||||||||||||||||||||||||
| Total other operating expenses | $ | 27,335 | $ | 29,335 | $ | 28,090 | $ | 27,536 | $ | 27,550 | $ | 84,760 | $ | 83,853 | ||||||||||||||||||||||||||||||
| (Dollars in thousands) | Sep 30, 2025 |
Jun 30, 2025 |
Mar 31, 2025 |
Dec 31, 2024 |
Sep 30, 2024 |
|||||||||||||||||||||||||||
| BALANCE SHEET RATIOS | ||||||||||||||||||||||||||||||||
| Total loans to total deposits | 88.22 | % | 86.80 | % | 85.24 | % | 86.11 | % | 88.74 | % | ||||||||||||||||||||||
| Common equity to assets | 18.56 | 17.83 | 17.58 | 17.61 | 17.35 | |||||||||||||||||||||||||||
|
Tangible common equity to tangible assets
(non-GAAP)(1)
|
13.08 | 12.35 | 12.09 | 11.98 | 11.78 | |||||||||||||||||||||||||||
| LOANS RECEIVABLE | ||||||||||||||||||||||||||||||||
| Real estate | ||||||||||||||||||||||||||||||||
| Commercial real estate loans | ||||||||||||||||||||||||||||||||
| Non-farm/non-residential | $ | 5,494,492 | $ | 5,553,182 | $ | 5,588,681 | $ | 5,426,780 | $ | 5,496,536 | ||||||||||||||||||||||
| Construction/land development | 2,709,197 | 2,695,561 | 2,735,760 | 2,736,214 | 2,741,419 | |||||||||||||||||||||||||||
| Agricultural | 331,301 | 315,926 | 335,437 | 336,993 | 335,965 | |||||||||||||||||||||||||||
| Residential real estate loans | ||||||||||||||||||||||||||||||||
| Residential 1-4 family | 2,142,375 | 2,138,990 | 1,947,872 | 1,956,489 | 1,932,352 | |||||||||||||||||||||||||||
| Multifamily residential | 716,595 | 620,439 | 576,089 | 496,484 | 482,648 | |||||||||||||||||||||||||||
| Total real estate | 11,393,960 | 11,324,098 | 11,183,839 | 10,952,960 | 10,988,920 | |||||||||||||||||||||||||||
| Consumer | 1,233,523 | 1,218,834 | 1,227,745 | 1,234,361 | 1,219,197 | |||||||||||||||||||||||||||
| Commercial and industrial | 2,100,268 | 2,107,326 | 2,045,036 | 2,022,775 | 2,084,667 | |||||||||||||||||||||||||||
| Agricultural | 346,167 | 323,457 | 314,323 | 367,251 | 352,963 | |||||||||||||||||||||||||||
| Other | 212,054 | 206,909 | 181,173 | 187,153 | 178,232 | |||||||||||||||||||||||||||
| Loans receivable | $ | 15,285,972 | $ | 15,180,624 | $ | 14,952,116 | $ | 14,764,500 | $ | 14,823,979 | ||||||||||||||||||||||
| ALLOWANCE FOR CREDIT LOSSES | ||||||||||||||||||||||||||||||||
| Balance, beginning of period | $ | 281,869 | $ | 279,944 | $ | 275,880 | $ | 312,574 | $ | 295,856 | ||||||||||||||||||||||
| Loans charged off | 4,651 | 4,071 | 3,458 | 53,959 | 2,001 | |||||||||||||||||||||||||||
| Recoveries of loans previously charged off | 1,731 | 2,996 | 7,522 | 565 | 519 | |||||||||||||||||||||||||||
| Net loans charged off (recovered) | 2,920 | 1,075 | (4,064) | 53,394 | 1,482 | |||||||||||||||||||||||||||
| Provision for credit losses - loans | 6,700 | 3,000 | — | 16,700 | 18,200 | |||||||||||||||||||||||||||
| Balance, end of period | $ | 285,649 | $ | 281,869 | $ | 279,944 | $ | 275,880 | $ | 312,574 | ||||||||||||||||||||||
| Net charge-offs (recoveries) to average total loans | 0.08 | % | 0.03 | % | (0.11) | % | 1.44 | % | 0.04 | % | ||||||||||||||||||||||
| Allowance for credit losses to total loans | 1.87 | 1.86 | 1.87 | 1.87 | 2.11 | |||||||||||||||||||||||||||
| NON-PERFORMING ASSETS | ||||||||||||||||||||||||||||||||
| Non-performing loans | ||||||||||||||||||||||||||||||||
| Non-accrual loans | $ | 81,087 | $ | 89,261 | $ | 86,383 | $ | 93,853 | $ | 95,747 | ||||||||||||||||||||||
| Loans past due 90 days or more | 4,125 | 7,031 | 3,264 | 5,034 | 5,356 | |||||||||||||||||||||||||||
| Total non-performing loans | 85,212 | 96,292 | 89,647 | 98,887 | 101,103 | |||||||||||||||||||||||||||
| Other non-performing assets | ||||||||||||||||||||||||||||||||
| Foreclosed assets held for sale, net | 41,263 | 41,529 | 39,680 | 43,407 | 43,040 | |||||||||||||||||||||||||||
| Other non-performing assets | — | — | 63 | 63 | 63 | |||||||||||||||||||||||||||
| Total other non-performing assets | 41,263 | 41,529 | 39,743 | 43,470 | 43,103 | |||||||||||||||||||||||||||
| Total non-performing assets | $ | 126,475 | $ | 137,821 | $ | 129,390 | $ | 142,357 | $ | 144,206 | ||||||||||||||||||||||
| Allowance for credit losses for loans to non-performing loans | 335.22 | % | 292.72 | % | 312.27 | % | 278.99 | % | 309.16 | % | ||||||||||||||||||||||
| Non-performing loans to total loans | 0.56 | 0.63 | 0.60 | 0.67 | 0.68 | |||||||||||||||||||||||||||
| Non-performing assets to total assets | 0.56 | 0.60 | 0.56 | 0.63 | 0.63 | |||||||||||||||||||||||||||
| Three Months Ended | ||||||||||||||||||||||||||||||||||||||
| September 30, 2025 | June 30, 2025 | |||||||||||||||||||||||||||||||||||||
| (Dollars in thousands) | Average Balance |
Income/ Expense |
Yield/ Rate |
Average Balance |
Income/ Expense |
Yield/ Rate |
||||||||||||||||||||||||||||||||
| ASSETS | ||||||||||||||||||||||||||||||||||||||
| Earning assets | ||||||||||||||||||||||||||||||||||||||
| Interest-bearing balances due from banks | $ | 567,617 | $ | 6,242 | 4.36 | % | $ | 813,833 | $ | 8,951 | 4.41 | % | ||||||||||||||||||||||||||
| Federal funds sold | 5,142 | 56 | 4.32 | 4,878 | 53 | 4.36 | ||||||||||||||||||||||||||||||||
| Investment securities - taxable | 3,039,247 | 26,326 | 3.44 | 3,095,764 | 26,444 | 3.43 | ||||||||||||||||||||||||||||||||
| Investment securities - non-taxable - FTE | 1,115,834 | 10,201 | 3.63 | 1,113,044 | 10,033 | 3.62 | ||||||||||||||||||||||||||||||||
| Loans receivable - FTE | 15,216,448 | 283,623 | 7.39 | 15,055,414 | 276,160 | 7.36 | ||||||||||||||||||||||||||||||||
| Total interest-earning assets | 19,944,288 | 326,448 | 6.49 | 20,082,933 | 321,641 | 6.42 | ||||||||||||||||||||||||||||||||
| Non-earning assets | 2,694,650 | 2,714,805 | ||||||||||||||||||||||||||||||||||||
| Total assets | $ | 22,638,938 | $ | 22,797,738 | ||||||||||||||||||||||||||||||||||
| LIABILITIES AND SHAREHOLDERS' EQUITY | ||||||||||||||||||||||||||||||||||||||
| Liabilities | ||||||||||||||||||||||||||||||||||||||
| Interest-bearing liabilities | ||||||||||||||||||||||||||||||||||||||
| Savings and interest-bearing transaction accounts | $ | 11,408,316 | $ | 70,406 | 2.45 | % | $ | 11,541,641 | $ | 71,042 | 2.47 | % | ||||||||||||||||||||||||||
| Time deposits | 1,911,703 | 17,556 | 3.64 | 1,886,147 | 17,447 | 3.71 | ||||||||||||||||||||||||||||||||
| Total interest-bearing deposits | 13,320,019 | 87,962 | 2.62 | 13,427,788 | 88,489 | 2.64 | ||||||||||||||||||||||||||||||||
| Federal funds purchased | 11 | — | — | 46 | — | — | ||||||||||||||||||||||||||||||||
| Securities sold under agreement to repurchase
|
145,883 | 1,019 | 2.77 | 143,752 | 1,012 | 2.82 | ||||||||||||||||||||||||||||||||
| FHLB and other borrowed funds | 550,501 | 5,378 | 3.88 | 566,984 | 5,539 | 3.92 | ||||||||||||||||||||||||||||||||
| Subordinated debentures | 338,757 | 3,007 | 3.52 | 439,027 | 4,123 | 3.77 | ||||||||||||||||||||||||||||||||
| Total interest-bearing liabilities | 14,355,171 | 97,366 | 2.69 | 14,577,597 | 99,163 | 2.73 | ||||||||||||||||||||||||||||||||
| Non-interest bearing liabilities | ||||||||||||||||||||||||||||||||||||||
| Non-interest bearing deposits | 3,956,826 | 3,981,901 | ||||||||||||||||||||||||||||||||||||
| Other liabilities | 211,057 | 202,085 | ||||||||||||||||||||||||||||||||||||
| Total liabilities | 18,523,054 | 18,761,583 | ||||||||||||||||||||||||||||||||||||
| Shareholders' equity | 4,115,884 | 4,036,155 | ||||||||||||||||||||||||||||||||||||
| Total liabilities and shareholders' equity | $ | 22,638,938 | $ | 22,797,738 | ||||||||||||||||||||||||||||||||||
| Net interest spread | 3.80 | % | 3.69 | % | ||||||||||||||||||||||||||||||||||
| Net interest income and margin - FTE | $ | 229,082 | 4.56 | $ | 222,478 | 4.44 | ||||||||||||||||||||||||||||||||
| Nine Months Ended | ||||||||||||||||||||||||||||||||||||||
| September 30, 2025 | September 30, 2024 | |||||||||||||||||||||||||||||||||||||
| (Dollars in thousands) | Average Balance |
Income/ Expense |
Yield/ Rate |
Average Balance |
Income/ Expense |
Yield/ Rate |
||||||||||||||||||||||||||||||||
| ASSETS | ||||||||||||||||||||||||||||||||||||||
| Earning assets | ||||||||||||||||||||||||||||||||||||||
| Interest-bearing balances due from banks | $ | 664,308 | $ | 21,813 | 4.39 | % | $ | 878,368 | $ | 35,188 | 5.35 | % | ||||||||||||||||||||||||||
| Federal funds sold | 5,037 | 164 | 4.35 | 4,688 | 182 | 5.19 | ||||||||||||||||||||||||||||||||
| Investment securities - taxable | 3,104,254 | 80,203 | 3.45 | 3,436,874 | 96,822 | 3.76 | ||||||||||||||||||||||||||||||||
| Investment securities - non-taxable - FTE | 1,121,481 | 30,294 | 3.61 | 1,202,003 | 29,077 | 3.23 | ||||||||||||||||||||||||||||||||
| Loans receivable - FTE | 15,056,440 | 830,691 | 7.38 | 14,633,382 | 821,930 | 7.50 | ||||||||||||||||||||||||||||||||
| Total interest-earning assets | 19,951,520 | 963,165 | 6.45 | 20,155,315 | 983,199 | 6.52 | ||||||||||||||||||||||||||||||||
| Non-earning assets | 2,710,647 | 2,662,627 | ||||||||||||||||||||||||||||||||||||
| Total assets | $ | 22,662,167 | $ | 22,817,942 | ||||||||||||||||||||||||||||||||||
| LIABILITIES AND SHAREHOLDERS' EQUITY | ||||||||||||||||||||||||||||||||||||||
| Liabilities | ||||||||||||||||||||||||||||||||||||||
| Interest-bearing liabilities | ||||||||||||||||||||||||||||||||||||||
| Savings and interest-bearing transaction accounts | $ | 11,450,902 | $ | 211,120 | 2.47 | % | $ | 11,084,397 | $ | 232,757 | 2.80 | % | ||||||||||||||||||||||||||
| Time deposits | 1,866,855 | 52,117 | 3.73 | 1,729,400 | 53,317 | 4.12 | ||||||||||||||||||||||||||||||||
| Total interest-bearing deposits | 13,317,757 | 263,237 | 2.64 | 12,813,797 | 286,074 | 2.98 | ||||||||||||||||||||||||||||||||
| Federal funds purchased | 19 | — | — | 26 | 1 | 5.14 | ||||||||||||||||||||||||||||||||
| Securities sold under agreement to repurchase
|
148,462 | 3,105 | 2.80 | 163,013 | 4,102 | 3.36 | ||||||||||||||||||||||||||||||||
| FHLB and other borrowed funds | 572,538 | 16,819 | 3.93 | 1,301,005 | 42,914 | 4.41 | ||||||||||||||||||||||||||||||||
| Subordinated debentures | 405,285 | 11,254 | 3.71 | 439,613 | 12,340 | 3.75 | ||||||||||||||||||||||||||||||||
| Total interest-bearing liabilities | 14,444,061 | 294,415 | 2.73 | 14,717,454 | 345,431 | 3.14 | ||||||||||||||||||||||||||||||||
| Non-interest bearing liabilities | ||||||||||||||||||||||||||||||||||||||
| Non-interest bearing deposits | 3,973,135 | 4,031,447 | ||||||||||||||||||||||||||||||||||||
| Other liabilities | 201,228 | 242,422 | ||||||||||||||||||||||||||||||||||||
| Total liabilities | 18,618,424 | 18,991,323 | ||||||||||||||||||||||||||||||||||||
| Shareholders' equity | 4,043,743 | 3,826,619 | ||||||||||||||||||||||||||||||||||||
| Total liabilities and shareholders' equity | $ | 22,662,167 | $ | 22,817,942 | ||||||||||||||||||||||||||||||||||
| Net interest spread | 3.72 | % | 3.38 | % | ||||||||||||||||||||||||||||||||||
| Net interest income and margin - FTE | $ | 668,750 | 4.48 | $ | 637,768 | 4.23 | ||||||||||||||||||||||||||||||||
| Quarter Ended | Nine Months Ended | |||||||||||||||||||||||||||||||||||||||||||
| (Dollars and shares in thousands, except per share data) |
Sep 30, 2025 |
Jun 30, 2025 |
Mar 31, 2025 |
Dec 31, 2024 |
Sep 30, 2024 |
Sep 30, 2025 |
Sep 30, 2024 |
|||||||||||||||||||||||||||||||||||||
| EARNINGS, AS ADJUSTED | ||||||||||||||||||||||||||||||||||||||||||||
| GAAP net income available to common shareholders (A) | $ | 123,604 | $ | 118,403 | $ | 115,209 | $ | 100,564 | $ | 100,038 | $ | 357,216 | $ | 301,677 | ||||||||||||||||||||||||||||||
| Pre-tax adjustments | ||||||||||||||||||||||||||||||||||||||||||||
| Gain on retirement of subordinated debt | (1,882) | — | — | — | — | (1,882) | — | |||||||||||||||||||||||||||||||||||||
| FDIC special assessment | — | (1,516) | — | — | — | (1,516) | 2,260 | |||||||||||||||||||||||||||||||||||||
| BOLI death benefits | (187) | (1,243) | — | (95) | — | (1,430) | (162) | |||||||||||||||||||||||||||||||||||||
| Gain on sale of premises and equipment | — | (983) | — | — | — | (983) | (2,059) | |||||||||||||||||||||||||||||||||||||
| Fair value adjustment for marketable securities | (1,020) | 238 | (442) | (850) | (1,392) | (1,224) | (2,121) | |||||||||||||||||||||||||||||||||||||
| Special income from equity investment | — | (3,498) | (3,891) | — | — | (7,389) | — | |||||||||||||||||||||||||||||||||||||
| Legal fee reimbursement | — | (885) | — | — | — | (885) | — | |||||||||||||||||||||||||||||||||||||
| Legal claims expense | — | 3,300 | — | — | — | 3,300 | — | |||||||||||||||||||||||||||||||||||||
| Recoveries on historic losses | (2,040) | — | — | — | — | (2,040) | — | |||||||||||||||||||||||||||||||||||||
| Total pre-tax adjustments | (5,129) | (4,587) | (4,333) | (945) | (1,392) | (14,049) | (2,082) | |||||||||||||||||||||||||||||||||||||
| Tax-effect of adjustments | (1,207) | (817) | (1,059) | (208) | (348) | (3,083) | (480) | |||||||||||||||||||||||||||||||||||||
| Deferred tax asset write-down | — | — | — | — | — | — | 2,030 | |||||||||||||||||||||||||||||||||||||
| Total adjustments after-tax (B) | (3,922) | (3,770) | (3,274) | (737) | (1,044) | (10,966) | 428 | |||||||||||||||||||||||||||||||||||||
| Earnings, as adjusted (C) | $ | 119,682 | $ | 114,633 | $ | 111,935 | $ | 99,827 | $ | 98,994 | $ | 346,250 | $ | 302,105 | ||||||||||||||||||||||||||||||
| Average diluted shares outstanding (D) | 197,288 | 197,765 | 198,852 | 198,973 | 199,461 | 197,952 | 200,430 | |||||||||||||||||||||||||||||||||||||
| GAAP diluted earnings per share: (A/D) | $ | 0.63 | $ | 0.60 | $ | 0.58 | $ | 0.51 | $ | 0.50 | $ | 1.80 | $ | 1.51 | ||||||||||||||||||||||||||||||
| Adjustments after-tax: (B/D) | (0.02) | (0.02) | (0.02) | (0.01) | — | (0.05) | — | |||||||||||||||||||||||||||||||||||||
| Diluted earnings per common share, as adjusted: (C/D) | $ | 0.61 | $ | 0.58 | $ | 0.56 | $ | 0.50 | $ | 0.50 | $ | 1.75 | $ | 1.51 | ||||||||||||||||||||||||||||||
| ANNUALIZED RETURN ON AVERAGE ASSETS | ||||||||||||||||||||||||||||||||||||||||||||
| Return on average assets: (A/E) | 2.17 | % | 2.08 | % | 2.07 | % | 1.77 | % | 1.74 | % | 2.11 | % | 1.77 | % | ||||||||||||||||||||||||||||||
| Return on average assets, as adjusted: (ROA, as adjusted) ((A+D)/E) | 2.10 | 2.02 | 2.01 | 1.76 | 1.72 | 2.04 | 1.77 | |||||||||||||||||||||||||||||||||||||
| Return on average assets excluding intangible amortization: ((A+C)/(E-F)) | 2.34 | 2.25 | 2.24 | 1.92 | 1.88 | 2.28 | 1.92 | |||||||||||||||||||||||||||||||||||||
| Return on average assets, as adjusted, excluding intangible amortization: ((A+C+D)/(E-F)) | 2.27 | 2.18 | 2.18 | 1.91 | 1.86 | 2.21 | 1.92 | |||||||||||||||||||||||||||||||||||||
| GAAP net income available to common shareholders (A) | $ | 123,604 | $ | 118,403 | $ | 115,209 | $ | 100,564 | $ | 100,038 | $ | 357,216 | $ | 301,677 | ||||||||||||||||||||||||||||||
| Amortization of intangibles (B) | 2,024 | 2,025 | 2,047 | 2,068 | 2,095 | 6,096 | 6,375 | |||||||||||||||||||||||||||||||||||||
| Amortization of intangibles after-tax (C) | 1,529 | 1,530 | 1,547 | 1,563 | 1,572 | 4,607 | 4,782 | |||||||||||||||||||||||||||||||||||||
| Adjustments after-tax (D) | (3,922) | (3,770) | (3,274) | (737) | (1,044) | (10,966) | 428 | |||||||||||||||||||||||||||||||||||||
| Average assets (E) | 22,638,938 | 22,797,738 | 22,548,835 | 22,565,077 | 22,893,784 | 22,662,167 | 22,817,942 | |||||||||||||||||||||||||||||||||||||
| Average goodwill & core deposit intangible (F) | 1,433,474 | 1,435,480 | 1,437,515 | 1,439,566 | 1,441,654 | 1,435,475 | 1,443,770 | |||||||||||||||||||||||||||||||||||||
| Quarter Ended | Nine Months Ended | |||||||||||||||||||||||||||||||||||||||||||
| (Dollars in thousands) | Sep 30, 2025 |
Jun 30, 2025 |
Mar 31, 2025 |
Dec 31, 2024 |
Sep 30, 2024 |
Sep 30, 2025 |
Sep 30, 2024 |
|||||||||||||||||||||||||||||||||||||
| ANNUALIZED RETURN ON AVERAGE COMMON EQUITY | ||||||||||||||||||||||||||||||||||||||||||||
| Return on average common equity: (A/D) | 11.91 | % | 11.77 | % | 11.75 | % | 10.13 | % | 10.23 | % | 11.81 | % | 10.53 | % | ||||||||||||||||||||||||||||||
| Return on average common equity, as adjusted: (ROE, as adjusted) ((A+C)/D) | 11.54 | 11.39 | 11.41 | 10.05 | 10.12 | 11.45 | 10.55 | |||||||||||||||||||||||||||||||||||||
| Return on average tangible common equity: (ROTCE) (A/(D-E)) |
18.28 | 18.26 | 18.39 | 15.94 | 16.26 | 18.31 | 16.91 | |||||||||||||||||||||||||||||||||||||
| Return on average tangible common equity, as adjusted: (ROTCE, as adjusted) ((A+C)/(D-E)) | 17.70 | 17.68 | 17.87 | 15.82 | 16.09 | 17.75 | 16.94 | |||||||||||||||||||||||||||||||||||||
| Return on average tangible common equity excluding intangible amortization: (B/(D-E)) | 18.51 | 18.50 | 18.64 | 16.18 | 16.51 | 18.55 | 17.18 | |||||||||||||||||||||||||||||||||||||
| Return on average tangible common equity, as adjusted, excluding intangible amortization: ((B+C)/(D-E)) | 17.93 | 17.92 | 18.12 | 16.07 | 16.34 | 17.98 | 17.20 | |||||||||||||||||||||||||||||||||||||
| GAAP net income available to common shareholders (A) | $ | 123,604 | $ | 118,403 | $ | 115,209 | $ | 100,564 | $ | 100,038 | $ | 357,216 | $ | 301,677 | ||||||||||||||||||||||||||||||
| Earnings excluding intangible amortization (B) | 125,133 | 119,933 | 116,756 | 102,127 | 101,610 | 361,823 | 306,459 | |||||||||||||||||||||||||||||||||||||
| Adjustments after-tax (C) | (3,922) | (3,770) | (3,274) | (737) | (1,044) | (10,966) | 428 | |||||||||||||||||||||||||||||||||||||
| Average common equity (D) | 4,115,884 | 4,036,155 | 3,977,671 | 3,950,176 | 3,889,712 | 4,043,743 | 3,826,619 | |||||||||||||||||||||||||||||||||||||
| Average goodwill & core deposits intangible (E) | 1,433,474 | 1,435,480 | 1,437,515 | 1,439,566 | 1,441,654 | 1,435,475 | 1,443,770 | |||||||||||||||||||||||||||||||||||||
EFFICIENCY RATIO & P5NR |
||||||||||||||||||||||||||||||||||||||||||||
| Efficiency ratio: ((D-G)/(B+C+E)) | 40.21 | % | 41.68 | % | 42.22 | % | 42.24 | % | 41.42 | % | 41.35 | % | 42.91 | % | ||||||||||||||||||||||||||||||
| Efficiency ratio, as adjusted: ((D-G-I)/(B+C+E-H)) | 40.95 | 42.01 | 42.84 | 42.00 | 41.66 | 41.91 | 42.87 | |||||||||||||||||||||||||||||||||||||
| Pre-tax net income to total revenue (net) (A/(B+C)) | 57.38 | 56.08 | 56.58 | 50.11 | 50.03 | 56.69 | 51.76 | |||||||||||||||||||||||||||||||||||||
| Pre-tax net income, as adjusted, to total revenue (net) ((A+F)/(B+C)) | 55.53 | 54.39 | 54.91 | 49.74 | 49.49 | 54.95 | 51.49 | |||||||||||||||||||||||||||||||||||||
| Pre-tax, pre-provision, net income (PPNR) (B+C-D) | $ | 162,833 | $ | 154,991 | $ | 147,154 | $ | 146,154 | $ | 147,954 | $ | 464,978 | $ | 424,258 | ||||||||||||||||||||||||||||||
| Pre-tax, pre-provision, net income, as adjusted (B+C-D+F) | 157,704 | 150,404 | 142,821 | 145,209 | 146,562 | 450,929 | 422,176 | |||||||||||||||||||||||||||||||||||||
P5NR ((Pre-tax, pre-provision, profit percentage) PPNR to total revenue (net)) (B+C-D)/(B+C) |
58.64 | % | 57.19 | % | 56.58 | % | 56.57 | % | 57.35 | % | 57.49 | % | 55.90 | % | ||||||||||||||||||||||||||||||
P5NR, as adjusted (B+C-D+F-G)/(B+C) |
56.80 | 55.49 | 54.91 | 56.20 | 56.81 | 55.75 | 55.62 | |||||||||||||||||||||||||||||||||||||
| Pre-tax net income (A) | $ | 159,327 | $ | 151,991 | $ | 147,154 | $ | 129,454 | $ | 129,084 | $ | 458,472 | $ | 392,888 | ||||||||||||||||||||||||||||||
| Net interest income (B) | 226,166 | 219,952 | 214,656 | 217,142 | 215,220 | 660,774 | 631,632 | |||||||||||||||||||||||||||||||||||||
| Non-interest income (C) | 51,505 | 51,079 | 45,426 | 41,222 | 42,779 | 148,010 | 127,352 | |||||||||||||||||||||||||||||||||||||
| Non-interest expense (D) | 114,838 | 116,040 | 112,928 | 112,210 | 110,045 | 343,806 | 334,726 | |||||||||||||||||||||||||||||||||||||
| Fully taxable equivalent adjustment (E) | 2,916 | 2,526 | 2,534 | 2,398 | 2,616 | 7,976 | 6,136 | |||||||||||||||||||||||||||||||||||||
| Total pre-tax adjustments (F) | (5,129) | (4,587) | (4,333) | (945) | (1,392) | (14,049) | (2,082) | |||||||||||||||||||||||||||||||||||||
| Amortization of intangibles (G) | 2,024 | 2,025 | 2,047 | 2,068 | 2,095 | 6,096 | 6,375 | |||||||||||||||||||||||||||||||||||||
| Adjustments: | ||||||||||||||||||||||||||||||||||||||||||||
| Non-interest income: | ||||||||||||||||||||||||||||||||||||||||||||
| Gain on retirement of subordinated debt | $ | 1,882 | $ | — | $ | — | $ | — | $ | — | $ | 1,882 | $ | — | ||||||||||||||||||||||||||||||
| Fair value adjustment for marketable securities | 1,020 | (238) | 442 | 850 | 1,392 | 1,224 | 2,121 | |||||||||||||||||||||||||||||||||||||
| (Loss) gain on OREO | (1) | 13 | (376) | (2,423) | 85 | (364) | 151 | |||||||||||||||||||||||||||||||||||||
| (Loss) gain on branches, equipment and other assets, net | (66) | 972 | (163) | 26 | 32 | 743 | 2,076 | |||||||||||||||||||||||||||||||||||||
| Special income from equity investment | — | 3,498 | 3,891 | — | — | 7,389 | — | |||||||||||||||||||||||||||||||||||||
| Legal expense reimbursement | — | 885 | — | — | — | 885 | — | |||||||||||||||||||||||||||||||||||||
| BOLI death benefits | 187 | 1,243 | — | 95 | — | 1,430 | 162 | |||||||||||||||||||||||||||||||||||||
| Recoveries on historic losses | 2,040 | — | — | — | — | 2,040 | — | |||||||||||||||||||||||||||||||||||||
| Total non-interest income adjustments (H) | $ | 5,062 | $ | 6,373 | $ | 3,794 | $ | (1,452) | $ | 1,509 | $ | 15,229 | $ | 4,510 | ||||||||||||||||||||||||||||||
| Non-interest expense: | ||||||||||||||||||||||||||||||||||||||||||||
| FDIC special assessment | — | (1,516) | — | — | — | (1,516) | 2,260 | |||||||||||||||||||||||||||||||||||||
| Legal claims expense | — | 3,300 | — | — | — | 3,300 | — | |||||||||||||||||||||||||||||||||||||
| Total non-interest expense adjustments (I) | $ | — | $ | 1,784 | $ | — | $ | — | $ | — | $ | 1,784 | $ | 2,260 | ||||||||||||||||||||||||||||||
| Quarter Ended | ||||||||||||||||||||||||||||||||
| Sep 30, 2025 |
Jun 30, 2025 |
Mar 31, 2025 |
Dec 31, 2024 |
Sep 30, 2024 |
||||||||||||||||||||||||||||
| TANGIBLE BOOK VALUE PER COMMON SHARE | ||||||||||||||||||||||||||||||||
| Book value per common share: (A/B) | $ | 21.41 | $ | 20.71 | $ | 20.40 | $ | 19.92 | $ | 19.91 | ||||||||||||||||||||||
| Tangible book value per common share: ((A-C-D)/B) | 14.13 | 13.44 | 13.15 | 12.68 | 12.67 | |||||||||||||||||||||||||||
| Total shareholders' equity (A) | $ | 4,214,964 | $ | 4,085,316 | $ | 4,042,555 | $ | 3,961,025 | $ | 3,959,789 | ||||||||||||||||||||||
| End of period common shares outstanding (B) | 196,889 | 197,239 | 198,206 | 198,882 | 198,879 | |||||||||||||||||||||||||||
| Goodwill (C) | 1,398,253 | 1,398,253 | 1,398,253 | 1,398,253 | 1,398,253 | |||||||||||||||||||||||||||
| Core deposit and other intangibles (D) | 34,231 | 36,255 | 38,280 | 40,327 | 42,395 | |||||||||||||||||||||||||||
| TANGIBLE COMMON EQUITY TO TANGIBLE ASSETS | ||||||||||||||||||||||||||||||||
| Equity to assets: (B/A) | 18.56 | % | 17.83 | % | 17.58 | % | 17.61 | % | 17.35 | % | ||||||||||||||||||||||
| Tangible common equity to tangible assets: ((B-C-D)/(A-C-D)) | 13.08 | 12.35 | 12.09 | 11.98 | 11.78 | |||||||||||||||||||||||||||
| Total assets (A) | $ | 22,707,802 | $ | 22,907,022 | $ | 22,992,203 | $ | 22,490,748 | $ | 22,823,117 | ||||||||||||||||||||||
| Total shareholders' equity (B) | 4,214,964 | 4,085,316 | 4,042,555 | 3,961,025 | 3,959,789 | |||||||||||||||||||||||||||
| Goodwill (C) | 1,398,253 | 1,398,253 | 1,398,253 | 1,398,253 | 1,398,253 | |||||||||||||||||||||||||||
| Core deposit and other intangibles (D) | 34,231 | 36,255 | 38,280 | 40,327 | 42,395 | |||||||||||||||||||||||||||
| Quarter Ended | Nine Months Ended | |||||||||||||||||||||||||||||||||||||||||||
| (Dollars and shares in thousands) | Sep 30, 2025 |
Jun 30, 2025 |
Mar 31, 2025 |
Dec 31, 2024 |
Sep 30, 2024 |
Sep 30, 2025 |
Sep 30, 2024 |
|||||||||||||||||||||||||||||||||||||
| SHAREHOLDER BUYBACK YIELD | ||||||||||||||||||||||||||||||||||||||||||||
| Shareholder buyback yield: (A/B) | 0.18 | % | 0.49 | % | 0.53 | % | 0.05 | % | 0.56 | % | 1.19 | % | 1.64 | % | ||||||||||||||||||||||||||||||
| Shares repurchased | 350 | 1,000 | 1,000 | 96 | 1,000 | 2,350 | 3,426 | |||||||||||||||||||||||||||||||||||||
Average price per share |
$ | 28.34 | $ | 26.99 | $ | 29.67 | $ | 26.38 | $ | 26.90 | $ | 28.33 | $ | 24.36 | ||||||||||||||||||||||||||||||
Principal cost |
9,918 | 26,989 | 29,668 | 2,526 | 26,902 | 66,575 | 83,450 | |||||||||||||||||||||||||||||||||||||
| Excise tax | 93 | 459 | 117 | (72) | 63 | 669 | 484 | |||||||||||||||||||||||||||||||||||||
| Total share repurchase cost (A) | $ | 10,011 | $ | 27,448 | $ | 29,785 | $ | 2,454 | $ | 26,965 | $ | 67,244 | $ | 83,934 | ||||||||||||||||||||||||||||||
| Shares outstanding beginning of period | 197,239 | 198,206 | 198,882 | 198,879 | 199,746 | 198,882 | 201,526 | |||||||||||||||||||||||||||||||||||||
| Price per share beginning of period | $ | 28.46 | $ | 28.27 | $ | 28.30 | $ | 27.09 | $ | 23.96 | $ | 28.30 | $ | 25.33 | ||||||||||||||||||||||||||||||
Market capitalization beginning of period (B) |
$ | 5,613,422 | $ | 5,603,284 | $ | 5,628,361 | $ | 5,387,632 | $ | 4,785,914 | $ | 5,628,361 | $ | 5,104,654 | ||||||||||||||||||||||||||||||


