UNITED STATES
SECURITIES AND EXCHANGE COMMISSION
WASHINGTON, DC 20549
FORM 8-K
CURRENT REPORT PURSUANT TO
SECTION 13 OR 15(d) OF THE
SECURITIES EXCHANGE ACT OF 1934
Date of report (Date of earliest event reported): October 31, 2025 (October 30, 2025)
CUBESMART
CUBESMART, L.P.
(Exact Name of Registrant as Specified in Its Charter)
Maryland (CubeSmart) |
001-32324 |
20-1024732 |
Delaware (CubeSmart, L.P.) |
000-54462 |
34-1837021 |
|
(State or Other Jurisdiction of Incorporation) |
(Commission File Number) |
(IRS Employer Identification No.) |
5 Old Lancaster Road |
Malvern, |
Pennsylvania |
19355 |
(Address of Principal |
Executive Offices) |
(610) 535-5000
(Registrant’s telephone number, including area code)
Not applicable
(Former Name or Former Address, if Changed Since Last Report)
Securities registered pursuant to Section 12(b) of the Act:
Title of Each Class |
|
Trading Symbol(s) |
|
Name of Each Exchange on Which Registered |
Common Shares, $0.01 par value per share, of CubeSmart |
|
CUBE |
|
New York Stock Exchange |
Check the appropriate box below if the Form 8-K filing is intended to simultaneously satisfy the filing obligation of the registrant under any of the following provisions (see General Instruction A.2. below):
☐ |
Written communications pursuant to Rule 425 under the Securities Act (17 CFR 230.425) |
☐ |
Soliciting material pursuant to Rule 14a-12 under the Exchange Act (17 CFR 240.14a-12) |
☐ |
Pre-commencement communications pursuant to Rule 14d-2(b) under the Exchange Act (17 CFR 240.14d-2(b)) |
☐ |
Pre-commencement communications pursuant to Rule 13e-4(c) under the Exchange Act (17 CFR 240.13e-4(c)) |
Indicate by check mark whether the registrant is an emerging growth company as defined in Rule 405 of the Securities Act of 1933 (17 CFR 230.405) or Rule 12b-2 of the Securities Exchange Act of 1934 (17 CFR 240.12b-2).
Emerging Growth Company (CubeSmart) ☐
Emerging Growth Company (CubeSmart, L.P.) ☐
If an emerging growth company, indicate by check mark if the registrant has elected not to use the extended transition period for complying with any new or revised financial accounting standards provided pursuant to Section 13(a) of the Exchange Act.
CubeSmart ☐
CubeSmart, L.P. ☐
Item 2.02 Results of Operations and Financial Condition.
On October 30, 2025, CubeSmart (the “Company”) announced its financial results for the three and nine months ended September 30, 2025. A copy of the Company’s earnings press release is furnished as Exhibit 99.1 to this Current Report on Form 8-K.
Item 7.01 Regulation FD Disclosure.
The information included in this Current Report on Form 8-K (including Exhibit 99.1 hereto) shall not be deemed “filed” for the purposes of Section 18 of the Securities Exchange Act of 1934, as amended (the “Exchange Act”), or otherwise subject to the liabilities of that section, nor shall it be deemed incorporated by reference into any filing made by the Company under the Exchange Act or the Securities Act of 1933, as amended, except as shall be expressly set forth by specific reference in such a filing.
The Company believes that certain statements in the information attached as Exhibit 99.1 may constitute “forward-looking statements” within the meaning of the Private Securities Litigation Reform Act of 1995. These statements are made on the basis of management’s views and assumptions regarding future events and business performance as of the time the statements are made. Actual results may differ materially from those expressed or implied. Information concerning factors that could cause actual results to differ materially from those in forward-looking statements is contained from time to time in the Company’s filings with the Securities and Exchange Commission.
Item 9.01 Financial Statements and Exhibits.
(a) Not applicable.
(b) Not applicable.
(c) Not applicable.
(d) Exhibits. The following exhibits are being furnished herewith to this Current Report on Form 8-K.
Exhibit No. |
|
Description |
99.1 |
|
|
|
|
|
104 |
|
Cover Page Interactive Data File – the cover page interactive data file does not appear in the Interactive Data File because its XBRL tags are embedded within the Inline XBRL document. |
2
SIGNATURES
Pursuant to the requirements of the Securities Exchange Act of 1934, the Registrant has duly caused this report to be signed on its behalf by the undersigned hereunto duly authorized.
|
CUBESMART |
|
|
|
|
|
By: |
/s/ Timothy M. Martin |
|
Name: |
Timothy M. Martin |
|
Title: |
Chief Financial Officer |
Date: October 31, 2025 |
|
|
|
|
|
|
CUBESMART, L.P. |
|
|
|
|
|
By: CUBESMART, its general partner |
|
|
|
|
|
By: |
/s/ Timothy M. Martin |
|
Name: |
Timothy M. Martin |
|
Title: |
Chief Financial Officer |
|
|
|
Date: October 31, 2025 |
|
|
3
EXHIBIT INDEX
Exhibit No. |
|
Description |
99.1 |
|
|
|
|
|
104 |
|
Cover Page Interactive Data File – the cover page interactive data file does not appear in the Interactive Data File because its XBRL tags are embedded within the Inline XBRL document. |
4
|
Exhibit 99.1 |
|
Earnings Release |
CubeSmart Reports Third Quarter 2025 Results
MALVERN, PA -- (Globe Newswire) – October 30, 2025 -- CubeSmart (NYSE: CUBE) today announced its operating results for the three and nine months ended September 30, 2025.
“Overall, third quarter results were in line with our expectations. Our coastal and more urban markets maintained their strong performance while our sunbelt properties continued to experience tradeoffs between rate and occupancy,” commented President and Chief Executive Officer Christopher P. Marr. “We are encouraged as operating trends continue to stabilize and are confident that our systems position us well to maximize long-term revenue within our highest-quality portfolio.”
Key Highlights for the Third Quarter
| ● | Reported diluted earnings per share (“EPS”) attributable to the Company’s common shareholders of $0.36. |
| ● | Reported funds from operations (“FFO”), as adjusted, per diluted share of $0.65. |
| ● | Same-store (606 stores) net operating income (“NOI”) decreased 1.5% year over year, resulting from a 1.0% decrease in revenues and a 0.3% increase in operating expenses. |
| ● | Same-store occupancy averaged 89.9% during the quarter, ending at 89.0%. |
| ● | Opened for operation one development property for a total cost of $18.1 million. |
| ● | Issued $450 million of unsecured senior notes due 2035. |
| ● | Added 46 stores to our third-party management platform, bringing our total third-party managed store count to 863. |
Financial Results
Net income attributable to the Company’s common shareholders was $82.9 million for the third quarter of 2025, compared with $100.8 million for the third quarter of 2024. Diluted EPS attributable to the Company’s common shareholders decreased to $0.36 for the third quarter of 2025, compared with $0.44 for the same period last year.
FFO, as adjusted was $149.0 million for the third quarter of 2025 compared with $153.0 million for the third quarter of 2024. FFO, as adjusted, per diluted share decreased 3.0% to $0.65 for the third quarter of 2025, compared with $0.67 for the same period last year.
Investment Activity
Acquisition Activity
The Company did not acquire any stores during the quarter ended September 30, 2025. In total for the year through September 30, 2025, the Company acquired the remaining 80% interest in HVP IV, which was a 28-store unconsolidated real estate venture in which we previously owned a 20% noncontrolling interest. The purchase price for the 80% ownership interest was $452.8 million, which included $44.4 million to repay the Company’s portion of the venture’s then-existing indebtedness.
Additionally, subsequent to September 30, 2025, the Company entered into contracts to acquire three properties in Arizona (1), Florida (1), and New Jersey (1) for an aggregate purchase price of $65.3 million. These acquisitions are expected to close during the fourth quarter of 2025, subject to customary closing conditions.
THIRD QUARTER 2025 |
|
PAGE 1 |
|
Earnings Release |
Development Activity
The Company has agreements with developers for the construction of self-storage properties in high-barrier-to-entry locations. During the three months ended September 30, 2025, the Company opened for operation one development property located in New York for a total cost of $18.1 million.
As of September 30, 2025, the Company had one joint venture development property under construction. The Company anticipates investing a total of $19.0 million related to this project and had invested $16.4 million of that total as of September 30, 2025. The store is located in New York and is expected to open during the fourth quarter of 2025.
Third-Party Management
As of September 30, 2025, the Company’s third-party management platform included 863 stores totaling 56.6 million rentable square feet. During the three and nine months ended September 30, 2025, the Company added 46 stores and 109 stores, respectively, to its third-party management platform.
Same-Store Results
The Company’s same-store portfolio as of September 30, 2025 included 606 stores containing 43.8 million rentable square feet, or approximately 90.9% of the aggregate rentable square feet of the Company’s 660 consolidated stores. These same-store properties represented approximately 93.7% of the Company’s property NOI for the three months ended September 30, 2025.
Same-store physical occupancy as of September 30, 2025 and 2024 was 89.0% and 90.2%, respectively. Same-store total revenues for the third quarter of 2025 decreased 1.0% and same-store operating expenses increased 0.3% compared to the same quarter in 2024. Same-store NOI decreased 1.5% from the third quarter of 2024 to the third quarter of 2025.
Operating Results
As of September 30, 2025, the Company’s total consolidated portfolio included 660 stores containing 48.2 million rentable square feet and had physical occupancy of 88.6%.
Total revenues increased $14.2 million and property operating expenses increased $9.0 million for the third quarter of 2025, as compared to the same period in 2024. Increases in revenues and expenses were primarily attributable to revenues and expenses generated from property acquisitions and recently opened development properties.
Interest expense increased from $22.8 million during the three months ended September 30, 2024 to $29.4 million during the three months ended September 30, 2025, an increase of $6.6 million. The increase was attributable to an increase in the average outstanding debt balance and higher interest rates during the 2025 period compared to the 2024 period. The average outstanding debt balance increased from $2.94 billion during the three months ended September 30, 2024 to $3.44 billion during the three months ended September 30, 2025. The weighted average effective interest rate on our outstanding debt increased from 2.99% during the three months ended September 30, 2024 to 3.32% for the three months ended September 30, 2025.
THIRD QUARTER 2025 |
|
PAGE 2 |
|
Earnings Release |
Financing Activity
On August 20, 2025, the Company’s operating partnership (the “Operating Partnership”) issued $450 million in aggregate principal amount of unsecured senior notes due November 1, 2035, which bear interest at a rate of 5.125% per annum (the “2035 Notes”). The 2035 Notes were priced at 98.656% of the principal amount with a yield to maturity of 5.295%. Net proceeds from the offering were used to repay outstanding indebtedness on the Operating Partnership’s unsecured revolving credit facility and for working capital and other general corporate purposes.
During the three months ended September 30, 2025, the Company did not sell any common shares of beneficial interest through its at-the-market ("ATM") equity program. As of September 30, 2025, the Company had 13.5 million shares available for issuance under the existing equity distribution agreements.
Quarterly Dividend
On July 29, 2025, the Company declared a quarterly dividend of $0.52 per common share. The dividend was paid on October 15, 2025 to common shareholders of record on October 1, 2025.
2025 Financial Outlook
“In August, we raised $450 million through a successful bond offering, our first in almost four years, showcasing our access to attractively-priced capital,” commented Chief Financial Officer Tim Martin. “Continued stabilizing trends through the third quarter positioned us to further increase the midpoints of our full year FFO per share and same-store guidance ranges.”
The Company estimates that its fully diluted earnings per share for 2025 will be between $1.46 and $1.50, and that its fully diluted FFO per share, as adjusted, for 2025 will be between $2.56 and $2.60. Due to uncertainty related to the timing and terms of transactions, the impact of any potential future speculative investment activity is excluded from guidance. For 2025, the same-store pool consists of 606 properties totaling 43.8 million rentable square feet.
THIRD QUARTER 2025 |
|
PAGE 3 |
|
Earnings Release |
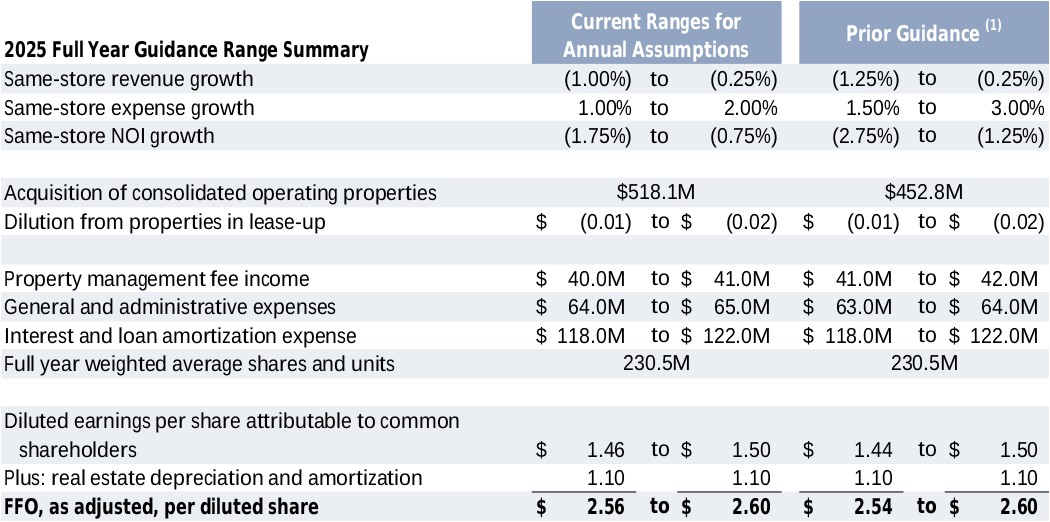
| (1) | Prior guidance as indicated in our second quarter earnings release dated July 31, 2025. |
Conference Call
Management will host a conference call at 11:00 a.m. ET on Friday, October 31, 2025 to discuss financial results for the three months ended September 30, 2025.
A live webcast of the conference call will be available online from the investor relations page of the Company’s corporate website at investors.cubesmart.com. Telephone participants may join on the day of the call by dialing 1 (800) 715-9871 using conference ID number 4783436.
After the live webcast, the webcast will be available on CubeSmart’s website. In addition, a telephonic replay of the call will be available through November 7, 2025 by dialing 1 (800) 770-2030 using conference ID number 4783436.
Supplemental operating and financial data as of September 30, 2025 is available in the investor relations section of the Company’s corporate website.
About CubeSmart
CubeSmart is a self-administered and self-managed real estate investment trust. The Company's self-storage properties are designed to offer affordable, easily accessible and, in most locations, climate-controlled storage space for residential and commercial customers. According to the 2025 Self-Storage Almanac, CubeSmart is one of the top three owners and operators of self-storage properties in the United States.
THIRD QUARTER 2025 |
|
PAGE 4 |
|
Earnings Release |
Non-GAAP Financial Measures
Funds from operations (“FFO”) is a widely used performance measure for real estate companies and is provided here as a supplemental measure of operating performance. The April 2002 National Policy Bulletin of the National Association of Real Estate Investment Trusts (the “White Paper”), as amended, defines FFO as net income (computed in accordance with GAAP), excluding gains (or losses) from sales of real estate and related impairment charges, plus real estate depreciation and amortization, and after adjustments for unconsolidated partnerships and joint ventures.
Management uses FFO as a key performance indicator in evaluating the operations of the Company's stores. Given the nature of its business as a real estate owner and operator, the Company considers FFO a key measure of its operating performance that is not specifically defined by accounting principles generally accepted in the United States. The Company believes that FFO is useful to management and investors as a starting point in measuring its operational performance because FFO excludes various items included in net income that do not relate to or are not indicative of its operating performance such as gains (or losses) from sales of real estate, gains from remeasurement of investments in real estate ventures, impairments of depreciable assets, and depreciation, which can make periodic and peer analyses of operating performance more difficult. The Company’s computation of FFO may not be comparable to FFO reported by other REITs or real estate companies.
FFO should not be considered as an alternative to net income (determined in accordance with GAAP) as an indication of the Company’s performance. FFO does not represent cash generated from operating activities determined in accordance with GAAP and is not a measure of liquidity or an indicator of the Company’s ability to make cash distributions. The Company believes that to further understand its performance, FFO should be compared with its reported net income and considered in addition to cash flows computed in accordance with GAAP, as presented in its consolidated financial statements.
FFO, as adjusted represents FFO as defined above, excluding the effects of acquisition related costs, gains or losses from early extinguishment of debt, and other non-recurring items, which the Company believes are not indicative of the Company’s operating results.
The Company defines net operating income, which it refers to as “NOI,” as total continuing revenues less continuing property operating expenses. NOI also can be calculated by adding back to net income (loss): interest expense on loans, loan procurement amortization expense, loss on early extinguishment of debt, acquisition related costs, equity in losses of real estate ventures, other expense, depreciation and amortization expense, general and administrative expense, and deducting from net income (loss): equity in earnings of real estate ventures, gains from sales of real estate, net, other income, gains from remeasurement of investments in real estate ventures and interest income. NOI is a measure of performance that is not calculated in accordance with GAAP.
Management uses NOI as a measure of operating performance at each of its stores, and for all of its stores in the aggregate. NOI should not be considered as a substitute for net income, cash flows provided by operating, investing and financing activities, or other income statement or cash flow statement data prepared in accordance with GAAP.
The Company believes NOI is useful to investors in evaluating operating performance because it is one of the primary measures used by management and store managers to evaluate the economic productivity of the Company’s stores, including the ability to lease stores, increase pricing and occupancy, and control property operating expenses. Additionally, NOI helps the Company’s investors meaningfully compare the results of its operating performance from period to period by removing the impact of its capital structure (primarily interest expense on outstanding indebtedness) and depreciation of the basis in its assets from operating results.
THIRD QUARTER 2025 |
|
PAGE 5 |
|
Earnings Release |
Forward-Looking Statements
This presentation, together with other statements and information publicly disseminated by CubeSmart (“we,” “us,” “our” or the “Company”), contain certain forward-looking statements within the meaning of Section 27A of the Securities Act of 1933, as amended, and Section 21E of the Securities Exchange Act of 1934, as amended, or the “Exchange Act.” Forward-looking statements include statements concerning the Company’s plans, objectives, goals, strategies, future events, future revenues or performance, capital expenditures, financing needs, plans or intentions relating to acquisitions and other information that is not historical information. In some cases, forward-looking statements can be identified by terminology such as “believes,” “expects,” “estimates,” “may,” “will,” “should,” “anticipates,” or “intends” or the negative of such terms or other comparable terminology, or by discussions of strategy. Such statements are based on assumptions and expectations that may not be realized and are inherently subject to risks, uncertainties and other factors, many of which cannot be predicted with accuracy and some of which might not even be anticipated. Although we believe the expectations reflected in these forward-looking statements are based on reasonable assumptions, future events and actual results, performance, transactions or achievements, financial and otherwise, may differ materially from the results, performance, transactions or achievements expressed or implied by the forward-looking statements. As a result, you should not rely on or construe any forward-looking statements in this presentation, or which management or persons acting on their behalf may make orally or in writing from time to time, as predictions of future events or as guarantees of future performance. We caution you not to place undue reliance on forward-looking statements, which speak only as of the date of this presentation or as of the dates otherwise indicated in such forward-looking statements. All of our forward-looking statements, including those in this presentation, are qualified in their entirety by this statement.
There are a number of risks and uncertainties that could cause our actual results to differ materially from the forward-looking statements contained in or contemplated by this presentation. Any forward-looking statements should be considered in light of the risks and uncertainties referred to in Item 1A. “Risk Factors” in our Annual Report on Form 10-K and in our other filings with the Securities and Exchange Commission (“SEC”).
These risks include, but are not limited to, the following:
| ● | adverse changes in economic conditions in the real estate industry and in the markets in which we own and operate self-storage properties; |
| ● | the effect of competition from existing and new self-storage properties and operators on our ability to maintain or raise occupancy and rental rates; |
| ● | the failure to execute our business plan; |
| ● | adverse consumer impacts and declines in general economic conditions from inflation, tariffs, rising interest rates and wage stagnation including the impact on the demand for self-storage, rental rates and fees and rent collection levels; |
| ● | reduced availability and increased costs of external sources of capital; |
| ● | financing risks, including rising interest rates, the risk of over-leverage and the corresponding risk of default on our mortgage and other debt and potential inability to refinance existing or future debt; |
| ● | counterparty non-performance related to the use of derivative financial instruments; |
| ● | risks related to our ability to maintain our qualification as a real estate investment trust (“REIT”) for federal income tax purposes; |
| ● | the failure of acquisitions and developments to close on expected terms, or at all, or to perform as expected; |
THIRD QUARTER 2025 |
|
PAGE 6 |
|
Earnings Release |
| ● | increases in taxes, fees and assessments from state and local jurisdictions; |
| ● | the failure of our joint venture partners to fulfill their obligations to us or their pursuit of actions that are inconsistent with our objectives; |
| ● | reductions in asset valuations and related impairment charges; |
| ● | negative publicity relating to our business or industry, which could adversely affect our reputation; |
| ● | increases in operating costs, including, without limitation, insurance, utility and other general expenses, which could adversely affect our financial results; |
| ● | cybersecurity breaches, cyber or ransomware attacks or a failure of our networks, systems or technology, which could adversely impact our business, customer and employee relationships or result in fraudulent payments; |
| ● | risks associated with generative artificial intelligence tools and large language models and the conclusions that these tools and models may draw about our business and prospects in connection with the dissemination of negative opinions, characterizations or disinformation; |
| ● | changes in real estate, zoning, use and occupancy laws or regulations; |
| ● | risks related to or consequences of earthquakes, hurricanes, windstorms, floods, wildfires, other natural disasters or acts of violence, pandemics, active shooters, terrorism, insurrection or war that impact the markets in which we operate; |
| ● | potential environmental and other material liabilities; |
| ● | governmental, administrative and executive orders, regulations and laws, which could adversely impact our business operations and customer and employee relationships; |
| ● | uninsured or uninsurable losses and the ability to obtain insurance coverage, indemnity or recovery from insurance against risks and losses; |
| ● | changes in the availability of and the cost of labor; |
| ● | other factors affecting the real estate industry generally or the self-storage industry in particular; and |
| ● | other risks identified in Item 1A of our Annual Report on Form 10-K and, from time to time, in other reports that we file with the SEC or in other documents that we publicly disseminate. |
Given these uncertainties, we caution readers not to place undue reliance on forward-looking statements. We undertake no obligation to publicly update or revise these forward-looking statements, whether as a result of new information, future events or otherwise except as may be required in securities laws.
Contact:
CubeSmart
Josh Schutzer
Vice President, Finance
(610) 535-5700
THIRD QUARTER 2025 |
|
PAGE 7 |
CUBESMART AND SUBSIDIARIES
CONSOLIDATED BALANCE SHEETS
(in thousands, except share data)
|
|
September 30, |
|
December 31, |
||
|
|
2025 |
|
2024 |
||
|
|
(unaudited) |
|
|
|
|
|
|
|
|
|
|
|
ASSETS |
|
|
|
|
|
|
Storage properties |
|
$ |
8,108,076 |
|
$ |
7,628,774 |
Less: Accumulated depreciation |
|
|
(1,730,103) |
|
|
(1,590,588) |
Storage properties, net (includes VIE amounts of $375,821 and $363,315, respectively) |
|
|
6,377,973 |
|
|
6,038,186 |
Cash and cash equivalents (includes VIE amounts of $4,783 and $2,907, respectively) |
|
|
108,393 |
|
|
71,560 |
Restricted cash (includes VIE amounts of $4,313 and $4,439, respectively) |
|
|
6,364 |
|
|
6,103 |
Loan procurement costs, net of amortization |
|
|
1,781 |
|
|
2,731 |
Investment in real estate ventures, at equity |
|
|
74,320 |
|
|
91,973 |
Other assets, net |
|
|
188,827 |
|
|
183,628 |
Total assets |
|
$ |
6,757,658 |
|
$ |
6,394,181 |
|
|
|
|
|
|
|
LIABILITIES AND EQUITY |
|
|
|
|
|
|
Unsecured senior notes, net |
|
$ |
3,223,866 |
|
$ |
2,780,631 |
Revolving credit facility |
|
|
— |
|
|
— |
Mortgage loans and notes payable, net (includes VIE amounts of $112,306 and $111,728, respectively) |
|
|
204,681 |
|
|
205,915 |
Lease liabilities - finance leases |
|
|
65,612 |
|
|
65,668 |
Accounts payable, accrued expenses and other liabilities |
|
|
246,162 |
|
|
229,581 |
Distributions payable |
|
|
119,676 |
|
|
119,600 |
Deferred revenue |
|
|
42,723 |
|
|
38,918 |
Total liabilities |
|
|
3,902,720 |
|
|
3,440,313 |
|
|
|
|
|
|
|
Noncontrolling interests in the Operating Partnership |
|
|
44,858 |
|
|
51,193 |
|
|
|
|
|
|
|
Commitments and contingencies |
|
|
|
|
|
|
|
|
|
|
|
|
|
Equity |
|
|
|
|
|
|
Common shares $.01 par value, 400,000,000 shares authorized, 228,035,275 and 227,764,975 shares issued and outstanding at September 30, 2025 and December 31, 2024, respectively |
|
|
2,280 |
|
|
2,278 |
Additional paid-in capital |
|
|
4,295,941 |
|
|
4,285,570 |
Accumulated other comprehensive loss |
|
|
(270) |
|
|
(330) |
Accumulated deficit |
|
|
(1,515,815) |
|
|
(1,415,662) |
Total CubeSmart shareholders’ equity |
|
|
2,782,136 |
|
|
2,871,856 |
Noncontrolling interests in subsidiaries |
|
|
27,944 |
|
|
30,819 |
Total equity |
|
|
2,810,080 |
|
|
2,902,675 |
Total liabilities and equity |
|
$ |
6,757,658 |
|
$ |
6,394,181 |
THIRD QUARTER 2025 |
|
PAGE 8 |
CUBESMART AND SUBSIDIARIES
CONSOLIDATED STATEMENTS OF OPERATIONS
(in thousands, except per share data)
(unaudited)
|
|
Three Months Ended |
|
Nine Months Ended |
||||||||
|
|
September 30, |
|
September 30, |
||||||||
|
|
2025 |
|
2024 |
|
2025 |
|
2024 |
||||
|
|
|
|
|
|
|
|
|
|
|
|
|
REVENUES |
|
|
|
|
|
|
|
|
|
|
|
|
Rental income |
|
$ |
243,400 |
|
$ |
230,954 |
|
$ |
715,722 |
|
$ |
682,935 |
Other property related income |
|
|
31,730 |
|
|
29,268 |
|
|
94,092 |
|
|
84,542 |
Property management fee income |
|
|
9,950 |
|
|
10,668 |
|
|
30,605 |
|
|
31,028 |
Total revenues |
|
|
285,080 |
|
|
270,890 |
|
|
840,419 |
|
|
798,505 |
OPERATING EXPENSES |
|
|
|
|
|
|
|
|
|
|
|
|
Property operating expenses |
|
|
90,848 |
|
|
81,868 |
|
|
262,810 |
|
|
242,002 |
Depreciation and amortization |
|
|
66,688 |
|
|
51,210 |
|
|
192,332 |
|
|
152,962 |
General and administrative |
|
|
16,506 |
|
|
14,265 |
|
|
47,471 |
|
|
44,512 |
Total operating expenses |
|
|
174,042 |
|
|
147,343 |
|
|
502,613 |
|
|
439,476 |
OTHER (EXPENSE) INCOME |
|
|
|
|
|
|
|
|
|
|
|
|
Interest: |
|
|
|
|
|
|
|
|
|
|
|
|
Interest expense on loans |
|
|
(29,380) |
|
|
(22,750) |
|
|
(84,570) |
|
|
(68,436) |
Loan procurement amortization expense |
|
|
(1,258) |
|
|
(986) |
|
|
(3,700) |
|
|
(3,031) |
Equity in earnings of real estate ventures |
|
|
648 |
|
|
418 |
|
|
1,574 |
|
|
1,688 |
Other |
|
|
1,368 |
|
|
721 |
|
|
2,483 |
|
|
744 |
Total other expense |
|
|
(28,622) |
|
|
(22,597) |
|
|
(84,213) |
|
|
(69,035) |
NET INCOME |
|
|
82,416 |
|
|
100,950 |
|
|
253,593 |
|
|
289,994 |
Net income attributable to noncontrolling interests in the Operating Partnership |
|
|
(396) |
|
|
(551) |
|
|
(1,250) |
|
|
(1,616) |
Net loss attributable to noncontrolling interests in subsidiaries |
|
|
910 |
|
|
398 |
|
|
2,744 |
|
|
910 |
NET INCOME ATTRIBUTABLE TO THE COMPANY |
|
$ |
82,930 |
|
$ |
100,797 |
|
$ |
255,087 |
|
$ |
289,288 |
|
|
|
|
|
|
|
|
|
|
|
|
|
Basic earnings per share attributable to common shareholders |
|
$ |
0.36 |
|
$ |
0.45 |
|
$ |
1.12 |
|
$ |
1.28 |
Diluted earnings per share attributable to common shareholders |
|
$ |
0.36 |
|
$ |
0.44 |
|
$ |
1.11 |
|
$ |
1.28 |
|
|
|
|
|
|
|
|
|
|
|
|
|
Weighted average basic shares outstanding |
|
|
228,791 |
|
|
226,166 |
|
|
228,731 |
|
|
225,941 |
Weighted average diluted shares outstanding |
|
|
229,295 |
|
|
227,149 |
|
|
229,237 |
|
|
226,805 |
|
|
|
|
|
|
|
|
|
|
|
|
|
THIRD QUARTER 2025 |
|
PAGE 9 |
Same-Store Results (606 stores)
(in thousands, except percentages and per square foot data)
(unaudited)
|
|
Three Months Ended |
|
|
|
|
Nine Months Ended |
|
|
|
||||||||
|
|
September 30, |
|
Percent |
|
September 30, |
|
Percent |
||||||||||
|
|
2025 |
|
2024 |
|
Change |
|
2025 |
|
2024 |
|
Change |
||||||
|
|
|
|
|
|
|
|
|
|
|
|
|
|
|
|
|
|
|
REVENUES |
|
|
|
|
|
|
|
|
|
|
|
|
|
|
|
|
|
|
Rental income |
|
$ |
226,181 |
|
$ |
228,332 |
|
(0.9) |
% |
|
$ |
669,738 |
|
$ |
675,236 |
|
(0.8) |
% |
Other property related income |
|
|
11,066 |
|
|
11,212 |
|
(1.3) |
% |
|
|
33,607 |
|
|
32,353 |
|
3.9 |
% |
Total revenues |
|
|
237,247 |
|
|
239,544 |
|
(1.0) |
% |
|
|
703,345 |
|
|
707,589 |
|
(0.6) |
% |
|
|
|
|
|
|
|
|
|
|
|
|
|
|
|
|
|
|
|
OPERATING EXPENSES |
|
|
|
|
|
|
|
|
|
|
|
|
|
|
|
|
|
|
Property taxes (1) |
|
|
26,754 |
|
|
26,018 |
|
2.8 |
% |
|
|
81,334 |
|
|
79,333 |
|
2.5 |
% |
Personnel expense |
|
|
14,326 |
|
|
14,094 |
|
1.6 |
% |
|
|
41,784 |
|
|
42,187 |
|
(1.0) |
% |
Advertising |
|
|
7,980 |
|
|
8,222 |
|
(2.9) |
% |
|
|
18,806 |
|
|
18,069 |
|
4.1 |
% |
Repair and maintenance |
|
|
3,364 |
|
|
2,803 |
|
20.0 |
% |
|
|
8,962 |
|
|
8,541 |
|
4.9 |
% |
Utilities |
|
|
5,870 |
|
|
6,577 |
|
(10.7) |
% |
|
|
16,967 |
|
|
17,878 |
|
(5.1) |
% |
Property insurance |
|
|
2,613 |
|
|
3,389 |
|
(22.9) |
% |
|
|
9,026 |
|
|
9,861 |
|
(8.5) |
% |
Other expenses |
|
|
9,886 |
|
|
9,475 |
|
4.3 |
% |
|
|
29,318 |
|
|
28,898 |
|
1.5 |
% |
|
|
|
|
|
|
|
|
|
|
|
|
|
|
|
|
|
|
|
Total operating expenses |
|
|
70,793 |
|
|
70,578 |
|
0.3 |
% |
|
|
206,197 |
|
|
204,767 |
|
0.7 |
% |
|
|
|
|
|
|
|
|
|
|
|
|
|
|
|
|
|
|
|
Net operating income (2) |
|
$ |
166,454 |
|
$ |
168,966 |
|
(1.5) |
% |
|
$ |
497,148 |
|
$ |
502,822 |
|
(1.1) |
% |
|
|
|
|
|
|
|
|
|
|
|
|
|
|
|
|
|
|
|
Gross margin |
|
|
70.2 |
% |
|
70.5 |
% |
|
|
|
|
70.7 |
% |
|
71.1 |
% |
|
|
|
|
|
|
|
|
|
|
|
|
|
|
|
|
|
|
|
|
|
Period end occupancy |
|
|
89.0 |
% |
|
90.2 |
% |
|
|
|
|
89.0 |
% |
|
90.2 |
% |
|
|
|
|
|
|
|
|
|
|
|
|
|
|
|
|
|
|
|
|
|
Period average occupancy |
|
|
89.9 |
% |
|
90.7 |
% |
|
|
|
|
90.0 |
% |
|
90.7 |
% |
|
|
|
|
|
|
|
|
|
|
|
|
|
|
|
|
|
|
|
|
|
Total rentable square feet |
|
|
43,777 |
|
|
|
|
|
|
|
|
43,777 |
|
|
|
|
|
|
|
|
|
|
|
|
|
|
|
|
|
|
|
|
|
|
|
|
|
Realized annual rent per occupied square foot (3) |
|
$ |
22.99 |
|
$ |
23.00 |
|
0.0 |
% |
|
$ |
22.66 |
|
$ |
22.67 |
|
0.0 |
% |
|
|
|
|
|
|
|
|
|
|
|
|
|
|
|
|
|
|
|
Reconciliation of Same-Store Net Operating Income to Net Income |
|
|
|
|
|
|
|
|
|
|
|
|
|
|
|
|
|
|
|
|
|
|
|
|
|
|
|
|
|
|
|
|
|
|
|
|
|
Same-store net operating income (2) |
|
$ |
166,454 |
|
$ |
168,966 |
|
|
|
|
$ |
497,148 |
|
$ |
502,822 |
|
|
|
Non same-store net operating income (2) |
|
|
11,136 |
|
|
2,129 |
|
|
|
|
|
29,807 |
|
|
5,872 |
|
|
|
Indirect property overhead (4) |
|
|
16,642 |
|
|
17,927 |
|
|
|
|
|
50,654 |
|
|
47,809 |
|
|
|
Depreciation and amortization |
|
|
(66,688) |
|
|
(51,210) |
|
|
|
|
|
(192,332) |
|
|
(152,962) |
|
|
|
General and administrative expense |
|
|
(16,506) |
|
|
(14,265) |
|
|
|
|
|
(47,471) |
|
|
(44,512) |
|
|
|
Interest expense on loans |
|
|
(29,380) |
|
|
(22,750) |
|
|
|
|
|
(84,570) |
|
|
(68,436) |
|
|
|
Loan procurement amortization expense |
|
|
(1,258) |
|
|
(986) |
|
|
|
|
|
(3,700) |
|
|
(3,031) |
|
|
|
Equity in earnings of real estate ventures |
|
|
648 |
|
|
418 |
|
|
|
|
|
1,574 |
|
|
1,688 |
|
|
|
Other |
|
|
1,368 |
|
|
721 |
|
|
|
|
|
2,483 |
|
|
744 |
|
|
|
|
|
|
|
|
|
|
|
|
|
|
|
|
|
|
|
|
|
|
Net income |
|
$ |
82,416 |
|
$ |
100,950 |
|
|
|
|
$ |
253,593 |
|
$ |
289,994 |
|
|
|
|
|
|
|
|
|
|
|
|
|
|
|
|
|
|
|
|
|
|
| (1) | For comparability purposes, current year amounts related to the expiration of certain real estate tax abatements have been excluded from the same-store portfolio results ($131k and $515k for the three and nine months ended September 30, 2025, respectively). |
| (2) | Net operating income (“NOI”) is a non-GAAP (“generally accepted accounting principles”) financial measure. The above table reconciles same-store NOI to GAAP Net income. |
| (3) | Realized annual rent per occupied square foot is calculated by dividing annualized rental income by the weighted average occupied square feet for the period. |
| (4) | Includes property management fee income earned in conjunction with managed properties. |
THIRD QUARTER 2025 |
|
PAGE 10 |
Non-GAAP Measure – Computation of Funds From Operations
(in thousands, except percentages and per share and unit data)
(unaudited)
|
|
Three Months Ended |
|
Nine Months Ended |
|
||||||||
|
|
September 30, |
|
September 30, |
|
||||||||
|
|
2025 |
|
|
2024 |
|
2025 |
|
2024 |
|
|||
|
|
|
|
|
|
|
|
|
|
|
|
|
|
Net income attributable to the Company's common shareholders |
|
$ |
82,930 |
|
$ |
100,797 |
|
$ |
255,087 |
|
$ |
289,288 |
|
|
|
|
|
|
|
|
|
|
|
|
|
|
|
Add: |
|
|
|
|
|
|
|
|
|
|
|
|
|
Real estate depreciation and amortization: |
|
|
|
|
|
|
|
|
|
|
|
|
|
Real property |
|
|
64,207 |
|
|
49,639 |
|
|
185,014 |
|
|
148,324 |
|
Company's share of unconsolidated real estate ventures |
|
|
1,438 |
|
|
2,025 |
|
|
4,681 |
|
|
6,163 |
|
Net income attributable to noncontrolling interests in the Operating Partnership |
|
|
396 |
|
|
551 |
|
|
1,250 |
|
|
1,616 |
|
|
|
|
|
|
|
|
|
|
|
|
|
|
|
FFO attributable to the Company's common shareholders and third-party OP unitholders |
|
$ |
148,971 |
|
$ |
153,012 |
|
$ |
446,032 |
|
$ |
445,391 |
|
|
|
|
|
|
|
|
|
|
|
|
|
|
|
Earnings per share attributable to common shareholders - basic |
|
$ |
0.36 |
|
$ |
0.45 |
|
$ |
1.12 |
|
$ |
1.28 |
|
Earnings per share attributable to common shareholders - diluted |
|
$ |
0.36 |
|
$ |
0.44 |
|
$ |
1.11 |
|
$ |
1.28 |
|
FFO per diluted share and unit |
|
$ |
0.65 |
|
$ |
0.67 |
|
$ |
1.94 |
|
$ |
1.95 |
|
|
|
|
|
|
|
|
|
|
|
|
|
|
|
Weighted average basic shares outstanding |
|
|
228,791 |
|
|
226,166 |
|
|
228,731 |
|
|
225,941 |
|
Weighted average diluted shares outstanding |
|
|
229,295 |
|
|
227,149 |
|
|
229,237 |
|
|
226,805 |
|
Weighted average diluted shares and units outstanding |
|
|
230,398 |
|
|
228,386 |
|
|
230,366 |
|
|
228,067 |
|
|
|
|
|
|
|
|
|
|
|
|
|
|
|
Dividends per common share and unit |
|
$ |
0.52 |
|
$ |
0.51 |
|
$ |
1.56 |
|
$ |
1.53 |
|
Payout ratio of FFO |
|
|
80.0 |
% |
|
76.1 |
% |
|
80.4 |
% |
|
78.5 |
% |
THIRD QUARTER 2025 |
|
PAGE 11 |