SECURITIES AND EXCHANGE COMMISSION
Washington, D.C. 20549
FORM 6-K
Report of Foreign Private Issuer
Pursuant to Rule 13a-16 or 15d-16 of the
Securities Exchange Act of 1934
For the month of November, 2025
Commission File Number 1-34129
CENTRAIS ELÉTRICAS BRASILEIRAS S.A. - ELETROBRÁS
(Exact name of registrant as specified in its charter)
BRAZILIAN ELECTRIC POWER COMPANY
(Translation of Registrant's name into English)
Rua da Quitanda, 196 – 24th floor,
Centro, CEP 20091-005,
Rio de Janeiro, RJ, Brazil
(Address of principal executive office)
Indicate by check mark whether the registrant files or will file annual reports under cover Form 20-F or Form 40-F.
Form 20-F ___X___ Form 40-F _______
Indicate by check mark whether the registrant by furnishing the information contained in this Form is also thereby furnishing the information to the Commission pursuant to Rule 12g3-2(b) under the Securities Exchange Act of 1934.
Yes _______ No___X____

| TABLE OF CONTENTS | |
| 1. CONSOLIDATED RESULT | IFRS AND REGULATORY | 7 |
| 2. ADJUSTED CONSOLIDATED RESULT | IFRS AND REGULATORY | 9 |
| 3. ENERGY TRADING | 13 |
| 4. INVESTMENTS AND EXPANSION PROJECTS | 14 |
| 5. INDEBTEDNESS | 16 |
| 6. COMPULSORY LOAN | 17 |
| 7. CASH FLOW | 18 |
| 8. FINANCIAL PERFORMANCE | 19 |
| 8.1. Operational and Financial Results | 19 |
| 8.2. Generation Segment | 21 |
| 8.3. Transmission Segment | 24 |
| 8.4. Operating Costs and Expenses - IFRS | 25 |
| 8.5. Equity Holdings - IFRS | 29 |
| 8.6. Financial Result - IFRS | 30 |
| 8.7. Current and Deferred Taxes - IFRS | 31 |
| 9. OPERATIONAL PERFORMANCE | 32 |
| 9.1. Generation Segment | 32 |
| 9.2. Transmission Segment | 34 |
| 9.3. ESG | 35 |
| 10. APPENDIX | 36 |
| 10.1. Appendix 1 - Generation and Transmission Revenue IFRS | 36 |
| 10.2. Appendix 2 - PMSO Breakdown | 37 |
| 10.3. Appendix 3 - Financing and Loans Granted (Receivables) | 38 |
| 10.4. Appendix 4 - Accounting Statements | 39 |
| 10.5. Appendix 5 - IFRS vs. Regulatory Reconciliation | 43 |
|
|
AXIA ENERGIA RELEASES 3rd QUARTER 2025 RESULTS
Highlights:
Shareholder remuneration: R$ 4.3 billion in dividends, totaling R$ 8.3 billion distributed in fiscal year 2025, reaching approximately R$ 4.01 per Class A and Class B preferred share, and R$ 3.65 per common share and golden share.
In September and October, Management delivered significant and consistent results, notably with the signing of the sale of Eletronuclear, the divestment of the stake in EMAE, and the acquisition of Tijoá Energia, accelerating the Company’s streamlining process and reducing its risk profile. These developments, together with the strong results achieved in 3Q25, resilient 2026 prices, advances in energy trading, and improvements to our long-term energy model, generated allocable capital under our capital allocation methodology. This, in turn, enabled both the dividend proposal and participation in the transmission auction No. 4/2025. The capital allocation methodology underscores our commitment to financial discipline, shareholder value creation, and sustained investment capacity.
Transmission auction No. 4/2025: winning bid of lots 6A, 6B, 7A and 7B, with RAP of R$ 138.74 million and CAPEX projected by ANEEL of R$ 1.63 billion, attesting to AXIA Energia's competitiveness and efficiency.
Adjusted Regulatory Net Revenue: R$ 9,969 million in 3Q25, down 4.6% YoY, with higher transmission revenues partially offsetting the lower generation revenue related to the sale of the Amazonas thermal power plants and the additional sale of energy from the Tucuruí HPP, which occurred only in 3Q24.
Contribution margin from generation, ACL + MCP: The contribution margin from energy traded in the Free Contracting Environment (ACL) and settled in the Short Term Market (MCP) increased to R$ 86/MWh in 3Q25 from R$ 48/MWh in 3Q24, considering the resources available for allocation in both segments.
Energy trading: 813 clients served in 3Q25, up 16% YoY, with 723 in the ACL compared to 614 in 3Q24.
Adjusted Regulatory EBITDA excluding the variation in results from the Amazonas thermal plants sold in 2025: EBITDA reached R$ 6,419 million in 3Q25, up 3.4% YoY, driven by the 9.8% increase in transmission revenues along with the 10.1% drop in PMSO expenses, reflecting the Company's focus on continuously enhancing operational efficiency. These advances more than offset the 2.1% decrease in generation revenue and the 21.9% reduction in equity income, ensuring resilient EBITDA growth.
Adjusted IFRS Net Income: Totaled R$ 2,176 million, down 68.0% YoY, due to the recognition of a R$ 303 million regulatory remeasurement in 3Q25, compared to R$ 6,130 million in 3Q24, when the impact of the 2023 Periodic Tariff Review was recognized, with no equivalent effect in 2025.
Investments: R$ 2,701 million in 3Q25, up by 32% and 57% compared to 2Q25 and 3Q24, respectively. It is worth noting the 28% YoY increase in investments in reinforcements and improvements in the transmission segment, which reached R$ 1,061 million in 3Q25.
Still within the transmission segment, 230 large-scale projects are under implementation, representing an additional RAP of R$ 1.7 billion between 2025 and 2030 and a total estimated CAPEX of R$ 12.5 billion.
100% Renewable Portfolio: In October, we completed the sale of our last thermal power asset, the Santa Cruz TPP. With this transaction, AXIA Energia now holds a 100% renewable portfolio, in line with its Net Zero 2030 commitment.
Portfolio Management Oct/25: Agreement for the sale of stake in Eletronuclear to J&F for R$ 535 million, providing for the release of guarantees granted by AXIA Energia and the transfer of the “ADI debentures.” The buyer will assume full responsibility for the payment of these debentures, totaling R$ 2.4 billion, as established in the Settlement Agreement with the Federal Government.
Execution of the contract for the sale of AXIA Energia’s stake in Empresa Metropolitana de Águas e Energia S.A. (EMAE) to Companhia de Saneamento Básico do Estado de São Paulo (SABESP) for R$ 476.5 million, including the possibility of future earn-out payments.
Acquisition of the remaining 50.1% stake in Tijoá Energia, in October 2025, for R$ 247 million. The plant has an installed capacity of 808 MW and, in 2024, achieved annual revenue of R$ 320 million and EBITDA of R$ 136 million.
|
|
Financial management: net debt totaled R$ 42,577 million in 3Q25, up by R$ 2,451 million and R$ 3,680 million compared to 2Q25 and 3Q24, respectively. This increase was due to the higher gross debt and lower available cash, resulting from the R$ 4 billion dividend payment in August 2025, which consumed a portion of the R$ 5 billion in free cash generated during the period. The average debt maturity decreased by 3.9 months while the average cost rose to CDI + 0.64% p.a. from CDI + 0.59% p.a. in 3Q24.
Notably, Eletronorte raised R$ 2 billion through a debenture issuance in July 2025, with a final cost equivalent to CDI -0.56% p.a. after a swap transaction.
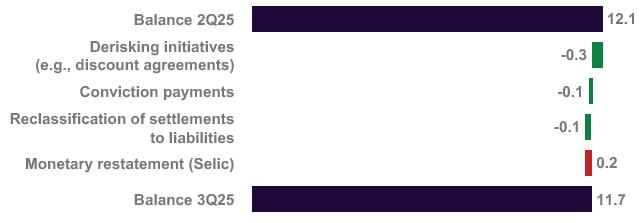
Compulsory Loan: the provision inventory was reduced by R$ 2.7 billion YoY and R$ 362 million sequentially, totaling R$ 11.7 billion in 3Q25. Agreements reached and favorable decisions led to a net reversal of R$ 300 million in the quarter.
|
|
MAIN OPERATIONAL AND FINANCIAL INDICATORS
Table 1 - Operating highlights
| 3Q25 | 3Q24 | ∆% | 2Q25 | ∆% | |
| Generation and Trading | |||||
| Installed Generation Capacity (MW) | 44,368 | 44,191 | 0.4 | 44,368 | 0.0 |
| Assured Capacity (aMW) (1) | 21,655 | 21,912 | -1.2 | 21,655 | 0.0 |
| Net Generation (TWh) | 24.5 | 26.5 | -7.6 | 38.7 | -36.6 |
| Energy Sold ACR (TWh) (2) | 26.7 | 31.3 | -14.7 | 18.8 | 42.5 |
| Energy Sold ACL (TWh) (3) | 52.5 | 45.4 | 15.8 | 36.1 | 45.4 |
| Energy Sold Quotas (TWh) (4) | 15.4 | 25.9 | -40.7 | 10.4 | 48.6 |
| Average ACR Price (R$/MWh) (5) | 268.70 | 298.96 | -10.1 | 284.80 | -5.7 |
| Average ACL Price (R$/MWh) | 156.07 | 156.13 | 0.0 | 152.07 | 2.6 |
| Transmission | |||||
| Transmission lines (km) | 74,769 | 73,958 | 1.1 | 73,774 | 1.3 |
| RAP (R$ mm) (6) | 16,644 | 17,015 | -2.2 | 17,209 | -3.3 |
(1) Assured Capacity (AC) reflects: (a) Ordinance GM/MME 544/21, which established the revision of AC values for plants that had their concessions renewed due to the capitalization (Quota regime plants: Tucuruí, Itumbiara, Sobradinho, Mascarenhas de Moraes, and Curuá-Una), leading to a significant AC reduction, effective from 2023; (b) Ordinance GM/MME 709/22, which introduced an Ordinary Review of the AC for hydroelectric power plants effective from 2023, impacting several AXIA Energia plants; (c) exit of TPP Candiota III as of Jan/24 and of TPPs Mauá III, Aparecida, Anamã, Anori, Codajás, and Caapiranga as of May/25; (d) inclusion of Colíder HPP and exclusion of Mauá HPP as of June/25, following the uncrossing of asset holdings with Copel; (e) inclusion of newly consolidated SPEs: Teles Pires HPP (Oct/23), Baguari HPP (Oct/23), Retiro Baixo HPP (Nov/23), and Santo Antônio HPP (Nov/23); (f) inclusion of the expanding wind farms Casa Nova B and Coxilha Negra, with full AC in 2024; (g) figures do not yet reflect the completion of the sale of the Santa Cruz TPP, concluded in Oct/25, nor the consolidation of the Três Irmãos HPP, whose signing occurred in Oct/25 and is still pending completion.
(2) Does not include quotas.
(3) Includes contracts under Law 13.182/2015.
(4) The figures presented refer to the Assured Capacity of quotas in GWh.
(5) Excludes thermoelectric power plants.
(6) Approved RAP for the current regulatory cycle, considering the modules in operation at the end of each period—including those in operation at the start of the cycle, as well as new modules that entered commercial operation. Includes transmission contracts from AXIA Energia Holding, Chesf, CGT Eletrosul, Eletronorte, TMT, and VSB.
Table 2 - Financial highlights
| 3Q25 | 3Q24 | ∆% | 2Q25 | ∆% | |
| Financial Indicators | |||||
| Gross Revenue | 11,725 | 12,960 | -9.5 | 12,082 | -3.0 |
| Adjusted Gross Revenue | 11,751 | 12,960 | -9.3 | 12,191 | -3.6 |
| Net Operating Revenue | 10,003 | 11,043 | -9.4 | 10,199 | -1.9 |
| Adjusted Net Operating Revenue | 10,029 | 11,043 | -9.2 | 10,308 | -2.7 |
| Regulatory Net Operating Revenue | 9,943 | 10,449 | -4.8 | 9,701 | 2.5 |
| EBITDA | -1,495 | 12,159 | -112.3 | 1,259 | -218.8 |
| Adjusted EBITDA | 5,890 | 11,964 | -50.8 | 5,151 | 14.4 |
| Regulatory EBITDA | -601 | 6,970 | -108.6 | 5,820 | -110.3 |
| Adjusted Regulatory EBITDA | 6,382 | 6,775 | -5.8 | 5,501 | 16.0 |
| EBITDA Margin (%) | -14.9 | 110.1 | -125.1pp | 12.3 | -27.3pp |
| Adjusted EBITDA Margin (%) | 58.7 | 108.3 | -49.6pp | 50.0 | 8.8pp |
| Net Income | -5,448 | 7,195 | -175.7 | -1,325 | 311.1 |
| Adjusted Net Income | 2,176 | 6,805 | -68.0 | 1,469 | 48.1 |
| Adjusted Gross Debt | 72,005 | 68,774 | 4.7 | 71,042 | 1.4 |
| Adjusted Net Debt (Adj Net Debt) | 42,577 | 38,897 | 9.5 | 40,125 | 6.1 |
| Adj Net Debt/Adjusted LTM EBITDA | 2.1 | 1.6 | 33.9 | 1.5 | 38.1 |
| Investments | 2,701 | 1,720 | 57.0 | 2,043 | 32.2 |
|
|
HIGHLIGHTS OF CONSOLIDATED RESULTS
1. CONSOLIDATED RESULT | IFRS AND REGULATORY
Table 3 - Income statement IFRS (R$ mm)
| 3Q25 | 3Q24 | 2Q25 | 9M25 | 9M24 | ||||||
| IFRS | Adjustment | Adjusted | Adjusted | % Y/Y | Adjusted | % Q/Q | Adjusted | Adjusted | % Y/Y | |
| Generation | 6,908 | 26 | 6,934 | 8,348 | -16.9 | 6,960 | -0.4 | 20,862 | 20,109 | 3.7 |
| Transmission | 4,646 | 0 | 4,646 | 4,566 | 1.7 | 5,079 | -8.5 | 14,910 | 13,520 | 10.3 |
| Others | 171 | 0 | 171 | 46 | n.m. | 152 | 12.6 | 392 | 182 | n.m. |
| Gross Revenue | 11,725 | 26 | 11,751 | 12,960 | -9.3 | 12,191 | -3.6 | 36,164 | 33,811 | 7.0 |
| (-) Deductions from Revenue | -1,723 | 0 | -1,723 | -1,918 | -10.2 | -1,883 | -8.5 | -5,413 | -5,655 | -4.3 |
| Net Revenue | 10,003 | 26 | 10,029 | 11,043 | -9.2 | 10,308 | -2.7 | 30,751 | 28,156 | 9.2 |
| Energy resale, grid, fuel and construction | -4,179 | 0 | -4,179 | -4,014 | 4.1 | -3,568 | 17.1 | -11,609 | -9,917 | 17.1 |
| Personnel, Material, Services and Others | -1,623 | 114 | -1,509 | -1,692 | -10.8 | -1,403 | 7.6 | -4,379 | -4,744 | -7.7 |
| Operating provisions | -236 | 218 | -18 | -251 | -92.7 | -177 | -89.7 | -281 | -834 | -66.4 |
| Results from asset sale | -7,071 | 7,071 | 0 | 0 | 0.0 | 0 | 0.0 | 0 | 0 | 0 |
| Regulatory remeasurements - Transmission contracts | 303 | 0 | 303 | 6,130 | -95.1 | 0 | 0.0 | -648 | 6,130 | n.m. |
| Other income and expenses | 43 | -43 | 0 | 0 | 0.0 | 0 | 0.0 | 0 | 0 | 0.0 |
| Results, before Equity holdings | -2,760 | 7,385 | 4,625 | 11,216 | -58.8 | 5,160 | -10.4 | 13,834 | 18,791 | -26.4 |
| Equity holdings | 1,265 | 0 | 1,265 | 749 | 69.0 | -10 | n.m. | 1,623 | 2,025 | -19.8 |
| EBITDA | -1,495 | 7,385 | 5,890 | 11,964 | -50.8 | 5,151 | 14.4 | 15,457 | 20,816 | -25.7 |
| D&A | -1,156 | 0 | -1,156 | -990 | 16.7 | -1,131 | 2.1 | -3,399 | -2,955 | 15.0 |
| EBIT | -2,651 | 7,385 | 4,734 | 10,974 | -56.9 | 4,019 | 17.8 | 12,058 | 17,861 | -32.5 |
| Financial Result | -2,571 | 186 | -2,385 | -2,225 | 7.2 | -2,377 | 0.3 | -8,081 | -7,756 | 4.2 |
| EBT | -5,222 | 7,571 | 2,349 | 8,749 | -73.1 | 1,642 | 43.1 | 3,976 | 10,105 | -60.6 |
| Income Tax and Social Contribution (1) | -226 | 53 | -173 | -1,944 | -91.1 | -173 | 0.1 | -411 | -1,828 | -77.5 |
| Net Income | -5,448 | 7,624 | 2,176 | 6,805 | -68.0 | 1,469 | 48.1 | 3,565 | 8,277 | -56.9 |
(1) The adjusted value originally disclosed for the Income Tax and Social Contribution line in 3Q24, published on November 6, 2024, was -R$ 1,186 million. Subsequently, part of the deferred tax recognized in 4Q24, amounting to R$ 758 million, was identified as having its triggering event in 3Q24. Accordingly, a non-recurring adjustment was made between the two quarters, reallocating this amount from 4Q24 to 3Q24, with no impact on full-year 2024 results. As a result, in the 4Q24 disclosure, the adjusted value for 3Q24 was revised from -R$ 1,186 million to -R$ 1,944 million. The value presented for 3Q24 in this earnings release reflects the revised amount, as disclosed in the 4Q24 results on March 13, 2025.
|
|
Table 4 - Regulatory IS (R$ mm)
| 3Q25 | 3Q24 | 2Q25 | 9M25 | 9M24 | ||||||
| Regulatory | Adjustment | Adjusted | Adjusted | % Y/Y | Adjusted | % Q/Q | Adjusted | Adjusted | % Y/Y | |
| Generation | 6,749 | 26 | 6,775 | 8,001 | -15.3 | 6,945 | -2.4 | 20,744 | 20,676 | 0.3 |
| Transmission (1) | 4,745 | 0 | 4,745 | 4,320 | 9.8 | 4,488 | 5.7 | 13,656 | 14,450 | -5.5 |
| Others | 171 | 0 | 171 | 45 | n.m. | 152 | 12.6 | 392 | 179 | n.m. |
| Gross Revenue | 11,665 | 26 | 11,691 | 12,366 | -5.5 | 11,585 | 0.9 | 34,791 | 35,305 | -1.5 |
| (-) Deductions from Revenue | -1,723 | 0 | -1,723 | -1,918 | -10.2 | -1,883 | -8.5 | -5,413 | -5,655 | -4.3 |
| Net Revenue | 9,943 | 26 | 9,969 | 10,449 | -4.6 | 9,701 | 2.8 | 29,378 | 29,650 | -0.9 |
| Energy resale, grid, fuel and construction (1) | -2,764 | 0 | -2,764 | -2,988 | -7.5 | -2,478 | 11.5 | -8,395 | -7,579 | 10.8 |
| Personnel, Material, Services and Others | -1,620 | 114 | -1,505 | -1,702 | -11.5 | -1,419 | 6.1 | -4,398 | -4,784 | -8.1 |
| Operating provisions | 142 | 65 | 207 | 405 | -49.0 | -98 | n.m. | 31 | -575 | n.m. |
| Results from asset sale | -6,821 | 6,821 | 0 | 0 | 0.0 | 0 | 0.0 | 0 | 0 | 0 |
| Regulatory remeasurements - Transmission contracts | 0 | 0 | 0 | 0 | 0.0 | 0 | 0.0 | 0 | 0 | 0 |
| Other income and expenses | 43 | -43 | 0 | 0 | 0.0 | 0 | 0.0 | 0 | 0 | 0.0 |
| Results, before Equity holdings | -1,077 | 6,983 | 5,906 | 6,165 | -4.2 | 5,706 | 3.5 | 16,617 | 16,712 | -0.6 |
| Equity holdings | 476 | 0 | 476 | 610 | -21.9 | -205 | n.m. | 643 | 1,686 | -61.9 |
| EBITDA | -601 | 6,983 | 6,382 | 6,775 | -5.8 | 5,501 | 16.0 | 17,260 | 18,398 | -6.2 |
| D&A | -1,589 | 0 | -1,589 | -1,490 | 6.6 | -1,615 | -1.6 | -4,795 | -4,419 | 8.5 |
| EBIT | -2,190 | 6,983 | 4,793 | 5,285 | -9.3 | 3,886 | 23.3 | 12,465 | 13,979 | -10.8 |
| Financial Result | -2,814 | 339 | -2,475 | -2,352 | 5.2 | -2,398 | 3.2 | -8,148 | -8,167 | -0.2 |
| EBT | -5,003 | 7,322 | 2,318 | 2,934 | -21.0 | 1,488 | 55.8 | 4,317 | 5,812 | -25.7 |
| Income Tax and Social Contribution (2) | -462 | 53 | -409 | -1,168 | -65.0 | -244 | 67.9 | -754 | -1,454 | -48.1 |
| Net Income | -5,465 | 7,375 | 1,909 | 1,766 | 8.1 | 1,244 | 53.4 | 3,563 | 4,358 | -18.2 |
(1) The figures for 3Q24 presented in this disclosure differ in two lines from those originally published on November 6, 2024. Gross transmission revenue decreased by R$ 147 million, from R$ 4,467 to R$ 4,320 million, while the cost of network usage charges—recorded under “Energy resale, grid, fuel and construction”—also decreased by R$ 147 million, from R$ 3,135 million to R$ 2,988 million. As a result, the net effect on EBITDA and net income is nil. The change in both lines results from the review of accounting practices in 2025 related to the elimination of intercompany transactions between the Company’s generation and transmission segments, This adjustment reflects that network usage charges paid by certain generation plants are offset by revenues received by the transmission companies within the group. To ensure comparability between 2024 and 2025, the corresponding elimination values for 2024 were also revised.
(2) The adjusted value originally disclosed for the Income Tax and Social Contribution line in 3Q24, published on November 6, 2024, was -R$ 410 million. Subsequently, part of the deferred tax recognized in 4Q24, amounting to R$ 758 million, was identified as having its triggering event in 3Q24. Accordingly, a non-recurring adjustment was made between the two quarters, reallocating this amount from 4Q24 to 3Q24, with no impact on full-year 2024 results. As a result, in the 4Q24 disclosure, the adjusted value for 3Q24 was revised from -R$ 410 million to -R$ 1,168 million. The value presented for 3Q24 in this earnings release reflects the revised amount, as disclosed in the 4Q24 results on March 13, 2025.
|
|
2. ADJUSTED CONSOLIDATED RESULT | IFRS AND REGULATORY
Adjusted Regulatory Income Statement
This section presents the reconciliation between Regulatory and IFRS Income Statements, along with the adjustments related to non-recurring events in the Regulatory Income Statement.
A detailed reconciliation is also available in the “Regulatory and IFRS Income Statement Reconciliation” spreadsheet, accessible on the Company’s Investor Relations website, under Market Information > Historical Financial Information.
Table 5 - Regulatory IS x IFRS IS (R$ mm)
| 3Q25 IFRS | Difference | 3Q25 Regulatory | Non-recurring Adjustment | 3Q25 Regulatory Adjusted | 3Q24 Regulatory Adjusted | % Y/Y | |
| Generation | 6,908 | -159 | 6,749 | 26 | 6,775 | 8,001 | -15.3 |
| Transmission | 4,646 | 99 | 4,745 | 0 | 4,745 | 4,320 | 9.8 |
| Others | 171 | 0 | 171 | 0 | 171 | 45 | n.m. |
| Gross Revenue | 11,725 | -60 | 11,665 | 26 | 11,691 | 12,366 | -5.5 |
| (-) Deductions from Revenue | -1,723 | 0 | -1,723 | 0 | -1,723 | -1,918 | -10.2 |
| Net Revenue | 10,003 | -60 | 9,943 | 26 | 9,969 | 10,449 | -4.6 |
| Construction | -1,262 | 1,262 | 0 | 0 | 0 | 0 | 0.0 |
| Energy resale | -1,714 | 0 | -1,714 | 0 | -1,714 | -1,628 | 5.3 |
| Grid | -1,010 | 153 | -857 | 0 | -857 | -869 | -1.4 |
| Fuel | -193 | 0 | -193 | 0 | -193 | -491 | -60.6 |
| Energy resale, grid, fuel and construction | -4,179 | 1,415 | -2,764 | 0 | -2,764 | -2,988 | -7.5 |
| Personnel | -832 | -4 | -836 | 82 | -754 | -915 | -17.6 |
| Material | -63 | 0 | -63 | 0 | -63 | -64 | -1.6 |
| Services | -548 | 0 | -548 | 15 | -533 | -568 | -6.2 |
| Others | -180 | 8 | -173 | 18 | -155 | -154 | 0.4 |
| Personnel, Material, Services and Others | -1,623 | 4 | -1,620 | 114 | -1,505 | -1,702 | -11.5 |
| Operating provisions | -236 | 378 | 142 | 65 | 207 | 405 | -49.0 |
| Results from asset sale | -7,071 | 249 | -6,821 | 6,821 | 0 | 0 | 0.0 |
| Regulatory remeasurements - Transmission contracts | 303 | -303 | 0 | 0 | 0 | 0 | 0.0 |
| Other income and expenses | 43 | 0 | 43 | -43 | 0 | 0 | 0.0 |
| Results, before Equity holdings | -2,760 | 1,683 | -1,077 | 6,983 | 5,906 | 6,165 | -4.2 |
| Equity holdings | 1,265 | -788 | 476 | 0 | 476 | 610 | -21.9 |
| EBITDA | -1,495 | 894 | -601 | 6,983 | 6,382 | 6,775 | -5.8 |
| D&A | -1,156 | -433 | -1,589 | 0 | -1,589 | -1,490 | 6.6 |
| EBIT | -2,651 | 461 | -2,190 | 6,983 | 4,793 | 5,285 | -9.3 |
| Financial Result | -2,571 | -242 | -2,814 | 339 | -2,475 | -2,352 | 5.2 |
| EBT | -5,222 | 219 | -5,003 | 7,322 | 2,318 | 2,934 | -21.0 |
| Income Tax and Social Contribution | -226 | -236 | -462 | 53 | -409 | -1,168 | -65.0 |
| Net Income, continued | -5,448 | -17 | -5,465 | 7,375 | 1,909 | 1,766 | 8.1 |
|
|
Non-recurring Adjustments
The following adjustments refer to events considered non-recurring:
| ▪ | Generation Revenue: R$ 26 million, related to adjustments in the value of sale transactions from the thermal power plants. |
| ▪ | PMSO (Personnel): R$ 82 million, of which R$ 50 million was severance and R$ 32 million was VDPs. |
| ▪ | PMSO (Services): R$ 15 million, of which R$ 14 million refer to legal consulting services related to the contingency reduction strategy. |
| ▪ | PMSO (Other): R$ 18 million, related to commitments under the self-managed health plan, which was replaced by a plan managed by a specialized market operator. |
| ▪ | Operating Provisions: R$ 65 million, resulting from: |
(a) R$ 266 million in provisions for litigation;
(b) -R$ 176 million in reversals of provisions for estimated losses on loans and financing;
(c) -R$ 29 million in appropriation of onerous contracts;
(d) R$ 15 million in adjustments related to the compulsory loan share conversion process;
(e) -R$ 12 million in estimated losses on investments and non-recoverable assets (impairment)
| ▪ | Asset Disposal: R$ 6,821 million, referring to non-cash impacts recognized in the P&L resulting from asset purchase and sale transactions during the quarter. These include signing the agreement for the sale of a stake in Eletronuclear (R$ 7,290 million), uncrossing assets with Copel (-R$ 483 million), signing the agreement for the sale of a stake in EMAE (R$ 25 million) and completing the sale of thermal power plants (-R$ 11 million). |
| ▪ | Other Revenues and Expenses: -R$ 43 million, fully adjusted as non-recurring, given the atypical nature of the items that make up this item. |
| ▪ | Financial Result: R$ 339 million, linked to the monetary restatement of compulsory loan and litigation. |
| ▪ | Income Tax and Social Contribution: R$ 53 million, related to a current tax expense recognized upon completion of the transaction involving the sale of the Mauá HPP. |
Regulatory Result: Adjusted EBITDA
In 3Q25, adjusted regulatory EBITDA totaled R$ 6,382 million, down R$ 393 million YoY, reflecting:
(a) the drop in generation revenue due to the sale of the Amazonas thermal power plants and the additional energy sale from Tucuruí HPP which occurred only in 3Q24;
(b) lower reversals of provisions; and
(c) a reduced contribution from equity holdings.
These effects were partially offset by:
(a) higher transmission revenue;
(b) lower PMSO costs and expenses; and
(c) reduced fuel costs for electricity generation following the sale of the Amazonas thermal power plants.
Equity income was R$ 476 million in 3Q25, and does not include the net income from the stake in Eletronuclear, which was classified as asset held for sale following the signing of the divestment agreement with J&F.
It is worth noting that, excluding the results from the Amazonas thermal power plants, sold in May 2025, EBITDA went up R$ 214 million to R$ 6,419 million in 3Q25 from R$ 6,205 million in 3Q24.
|
|
Table 6 - Adjusted regulatory EBITDA, without thermal power plants (R$ mm)
| 3Q25 |
Thermal Power Plants (TPP) |
3Q25 Excluding TPP |
3Q24 |
Thermal Power Plants (TPP) |
3Q24 Excluding TPP |
|
| Generation | 6,775 | 200 | 6,575 | 8,001 | 1,281 | 6,720 |
| Transmission | 4,745 | 0 | 4,745 | 4,320 | 0 | 4,320 |
| Others | 171 | 0 | 171 | 45 | 0 | 45 |
| Gross Revenue | 11,691 | 200 | 11,491 | 12,366 | 1,281 | 11,085 |
| (-) Deductions from Revenue | -1,723 | -21 | -1,702 | -1,918 | -219 | -1,698 |
| Net Revenue | 9,969 | 179 | 9,790 | 10,449 | 1,062 | 9,387 |
| Energy resale, grid, fuel and construction | -2,764 | -210 | -2,555 | -2,988 | -833 | -2,154 |
| Personnel, Material, Services and Others | -1,505 | -6 | -1,499 | -1,702 | -35 | -1,667 |
| Operating provisions | 207 | 0 | 207 | 405 | 376 | 29 |
| Results, before Equity holdings | 5,906 | -37 | 5,942 | 6,165 | 570 | 5,595 |
| Equity holdings | 476 | 0 | 476 | 610 | 0 | 610 |
| EBITDA | 6,382 | -37 | 6,419 | 6,775 | 570 | 6,205 |
Generation revenue was R$ 6,775 million in 3Q25, down R$ 1,225 million YoY. Recurring revenue fell 15.3% reflecting decreases of 12.3% in volume and 3.4% in average price. The reduction in both volume and price can be explained by:
(a) the sale of Amazonas thermal power plants, and
(b) the additional sale of energy from Tucuruí HPP in 3Q24, due to the renegotiation of hydrological risk, an event without a counterpart in 3Q25.
Excluding the revenue billed from energy sold by the thermal power plants, generation revenue was down by R$ 144 million, reaching R$ 6,575 million in 3Q25, reflecting an 8.5% drop in volume, partially offset by a 6.9% increase in average price. In 3Q25, revenue was positively impacted by higher energy settlements in the Short Term Market (MCP) amounting to R$ 1,755 million, compared to R$ 695 million in 3Q24. This increase reflected the combined increases of 38% in average price and 83% in volume.
Costs associated with generation reached R$ 2,555 million in 3Q25, up by R$ 400 million YoY, of which R$ 380 million relate to higher expenses with energy purchased for resale.
Transmission revenue increased by R$ 425 million YoY, reaching R$ 4,745 million in 3Q25, mainly reflecting a reduction in the negative component of the Adjustment Portion (PA).
Personnel, Materials, Services and Other (PMSO) expenses fell by R$ 168 million, totaling R$ 1,499 million in 3Q25. The decrease resulted from measures implemented by the Company to enhance operational efficiency.
Provisions under the regulatory view showed a reversal of R$ 207 million in 3Q25, compared to R$ 29 million in 3Q24. This variation reflects the R$ 170 million reversal in 3Q25 related to Amazonas Energia debts with AXIA Energia, following the release of judicial deposits made by the counterparty.
3Q25’s performance reflected positive effects from higher transmission revenue and lower PMSO and provision expenses, reflecting the Company’s continuous pursuit of operational efficiency and mitigation of contingencies. These improvements more than offset the lower contribution from the generation segment and from equity income, ensuring resilient EBITDA growth.
|
|
IFRS Result: Adjusted EBITDA and Net Income
Adjusted IFRS PMSO was R$ 1,509 million, down 10.8% YoY, reflecting savings related to efficiency gains. In 3Q25, the adjusted PMSO was impacted by the following effects:
(a) R$ 82 million related to Voluntary Dismissal Programs (VDPs) and severance costs;
(b) R$ 18 million related to commitments under the self-managed health plan, which was replaced by a plan managed by a specialized market operator;
(c) R$ 15 million in legal consulting costs related to the contingency reduction strategy.
Adjusted IFRS EBITDA reached R$ 5,890 million in 3Q25, down 50.8% YoY. This variation was mainly explained by the recognition of a R$ 303 million regulatory remeasurement in 3Q25, compared to R$ 6,130 million in 3Q24, when the impact of the 2023 Periodic Tariff Review was recognized, with no equivalent effect in 2025.
Adjusted IFRS Financial Result reached -R$ 2,385 million in 3Q25, compared to -R$ 2,225 million in 3Q24.
Adjusted Income Tax and Social Contribution tax expenses under IFRS reached R$ 173 million in 3Q25 compared to R$ 1,944 million in 3Q24, due to lower recognition of deferred tax expenses.
Thus, Adjusted IFRS Net income reached R$ 2,176 million, down 68.0% YoY.
|
|
3. ENERGY TRADING
AXIA Energia companies sold 94.7 TWh of energy in 3Q25, down 7.8% compared to the 102.6 TWh traded in 3Q24.
The volumes sold include energy from plants under the quota regime, renewed under Law 12,783/2013, as well as from plants operating under the ACL and ACR exploration regimes and consolidated Special Purpose Entities - SPEs: HPPs Teles Pires and Baguari (as of Oct/23), and Retiro Baixo and Santo Antônio (as of Nov/23).
Table 7 - Energy balance 3Q25 (aMW)
| 2025 | 2026 | 2027 | ||||
| Resources (A) | 16,905 | 16,984 | 17,833 | |||
| Own resources (1) (2) (3) (4) (5) | 14,214 | 15,533 | 16,702 | |||
| Hydraulic | 13,938 | 15,251 | 16,420 | |||
| Wind | 276 | 282 | 282 | |||
| Energy Purchase | 2,690 | 1,452 | 1,130 | |||
| Limit => | Lower | Higher | Lower | Higher | Lower | Higher |
| Sales (B) (6) | 11,998 | 14,368 | 9,347 | 12,347 | 7,148 | 9,648 |
| ACR - Except quotas | 3,498 | 3,597 | 3,148 | |||
| ACL - Bilateral Contracts + STM implemented (range) (6) | 8,500 | 10,870 | 5,750 | 8,750 | 4,000 | 6,500 |
| Average prices Contracts signed | ||||||
| Limit => | Lower | Higher | Lower | Higher | Lower | Higher |
| Average Price of Sales Contracts (ACR and ACL - R$/MWh) | 170 | 180 | 185 | 205 | 195 | 225 |
| Balance (A - B) | 4,907 | 2,537 | 7,637 | 4,637 | 10,684 | 8,184 |
| Balance considering estimated hedge (9) | 2,370 | 0 | 4,862 | 1,862 | 7,696 | 5,196 |
| Uncontracted energy considering estimated hedge (9) | 14% | 0% | 29% | 11% | 43% | 29% |
Contracts signed until 9/30/2025.
The energy balance reflects the SPEs consolidated into AXIA Energia: Santo Antônio HPP (as of 3Q22) and Baguari and Retiro Baixo HPPs (as of 4Q23) in terms of resources, sales, and average prices. Similarly, Teles Pires HPP, an SPE consolidated into Eletronorte (as of 4Q23), is also included.
| 1. | The energy balance does not include Independent Power Producers (IPPs) contracts resulting from the Amazonas Distribuidora de-verticalization process, thermal plant availability contracts, or Assured Capacity Quotas, whether in terms of resources, requirements (sales), or average prices. |
| 2. | Own Resources include the decotization plants (new IPPs) and the New Grants—Sobradinho, Itumbiara, Tucuruí, Curuá-Una, and Mascarenhas de Moraes. For hydroelectric projects, the estimate of GFIS2 was used, representing Assured Capacity adjusted for Internal Losses, Losses in the Basic Grid, Availability, and portfolio-specific factors. |
| 3. | The revised Assured Capacity values, as outlined in Ordinance No. 709/GM/MME, of November 30, 2022, have been taken into account. |
| 4. | With the gradual phasing out of quota-based generation legacy contracts (decotization), plants currently operating under the quota regime are gradually granted new concessions under the IPP regime over a five-year period beginning in 2023. The Assured Capacity values were established in Ordinance GM/MME No. 544/21. |
| 5. | Considering the new concession grants from 2023 onward for the Sobradinho, Itumbiara, Tucuruí, Curuá-Una, and Mascarenhas de Moraes plants, whose Assured Capacity values were established in Ordinance GM/MME No. 544/21. |
| 6. | The balances include intercompany transactions, impacting both energy purchase and sales lines in the ACL, in the following amounts: approximately 900 aMW in 2025 and 200 aMW in 2026 and 2027. |
Table 8 - Assured capacity quotas of hydroelectric power plants (aMW)
| 2025 | 2026 | 2027 | |
| Assured Capacity Quotas | 2,626 | 1,313 | 0 |
| 7. | This excludes the Assured Capacity of Jaguari HPP (12.7 aMW), whose concession remains under AXIA Energia's provisional management. |
| 8. | Decotization occurs gradually over a five-year period beginning in 2023. The Assured Capacity values applied from 2023 onward are those established in Ordinance GM/MME No. 544/21. |
| 9. | The figures represent an estimate of uncontracted energy. The projected values for 2025, 2026 and 2027 is 81.8%. Worth noting that the average historical GSF from 2019 to 2024 is 82.7%. Source: CCEE, obtained from the CCEE website at the following link: CCEE Data and Analysis (in Portuguese only, select the MRE option in the panel). It is important to note that this is only an estimate, based on past events. |
|
|
4. INVESTMENTS AND EXPANSION PROJECTS
Investments totaled R$ 2,701 million in 3Q25, with allocation as follows:
(a) R$ 1,203 million to transmission;
(b) R$ 677 million to Itaipu's HVDC project;
(c) R$ 289 million to generation;
(d) R$ 282 million to equity holdings;
(e) R$ 181 million to infrastructure; and
(f) R$ 69 million to the environmental area.
It is worth highlighting the higher investments related to the revitalization of the Itaipu High Voltage Direct Current (HVDC) system, which transmits energy generated by the power plant to consumer centers in Brazil. The project results from a technical and financial cooperation agreement between AXIA Energia, which is responsible for execution, and Itaipu, which fully reimburses the investments, with funds released in advance of disbursements.
The amount invested in infrastructure was allocated as follows:
(a) 36% for IT;
(b) 28% for socio-environmental initiatives;
(c) 19% for real estate; and
(d) 17% for equipment and vehicles.
In the socio-environmental area, key highlights included investments related to the maintenance of operating licenses for power plants and substations, as well as land compensation.
The breakdown of investments by the holding company and its main subsidiaries is available in the operational spreadsheet in the Results Center section of the Company’s Investor Relations website.
Table 9 - Investments (R$ mm)
| 3Q25 | 3Q24 | % | 2Q25 | % | 9M25 | 9M24 | % | |
| Generation Corporate | 289 | 534 | -45.8 | 357 | -19.1 | 813 | 1,768 | -54.0 |
| Implementation / Expansion | 27 | 216 | -87.7 | 45 | -41.5 | 109 | 926 | -88.3 |
| Maintenance | 263 | 318 | -17.3 | 312 | -15.8 | 705 | 842 | -16.3 |
| Transmission Corporate | 1,203 | 966 | 24.6 | 1,199 | 0.3 | 3,057 | 2,265 | 35.0 |
| Expansion | 135 | 93 | 44.3 | 85 | 58.1 | 274 | 119 | n.m. |
| Reinforcements and improvements | 1,061 | 830 | 27.8 | 1,108 | -4.3 | 2,765 | 2,039 | 35.6 |
| Maintenance | 8 | 42 | -81.8 | 5 | 44.7 | 19 | 107 | -82.6 |
| Infrastructure | 181 | 104 | 73.7 | 117 | 54.5 | 341 | 173 | 97.7 |
| Environmental | 69 | 109 | -36.4 | 67 | 3.4 | 184 | 242 | -24.1 |
| SPEs | 282 | 0 | 0.0 | 225 | 25.2 | 507 | 486 | 4.2 |
| Generation - Contributions | 0 | 0 | 0.0 | 0 | 0.0 | 0 | 478 | n.m. |
| Generation - Acquisition | 0 | 0 | 0.0 | 0 | 0.0 | 0 | 0 | 0.0 |
| Transmission - Contributions | 282 | 0 | 0.0 | 225 | 25.2 | 507 | 8 | n.m. |
| Transmission - Acquisition | 0 | 0 | 0.0 | 0 | 0.0 | 0 | 0 | 0.0 |
| Investment for Special Obligation – Itaipu HVDC | 677 | 7 | n.m. | 77 | n.m. | 836 | 199 | n.m. |
| Total | 2,701 | 1,720 | 57.0 | 2,043 | 32.2 | 5,739 | 5,132 | 11.8 |
|
|
Expansion Projects - Transmission
Large Scale Projects
| ▪ | Projects: 230[1], including the Itaipu HVDC System Revitalization project. Throughout 3Q25, the sample was reduced from 250 to 230 projects, due to 21 projects that were energized and the inclusion of 1 new authorization issued by the regulator. |
| ▪ | Estimated investment: R$ 6.21 billion, excluding the Itaipu HVDC System Revitalization project, as AXIA Energia is responsible solely for the execution, and therefore does not benefit from associated revenue while being fully reimbursed for the amount disbursed. |
| ▪ | Auctions: Investments of R$ 6.24 billion, mainly driven by the following SPEs: Nova Era Janapu, which was part of the sample since 2Q24, while Nova Era Catarina, Nova Era Ceará, Nova Era Integração and Nova Era Teresina were added in 3Q24[2]. The lot acquired in Auction 01/2022, awarded to Eletronorte and concluded in August 2025 — 13 months ahead of schedule — was excluded in 3Q25. |
| ▪ | Additional associated RAP: R$ 1.7 billion between 2025-2030. |
Small Scale Projects
| ▪ | Projects: data from ONS's Improvement and Reinforcement Plan Management System (SGPMR). |
| ▪ | Works: 8,575 small-scale events under implementation or to be implemented, of which 8,088 were improvements and 487 were reinforcements. |
Table 10 - Portfolio of ongoing transmission projects
| 3Q25 | 3Q24 | % | 2Q25 | % | |
| Large Scale: Reinforcement and Improvement | |||||
| Estimated Portfolio Investment (R$ bi) (2) | 6.2 | 6.8 | -8.9 | 7.0 | -10.6 |
| Additional RAP associated (R$ bi) | 1.0 | 1.1 | -8.9 | 1.1 | -7.5 |
| # of projects in the beggining of the period (1) | 244 | 245 | -0.4 | 235 | 3.8 |
| (-) energized | -20 | -5 | n.m. | -9 | n.m. |
| (+) new authorizations | 1 | 1 | 0.0 | 18 | -94.4 |
| # of projects in the end of the period (1) | 225 | 241 | -6.6 | 244 | -7.8 |
| Large Scale: Expansion (Auctions in implementation) (3) | |||||
| Estimated Portfolio Investment (R$ bi) (2) | 6.2 | 6.4 | -1.8 | 6.4 | -1.8 |
| Additional RAP associated (R$ bi) | 0.7 | 0.7 | 6.5 | 0.7 | 3.2 |
| # of projects in the beggining of the period (1) | 6 | 1 | n.m. | 6 | 0.0 |
| (-) energized | -1 | 0 | 0.0 | 0 | 0.0 |
| (+) new authorizations | 0 | 5 | n.m. | 0 | 0.0 |
| # of projects in the end of the period | 5 | 6 | -16.7 | 6 | -16.7 |
| Small Scale (4) | |||||
| # of projects in the end of the period | 8,575 | 11,130 | -23.0 | 9,194 | -6.7 |
| Improvement | 8,088 | 10,491 | -22.9 | 8,668 | -6.7 |
| Reinforcement | 487 | 639 | -23.8 | 526 | -7.4 |
[1] Referring to reinforcements, improvements and auction-related projects. Considers projects registered in ANEEL's Transmission Management System (SIGET). Projects are included when added to the system and excluded when they are either canceled or enter commercial operation. The 230 projects will add 2,306 km of transmission lines and 12,926 MVA in substations.
[2] Each of the 5 SPEs created holds the contracts signed in last years' transmission auctions. SPE Nova Era Janapu holds contract no. 09/2023-ANEEL for the 4th lot of Auction 01-2023; SPE Nova Era Teresina holds contract no. 04/2024-ANEEL for the 1st lot of Auction 01-2024; SPE Nova Era Ceará holds contract no. 06/2024-ANEEL for the 3rd lot of Auction 01-2024; SPE Nova Era Integração holds contract no. 08/2024-ANEEL for the 5th lot of Auction 01-2024; and SPE Nova Era Catarina holds contract no. 12/2024-ANEEL for the 9th lot of Auction 01-2024.
|
|
5. INDEBTEDNESS
Net debt totaled R$ 42,577 million in 3Q25, up R$ 2,451 million sequentially and R$ 3,680 million YoY. As a result of liability management and a 425 bps increase in the Brazilian basic interest rate (Selic), the Company's average debt maturity was reduced by 3.9 months in 3Q25 when compared to 3Q24, while the total average cost increased to CDI + 0.64% p.a. in 3Q25 from CDI + 0.59% p.a. in 3Q24.
Table 11 - Net debt (R$ mm)
| 09/30/2025 | 06/30/2025 | 09/30/2024 | |
| (+) Gross Debt, including derivatives | 72,005 | 71,042 | 68,774 |
| (+) Gross Debt | 70,836 | 70,290 | 68,879 |
| (+) Derivatives (currency hedge) Net | 1,169 | 752 | -105 |
| (-) Cash and Cash Equivalents + Current Securities | 28,256 | 29,387 | 28,378 |
| (-) Restricted Cash for Loans and Financing | 987 | 899 | 875 |
| (-) Loans receivable | 187 | 632 | 624 |
| Net Debt | 42,577 | 40,125 | 38,897 |
| Adjusted Net Debt / Adjusted Regulatory EBITDA LTM | 1.9x | 1.8x | 1.6x |
| Net Debt's Average Term (months) | 55.5 | 56.5 | 59.4 |
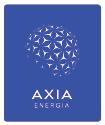
Below are the gross debt maturity schedule and its breakdown by index, according to the index profile, as well as the respective spreads over each index, considering gross debt including derivatives. A more detailed breakdown is available in the operational spreadsheet in the Results Center on the Company’s Investor Relations website.
Chart 1 - Debt maturity schedule after hedge (R$ billion)
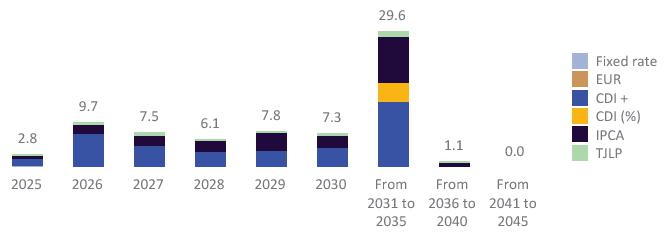
Table 12 - Debt breakdown, including hedge
| Index | Average Cost | Total Balance (R$ million) |
Share of Total (%) |
| CDI + | CDI + 1.12% | 38,353 | 53.3 |
| IPCA | IPCA + 5.97% | 24,304 | 33.8 |
| % of CDI | 122% of CDI | 4,546 | 6.3 |
| TJLP | TJLP + 1.99% | 3,031 | 4.2 |
| Fixed Rate | 5.72% per year | 1,568 | 2.2 |
| EUR | 2.65% per year | 204 | 0.3 |
| Total | 72,005 | 100.0 |
|
|
6. COMPULSORY LOAN
AXIA Energia has implemented measures to mitigate risks associated with legal proceedings related to compulsory loans on electricity[1]. To address this, the Company has strengthened its legal defense strategy and pursued settlements with discounts and full resolution of lawsuits. As a result of the negotiations:
| ▪ | The inventory of provisions was reduced by R$ 2.7 billion YoY and R$ 362 million sequentially, totaling R$ 11.7 billion in 3Q25, mainly due to the agreements signed; |
| ▪ | Net reversal of R$ 300 million due to agreements signed and favorable decisions in the quarter; |
| ▪ | R$ 186 million was the amount recorded in 3Q25 under financial expenses related to monetary restatements; |
| ▪ | With the signing of new agreements in 3Q25, R$ 21 million in guarantees previously deposited in court will be released upon approval, bringing the total released since 3Q22 to R$ 2.6 billion. |
Since 3Q22, when negotiations began, the provision inventory related to compulsory loan fell by R$ 14.2 billion, reaching R$ 11.7 billion in 3Q25, even considering the accumulated R$ 2.9 billion monetary restatement in the period. The agreements also enabled the elimination of R$ 10.1 billion in legal risks considered "off balance", of which R$ 930 million was classified as possible and R$ 9.2 billion as remote.
Chart 2 - Total inventory of compulsory loan provisions 3Q25 x 3Q24 (R$ bn)
Chart 3 - Total inventory of compulsory loan provisions 3Q25 x 2Q25 (R$ bn)
[1] Starting in 3Q25, the figures presented in this section fully encompass all procedural matters related to the topic, rather than only the book-entry credits, which represented approximately 99% of the total balance and had been the focus of this section in previous quarters. As a result, the figures disclosed herein may show slight variations compared to those reported in prior periods.
|
|
7. CASH FLOW
It is worth highlighting for 3Q25 the R$ 4 billion dividend payment in August 2025.
Table 13 - Cash flow (R$ mm)
| 3Q25 | 3Q24 | ∆% | |
| Adjusted Regulatory Result, before Equity Holdings | 5,906 | 6,165 | -4.2 |
| EBITDA Adjustment * | -162 | 196 | n.m. |
| Income Tax and Social Contribution | -154 | -430 | -64.1 |
| Working Capital | 773 | 569 | 35.9 |
| Privatization Charges | 0 | 0 | n.m. |
| Dividends Received | 350 | 115 | n.m. |
| Operating Cash Flow | 6,713 | 6,614 | 1.5 |
| Investments ** | -1,743 | -1,911 | -8.8 |
| Free Cash Flow | 4,970 | 4,704 | 5.7 |
| Debt Service | -1,281 | -1,379 | -7.1 |
| Litigation | -1,244 | -1,141 | 9.1 |
| Guarantees and Restricted Deposits | 23 | 222 | -89.8 |
| Supplementary social security | -116 | -86 | 35.8 |
| Net Funding *** | -92 | -1,878 | -95.1 |
| Receipt of Loans and Financial Charges | 653 | 32 | n.m. |
| Disposal of equity holdings | 18 | 2,281 | -99.2 |
| Dividends | -4,022 | 47 | n.m. |
| Free Net Cash | -1,092 | 2,802 | n.m. |
| Change in Restricted Cash (short and long term) | -205 | -492 | -58.3 |
| Change in Financial Investments (long-term) | -117 | -16 | n.m. |
| Net Cash | -1,414 | 2,294 | n.m. |
*Does not take into account the adjustment related to asset disposal in the net profit line.
**Excludes generation contributions.
***Net funding: debt raised, net of issuance costs.
|
|
FINANCIAL AND OPERATIONAL RESULTS ANALYSIS
8. FINANCIAL PERFORMANCE
8.1. Operational and Financial Results
The table below presents the results by segment for the AXIA Energia Group’s two main businesses—generation and transmission—considering revenue and direct costs. Other costs and expenses, results from equity holdings, financial results, and taxes are analyzed on a consolidated basis.
Table 14 - Income statement 3Q25 (R$ mm)
| Income Statement |
IFRS (a) |
Adjustment (b) |
Regulatory (c)=(a)+(b) |
Non Recurring (d) |
Adjusted Regulatory (e)=(c)+(d) |
Generation (e.1) |
Transmission (e.2) |
Others (e.3) |
Eliminations (e.4) (1) |
| Gross Revenue | 11,725 | -60 | 11,665 | 26 | 11,691 | 6,775 | 5,020 | 171 | -276 |
| (-) Deductions | -1,723 | 0 | -1,723 | 0 | -1,723 | -889 | -834 | 0 | 0 |
| Net Revenue | 10,003 | -60 | 9,943 | 26 | 9,969 | 5,886 | 4,187 | 171 | -276 |
| Energy purchased for resale | -1,714 | 0 | -1,714 | 0 | -1,714 | -1,714 | 0 | 0 | 0 |
| Charges on use of the electricity grid | -1,010 | 153 | -857 | 0 | -857 | -1,132 | 0 | 0 | 276 |
|
Fuel for electricity production (net of CCC) |
-193 | 0 | -193 | 0 | -193 | -193 | 0 | 0 | 0 |
| Other Generation Costs (2) | -31 | 0 | -31 | 0 | -31 | -31 | 0 | 0 | 0 |
| Construction costs | -1,262 | 1,262 | 0 | 0 | 0 | 0 | 0 | 0 | 0 |
| Regulatory remeasurements | 303 | -303 | 0 | 0 | 0 | 0 | 0 | 0 | 0 |
| Contribution Margin | 6,095 | 1,052 | 7,147 | 26 | 7,173 | 2,815 | 4,187 | 171 | 0 |
| PMSO, excluded Other Generation Costs (2) | -1,592 | 4 | -1,588 | 114 | -1,474 | ||||
| Provisions | -236 | 378 | 142 | 65 | 207 | ||||
| Results from asset sale | -7,071 | 249 | -6,821 | 6,821 | 0 | ||||
| Other income and expenses | 43 | 0 | 43 | -43 | 0 | ||||
|
Results, before Equity holdings |
-2,760 | 1,683 | -1,077 | 6,983 | 5,906 | ||||
| Equity holdings | 1,265 | -788 | 476 | 0 | 476 | ||||
| EBITDA | -1,495 | 894 | -601 | 6,983 | 6,382 | ||||
| D&A | -1,156 | -433 | -1,589 | 0 | -1,589 | ||||
| EBIT | -2,651 | 461 | -2,190 | 6,983 | 4,793 | ||||
| Financial Result | -2,571 | -242 | -2,814 | 339 | -2,475 | ||||
| EBT | -5,222 | 219 | -5,003 | 7,322 | 2,318 | ||||
|
Income Tax and Social Contribution |
-226 | -236 | -462 | 53 | -409 | ||||
| Net Income | -5,448 | -17 | -5,465 | 7,375 | 1,909 |
(1) Eliminations: These refer to the portion of transmission system usage charges paid by AXIA Energia's generators to the Company's own transmission companies, which receive them in the form of RAP. For accounting consolidation purposes (Tables 4 and 5), these amounts are eliminated from both transmission revenue and generation usage charges. For management purposes, gross transmission revenue in 3Q25 is R$ 5,020 million, and including the accounting elimination of -R$ 276 million, this translates into accounting revenue of R$ 4,745 million. In the case of generation connection charges costs, for management purposes, the value in 3Q25 is -R$ 1,132 million, and including the accounting elimination of R$ 276 million, this translates into an accounting cost of -R$ 857 million.
(2) The "RHR Hedge Cost" and "Other Operating Costs" lines, related to the generation segment costs, make up the "Other PMSO Costs" line under the accounting view. For a better understanding of the contribution margin by segment, from a management perspective, both lines are allocated in the composition of the contribution margin from generation. In 3Q25, the adjusted regulatory PMSO under the accounting view totaled R$ 1,505 million, composed of R$ 19 million in RHR hedge costs and R$ 13 million in other generation operating costs, both allocated in the margin from generation, and R$ 1,474 million in other cost and expense components for personnel, materials, services and others. At the same time, in 3Q25, the adjusted IFRS PMSO from an accounting perspective totaled R$ 1,509 million, comprised of R$ 19 million in RRH hedging costs and R$ 13 million in other generation operating costs, both allocated to the margin from generation, and R$ 1,478 million in other cost and expense components related to personnel, materials, services, and others.
|
|
Table 15 - Income statement 3Q24 (R$ mm)
| Income Statement |
IFRS (a) |
Adjustment (b) |
Regulatory (c)=(a)+(b) |
Non Recurring (d) |
Adjusted Regulatory (e)=(c)+(d) |
Generation (e.1) |
Transmission (e.2) |
Others (e.3) |
Eliminations (e.4) (1) |
| Gross Revenue | 12,960 | -594 | 12,366 | 0 | 12,366 | 8,001 | 4,575 | 45 | -255 |
| (-) Deductions | -1,918 | 0 | -1,918 | 0 | -1,918 | -1,205 | -715 | 2 | 0 |
| Net Revenue | 11,043 | -594 | 10,449 | 0 | 10,449 | 6,796 | 3,860 | 47 | -255 |
| Energy purchased for resale | -1,452 | -176 | -1,628 | 0 | -1,628 | -1,628 | 0 | 0 | 0 |
| Charges on use of the electricity grid | -1,016 | 147 | -869 | 0 | -869 | -1,123 | 0 | 0 | 255 |
|
Fuel for electricity production (net of CCC) |
-491 | 0 | -491 | 0 | -491 | -491 | 0 | 0 | 0 |
| Other Generation Costs (2) | -100 | 0 | -100 | 0 | -100 | -100 | 0 | 0 | 0 |
| Construction costs | -1,055 | 1,055 | 0 | 0 | 0 | 0 | 0 | 0 | 0 |
| Regulatory remeasurements | 6,130 | -6,130 | 0 | 0 | 0 | 0 | 0 | 0 | 0 |
| Contribution Margin | 13,059 | -5,698 | 7,361 | 0 | 7,361 | 3,454 | 3,860 | 47 | 0 |
| PMSO, excluded Other Generation Costs (2) | -1,905 | -10 | -1,915 | 313 | -1,602 | ||||
| Provisions | 229 | 656 | 885 | -480 | 405 | ||||
| Results from asset sale | 0 | 0 | 0 | 0 | 0 | ||||
| Other income and expenses | 28 | 0 | 29 | -29 | 0 | ||||
|
Results, before Equity holdings |
11,411 | -5,051 | 6,360 | -195 | 6,165 | ||||
| Equity holdings | 749 | -138 | 610 | 0 | 610 | ||||
| EBITDA | 12,159 | -5,189 | 6,970 | -195 | 6,775 | ||||
| D&A | -990 | -500 | -1,490 | 0 | -1,490 | ||||
| EBIT | 11,169 | -5,689 | 5,480 | -195 | 5,285 | ||||
| Financial Result | -2,788 | -126 | -2,915 | 563 | -2,352 | ||||
| EBT | 8,381 | -5,815 | 2,566 | 368 | 2,934 | ||||
|
Income Tax and Social Contribution |
-1,186 | 776 | -410 | -758 | -1,168 | ||||
| Net Income | 7,195 | -5,039 | 2,156 | -390 | 1,766 |
(1) Eliminations: These refer to the portion of transmission system usage charges paid by AXIA Energia's generators to the Company's own transmission companies, which receive them in the form of RAP. For accounting consolidation purposes (Tables 4 and 5), these amounts are eliminated from both transmission revenue and generation usage charges. For management purposes, gross transmission revenue in 3Q24 is R$ 4,575 million, and including the accounting elimination of -R$ 255 million, this translates into accounting revenue of R$ 4,320 million. In the case of generation connection charges costs, for management purposes, the value in 3Q24 is -R$ 1,123 million, and including the accounting elimination of R$ 255 million, this translates into an accounting cost of -R$ 869 million.
(2) The "RHR Hedge Cost" and "Other Operating Costs" lines, related to generation segment costs, make up the "Other PMSO Costs" line under the accounting view. For a better understanding of the contribution margin by segment, from a management perspective, both lines are allocated in the composition of the contribution margin from generation. In 3Q24, the adjusted regulatory PMSO under the accounting view totaled R$ 1,702 million, composed of R$ 91 million in RHR hedge costs and R$ 9 million in other generation operating costs, both allocated in the margin from generation, and R$ 1,602 million in other cost and expense components for personnel, materials, services and others. At the same time, in 3Q24, the adjusted IFRS PMSO from an accounting perspective totaled R$ 1,692 million, comprised of R$ 91 million in RRH hedging costs and R$ 9 million in other generation operating costs, both allocated to the margin from generation, and R$ 1,592 million in other cost and expense components related to personnel, materials, services, and others.
|
|
8.2. Generation Segment
Revenue by Contracting Environment
Recurring regulatory revenue was R$ 6,775 million in 3Q25, R$ 159 million lower than adjusted IFRS generation revenue. This difference reflected the accounting treatment of the portion of revenue from Amazonas Energia related to previously unpaid amounts, following a change in the assessment of receivables. Under IFRS, these amounts were recognized as revenue, while under regulatory accounting—where such recognition had already occurred—there was also a reversal of the provision recorded at that time. The difference, which had been recognized in previous comparison periods, had the same nature at that time.
Two effects on energy sales in the regulated market deserve highlight:
(a) the contractual extension and sale of additional energy in 3Q24, without a counterpart in 3Q25, related to the renegotiation of the hydrological risk of Tucuruí HPP, and
(b) the 84% reduction in revenue from the sale of thermal energy, which in 3Q25 included only the Santa Cruz TPP, whose sale was completed on October 9, 2025.
Regarding non-recurring effects in the quarter, a negative impact of R$ 26 million was recorded, stemming from adjustments to the value of thermal power plant sale transactions. The adjustment relates to obligations and rights with maturities extending beyond the closing of the transactions.
Table 16 - Generation revenue by contracting environment (R$ mm)
| Revenue Generation |
Volume (aMW) (a) |
Price (R$/MWh) (b) |
Regulatory Revenue (c) = (a) x (b) |
||||||
| 3Q25 | % Y/Y | % Q/Q | 3Q25 | % Y/Y | % Q/Q | 3Q25 | % Y/Y | % Q/Q | |
| (+) Regulated Market | 3,609 | -40.1 | -9.7 | 231 | -24.5 | -14.8 | 1,840 | -54.7 | -22.2 |
| Existing | 3,244 | 8.6 | -1.0 | 220 | 4.0 | 0.7 | 1,576 | 13.0 | 0.7 |
| M&As (1) | 120 | 29.6 | 32.3 | 239 | -19.9 | -22.1 | 63 | 3.8 | 4.2 |
| HPP Tucuruí Extension (2) | 0 | n.m. | 0.0 | 0 | 0.0 | 0.0 | 0 | n.m. | 0.0 |
| Thermal | 246 | -77.0 | -61.0 | 369 | -32.0 | -31.3 | 200 | -84.4 | -72.9 |
| (+) Free Market | 7,435 | 3.9 | -2.4 | 165 | 3.9 | 7.3 | 2,707 | 7.9 | 5.9 |
| Existing | 7,342 | 2.6 | -3.6 | 165 | 3.7 | 7.1 | 2,669 | 6.4 | 4.4 |
| M&As (1) | 93 | 0.0 | 0.0 | 185 | 0.0 | 0.0 | 38 | 0.0 | 0.0 |
| (+) O&M (Quotas) | 2,279 | -42.2 | 1.4 | 94 | 11.7 | -9.3 | 474 | -35.4 | -7.1 |
| (+) ST Market (CCEE)(3) | 3,233 | 83.1 | -19.2 | 246 | 37.9 | 41.9 | 1,755 | 152.4 | 15.9 |
| (=) Revenue with energy sold | 16,556 | -12.3 | -7.3 | 185 | -3.4 | 4.1 | 6,775 | -15.3 | -2.5 |
| (+) Other (4) | — | — | — | — | — | — | -26 | n.m. | -76.7 |
| (=) Total Revenue | — | — | — | — | — | — | 6,749 | -15.6 | -1.3 |
| Recurring | — | — | — | — | — | — | 6,775 | -15.3 | -2.4 |
| Non-recurring | — | — | — | — | — | — | -26 | 0.0 | -76.1 |
|
|
| Revenue Generation |
Regulatory Revenue (c) |
Accounting Adjustment (d) (5) |
Accounting Revenue (e) = (c) + (d) |
||||||||
| 3Q25 | 3Q24 | 2Q25 | 3Q25 | 3Q24 | 2Q25 | 3Q25 | 3Q24 | 3Q25x3Q24 | 2Q25 | 3Q25x2Q25 | |
| Regulated Market | 1,840 | 4,065 | 2,365 | 159 | 347 | 15 | 1,998 | 4,412 | -54.7% | 2,381 | -16.1 |
| Free Market | 2,707 | 2,508 | 2,557 | 0 | 0 | 0 | 2,707 | 2,508 | 7.9% | 2,557 | 5.9 |
| O&M (Quotas) | 474 | 734 | 510 | 0 | 0 | 0 | 474 | 734 | -35.4% | 510 | -7.1 |
| Short-term market (3) | 1,755 | 695 | 1,514 | 0 | 0 | 0 | 1,755 | 695 | 152.4% | 1,514 | 15.9 |
| Energy Sales | 6,775 | 8,002 | 6,946 | 159 | 347 | 15 | 6,934 | 8,349 | -16.9% | 6,962 | -0.4 |
| Others (4) | -26 | -1 | -111 | 0 | 0 | 0 | -26 | -1 | n.m. | -111 | -76.7 |
| Total Revenue | 6,749 | 8,001 | 6,836 | 159 | 347 | 15 | 6,908 | 8,348 | -17.2% | 6,851 | 0.8 |
| Recurring | 6,775 | 8,001 | 6,945 | 159 | 347 | 15 | 6,934 | 8,348 | -16.9% | 6,960 | -0.4 |
| Non-recurring | -26 | 0 | -109 | 0 | 0 | 0 | -26 | 0 | 0.0% | -109 | -76.1 |
(1) M&A: Includes revenue from assets in which AXIA Energia’s ownership interest has changed over the past 12 months.
(2) Energy sales related to the 12th and 13th Existing Energy Auctions (LEN) of the Tucuruí HPP, resulting from the extension of the concession term through the signing of a contract in the Regulated Contracting Environment (ACR), following the renegotiation of hydrological risk for electricity generation, as per ANEEL Ruling No. 1,395, dated May 20, 2019. The revenues refer to the period from July 12, 2024, to August 30, 2024. This event, which affected only 3Q24—with no equivalent effect in 3Q25—generated a sold volume of 1,872 MWm, recognized revenue of R$ 1,327 million, and an average price of R$ 321/MWh.
(3) Short-term market: the Brazilian electric energy trading chamber (CCEE).
(4) Main effect: recognition of a negative amount of R$ 26 million, related to adjustments in the value of thermal power plant sale transactions. This effect refers to obligations and rights with maturities extending beyond the completion of the transactions and is treated as a non-recurring adjustment to gross revenue in the period.
(5) The differences between IFRS and regulatory revenues in 2Q25, 3Q24 and 3Q25 refer to energy sold and unpaid for by Amazonas Energia, which was not recognized as revenue under IFRS accounting, but recorded under regulatory accounting, where it was fully provisioned.
Regulatory Margin from Generation
The contribution margin from generation reflects the value added by this segment’s results, considering energy trading and directly related costs, and excluding Personnel, Materials, Services, and Other expenses.
The contribution of generation to the results decreased to R$ 2,815 million in 3Q25 from R$ 3,454 million in 3Q24, which is mainly explained by the sale of the Amazonas thermal power plants in May 2025 and the lower volume of available energy due to the GSF (Generation Scaling Factor), which fell to 64.9% in 3Q25 from 79.1% in 3Q24. In unit terms, the margin by volume of available energy (energy resource) decreased to R$ 91/MWh in 3Q25 from R$ 96/MWh in 3Q24.
It is worth noting that, when excluding the thermal power plant results (Table 18), the unit contribution margin rose to R$ 93/MWh in 3Q25 from R$ 86/MWh in 3Q24, while energy resources fell to 13,819 MWm from 15,368 MWm, reflecting the drop in the GSF mentioned above.
Table 17 - Generation - adjusted contribution margin, regulatory (R$ mm)
| 3Q25 | 3Q24 | % | 2Q25 | % | 9M25 | 9M24 | % | |
| Gross Revenue | 6,775 | 8,001 | -15.3 | 6,945 | -2.4 | 20,744 | 20,676 | 0.3 |
| Taxes | -616 | -911 | -32.4 | -704 | -12.5 | -2,067 | -2,407 | -14.1 |
| Sector charges | -274 | -294 | -7.0 | -380 | -28.0 | -968 | -958 | 1.0 |
| Net Revenue | 5,886 | 6,796 | -13.4 | 5,861 | 0.4 | 17,709 | 17,311 | 2.3 |
| Energy purchased for resale | -1,714 | -1,628 | 5.3 | -1,447 | 18.4 | -4,905 | -3,513 | 39.6 |
| Charges on use of the electricity grid (1) | -1,132 | -1,123 | 0.8 | -1,082 | 4.7 | -3,337 | -3,257 | 2.4 |
| Fuel for electricity production (net of CCC (2)) | -193 | -491 | -60.6 | -222 | -13.0 | -975 | -1,461 | -33.2 |
| Other Generation Costs | -31 | -100 | -68.5 | -38 | -17.1 | -106 | -133 | -20.4 |
| GSF Insurance (3) | -19 | -91 | -79.3 | -17 | 11.7 | -52 | -112 | -53.5 |
| Others (4) | -13 | -9 | 40.1 | -21 | -40.1 | -54 | -21 | n.m. |
| Contribution Margin | 2,815 | 3,454 | -18.5 | 3,072 | -8.4 | 8,386 | 8,947 | -6.3 |
| Resources (MWm) (5) | 14,065 | 16,230 | -13.3 | 15,786 | -10.9 | 16,228 | 17,378 | -6.6 |
| Unit Margin (R$/MWh) | 91 | 96 | -6.0 | 89 | 1.7 | 79 | 78 | 0.7 |
|
|
Table 18 - Generation, ex thermal power plants - adjusted contribution margin, regulatory (R$ mm)
| 3Q25 | 3Q24 | % | 2Q25 | % | 9M25 | 9M24 | % | |
| Gross Revenue | 6,575 | 6,720 | -2.1 | 6,205 | 6.0 | 18,512 | 16,943 | 9.3 |
| Taxes | -594 | -692 | -14.0 | -655 | -9.2 | -1,928 | -1,807 | 6.7 |
| Sector charges | -274 | -294 | -7.0 | -380 | -28.0 | -968 | -933 | 3.7 |
| Net Revenue | 5,707 | 5,734 | -0.5 | 5,170 | 10.4 | 15,616 | 14,203 | 10.0 |
| Energy purchased for resale | -1,703 | -1,628 | 4.6 | -1,300 | 31.0 | -4,430 | -3,064 | 44.6 |
| Charges on use of the electricity grid (1) | -1,125 | -1,075 | 4.7 | -995 | 13.1 | -3,112 | -3,156 | -1.4 |
| Fuel for electricity production (net of CCC (2)) | 0 | 0 | 0.0 | 0 | 0.0 | 0 | 0 | 0.0 |
| Other Generation Costs | -31 | -100 | -68.5 | -38 | -17.1 | -106 | -133 | -20.4 |
| GSF Insurance (3) | -19 | -91 | -79.3 | -17 | 11.7 | -52 | -112 | -53.5 |
| Others (4) | -13 | -9 | 40.1 | -21 | -40.1 | -54 | -21 | 153.4 |
| Contribution Margin | 2,847 | 2,931 | -2.9 | 2,836 | 0.4 | 7,968 | 7,849 | 1.5 |
| Resources (MWm) (5) | 13,819 | 15,368 | -10.1 | 15,310 | -9.7 | 15,755 | 16,690 | -5.6 |
| Unit Margin (R$/MWh) | 93 | 86 | 8.0 | 85 | 10.0 | 77 | 72 | 7.9 |
(1) Does not consider the accounting elimination effect of charges paid to the Company's own transmission segment.
(2) CCC: Conta de Consumo de Combustíveis, or Fuel Consumption Account, is responsible for management of payments
made by distribution and transmission companies to subsidize the costs of generators serving Isolated Systems.
(3) RHR: Renegotiation of Hydrological Risk
(4) Others: association contributions (CCEE and ONS) and other costs.
(5) Includes own resources and structural purchases, taking into account contracts with a supply duration longer than 12 months.
Table 19 - Generation - ajusted contribution margin, regulatory - by contracting environment (R$ mm)
| 3Q25 | 3Q24 | 2Q25 | |||||||
|
Total (a)=(b)+(c) +(d)+(e) |
Thermal (b) |
Quota (c) |
ACR (d) |
ACL + MCP (e) |
ACL + MCP |
% Y/Y | ACL + MCP |
% Q/Q | |
| Gross Revenue | 6,749 | 174 | 474 | 1,640 | 4,462 | 3,202 | 39.3 | 4,051 | 10.1 |
| (-) Adjustment | 26 | 26 | 0 | 0 | 0 | 0 | 0.0 | 0 | 0.0 |
| Adjusted Gross Revenue | 6,775 | 200 | 474 | 1,640 | 4,462 | 3,202 | 39.3 | 4,051 | 10.1 |
| (-) Taxes | -616 | -21 | -43 | -148 | -403 | -330 | 22.4 | -429 | -5.9 |
| (-) Sector Charges | -274 | 0 | -40 | -71 | -163 | -125 | 30.6 | -234 | -30.5 |
| (-) Energy purchased for resale | -1,714 | -11 | 0 | 0 | -1,703 | -1,628 | 4.6 | -1,300 | 31.0 |
| (-) Charges on use of the electricity grid (1) | -1,132 | -7 | -201 | -297 | -628 | -415 | 51.2 | -595 | 5.4 |
| (-) Fuel for electricity production (2) | -193 | -193 | 0 | 0 | 0 | 0 | 0.0 | 0 | 0.0 |
| (-) Other Generation Costs | -31 | 0 | -1 | -22 | -9 | -4 | 99.5 | -14 | -37.9 |
| GSF Insurance (3) | -19 | 0 | 0 | -19 | 0 | 0 | 0.0 | 0 | 0.0 |
| Others (4) | -13 | 0 | -1 | -3 | -9 | -4 | 99.5 | -14 | -37.9 |
| Contribution Margin (f) | 2,815 | -32 | 189 | 1,102 | 1,556 | 701 | n.m. | 1,478 | 5.3 |
| Own Resources (MWm) | 12,999 | 15,203 | -14.5 | 14,820 | -12.3 | ||||
| (-) Quotas | -2,279 | -3,474 | -34.4 | -2,248 | 1.4 | ||||
| (-) ACR (includes thermal plants) | -3,609 | -6,194 | -41.7 | -3,993 | -9.6 | ||||
| (+) Structural Purchases | 1,066 | 1,028 | 3.8 | 966 | 10.4 | ||||
| Resources (MWm) (5) | 8,177 | 6,562 | 24.6 | 9,545 | -14.3 | ||||
| Resources (MWh thousand) (4) (g) | 18,055 | 14,490 | 24.6 | 20,845 | -13.4 | ||||
| R$/MWh (f)/(g) | 86 | 48 | 78.3 | 71 | 21.5 | ||||
(1) Does not consider the accounting elimination effect of charges paid to the Company's own transmission segment.
(2) Net of CCC: Conta de Consumo de Combustíveis, or Fuel Consumption Account, is responsible for management of payments
made by distribution and transmission companies to subsidize the costs of generators serving Isolated Systems.
(3) RHR: Renegotiation of Hydrological Risk
(4) Others: association contributions (CCEE and ONS) and other costs.
(5) Includes own resources and structural purchases, considering contracts with a supply term longer than 12 months.
|
|
The contribution margin of energy traded in the Free Contracting Market and settled in the Short Term Market increased to R$ 86/MWh in 3Q25 from R$ 48/MWh in 3Q24, considering the resources available for allocation in both environments.
Available resources increased due to the combined effect of volume released by the gradual phasing out of legacy contracts (decotization) and absence, this year, of the additional sale related to the Tucuruí HPP contract extension. These factors more than offset the lower GSF, which fell to 64.9% in 3Q25 from 79.1% in 3Q24.
The contribution in financial volume increased to R$ 1,556 million in 3Q25 from R$ 701 million in 3Q24, with higher revenue more than offsetting the increased expenses related to energy purchases, as a result of the energy trading strategy in the quarter.
8.3. Transmission Segment
Regulatory Margin from Transmission
Net transmission revenue comprises gross revenue and its respective deductions and, for management purposes, represents the contribution margin of this segment.
Gross transmission revenue is based on the Allowed Annual Revenue (RAP) and the Adjustment Portion (PA) approved by ANEEL for the current tariff cycle, 2025/2026 (from July 1, 2025, to June 30, 2026). It is worth noting that the PA of the current tariff cycle is a contractual mechanism established by the regulator to compensate for any deficit or surplus between the revenue billed and the RAP approved in the previous cycle.
In addition, gross revenue includes:
(a) taxes and charges that are not part of the RAP (gross-up);
(b) discounts for unavailability;
(c) additional RAP related to new facilities that entered into operation after the approval; and
(d) pass-through items, which are offset in the following cycle through the PA.
Accounting eliminations related to transmission system usage charges paid by AXIA Energia’s generation companies to the Group’s own transmission subsidiaries are not considered. Deductions include taxes (PIS/COFINS, ICMS, and ISS) and sector charges (CDE, PROINFA, TFSEE, R&D, and RGR).
Net regulatory transmission revenue was R$ 4,187 million, up 8.5% YoY, mainly reflecting the lower PA in the current tariff cycle, primarily explained by:
(a) the repositioning of RBSE's financial component;
(b) the review of resources linked to the 2023 Periodic Tariff Review (RTP); and
(c) the addition of RAP from reinforcement and improvement projects authorized by the regulator.
Transmission auction No. 4/2025: winning bid of lots 6A, 6B, 7A and 7B, with RAP of R$ 138.74 million and CAPEX projected by ANEEL of R$ 1.63 billion, attesting to AXIA Energia's competitiveness and efficiency.
Further details and explanations are available in the "Modeling Support - Transmission" spreadsheet, located in the Results Center on the Company's Investor Relations website, including an analysis of the transmission revenue and a breakdown of the Adjustment Portion (PA).
|
|
Table 20 - Transmission - adjusted contribution margin, regulatory (R$ mm)
| 3Q25 | 3Q24 | % | 2Q25 | % | 9M25 | 9M24 | % | |
| RAP (1) | 4,134 | 4,246 | -2.6 | 4,246 | -2.6 | 12,626 | 13,033 | -3.1 |
| PA (1) | -117 | -382 | -69.5 | -382 | -69.5 | -881 | -524 | 68.2 |
| Approved RAP and Adjustment Portion | 4,018 | 3,864 | 4.0 | 3,864 | 4.0 | 11,745 | 12,509 | -6.1 |
| Taxes and Sector Charges (2) | 685 | 551 | 24.3 | 585 | 17.0 | 1,858 | 1,739 | 6.8 |
| Unavailability Discount (3) | -51 | -60 | -15.3 | -64 | -21.5 | -181 | -184 | -1.5 |
| RAP Addition: new facilities | 9 | 4 | n.m. | 40 | -77.1 | 80 | 57 | 41.1 |
| Pass through (4) | 176 | 71 | n.m. | 157 | 11.9 | 476 | 416 | 14.5 |
| Other mismatches (5) | 184 | 146 | 25.9 | 179 | 2.8 | 499 | 565 | -11.6 |
| Gross Revenue (6) | 5,020 | 4,575 | 9.7 | 4,760 | 5.5 | 14,477 | 15,102 | -4.1 |
| Tributes | -479 | -423 | 13.1 | -457 | 4.8 | -1,341 | -1,373 | -2.3 |
| Sector Charges (7) | -355 | -292 | 21.8 | -332 | 7.0 | -1,025 | -918 | 11.7 |
| Net Revenue | 4,187 | 3,860 | 8.5 | 3,972 | 5.4 | 12,111 | 12,810 | -5.5 |
(1) RAP and PA: considers 1/4 of the amounts approved for the tariff cycle in effect during the quarter, and proportional amounts accumulated throughout the year.
(2) Considers (a) PIS/COFINS and (b) CDE/Proinfa. Both are pass-through costs, and AXIA Energia collects these amounts from consumers.
(3) Discount associated with Variable Portion (PV), suspension of Base Payment (PB)
due to unavailability, and pending items in Release Terms (TL).
(4) Items for which transmission companies act only as collection agents, and which will be deducted in PA in the following tariff cycle.
This involves differences between the approved RAP and billing by ONS related to cost-sharing of advances, as well
as the receipt of CDE Fund resources (via CCEE) for amounts not collected due to discounts applied on tariffs.
(5) Other mismatches in relation to the approved RAP for the current tariff cycle, such as (a) mismatch
between Transmission and Distribution Annual Adjustments, (b) complementary AVCs associated with the termination of
Transmission System Usage Agreements (CUST) by generators, etc.
(6) Does not consider the accounting elimination effect of charges paid to the Company's own transmission segment.
Eliminations: transactions that occur between companies of the same group, i.e., AXIA Energia companies.
These refer to transmission system usage charges paid by AXIA Energia generation companies to AXIA Energia transmission companies,
which receive them in the form of RAP. For consolidation purposes, these amounts are eliminated from
transmission revenue and generation usage cost.
(7) Sector Charges includes: RGR, R&D, TFSEE, CDE, and Proinfa.
8.4. Operating Costs and Expenses - IFRS
Table 21 - Operating costs and expenses (R$ mm)
| 3Q25 | 3Q24 | % | 2Q25 | % | 9M25 | 9M24 | % | |
| Energy purchased for resale | 1,714 | 1,452 | 18.0 | 1,356 | 26.5 | 4,630 | 2,986 | 55.0 |
| Charges on use of the electricity grid | 1,010 | 1,016 | -0.6 | 955 | 5.8 | 2,961 | 2,986 | -0.9 |
| Fuel for electricity production | 193 | 491 | -60.6 | 222 | -13.0 | 975 | 1,461 | -33.2 |
| Construction | 1,262 | 1,055 | 19.7 | 1,036 | 21.9 | 3,043 | 2,483 | 22.6 |
| Personnel, Material, Services and Others | 1,623 | 2,005 | -19.0 | 1,631 | -0.5 | 4,912 | 5,261 | -6.6 |
| Depreciation and Amortization | 1,156 | 990 | 16.7 | 1,131 | 2.1 | 3,399 | 2,955 | 15.0 |
| Operating provisions | 236 | -229 | n.m. | 133 | 77.1 | 495 | -160 | n.m. |
| Result from asset sale | 7,071 | 0 | n.m. | 105 | n.m. | 7,176 | 115 | n.m. |
| Regulatory remeasurements | -303 | -6,130 | -95.1 | 3,433 | n.m. | 4,082 | -6,130 | n.m. |
| Costs and expenses | 13,961 | 650 | n.m. | 10,002 | 39.6 | 31,674 | 11,958 | n.m. |
| Non-recurring events | ||||||||
| (-) Non-recurring PMSO events | -114 | -313 | -63.6 | -228 | -50.0 | -534 | -516 | 3.3 |
| (-) Non-recurring provisions | -218 | 480 | n.m. | 43 | n.m. | -215 | 994 | n.m. |
| (-) Result from asset sale | -7,071 | 0 | n.m. | -105 | n.m. | -7,176 | -115 | n.m. |
| (-) Regulatory remeasurements | 0 | 0 | 0.0 | -3,433 | n.m. | -3,433 | 0 | 0.0 |
| Adjusted Costs and Expenses | 6,559 | 817 | n.m. | 6,279 | 4.5 | 20,316 | 12,320 | 64.9 |
Energy purchased for resale, charges on the use of electricity grid, fuel for electricity production, and construction costs comprise the generation and transmission margins. The explanation of the remaining lines, including PMSO (Personnel, Materials, Services, and Other), is provided below.
|
|
Personnel, Material, Services and Others
| ▪ | Personnel: adjusted balance of R$ 750 million in 3Q25, down 17% YoY, with the main effects being: |
| ▪ | R$ 152 million in savings driven by the Voluntary Dismissal Plans (VDPs), broken down as follows: |
(a) R$ 118 million from workforce reduction,
(b) R$ 64 million reflecting the capitalization of personnel costs, more aligned with the increased level of investments, and
(c) R$ 34 million from efficiency gains driven by team restructuring, new hiring models, and increased process centralization.
These effects were partially offset by new hires, which increased expenses by R$ 37 million.
| ▪ | Non-recurring effects: R$ 82 million, being: |
(a) R$ 32 million with VDPs,
(b) R$ 29 million related to FGTS fine linked to terminations, and
(c) R$ 21 million with severance costs.
| ▪ | Material: adjusted balance of R$ 63 million in 3Q25, in line with the R$ 64 million recorded in 3Q24. |
| ▪ | There were no non-recurring effects in the quarter. |
| ▪ | Services: adjusted balance of R$ 533 million in 3Q25, down R$ 36 million YoY, driven by optimization and savings with travel, insurance, and consulting services. |
| ▪ | Non-recurring effects: R$ 15 million, being R$ 14 million related to success fee paid to legal defense as part of the contingency reduction strategy. |
| ▪ | Outros: adjusted balance of R$ 163 million in 3Q25, up R$ 6 million YoY. |
| ▪ | Non-recurring effects: R$ 18 million associated with commitments under the self-managed health plan, which was replaced by a plan managed by a specialized market operator. |
For more details on PMSO, including a breakdown by company and by nature of other costs and expenses, please refer to Appendix 2 - PMSO Breakdown.
|
|
Table 22 - Detailed IFRS PMSO (R$ mm)
| 3Q25 | 3Q24 | % | 2Q25 | % | 9M25 | 9M24 | % | |
| Personnel | 800 | 902 | -11.3 | 899 | -11.0 | 2,555 | 2,771 | -7.8 |
| VDP | 32 | 2 | n.m. | 98 | -67.5 | 226 | 45 | n.m. |
| Material | 63 | 64 | -1 | 41.9 | 51 | 157.2 | 147 | 7 |
| Services | 548 | 569 | -3.6 | 456 | 20.1 | 1,442 | 1,464 | -1.6 |
| Others | 180 | 468 | -61.5 | 136 | 32.4 | 533 | 833 | -36.0 |
| other generation costs | 31 | 100 | -68.5 | 38 | -17.1 | 106 | 133 | -20.4 |
| other expenses | 149 | 368 | -59.6 | 98 | 51.5 | 427 | 700 | -39.0 |
| PMSO (a) | 1,623 | 2,005 | -19.0 | 1,631 | -0.5 | 4,912 | 5,261 | -6.6 |
| Personnel | -50 | 0 | 0.0 | -115 | -56.8 | -218 | 0 | 0.0 |
| VDP | -32 | -2 | n.m. | -98 | -67.5 | -226 | -45 | n.m. |
| Material | 0 | 0 | 0.0 | 0 | 0.0 | 0 | 0 | 0.0 |
| Services | -15 | 0 | 0 | -15 | -1.6 | -72 | -42.2 | 70 |
| Others | -18 | -311 | -94.4 | 0 | 0.0 | -18 | -429 | -95.9 |
| other generation costs | 0 | 0 | 0.0 | 0 | 0.0 | 0 | 0 | 0.0 |
| other expenses | -18 | -311 | -94.4 | 0 | 0.0 | -18 | -429 | -95.9 |
| Non recurring (b) | -114 | -313 | -63.6 | -228 | -50.0 | -534 | -516 | 3.3 |
| Personnel | 750 | 902 | -16.9 | 784 | -4.3 | 2,336 | 2,771 | -15.7 |
| VDP | 0 | 0 | 0.0 | 0 | 0.0 | 0 | 0 | 0.0 |
| Material | 63 | 64 | -1.5 | 42 | 51.3 | 157 | 147 | 6.6 |
| Services | 533 | 569 | -6.3 | 441 | 20.9 | 1,370 | 1,422 | -3.7 |
| Others | 163 | 157 | 3.9 | 136 | 19.5 | 516 | 404 | 27.6 |
| other generation costs | 31 | 100 | -68.5 | 38 | -17.1 | 106 | 133 | -20.4 |
| other expenses | 131 | 57 | n.m. | 98 | 33.6 | 410 | 271 | 51.2 |
| PMSO adjusted (c) = (a) + (b) | 1,509 | 1,692 | -10.8 | 1,403 | 7.6 | 4,379 | 4,744 | -7.7 |
| PMSO excluding TPP * (c.1) | 1,503 | 1,657 | -9.3 | 1,374 | 9.4 | 4,307 | 4,641 | -7.2 |
| expenses | 1,471 | 1,558 | -5.5 | 1,336 | 10.2 | 4,201 | 4,508 | -6.8 |
| costs: generation segment ** | 31 | 100 | -68.5 | 38 | -17.1 | 106 | 133 | -20.4 |
| Thermal Power Plants (c.2) | 6 | 35 | -81.6 | 29 | -78.3 | 72 | 103 | -29.8 |
* TPP: Thermal Power Plants. PMSO of thermal plants sold to Âmbar.For 2Q25, considers amounts for the Santa Cruz Thermal Power Plant for the full quarter.
For the other plants, whose sale was completed on May 15, 2025, amounts are considered up to that date.
** Other operating costs, related to generation operations: GSF insurance, association contributions, and other items.
Regulatory Remeasurement and Asset Disposal Result
| ▪ | Regulatory Remeasurement - Transmission Contracts: Revenue of R$ 303 million in 3Q25, reflecting adjustments in the flow of RAP receivables from transmission concession contracts, resulting from the annual readjustment process for the 2025/2026 cycle, which began in July 2025. |
| ▪ | Asset disposal result: R$ 7,071 million expense in 3Q25, mainly reflecting non-cash adjustments due to negotiations concluded during the period, notably: |
| ▪ | -R$ 7,290 million: Sale of the entire stake in Eletronuclear to J&F; |
| ▪ | +R$ 234 million: Asset uncrossing with Copel, with the acquisition of the Colíder HPP in exchange for a stake in the Jayme Canet Junior HPP (Mauá) and in the Mata de Santa Genebra transmission plant; |
| ▪ | -R$ 25 million: Sale of the entire stake in EMAE to Sabesp; |
| ▪ | +R$ 11 million: Completion of the sale of the Amazonas thermal plants to Âmbar Energia. |
|
|
Operating Provisions
Table 23 - Operating provisions - IFRS (R$ mm)
| 3Q25 | 3Q24 | % | 2Q25 | % | 9M25 | 9M24 | % | |
| Operating Provisions / Reversals | ||||||||
| Provision/Reversal for Litigation | -419 | 418 | n.m. | 22 | n.m. | -505 | 646 | n.m. |
| Estimated losses on investments | 12 | 11 | 1.3 | 21 | -45.9 | 45 | -18 | n.m. |
| Measurement at fair value of assets held for sale | 0 | -30 | n.m. | 0 | 0.0 | 0 | 137 | n.m. |
| Provision for the Implementation of Lawsuits - Compulsory Loan | -15 | 3 | n.m. | -20 | -23.5 | -10 | -47 | -79.3 |
| ECL - Loans and financing | 176 | -6 | n.m. | -10 | n.m. | 166 | -10 | n.m. |
| ECL - Consumers and resellers | -35 | -59 | -40.3 | -79 | -55.1 | -133 | -235 | -43.2 |
| ECL - Other credits | 175 | -10 | n.m. | -26 | n.m. | 142 | -125 | n.m. |
| Onerous contracts | 29 | 52 | -44.1 | 30 | -0.7 | 88 | 136 | -35.3 |
| Results of actuarial reports | -95 | -128 | -26.0 | -92 | 3.4 | -279 | -384 | -27.2 |
| Other * | -63 | -23 | n.m. | 20 | n.m. | -10 | 60 | n.m. |
| Operating Provisions / Reversals | -236 | 229 | n.m. | -133 | 77.1 | -495 | 160 | n.m. |
| Non-recurring items / Adjustments | 218 | -480 | n.m. | -43 | n.m. | 215 | -994 | n.m. |
| Provision for Litigation | 419 | -418 | n.m. | -22 | n.m. | 505 | -646 | n.m. |
| Measurement at fair value of assets held for sale | 0 | 0 | 0.0 | 0 | 0.0 | 0 | -293 | n.m. |
| Estimated losses on investments | -12 | -11 | 1.3 | -21 | -45.9 | -45 | 18 | n.m. |
| Provision for the Implementation of Lawsuits - Compulsory Loan | 15 | -3 | n.m. | 20 | -23.5 | 10 | 47 | -79.3 |
| ECL - Loans and financing | -176 | 6 | n.m. | 10 | n.m. | -166 | 10 | n.m. |
| Onerous contracts | -29 | -52 | -44.1 | -30 | -0.7 | -88 | -136 | -35.3 |
| Impairment | 0 | 0 | n.m. | 0 | 0.0 | 0 | 6 | n.m. |
| Restitution RGR | 0 | 0 | 0.0 | 0 | 0.0 | 0 | 0 | 0.0 |
| Adjusted Provisions/Reversals | -18 | -251 | -92.7 | -177 | -89.7 | -281 | -834 | -66.4 |
Positive values in the table above indicate reversal of provision.
* Primarily Includes impairment and RGR refunds.
| ▪ | Provision for litigation: provision of R$ 419 million in 3Q25 compared to a reversal of R$ 418 million in 3Q24. The R$ 837 million variation was explained by the recording of provisions in civil, tax, labor, regulatory, environmental, land, and other proceedings, partially offset by the reversal of provisions in compulsory loan proceedings. |
| ▪ | Compulsory Loan: Contributed a net reversal of R$ 300 million in 3Q25, compared to the net reversal of R$ 374 million in 3Q24, reflecting agreements signed and favorable decisions. It is worth noting that, unlike other provisions, the monetary restatement related to the compulsory loan provision was recognized under financial results. |
| ▪ | Other events: Contributed a provision of R$ 566 million in 3Q25, compared to a reversal of R$ 324 million in 3Q24, an R$ 890 million variation in expenses in the period, mainly explained by: |
(a) provisions recognized in 3Q25 related to cases of various natures, including civil, labor, and regulatory matters; and
(b) monetary restatement, which contributed an expense of R$ 153 million in 3Q25, compared to R$ 270 million in 3Q24.
| ▪ | Fair value measurement of asset available for sale: no recognitions in 3Q25, after a R$ 30 million provision was recorded in 3Q24. |
| ▪ | Share conversion process – Compulsory Loan: R$ 15 million provision in 3Q25, compared to R$ 3 million reversal in 3Q24. This result reflects the mark-to-market effect on the average price of the Company’s class B preferred shares over the past 12 months, related to amounts recorded in the balance sheet and linked to those shares. |
|
|
| ▪ | Expected Credit Losses (ECL) - Loans and Financings: the R$ 176 million reversal included R$ 140 million related to provisions for guarantees granted by AXIA Energia in connection with loans contracted by Amazonas Energia. |
| ▪ | Expected Credit Losses (ECL) - Other Receivables: R$ 175 million reversal in 3Q25 compared to a R$ 10 million provision in 3Q24. In 3Q25, R$ 170 million in debts owed by Amazonas Energia to AXIA Energia were reversed following the release of judicial deposits previously made by the counterparty. |
| ▪ | Onerous Contracts: R$ 29 million reversal in 3Q25 compared to a R$ 52 million reversal in 3Q24, reflecting changes in the value of contracts in the period. |
| ▪ | Results of actuarial reports: R$ 95 million provision in 3Q25 compared to a R$ 128 million provision in 3Q24 associated with interest expenses and current service costs, as outlined in the 2024 reports, due to a reduction in the underlying liability base. |
8.5. Equity Holdings - IFRS
The main highlights of equity income were as follows:
| ▪ | Eletronuclear: 3Q25 income was not recognized following the signing of the agreement for the sale of the company’s stake. |
| ▪ | Transnorte Energia (TNE): The increase in 3Q25 results reflected the positive effect of the regulatory remeasurement arising from the agreement between ANEEL and TNE to pursue the economic and financial rebalancing of the concession. The agreement set a maximum RAP value of R$ 592 million (as of July 2025) and extended the concession term from 17 to 27 years. Under the IFRS accounting perspective, this led to a review that increased the value of the contractual asset, resulting in a positive impact from the regulatory remeasurement. |
| ▪ | Equatorial Maranhão: Recognition of both 3Q25 and 2Q25 results. |
Table 24 - Equity holdings (R$ mm)
| 3Q25 | 3Q24 | % | 2Q25 | % | 9M25 | 9M24 | % | |
| Highlights Affiliates (a) | 395 | 620 | -36.3 | -45 | -972.7 | 626 | 1,620 | -61.3 |
| Eletronuclear (1) | 0 | 237 | n.m. | -147 | n.m. | -84 | 540 | -115.5 |
| ISA Energia | 191 | 231 | -17.4 | 25 | 673.3 | 350 | 649 | -46.1 |
| Equatorial Maranhão | 149 | 71 | 109.7 | 0 | n.m. | 149 | 149 | 0.0 |
| Other Affiliates | 55 | 81 | -32.2 | 78 | -29.3 | 211 | 282 | -25.2 |
| Highlights SPEs (b) (2) | 751 | 37 | n.m. | -148 | -608.6 | 651 | 204 | 218.7 |
| IE Madeira | 55 | 11 | 398.5 | 31 | 75.7 | 170 | 128 | 32.9 |
| Belo Monte Transmissora de Energia S.A. - BMTE | 95 | 50 | 90.6 | 27 | 253.9 | 178 | 157 | 13.5 |
| Transnorte Energia (TNE) | 649 | 62 | 949.3 | -128 | -609.3 | 572 | 97 | 490.9 |
| Chapecoense | 59 | 47 | 26.0 | 55 | 7.3 | 157 | 129 | 22.2 |
| ESBR Jirau | 57 | 14 | 308.9 | 22 | 161.4 | 118 | 55 | 115.4 |
| IE Garanhuns | 15 | 5 | 191.3 | 23 | -37.9 | 53 | 45 | 17.2 |
| Norte Energia | -179 | -152 | 17.9 | -179 | 0.2 | -598 | -406 | 47.3 |
| Other Holdings (c) (3) | 119 | 92 | 29.7 | 67 | 77.9 | 230 | 279 | -17.5 |
| Total Equity Holdings (a) + (b) + (c) | 1,265 | 749 | 69.0 | -126 | n.m. | 1,507 | 2,103 | -28.4 |
| Non-recurring events | ||||||||
| (-) Regulatory remeasurements, ISA Energia | 0 | 0 | 0.0 | 116 | n.m. | 116 | 0 | 0.0 |
| Adjusted Equity Holding | 1,265 | 749 | 69.0 | -10 | n.m. | 1,623 | 2,103 | -22.8 |
(1) 3Q25 income was not recognized following the signing of the agreement for the sale of the company’s stake.
(2) SPE: special purpose entities.
(3) Includes movements from amounts recognized in the balance sheet of affiliated companies measured at fair value/cost.
|
|
8.6. Financial Result - IFRS
Table 25 - Financial result (R$ mm)
| 3Q25 | 3Q24 | % | 2Q25 | % | 9M25 | 9M24 | % | |
| Financial Income | 1,272 | 815 | 56.0 | 1,069 | 19.0 | 3,414 | 2,181 | 56.5 |
| Interest income, fines, commissions and fees | 38 | 45 | -16.1 | -13 | n.m. | 61 | 117 | -47.5 |
| Income from financial investments | 1,228 | 835 | 47.1 | 1,101 | 11.5 | 3,387 | 1,955 | 73.2 |
| Late payment surcharge on electricity | 16 | 18 | -9.0 | 36 | -54.4 | 85 | 96 | -12.3 |
| Other financial income | 68 | -24 | n.m. | 24 | n.m. | 121 | 178 | -32.0 |
| (-) Taxes on financial income | -79 | -59 | 32.9 | -79 | -1.0 | -240 | -165 | 45.4 |
| Financial Expenses | -2,269 | -2,583 | -12.2 | -2,380 | -4.7 | -7,112 | -7,551 | -5.8 |
| Debt Charges | -1,444 | -1,437 | 0.5 | -1,528 | -5.5 | -4,613 | -4,561 | 1.1 |
| Loans, financing and suppliers | -1,439 | -1,306 | 10.2 | -1,459 | -1.3 | -4,402 | -4,162 | 5.8 |
| Leasing | -5 | -131 | -96.3 | -70 | -93.0 | -211 | -399 | -47.2 |
| CDE obligation charges (1) | -665 | -622 | 7.0 | -661 | 0.6 | -1,988 | -1,844 | 7.8 |
| River basin revitalization charges (1) | -80 | -85 | -5.6 | -79 | 2.1 | -237 | -253 | -6.1 |
| Financial discount for early payment - ENBpar | 0 | 0 | 0.0 | 0 | 0.0 | 0 | 0 | 0.0 |
| Other financial expenses | -79 | -440 | -82.1 | -111 | -29.3 | -274 | -893 | -69.3 |
| Net Financial Items | -1,575 | -1,020 | 54.4 | -1,244 | 26.6 | -4,921 | -3,328 | 47.9 |
| Monetary changes | -196 | 0 | n.m. | -264 | -25.8 | -744 | -536 | 38.7 |
| Compulsory Loan | -186 | -214 | -13.0 | -178 | 4.9 | -539 | -593 | -9.1 |
| Others | -9 | 215 | n.m. | -86 | -89.0 | -205 | 57 | n.m. |
| Exchange rate variations | 6 | 25 | -77.3 | -12 | n.m. | -1 | 27 | n.m. |
| Change in fair value of hedged debt net of derivative | -1,056 | -729 | 44.8 | -587 | 79.8 | -2,609 | -1,292 | n.m. |
| Monetary updates - CDE (1) | -270 | -236 | 14.5 | -316 | -14.5 | -1,318 | -1,096 | 20.2 |
| Monetary updates - river basins (1) | -42 | -43 | -2.0 | -52 | -19.6 | -207 | -196 | 5.5 |
| Change in derivative financial instrument not linked to debt protection | -17 | -38 | -55.5 | -14 | 22.0 | -41 | -234 | -82.5 |
| Financial Results | -2,571 | -2,788 | -7.8 | -2,555 | 0.6 | -8,620 | -8,698 | -0.9 |
| Adjustments | ||||||||
| Monetary restatement - Compulsory Loan | 186 | 214 | -13.0 | 178 | 4.9 | 539 | 593 | -9.1 |
| Write-off of judicial deposits due to the conciliation project | 0 | 100 | n.m. | 0 | 0.0 | 0 | 100 | n.m. |
| Adjustment of the correction rate for judicial deposits | 0 | 249 | n.m. | 0 | 0.0 | 0 | 249 | n.m. |
| Adjusted Financial Result | -2,385 | -2,225 | 7.2 | -2,377 | 0.3 | -8,081 | -7,756 | 4.2 |
(1) These obligations were established by Law 14,182/21 (Privatization of Eletrobras, now AXIA Energia) as a condition for obtaining new concession grants for power generation for an additional 30 years. The charges were calculated based on data published in CNPE Resolution 015/2021, considering (a) the present value of the obligation; (b) the future payment flow; and (c) the payment term.
The main variations this quarter were:
| ▪ | Financial Income: went up to R$ 1,272 million in 3Q25 from R$ 815 million in 3Q24, mainly due to the higher CDI rate in the period — 14.9% in 3Q25 versus 10.4% in 3Q24 — combined with a 6% increase in average cash. |
| ▪ | Debt charges: R$ 1,444 million expense in 3Q25, in line with 3Q24. Interest expenses on loans and financing increased, mainly due to the higher Selic rate in the period, combined with a 3% rise in the average level of gross debt. Part of this increase was offset by a reduction in leasing charges due to the termination of power purchase agreements—treated as leases—for thermal plants located in the state of Amazonas in May 2025. |
| ▪ | Monetary restatements: R$ 196 million expense in 3Q25, compared to zero in 3Q24. This line is comprised by the monetary restatements of two main components: |
|
|
| ▪ | Lawsuit update for compulsory loans: R$ 186 million expense in 3Q25 from R$ 214 million in 3Q24, reflecting the reduction in the provision inventory, which offset the higher Selic rate. |
| ▪ | Other lines: R$ 9 million expense in 3Q25 compared to a R$ 215 million revenue in 3Q24, mainly due to events that occurred in 2024 with no corresponding effects in 2025, such as the reduction in interest income on dividends due related to the reclassification to Other Revenues, the recognition of monetary restatement revenue, and the write-off of judicial deposits. |
| ▪ | Other financial expenses: R$ 79 million in 3Q25, compared to R$ 440 million in 3Q24. The reduction was mainly explained by the write-off of judicial deposits of R$ 371 million in 3Q24, with no corresponding entry in 3Q25. |
8.7. Current and Deferred Taxes - IFRS
There were no events worth highlighting in the tax line in 3Q25.
| ▪ | Non-recurring effects: R$ 53 million related to current tax expense recognized upon completion of the transaction involving the sale of the Mauá HPP. |
Table 26 - Income tax and social contribution (R$ mm)
| 3Q25 | 3Q24 | % | 2Q25 | % | 9M25 | 9M24 | % | |
| Current income tax and social contribution | -425 | -229 | 85.7 | -254 | 67.5 | -757 | -723 | 4.8 |
| Deferred income tax and social contribution | 198 | (957) | n.m. | 1356 | -85.4 | 1,569 | 435 | n.m. |
| Income tax and social contribution total | -226 | -1,186 | -80.9 | 1102 | n.m. | 811 | -288 | n.m. |
| Adjustments | ||||||||
| Constitution of deferred taxes on tax losses - Holding | 0 | 0 | 0.0 | 0 | 0 | 0 | -1,074 | n.m. |
| Reversal of Deferred Tax on Tax Loss with the Sale of Candiota | 0 | 0 | 0.0 | 0 | 0 | 0 | 292 | n.m. |
| Constitution/Reversal of Deferred Tax on Tax Loss (1) | 0 | 0 | 0.0 | 0 | 0 | 0 | -782 | n.m. |
| Deferred Tax Adjustment on Regulatory Remeasurement (2) | 0 | -758 | n.m. | -882 | n.m. | -882 | -758 | 16.4 |
| Deferred Tax Adjustment on Eletronorte's tax rate | 0 | 0 | 0.00 | -393 | n.m. | -393 | 0 | 0.0 |
| Current income tax on assets sold | 53 | 0 | 0.00 | 0 | 0.00 | 53 | 0 | 0.0 |
| Adjusted income tax and social contribution | -173 | -1,944 | -91.1 | -173 | 0.1 | -411 | -1,828 | -77.5 |
(1) AXIA Energia and CGT Eletrosul in 2Q24. At the Holding level, R$1,074 million in tax credits were recognized, stemming from tax loss carryforwards accumulated by AXIA Energia, following a reassessment of taxable income due to the merger with Furnas. At CGT Eletrosul, R$292.4 million were reversed, based on a revised expectation regarding the completion of the operations required to utilize the tax credit generated by the sale of the Candiota thermal power plant.
(2) Deferred Tax recognized in
2Q25 relative to the Regulatory Remeasurement, due to changes in the payment schedule of the RBSE financial component for contracts extended
under Law 12,783/2013, as approved by ANEEL’s Board at its 20th Ordinary Public Meeting held on June 10, 2025, affecting the 2025–26
to 2027–28 cycles.
|
|
9. OPERATIONAL PERFORMANCE
9.1. Generation Segment
Generation Assets
The Company had 82 plants, including 47 hydroelectric, 33 wind, 1 thermal and 1 solar in 3Q25, considering corporate ventures, shared ownership and stakes via SPEs. Compared to 2Q25, the decrease of six assets was primarily due to the transfer of ownership of thermal power plants held by Eletronorte. Additionally, the period reflected the acquisition of the Colíder HPP and the transfer of the Gov. Jayme Canet HPP from CGT Eletrosul.
Portfolio installed capacity reached 44,368 MW in 3Q25, with 99% generated from clean sources with low greenhouse gas emissions, representing 17% of Brazil's total installed capacity.
Table 27 - Generation assets
| Source | Installed Capacity (MW) | Assured Capacity (aMW) | Accumulated Generated Energy (GWh) |
| Hydro (47 plants) | 43,073 | 21,028 | 106,338 |
| Thermal (1 plants) | 500 | 401 | 1,336 |
| Wind Power (33 plants) | 794 | 226 | 1,415 |
| Solar (1 plant) | 0.93 | 0.00 | 0.73 |
| Total (82 plants) | 44,368 | 21,655 | 109,090 |
Total energy generated by AXIA Energia fell by 7.6% YoY in 3Q25.
Chart 4 - AXIA Energia - net energy generation (GWh)
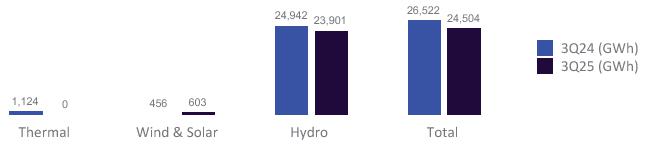
System Data – Installed Capacity and Generation
Brazil's installed capacity was 258,111.84 MW in 3Q25.
Chart 5 - Brazil’s installed capacity - by source
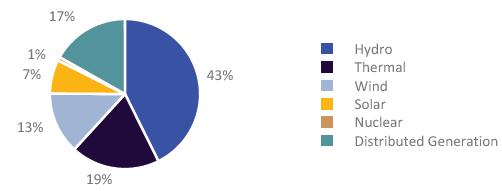
Source: ANEEL's Generation Information System (SIGA)
|
|
Chart 6 - Generated energy SIN - national interconnected system (GWh)
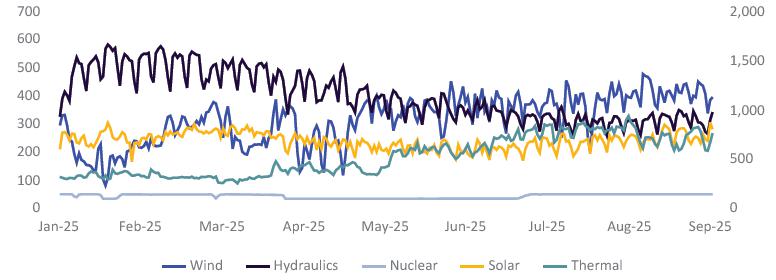
Source: Operating Results 01/01 to 9/30/2025 from the National Operator of the Electric System (ONS)
System Data – Energy Market
Table 28 - PLD
| 3Q25 | 3Q24 | ∆% | 2Q25 | ∆% | ||
| Market | GSF (%) | 64.92 | 79.10 | -14.2 p.p. | 95.64 | -30.7 p.p. |
| PLD SE (R$/MWh) | 252.43 | 169.67 | 48.8 | 216.45 | 16.6 | |
| PLD S (R$/MWh) | 252.98 | 169.72 | 49.1 | 224.26 | 12.8 | |
| PLD NE (R$/MWh) | 239.96 | 142.72 | 68.1 | 154.07 | 55.8 | |
| PLD N (R$/MWh) | 250.98 | 172.55 | 45.5 | 154.59 | 62.4 |
Chart 7 - GSF (%)
| Month | 2021 | 2022 | 2023 | 2024 | 2025 |
| September | 52% | 71% | 83% | 73% | 63% |
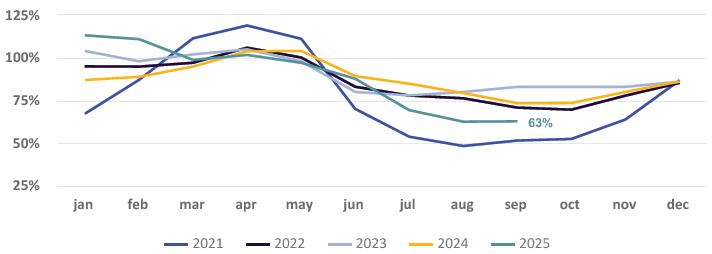
|
|
Chart 8 - Historical average of affluent natural energy (ENA) - SIN (%)
During the dry season, 3Q25 recorded ENAs below the historical average, with recovery observed only in the Southern submarket in September.
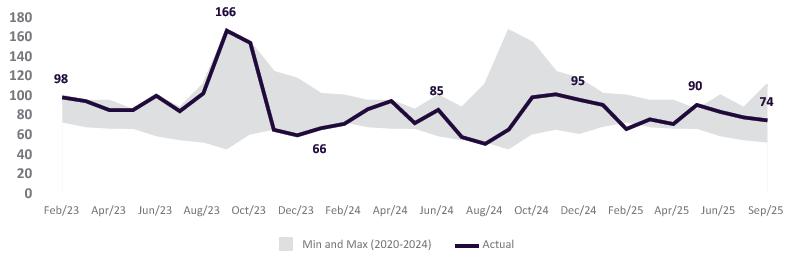
Chart 9 - Energy stored in reservoirs (EAR) - SIN (%)
The Brazilian Interconnected System (SIN) ended the quarter with the level of energy stored in reservoirs at 55%, more than 6% higher than in the same period last year. The highlight was the Northern submarket at 82.4%, 7% above the highest level of the last five years.
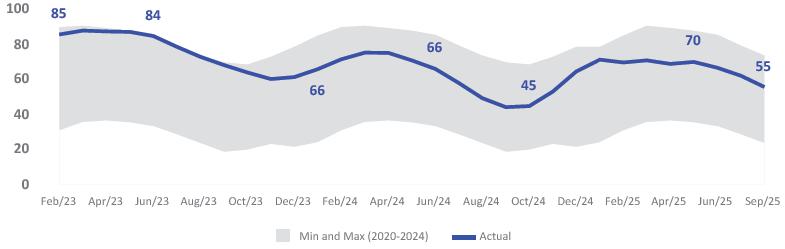
9.2. Transmission Segment
The Company ended 3Q25 with 74.8 thousand km of transmission lines, compared to 74.0 thousand km in 3Q24. There were also 412 substations, being 296 owned and 116 operated by third parties.
Table 29 - Transmission lines (km)
| Company | Own(1) | In Partnership (2) | Total |
| Chesf | 22,191 | 1,832 | 24,023 |
| Eletronorte | 10,988 | 2,013 | 13,001 |
| CGT Eletrosul | 12,182 | 5 | 12,187 |
| AXIA Energia | 22,129 | 3,429 | 25,558 |
| Total | 67,490 | 7,279 | 74,769 |
(1) Includes TMT (100%) and VSB (100%).
(2) Partnerships consider extensions proportional to the capital invested by AXIA Energia Companies in the venture.
|
|
9.3. ESG
Table 30 - ESG KPIs 3Q25
| Pillar | KPI | 3Q24 | 3Q25 | Change | |
| Planet | Accumulated GHG Emissions for the year (1) | 2,605,049 | 1,252,389 | -52% | |
| (Scopes 1, 2 and 3) (tCO2e) | |||||
| People | Accident Frequency Rate - own Employees (with time off) | 0.54 | 0.49 | -9% | |
| Women in the Workforce (%) | 21% | 25% | 4 p.p. | ||
| Leadership positions held by women (%) (2) | 26% | 25% | -1 p.p. | ||
| Governance | Complaints answered on time (%) | 100.0% | 98.0% | -2 p.p. | |
The values presented are preliminary and not assured, and may be adjusted based on data collection, verification and updating processes.
(1) The reduction in emissions is primarily due to the removal of coal-fired thermoelectric generation from the Company’s energy matrix.
(2) Reduction was due to departures connected to the VDPs.
(3) The percentage of complaints handled remains within the parameters established by the target.
|
|
10. APPENDIX
10.1. Appendix 1 - Generation and Transmission Revenue IFRS
Generation revenue comprises:
(a) revenue from supply to non-end consumers — distributors, traders, and generators — under contracts in the Regulated Contracting Environment (ACR) and the Free Contracting Environment (ACL);
(b) revenue from supply to end consumers — industrial and commercial clients — under contracts exclusively in the ACL;
(c) revenue from the CCEE, through settlements in the Short Term Market (MCP); and
(d) revenue from operation and maintenance, representing remuneration for energy sold under the quota regime.
Table 31 - Generation operating revenue (R$ mm)
| 3Q25 | 3Q24 | % | 2Q25 | % | 9M25 | 9M24 | % | |
| Power supply to non-end consumers | 4,235 | 6,224 | -32.0 | 4,374 | -3.2 | 13,951 | 13,632 | 2.3 |
| Power supply to end consumers | 422 | 695 | -39.3 | 433 | -2.6 | 1,349 | 2,248 | -40.0 |
| CCEE | 1,777 | 695 | n.m. | 1,534 | 15.8 | 3,923 | 1,911 | n.m. |
| O&M revenue | 474 | 734 | -35.4 | 509 | -6.9 | 1,503 | 2,319 | -35.2 |
| Generation Revenues | 6,908 | 8,348 | -17.2 | 6,851 | 0.8 | 20,727 | 20,109 | 3.1 |
| Non-recurring items - Adjustments | 26 | 0 | 0.0 | 109 | -76.1 | 135 | 0 | 0.0 |
| Adjusted Generation Revenue | 6,934 | 8,348 | -16.9 | 6,960 | -0.4 | 20,862 | 20,109 | 3.7 |
Transmission revenue comprises:
(a) operation and maintenance (O&M) revenue, related to the operation and maintenance of assets;
(b) construction revenue, linked to investments made (appropriated and allocated) in ongoing projects; and
(c) contractual (financial) revenue, associated with the application of inflation indices to the asset balances of each concession contract.
Table 32 - Transmission operating revenue (R$ mm)
| 3Q25 | 3Q24 | % | 2Q25 | % | 9M25 | 9M24 | % | |
| Revenue from Operation & Maintenance (O&M) | 2,096 | 1,906 | 10.0 | 2,065 | 1.5 | 6,177 | 5,863 | 5.4 |
| Construction Revenue | 1,182 | 1,044 | 13.2 | 1,063 | 11.2 | 2,991 | 2,351 | 27.2 |
| Contractual Revenue - Transmission | 1,367 | 1,616 | -15.4 | 1,951 | -29.9 | 5,742 | 5,306 | 8.2 |
| Transmission Revenues | 4,646 | 4,566 | 1.7 | 5,079 | -8.5 | 14,910 | 13,520 | 10.3 |
| Non-recurring items - Adjustments | 0 | 0 | 0.0 | 0 | 0.0 | 0 | 0 | 0.0 |
| Adjusted Transmission Operating Revenue | 4,646 | 4,566 | 1.7 | 5,079 | -8.5 | 14,910 | 13,520 | 10.3 |
|
|
10.2. Appendix 2 - PMSO Breakdown
Table 33 - PMSO 3Q25 (R$ mm)
| PMSO | 3Q25 | ||||||
| (R$ million) | AXIA Energia Holding | Chesf | Eletronorte | CGT Eletrosul | Total | Elimination | Consolidated IFRS |
| Personnel | 357 | 199 | 165 | 78 | 800 | 0 | 800 |
| Voluntary Dismissal Plan (PDV) - Provision | 18 | 5 | 7 | 1 | 32 | 0 | 32 |
| Material | 26 | 17 | 13 | 8 | 63 | 0 | 63 |
| Services | 315 | 101 | 100 | 33 | 548 | 0 | 548 |
| Other | 97 | 11 | 50 | 26 | 184 | -3 | 180 |
| PMSO | 813 | 333 | 336 | 146 | 1,627 | -3 | 1,623 |
| Non-recurring events | |||||||
| Personnel: VDP | -18 | -5 | -7 | -1 | -32 | 0 | -32 |
| Personnel: Termination Costs | -20 | -8 | -17 | -4 | -50 | 0 | -50 |
| Services: Success fee related to legal consulting | -13 | -1 | 0 | 0 | -14 | 0 | -14 |
| Services: Other expenses | -1 | 0 | 0 | 0 | -1 | 0 | -1 |
| Other: Expenses related to healthcare | -7 | -4 | -5 | -2 | -18 | 0 | -18 |
| Other: Judicial convictions | 0 | 0 | 0 | 0 | 0 | 0 | 0 |
| Other: Write-off of court deposits | 0 | 0 | 0 | 0 | 0 | 0 | 0 |
| Adjusted PMSO | 754 | 314 | 306 | 138 | 1,513 | -3 | 1,509 |
Table 34 - PMSO 3Q24 (R$ mm)
| PMSO | 3Q24 | ||||||
| (R$ million) | AXIA Energia Holding | Chesf | Eletronorte | CGT Eletrosul | Total | Elimination | Consolidated IFRS |
| Personnel | 349 | 226 | 208 | 81 | 864 | 38 | 902 |
| Voluntary Dismissal Plan (PDV) - Provision | 0 | 3 | -2 | 0 | 2 | 0 | 2 |
| Material | 13 | 13 | 27 | 5 | 59 | 6 | 64 |
| Services | 242 | 112 | 121 | 39 | 514 | 54 | 569 |
| Other | 340 | 51 | 96 | 3 | 491 | -22 | 468 |
| PMSO | 945 | 405 | 451 | 129 | 1,929 | 76 | 2,005 |
| Non-recurring events | |||||||
| Personnel: PDV, PDC | 0 | -3 | 2 | 0 | -2 | 0 | -2 |
| Personnel: Retroactive profit Sharing (PLR) | 0 | 0 | 0 | 0 | 0 | 0 | 0 |
| Services: Commissions related to compulsory loans | 0 | 0 | 0 | 0 | 0 | 0 | 0 |
| Other: Judicial convictions | -90 | 0 | 0 | 0 | -90 | 0 | -90 |
| Other: Write-off of court deposits | -216 | 0 | 0 | -5 | -221 | -221 | |
| Adjusted PMSO | 638 | 401 | 453 | 124 | 1,616 | 76 | 1,692 |
|
|
Table 35 - Other costs and expenses (R$ mm)
| 3Q25 | 3Q24 | % | 2Q25 | % | 9M25 | 9M24 | % | |
| Convictions, losses and legal costs | 60 | 57 | 4.8 | 5 | n.m. | 136 | 218 | -37.8 |
| GSF | 19 | 92 | -79.6 | 17 | 11.7 | 52 | 116 | -55.1 |
| Insurance | 24 | 39 | -37.5 | 24 | -0.1 | 71 | 86 | -16.9 |
| Equity Holding | 28 | 10 | n.m. | 18 | 56.0 | 55 | 43 | 29.0 |
| Donations and contributions | 16 | 17 | -2.4 | 29 | -43.4 | 66 | 81 | -18.0 |
| Rent | 23 | 21 | 8.7 | 19 | 25.5 | 65 | 43 | 50.1 |
| Recovery of expenses | -61 | -24 | n.m. | -12 | n.m. | -85 | -70 | 21.2 |
| Taxes | 23 | -1 | n.m. | 17 | 35.4 | 85 | 36 | n.m. |
| Others | 48 | 257 | -81.4 | 20 | n.m. | 88 | 280 | -68.6 |
| Total | 180 | 468 | -61.5 | 136 | 32.4 | 533 | 833 | -36.0 |
10.3. Appendix 3 - Financing and Loans Granted (Receivables)
Chart 10 - Receivables (R$ billion)
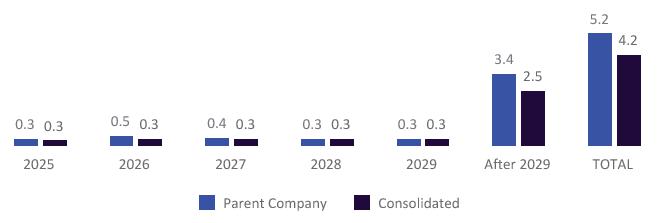
Does not include ECL of R$ 3,989 million and current liabilities.
|
|
10.4. Appendix 4 - Accounting Statements
Table 36 - Balance sheet (R$ thousand)
| PARENT COMPANY | CONSOLIDATED | |||
| 09/30/2025 | 12/31/2024 | 09/30/2025 | 12/31/2024 | |
| ASSETS | ||||
| CURRENT | ||||
| Cash and cash equivalents | 6,094,879 | 16,387,945 | 18,501,361 | 26,572,522 |
| Restricted cash | 291,512 | 449,865 | 633,628 | 508,734 |
| Securities | 2,659,286 | 6,421,621 | 9,754,362 | 8,951,838 |
| Clients | 1,631,063 | 1,686,293 | 5,424,445 | 5,911,477 |
| Transmission contract assets | 4,770,067 | 4,634,940 | 10,437,925 | 10,539,570 |
| Financing, loans and debentures | 154,280 | 971,555 | 12,035 | 475,459 |
| Remuneration for equity holdings | 834,923 | 2,286,078 | 612,283 | 721,683 |
| Taxes and Contributions | 1,475,741 | 1,734,020 | 2,252,359 | 2,831,414 |
| Income tax and social contribution | 0 | 0 | 0 | 0 |
| Right to compensation | 726,346 | 865,299 | 755,287 | 893,254 |
| Warehouse | 64,663 | 50,576 | 389,921 | 441,471 |
| Derivative financial instruments | 0 | 500,998 | 14,521 | 692,660 |
| Others | 1,160,175 | 729,718 | 1,871,101 | 1,408,919 |
| 19,862,935 | 36,718,908 | 50,659,228 | 59,949,001 | |
| Assets held for sale | 1,714,953 | 1,353,723 | 1,714,953 | 4,502,102 |
| 21,577,888 | 38,072,631 | 52,374,181 | 64,451,103 | |
| NON-CURRENT | ||||
| LONG-TERM ASSETS | ||||
| Restricted cash | 1,571,968 | 1,430,650 | 3,154,083 | 3,170,749 |
| Equity Holdings Income | 181,049 | 181,049 | 0 | 0 |
| Right to compensation | 175,127 | 692,126 | 184,770 | 720,081 |
| Financing, loans and debentures | 1,091,319 | 1,894,322 | 174,489 | 163,140 |
| Clients | 142,506 | 171,017 | 533,852 | 602,411 |
| Securities | 440,401 | 421,933 | 556,422 | 433,341 |
| Taxes and Contributions | 2,357,835 | 2,356,369 | 2,743,790 | 2,715,445 |
| Deferred income tax and social contribution | 0 | 0 | 5,819,907 | 5,673,011 |
| Bonds and deposits linked | 4,058,212 | 3,693,298 | 5,630,275 | 5,190,344 |
| Transmission contractual assets | 18,751,225 | 21,223,812 | 53,241,622 | 56,848,086 |
| Derivative financial instruments | 336,887 | 1,269,677 | 675,939 | 1,544,095 |
| Others | 1,544,215 | 2,000,734 | 916,853 | 1,645,570 |
| 30,650,744 | 35,334,987 | 73,632,002 | 78,706,273 | |
| INVESTMENTS | ||||
| Equity Income | 106,916,968 | 112,300,525 | 23,316,774 | 30,727,405 |
| Held at fair value | 1,039,837 | 839,546 | 1,039,837 | 861,234 |
| Other Investments | 19,387 | 19,387 | 97,988 | 97,987 |
| 107,976,192 | 113,159,458 | 24,454,599 | 31,686,626 | |
| FIXED ASSETS | 7,793,047 | 6,137,175 | 39,091,851 | 36,854,055 |
| INTANGIBLE | 20,487,718 | 20,779,526 | 76,949,814 | 78,173,273 |
| 166,907,701 | 175,411,146 | 214,128,266 | 225,420,227 | |
| TOTAL ASSETS | 188,485,589 | 213,483,777 | 266,502,447 | 289,871,330 |
| PARENT COMPANY | CONSOLIDATED | |||
| LIABILITIES AND SHAREHOLDERS' EQUITY | 9/30/2025 | 12/31/2024 | 9/30/2025 | 12/31/2024 |
| CURRENT LIABILITIES | ||||
| Loans, financing and debentures | 6,983,721 | 8,329,966 | 11,210,908 | 12,809,872 |
| Compulsory loans - Agreements | 919,573 | 1,105,534 | 919,573 | 1,105,534 |
| Compulsory loans | 1,223,269 | 1,326,925 | 1,223,269 | 1,326,925 |
| Suppliers | 1,347,599 | 1,145,660 | 2,785,590 | 2,756,329 |
| Taxes and Contributions | 192,487 | 378,569 | 912,729 | 1,146,169 |
|
|
| Income tax and social contribution | 0 | 0 | 0 | 0 |
| Onerous contracts | 0 | 0 | 122,446 | 62,711 |
| Shareholder remuneration | 40,975 | 2,486,778 | 43,889 | 2,490,668 |
| Personnel obligations | 437,231 | 483,779 | 924,361 | 1,065,114 |
| Reimbursement Obligations | 0 | 0 | 61,141 | 55,517 |
| Post-employment benefits | 954 | 993 | 303,525 | 289,840 |
| Provision for litigation | 719,478 | 1,719,453 | 802,073 | 1,791,088 |
| Sector charges | 66,655 | 105,352 | 824,847 | 820,067 |
| Obligations under Law 14,182/2021 | 1,021,349 | 814,819 | 3,660,074 | 2,916,199 |
| RGR Returns | 645,715 | 492,276 | 645,715 | 492,276 |
| Leasing | 35,260 | 8,429 | 73,821 | 26,861 |
| Derivative financial instruments | 955,644 | 824,125 | 1,615,340 | 1,175,652 |
| Others | 169,284 | 458,746 | 1,178,740 | 1,105,094 |
| 14,759,194 | 19,681,404 | 27,308,041 | 31,435,916 | |
| Liabilities associated with assets held for sale | 0 | 0 | 0 | 194,454 |
| 14,759,194 | 19,681,404 | 27,308,041 | 31,630,370 | |
| NON-CURRENT | ||||
| Loans, financing and debentures | 36,111,757 | 40,926,187 | 59,625,045 | 62,810,702 |
| Shareholder remuneration | 0 | 0 | 585 | 0 |
| Suppliers | 0 | 0 | 9,481 | 7,959 |
| Provision for litigation | 14,448,899 | 15,658,437 | 20,714,103 | 21,583,395 |
| Post-employment benefits | 411,672 | 418,586 | 3,390,699 | 3,416,381 |
| Obligations under Law 14,182/2021 | 11,131,450 | 11,111,765 | 39,103,575 | 39,105,924 |
| RGR Returns | 109,993 | 439,974 | 109,993 | 439,974 |
| Onerous contracts | 0 | 0 | 474,039 | 621,725 |
| Reimbursement Obligations | 0 | 0 | 22,004 | 15,286 |
| Leasing | 105,820 | 79,994 | 419,823 | 155,722 |
| Concessions payable - Use of public assets | 38,164 | 38,175 | 559,738 | 543,867 |
| Advances for future capital increases | 120,226 | 108,938 | 120,226 | 108,938 |
| Derivative financial instruments | 230,088 | 2,283 | 230,088 | 2,283 |
| Sector charges | 517,209 | 744,833 | 753,080 | 942,348 |
| Taxes and Contributions | 91,486 | 103,682 | 244,381 | 372,488 |
| Deferred income tax and social contribution | 793,701 | 1,566,835 | 2,973,385 | 4,287,021 |
| Others | 326,043 | 739,459 | 1,103,759 | 1,827,171 |
| 64,436,508 | 71,939,148 | 129,854,004 | 136,241,184 | |
| SHAREHOLDERS' EQUITY | ||||
| Share capital | 70,135,201 | 70,099,826 | 70,135,201 | 70,099,826 |
| Share issue costs | -108,186 | -108,186 | -108,186 | -108,186 |
| Capital Reserves and Granted Equity Instruments | 13,920,382 | 13,910,768 | 13,920,382 | 13,910,768 |
| Treasury shares | -2,252,578 | -2,223,011 | -2,252,578 | -2,223,011 |
| Profit reserves | 39,905,041 | 43,905,041 | 39,905,041 | 43,905,041 |
| Proposed additional dividend | 0 | 1,535,196 | 0 | 1,535,196 |
| Accumulated profit | -7,117,905 | 0 | -7,117,905 | 0 |
| Accumulated other comprehensive income | -5,192,068 | -5,256,409 | -5,192,068 | -5,256,409 |
| Amounts recognized in other comprehensive income classified as held for sale | 0 | 0 | 0 | 0 |
| Controlling shareholders | 109,289,887 | 121,863,225 | 109,289,887 | 121,863,225 |
| Non-controlling shareholders | 0 | 0 | 50,515 | 136,551 |
| TOTAL SHAREHOLDERS' EQUITY | 109,289,887 | 121,863,225 | 109,340,402 | 121,999,776 |
| TOTAL LIABILITIES AND SHAREHOLDERS' EQUITY | 188,485,589 | 213,483,777 | 266,502,447 | 289,871,330 |
|
|
Table 37 - Income statement (R$ thousand)
| PARENT COMPANY | CONSOLIDATED | |||
| 09/30/2025 | 09/30/2024 | 09/30/2025 | 09/30/2024 | |
| CONTINUING OPERATIONS | ||||
| Net operating revenue | 10,419,618 | 2,647,184 | 30,615,636 | 28,156,480 |
| Operating costs | -6,704,223 | -1,757,956 | -16,843,658 | -14,929,256 |
| GROSS PROFIT | 3,715,395 | 889,228 | 13,771,978 | 13,227,224 |
| Operating expenses | -8,198,186 | -668,903 | -10,748,491 | -3,158,383 |
| Regulatory Remeasurements - Transmission Contracts | -1,762,645 | 2,229,490 | -4,081,630 | 6,129,771 |
| OPERATING RESULT BEFORE FINANCIAL RESULT | -6,245,436 | 2,449,815 | -1,058,143 | 16,198,612 |
| FINANCIAL RESULT | -4,585,068 | -3,200,964 | -8,620,094 | -8,697,910 |
| Income from interest, fines, commissions and fees | 217,517 | 726,656 | 61,324 | 116,872 |
| Income from financial investments | 1,697,593 | 872,896 | 3,386,869 | 1,955,055 |
| Late payment surcharge on electricity | 5,256 | 850 | 84,594 | 96,498 |
| Other financial income | 111,254 | 117,498 | 121,026 | 177,927 |
| (–) Taxes on financial income | -129,056 | -116,611 | -240,038 | -165,097 |
| Financial Income | 1,902,564 | 1,601,289 | 3,413,775 | 2,181,255 |
| Debt charges | -2,825,256 | -2,423,204 | -4,612,608 | -4,561,343 |
| CDE obligation charges | -571,797 | -178,795 | -1,988,233 | -1,844,288 |
| River basin revitalization charges | -62,878 | -22,317 | -237,431 | -252,910 |
| Other financial expenses | -166,494 | -693,039 | -274,208 | -892,893 |
| Financial expenses | -3,626,425 | -3,317,355 | -7,112,480 | -7,551,434 |
| Monetary updates – CDE | -379,124 | -67,801 | -1,318,278 | -1,096,405 |
| Monetary updates – river basins | -54,010 | -11,212 | -207,268 | -196,420 |
| Monetary reliefs | -478,224 | -458,765 | -744,231 | -536,390 |
| Exchange rate variations | -9,580 | 61,018 | -1,352 | 27,116 |
| Change in fair value of hedged debt net of derivative | -1,940,269 | -1,008,138 | -2,609,482 | -1,292,131 |
| Change in derivative financial instrument not linked to debt protection | 0 | 0 | -40,778 | -233,501 |
| Financial items, net | -2,861,207 | -1,484,898 | -4,921,389 | -3,327,731 |
| PROFIT BEFORE EQUITY HOLDINGS | -10,830,504 | -751,149 | -9,678,237 | 7,500,702 |
| Equity income | 2,775,475 | 8,915,489 | 1,506,539 | 2,024,711 |
| Other income and expenses | 90,485 | 31,730 | 233,615 | 31,058 |
| OPERATING PROFIT BEFORE TAX | -7,964,544 | 8,196,070 | -7,938,083 | 9,556,471 |
| Current income tax and social contribution | 0 | 0 | -757,481 | -722,921 |
| Deferred income tax and social contribution | 837,428 | 1,074,204 | 1,568,725 | 434,937 |
| NET INCOME FOR CONTINUING OPERATIONS | -7,127,116 | 9,270,274 | -7,126,839 | 9,268,487 |
| Portion attributable to controlling | -7,127,116 | 9,270,274 | -7,127,116 | 9,270,274 |
| Portion attributable to non-controlling | 0 | 0 | 277 | -1,787 |
| NET INCOME (LOSS) FOR DISCONTINUED OPERATIONS | 0 | 0 | 0 | 0 |
| Portion attributable to controlling | 0 | 0 | 0 | 0 |
| Portion attributable to non-controlling | 0 | 0 | 0 | 0 |
| NET INCOME FOR THE YEAR | -7,127,116 | 9,270,274 | -7,126,839 | 9,268,487 |
| Portion attributable to controlling | -7,127,116 | 9,270,274 | -7,127,116 | 9,270,274 |
| Portion attributable to non-controlling | 0 | 0 | 277 | -1,787 |
| EARNINGS PER SHARE | ||||
| Earnings per share - basic (ON) | -3.13 | 4.07 | 0.00 | 0.00 |
| Earnings per share - basic (PN) | -3.45 | 4.48 | 0.00 | 0.00 |
| Earnings per share - diluted (ON) | -3.11 | 4.02 | 0.00 | 0.00 |
| Earnings per share - diluted (PN) | -3.42 | 4.43 | 0.00 | 0.00 |
|
|
Table 38 - Cash flow statement (R$ thousand)
| PARENT COMPANY | CONSOLIDATED | |||
| 09/30/2025 | 09/30/2024 | 09/30/2025 | 09/30/2024 | |
| OPERATING ACTIVITIES | ||||
| Profit for the year before income tax and social contribution | -7,964,544 | 8,196,070 | -7,938,083 | 9,556,471 |
| Adjustments to reconcile profit with cash generated by operations: | ||||
| Depreciation and amortization | 691,116 | 173,057 | 3,399,225 | 2,954,830 |
| Net exchange and monetary variations | 920,938 | 476,760 | 2,271,129 | 1,802,099 |
| Result of acquisitions and divestments | 7,250,655 | 115,483 | 7,176,177 | 115,483 |
| Financial charges | 3,037,738 | 1,024,763 | 5,985,230 | 4,586,614 |
| Equity income | -2,775,475 | -8,915,489 | -1,506,539 | -2,024,711 |
| Other income and expenses | -90,485 | -42,069 | -233,615 | -41,397 |
| Transmission revenues | -5,556,575 | -1,661,502 | -14,910,112 | -13,519,941 |
| Construction cost - transmission | 1,145,205 | 338,486 | 3,043,066 | 2,482,964 |
| Regulatory Remeasurements - Transmission Contracts | 1,762,645 | -2,229,490 | 4,081,630 | -6,129,771 |
| Operating provisions (reversals) | -490,624 | -747,377 | 495,482 | -159,797 |
| Write-offs of PP&E and Intangible Assets | 7,959 | 0 | -99,395 | 0 |
| Result of hedged debt and derivatives | 1,940,269 | 1,008,138 | 2,650,260 | 1,525,632 |
| Other | 179,040 | 770,791 | 284,995 | 809,676 |
| 8,022,406 | -9,688,449 | 12,637,533 | -7,598,319 | |
| (Additions)/decreases in operating assets | ||||
| Clients | 26,843 | 34,109 | 447,900 | -150,160 |
| Right to compensation | 766,112 | 707,625 | 783,438 | 738,843 |
| Others | 154,262 | -170,940 | -570,057 | -349,681 |
| 947,217 | 570,794 | 661,281 | 239,002 | |
| Additions/(decreases) in operating liabilities | ||||
| Suppliers | 158,799 | 143,356 | -69,778 | -962,956 |
| Advances | 0 | 0 | 0 | 0 |
| Personnel obligations | -41,380 | 28,888 | -135,585 | -569,684 |
| Sector charges | -282,132 | 624,297 | -217,924 | 548,650 |
| Others | -597,980 | 135,276 | -402,791 | -560,716 |
| -762,693 | 931,817 | -826,078 | -1,544,706 | |
| Payment of financial charges | -2,889,934 | -3,290,688 | -4,534,868 | -5,070,249 |
| Receipt of RAP revenue | 6,131,390 | 1,779,777 | 14,536,591 | 14,828,290 |
| Receipt of Financial Charges from Subsidiaries | 0 | 0 | 0 | 0 |
| Receipt of remuneration from investments in equity holdings | 2,211,921 | 2,985,443 | 877,130 | 1,059,198 |
| Payment of litigation | -2,738,570 | -2,240,605 | -3,118,773 | -2,544,691 |
| Bonds and linked deposits | -418,444 | -103,399 | -389,759 | -183,164 |
| Payment of income tax and social contribution | -21,156 | -70,366 | -328,098 | -1,509,790 |
| Supplementary pension payments | -17,140 | -16,583 | -282,610 | -313,365 |
| Net cash provided by operating activities of discontinued operations | 0 | 0 | 0 | 0 |
| Net cash provided by (used in) operating activities | 2,500,453 | -946,189 | 11,294,266 | 6,918,677 |
| FINANCING ACTIVITIES | ||||
| Loans and financing obtained and debentures obtained | 0 | 13,237,820 | 3,330,000 | 21,152,463 |
| Payment of loans and financing and debentures - principal | -6,622,713 | -9,920,297 | -9,254,732 | -12,851,588 |
| Payment of remuneration to shareholders | -7,981,613 | -1,287,242 | -7,982,004 | -1,176,190 |
| Payment to dissenting shareholders - incorporation of shares | 0 | 0 | 0 | 0 |
| Share buybacks | -36,728 | -68,399 | -36,728 | -68,399 |
| Payment of CDE obligations and revitalization of basins - principal | -725,774 | 0 | -2,575,565 | -1,974,963 |
| Lease payments - principal | -25,444 | -33,914 | -39,360 | -48,167 |
| Derivatives Payment | -462,570 | 0 | -546,001 | 0 |
| Others | -203,775 | 0 | -203,777 | 0 |
| Net cash (used in) financing activities | -16,058,617 | 1,927,968 | -17,308,167 | 5,033,156 |
| INVESTMENT ACTIVITIES | ||||
| Grant of advance for future capital increase | 0 | -8,051 | 0 | -8,051 |
| Receipt of loans and financing | 795,946 | 805,687 | 445,644 | 8,848 |
| Receipt of financial charges | 359,454 | 752,803 | 209,590 | 56,359 |
| Acquisition of fixed assets | -335,909 | -92,911 | -1,281,112 | -1,870,635 |
|
|
| Acquisition of intangible assets | -117,042 | -67,912 | -274,879 | -202,874 |
| Restricted cash | 17,035 | -149,912 | -108,228 | -708,150 |
| Financial (withdrawals)/contributions (securities) | 3,919,935 | 862,776 | -429,693 | -786,853 |
| Receipt of charges (securities) | 301,813 | 183,697 | 413,724 | 402,521 |
| Debentures Acquisition | 0 | 0 | 0 | 0 |
| Transmission infrastructure - contractual asset | -1,145,205 | -338,486 | -3,043,066 | -2,482,964 |
| Capital acquisition/contribution of equity holdings | -720,752 | -176,643 | -873,311 | -176,644 |
| Disposal of equity holdings | 189,823 | 2,449,160 | 2,884,072 | 2,449,160 |
| Net cash in the incorporation of subsidiaries | 0 | 1,018,193 | 0 | 0 |
| Net cash in the acquisition of control of investees | 0 | 0 | 0 | 0 |
| Others | 0 | 0 | 0 | -305 |
| Net cash provided by investment activities of discontinued operations | 0 | 0 | 0 | 0 |
| Net cash provided by (used in) investing activities | 3,265,098 | 5,238,401 | -2,057,259 | -3,319,588 |
| Increase (decrease) in cash and cash equivalents | -10,293,066 | 6,220,180 | -8,071,160 | 8,632,245 |
| Cash and cash equivalents at the beginning of the period | 16,387,945 | 5,698,457 | 26,572,522 | 13,046,371 |
| Cash and cash equivalents at the end of the period | 6,094,879 | 11,918,637 | 18,501,361 | 21,678,616 |
| -10,293,066 | 6,220,180 | -8,071,161 | 8,632,245 |
10.5. Appendix 5 - IFRS vs. Regulatory Reconciliation
Table 39 - Reconciliation IFRS vs. regulatory (R$ thousand)
| CVM Result IFRS | Regulatory Result | ∆ | CVM Result IFRS | Regulatory Result | ∆ | |
| 09/30/2025 | 09/30/2024 | |||||
| OPERATING REVENUES | ||||||
| Generation | ||||||
| Power supply for distribution companies | 13,951,211 | 13,833,218 | 117,993 | 13,631,687 | 14,198,185 | -566,498 |
| Power supply for end consumers | 1,349,467 | 1,349,467 | 0 | 2,247,830 | 2,247,830 | 0 |
| CCEE revenue (short term market) | 3,923,394 | 3,923,394 | 0 | 1,910,559 | 1,910,559 | 0 |
| Operation and maintenance (O&M) revenue | 1,502,653 | 1,502,653 | 0 | 2,319,252 | 2,319,252 | 0 |
| Transmission | ||||||
| Operation and maintenance revenue | 6,177,346 | 0 | 6,177,346 | 5,862,771 | 0 | 5,862,771 |
| Construction revenue | 2,990,824 | 0 | 2,990,824 | 2,350,714 | 0 | 2,350,714 |
| Contract revenue – Transmission | 5,741,942 | 0 | 5,741,942 | 5,306,457 | 0 | 5,306,457 |
| Transmission System Availability (Rap) | 0 | 13,655,618 | -13,655,618 | 0 | 14,449,745 | -14,449,745 |
| Other income | 391,871 | 391,872 | 0 | 182,057 | 179,332 | 2,725 |
| Deductions | ||||||
| (-) Sector charges | -1,994,085 | -1,994,084 | -1 | -1,876,645 | -1,876,994 | 349 |
| (-) ICMS | -224,986 | -224,986 | 0 | -701,758 | -701,758 | 0 |
| (-) PASEP e COFINS | -3,190,461 | -3,190,461 | 0 | -3,073,862 | -3,073,861 | -1 |
| (-) Other Deductions | -3,540 | -3,540 | 0 | -2,582 | -2,233 | -349 |
| Net Operating Revenue | 30,615,636 | 29,243,150 | 1,372,486 | 28,156,480 | 29,650,057 | -1,493,577 |
| OPERATING COSTS | ||||||
| Personnel, Material and Services | -1,954,915 | -1,954,837 | -78 | -2,106,272 | -2,105,285 | -987 |
| Energy purchased for resale | -4,629,606 | -4,904,602 | 274,996 | -2,986,397 | -3,513,004 | 526,607 |
| Charges for use of the electricity grid | -2,960,926 | -2,514,835 | -446,092 | -2,986,393 | -2,605,112 | -381,281 |
| Fuel for electricity production | -975,346 | -975,346 | 0 | -1,460,855 | -1,460,855 | 0 |
| Construction | -3,043,066 | 0 | -3,043,066 | -2,482,964 | 0 | -2,482,964 |
| Depreciation | -1,443,360 | -2,836,739 | 1,393,379 | -1,291,734 | -2,738,039 | 1,446,305 |
|
|
| Amortization | -1,695,641 | -1,701,363 | 5,722 | -1,463,207 | -1,477,292 | 14,085 |
| Operating provisions/reversals | 0 | 0 | 0 | 0 | 0 | 0 |
| Other costs | -140,798 | -126,124 | -14,674 | -151,434 | -151,624 | 190 |
| Operating costs | -16,843,658 | -15,013,844 | -1,829,814 | -14,929,256 | -14,051,211 | -878,045 |
| GROSS PROFIT | 13,771,978 | 14,229,306 | -457,328 | 13,227,224 | 15,598,846 | -2,371,622 |
| OPERATING EXPENSES | ||||||
| Personnel, Material and Services | -2,198,635 | -2,209,709 | 11,074 | -2,276,163 | -2,313,516 | 37,353 |
| Voluntary Dismissal Program | -225,624 | -225,624 | 0 | -45,137 | -45,137 | 0 |
| Remuneration and compensation | 0 | 0 | 0 | 0 | 0 | 0 |
| Depreciation | -155,718 | -150,481 | -5,237 | -145,106 | -143,715 | -1,391 |
| Amortization | -104,506 | -106,589 | 2,083 | -54,783 | -59,729 | 4,946 |
| Donations and contributions | -51,729 | -51,729 | 0 | -74,362 | -74,365 | 3 |
| Operating provisions/reversals | -495,482 | 227,776 | -723,258 | 159,797 | 418,901 | -259,104 |
| Result from asset sales | -7,176,177 | -6,317,107 | -859,070 | -115,483 | -115,483 | 0 |
| Other expenses | -340,620 | -363,256 | 22,636 | -607,146 | -610,221 | 3,075 |
| OPERATING EXPENSES | -10,748,491 | -9,196,719 | -1,551,772 | -3,158,383 | -2,943,265 | -215,118 |
| Regulatory Remeasurements - Transmission Contracts | -4,081,630 | 0 | -4,081,630 | 6,129,771 | 0 | 6,129,771 |
| OPERATING RESULT BEFORE FINANCIAL RESULT | -1,058,143 | 5,032,587 | -6,090,730 | 16,198,612 | 12,655,581 | 3,543,031 |
| FINANCIAL RESULT | -8,620,094 | -9,097,414 | 477,320 | -8,697,910 | -9,108,649 | 410,739 |
| PROFIT BEFORE EQUITY HOLDINGS | -9,678,237 | -4,064,827 | -5,613,410 | 7,500,702 | 3,546,932 | 3,953,770 |
| Equity income | 1,506,539 | 642,891 | 863,648 | 2,024,711 | 1,685,874 | 338,837 |
| Other income and expenses | 233,615 | 233,615 | 0 | 31,058 | 31,159 | -101 |
| OPERATING PROFIT BEFORE TAX | -7,938,083 | -3,188,321 | -4,749,762 | 9,556,471 | 5,263,965 | 4,292,506 |
| Current income tax and social contribution | -757,481 | -757,481 | 0 | -722,921 | -722,921 | 0 |
| Deferred income tax and social contribution | 1,568,725 | -135,889 | 1,704,614 | 434,937 | 808,817 | -373,880 |
| NET INCOME FOR CONTINUING OPERATIONS | -7,126,839 | -4,081,691 | -3,045,148 | 9,268,487 | 5,349,861 | 3,918,626 |
| Portion attributable to controlling | -7,127,116 | -4,081,968 | -3,045,148 | 9,270,274 | 5,352,733 | 3,917,541 |
| Portion attributable to controlling | 277 | 277 | 0 | -1,787 | -2,872 | 1,085 |
| NET INCOME (LOSS) FOR DISCONTINUED OPERATIONS | 0 | 0 | 0 | 0 | 0 | 0 |
| Portion attributable to controlling | 0 | 0 | 0 | 0 | 0 | 0 |
| Portion attributable to controlling | 0 | 0 | 0 | 0 | 0 | 0 |
| NET INCOME FOR THE YEAR | -7,126,839 | -4,081,691 | -3,045,148 | 9,268,487 | 5,349,861 | 3,918,626 |
| Portion attributable to controlling | -7,127,116 | -4,081,968 | -3,045,148 | 9,270,274 | 5,352,733 | 3,917,541 |
| Portion attributable to controlling | 277 | 277 | 0 | -1,787 | -2,872 | 1,085 |
|
|

SIGNATURE
Pursuant to the requirements of the Securities Exchange Act of 1934, the registrant has duly caused this report to be signed on its behalf by the undersigned, thereunto duly authorized.
Date: November 5, 2025
| CENTRAIS ELÉTRICAS BRASILEIRAS S.A. - ELETROBRÁS | ||
| By: |
/S/ Eduardo Haiama |
|
|
Eduardo Haiama Vice-President of Finance and Investor Relations |
||
FORWARD-LOOKING STATEMENTS
This document may contain estimates and projections that are not statements of past events but reflect our management’s beliefs and expectations and may constitute forward-looking statements under Section 27A of the Securities Act of 1933, as amended, and Section 21E of the Securities and Exchange Act of 1934, as amended. The words “believes”, “may”, “can”, “estimates”, “continues”, “anticipates”, “intends”, “expects”, and similar expressions are intended to identify estimates that necessarily involve known and unknown risks and uncertainties. Known risks and uncertainties include, but are not limited to: general economic, regulatory, political, and business conditions in Brazil and abroad; fluctuations in interest rates, inflation, and the value of the Brazilian Real; changes in consumer electricity usage patterns and volumes; competitive conditions; our level of indebtedness; the possibility of receiving payments related to our receivables; changes in rainfall and water levels in reservoirs used to operate our hydroelectric plants; our financing and capital investment plans; existing and future government regulations; and other risks described in our annual report and other documents filed with the CVM and SEC. Estimates and projections refer only to the date they were expressed, and we do not assume any obligation to update any of these estimates or projections due to new information or future events. Future results of the Company’s operations and initiatives may differ from current expectations, and investors should not rely solely on the information contained herein. This material contains calculations that may not reflect precise results due to rounding.