SECURITIES AND EXCHANGE COMMISSION
Washington, D.C. 20549
FORM 6-K
Report of Foreign Private Issuer
Pursuant to Rule 13a-16 or 15d-16 of the
Securities Exchange Act of 1934
For the month of May, 2025
Commission File Number 1-34129
CENTRAIS ELÉTRICAS BRASILEIRAS S.A. - ELETROBRÁS
(Exact name of registrant as specified in its charter)
BRAZILIAN ELECTRIC POWER COMPANY
(Translation of Registrant's name into English)
Rua da Quitanda, 196 – 24th floor,
Centro, CEP 20091-005,
Rio de Janeiro, RJ, Brazil
(Address of principal executive office)
Indicate by check mark whether the registrant files or will file annual reports under cover Form 20-F or Form 40-F.
Form 20-F ___X___ Form 40-F _______
Indicate by check mark whether the registrant by furnishing the information contained in this Form is also thereby furnishing the information to the Commission pursuant to Rule 12g3-2(b) under the Securities Exchange Act of 1934.
Yes _______ No___X____


| TABLE OF CONTENTS | |
| 1. CONSOLIDATED RESULT | IFRS AND REGULATORY | 7 |
| 2. ADJUSTED REGULATORY INCOME STATEMENT | 9 |
| 3. ADJUSTED EBITDA | 11 |
| 4. ENERGY TRADING | 13 |
| 5. INVESTMENTS AND EXPANSION PROJECTS | 14 |
| 6. INDEBTEDNESS | 19 |
| 7. COMPULSORY LOAN | 21 |
| 8. CASH FLOW | 22 |
| 9. FINANCIAL PERFORMANCE | 23 |
| 9.1. Operating Revenue | 23 |
| 9.2. Operating Costs and Expenses | 27 |
| 9.3. Equity Holdings | 33 |
| 9.4. Financial Results | 34 |
| 9.5. Current and Deferred Taxes | 37 |
| 10. OPERATING PERFORMANCE | 37 |
| 10.1. Generation Segment | 37 |
| 10.2. Transmission Segment | 40 |
| 10.3. ESG | 41 |
| 11. APPENDIX | 42 |
| 11.1. Appendix 1 - Accounting Statements | 42 |
| 11.2. Appendix 2 - Statement on Thermal Power Plants Sale | 49 |
| 11.3. Appendix 3 - Statement on Furnas Merger | 49 |
| 11.4. Appendix 4 - Regulatory vs IFRS Income Statement | 50 |
| 11.5. Appendix 5 - EBITDA IFRS | 53 |
| 11.6. Appendix 6 - Generation Revenue IFRS | 53 |
| 11.7. Appendix 7 - Transmission Revenue IFRS | 54 |
| 11.8. Appendix 8 - Regulatory Transmission Revenue - Adjustment Portion (PA) | 54 |
| 11.9. Appendix 9 - RAP's Periodic Tariff Review of tendered contracts revised in 2024 | 56 |
| 11.10. Appendix 10 - 2nd RAP's Periodic Tariff Review of contracts extended by Law 12,783/2013 | 57 |
| 11.11. Appendix 11 - Financing and Loans Granted (Receivables) | 58 |
| 11.12. Appendix 12 - Result Reconciliation Regulatory vs. IFRS | 59 |
Earnings Release 1Q25 |
|
ELETROBRAS RELEASES 1ST QUARTER 2025 RESULTS
Highlights 1Q25
| ▪ | Regulatory Net Operating
Revenue: remained stable from 1Q24, reaching
R$ 9,708 million: (+) growth in generation revenue, reflecting both a 9.9% increase in average price and a 1.0% increase in volume. The increase in volume was due to the growth in sales in both the free contracting environment (ACL) and the regulated contracting environment (ACR). (-) R$ 483 million YoY reduction in Annual Permitted Revenue (RAP) related to the 2024 Periodic Tariff Review (2024 RTP), of which R$ 328 million related to Postponement Adjustment Portion (PA Postergação). |
| ▪ | Adjusted PMSO: R$ 1,467 million (down -8.0% YoY), reflecting savings linked to efficiency gains. In 1Q25, adjusted PMSO was impacted by the following effects: |
(a) R$ 96 million related to Voluntary Dismissal Plans (VDPs);
(b) R$ 31 million and R$ 22 million in severance costs for 1Q25 and 4Q24, respectively;
(c) R$ 42 million in legal consulting expenses related to the contingency reduction strategy.
| ▪ | Energy Purchased for Resale: R$ 1,560 million (up 111.6% vs. 1Q24), mainly driven by higher short-term market settlements, as a result of increased sales volume in the free market. It is worth noting that the group companies that presented a negative exposure (short position) in energy volume book the energy settled in the short-term market under the energy purchased for resale line. On the other hand, companies with positive exposure (long position) book the energy settled in the short-term market under revenue. |
| ▪ | Adjusted Regulatory Provisions: net provision of R$ 77 million, mainly impacted by the lower default on energy sold to Amazonas Energia, which fell to R$ 56 million in 1Q25 from R$ 432 million in 1Q24. |
| ▪ | Adjusted Regulatory EBITDA: R$ 5,377 million (down 4.1% YoY), reflecting: |
(a) higher generation revenue;
(b) lower costs and expenses with personnel, materials, services and others;
(c) lower provisions recognized in the quarter;
(d) increased contribution from equity results.
These effects were offset by lower transmission revenue and higher costs with energy purchased for resale.
Earnings Release 1Q25 |
|
Table 1 - Adjustments on Regulatory EBITDA (R$ mm)
| 1Q25 | 1Q24 | % | 4Q24 | % | |
| Regulatory EBITDA (a) | 5,485 | 5,696 | -3.7 | 5,444 | 0.8 |
| Total Adjustments on Regulatory EBITDA (b) | -108 | -91 | 19.6 | -355 | -69.5 |
| PMSO | 191 | 33 | 484.7 | 292 | -34.5 |
| Voluntary Dismissal Plan (VDP) - Provision | 96 | 33 | 194.5 | 182 | -46.9 |
| Severance costs in 1Q25 | 31 | 0 | 0.0 | 69 | -54.7 |
| Severance costs in 4Q24 | 22 | 0 | 0.0 | 0 | 0.0 |
| Legal consulting related to the contingency reduction strategy | 42 | 0 | 0.0 | 42 | -0.6 |
| Provisions | -166 | -118 | 40.4 | -552 | -69.9 |
| Provision for litigation | -99 | -139 | -28.7 | 427 | -123.2 |
| ECL - Loans and financing | 0 | 4 | -100.0 | 4 | -100.0 |
| Onerous contracts | -29 | -39 | -24.7 | -251 | -88.4 |
| Estimated losses on investments | -12 | 15 | -181.8 | -217 | -94.3 |
| Impairment | 0 | 6 | -101.3 | -540 | -100.0 |
| Provision for the settlement of lawsuits - Compulsory Loan | -26 | 34 | -176.6 | 23 | -209.5 |
| Other income and expenses | -133 | -5 | 2,696.8 | -95 | 40.1 |
| Regulatory Adjusted EBITDA (c) = (a) + (b) | 5,377 | 5,606 | -4.1 | 5,089 | 5.7 |
| ▪ | Adjusted IFRS Net Income: -R$ 81 million (115.7% sequential drop), negatively impacted by the R$ 952 million reversal at Chesf of part of the amount recognized as regulatory remeasurement in 2024 following the Periodic Tariff Review of the transmission contracts. |
| ▪ | Investments: R$ 912 million in 1Q25 (down -25.3% YoY), mainly due to the implementation completion of the Coxilha Negra project in April 2025. |
Earnings Release 1Q25 |
|
MAIN FINANCIAL AND OPERATING INDICATORS
Table 2 - Operating Highlights
| 1Q25 | 1Q24 | ∆% | 4Q24 | ∆% | |
| Generation and Trading | |||||
| Installed Generation Capacity (MW) | 44,359 | 44,304 | 0.1 | 44,246 | 0.3 |
| Assured Capacity (aMW) (1) | 21,915 | 22,033 | -0.5 | 21,915 | 0.0 |
| Net Generation (TWh) | 45.5 | 45.1 | 1.1 | 30.3 | 50.2 |
| Energy Sold ACR (TWh) (2) | 10.1 | 9.8 | 3.0 | 9.9 | 2.5 |
| Energy Sold ACL (TWh) (3) | 23.2 | 13.8 | 67.9 | 18.5 | 25.2 |
| Energy Sold Quotas (TWh) (4) | 5.7 | 8.6 | -34.0 | 8.7 | -34.7 |
| Average ACR Price (R$/MWh) | 214.34 | 219.81 | -2.5 | 216.07 | -0.8 |
| Average ACL Price (R$/MWh) | 141.14 | 199.96 | -29.4 | 170.48 | -17.2 |
| Transmission | |||||
| Transmission lines (km) | 74,097 | 73,795 | 0.4 | 74,013 | 0.1 |
| RAP (R$ mm) (5) | 17,164 | 17,702 | -3.0 | 17,095 | 0.4 |
(1) Assured Capacity (AC) reflects: (a) Ordinance GM/MME 544/21, which established the revision of AC values for plants that had their concessions renewed due to the capitalization (Quota regime plants: Tucuruí, Itumbiara, Sobradinho, Mascarenhas de Moraes, and Curuá-Una), leading to a significant AC reduction effective from 2023; (b) Ordinance GM/MME 709/22, which introduced an Ordinary Review of the AC for hydroelectric power plants effective from 2023, impacting several Eletrobras plants; (c) the AC increase at Santa Cruz TPP due to the completion of the Combined Cycle, following ANEEL Order 481 of Feb 23, 2023 that authorized the start of commercial operations for a new generating unit at the plant.
(2) Does not include quotas.
(3) Includes contracts under Law 13.182/2015.
(4) The figures presented refer to the Assured Capacity of quotas in GWh.
(5) Approved RAP for the current regulatory cycle, considering the modules in operation at the end of each period—including those active at the start of the cycle, as well as new modules that entered commercial operation. Includes transmission contracts from Eletrobras Holding, Chesf, CGT Eletrosul, Eletronorte, TMT, and VSB.
Table 3 - Financial Highlights
| 1Q25 | 1Q24 | ∆% | 4Q24 | ∆% | |
| Financial Indicators | |||||
| Gross Revenue | 12,222 | 10,571 | 15.6 | 13,914 | -12.2 |
| Adjusted Gross Revenue | 12,222 | 10,571 | 15.6 | 13,914 | -12.2 |
| Net Operating Revenue | 10,414 | 8,718 | 19.5 | 12,025 | -13.4 |
| Adjusted Net Operating Revenue | 10,414 | 8,718 | 19.5 | 12,025 | -13.4 |
| Regulatory Net Operating Revenue | 9,708 | 9,700 | 0.1 | 10,704 | -9.3 |
| EBITDA | 4,318 | 4,620 | -6.5 | 5,027 | -14.1 |
| Adjusted EBITDA | 4,416 | 4,530 | -2.5 | 4,672 | -5.5 |
| Regulatory EBITDA | 5,485 | 5,696 | -3.7 | 5,444 | 0.8 |
| Adjusted Regulatory EBITDA | 5,377 | 5,606 | -4.1 | 5,089 | 5.7 |
| EBITDA Margin (%) | 41.5 | 53.0 | -11.5pp | 41.8 | -0.4pp |
| Adjusted EBITDA Margin (%) | 42.4 | 52.0 | -9.5pp | 38.9 | 3.6pp |
| Return on Equity (ROE %) | 8.0 | 3.8 | 4.1pp | 8.5 | -0.5pp |
| Adjusted Gross Debt | 71,192 | 59,734 | 19.2 | 74,646 | -4.6 |
| Adjusted Net Debt (Adj Net Debt) | 39,272 | 40,835 | -3.8 | 37,671 | 4.3 |
| Adj Net Debt/Adjusted LTM EBITDA | 1.5 | 2.2 | -30.7 | 1.5 | 4.7 |
| Net Income | -354 | 331 | -207.0 | 1,112 | -131.8 |
| Adjusted Net Income | -81 | 447 | -118.2 | 517 | -115.7 |
| Investments | 912 | 1,221 | -25.3 | 2,775 | -67.1 |
Earnings Release 1Q25 |
|
HIGHLIGHTS OF CONSOLIDATED RESULTS
1. CONSOLIDATED RESULT | IFRS AND REGULATORY
Table 4 - Income Statement IFRS (R$ mm)
| 1Q25 | 1Q24 | 4Q24 | |||||
| IFRS | Adjustment | Adjusted | Adjusted | % Y/Y | Adjusted | % Q/Q | |
| Generation | 6,967 | 0 | 6,967 | 5,933 | 17.4 | 7,986 | -12.8 |
| Transmission | 5,186 | 0 | 5,186 | 4,559 | 13.8 | 5,773 | -10.2 |
| Others | 69 | 0 | 69 | 79 | -13.4 | 155 | -55.7 |
| Gross Revenue | 12,222 | 0 | 12,222 | 10,571 | 15.6 | 13,914 | -12.2 |
| (-) Deductions from Revenue | -1,807 | 0 | -1,807 | -1,853 | -2.5 | -1,889 | -4.3 |
| Net Revenue | 10,414 | 0 | 10,414 | 8,718 | 19.5 | 12,025 | -13.4 |
| Energy resale, grid, fuel and construction | -3,862 | 0 | -3,862 | -2,856 | 35.2 | -5,385 | -28.3 |
| Personnel, Material, Services and Others | -1,658 | 191 | -1,467 | -1,594 | -8.0 | -2,040 | -28.1 |
| Operating provisions | -126 | 41 | -86 | -314 | -72.7 | -406 | -78.9 |
| Regulatory remeasurements - Transmission contracts | -952 | 0 | -952 | 0 | 0.0 | 0 | 0.0 |
| Other income and expenses | 133 | -133 | 0 | 0 | 0.0 | 0 | 0.0 |
| EBITDA, before Equity holdings | 3,950 | 99 | 4,049 | 3,954 | 2.4 | 4,194 | -3.5 |
| Equity holdings | 368 | 0 | 368 | 576 | -36.1 | 478 | -23.1 |
| EBITDA | 4,318 | 99 | 4,416 | 4,530 | -2.5 | 4,672 | -5.5 |
| D&A | -1,112 | 0 | -1,112 | -997 | 11.6 | -1,033 | 7.7 |
| EBIT | 3,205 | 99 | 3,304 | 3,533 | -6.5 | 3,639 | -9.2 |
| Financial Result | -3,494 | 173 | -3,321 | -2,781 | 19.4 | -2,755 | 20.5 |
| EBT | -289 | 272 | -16 | 752 | -102.2 | 884 | -101.9 |
| Income Tax and Social Contribution | -65 | 0 | -65 | -305 | -78.7 | -367 | -82.3 |
| Net Income | -354 | 272 | -81 | 447 | -118.2 | 517 | -115.7 |
Earnings Release 1Q25 |
|
Table 5 - Regulatory IS (R$ mm)
| 1Q25 | 1Q24 | 4Q24 | |||||
| Regulatory | Adjustment | Adjusted | Adjusted | % Y/Y | Adjusted | % Q/Q | |
| Generation | 7,023 | 0 | 7,023 | 6,365 | 10.3 | 8,018 | -12.4 |
| Transmission | 4,423 | 0 | 4,423 | 5,110 | -13.4 | 4,419 | 0.1 |
| Others | 69 | 0 | 69 | 78 | -12.4 | 156 | -55.9 |
| Gross Revenue | 11,515 | 0 | 11,515 | 11,553 | -0.3 | 12,593 | -8.6 |
| (-) Deductions from Revenue | -1,807 | 0 | -1,807 | -1,853 | -2.5 | -1,889 | -4.3 |
| Net Revenue | 9,708 | 0 | 9,708 | 9,700 | 0.1 | 10,704 | -9.3 |
| Energy resale, grid, fuel and construction | -3,152 | 0 | -3,152 | -2,390 | 31.9 | -3,757 | -16.1 |
| Personnel, Material, Services and Others | -1,664 | 191 | -1,473 | -1,607 | -8.3 | -2,074 | -29.0 |
| Operating provisions | 89 | -166 | -77 | -544 | -85.8 | -150 | -48.5 |
| Regulatory remeasurements - Transmission contracts | 0 | 0 | 0 | 0 | 0.0 | 0 | 0.0 |
| Other income and expenses | 133 | -133 | 0 | 0 | 0.0 | 0 | 0.0 |
| EBITDA, before Equity holdings | 5,114 | -108 | 5,006 | 5,160 | -3.0 | 4,724 | 6.0 |
| Equity holdings | 371 | 0 | 371 | 446 | -16.8 | 365 | 1.7 |
| EBITDA | 5,485 | -108 | 5,377 | 5,606 | -4.1 | 5,089 | 5.7 |
| D&A | -1,592 | 0 | -1,592 | -1,478 | 7.7 | -1,620 | -1.7 |
| EBIT | 3,893 | -108 | 3,785 | 4,127 | -8.3 | 3,469 | 9.1 |
| Financial Result | -3,656 | 380 | -3,276 | -2,870 | 14.2 | -3,035 | 7.9 |
| EBT | 237 | 272 | 509 | 1,258 | -59.5 | 434 | 17.2 |
| Income Tax and Social Contribution | -101 | 0 | -101 | -370 | -72.6 | 663 | -115.3 |
| Net Income | 136 | 272 | 408 | 887 | -54.0 | 1,097 | -62.8 |
Earnings Release 1Q25 |
|
2. ADJUSTED REGULATORY INCOME STATEMENT
This section presents the reconciliation between Regulatory and IFRS Income Statements, along with the adjustments related to non-recurring events in the Regulatory Income Statement.
Additional explanations are provided in Appendix 4 of this report to support a better understanding of the topics.
A detailed reconciliation is also available in the ‘Regulatory and Corporate Income Statement Reconciliation’ spreadsheet, accessible on Company's IR website in the Results Center, under ‘Attachments’.
Table 6 - Regulatory IS x IFRS IS(R$ mm)
|
1Q25 IFRS |
Difference | 1Q25 Regulatory | Adjustment | 1Q25 Regulatory Adjusted | |
| Generation | 6,967 | 56 | 7,023 | 0 | 7,023 |
| Transmission | 5,186 | -763 | 4,423 | 0 | 4,423 |
| Others | 69 | 0 | 69 | 0 | 69 |
| Gross Revenue | 12,222 | -707 | 11,515 | 0 | 11,515 |
| (-) Deductions from Revenue | -1,807 | 0 | -1,807 | 0 | -1,807 |
| Net Revenue | 10,414 | -707 | 9,708 | 0 | 9,708 |
| Construction | -745 | 745 | 0 | 0 | 0 |
| Energy resale | -1,560 | -183 | -1,743 | 0 | -1,743 |
| Grid | -996 | 148 | -849 | 0 | -849 |
| Fuel | -560 | 0 | -560 | 0 | -560 |
| Energy resale, grid, fuel and construction | -3,862 | 710 | -3,152 | 0 | -3,152 |
| Personnel | -952 | -4 | -956 | 150 | -806 |
| Material | -52 | 0 | -52 | 0 | -52 |
| Services | -438 | 0 | -438 | 42 | -396 |
| Others | -217 | -3 | -219 | 0 | -219 |
| Personnel, Material, Services and Others | -1,658 | -6 | -1,664 | 191 | -1,473 |
| Operating provisions | -126 | 216 | 89 | -166 | -77 |
| Regulatory remeasurements - Transmission contracts | -952 | 952 | 0 | 0 | 0 |
| Other income and expenses | 133 | 0 | 133 | -133 | 0 |
| EBITDA, before Equity holdings | 3,950 | 1,164 | 5,114 | -108 | 5,006 |
| Equity holdings | 368 | 3 | 371 | 0 | 371 |
| EBITDA | 4,318 | 1,167 | 5,485 | -108 | 5,377 |
| D&A | -1,112 | -479 | -1,592 | 0 | -1,592 |
| EBIT | 3,205 | 688 | 3,893 | -108 | 3,785 |
| Financial Result | -3,494 | -163 | -3,656 | 380 | -3,276 |
| EBT | -289 | 526 | 237 | 272 | 509 |
| Income Tax and Social Contribution | -65 | -36 | -101 | 0 | -101 |
| Net Income, continued | -354 | 489 | 136 | 272 | 408 |
Earnings Release 1Q25 |
|
Adjustments of non-recurring events
The following adjustments are based on events deemed non-recurring:
| • | PMSO, Personnel: R$ 150 million, of which R$ 96.4 million was VDPs and R$ 53.3 million was severance. |
| • | PMSO, Services: R$ 42 million for legal consulting related to the contingency reduction strategy. |
| • | Operational Provisions: -R$ 166 million in provisions to litigation, to the settlement of lawsuits related to compulsory loan, to estimated losses on investments and asset impairment, as well as to monetary adjustment of onerous contracts. |
| • | Other Income and Expenses: -R$ 133 million with the entire line adjusted, being R$ 48 million related to the sale of the deactivated TPP Santana and R$ 85 million from an agreement with suppliers. |
| • | Financial Result: R$ 380 million linked to the monetary update of compulsory loan and litigation. |
Earnings Release 1Q25 |
|
3. ADJUSTED EBITDA
Adjusted Regulatory EBITDA
In 1Q25, Adjusted Regulatory EBITDA totaled R$ 5,377 million, down R$ 229 million compared to 1Q24, reflecting lower transmission revenue, higher costs for energy purchased for resale, and a reduced contribution from equity income—partially offset by higher generation revenue, lower PMSO expenses, and a reduced volume of provisions recognized during the quarter.
It is worth noting that the decrease in EBITDA can also be explained by a negative financial result in the short-term market (CCEE), due to the higher settlement volume, which had a negative net effect mainly caused by price differences between submarkets. The increase in free market trading reflects a strategy that favored higher contracting in 1Q25, rather than maintaining uncontracted energy volumes for the rest of the year.
It is important to highlight that this portfolio optimization strategy is based on a balanced assessment of supply and demand risks under prospective scenarios throughout the year. These assumptions are continuously reviewed and recalibrated.
Table 7 - Adjusted Regulatory EBITDA (R$ mm)
| 1Q25 | 1Q24 | % | 4Q24 | % | |
| Net Revenue (1) | 9,708 | 9,700 | 0.1 | 10,704 | -9.3 |
| Energy resale, grid charges, fuel | -3,152 | -2,390 | 31.9 | -3,757 | -16.1 |
| - Personnel, Material, Services and Others | -1,473 | -1,607 | -8.3 | -2,074 | -29.0 |
| - Operating provisions (1) | -77 | -544 | -85.8 | -150 | -48.5 |
| - Other income and expenses | 0 | 0 | 0.0 | 0 | 0.0 |
| + Equity Holdings | 371 | 446 | -16.8 | 365 | 1.7 |
| Adjusted Regulatory EBITDA | 5,377 | 5,606 | -4.1 | 5,089 | 5.7 |
(1) Recognizes the amount of R$ 432 million in 1Q24 related to revenue from Amazonas Energia. Due to default, these balances are also fully recognized in operating provisions. In 4Q24 and 1Q25, the revenue from thermal plants was recognized without any corresponding provision. As part of HPP Balbina's revenue remained—and continues to remain—in default, the amounts of R$ 32 million in 4Q24 and R$ 56 million in 1Q25 were provisioned.
Generation revenue was R$ 7,023 million in 1Q25, up R$ 658 million compared to 1Q24, mainly due to higher revenues in the free contracting environment (ACL) of R$ 753 million and in the regulated contracting environment (ACR) of R$ 263 million, which were partially offset by lower revenues from plants under the quota regime of R$ 268 million, and from the short-term market of R$ 89 million.
The increase in revenue was accompanied by higher costs associated with generation, of R$ 762 million, reaching R$ 3,152 million in 1Q25. Of note were expenses with energy purchased for resale and fuel for electricity production, which went up by R$ 830 million and R$ 54 million, respectively, while expenses with network usage charges fell by R$ 123 million.
Still on generation, it is also worth noting the progress in receivables related to energy sold by Eletrobras thermal plants and by Balbina HPP to Amazonas Energia (AmE) following the resumption of its recognition in 3Q24. In 1Q25 the regulatory gross revenue from energy sold by thermal plants and Balbina HPP totaled R$1.3 billion. Approximately 88% of the total was billed under the Reserve Energy Contract (CER) and was received through the Reserve Energy Charge. It is worth noting that in 1Q25 there is no more volume to be converted into CER. The remaining 12%, billed to AmE is divided into two groups:
(a) Sales contracts from thermal plants classified as Independent Power Producers, which were paid by AmE (3% of the total); and
(b) Energy sold by Balbina HPP (9% of the total).
The only unpaid portion in the quarter, of R$ 56 million, corresponds to approximately 48% of the energy sold by Balbina HPP, and it accounts for the difference between regulatory and IFRS gross revenue. In the IFRS accounting, this portion was not recognized as revenue, whereas in the regulatory accounting, it was recognized and fully provisioned.
Earnings Release 1Q25 |
|
Table 8 - Amazonas Energia (R$ mm)
| Regulatory | IFRS | |
| Gross Revenue, HPP Balbina | 118 | 62 |
| Paid | 62 | 62 |
| Outstanding | 56 | 0 |
| Provision, HPP Balbina | -56 | 0 |
Transmission revenue was R$ 4,423 million in 1Q25, down R$ 687 million from 1Q24, mainly driven by reductions in Annual Permitted Revenue (RAP) and the Adjustment Portion (PA), revised as part of the Periodic Tariff Adjustment and Annual Adjustment processes for the 2024-2025 regulatory cycle, which started in July 2024.
Personnel, Material, Services and Others (PMSO) went down by R$ 134 million YoY, totaling R$ 1,473 million in 1Q25. This decrease is primarily driven by the gains from various initiatives implemented by the Company to improve staff efficiency, as well as adjustments to processes and the organizational structure.
Provisions decreased R$ 467 million, reaching R$ 77 million in 1Q25, from R$ 544 million in 1Q24 . This reduction essentially reflects the sharp decline in defaults on energy sales to Amazonas Energia, from R$432 million in 1Q24 to R$56 million in 1Q25, given that in 2024, energy sold by both the thermal plants and Balbina HPP was in default, whereas in 2025, defaults were limited to only the portion of energy sold by Balbina.
Finally, equity income represented a YoY improvement of R$ 75 million, reaching R$ 371 million in 1Q25.
Adjusted IFRS EBITDA
Adjusted IFRS EBITDA reached R$ 4,416 million in 1Q25, down -2.5% from 1Q24.
The increase in transmission and generation revenues, along with reductions in PMSO and provision expenses, was not enough to offset the increase in expenses with energy purchased for resale and the lower contribution from equity income.
Table 9 - Adjusted IFRS EBITDA (R$ mm)
| 1Q25 | 1Q24 | % | 4Q24 | % | |
| Net Revenue | 10,414 | 8,718 | 19.5 | 12,025 | -13.4 |
| Energy resale, grid charges, fuel | -3,862 | -2,856 | 35.2 | -5,385 | -28.3 |
| Regulatory remeasurement – Transmission Contracts | -952 | 0 | 0.0 | 0 | 0.0 |
| - Personnel, Material, Services and Others | -1,467 | -1,594 | -8.0 | -2,040 | -28.1 |
| - Operating provisions | -86 | -314 | -72.7 | -406 | -78.9 |
| - Other income and expenses | 0 | 0 | 0.0 | 0 | 0.0 |
| + Equity Holdings | 368 | 576 | -36.1 | 478 | -23.1 |
| Adjusted IFRS EBITDA | 4,416 | 4,530 | -2.5 | 4,672 | -5.5 |
The table detailing the EBITDA calculation, in accordance with CVM Resolution 156/2022, is presented in Appendix 5 of this document.
Earnings Release 1Q25 |
|
4. ENERGY TRADING
Eletrobras companies sold 39.0 TWh of energy in 1Q25, up 20.9% compared to the 32.3 TWh traded in 1Q24. The volumes sold include energy from plants under the quota regime, renewed under Law 12,783/2013, as well as from plants operating under the ACL and ACR exploration regimes and Special Purpose Entities - SPEs, consolidated: HPPs Teles Pires (starting Oct/23), Baguari (starting Oct/23), Retiro Baixo (starting Nov/23), and Santo Antônio (starting Nov/23).
Table 10 - Energy Balance 1Q25 (aMW)
| 2025 | 2026 | 2027 | ||||
| Resources with no impact on the balance sheet (1) | 964 | 0 | 0 | |||
| Resources (A) | 16,213 | 16,621 | 17,692 | |||
| Own resources (2) (3) (4) (5) | 14,155 | 15,418 | 16,570 | |||
| Hydraulic | 13,915 | 15,161 | 16,313 | |||
| Wind | 240 | 257 | 257 | |||
| Energy Purchase | 2,058 | 1,204 | 1,122 | |||
| Limit => | Lower | Higher | Lower | Higher | Lower | Higher |
| Sales (B) (6) | 11,180 | 13,680 | 9,003 | 11,003 | 6,820 | 8,320 |
| ACR - Except quotas | 3,424 | 3,503 | 3,070 | |||
| ACL - Bilateral Contracts + STM implemented (range) (6) | 7,756 | 10,256 | 5,500 | 7,500 | 3,750 | 5,250 |
| Average prices Contracts signed | ||||||
| Limit => | Lower | Higher | Lower | Higher | Lower | Higher |
| Average Price of Sales Contracts (ACR and ACL - R$/MWh) | 170 | 180 | 185 | 205 | 190 | 220 |
| Balance (A - B) | 5,032 | 2,532 | 7,618 | 5,618 | 10,873 | 9,373 |
| Balance considering estimated hedge (9) | 2,500 | 0 | 4,859 | 2,859 | 7,904 | 6,404 |
| Uncontracted energy considering estimated hedge (9) | 15% | 0% | 29% | 17% | 45% | 36% |
Contracts signed until 3/31/2025.
The energy balance reflects the SPEs consolidated into Eletrobras, including Santo Antônio HPP (since 3Q22) and HPPs Baguari and Retiro Baixo (since 4Q23) in terms of resources, sales, and average prices. Similarly, Teles Pires HPP, the SPE consolidated into Eletronorte (since 4Q23), is also included.
| 1. | The energy balance does not include Independent Power Producers (IPPs) contracts resulting from the Amazonas Distribuidora de-verticalization process, thermal plant availability contracts, or Assured Capacity Quotas, whether in terms of resources, requirements (sales), or average prices. These resources are recorded only for 2025 and are not considered for future years due to divestments. |
| 2. | Own Resources include the decotization plants (new IPPs) and the New Grants—Sobradinho, Itumbiara, Tucuruí, Curuá-Una, and Mascarenhas de Moraes. For hydroelectric projects, the estimate of GFIS2 was used, representing Assured Capacity adjusted for Internal Losses, Losses in the Basic Grid, Availability, and portfolio-specific factors. |
| 3. | The revised Assured Capacity values, as outlined in Ordinance No. 709/GM/MME, of November 30, 2022, have been taken into account. |
| 4. | With the gradual phasing out of legacy contracts (decotization), plants currently operating under the quota regime are gradually granted new concessions under the IPP regime over a five-year period beginning in 2023. The Assured Capacity values were established in Ordinance GM/MME No. 544/21. |
| 5. | Considering the new concession grants from 2023 onward for the Sobradinho, Itumbiara, Tucuruí, Curuá-Una, and Mascarenhas de Moraes plants, whose Assured Capacity values were established in Ordinance GM/MME No. 544/21. |
| 6. | The balances include intercompany transactions, impacting both energy purchase and sales lines in the ACL, in the following amounts: approximately 800 aMW in 2025, 200 aMW in 2026 and 2027 and 150 aMW in 2028. |
Table 11 - Assured Capacity Quotas of Hydroelectric Power Plants (aMW)
| 2025 | 2026 | 2027 | |
| Assured Capacity Quotas | 2,626 | 1,313 | 0 |
| 7. | This excludes the Assured Capacity of Jaguari HPP (12.7 aMW), whose concession remains under Eletrobras’ provisional management. |
| 8. | Decotization occurs gradually over a five-year period beginning in 2023. The Assured Capacity values applied from 2023 onward are those established in Ordinance GM/MME No. 544/21. |
| 9. | The figures represent an estimate of uncontracted energy. The projected value for 2025 is 83.5%, while for subsequent years, the average historical GSF from 2019 to 2023 of 82.7% was considered. Source: CCEE, obtained from the CCEE website at the following link: CCEE Data and Analysis (in Portuguese only, select the MRE option in the panel). It is important to note that this is only an estimate, based on historical data and past events. |
Earnings Release 1Q25 |
|
5. INVESTMENTS AND EXPANSION PROJECTS
Investments in 1Q25 totaled R$ 912 million, with R$ 655 million allocated to transmission, R$ 167 million to generation, R$ 43 million to infrastructure and R$ 47 million to the environmental area.
The amount invested in infrastructure was allocated as follows: 53% to socio-environmental initiatives, 20% to IT, 17% to real estate, and 10% to equipment and vehicles. In the socio-environmental area, key highlights included investments related to the maintenance of operating licenses for power plants and substations, seismological monitoring, water quality and wildlife monitoring, as well as land compensation.
Table 12 - Investments (R$ mm)
| 1Q25 | 1Q24 | % | 4Q24 | % | |
| Generation Corporate | 167 | 502 | -66.8 | 827 | -79.9 |
| Implementation / Expansion | 37 | 298 | -87.7 | 283 | -87.1 |
| Maintenance | 130 | 204 | -36.4 | 543 | -76.1 |
| Transmission Corporate | 655 | 627 | 4.6 | 1,442 | -54.5 |
| Expansion | 54 | 4 | 1,420.7 | 136 | -60.3 |
| Reinforcements and improvements | 596 | 599 | -0.4 | 1,266 | -52.9 |
| Maintenance | 5 | 24 | -78.9 | 40 | -87.1 |
| Infrastructure | 43 | 19 | 127.6 | 381 | -88.6 |
| Environmental | 47 | 69 | -31.6 | 126 | -62.8 |
| SPEs | 0 | 5 | -100.0 | 0 | 0.0 |
| Generation - Contributions | 0 | 0 | 0.0 | 0 | 0.0 |
| Generation - Acquisition | 0 | 0 | 0.0 | 0 | 0.0 |
| Transmission - Contributions | 0 | 5 | -100.0 | 0 | 0.0 |
| Transmission - Acquisition | 0 | 0 | 0.0 | 0 | 0.0 |
| Total | 912 | 1,221 | -25.3 | 2,775 | -67.1 |
Earnings Release 1Q25 |
|
Generation
Investments in generation totaled R$ 167 million in 1Q25, compared to R$ 502 million in 1Q24.
The reduction is mainly explained by decreased expenses associated with the expansion of CGT Eletrosul, as the Coxilha Negra Wind Farm project nears completion .
In 1Q25, main expenditures were allocated to
Earnings Release 1Q25 |
|
Transmission
Investments in transmission totaled R$ 655 million in 1Q25, mainly in reinforcements and improvements (R&I) that reached R$ 596 million, a stable level compared to 1Q24. Investments in expansions reached R$ 54 million, reflecting the progress of activities in transmission lines and substations related to lots won in auctions in recent years.
In 1Q25, expenditures were distributed as follows:
Earnings Release 1Q25 |
|
Expansion Projects - Transmission
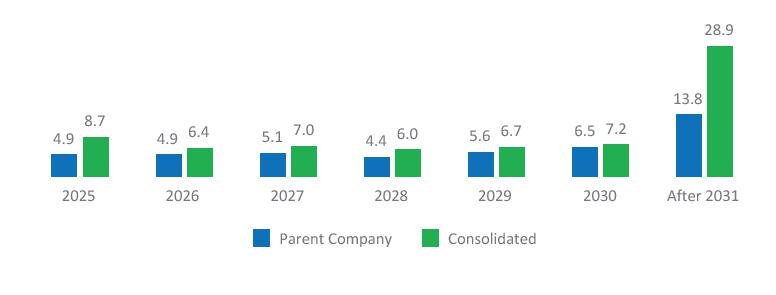
Large-Scale Projects
| ▪ | Sampling: 240 projects3, including the Itaipu HVDC System Revitalization project. In 1Q25, the sample was reduced from 241 to 240 projects, due to 9 exclusions—8 of which were energized and 1 was revoked—while 8 new authorizations were issued by the regulator. |
| ▪ | Estimated investment: R$13.1 billion, excluding the Itaipu HVDC System Revitalization project, as Eletrobras is responsible solely for the execution, and therefore does not benefit from associated revenue while being fully reimbursed for the amount disbursed. |
| ▪ | Additional associated RAP: R$1.8 billion between 2025-2030. |
| ▪ | Auctions: the following SPEs stand out: Nova Era Janapu, which was part of the sample since 2Q24, while Nova Era Catarina, Nova Era Ceará, Nova Era Integração and Nova Era Teresina were added in 3Q244. In addition, the sample also includes a lot awarded at Auction 01/2022, won by Eletronorte. |
Small-Scale Projects
| ▪ | Sampling: database of the Improvement and Reinforcement Plan Management System (SGPMR). |
| ▪ | Projects: 9,635 small-scale events under implementation or to be implemented, of which 9,077 were improvements and 558 were reinforcements. |
Expansion Projects - Generation
Two projects are currently under construction and, once completed, will add approximately 330 MW to Eletrobras’ installed capacity.
Coxilha Negra Wind Farm (302.4 MW capacity, located in Rio Grande do Sul state)
| ▪ | Estimated Investment: R$2.4 billion |
| ▪ | Completion of assembly for 72 wind turbines. |
| ▪ | As of March 31, 2025, 63 wind turbines were in commercial operation, with another 8 undergoing testing. |
| ▪ | On April 4, 2025, the commissioning of the last wind turbine was completed and test operations began. |
| ▪ | Implementation concluded in April 2025 |
| ▪ | Testing began in February 2024, with commercial operations starting gradually in July 2024. By 1Q25, 71 wind turbines were operating, and the final unit began testing in April 2025. |
| ▪ | The project is currently in its final stages, which include resolving outstanding documentation, completing operations of the wind farm and the exclusive-use transmission system, demobilizing the construction site, and restoring degraded areas. These activities do not impact the project’s operation and are accounted for in the contract. |
3 Referring to reinforcements, improvements and auction projects. Considers projects registered in ANEEL's Transmission Management System (SIGET). Projects are included when added to the system and excluded when they are canceled or enter commercial operation. The 240 projects will add approximately 2,400 km of transmission lines and 12,000 MVA in substations.
4 Each of the 5 SPEs created holds the contracts signed in last years' transmission auctions. SPE Nova Era Janapu holds contract no. 09/2023-ANEEL for the 4th lot of Auction 01-2023; SPE Nova Era Teresina holds contract no. 04/2024-ANEEL for the 1st lot of Auction 01-2024; SPE Nova Era Ceará holds contract no. 06/2024-ANEEL for the 3rd lot of Auction 01-2024; SPE Nova Era Integração holds contract no. 08/2024-ANEEL for the 5th lot of Auction 01-2024; and SPE Nova Era Catarina holds contract no. 12/2024-ANEEL for the 9th lot of Auction 01-2024.
Earnings Release 1Q25 |
|
Casa Nova B Wind Farm (27 MW capacity, located in Bahia state)
| ▪ | Estimated Investment: R$ 151 million |
| ▪ | Physical implementation progress: 86% |
| ▪ | Considering both phases of the project: Casa Nova A, which accounts for 60% of the project, is 100% complete, while Casa Nova B, representing the remaining 40%, is 66% complete. |
| ▪ | Physical works: Completion and adjustments to wind turbine access, installation of identification plates along the cable route, testing and voltage verification of power cables. |
| ▪ | Other advances: |
| ▪ | Installation and energization of a capacitor bank at the Casa Nova II substation, in compliance with requirements from ONS and ANEEL. |
| ▪ | Expected start of full operations: 3Q27, with the possibility of an earlier start depending on transmission system access. This access is exclusively subject to technical conditions beyond the Company’s control, as these are projects managed by other agents. |
Earnings Release 1Q25 |
|
6. INDEBTEDNESS
Net debt totaled R$ 39.3 billion in 1Q25, up R$ 1.60 billion from 4Q24 and down R$ 1.56 billion from 1Q24. The Net Debt/Adjusted Regulatory EBITDA LTM ratio reached 1.7x in 1Q25, 1.6x in 4Q24 and 1.8x in 1Q24.
As a result of liability management and a 200 bps increase in the Brazilian basic interest rate (Selic), the Company's average debt maturity was extended by 12.6 months, while the total average cost decreased to CDI + 0.15% p.a. in 1Q25 from CDI + 0.93% p.a. in 1Q24.
Deserves highlight the maturity in February of the 2025 Bond, with a principal amount of US$ 500 million. On the funding side, the highlight of the quarter was the issuance of bank debt by Eletronorte in the amount of R$ 500 million (equivalent to US$86.5 million), to strengthen cash position. The issuance carries a SOFR + 0.45% rate, swapped to CDI + 0.44% p.a., with maturity on March 1, 2026.
Table 15 - Net Debt (R$ mm)
| 03/31/2025 | 12/31/2024 | 03/31/2024 | |
| (+) Gross Debt | 70,890 | 75,621 | 59,541 |
| (+) Derivatives (currency hedge) Net | 302 | -974 | 193 |
| (-) Cash and Cash Equivalents + Current Securities | 30,281 | 35,524 | 17,327 |
| (-) Restricted Cash for Loans and Financing | 994 | 813 | 918 |
| (-) Loans receivable | 644 | 639 | 654 |
| Net Debt | 39,272 | 37,671 | 40,835 |
Chart 1 - Loans and Financing Payable (R$ billion)
Earnings Release 1Q25 |
|
Table 16 - Gross Debt Breakdown
| Creditor | Index | Average cost (per year) | Total Balance (R$ million) |
Share of Total (%) |
| Debêntures & Commercial papers | CDI | CDI + 0.09% to 2.20% | 24,102 | 34.0 |
| Debêntures & Commercial papers | IPCA | IPCA + 3.75% to 7.029% | 15,680 | 22.1 |
| BNDES | TJLP, IPCA | IPCA + 5.38% to 6.41%; TJLP to TJLP + 3.28% | 6,296 | 8.9 |
| Banco do Brasil | CDI, IPCA, TJLP | TJLP + 1.89% to 2.13%, CDI + 2% to 2.25%, IPCA to 6.56% | 2,059 | 2.9 |
| Banco do Nordeste do Brasil | IPCA, TFC | IPCA + 2.33% to 6.56%, 2.94% to 9.5% | 1,485 | 2.1 |
| Caixa Econômica Federal | IPCA | IPCA + 6.56% | 1,483 | 2.1 |
| Bradesco | IPCA, CDI | IPCA + 6.56%, CDI + 2.09% to 2.17% | 1,344 | 1.9 |
| Itaú | IPCA, CDI | IPCA + 6.56%, CDI + 0.30% to 2.28% | 503 | 0.7 |
| Other Creditors | CDI, IPCA, TJLP, Fixed Rate | CDI + 0.19% to 2.20%, IPCA + 6.56%; 2.94% to 10%; TJLP + 5% | 5,588 | 7.9 |
| Foreign Currency - Bonds and other debts | USD | 1.40% to 4.63% | 11,638 | 16.4 |
| Foreign currency - other debts | EUR | 2.00% to 4.4212% | 712 | 1.0 |
| TOTAL | 70,890 | 100.0 |
*It is important to note that the Company has carried out exchange rate hedge operations for certain foreign currency debts. The data below presents these debts along with their respective equivalent rates (post-hedge) linked to the CDI:
Bonds 2025 - 97.41% of CDI
Bonds 2030 - CDI + 1.70% p.a.
Bonds 2035 - 122.59% of CDI
Citibank - CDI + 0.19% to 1.70% p.a.
Itaú - CDI + 0.30% p.a.
** Exposure to BNDES only considers contracts under the BNDES direct line.
Earnings Release 1Q25 |
|
7. COMPULSORY LOAN
Eletrobras has implemented measures to mitigate risks associated with legal proceedings related to compulsory loans on electricity, which involve the monetary adjustment of book-entry credits.To address this, the Company has strengthened its legal defense strategy and pursued settlements with discounts and full resolution of lawsuits.
As a result of the negotiations:
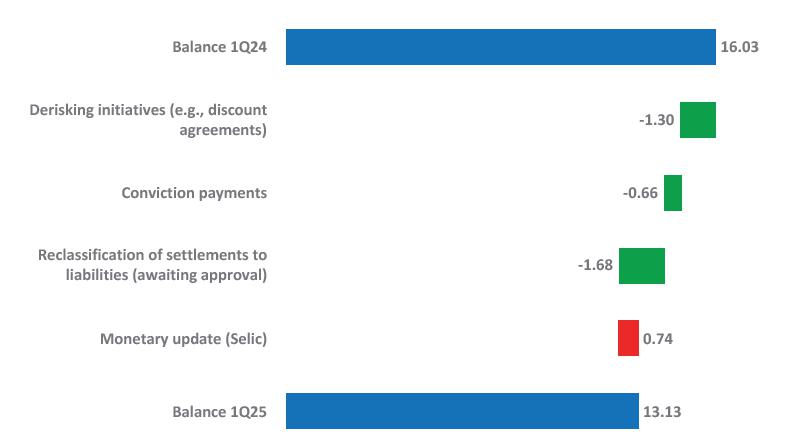
| ▪ | the inventory of provisions was reduced by R$ 447 million compared to 4Q24 and R$ 2.9 billion compared to 1Q24, totaling R$ 13.1 billion in 1Q25, mainly due to the agreements signed; |
| ▪ | net reversal of R$ 200 million in provisions due to agreements signed and favorable decisions in 1Q25; |
| ▪ | as a result of the reduction in provision inventory, financial expenses related to monetary restatement decreased to R$ 173 million in 1Q25 from R$ 207 million in 1Q24 and R$ 175 million in 4Q24 . |
Thus, as from 3Q22, when negotiations began, the provision inventory related to this set of lawsuits fell by R$ 12.7 billion, from R$25.8 billion to the current R$ 13.1 billion, even considering the accumulated monetary restatement of R$2.5 billion in the period. In addition, the agreements signed also allowed for the elimination of R$8.5 billion in legal risks considered "off balance", of which R$ 791 million classified as possible and R$ 7.7 billion as remote. These reductions are in line with the Company's strategy of reducing its legacy legal liabilities.
Chart 2 - Total inventory of compulsory loan provisions (R$ bn)
Earnings Release 1Q25 |
|
8. CASH FLOW
In 1Q25, funds generated by operating activities reached R$ 6.0 billion, up R$ 2.7 billion from the R$ 3.3 billion recorded in 1Q24. It is worth highlighting this quarter the receipt of approximately R$ 1.0 billion—related to energy sold by thermal plants to Amazonas Energia in 1Q25, portion that had been in default in 1Q24.
Operating cash generation in 1Q25 was allocated to:
| ▪ | dividends (R$ 2.2 billion), |
| ▪ | debt service (R$ 1.9 billion), |
| ▪ | investments (R$ 1.9 billion), |
| ▪ | litigation (R$ 0.5 billion). |
Table 17 - Cash Flow (R$ bn)
| 1Q25 | 1Q24 | ∆% | |
| Ajusted Regulatory EBITDA, before Equity Holdings | 5.01 | 5.16 | -3.0 |
| EBITDA Adjustment | 0.11 | 0.09 | 19.6 |
| Income Tax and Social Contribution | -0.24 | -0.32 | -26.0 |
| Working Capital | 1.77 | -0.89 | -299.9 |
| Privatization Charges | -0.89 | -0.85 | 4.8 |
| Dividends Received | 0.28 | 0.14 | 91.8 |
| Operating Cash Flow | 6.04 | 3.34 | 80.9 |
| Investments * | -1.87 | -1.82 | 2.5 |
| Free Cash Flow | 4.17 | 1.52 | 174.8 |
| Debt Service | -1.91 | -1.54 | 24.6 |
| Litigation | -0.53 | -0.24 | 117.4 |
| Guarantees and Restricted Deposits | -0.51 | -0.21 | 145.6 |
| Supplementary social security | -0.02 | -0.12 | -86.0 |
| Net Funding ** | -4.46 | -0.63 | 612.0 |
| Receipt of Loans and Financial Charges | 0.00 | 0.00 | -72.0 |
| Disposal of equity holdings | 0.01 | 0.00 | 649.3 |
| Dividends | -2.19 | 0.00 | n.m. |
| Free Net Cash | -5.43 | -1.21 | 348.1 |
| Change in Restricted Cash (short and long term) | -0.27 | -0.64 | -58.3 |
| Change in Financial Investments (long-term) | -0.01 | 0.00 | n.m. |
| Net Cash | -5.71 | -1.85 | 208.2 |
*Excludes generation contributions.
**Net funding: debt raised, net of issuance costs.
Earnings Release 1Q25 |
|
FINANCIAL AND OPERATING RESULTS ANALYSIS
9. FINANCIAL PERFORMANCE
9.1. Operating Revenue
Regulatory Generation Revenue
Adjusted regulatory revenue was R$ 7,023 million in 1Q25, R$ 56 million lower than adjusted IFRS generation revenue, reflecting the different treatment of the portion of revenue from Amazonas Energia related to outstanding unpaid amounts for energy sold by Balbina HPP.
Generation Revenue by Contracting Environment
When comparing 1Q25 x 1Q24 x 4Q24 there are no M&A effects.
Excluding the portion from construction, regulatory adjusted revenue from energy sales across all contracting environments totaled R$ 7,023 million in 1Q25, reflecting an YoY increase of R$ 658 million.
The positive highlights were the respective increases of R$ 753 million and R$ 263 million million in the free contracting and regulated market environments. On the other hand, there was a R$ 268 million reduction in revenue from O&M energy sales from plants under the quota regime. Finally, revenue in the short-term market fell by R$ 89 million, reflecting the lower volume settled in this environment.
In 1Q25, revenue increased 10.3% compared to 1Q24, due to a 10.4% increase in average price and a 1.0% increase in volume.
The 211 aMW increase in total volume is mainly explained by increases of 2,717 aMW in the free market and 401 aMW in the regulated market, more than offsetting the reductions of 1,485 aMW in energy settled in the short-term market and 1,422 aMW of energy traded under the quota regime.
Table 18 - Generation Revenue by Contracting Environment (R$ mm)
| Revenue Generation | Volume (aMW) (a) | Price (R$/MWh) (b) | Regulatory Revenue (c) = (a) x (b) | ||||||
| 1Q25 | % Y/Y | % Q/Q | 1Q25 | % Y/Y | % Q/Q | 1Q25 | % Y/Y | % Q/Q | |
| (+) Regulated Market | 4,638 | 9.5 | 13.8 | 299 | 1.2 | -8.5 | 3,000 | 9.6 | 1.8 |
| Existing | 3,667 | 10.7 | 21.8 | 216 | 3.2 | -9.1 | 1,708 | 13.0 | 8.3 |
| M&As (4) | 0 | 0.0 | 0.0 | 0 | 0.0 | 0.0 | 0 | 0.0 | 0.0 |
| Tucuruí Extension | 0 | 0.0 | 0.0 | 0 | 0.0 | 0.0 | 0 | 0.0 | 0.0 |
| Thermal | 971 | 5.0 | -8.8 | 616 | 1.4 | 5.8 | 1,292 | 5.4 | -5.6 |
| (+) Free Market | 9,022 | 43.1 | 11.0 | 148 | -4.5 | -10.0 | 2,892 | 35.2 | -2.3 |
| Existing | 9,022 | 43.1 | 11.0 | 148 | -4.5 | -10.0 | 2,892 | 35.2 | -2.3 |
| M&As (4) | 0 | 0.0 | 0.0 | 0 | 0.0 | 0.0 | 0 | 0.0 | 0.0 |
| (+) O&M (Quotas) | 2,521 | -36.1 | -35.4 | 95 | 4.3 | 10.3 | 519 | -34.1 | -30.3 |
| (+) ST Market (CCEE)(1) | 4,314 | -25.6 | 51.9 | 66 | 18.6 | -69.9 | 612 | -12.7 | -55.3 |
| (=) Ex others | 20,495 | 1.0 | 8.2 | 159 | 10.4 | -17.2 | 7,023 | 10.3 | -12.4 |
| (+) Other (2) | 0 | 0.0 | 0.0 | 0 | 0.0 | 0.0 | 0 | -18504.5 | -1251500.4 |
| (=) Total | 0 | 0.0 | 0.0 | 0 | 0.0 | 0.0 | 7,023 | 10.3 | -12.4 |
| Recurring | 0 | 0.0 | 0.0 | 0 | 0.0 | 0.0 | 7,023 | 10.3 | -12.4 |
| Non-recurring | 0 | 0.0 | 0.0 | 0 | 0.0 | 0.0 | 0 | 0.0 | 0.0 |
Earnings Release 1Q25 |
|
| Revenue Generation | Regulatory Revenue (c) | Accounting Adjustment (d) (3) | Accounting Revenue (e) = (c) + (d) | ||||||||
| 1Q25 | 1Q24 | 4Q24 | 1Q25 | 1Q24 | 4Q24 | 1Q25 | 1Q24 | 1Q25x1Q24 | 4Q24 | 1Q25x4Q24 | |
| Regulated Market | 3,000 | 2,738 | 2,946 | -56 | -432 | -32 | 2,944 | 2,306 | 27.7 | 2,914 | 1.0 |
| Free Market | 2,892 | 2,139 | 2,959 | 0 | 0 | 0 | 2,892 | 2,139 | 35.2 | 2,959 | -2.3 |
| O&M (Quotas) | 519 | 787 | 745 | 0 | 0 | 0 | 519 | 787 | -34.1 | 745 | -30.3 |
| Short-term market (1) | 612 | 701 | 1,368 | 0 | 0 | 0 | 612 | 701 | -12.7 | 1,368 | -55.3 |
| Energy Sales | 7,023 | 6,365 | 8,018 | -56 | -432 | -32 | 6,967 | 5,933 | 17.4 | 7,986 | -12.8 |
| Others (2) | 0 | 0 | 0 | 0 | 0 | 0 | 0 | 0 | -18504.5 | 0 | -1251500.4 |
| Total | 7,023 | 6,365 | 8,018 | -56 | -432 | -32 | 6,967 | 5,933 | 17.4 | 7,986 | -12.8 |
| Recurring | 7,023 | 6,365 | 8,018 | -56 | -432 | -32 | 6,967 | 5,933 | 17.4 | 7,986 | -12.8 |
| Non-recurring | 0 | 0 | 0 | 0 | 0 | 0 | 0 | 0 | 0.0 | 0 | 0.0 |
(1) Short-term market: Electricity Trading Chamber (CCEE)
(2) Construction Revenues
(3) The R$ 56 million in 1Q25 and R$ 32 million in 4Q24 refer to energy sold by the HPP Balbina, but defaulted by Amazonas Energia. As a result, the amount is not recognized as revenue under IFRS accounting, but is recorded under the regulatory accounting, where it is fully provisioned. In 1Q24, the R$ 432 million refers to all energy sold to the same customer—not only by Balbina HPP, but also by the thermal plants.
(4) M&A: includes revenue from assets in which Eletrobras' stake has changed over the last 12 months.
| ▪ | Regulated Contracting Environment (ACR): regulatory generation revenue in ACR totaled R$ 3,000 million in 1Q25, up R$ 263 million from 1Q24, reflecting a 9.5% increase in volumes sold with stable prices. |
| ▪ | Free Contracting Environment (ACL): regulatory generation revenue in ACL totaled R$ 2,892 million in 1Q25, up by R$ 753 million from 1Q24, mainly due to the 43.1% increase in volume sold, which more than offset the 4.5% drop in the average price. It is worth noting that, despite the decline, the average price was R$148/MWh—well above the R$66/MWh recorded in the short-term market, where any unsold volume from other environments is settled. This positive effect of higher volumes sold at ACL prices partially offset the increase in energy purchases in the short-term market. |
| ▪ | O&M: Operation and maintenance revenues totaled R$ 519 million in 1Q25, down R$ 268 million from 1Q24, mainly reflecting the gradual phasing out of legacy contracts (decotization), mitigated by the effects of the annual adjustment of the Annual Generation Revenue (RAG5). |
| ▪ | Short-Term Market (CCEE): revenue of R$ 612 million in 1Q25, down R$ 89 million compared to 1Q24, explained by the higher volume traded in the free market. |
Regulatory Transmission Revenue
Regulatory transmission revenue was R$ 4,423 million, down 13.4% from 1Q24. The decrease reflects the approval, in July 2024, of the 2023 periodic tariff review (RTP), which were postponed to 2024, with a particular focus on the revenue review for concession contracts extended under Law No. 12,783/2013.
It is worth noting that the eliminations, both in regulatory and IFRS revenue, refer to the portion of transmission system usage charges paid by Eletrobras’ generation companies to the Group’s own transmission companies, which receive them as RAP. For consolidation purposes, these amounts are eliminated from transmission revenue and from the cost of transmission system charges in generation. The IFRS accounting considers the portion of revenue related to operation and maintenance (O&M), whereas under regulatory accounting, the elimination reflects the RAP.
5 According to ANEEL Resolutions No. 3,068/2022 (2022-2023 cycle) and No. 3,225/2023 (2023-2024 cycle), impacting Eletronorte, Chesf and Furnas.
Earnings Release 1Q25 |
|
Table 19 - Quarterly IFRS vs. Regulatory Revenue (R$ mm)6
| 1Q25 | 1Q24 | Regulatory | |||||
| IFRS | Adjustments | Regulatory | IFRS | Adjustments | Regulatory | ∆% | |
| Eletrobras Holding | 1,964 | -170 | 1,794 | 1,663 | 419 | 2,081 | -14 |
| Chesf | 1,637 | -152 | 1,484 | 1,358 | 202 | 1,560 | -5 |
| CGT Eletrosul | 607 | -106 | 500 | 560 | -33 | 527 | -5 |
| Eletronorte | 1,096 | -201 | 894 | 1,059 | -37 | 1,022 | -12 |
| Eliminations | -117 | -133 | -250 | -80 | 0 | -80 | 212 |
| TOTAL | 5,186 | -763 | 4,423 | 4,559 | 551 | 5,110 | -13 |
Chart 3 - Reconciliation RAP and Transmission Revenue 1Q25 (R$ mm)
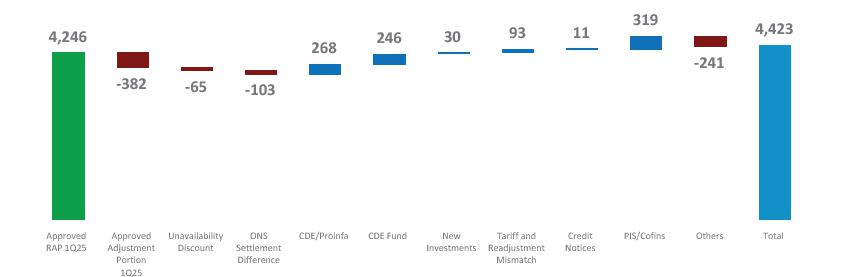
Regulatory Transmission Revenue: Approved RAP x Gross Revenue
| ▪ | Annual Permitted Revenue (RAP) and Approved Adjustment Portion (PA) 1Q25: Corresponds to ¼ of the RAP and PA, respectively, of R$ 16,983 million and R$1,529 million, approved for the 2024/2025 cycle under ANEEL Resolution No. 3,348/2024 for the transmission concession contracts of Eletrobras (post-Furnas incorporation), Chesf, CGT Eletrosul, Eletronorte, TMT, and VSB. More details about PA in Appendix 8. |
| ▪ | Discount for unavailability: Associated with the discount applied for Variable Portion (PV) and Suspension of Base Payment (PB) due to the unavailability of transmission facilities, according to Module 4 of the Transmission Services Rules (available on ANEEL’s website). In 1Q25, the total revenue reduction due to unavailability was approximately -R$ 65 million, comprising -R$ 52 million related to the Variable Portion and -R$ 13 million to the Suspension of Base Payment. The Suspension of Base Payment applies when, after reaching one of the discount thresholds defined in Module 4, the Transmission Function (FT) remained unavailable for 30 consecutive days, without either the facility being restored to operation or the temporary operational restriction being resolved. |
6 For more information on Eletrobras Holding's Corporate Structure, refer to Appendix 3 of this report.
Earnings Release 1Q25 |
|
| ▪ | Differences in ONS Calculation - Prepayment Apportionment: Related to the difference arising from the deficit or surplus in revenue calculated by the ONS, as reflected in the Credit Notice (AVC) issued by the ONS, and offset through the Adjustment Portion (PA) in the subsequent tariff cycle. |
| ▪ | CDE/Proinfa (Sectoral Collection): corresponds to collections of sector charges (pass-through) from consumers directly connected to Eletrobras transmission facilities, related to the Energy Development Fund (CDE) and the Incentive Program for Alternative Sources of Electricity (Proinfa), as considered in the AVCs issued by the ONS. |
| ▪ | CDE Fund: corresponds to the receipt via CCEE of amounts not collected due to discounts on tariffs, which are offset annually through an Adjustment Portion. These amounts already include a portion of PIS/COFINS taxes. |
| ▪ | New Investments: Additional RAP for new installations (large-scale reinforcements and improvements) in the basic network, authorized with previously defined revenues, which entered commercial operation throughout the quarter. |
| ▪ | Tariffs Mismatches |
(i) Between Annual Adjustment of Transmission and Distribution: Associated with the timing mismatch between the amounts approved for Other Transmission Facilities (DIT) for exclusive use in the Annual RAP Adjustment for transmission companies (ANEEL Resolution No. 3,348/2024) and the revenue amounts approved in the Annual Adjustments of the distribution companies, which occur at different times. In 1Q25, this difference totaled approximately R$ 40 million.
(ii) Border Network Difference: Related to the difference between the RAP amounts approved for the Basic Border Network and Other Transmission Facilities (DIT) for shared use in the Annual RAP Adjustment of the transmission companies for the 2024/2025 cycle, and the billing amounts reflected in the AVCs issued by ONS. These adjustments will be incorporated into the Adjustment Portion of the following cycle. In 1Q25, this difference totaled approximately R$ 64 million.
(iii) Other Transmission Facilities (DIT) Difference for Exclusive Use of Itaipu: Refers to the discrepancy between the approved RAP for Other Transmission Facilities (DIT) for Itaipu’s exclusive use and the monthly amount collected based on the power and tariff approved by ANEEL. For each subsequent calendar year, ANEEL publishes the contracted power amounts for Itaipu in a specific Regulatory Resolution, while the monthly tariff for electricity transportation from Itaipu Binacional is published for the Transmission tariff cycle. As a result, an adjustment is required to account for variations in contracted power, arising from the timing mismatch between the calendar year and the tariff cycle. This adjustment is considered in the Adjustment Portion of the following cycle. In 1Q25, this mismatch totaled approximately -R$ 11 million.
| ▪ | Complementary Credit Notices associated with the termination of Transmission System Use Contracts (CUST): Related to the termination of CUST agreements linked to generation projects, as outlined in complementary Credit Notices (AVCs) issued by ONS. Upon termination, ONS issues a Debit Notice (AVD) to the generation company and a Credit Notice to the transmission companies, specifying the amount to be received—equivalent to 36 months of the Transmission System Usage Charge (EUST) under the contract. It is important to note that transmission companies act solely as as intermediaries in collecting and transferring these amounts. The amount does not include PIS/COFINS taxes. |
| ▪ | PIS/COFINS: related to revenue from the Basic Network, Basic Border Network and Other Transmission Facilities Shared, according to Credit Notices issued by the ONS. |
Earnings Release 1Q25 |
|
| ▪ | Others: Includes “Eliminations,” which represent transactions between companies within the same group, i.e., Eletrobras companies. In 1Q25, total eliminations were approximately R$ -232 million. |
RAP Changes for Extended and Tendered Contracts, as approved by ANEEL Resolutions 3,343/2024 and 3,344/2024
On April 4 and 24, 2025, ANEEL published Rulings No. 920/2025 and No. 1,228/2025, respectively, approving the revised results of the Periodic Review for contracts with a review date in July 2024, as well as the 2nd Periodic Review of contracts renewed under Law No. 12,783/2013. The effects of these approvals will be fully reflected in the 2025–2026 cycle.
As a result, there was a reduction of 0.01%—equivalent to just R$ 14,000—when comparing the total approved RAP and Adjustment Portion to the amounts set forth in ANEEL Resolution No. 3,343/2024 for the tendered contracts that were revised. For the renewed contracts, the reduction was 5.48%, or R$ 371.9 million, compared to the total approved RAP and Adjustment Portion established in ANEEL Resolution No. 3,344/2024. Additional details on the changes, including a breakdown by contract, are provided in Appendices 9 and 10.
9.2. Operating Costs and Expenses
Table 20 - Operating Costs and Expenses (R$ mm)
| 1Q25 | 1Q24 | % | 4Q24 | % | |
| Energy purchased for resale | 1,560 | 737 | 111.6 | 2,082 | -25.1 |
| Charges on use of the electricity grid | 996 | 972 | 2.6 | 968 | 2.9 |
| Fuel for electricity production | 560 | 506 | 10.7 | 531 | 5.4 |
| Construction | 745 | 642 | 16.1 | 1,804 | -58.7 |
| Personnel, Material, Services and Others | 1,658 | 1,627 | 1.9 | 2,332 | -28.9 |
| Depreciation and Amortization | 1,112 | 997 | 11.6 | 1,033 | 7.7 |
| Operating provisions | 126 | 196 | -35.4 | -146 | -186.6 |
| Regulatory remeasurements | 952 | 0 | 0.0 | 0 | 0.0 |
| Costs and expenses | 7,710 | 5,676 | 35.8 | 8,604 | -10.4 |
| Non-recurring events | |||||
| (-) Non-recurring PMSO events | -191 | -33 | 484.7 | -292 | -34.5 |
| (-) Non-recurring provisions | -41 | 118 | -134.4 | 552 | -107.4 |
| Adjusted Costs and Expenses | 7,478 | 5,761 | 29.8 | 8,864 | -15.6 |
| ▪ | Energy purchased for resale: Totaled R$ 1,560 million in 1Q25, up R$ 823 million compared to 1Q24. Part of this change is related to the negative net effect in the short-term market which, as previously mentioned, allowed the Company to benefit from higher volumes sold in the free market at higher average prices. |
| ▪ | Charges on use of the electricity grid: Totaled R$ 996 million in 1Q25, up R$ 25 million from 1Q24, mainly reflecting higher Transmission System Usage Charges (EUST), effective following ANEEL Resolution 3,349/2024, which replaced the previously valid values established by ANEEL Resolution 3,216/2023. |
| ▪ | Fuel for electricity production: Costs associated with the use of fuel for electricity production reached R$ 560 million in 1Q25, up R$ 54 million from 1Q24. The increase is primarily explained by a R$146 million rise, driven by higher gas consumption and the annual gas price adjustment, partially offset by a R$92 million increase in expense recovery through the Fuel Consumption Account (CCC). |
Earnings Release 1Q25 |
|
| ▪ | Construction-related costs: Totaled R$ 745 million in 1Q25, up by R$ 104 million compared to 1Q24, mainly driven by a R$57 million rise related to reinforcement and improvement works, and a R$47 million increase in civil construction activities linked to concession contracts awarded in transmission auctions in recent years. |
| ▪ | Regulatory Remeasurement - transmission contracts: R$ 952 million expenses at Chesf, reflecting the reversal of part of the amount previously recognized in this line in 2024. This reversal results from changes introduced by ANEEL in the Periodic Reviews carried out in the same year, as set forth in Rulings No. 920/2025 and No. 1,228/2025, whose effects will be effectively reflected throughout the 2025–2026 cycle. |
PMSO - Personnel, Material, Services and Others
Personnel: adjusted balance of R$ 802 million in 1Q25, down 15% from R$ 945 million in 1Q24, with the main effects being:
| ▪ | R$ 108 million in savings, of which R$ 79 million in compensation expenses and R$ 29 million in charges, reflecting the reduction in the number of employees resulting from the Voluntary Dismissal Plans (VDPs), partially offset by new hires, which increased expenses by R$ 57 million, of which R$ 41 million in compensation and R$ 16 million in charges; |
| ▪ | R$ 50 million in savings resulting from efficiency gains achieved through team restructuring, driven by VDPs, new hiring models, and increased resource sharing among the group’s companies. |
| ▪ | R$ 16 million reduction related to expenses related to employee terminations in 1Q25. |
Non-recurring effects: R$ 150 million, of which: (a) R$ 96 million with VDPs, (b) R$ 31 million with severance costs, and (c) R$ 22 million with severance indemnity fund (FGTS) fines linked to terminations.
Material: adjusted balance of R$ 52 million in 1Q25, up R$ 6 million when compared to R$ 46 million recorded in 1Q24. The variation reflects higher operational maintenance expenses of R$ 15 million, partially offset by savings of R$ 9 million related to contract optimization with suppliers.
There were no non-recurring effects in the quarter.
Services: adjusted balance of R$ 396 million in 1Q25, representing a 10% decrease compared to R$ 439 million in 1Q24. The main highlights for a drop of R$ 43 million were:
| ▪ | R$ 16 million in savings from portfolio restructuring and optimization initiatives, including the incorporation of Furnas; |
| ▪ | R$ 15 million in savings related to strategic consulting expenses incurred in 1Q24, with no equivalent in 1Q25; |
| ▪ | Reduction of R$ 12 million related to maintenance activities at power plants that were originally planned for 2H25 but took place in 1Q24. |
Non-recurring effects: R$42 million for legal consulting related to the contingency reduction strategy.
Earnings Release 1Q25 |
|
Others: adjusted balance of R$ 217 million in 1Q25, up R$ 52 million compared to 1Q24, mainly reflecting the R$ 34 million increase in expenses related to fines, court rulings, legal costs, as well as other losses.
There were no non-recurring effects in the quarter.
Table 21 - PMSO 1Q25 (R$ mm)7
| PMSO | 1Q25 | |||||||
| (R$ million) | Eletrobras Holding | Chesf | Eletronorte | CGT Eletrosul | Eletropar | Total | Elimination | Consolidated IFRS |
| Personnel | 368 | 210 | 190 | 88 | 0 | 855 | 0 | 855 |
| Voluntary Dismissal Plan (PDV) - Provision | 78 | 5 | 10 | 3 | 0 | 96 | 0 | 96 |
| Material | 18 | 8 | 20 | 6 | 0 | 52 | 0 | 52 |
| Services | 193 | 111 | 99 | 34 | 1 | 438 | 0 | 438 |
| Other | 104 | 31 | 45 | 25 | 11 | 217 | 0 | 217 |
| PMSO | 762 | 365 | 364 | 155 | 13 | 1,658 | 0 | 1,658 |
| Non-recurring events | ||||||||
| Personnel: PDV, PDC | -78 | -5 | -10 | -3 | 0 | -96 | 0 | -96 |
| Personnel: Termination Costs | -39 | -4 | -7 | -4 | 0 | -53 | 0 | -53 |
| Services: Sucess fee related to legal consulting | -6 | -25 | -11 | 0 | 0 | -42 | 0 | -42 |
| Adjusted PMSO | 640 | 330 | 336 | 149 | 13 | 1,467 | 0 | 1,467 |
Table 22 - PMSO 1Q24 (R$ mm)
| PMSO | 1Q24 | |||||||
| (R$ million) | Eletrobras + Furnas and Others | Chesf | Eletronorte | CGT Eletrosul | Eletropar | Total | Elimination | Consolidated IFRS |
| Personnel | 413 | 214 | 214 | 104 | 1 | 945 | 0 | 945 |
| Voluntary Dismissal Plan (PDV) - Provision | 0 | 25 | 8 | 0 | 0 | 33 | 0 | 33 |
| Material | 16 | 13 | 13 | 4 | 0 | 46 | 0 | 46 |
| Services | 229 | 75 | 96 | 37 | 1 | 439 | 0 | 439 |
| Other | 66 | 41 | 48 | 9 | 0 | 165 | 0 | 165 |
| PMSO | 724 | 368 | 380 | 154 | 1 | 1,627 | 0 | 1,627 |
| Non-recurring events | ||||||||
| Personnel: PDV, PDC | 0 | -25 | -8 | 0 | 0 | -33 | 0 | -33 |
| Adjusted PMSO | 724 | 343 | 372 | 154 | 1 | 1,594 | 0 | 1,594 |
7 For more information on the Composition of Eletrobras Holding, see Appendix 3 .
Earnings Release 1Q25 |
|
Table 23 - PMSO IFRS (R$ mm)
| 1Q25 | 1Q24 | 4Q24 | |||||
| Total (a) | Nonrecurring (b) |
Adjusted (c) = (a) - (b) |
Adjusted | ∆% | Adjusted | ∆% | |
| Personnel | 855 | -53 | 802 | 945 | -15.1 | 915 | -12.3 |
| VDP | 96 | -96 | 0 | 0 | 0.0 | 0 | 0.0 |
| Material | 52 | 0 | 52 | 46 | 12.7 | 73 | -28.6 |
| Services | 438 | -42 | 396 | 439 | -9.7 | 731 | -45.8 |
| Others | 217 | 0 | 217 | 165 | 31.7 | 321 | -32.6 |
| Total | 1,658 | -191 | 1,467 | 1,594 | -8.0 | 2,040 | -28.1 |
Table 24 - Other Costs and Expenses (R$ mm)
| 1Q25 | 1Q24 | % | 4Q24 | % | |
| Convictions, losses and legal costs | 71 | 34 | 111 | 86 | -18 |
| GSF | 17 | 19 | -13 | 20 | -16 |
| Insurance | 23 | 20 | 17 | 27 | -15 |
| Equity Holdings | 10 | 17 | -40 | 40 | -75 |
| Donations and contributions | 21 | 54 | -61 | 66 | -68 |
| Leasing | 23 | 14 | 66 | 35 | -35 |
| Expense recovery | -12 | -40 | -69 | -3 | 252 |
| Taxes | 31 | 26 | 16 | 29 | 7 |
| Water Resources Inspection Fee - TFRH | 14 | 0 | 0 | 4 | 251 |
| Others | 20 | 22 | -6 | 18 | 10 |
| Total | 217 | 165 | 32 | 321 | -33 |
Earnings Release 1Q25 |
|
Operating Provisions
Table 25 - Operating Provisions - IFRS (R$ mm)
| 1Q25 | 1Q24 | % | 4Q24 | % | |
| Operating Provisions / Reversals | |||||
| Provision/Reversal for Litigation | -108 | 139 | -177.7 | -486 | -77.8 |
| Estimated losses on investments | 12 | -15 | -181.8 | 217 | -94.3 |
| Measurement at fair value of assets held for sale | 0 | 0 | 0.0 | -57 | -100.0 |
| Provision for the Implementation of Lawsuits - Compulsory Loan | 26 | -34 | -176.6 | -23 | -209.5 |
| ECL - Loans and financing | 0 | -4 | -100.0 | -4 | -100.0 |
| ECL - Consumers and resellers | -19 | -132 | -85.9 | -157 | -88.1 |
| ECL - Other credits | -7 | -91 | -91.9 | -44 | -83.2 |
| Onerous contracts | 29 | 39 | -24.7 | 251 | -88.4 |
| Results of actuarial reports | -93 | -128 | -27.3 | -106 | -12.3 |
| Other * | 33 | 30 | 9.9 | 556 | -94.0 |
| Operating Provisions / Reversals | -126 | -196 | -35.4 | 146 | -186.6 |
| Non-recurring items / Adjustments | 41 | -118 | -134.4 | -552 | -107.4 |
| Provision for Litigation | 108 | -139 | -177.7 | 427 | -74.7 |
| Measurement at fair value of assets held for sale | 0 | 0 | 0.0 | 0 | 0.0 |
| Estimated losses on investments | -12 | 15 | -181.8 | -217 | -94.3 |
| Provision for the Implementation of Lawsuits - Compulsory Loan | -26 | 34 | -176.6 | 23 | -209.5 |
| ECL - Loans and financing | 0 | 4 | -100.0 | 4 | -100.0 |
| Onerous contracts | -29 | -39 | -24.7 | -251 | -88.4 |
| Impairment | 0 | 6 | -100.0 | -540 | -100.0 |
| Restitution RGR | 0 | 0 | 0.0 | 0 | 0.0 |
| Adjusted Provisions/Reversals | -86 | -314 | -72.7 | -406 | -78.9 |
Positive values in the table above indicate reversal of provision.
* Primarily Includes impairment and RGR refunds.
| ▪ | Provision for litigation: provision of R$ 108 million in 1Q25 compared to a reversal of R$ 139 million in 1Q24, mainly explained by the increase in provisions, of which: |
| ▪ | R$ 137 million, related to new lawsuits; |
| ▪ | R$ 69 million due to the update of indexes and interest rates on lawsuits; |
| ▪ | R$ 42 million resulting from changes in the lawsuit prognosis. |
| ▪ | Settlement of Lawsuits – Compulsory Loan: The year-over-year variation is mainly explained by the net effect of lawsuits related to the compulsory loan on electricity. In 1Q24, results were negatively impacted by the recognition of new provisions following unfavorable court decisions. In 1Q25, there were provision reversals related to the settlement of lawsuits, reflecting final and unappealable decisions favorable to the Company. |
| ▪ | Results of actuarial reports: provision of R$ 93 million in 1Q25 compared to a provision of R$ 128 million related to interest expenses and current service costs, as defined in the 2024 reports, which began to be released monthly instead of only at year-end, as was done previously. |
Earnings Release 1Q25 |
|
| ▪ | Estimated losses on investments: reversal of R$ 12 million in 1Q25 related to the review of the remaining useful life of intangible assets in subsidiary Madeira Energia S.A. (MESA). |
| ▪ | Expected Credit Losses (ECL) – Consumers and Resellers: Reduction of provision to R$ 19 million in 1Q25 from R$ 132 million million in 1Q24. This R$ 114 million difference is mainly explained by two events recorded in 1Q24 with no equivalent in 1Q25: (a) R$ 66 million at Chesf, related to transmission consumers and concessionaires, and (b) R$ 78 million at Eletronorte, referring to Amazonas Energia’s collateral to Breitner Energética. |
| ▪ | Expected Credit Losses (ECL) – Other Credits: Reduction of provision to R$ 7 million in 1Q25 from R$ 91 million in 1Q24. The R$ 84 million variation is mainly explained by the recognition of defaults on loan and financing contracts granted by Eletrobras in 1Q24, with no equivalent in 1Q25. |
Earnings Release 1Q25 |
|
9.3. Equity Holdings
Equity income had two highlights this quarter:
| ▪ | ISA Energia: reduction in shareholding reflecting the sale of stake completed in the second half of 2024. |
| ▪ | Norte Energia: the decrease is mainly due to the recognition of a deferred tax asset in 2024, with no corresponding effect in 2025, along with a provision recorded for an onerous energy purchase and sale contract. |
Table 26 - Equity Holdings (R$ mm)
| 1Q25 | 1Q24 | % | 4Q24 | % | |
| Highlights Affiliates (a) | 277 | 393 | -29.6 | 406 | -31.8 |
| Eletronuclear | 64 | 103 | -38.2 | 22 | 184.6 |
| ISA Energia | 135 | 230 | -41.4 | 251 | -46.4 |
| Other Affiliates | 78 | 60 | 30.7 | 132 | -40.7 |
| Highlights SPEs ** (b) | 47 | 68 | -30.8 | -57 | -181.5 |
| IE Madeira | 84 | 65 | 29.4 | 68 | 22.8 |
| Belo Monte Transmissora de Energia S.A. - BMTE | 56 | 55 | 1.7 | 135 | -58.7 |
| Transnorte Energia | 50 | 16 | 206.6 | 51 | -2.3 |
| Chapecoense | 43 | 50 | -13.8 | 65 | -34.7 |
| ESBR Jirau | 39 | 36 | 9.2 | 32 | 24.0 |
| IE Garanhuns | 15 | 20 | -26.5 | 19 | -24.4 |
| Norte Energia | -240 | -174 | 37.9 | -429 | -44.0 |
| Other Holdings * (c) | 44 | 116 | -61.8 | 130 | -66.1 |
| Total Equity Holdings (a) + (b) + (c) | 368 | 576 | -36.2 | 478 | -23.1 |
| * Includes movements from amounts recognized in the balance sheet of associates measured at fair value/cost. | |||||
Earnings Release 1Q25 |
|
9.4. Financial Results
Table 27 - Financial Result (R$ mm)
| 1Q25 | 1Q24 | % | 4Q24 | % | |
| Financial Income | 1,073 | 675 | 59.0 | 971 | 10.6 |
| Interest income, fines, commissions and fees | 37 | 32 | 14.2 | 22 | 68.8 |
| Income from financial investments | 1,057 | 574 | 84.3 | 982 | 7.6 |
| Late payment surcharge on electricity | 32 | 47 | -31.0 | 23 | 40.5 |
| Other financial income | 29 | 74 | -60.4 | 46 | -36.5 |
| (-) Taxes on financial income | -82 | -51 | 59.9 | -103 | -19.9 |
| Financial Expenses | -2,464 | -2,470 | -0.2 | -2,589 | -4.8 |
| Debt Charges | -1,640 | -1,625 | 0.9 | -1,556 | 5.4 |
| CDE obligation charges | -662 | -610 | 8.5 | -640 | 3.4 |
| River basin revitalization charges | -79 | -85 | -7.5 | -87 | -9.5 |
| Financial discount for early payment - ENBpar | 0 | 0 | 0.0 | 0 | 0.0 |
| Other financial expenses | -84 | -151 | -44.2 | -306 | -72.5 |
| Net Financial Items | -2,103 | -1,192 | 76.4 | -1,312 | 60.3 |
| Monetary changes | -285 | -347 | -17.9 | -242 | 18 |
| Exchange rate variations | 5 | -2 | -297.3 | -56 | -108.6 |
| Change in fair value of hedged debt net of derivative | -966 | -191 | 405.9 | -274 | 252.3 |
| Monetary updates - CDE | -733 | -493 | 48.5 | -508 | 44.2 |
| Monetary updates - river basins | -113 | -87 | 30.7 | -92 | 23.8 |
| Change in derivative financial instrument not linked to debt protection | -10 | -72 | -85.6 | -140 | -92.6 |
| Financial Results | -3,494 | -2,988 | 16.9 | -2,930 | 19.2 |
| Adjustments | |||||
| Income from Discos + AIC | 0 | 0 | 0.0 | 0 | 0.0 |
| Regularization of tax credits / Fines and Tax Assessment Notices | 0 | 0 | 0.0 | 0 | 0.0 |
| Monetary restatement - Compulsory Loan | 173 | 207 | -16.3 | 175 | -1.0 |
| Write-off of judicial deposits due to the conciliation project | 0 | 0 | 0.0 | 0 | 0.0 |
| Adjustment of the correction rate for judicial deposits | 0 | 0 | 0.0 | 0 | 0.0 |
| PIS/COFINS (Interest on Equity - JCP) | 0 | 0 | 0.0 | 0 | 0.0 |
| Adjusted Financial Result | -3,321 | -2,781 | 19.4 | -2,755 | 20.5 |
(1) These obligations were established by Law 14,182/21 (Eletrobras Privatization) as a condition for obtaining new concession grants for electricity generation for an additional 30 years. The charges were calculated based on data published in CNPE Resolution 015/2021, considering (a) the present value of the obligation; (b) the future payment flow; and (c) the payment term. See Table 28 for more details.
Adjusted financial result was negative by R$ 3,321 million in 1Q25, compared to negative R$ 2,781 million in 1Q24. The main variations in this quarter were:
| ▪ | Debt charges: expense increased to R$ 1,640 million in 1Q25 from R$ 1,625 million in 1Q24, mainly due to the increase in inflation index (as measured by IPCA) and Selic rates during the period. In 1Q24, financial charges reflected a decline in the Selic rate—from 11.25% to 10.75%—and an accumulated inflation index of 1.42%. In contrast, 1Q25 saw the opposite trend: the Selic rate increased from 12.25% to 14.25%, while the accumulated inflation index for the quarter reached 2.04%. |
Earnings Release 1Q25 |
|
| ▪ | Monetary update variation (Selic): reduction in expense to R$ 285 million in 1Q25 from R$ 347 million in 1Q24, impacted by the lower update of the compulsory loan litigation inventory, driven by a lower balance in March 2025. Eletrobras' compulsory loan update expense went down to R$ 173 million in 1Q25 from R$ 207 million in 1Q24, reflecting the inventory reduction to R$ 13.1 billion billion in March 2025 from R$ 16 billion in March 2024. In addition, expenses related to the monetary update of undue tax debt using the Selic rate decreased to R$ 110 million in 1Q25, down from R$ 138 million in 1Q24. |
| ▪ | Energy Sector Development Fund (CDE) obligation charges and monetary updates (IPCA financial expenses + charges on the outstanding balance of CDE obligations, a 7.6% p.y. charge): expenses totaled R$ 1,394 million in 1Q25, up R$ 291 million from 1Q24, mainly due to the IPCA monetary update applied between the periods. Charges amounted to R$ 610 million in 1Q24 and R$ 662 million in 1Q25, while monetary update was R$ 493 million in 1Q24 and R$ 733 million in 1Q25. These obligations were established by Law 14,182/21 (Privatization of Eletrobras) as a condition for obtaining new concession grants for electricity generation for an additional 30 years. The charges were calculated based on data published in CNPE Resolution 015/2021, considering (a) the present value of the obligation; (b) the future payment flow; and (c) the payment term. |
| ▪ | Charges for revitalization of river basins (5.67% charge), with a R$ 79 million expense in 1Q25, and monetary updates - river basins, with a R$ 113 million expense. These obligations were established by Law 14,182/21 (Privatization of Eletrobras) as a condition for obtaining new concession grants for electricity generation for an additional 30 years. The charges were calculated based on data published in CNPE Resolution 015/2021, considering (a) the present value of the obligation; (b) the future payment flow; and (c) the payment term. |
Table 28 - CDE Charges and Projects - Law 14.182/2021 (R$ mm)
| 1Q25 | ||||
| Holding | Chesf | Eletronorte | Total | |
| Debt charges - CDE obligations | -190 | -277 | -195 | -662 |
| Debt charges - Revitalization of river basins | -21 | -30 | -27 | -79 |
| Passive monetary restatement - CDE obligations | -211 | -306 | -216 | -733 |
| Passive monetary updating - Revitalization of river basins | -29 | -46 | -38 | -113 |
| Total CDE charges and Projects - Law 14.182/2021 | -452 | -660 | -475 | -1,587 |
| ▪ | Change in fair value of hedged debt, net of derivatives: R$ 966 million expense in 1Q25, higher than the R$ 191 million expense in 1Q24, mainly explained by the inclusion of new transactions signed at the end of 2024, such as Bond 35 (US$750 million in Oct/24) and the SACE financing (R$1.6 billion, or US$400 million, Dec/24), pegged to the dollar x CDI and IPCA x CDI, respectively. The payment of interest on Bonds 2030 and 2035, the settlement of Bond 2025 in Feb/25 and the new credit and swap transactions at Eletrosul also contributed to the impact. |
| ▪ | Change in derivative financial instrument not linked to debt protection: there was no impact in 1Q25 compared to an expense of R$ 72 million in 1Q24. This change is due to the termination, in December 2024, of the contract betweenEletronorte and Albras, which contained an embedded derivative tied to the U.S. dollar, the Selic rate, and aluminum prices on the LME. |
Earnings Release 1Q25 |
|
| ▪ | Other financial expenses: totaled R$ 84 million in 1Q25, compared to R$ 151 million in 1Q24. The reduction mainly reflects a R$35 million drop in tax-related charges in 2024 from the incorporated company Furnas, as well as R$15 million in expenses—mainly related to R&D—reclassified under the monetary update line. |
| ▪ | Other financial income: dropped by R$ 44 million, to R$ 29 million in 1Q25 from R$ 74 million in 1Q24, primarily due to amounts recorded in 1Q24 with no equivalent in 1Q25, such as the recognition of R$ 26 million in undue tax debt from Eletronorte in 1Q24—later reclassified under monetary restatement—and the R$ 23 million court-ordered debt (precatório) credit from CGT Eletrosul, recognized in March 2024. |
Earnings Release 1Q25 |
|
9.5. Current and Deferred Taxes
Adjusted income tax and social contributions amounted to -R$ 65 million in 1Q25, compared to -R$ 305 million in 1Q24. There were no adjustments to the tax line in either period.
Table 29 - Income Tax and Social Contribution (R$ mm)
| 1Q25 | 1Q24 | % | 4Q24 | % | |
| Current income tax and social contribution | -79 | -514 | -84.6 | 5 | -1683.1 |
| Deferred income tax and social contribution | 14 | 209 | -93 | 43 | -66.5 |
| Income tax and social contribution total | -65 | -305 | -78.7 | 48 | -235.4 |
| Adjustments | |||||
| Constitution/Reversal of Deferred Tax on Tax Loss ¹ | 0 | 0 | 0 | -1,425 | -100 |
| Deferred Tax Adjustment on Regulatory Remeasurement ² | 0 | 0 | 0 | 758 | -100 |
| IOE - Interest on Equity ³ | 0 | 0 | 0 | 0 | 0 |
| Deferred Tax on Provisions: onerous contracts and impairment | 0 | 0 | 0 | 252 | -100 |
| Negative tax base constitution - SAESA | 0 | 0 | 0 | 0 | 0 |
| Adjusted income tax and social contribution | -65 | -305 | -78.7 | -367 | -82.3 |
¹ Holding and CGT Eletrosul
² Deferred Income Tax recognized in 4Q24 on the Regulatory Remeasurement of transmission contracts in the Holding following the Furnas merger.
10. OPERATING PERFORMANCE
10.1. Generation Segment
Generation Assets
The Company had 88 plants, including 47 hydroelectric, 7 thermal, 33 wind and 1 solar in 1Q25, considering corporate ventures, shared ownership and stakes via SPEs. Compared to 4Q24, the increase of one asset was due to the commercial operation of the Coxilha Negra 4 wind farm under CGT Eletrosul
The installed capacity of the portfolio reached 44,359.12 MW in 1Q25, with 97% generated from clean sources with low greenhouse gas emissions, representing 18% of Brazil's total installed capacity.
Table 30 - Generation Assets
| Source | Installed Capacity (MW) | Assured Capacity (avgMW) | Accumulated Generated Energy (GWh) |
| Hydro (47 plants) | 42,293.49 | 20,629.79 | 44,244.64 |
| Thermal (7 plants) | 1,270.23 | 1,058.60 | 972.54 |
| Wind Power (33 plants) | 794.47 | 226.39 | 328.16 |
| Solar (1 plant) | 0.93 | 0.00 | 0.31 |
| Total (88 plants) | 44,359.12 | 21,914.77 | 45,545.65 |
In 1Q25,the total energy generation by Eletrobras increased by 1.1% compared to 1Q24.
Earnings Release 1Q25 |
|
Chart 4 - Eletrobras - Net Energy Generation (GWh)
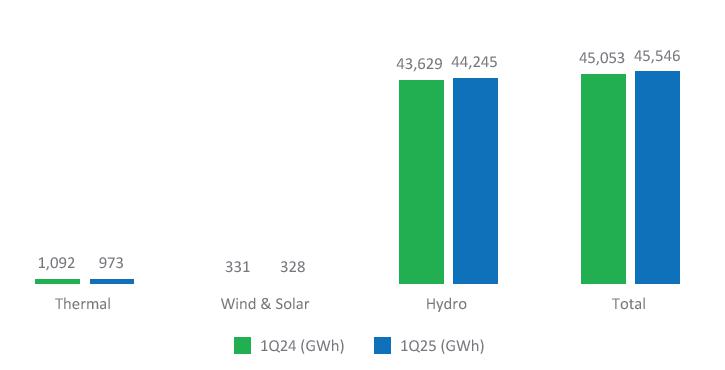
System Data - Installed Capacity and Generation
In 1Q25, Brazil's installed capacity was 248,710.12 MW.
Chart 5 - Brazil’s Installed capacity - by source
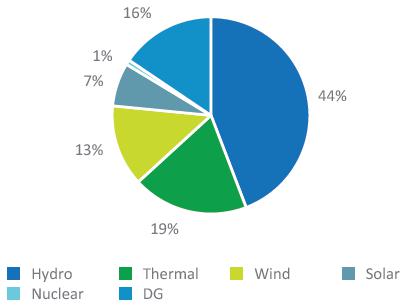
Source: ANEEL's Generation Information System (SIGA)
Earnings Release 1Q25 |
|
Chart 6 - Generated Energy SIN - National Interconnected System (GWh)
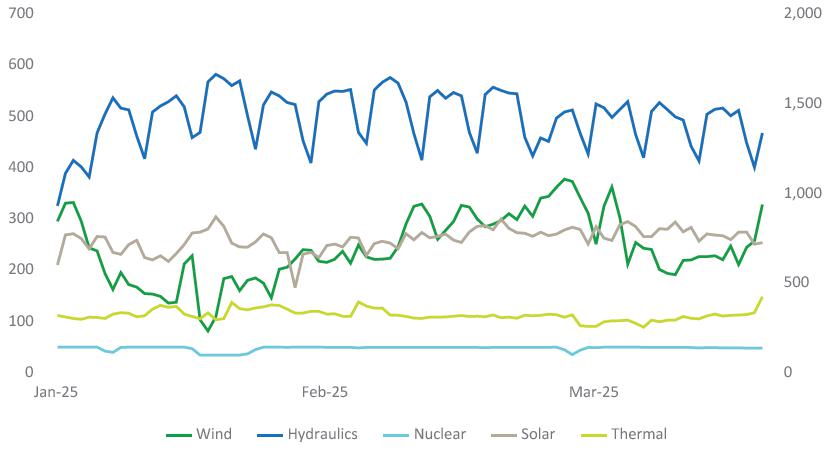
Source: Operating Results 01/01 to 3/31/2025 from the National Operator of the Electric System (ONS)
System Data - Energy Market
Table 31 - PLD
| 1Q25 | 1Q24 | ∆% | 4Q24 | ∆% | ||
| Market | GSF (%) | 107.30 | 90.25 | 18.9 | 79.91 | 34.3 |
| PLD SE (R$/MWh) | 162.31 | 61.14 | 165.5 | 217.59 | -25.4 | |
| PLD S (R$/MWh) | 164.13 | 61.14 | 168.5 | 217.58 | -24.6 | |
| PLD NE (R$/MWh) | 58.92 | 61.14 | -3.6 | 206.71 | -71.5 | |
| PLD N (R$/MWh) | 58.92 | 60.47 | -2.6 | 218.23 | -73.0 |
Chart 7 - GSF (%)
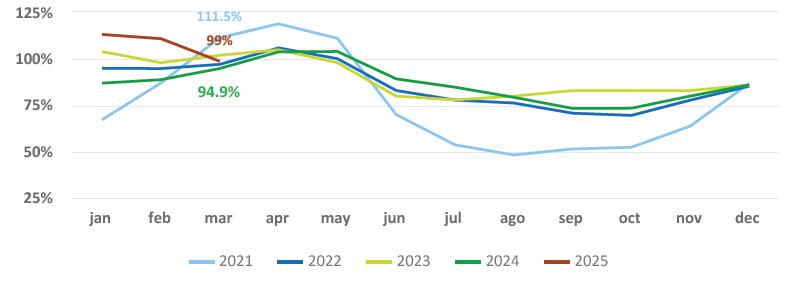
Earnings Release 1Q25 |
|
Chart 8 - Historical Average of Affluent Natural Energy (ENA) - SIN (%)
1Q25 was marked by low hydroelectric generation in the system, particularly in March, which recorded the fourth worst performance in the historical series.
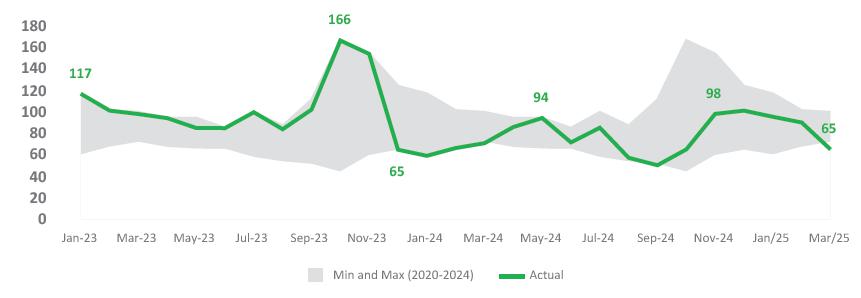
Chart 9 - Energy Stored in Reservoirs - SIN (%)
The level of Energy Stored in Reservoirs was at 69.4% in 1Q25, above the midpoint of the range based on historical data from 2020 to 2024.

10.2. Transmission Segment
The Company ended 1Q25 with 74.1 thousand km of transmission lines, of which 67.3 thousand km were owned and 6.8 thousand km operated through partnerships, compared to 73.8 thousand km in 1Q24 (66.5 thousand km owned and 7.3 thousand km in partnership).
There were also 405 substations in 1Q25, including 293 owned and 112 operated by third parties.
Earnings Release 1Q25 |
|
Table 32 - Transmission Lines (Km)8
| Company | Own(1) | In Partnership (2) | Total |
| Chesf | 22,141 | 1,832 | 23,973 |
| Eletronorte | 10,982 | 1,073 | 12,055 |
| CGT Eletrosul | 12,086 | 5 | 12,091 |
| Furnas | 22,111 | 3,867 | 25,978 |
| Total | 67,321 | 6,777 | 74,097 |
(1) Includes TMT (100%) and VSB (100%).
(2) Partnerships consider extensions proportional to the capital invested by Eletrobras Companies in the venture.
10.3. ESG
Table 33 - ESG KPIs 1Q25
| Pillar | KPI | 1Q24 | 1Q25 | YoY | |
| Prosperity | Investment in Technology and Innovation | R$ 120.6 million | R$ 120.8 million | 0.2% | |
| YTD (R$ mm) | |||||
| Planet | Accumulated GHG Emissions for the year | 955,058 | 839,920 | -12% | |
| (Scopes 1, 2 and 3) (tCO2e) | |||||
| People | Accident Frequency Rate - own Employees (with time off) | 0.97 | 0.24 | -75% | |
| Women in the Workforce (%) | 19% | 20% | 1.0 p.p. | ||
| Leadership positions held by women (%) | 26% | 25% | -1.0 p.p. | ||
| Governance | Complaints answered on time (%) | 98.3% | 97.7% | -0.7 p.p. | |
The values presented are preliminary and not assured, and may be adjusted based on data collection, verification and updating processes.
1The reduction in emissions is primarily due to the removal of coal-fired thermoelectric generation from the Company’s energy matrix.
8 For more information on Eletrobras Holding's Corporate Structure, refer to Appendix 3 in this report.
Earnings Release 1Q25 |
|
11. APPENDIX
11.1. Appendix 1 - Accounting Statements
Table 34 - Balance Sheet (R$ Thousand)
| PARENT COMPANY | CONSOLIDATED | |||
| 03/31/2025 | 12/31/2024 | 03/31/2025 | 12/31/2024 | |
| ASSETS | ||||
| CURRENT | ||||
| Cash and cash equivalents | 12,947,438 | 16,387,945 | 22,663,836 | 26,572,522 |
| Restricted cash | 367,140 | 449,865 | 571,173 | 508,734 |
| Securities | 4,224,005 | 6,421,621 | 7,617,041 | 8,951,838 |
| Clients | 1,732,427 | 1,686,293 | 5,323,884 | 5,911,477 |
| Transmission contract assets | 4,819,562 | 4,634,940 | 10,409,018 | 10,539,570 |
| Financing, loans and debentures | 931,773 | 971,555 | 478,049 | 475,458 |
| Remuneration for equity holdings | 2,067,628 | 2,286,078 | 433,152 | 721,685 |
| Taxes and Contributions | 1,501,777 | 1,734,020 | 2,615,492 | 2,831,413 |
| Income tax and social contribution | 0 | 0 | 0 | 0 |
| Right to compensation | 717,619 | 865,299 | 746,133 | 893,254 |
| Warehouse | 51,234 | 50,576 | 446,282 | 441,471 |
| Derivative financial instruments | 0 | 500,998 | 45,794 | 692,660 |
| Others | 787,307 | 729,718 | 1,544,842 | 1,408,919 |
| 30,147,910 | 36,718,908 | 52,894,696 | 59,949,001 | |
| Assets held for sale | 1,346,333 | 1,353,723 | 4,481,280 | 4,502,102 |
| 31,494,243 | 38,072,631 | 57,375,976 | 64,451,103 | |
| NON-CURRENT | ||||
| LONG-TERM ASSETS | ||||
| Restricted cash | 1,484,332 | 1,430,650 | 3,139,080 | 3,170,749 |
| Equity Holdings Income | 181,049 | 181,049 | 0 | 0 |
| Right to compensation | 526,830 | 692,126 | 548,215 | 720,081 |
| Financing, loans and debentures | 1,825,367 | 1,894,322 | 166,339 | 163,140 |
| Clients | 163,028 | 171,017 | 591,731 | 602,411 |
| Securities | 429,397 | 421,933 | 438,820 | 433,341 |
| Taxes and Contributions | 2,356,369 | 2,356,369 | 2,718,275 | 2,715,445 |
| Deferred income tax and social contribution | 0 | 0 | 5,618,635 | 5,673,011 |
| Bonds and deposits linked | 4,155,885 | 3,693,298 | 5,789,174 | 5,190,344 |
| Transmission contractual assets | 21,171,511 | 21,223,812 | 56,642,081 | 56,848,086 |
| Derivative financial instruments | 893,191 | 1,269,677 | 1,093,739 | 1,544,095 |
| Others | 1,934,498 | 2,000,734 | 1,697,561 | 1,645,570 |
| 35,121,457 | 35,334,987 | 78,443,650 | 78,706,273 | |
| INVESTMENTS | ||||
| Equity Income | 112,186,705 | 112,300,525 | 31,109,218 | 30,727,405 |
| Held at fair value | 858,007 | 839,546 | 879,695 | 861,234 |
| Other Investments | 19,387 | 19,387 | 97,987 | 97,987 |
| 113,064,099 | 113,159,458 | 32,086,900 | 31,686,626 | |
| FIXED ASSETS | 6,095,970 | 6,137,175 | 36,587,602 | 36,854,056 |
| INTANGIBLE | 20,655,371 | 20,779,526 | 77,522,012 | 78,173,273 |
| 174,936,897 | 175,411,146 | 224,640,164 | 225,420,228 | |
| TOTAL ASSETS | 206,431,140 | 213,483,777 | 282,016,140 | 289,871,331 |
Earnings Release 1Q25 |
|
| PARENT COMPANY | CONSOLIDATED | |||
| LIABILITIES AND SHAREHOLDERS' EQUITY | 3/31/2025 | 12/31/2024 | 3/31/2025 | 12/31/2024 |
| CURRENT LIABILITIES | ||||
| Loans, financing and debentures | 4,918,686 | 8,329,966 | 8,726,979 | 12,809,872 |
| Compulsory loans - Agreements | 1,081,121 | 1,105,534 | 1,081,121 | 1,105,534 |
| Compulsory loans | 1,309,223 | 1,326,925 | 1,309,223 | 1,326,925 |
| Suppliers | 1,054,103 | 1,145,660 | 2,341,803 | 2,756,329 |
| Taxes and Contributions | 203,295 | 378,569 | 980,771 | 1,146,169 |
| Income tax and social contribution | 0 | 0 | 0 | 0 |
| Onerous contracts | 0 | 0 | 119,018 | 62,711 |
| Shareholder remuneration | 294,774 | 2,486,778 | 315,961 | 2,490,668 |
| Personnel obligations | 416,402 | 483,779 | 826,916 | 1,065,114 |
| Reimbursement Obligations | 0 | 0 | 47,959 | 55,517 |
| Post-employment benefits | 920 | 993 | 275,373 | 289,840 |
| Provision for litigation | 1,719,453 | 1,719,453 | 1,786,501 | 1,791,088 |
| Sector charges | 97,483 | 105,352 | 873,758 | 820,067 |
| Obligations under Law 14,182/2021 | 843,136 | 814,819 | 3,001,765 | 2,916,199 |
| RGR Returns | 544,000 | 492,276 | 544,000 | 492,276 |
| Leasing | 5,356 | 8,429 | 23,068 | 26,861 |
| Derivative financial instruments | 1,011,149 | 824,125 | 1,406,301 | 1,175,652 |
| Others | 459,813 | 458,746 | 1,260,476 | 1,105,095 |
| 13,958,914 | 19,681,404 | 24,920,993 | 31,435,917 | |
| Liabilities associated with assets held for sale | 0 | 0 | 138,176 | 194,454 |
| 13,958,914 | 19,681,404 | 25,059,169 | 31,630,371 | |
| NON-CURRENT | ||||
| Loans, financing and debentures | 40,248,732 | 40,926,187 | 62,162,567 | 62,810,702 |
| Shareholder remuneration | 0 | 0 | 479 | 0 |
| Suppliers | 0 | 0 | 8,271 | 7,959 |
| Provision for litigation | 15,305,917 | 15,658,437 | 21,360,231 | 21,583,395 |
| Post-employment benefits | 416,482 | 418,586 | 3,428,100 | 3,416,381 |
| Obligations under Law 14,182/2021 | 11,280,294 | 11,111,765 | 39,638,051 | 39,105,924 |
| RGR Returns | 329,980 | 439,974 | 329,980 | 439,974 |
| Onerous contracts | 0 | 0 | 536,322 | 621,725 |
| Reimbursement Obligations | 0 | 0 | 15,286 | 15,286 |
| Leasing | 79,695 | 79,994 | 150,971 | 155,722 |
| Concessions payable - Use of public assets | 38,450 | 38,175 | 556,561 | 543,867 |
| Advances for future capital increases | 112,198 | 108,938 | 112,198 | 108,938 |
| Derivative financial instruments | 0 | 2,283 | 0 | 2,283 |
Earnings Release 1Q25 |
|
| Sector charges | 759,907 | 744,833 | 985,328 | 942,348 |
| Taxes and Contributions | 97,503 | 103,682 | 325,182 | 372,488 |
| Deferred income tax and social contribution | 1,571,735 | 1,566,835 | 4,165,336 | 4,287,021 |
| Others | 737,268 | 739,459 | 1,604,426 | 1,827,171 |
| 70,978,161 | 71,939,148 | 135,379,289 | 136,241,184 | |
| SHAREHOLDERS' EQUITY | ||||
| Share capital | 70,099,826 | 70,099,826 | 70,099,826 | 70,099,826 |
| Share issue costs | -108,186 | -108,186 | -108,186 | -108,186 |
| Capital Reserves and Granted Equity Instruments | 13,910,768 | 13,910,768 | 13,910,768 | 13,910,768 |
| Treasury shares | -2,223,011 | -2,223,011 | -2,223,011 | -2,223,011 |
| Profit reserves | 43,905,041 | 43,905,041 | 43,905,041 | 43,905,041 |
| Proposed additional dividend | 1,535,196 | 1,535,196 | 1,535,196 | 1,535,196 |
| Accumulated profit | -353,039 | 0 | -353,039 | 0 |
| Accumulated other comprehensive income | -5,272,530 | -5,256,409 | -5,272,530 | -5,256,409 |
| Amounts recognized in other comprehensive income classified as held for sale | 0 | 0 | 0 | 0 |
| Controlling shareholders | 121,494,065 | 121,863,225 | 121,494,065 | 121,863,225 |
| Non-controlling shareholders | 0 | 0 | 83,617 | 136,551 |
| TOTAL SHAREHOLDERS' EQUITY | 121,494,065 | 121,863,225 | 121,577,682 | 121,999,776 |
| TOTAL LIABILITIES AND SHAREHOLDERS' EQUITY | 206,431,140 | 213,483,777 | 282,016,140 | 289,871,331 |
Earnings Release 1Q25 |
|
Table 35 - Income Statement (R$ Thousand)
| PARENT COMPANY | CONSOLIDATED | |||
| 03/31/2025 | 03/31/2024 | 03/31/2025 | 03/31/2024 | |
| CONTINUING OPERATIONS | ||||
| Net operating revenue | 3,822,140 | 14,662 | 10,414,179 | 8,718,271 |
| Operating costs | -2,096,971 | -32 | -5,607,758 | -4,499,682 |
| GROSS PROFIT | 1,725,169 | 14,630 | 4,806,421 | 4,218,589 |
| Operating expenses | -366,901 | -107,137 | -1,150,517 | -1,175,912 |
| Regulatory Remeasurements - Transmission Contracts | 0 | 0 | -951,763 | 0 |
| OPERATING RESULT BEFORE FINANCIAL RESULT | 1,358,268 | -92,507 | 2,704,141 | 3,042,677 |
| FINANCIAL RESULT | -1,728,586 | -814,911 | -3,493,978 | -2,987,777 |
| Income from interest, fines, commissions and fees | 93,514 | 247,318 | 36,798 | 32,234 |
| Income from financial investments | 619,911 | 212,567 | 1,057,136 | 573,675 |
| Late payment surcharge on electricity | 1,679 | 0 | 32,318 | 46,816 |
| Other financial income | 25,789 | 67,282 | 29,189 | 73,628 |
| (–) Taxes on financial income | -47,823 | -28,173 | -82,248 | -51,447 |
| Financial Income | 693,070 | 498,994 | 1,073,193 | 674,906 |
| Debt charges | -911,640 | -754,978 | -1,639,807 | -1,624,862 |
| CDE obligation charges | -190,279 | 0 | -661,631 | -609,710 |
| River basin revitalization charges | -21,157 | 0 | -78,708 | -85,047 |
| Other financial expenses | -46,850 | -54,746 | -84,124 | -150,668 |
| Financial expenses | -1,169,926 | -809,724 | -2,464,270 | -2,470,287 |
| Monetary updates – CDE | -210,725 | 0 | -732,725 | -493,374 |
| Monetary updates – river basins | -29,347 | 0 | -113,448 | -86,773 |
| Monetary reliefs | -229,615 | -330,108 | -284,749 | -346,776 |
| Exchange rate variations | -8,446 | 896 | 4,821 | -2,444 |
| Change in fair value of hedged debt net of derivative | -773,597 | -174,969 | -966,470 | -191,053 |
| Change in derivative financial instrument not linked to debt protection | 0 | 0 | -10,330 | -71,976 |
| Financial items, net | -1,251,730 | -504,181 | -2,102,901 | -1,192,396 |
Earnings Release 1Q25 |
|
| PARENT COMPANY | CONSOLIDATED | |||
| 03/31/2025 | 03/31/2024 | 03/31/2025 | 03/31/2024 | |
| PROFIT BEFORE EQUITY HOLDINGS | -370,318 | -907,418 | -789,837 | 54,900 |
| Equity income | -69,100 | 1,235,115 | 367,832 | 575,962 |
| Other income and expenses | 85,002 | 354 | 133,325 | 4,767 |
| OPERATING PROFIT BEFORE TAX | -354,416 | 328,051 | -288,680 | 635,629 |
| Current income tax and social contribution | 0 | 0 | -79,344 | -513,922 |
| Deferred income tax and social contribution | 1,377 | 0 | 14,407 | 208,827 |
| NET INCOME FOR CONTINUING OPERATIONS | -353,039 | 328,051 | -353,617 | 330,534 |
| Portion attributable to controlling | -353,039 | 328,051 | -353,039 | 328,051 |
| Portion attributable to non-controlling | 0 | 0 | -578 | 2,483 |
| NET INCOME (LOSS) FOR DISCONTINUED OPERATIONS | 0 | 0 | 0 | 0 |
| Portion attributable to controlling | 0 | 0 | 0 | 0 |
| Portion attributable to non-controlling | 0 | 0 | 0 | 0 |
| NET INCOME FOR THE YEAR | -353,039 | 328,051 | -353,617 | 330,534 |
| Portion attributable to controlling | -353,039 | 328,051 | -353,039 | 328,051 |
| Portion attributable to non-controlling | 0 | 0 | -578 | 2,483 |
| EARNINGS PER SHARE | ||||
| Earnings per share - basic (ON) | -0.16 | 0.14 | -0.16 | 0.14 |
| Earnings per share - basic (PN) | -0.15 | 0.14 | -0.15 | 0.14 |
| Earnings per share - diluted (ON) | -0.15 | 0.14 | -0.15 | 0.14 |
| Earnings per share - diluted (PN) | -0.17 | 0.15 | -0.17 | 0.15 |
Earnings Release 1Q25 |
|
Table 36 - Cash Flow Statement (R$ Thousand)
| PARENT COMPANY | CONSOLIDATED | |||
| 03/31/2025 | 03/31/2024 | 03/31/2025 | 03/31/2024 | |
| OPERATING ACTIVITIES | ||||
| Profit for the year before income tax and social contribution | -354,416 | 328,051 | -288,680 | 635,629 |
| Adjustments to reconcile profit with cash generated by operations: | ||||
| Depreciation and amortization | 218,351 | 4,377 | 1,112,231 | 996,711 |
| Net exchange and monetary variations | 478,133 | 329,212 | 1,126,101 | 929,367 |
| Financial charges | 409,651 | 295,093 | 1,286,212 | 1,713,710 |
| Equity income | 69,100 | -1,235,115 | -367,832 | -575,962 |
| Other income and expenses | -33,001 | -354 | -81,324 | -4,767 |
| Transmission revenues | -1,931,428 | 0 | -5,185,619 | -4,558,572 |
| Construction cost - transmission | 304,592 | 0 | 745,323 | 641,806 |
| Regulatory Remeasurements - Transmission Contracts | 0 | 0 | 951,763 | 0 |
| Operating provisions (reversals) | -106,107 | -180,627 | 126,417 | 195,661 |
| Write-offs of PP&E and Intangible Assets | 266 | 0 | 31,975 | 0 |
| Result of hedged debt and derivatives | 773,597 | 174,969 | 976,800 | 263,029 |
| Other | 321,425 | 2,269 | 492,940 | 117,443 |
| 504,579 | -610,176 | 1,214,987 | -281,574 | |
| (Additions)/decreases in operating assets | ||||
| Clients | -38,145 | -111 | 598,273 | 245,656 |
| Right to compensation | 340,287 | -42,549 | 346,298 | -23,938 |
| Others | 867,771 | -36,976 | 684,731 | -541,798 |
| 1,169,913 | -79,636 | 1,629,302 | -320,080 | |
| Additions/(decreases) in operating liabilities | ||||
| Suppliers | -91,557 | -51,446 | -414,214 | -1,111,217 |
| Advances | 0 | 0 | 0 | 0 |
| Personnel obligations | -67,377 | -3,469 | -238,198 | -197,579 |
| Sector charges | 7,205 | 0 | 96,671 | 69,675 |
| Others | -233,051 | -239,185 | -502,831 | -321,710 |
| -384,780 | -294,100 | -1,058,572 | -1,560,831 | |
| Payment of financial charges | -1,487,656 | -902,194 | -1,913,735 | -1,535,742 |
| Receipt of RAP revenue | 1,799,108 | 0 | 4,570,414 | 5,101,107 |
| Receipt of Financial Charges from Subsidiaries | 55,217 | 230,943 | 0 | 0 |
| Receipt of remuneration from investments in equity holdings | 284,706 | 822,193 | 277,907 | 144,873 |
| Payment of litigation | -492,269 | -111,603 | -529,389 | -243,504 |
| Bonds and linked deposits | -513,829 | -175,340 | -506,543 | -206,260 |
| Payment of income tax and social contribution | -73,007 | -25,874 | -238,827 | -322,543 |
| Supplementary pension payments | -6,136 | -5,452 | -17,511 | -124,997 |
Earnings Release 1Q25 |
|
| PARENT COMPANY | CONSOLIDATED | |||
| 03/31/2025 | 03/31/2024 | 03/31/2025 | 03/31/2024 | |
| Net cash provided by operating activities of discontinued operations | 0 | 0 | 0 | 0 |
| Net cash provided by (used in) operating activities | 501,430 | -823,188 | 3,139,353 | 1,286,078 |
| FINANCING ACTIVITIES | ||||
| Loans and financing obtained and debentures obtained | 0 | 0 | 500,298 | 524,896 |
| Payment of loans and financing and debentures - principal | -3,424,067 | -892,198 | -4,956,916 | -1,150,846 |
| Payment of remuneration to shareholders | -2,192,004 | -424 | -2,192,004 | -424 |
| Payment to dissenting shareholders - incorporation of shares | 0 | 0 | 0 | 0 |
| Share buybacks | 0 | 0 | 0 | 0 |
| Payment of CDE obligations and revitalization of basins - principal | -254,663 | 0 | -887,917 | -846,890 |
| Lease payments - principal | 0 | -4,851 | -6,063 | -16,088 |
| Restricted Cash | 0 | 0 | 0 | 0 |
| Others | 0 | 0 | 0 | 0 |
| Net cash (used in) financing activities | -5,870,734 | -897,473 | -7,542,602 | -1,489,352 |
| INVESTMENT ACTIVITIES | ||||
| Grant of advance for future capital increase | 0 | -5,113 | 0 | -5,113 |
| Receipt of loans and financing | 112,116 | 436,887 | 1,239 | 304,308 |
| Receipt of financial charges | 151 | 60,036 | 151 | 53,935 |
| Acquisition of fixed assets | -37,878 | -2 | -226,396 | -661,972 |
| Acquisition of intangible assets | -15,377 | -7,566 | -37,177 | -58,634 |
| Restricted cash | -56,451 | 0 | -266,822 | -639,129 |
| Financial (withdrawals)/contributions (securities) | 2,095,006 | 1,029,792 | 1,601,108 | 205,458 |
| Receipt of charges (securities) | 163,993 | 56,386 | 195,946 | 91,616 |
| Debentures Acquisition | 0 | 0 | 0 | 0 |
| Transmission infrastructure - contractual asset | -304,592 | 0 | -745,323 | -642,555 |
| Capital acquisition/contribution of equity holdings | -37,222 | 0 | -37,222 | 0 |
| Disposal of equity holdings | 9,051 | 0 | 9,051 | 0 |
| Net cash in the incorporation of subsidiaries | 0 | 0 | 0 | 0 |
| Net cash in the acquisition of control of investees | 0 | 0 | 0 | 0 |
| Others | 0 | 0 | 8 | 1,208 |
| Net cash provided by investment activities of discontinued operations | 0 | 0 | 0 | 0 |
| Net cash provided by (used in) investing activities | 1,928,797 | 1,570,420 | 494,563 | -1,350,878 |
| Increase (decrease) in cash and cash equivalents | -3,440,507 | -150,241 | -3,908,686 | -1,554,152 |
| Cash and cash equivalents at the beginning of the period | 5,698,457 | 4,927,871 | 13,046,371 | 10,739,126 |
| Cash and cash equivalents at the end of the period | 2,257,950 | 4,777,630 | 9,137,685 | 9,184,974 |
| -3,440,507 | -150,241 | -3,908,686 | -1,554,152 | |
Earnings Release 1Q25 |
|
11.2. Appendix 2 - Statement on Thermal Power Plants Sale
On June 10, 2024, Eletrobras signed an agreement with Âmbar Energia/J&F Group to sell its thermoelectric portfolio for R$ 4.7 billion, including R$ 1.2 billion in earn-out. J&F also immediately and fully assumed the credit risk of the energy contracts in this portfolio.
On June 12, 2024, Provisional Measure No. 1,232 was published, introducing changes to the rules for isolated systems. The measure allows for a corporate transfer plan to be approved as an alternative to concession extinction, provided that ANEEL recognizes the loss of service conditions. It also modifies the rules for energy purchase and sale contracts (CCVEEs) reimbursable by the Fuel Consumption Account (CCC).
As a result, Eletronorte entered into Reserve Energy Contracts (CERs) with the Electric Energy Commercialization Chamber (CCEE), linked to specific Company power plants9. In addition, the terminations of CCVEEs for these plants, along with the Term of Withdrawal and Waiver of Rights against the Federal Government regarding energy purchases, were signed with Amazonas Distribuidora de Energia S/A before exchanging contracts for CERs.
The documents were approved sub judice in accordance with ANEEL Ruling No. 3,025, dated October 7, 2024. Eletrobras is already receiving the new CER-related payments directly from CCEE, including retroactive amounts up to June 13, 2024, the date on which the energy supply provided for in the CERs began.
Furthermore, on May 14, 2025, the partial closing of the sale of thermal plants to the J&F Group was concluded. This phase includes the thermoelectric assets of Eletronorte, which are the counterparties to the new CERs. The closing of the sale of TPP Santa Cruz (500 MW), the last remaining asset in the divested portfolio, is still pending the completion of regulatory approvals.
11.3. Appendix 3 - Statement on Furnas Merger
In the tables detailing the main operating subsidiaries of the Eletrobras Group, the comments on results for “Eletrobras Holding” as of 3Q24 take into account the following considerations:
| a) | Furnas’ newly-incorporated assets; |
| b) | The generation entities: Baguari Energia, Retiro Baixo Energética, Brasil Ventos, and Madeira Energia (MESA); and |
| c) | The transmission entities: Triângulo Mineiro Transmissora, Vale do São Bartolomeu Transmissora, and Nova Era Janapú. |
These seven entities were previously consolidated under Furnas.
For simplicity in comparisons between 1Q25 and 1Q24, the sum of Eletrobras Holding and consolidated Furnas, including the seven SPEs, was considered for 1Q24. This approach was adopted as the eliminations have an immaterial impact on both the operating result (revenue and EBITDA) and the financial result.
9 Aparecida, Jaraqui, Tambaqui, Cristiano Rocha, Manauara and Ponta Negra.
Earnings Release 1Q25 |
|
11.4. Appendix 4 - Regulatory vs IFRS Income Statement
Considering the regulatory income statement versus the IFRS one, the differences in accounting treatment in both frameworks generated a positive effect of R$ 1,167 million on EBITDA and R$ 489 million on net income.
Chart 10 - EBITDA Regulatory x IFRS (R$ mm)
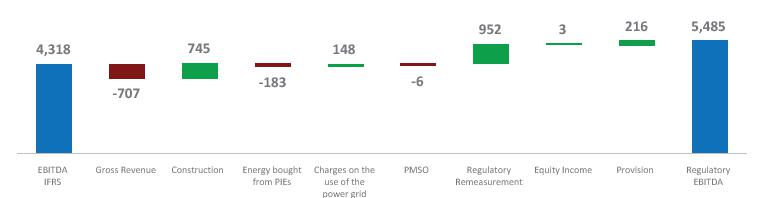
Chart 11 - Net Income Regulatory x IFRS (R$ mm)

The difference between regulatory and IFRS net income can also be analyzed by reorganizing the Income Statement lines. It is possible to group them according to the operational nature of the events to which they are related. This exercise consists of segmenting them into (a) transmission, (b) generation, (c) equity holdings, and (d) others—including provisions, financial result and taxes.
As a result, the entire difference between regulatory and IFRS net income is essentially explained by the specific accounting treatment applied to the transmission segment under each accounting framework, resulting in a positive effect of R$ 594 million on regulatory net income, considering the transactions of consolidated companies within this segment.
Chart 12 - Net Income Regulatory x IFRS by Segment (R$ mm)
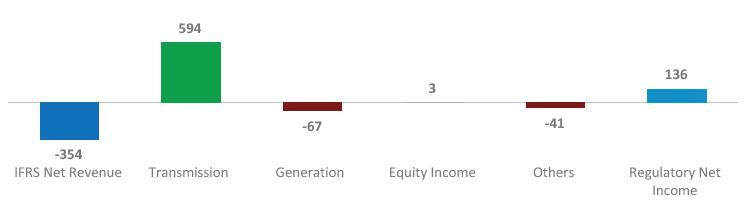
Earnings Release 1Q25 |
|
Transmission: R$ 594 million positive effect
Chart 13 - Transmission Effects (R$ mm)
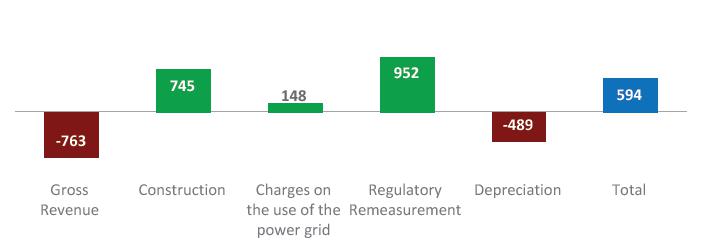
| • | -R$ 763 million in gross revenue, including two effects: |
(a) In the regulatory system, revenue is recognized on a cash basis, based on the billing of transmission concessionaires. Under IFRS, revenue reflects the value of the contractual asset, which is a non-cash item.
(b) The difference in the way the network usage charge paid by Eletrobras’ generation companies to its own transmission companies is eliminated from transmission revenue, following the cash regime in the regulatory framework. In the IFRS framework, one of the non-cash portions of transmission revenue is considered: operation and maintenance revenue.
| • | R$ 745 million relating to the construction cost, recognized only at IFRS accounting; |
| • | R$ 148 million as a counterpart to the elimination in transmission revenue mentioned in item (b) above, recorded in the cost with charges for use of the generation grid, in the same amount, but with the sign inverted; |
| • | R$ 952 million in regulatory remeasurement, referring to the reversal of part of the amount recognized in 2024 following the Tariff Review of the concession contracts at Chesf; |
| • | -R$ 489 million referring to higher depreciation under the regulatory framework, reflecting the depreciation of transmission lines and substations—an effect that does not occur on the contractual asset under the IFRS framework. |
Earnings Release 1Q25 |
|
Generation: R$ 67 million negative effect
Chart 14 - Generation Effects (R$ mm)

| • | In 1Q25, the R$ 56 million positive difference in revenue is explained by the default on part of the energy sold by HPP Balbina, which was offset by a provision of the same amount under the regulatory framework. In this framework, the revenue is recognized and fully provisioned, whereas under IFRS, it is not recognized. |
| • | Energy Purchased from Independent Power Producers (IPPs): under the regulatory framework, an expense of R$ 183 million is recognized for energy purchased for resale. Under the IFRS framework, the purchase agreement is treated as a lease; therefore, only the depreciation of the right-of-use asset and the interest expense on the lease liability are recognized in the financial result, in the amounts of R$ 11 million and R$ 134 million, respectively. The total net effect is a negative R$ 38 million under the regulatory framework. |
| • | Management of Generation Assets (GAG) for investment in improvements: under IFRS, this liability in the amount of R$ 28 million is reversed under provisions, following the decotization curve as legacy contracts of the plants are gradually phased out. Under the regulatory framework, this effect is not recognized. |
Equity Income: R$ 3 million positive effect
| • | Mainly reflecting the equity income from the transmission segment. |
Other Lines: -R$ 41 million negative effect
| • | Differences in recognition in various lines of provision, financial results and taxes. |
Earnings Release 1Q25 |
|
11.5. Appendix 5 - EBITDA IFRS
Table 37 - Adjusted IFRS EBITDA (R$ Thousand)
| 1Q25 | 1Q24 | % | 4Q24 | % | 3M25 | 3M24 | % | |
| Results for the year | -354 | 331 | -207.0 | 1,112 | -131.8 | -354 | 331 | -207.0 |
| + Results for the year, discontinued operations | 0 | 0 | 0.0 | 0 | 0.0 | 0 | 0 | 0.0 |
| Results for the year, continued operations | -354 | 331 | -207.0 | 1,112 | -131.8 | -354 | 331 | -207.0 |
| + Provision for Income Tax and Social Contribution | 65 | 305 | -78.7 | -48 | -235.4 | 65 | 305 | -78.7 |
| + Financial Result | 3,494 | 2,988 | 16.9 | 2,930 | 19.2 | 3,494 | 2,988 | 16.9 |
| + Amortization and Depreciation | 1,112 | 997 | 11.6 | 1,033 | 7.7 | 1,112 | 997 | 11.6 |
| EBITDA | 4,318 | 4,620 | -6.5 | 5,027 | -14.1 | 4,318 | 4,620 | -6.5 |
| Revenue Adjustments | 0 | 0 | 0.0 | 0 | 0.0 | 0 | 0 | 0.0 |
| Cost and Expense Adjustments | 191 | 33 | 484.7 | 292 | -34.5 | 191 | 33 | 484.7 |
| Adjustments Provisions | 41 | -118 | -134.4 | -552 | -107.4 | 41 | -118 | -134.4 |
| Adjustments Other Income and Expenses | -133 | -5 | 2,696.8 | -95 | 40.1 | -133 | -5 | 2,696.8 |
| Adjusted EBITDA | 4,416 | 4,530 | -2.5 | 4,672 | -5.5 | 4,416 | 4,530 | -2.5 |
11.6. Appendix 6 - Generation Revenue IFRS
The following table presents the breakdown of the IFRS Generation Revenue, aligned with the accounting statements. The power supply for distribution companies is revenue derived from customers who are not end consumers, such as distributors, traders, and generators, covering contracts in both the free contracting (ACL) and regulated market (ACR) environments, while the power supply for end consumers is revenue that comes directly from end consumers, including industries and commercial entities, and consists exclusively of contracts in the free contracting environment (ACL).
Table 38 - Gross Revenue 1Q25 (R$ mm)
| 1Q25 | |||||||
| Eletrobras Holding | Chesf | Eletronorte | CGT Eletrosul | Total | Elimination | Consolidated IFRS | |
| Power supply for distribution companies | 3,128 | 402 | 1,864 | 206 | 5,599 | -257 | 5,342 |
| Power supply for end consumers | 332 | 50 | 79 | 33 | 494 | 0 | 494 |
| CCEE | 85 | 80 | 425 | 22 | 612 | 0 | 612 |
| O&M revenue | 178 | 336 | 4 | 0 | 519 | 0 | 519 |
| Generation Revenues | 3,724 | 868 | 2,372 | 261 | 7,225 | -257 | 6,967 |
| Non-recurring items - Adjustments | 0 | 0 | 0 | 0 | 0 | 0 | 0 |
| Adjusted Generation Revenue | 3,724 | 868 | 2,372 | 261 | 7,225 | -257 | 6,967 |
Earnings Release 1Q25 |
|
Table 39 - Gross Revenue 1Q24 (R$ mm)
| 1Q24 | |||||||
| Eletrobras + Furnas and Others | Chesf | Eletronorte | CGT Eletrosul | Total | Elimination | Consolidated IFRS | |
| Power supply for distribution companies | 1,872 | 116 | 1,505 | 191 | 3,684 | -1 | 3,683 |
| Power supply for end consumers | 310 | 77 | 365 | 9 | 761 | 0 | 761 |
| CCEE | 188 | 228 | 284 | 2 | 701 | 0 | 701 |
| O&M revenue | 263 | 518 | 7 | 0 | 787 | 0 | 787 |
| Generation Revenues | 2,633 | 938 | 2,161 | 202 | 5,934 | -1 | 5,933 |
| Non-recurring items - Adjustments | 0 | 0 | 0 | 0 | 0 | 0 | 0 |
| Adjusted Generation Revenue | 2,633 | 938 | 2,161 | 202 | 5,934 | -1 | 5,933 |
11.7. Appendix 7 - Transmission Revenue IFRS
IFRS transmission revenue was R$ 5,186 million in 1Q25, up 14% from 1Q24, recording increases of R$ 350 million in Contractual revenue, R$ 160 million in Construction revenue, and R$ 117 million in O&M revenue. O&M revenue relates to the operation and maintenance of assets in operation. Construction revenue corresponds to investments made (appropriated and allocated) in ongoing projects. Contractual (financial) revenue is derived from the application of inflation indexes to the contract asset balances of each concession.
Table 40 - Transmission Operating Revenue (R$ mm)
| 1Q25 | 1Q24 | % | 4Q24 | % | 3M25 | 3M24 | % | |
| Transmission Revenues | 5,186 | 4,559 | 14 | 5,773 | -10 | 5,186 | 4,559 | 14 |
| Revenue from Operation & Maintenance | 2,016 | 1,899 | 6 | 1,863 | 8 | 2,016 | 1,899 | 6 |
| Construction Revenue | 746 | 586 | 27 | 1,811 | -59 | 746 | 586 | 27 |
| Contractual Revenue - Transmission | 2,424 | 2,074 | 17 | 2,099 | 15 | 2,424 | 2,074 | 17 |
| Non-recurring items - Adjustments | 0 | 0 | 0 | 0 | 0 | 0 | 0 | 0 |
| Adjusted Transmission Operating Revenue | 5,186 | 4,559 | 14 | 5,773 | -10 | 5,186 | 4,559 | 14 |
11.8. Appendix 8 - Regulatory Transmission Revenue - Adjustment Portion (PA)
The Adjustment Portion (PA) of the current tariff cycle is a regulatory mechanism, as outlined in the contract, designed to compensate for revenue deficits or surpluses from the previous tariff cycle. In other words, it adjusts the difference between the amounts received and those allowed in the prior cycle, which is then offset in 12 equal monthly installments during the current cycle. The Adjustment Portion can be positive or negative, depending on each agent’s balance.
The table below presents the PA breakdown defined by ANEEL for the 2024/2025 cycle, as established in ANEEL Resolution 3,348/2024, within the scope of the Annual RAP Readjustment for the 2024/2025 cycle. Additionally, for the upcoming tariff cycles (2025/2026 to 2027/2028), the PA Reviews established by ANEEL under the RAP periodic review processes for renewed and tendered concession contracts—approved by ANEEL up to the 2024/2025 cycle—are also included.
Earnings Release 1Q25 |
|
Table 41 - Adjustment Portion (PA) - ANEEL Resolution 3,348/2024 (R$ mm)
|
Concession Contracts Extended by Law 12,783/2012 As of Jun/24 |
PA Cycle 24/25 |
PA Cycle 25/26 |
PA Cycle 26/27 |
PA Cycle 27/28 |
TOTAL |
| PA Periodic Review of RAP - 2023 (I) (1) | -811 | 480 | 480 | 480 | 628 |
| PA Postponement RTP (Periodic Tariff Review) (2) | -1,316 | -1,316 | |||
| RBSE - Economic Component | -1,655 | -1,655 | |||
| RBSE - O&M - Ordinance 579/2012 | 18 | 18 | |||
| Reinforcements and Improvements with Previous RAP | -176 | -176 | |||
| Reinforcements and Improvements without Previous RAP (3) | 496 | 496 | |||
| PA Retroactive of the revised revenue for Reinforcements and Improvements (4) | 349 | 349 | 349 | 349 | 1,395 |
| Reinforcements and Improvements with Previous RAP | 50 | 50 | 50 | 50 | 201 |
| Reinforcements and Improvements without Previous RAP | 299 | 299 | 299 | 299 | 1,194 |
| PA Other Adjustments - RTP 2023 (5) | 26 | 26 | |||
| PA Annual Improvements (6) | 131 | 131 | 131 | 131 | 524 |
| PA Annual Readjustment of RAP cycle 2024/2025 (II) | -627 | 0 | 0 | 0 | -627 |
| PA Measurement (7) | -623 | -623 | |||
| PA Authorizations for Small-Scale Reinforcements without RAP (8) | 5 | 5 | |||
| PA Other Adjustments | -9 | -9 | |||
| TOTAL PA - Concession Contracts Extended (I + II) | -1,438 | 480 | 480 | 480 | 1 |
| Concession Contracts Tendered | |||||
| PA Periodic Tariff Review of RAP (III) (9) | 19 | 15 | 10 | 6 | 49 |
| PA Annual Readjustment of RAP cycle 2024/2025 (IV) | -110 | 0 | 0 | 0 | -110 |
| PA Measurement (7) | -112 | -112 | |||
| PA Authorizations for Small Reinforcements without RAP (8) | 2 | 2 | |||
| PA Other Adjustments | 0 | 0 | |||
| PA TOTAL - Concession Contracts Tendered (III + IV) | -91 | 15 | 10 | 6 | -61 |
(1) Adjustment Portion (PA) established in ANEEL Resolution No. 3,344/2024, defining the RAP Periodic Review results for Concession Contracts 057/2001, 058/2001, 061/2001, and 062/2001, extended under Law 12,783/2013, following Public Consultation (CP) ANEEL 12/2024.
(2) PA Postponement: Financial differences from postponing the RAP Periodic Review for extended concession contracts from 07/01/2023 to 07/01/2024, per Ruling No. 402/2023. PA to be offset in a single installment.
(3) Includes annuities (prepayments) for the execution of small-scale improvements related to the 2023-2024 cycle.
(4) PA Retroactive: Retroactive RAP additional installments for reinforcements and improvements undergoing their first Periodic Review (incremental basis), covering the period from commercial operation start until June 30, 2023, as per Submodule 9.7 of PRORET. Already adjusted for full-year payments related to prepayment of part of the revenue associated with executing small-scale improvements that initially had no prior revenue. To be offset in equal installments until the subsequent review in July 2028.
(5) PA Other Adjustments - RTP 2023: Adjustments based on Technical Notes No. 58/2024 and No. 103/2024-STR/ANEEL, supporting Public Consultation 12/2024. To be offset in a single installment.
(6) PA Annual Fee Improvements: Annual financial contribution for the execution of small-scale improvements to be considered as from the 2024-2025 cycle until the 2027-2028 cycle
(7) PA Calculation: Offsets differences arising from revenue deficits or surpluses in the ONS accounting process.
(8) PA Authorizations for Small-Scale Reinforcements without RAP: Covers the RAP portion from the commercial operation start date (per ONS Release Term) until June 30 of year i (June of cycle i-1), for cases where small-scale reinforcements were authorized with RAP established within the Annual RAP Adjustment.
(9) Considers only the PA of the Review approved by ANEEL for Tendered concession contracts reviewed until 2024.
Earnings Release 1Q25 |
|
11.9. Appendix 9 - RAP's Periodic Tariff Review of tendered contracts revised in 2024
The result of the Periodic Tariff Review (RTP) of the Annual Permitted Revenue (RAP) for the Auctioned Transmission Concession Contracts reviewed in 2024 was initially established through ANEEL Resolution No. 3,343/2024, published on July 11, 2024.
On April 4, 2025, ANEEL published Ruling No. 920/2025, through which it decided to consider the administrative appeals filed against ANEEL Resolution No. 3,343/2024 and partially uphold them. The ruling approved amendments to the outcome of the RAP Periodic Review for the auctioned transmission concession contracts with a review date of July 2024, whose effects will be effectively reflected throughout the 2025–2026 cycle.
Following the analysis of the reconsideration requests, the Agency identified material errors and the need to make official corrections.
As a result of the adjustments introduced by Ruling No. 920/2025, there was a 0.01% reduction in the total value of the RAP plus the Adjustment Portion originally approved by ANEEL Resolution No. 3,343/2024, as detailed in the following tables:
Table 42 - Revised RAP and PA values for Reinforcements and Improvements, after analysis of the appeals against ReH No. 3,343/2024 (R$) – Dispatch No. 920/2025
| Concessionaire | Contract |
Gross RAP Reviewed ANEEL 3,343/2024 (R$) |
Total PA ANEEL 3,343/2024 (R$) | Gross RAP Reviewed Post-Appeals (R$) | Total PA Post Revision (R$) | Total Difference RAP + PA (R$) | Total Chg RAP + PA (%) |
| Eletronorte | 002/2009 | 8,792,926 | -1,102,937 | 8,793,245 | -1,101,240 | 2,017 | 0.03 |
| Eletrobras Holding | 034/2001 | 11,335,375 | -563,270 | 11,335,375 | -563,270 | 0 | 0.00 |
| Eletronorte | 010/2009 | 1,539,965 | -77,310 | 1,539,965 | -77,310 | 0 | 0.00 |
| Eletronorte | 001/2009 | 18,283,185 | 3,752,485 | 18,283,185 | 3,752,485 | 0 | 0.00 |
| CGT Eletrosul | 005/2006 | 9,932 | -79,037 | 9,932 | -79,037 | 0 | 0.00 |
| CGT Eletrosul | 004/2004 | 12,829 | -102,175 | 12,829 | -102,175 | 0 | 0.00 |
| Eletrobras Holding | 007/2006 | 199,922 | 0 | 199,922 | 0 | 0 | 0.00 |
| Eletrobras Holding | 006/2005 | 95,794 | 0 | 95,794 | 0 | 0 | 0.00 |
| CGT Eletrosul | 005/2009 | 602,382 | -54,093 | 602,382 | -54,093 | 0 | 0.00 |
| Chesf | 014/2008 | 5,111,100 | 9,580,658 | 5,111,043 | 9,580,371 | -345 | 0.00 |
| Chesf | 007/2005 | 18,921,919 | 0 | 18,919,946 | 0 | -1,974 | -0.01 |
| Chesf | 006/2009 | 13,572,707 | 9,713,704 | 13,564,141 | 9,707,936 | -14,334 | -0.06 |
| Total | 78,478,036 | 21,068,025.6 | 78,467,759 | 21,063,667 | -14,635.59 | -0.01 |
Earnings Release 1Q25 |
|
11.10. Appendix 10 - 2nd RAP's Periodic Tariff Review of contracts extended by Law 12,783/2013
The second Periodic Tariff Review (RTP) of the Annual Permitted Revenue (RAP) for the transmission concession contracts extended under Law No. 12,783/2013 was originally scheduled for 2023, with a review date of July 1, 2023, but was postponed to July 1, 2024, as established by ANEEL Ruling No. 402/2023. The result of this review was published on December 7, 2024, through ANEEL Resolution No. 3,344/2024.
On April 24, 2025, ANEEL issued Ruling No. 1,228/2025, in which it acknowledged the administrative appeals filed against Resolution No. 3,344/2024 and partially granted them, approving amendments to the outcome of the Periodic Review for the RAP of the extended transmission concession contracts. The effects of these changes will be effectively reflected throughout the 2025–2026 RAP cycle.
In addition to evaluating the reconsideration requests, the Agency conducted a new calculation of the Tariff Review and identified the need for official changes.
It is worth noting that, although part of the Company’s claims were accepted—resulting in positive impacts on revenue—the final outcome of the review led to a net reduction in revenue and in the Adjustment Portion (PA), due to official changes prompted by material errors. The main variation occurred in the Economic Component of RBSE, whose revenue was reduced by approximately R$192 million, with an equivalent impact on the Adjustment Portion.
As a result of the adjustments introduced by Ruling No. 1,228/2025, there was a 2.5% reduction in the RAP and a 23.2% reduction in the Adjustment Portion originally approved by ANEEL Resolution No. 3,344/2024, as detailed in the tables below:
Table 43 - Comparison of the impact of the changes to the RAP approved by ANEEL Res. No. 3,444/2024
| Concessionaire | Contract | RAP ANEEL 3,344/2024 (R$) | RAP Post-Appeals (R$) | Difference (R$) | Chg (%) |
| Chesf | 061/2001 | 2,526,404,066 | 2,327,142,640 | -199,261,426 | 7.9 |
| Eletronorte | 058/2001 | 1,256,255,532 | 1,258,880,988 | 2,625,456 | -0.2 |
| CGT Eletrosul | 057/2001 | 644,308,102 | 644,228,851 | -79,251 | 0.0 |
| Eletrobras Holding | 062/2001 | 3,138,941,152 | 3,144,894,572 | 5,953,420 | -0.2 |
| Total | 7,565,908,852 | 7,375,147,051.0 | -190,761,801 | 2.5 |
Table 44 - Comparison of the impact of the changes to the PA(1) approved by ANEEL Res. No. 3,444/2024
| Concessionaire | Contract | PA ANEEL 3,344/2024 (R$) | PA Post-Appeals (R$) | Difference (R$) | Chg (%) |
| Chesf | 061/2001 | -25,982,471 | -233,708,440 | -207,725,968 | -799.5 |
| Eletronorte | 058/2001 | -140,459,432 | -125,808,293 | 14,651,139 | 10.4 |
| CGT Eletrosul | 057/2001 | -52,840,680 | -52,204,298 | 636,382 | 1.2 |
| Eletrobras Holding | 062/2001 | -560,883,365 | -549,550,362 | 11,333,003 | 2.0 |
| Total | -780,165,949 | -961,271,393.5 | -181,105,445 | -23.2 |
The consolidated result, reflecting the adjustments established in Ruling No. 1,228/2025, is presented in the table below:
Earnings Release 1Q25 |
|
Table 45 - Consolidated changes to the revenue approved by ANEEL Res. No. 3,444/2024
| Concessionaire | Contract |
RAP + PA ANEEL 3,344/2024 (R$) |
RAP + PA PA Post-Appeals (R$) |
Total Difference (R$) |
Total Chg (%) |
| Chesf | 061/2001 | 2,500,421,595 | 2,093,434,200 | -406,987,394 | -16.28 |
| Eletronorte | 058/2001 | 1,115,796,100 | 1,133,072,695 | 17,276,595 | 1.55 |
| CGT Eletrosul | 057/2001 | 591,467,422 | 592,024,553 | 557,131 | 0.09 |
| Eletrobras Holding | 062/2001 | 2,578,057,787 | 2,595,344,210 | 17,286,423 | 0.67 |
| Total | 6,785,742,903 | 6,413,875,657.5 | -371,867,246 | -5.48 |
11.11. Appendix 11 - Financing and Loans Granted (Receivables)
Chart 15 - Receivables (R$ billion)
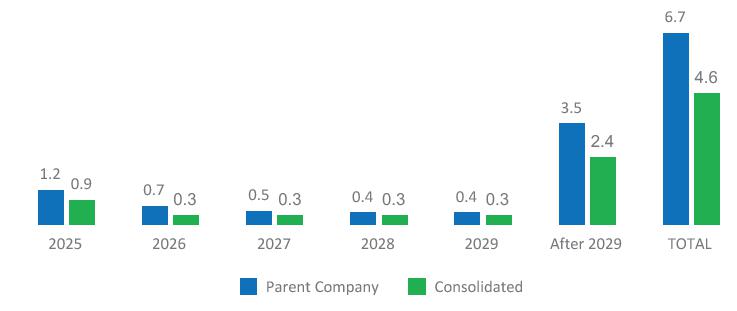
Does not include ECL of R$ 3,989 million and current charges.
Earnings Release 1Q25 |
|
11.12. Appendix 12 - Result Reconciliation Regulatory vs. IFRS
Table 46 - Reconciliation IFRS vs. Regulatory (R$ Thousand)
| CVM Result IFRS | Regulatory Result | Differences | CVM Result IFRS | Regulatory Result | Differences | |
| 03/31/2025 | 03/31/2024 | |||||
| OPERATING REVENUES | ||||||
| Generation | ||||||
| Power supply for distribution companies | 5,342,035 | 5,398,202 | -56,167 | 3,683,460 | 4,115,207 | -431,747 |
| Power supply for end consumers | 494,335 | 494,335 | 0 | 761,385 | 761,385 | 0 |
| CCEE revenue (short term market) | 611,792 | 611,792 | 0 | 701,165 | 701,165 | 0 |
| Operation and maintenance (O&M) revenue | 519,093 | 519,093 | 0 | 787,242 | 787,242 | 0 |
| Revenue from construction of Power Plants | 0 | 0 | 0 | 0 | 0 | 0 |
| Rate of return updates - Generation | 0 | 0 | 0 | 0 | 0 | 0 |
| Itaipu transfer | 0 | 0 | 0 | 0 | 0 | 0 |
| Transmission | ||||||
| Operation and maintenance revenue - Renewed Lines | 0 | 0 | 0 | 0 | 0 | 0 |
| Operation and maintenance revenue | 2,015,823 | 1,868,171 | 147,652 | 1,898,661 | 1,898,661 | 0 |
| Financial - Return on Investment - RBSE | 0 | 0 | 0 | 0 | 0 | 0 |
| Construction revenue | 746,008 | 0 | 746,008 | 585,683 | 0 | 585,683 |
| Contract revenue – Transmission | 2,423,788 | 0 | 2,423,788 | 2,074,228 | 0 | 2,074,228 |
| Transmission System Availability (Rap) | 0 | 2,554,771 | -2,554,771 | 0 | 3,211,041 | -3,211,041 |
| Other income | 68,749 | 68,749 | 0 | 79,370 | 78,444 | 926 |
| Deductions | ||||||
| (-) Sector charges | -652,535 | -652,535 | 0 | -648,914 | -648,914 | 0 |
| (-) ICMS | -64,024 | -64,024 | 0 | -236,462 | -236,462 | 0 |
| (-) PASEP e COFINS | -1,090,177 | -1,090,177 | 0 | -966,503 | -966,503 | 0 |
| (-) Other Deductions | -708 | -708 | 0 | -1,044 | -1,044 | 0 |
| Net Operating Revenue | 10,414,179 | 9,707,669 | 706,510 | 8,718,271 | 9,700,222 | -981,951 |
| OPERATING COSTS | ||||||
| Personnel, Material and Services | -651,822 | -651,822 | 0 | -666,689 | -666,491 | -198 |
Earnings Release 1Q25 |
|
| Energy purchased for resale | -1,560,041 | -1,743,372 | 183,331 | -737,337 | -912,873 | 175,536 |
| Charges for use of the electricity grid | -996,440 | -848,788 | -147,652 | -971,645 | -971,645 | 0 |
| Fuel for electricity production | -559,757 | -559,757 | 0 | -505,536 | -505,536 | 0 |
| Construction | -745,323 | 0 | -745,323 | -641,806 | 0 | -641,806 |
| Depreciation | -461,064 | -938,419 | 477,355 | -446,749 | -917,786 | 471,037 |
| Amortization | -566,096 | -568,086 | 1,990 | -490,085 | -501,932 | 11,847 |
| Operating provisions/reversals | 0 | 0 | 0 | 0 | 0 | 0 |
| Other costs | -67,215 | -64,377 | -2,838 | -39,835 | -39,890 | 55 |
| Operating costs | -5,607,758 | -5,374,621 | -233,137 | -4,499,682 | -4,516,153 | 16,471 |
| GROSS PROFIT | 4,806,421 | 4,333,048 | 473,373 | 4,218,589 | 5,184,069 | -965,480 |
| OPERATING EXPENSES | ||||||
| Personnel, Material and Services | -693,227 | -696,923 | 3,696 | -762,970 | -772,843 | 9,873 |
| Voluntary Dismissal Program | -96,402 | -96,402 | 0 | -32,736 | -32,736 | 0 |
| Remuneration and compensation | 0 | 0 | 0 | 0 | 0 | 0 |
| Depreciation | -54,090 | -54,050 | -40 | -50,702 | -49,514 | -1,188 |
| Amortization | -30,981 | -30,981 | 0 | -9,175 | -9,175 | 0 |
| Donations and contributions | -17,487 | -17,487 | 0 | -52,523 | -52,523 | 0 |
| Operating provisions/reversals | -126,417 | 89,213 | -215,630 | -195,661 | -425,524 | 229,863 |
| Other expenses | -131,913 | -137,398 | 5,485 | -72,145 | -74,818 | 2,673 |
| OPERATING EXPENSES | -1,150,517 | -944,028 | -206,489 | -1,175,912 | -1,417,133 | 241,221 |
| Regulatory Remeasurements - Transmission Contracts | -951,763 | 0 | -951,763 | 0 | 0 | 0 |
| OPERATING RESULT BEFORE FINANCIAL RESULT | 2,704,141 | 3,389,020 | -684,879 | 3,042,677 | 3,766,936 | -724,259 |
| FINANCIAL RESULT | -3,493,978 | -3,656,488 | 162,510 | -2,987,777 | -3,076,886 | 89,109 |
| PROFIT BEFORE EQUITY HOLDINGS | -789,837 | -267,468 | -522,369 | 54,900 | 690,050 | -635,150 |
| Equity income | 367,832 | 371,066 | -3,234 | 575,962 | 446,085 | 129,877 |
| Other income and expenses | 133,325 | 133,324 | 1 | 4,767 | 4,767 | 0 |
Earnings Release 1Q25 |
|
| OPERATING PROFIT BEFORE TAX | -288,680 | 236,922 | -525,602 | 635,629 | 1,140,902 | -505,273 |
| Current income tax and social contribution | -79,344 | -79,344 | 0 | -513,922 | -513,922 | 0 |
| Deferred income tax and social contribution | 14,407 | -21,965 | 36,372 | 208,827 | 143,722 | 65,105 |
| NET INCOME FOR CONTINUING OPERATIONS | -353,617 | 135,613 | -489,230 | 330,534 | 770,702 | -440,168 |
| 0 | 0 | |||||
| Portion attributable to controlling | -353,039 | 136,192 | -489,231 | 328,051 | 768,247 | -440,196 |
| Portion attributable to controlling | -578 | -579 | 1 | 2,483 | 2,455 | 28 |
| NET INCOME (LOSS) FOR DISCONTINUED OPERATIONS | 0 | 0 | 0 | 0 | 0 | 0 |
| Portion attributable to controlling | 0 | 0 | 0 | 0 | 986,785 | -986,785 |
| Portion attributable to controlling | 0 | 0 | 0 | 0 | 0 | 0 |
| NET INCOME FOR THE YEAR | -353,617 | 135,613 | -489,230 | 330,534 | 770,702 | -440,168 |
| Portion attributable to controlling | -353,039 | 136,192 | -489,231 | 328,051 | 768,247 | -440,196 |
| Portion attributable to controlling | -578 | -579 | 1 | 2,483 | 2,455 | 28 |
Earnings Release 1Q25 |
|

SIGNATURE
Pursuant to the requirements of the Securities Exchange Act of 1934, the registrant has duly caused this report to be signed on its behalf by the undersigned, thereunto duly authorized.
Date: May 15, 2025
| CENTRAIS ELÉTRICAS BRASILEIRAS S.A. - ELETROBRÁS | ||
| By: |
/S/ Eduardo Haiama |
|
|
Eduardo Haiama Vice-President of Finance and Investor Relations |
||
FORWARD-LOOKING STATEMENTS
This document may contain estimates and projections that are not statements of past events but reflect our management’s beliefs and expectations and may constitute forward-looking statements under Section 27A of the Securities Act of 1933, as amended, and Section 21E of the Securities and Exchange Act of 1934, as amended. The words “believes”, “may”, “can”, “estimates”, “continues”, “anticipates”, “intends”, “expects”, and similar expressions are intended to identify estimates that necessarily involve known and unknown risks and uncertainties. Known risks and uncertainties include, but are not limited to: general economic, regulatory, political, and business conditions in Brazil and abroad; fluctuations in interest rates, inflation, and the value of the Brazilian Real; changes in consumer electricity usage patterns and volumes; competitive conditions; our level of indebtedness; the possibility of receiving payments related to our receivables; changes in rainfall and water levels in reservoirs used to operate our hydroelectric plants; our financing and capital investment plans; existing and future government regulations; and other risks described in our annual report and other documents filed with the CVM and SEC. Estimates and projections refer only to the date they were expressed, and we do not assume any obligation to update any of these estimates or projections due to new information or future events. Future results of the Company’s operations and initiatives may differ from current expectations, and investors should not rely solely on the information contained herein. This material contains calculations that may not reflect precise results due to rounding.