| Maryland | 001-32268 | 11-3715772 | ||||||
| Delaware | 333-202666-01 | 20-1453863 | ||||||
| (State or other jurisdiction of incorporation) | (Commission File Number) | (IRS Employer Identification Number) | ||||||
| Title of each class | Trading Symbol | Name of each exchange on which registered | ||||||||||||
| Common Shares, $0.01 par value per share | KRG | New York Stock Exchange | ||||||||||||
| Exhibit No. | Description | |||||||
| 99.1 | ||||||||
| 99.2 | ||||||||
| 104 | Cover Page Interactive Data File (embedded within the Inline XBRL document) | |||||||
| KITE REALTY GROUP TRUST | ||||||||
| Date: February 11, 2025 | By: | /s/ HEATH R. FEAR | ||||||
| Heath R. Fear | ||||||||
| Executive Vice President and | ||||||||
| Chief Financial Officer | ||||||||
| KITE REALTY GROUP, L.P. | ||||||||
| By: Kite Realty Group Trust, its sole general partner | ||||||||
| By: | /s/ HEATH R. FEAR | |||||||
| Heath R. Fear | ||||||||
| Executive Vice President and | ||||||||
| Chief Financial Officer | ||||||||
| Exhibit 99.1 | ||||||||

| Low | High | ||||||||||
| Net income | $ | 0.45 | $ | 0.51 | |||||||
| Depreciation and amortization | 1.57 | 1.57 | |||||||||
| NAREIT FFO | $ | 2.02 | $ | 2.08 | |||||||
| Non-cash items | (0.04) | (0.04) | |||||||||
| Core FFO | $ | 1.98 | $ | 2.04 | |||||||
| December 31, 2024 |
December 31, 2023 |
||||||||||
| Assets: | |||||||||||
| Investment properties, at cost | $ | 7,634,191 | $ | 7,740,061 | |||||||
| Less: accumulated depreciation | (1,587,661) | (1,381,770) | |||||||||
| Net investment properties | 6,046,530 | 6,358,291 | |||||||||
| Cash and cash equivalents | 128,056 | 36,413 | |||||||||
|
Tenant and other receivables, including accrued straight-line rent
of $67,377 and $55,482, respectively
|
125,768 | 113,290 | |||||||||
| Restricted cash and escrow deposits | 5,271 | 5,017 | |||||||||
| Deferred costs, net | 238,213 | 304,171 | |||||||||
| Short-term deposits | 350,000 | — | |||||||||
| Prepaid and other assets | 104,627 | 117,834 | |||||||||
| Investments in unconsolidated subsidiaries | 19,511 | 9,062 | |||||||||
| Assets associated with investment property held for sale | 73,791 | — | |||||||||
| Total assets | $ | 7,091,767 | $ | 6,944,078 | |||||||
| Liabilities and Equity: | |||||||||||
| Liabilities: | |||||||||||
| Mortgage and other indebtedness, net | $ | 3,226,930 | $ | 2,829,202 | |||||||
| Accounts payable and accrued expenses | 202,651 | 198,079 | |||||||||
| Deferred revenue and other liabilities | 246,100 | 272,942 | |||||||||
| Liabilities associated with investment property held for sale | 4,009 | — | |||||||||
| Total liabilities | 3,679,690 | 3,300,223 | |||||||||
| Commitments and contingencies | |||||||||||
| Limited Partners’ interests in the Operating Partnership | 98,074 | 73,287 | |||||||||
| Equity: | |||||||||||
|
Common shares, $0.01 par value, 490,000,000 shares authorized,
219,667,067 and 219,448,429 shares issued and outstanding at
December 31, 2024 and 2023, respectively
|
2,197 | 2,194 | |||||||||
| Additional paid-in capital | 4,868,554 | 4,886,592 | |||||||||
| Accumulated other comprehensive income | 36,612 | 52,435 | |||||||||
| Accumulated deficit | (1,595,253) | (1,373,083) | |||||||||
| Total shareholders’ equity | 3,312,110 | 3,568,138 | |||||||||
| Noncontrolling interests | 1,893 | 2,430 | |||||||||
| Total equity | 3,314,003 | 3,570,568 | |||||||||
| Total liabilities and equity | $ | 7,091,767 | $ | 6,944,078 | |||||||
| Three Months Ended December 31, |
Year Ended December 31, |
||||||||||||||||||||||
| 2024 | 2023 | 2024 | 2023 | ||||||||||||||||||||
| Revenue: | |||||||||||||||||||||||
| Rental income | $ | 209,965 | $ | 197,257 | $ | 826,548 | $ | 810,146 | |||||||||||||||
| Other property-related revenue | 4,310 | 2,521 | 10,631 | 8,492 | |||||||||||||||||||
| Fee income | 441 | 498 | 4,663 | 4,366 | |||||||||||||||||||
| Total revenue | 214,716 | 200,276 | 841,842 | 823,004 | |||||||||||||||||||
| Expenses: | |||||||||||||||||||||||
| Property operating | 29,200 | 25,768 | 113,601 | 107,958 | |||||||||||||||||||
| Real estate taxes | 25,646 | 22,093 | 103,893 | 102,426 | |||||||||||||||||||
| General, administrative and other | 13,549 | 14,342 | 52,558 | 56,142 | |||||||||||||||||||
| Depreciation and amortization | 97,009 | 102,898 | 393,335 | 426,361 | |||||||||||||||||||
| Impairment charges | — | — | 66,201 | 477 | |||||||||||||||||||
| Total expenses | 165,404 | 165,101 | 729,588 | 693,364 | |||||||||||||||||||
| Gain (loss) on sales of operating properties, net | — | 133 | (864) | 22,601 | |||||||||||||||||||
| Operating income | 49,312 | 35,308 | 111,390 | 152,241 | |||||||||||||||||||
| Other (expense) income: | |||||||||||||||||||||||
| Interest expense | (32,706) | (27,235) | (125,691) | (105,349) | |||||||||||||||||||
| Income tax benefit (expense) of taxable REIT subsidiaries | 186 | (449) | (139) | (533) | |||||||||||||||||||
| Loss on extinguishment of debt | (180) | — | (180) | — | |||||||||||||||||||
| Equity in earnings (loss) of unconsolidated subsidiaries | 43 | 206 | (1,158) | 33 | |||||||||||||||||||
| Gain on sale of unconsolidated property, net | — | — | 2,325 | — | |||||||||||||||||||
| Other income, net | 5,575 | 334 | 17,869 | 1,991 | |||||||||||||||||||
| Net income | 22,230 | 8,164 | 4,416 | 48,383 | |||||||||||||||||||
| Net income attributable to noncontrolling interests | (406) | (185) | (345) | (885) | |||||||||||||||||||
| Net income attributable to common shareholders | $ | 21,824 | $ | 7,979 | $ | 4,071 | $ | 47,498 | |||||||||||||||
| Net income per common share – basic and diluted | $ | 0.10 | $ | 0.04 | $ | 0.02 | $ | 0.22 | |||||||||||||||
| Weighted average common shares outstanding – basic | 219,666,445 | 219,407,927 | 219,614,149 | 219,344,832 | |||||||||||||||||||
| Weighted average common shares outstanding – diluted | 220,314,836 | 219,795,602 | 219,727,496 | 219,728,283 | |||||||||||||||||||
| Three Months Ended December 31, |
Year Ended December 31, |
||||||||||||||||||||||
| 2024 | 2023 | 2024 | 2023 | ||||||||||||||||||||
| Net income | $ | 22,230 | $ | 8,164 | $ | 4,416 | $ | 48,383 | |||||||||||||||
| Less: net income attributable to noncontrolling interests in properties | (76) | (56) | (280) | (257) | |||||||||||||||||||
| Less/add: (gain) loss on sales of operating properties, net | — | (133) | 864 | (22,601) | |||||||||||||||||||
| Less: gain on sale of unconsolidated property, net | — | — | (2,325) | — | |||||||||||||||||||
| Add: impairment charges | — | — | 66,201 | 477 | |||||||||||||||||||
|
Add: depreciation and amortization of consolidated and unconsolidated entities,
net of noncontrolling interests
|
97,316 | 103,119 | 394,847 | 427,335 | |||||||||||||||||||
FFO of the Operating Partnership(1) |
119,470 | 111,094 | 463,723 | 453,337 | |||||||||||||||||||
Less: Limited Partners’ interests in FFO |
(2,150) | (1,708) | (7,889) | (6,447) | |||||||||||||||||||
FFO attributable to common shareholders(1) |
$ | 117,320 | $ | 109,386 | $ | 455,834 | $ | 446,890 | |||||||||||||||
| FFO, as defined by NAREIT, per share of the Operating Partnership – basic | $ | 0.53 | $ | 0.50 | $ | 2.08 | $ | 2.04 | |||||||||||||||
| FFO, as defined by NAREIT, per share of the Operating Partnership – diluted | $ | 0.53 | $ | 0.50 | $ | 2.07 | $ | 2.03 | |||||||||||||||
| Weighted average common shares outstanding – basic | 219,666,445 | 219,407,927 | 219,614,149 | 219,344,832 | |||||||||||||||||||
| Weighted average common shares outstanding – diluted | 219,791,253 | 219,795,602 | 219,727,496 | 219,728,283 | |||||||||||||||||||
| Weighted average common shares and units outstanding – basic | 223,694,733 | 222,827,090 | 223,416,919 | 222,514,956 | |||||||||||||||||||
| Weighted average common shares and units outstanding – diluted | 223,819,541 | 223,214,765 | 223,530,266 | 222,898,407 | |||||||||||||||||||
| Reconciliation of NAREIT FFO to Core FFO | |||||||||||||||||||||||
FFO of the Operating Partnership(1) |
$ | 119,470 | $ | 111,094 | $ | 463,723 | $ | 453,337 | |||||||||||||||
| Add: | |||||||||||||||||||||||
| Amortization of deferred financing costs | 1,672 | 924 | 4,650 | 3,609 | |||||||||||||||||||
| Non-cash compensation expense and other | 2,832 | 2,589 | 11,276 | 11,063 | |||||||||||||||||||
| Less: | |||||||||||||||||||||||
| Straight-line rent – minimum rent and common area maintenance | 2,023 | 2,087 | 12,085 | 11,820 | |||||||||||||||||||
| Market rent amortization income | 3,160 | 2,798 | 10,082 | 12,117 | |||||||||||||||||||
| Amortization of debt discounts, premiums and hedge instruments | 3,011 | 4,511 | 13,592 | 19,503 | |||||||||||||||||||
| Core FFO of the Operating Partnership | $ | 115,780 | $ | 105,211 | $ | 443,890 | $ | 424,569 | |||||||||||||||
| Core FFO per share of the Operating Partnership – diluted | $ | 0.52 | $ | 0.47 | $ | 1.99 | $ | 1.90 | |||||||||||||||
| Three Months Ended December 31, | Year Ended December 31, | ||||||||||||||||||||||||||||||||||
| 2024 | 2023 | Change | 2024 | 2023 | Change | ||||||||||||||||||||||||||||||
Number of properties in Same Property Pool for the period(1) |
177 | 177 | 177 | 177 | |||||||||||||||||||||||||||||||
| Leased percentage at period end | 95.0 | % | 94.2 | % | 95.0 | % | 94.2 | % | |||||||||||||||||||||||||||
| Economic occupancy percentage at period end | 92.5 | % | 91.3 | % | 92.5 | % | 91.3 | % | |||||||||||||||||||||||||||
Economic occupancy percentage(2) |
92.4 | % | 91.2 | % | 91.6 | % | 92.0 | % | |||||||||||||||||||||||||||
| Minimum rent | $ | 154,433 | $ | 148,183 | $ | 604,778 | $ | 588,497 | |||||||||||||||||||||||||||
| Tenant recoveries | 42,552 | 36,695 | 166,902 | 157,236 | |||||||||||||||||||||||||||||||
| Bad debt reserve | (1,547) | (1,658) | (5,246) | (4,178) | |||||||||||||||||||||||||||||||
| Other income, net | 3,743 | 3,664 | 10,913 | 11,083 | |||||||||||||||||||||||||||||||
| Total revenue | 199,181 | 186,884 | 777,347 | 752,638 | |||||||||||||||||||||||||||||||
| Property operating | (25,408) | (23,205) | (98,900) | (93,347) | |||||||||||||||||||||||||||||||
| Real estate taxes | (24,763) | (21,561) | (99,624) | (97,500) | |||||||||||||||||||||||||||||||
| Total expenses | (50,171) | (44,766) | (198,524) | (190,847) | |||||||||||||||||||||||||||||||
| Same Property NOI | $ | 149,010 | $ | 142,118 | 4.8 | % | $ | 578,823 | $ | 561,791 | 3.0 | % | |||||||||||||||||||||||
|
Reconciliation of Same Property NOI to most
directly comparable GAAP measure:
|
|||||||||||||||||||||||||||||||||||
| Net operating income – same properties | $ | 149,010 | $ | 142,118 | $ | 578,823 | $ | 561,791 | |||||||||||||||||||||||||||
Net operating income – non-same activity(3) |
10,419 | 9,799 | 40,862 | 46,463 | |||||||||||||||||||||||||||||||
| Total property NOI | 159,429 | 151,917 | 4.9 | % | 619,685 | 608,254 | 1.9 | % | |||||||||||||||||||||||||||
| Other income, net | 6,245 | 589 | 21,235 | 5,857 | |||||||||||||||||||||||||||||||
| General, administrative and other | (13,549) | (14,342) | (52,558) | (56,142) | |||||||||||||||||||||||||||||||
| Loss on extinguishment of debt | (180) | — | (180) | — | |||||||||||||||||||||||||||||||
| Impairment charges | — | — | (66,201) | (477) | |||||||||||||||||||||||||||||||
| Depreciation and amortization | (97,009) | (102,898) | (393,335) | (426,361) | |||||||||||||||||||||||||||||||
| Interest expense | (32,706) | (27,235) | (125,691) | (105,349) | |||||||||||||||||||||||||||||||
| Gain (loss) on sales of operating properties, net | — | 133 | (864) | 22,601 | |||||||||||||||||||||||||||||||
| Gain on sale of unconsolidated property, net | — | — | 2,325 | — | |||||||||||||||||||||||||||||||
|
Net income attributable to noncontrolling
interests
|
(406) | (185) | (345) | (885) | |||||||||||||||||||||||||||||||
| Net income attributable to common shareholders | $ | 21,824 | $ | 7,979 | $ | 4,071 | $ | 47,498 | |||||||||||||||||||||||||||
| Three Months Ended December 31, 2024 |
|||||
| Net income | $ | 22,230 | |||
| Depreciation and amortization | 97,009 | ||||
| Interest expense | 32,706 | ||||
| Income tax benefit of taxable REIT subsidiaries | (186) | ||||
| EBITDA | 151,759 | ||||
| Unconsolidated EBITDA, as adjusted | 1,134 | ||||
| Loss on extinguishment of debt | 180 | ||||
| Other income and expense, net | (5,618) | ||||
| Noncontrolling interests | (210) | ||||
| Adjusted EBITDA | $ | 147,245 | |||
Annualized Adjusted EBITDA(1) |
$ | 588,980 | |||
| Company share of Net Debt: | |||||
| Mortgage and other indebtedness, net | $ | 3,226,930 | |||
| Add: Company share of unconsolidated joint venture debt | 44,569 | ||||
| Add: debt discounts, premiums and issuance costs, net | 1,255 | ||||
Less: Partner share of consolidated joint venture debt(2) |
(9,801) | ||||
| Company’s consolidated debt and share of unconsolidated debt | 3,262,953 | ||||
| Less: cash, cash equivalents, restricted cash and short-term deposits | (485,280) | ||||
| Company share of Net Debt | $ | 2,777,673 | |||
| Net Debt to Adjusted EBITDA | 4.7x | ||||
| Exhibit 99.2 | ||||||||
| Earnings Press Release | |||||
| Contact Information | |||||
| Results Overview | |||||
| Consolidated Balance Sheets | |||||
| Consolidated Statements of Operations | |||||
| Same Property Net Operating Income | |||||
| Net Operating Income and Adjusted EBITDA by Quarter | |||||
| Funds From Operations | |||||
| Joint Venture Summary | |||||
| Key Debt Metrics | |||||
| Summary of Outstanding Debt | |||||
| Maturity Schedule of Outstanding Debt | |||||
| Acquisitions and Dispositions | |||||
| Development and Redevelopment Projects | |||||
| Geographic Diversification – Retail ABR by Region and State | |||||
| Top 25 Tenants by ABR | |||||
| Retail Leasing Spreads | |||||
| Lease Expirations | |||||
| Components of Net Asset Value | |||||
| Non-GAAP Financial Measures | |||||

i |
|||||
ii |
|||||
| Low | High | ||||||||||
| Net income | $ | 0.45 | $ | 0.51 | |||||||
| Depreciation and amortization | 1.57 | 1.57 | |||||||||
| NAREIT FFO | $ | 2.02 | $ | 2.08 | |||||||
| Non-cash items | (0.04) | (0.04) | |||||||||
| Core FFO | $ | 1.98 | $ | 2.04 | |||||||
iii |
|||||
iv |
|||||
| Investor Relations Contact | Analyst Coverage | Analyst Coverage | ||||||||||||
| Tyler Henshaw | Robert W. Baird & Co. | Jefferies LLC | ||||||||||||
| Senior Vice President, Capital Markets and IR | Mr. Wes Golladay | Ms. Linda Tsai | ||||||||||||
| (317) 713-7780 | (216) 737-7510 | (212) 778-8011 | ||||||||||||
| thenshaw@kiterealty.com | wgolladay@rwbaird.com | ltsai@jefferies.com | ||||||||||||
| Matt Hunt | Bank of America/Merrill Lynch | J.P. Morgan | ||||||||||||
| Director, Capital Markets and IR | Mr. Jeffrey Spector | Mr. Michael W. Mueller/Mr. Hongliang Zhang | ||||||||||||
| (317) 713-7646 | (646) 855-1363 | (212) 622-6689/(212) 622-6416 | ||||||||||||
| mhunt@kiterealty.com | jeff.spector@bofa.com | michael.w.mueller@jpmorgan.com/ | ||||||||||||
| hongliang.zhang@jpmorgan.com | ||||||||||||||
| Transfer Agent | BTIG | KeyBanc Capital Markets | ||||||||||||
| Broadridge Financial Solutions | Mr. Michael Gorman | Mr. Todd Thomas | ||||||||||||
| Ms. Kristen Tartaglione | (212) 738-6138 | (917) 368-2286 | ||||||||||||
| 2 Journal Square, 7th Floor | mgorman@btig.com | tthomas@keybanccm.com | ||||||||||||
| Jersey City, NJ 07306 | ||||||||||||||
| (201) 714-8094 | Citigroup Global Markets | Piper Sandler | ||||||||||||
| Mr. Craig Mailman | Mr. Alexander Goldfarb | |||||||||||||
| (212) 816-4471 | (212) 466-7937 | |||||||||||||
| craig.mailman@citi.com | alexander.goldfarb@psc.com | |||||||||||||
| Stock Specialist | ||||||||||||||
| GTS | Compass Point Research & Trading, LLC | Raymond James | ||||||||||||
| 545 Madison Avenue, 15th Floor | Mr. Floris van Dijkum | Mr. RJ Milligan | ||||||||||||
| New York, NY 10022 | (646) 757-2621 | (727) 567-2585 | ||||||||||||
| (212) 715-2830 | fvandijkum@compasspointllc.com | rjmilligan@raymondjames.com | ||||||||||||
| Green Street | Wells Fargo | |||||||||||||
| Ms. Paulina Rojas Schmidt | Mr. James Feldman/Ms. Dori Kesten | |||||||||||||
| (949) 640-8780 | (212) 215-5328/(617) 603-4233 | |||||||||||||
| projasschmidt@greenstreet.com | james.feldman@wellsfargo.com/ | |||||||||||||
| dori.kesten@wellsfargo.com | ||||||||||||||
| 4th Quarter 2024 Supplemental Financial and Operating Statistics | 1 |
||||
| Three Months Ended December 31, | Year Ended December 31, | ||||||||||||||||||||||
| Summary Financial Results | 2024 | 2023 | 2024 | 2023 | |||||||||||||||||||
| Total revenue (page 4) | $ | 214,716 | $ | 200,276 | $ | 841,842 | $ | 823,004 | |||||||||||||||
| Net income attributable to common shareholders (page 4) | $ | 21,824 | $ | 7,979 | $ | 4,071 | $ | 47,498 | |||||||||||||||
| Net income per diluted share (page 4) | $ | 0.10 | $ | 0.04 | $ | 0.02 | $ | 0.22 | |||||||||||||||
| Net operating income (NOI) (page 6) | $ | 159,429 | $ | 151,917 | $ | 619,685 | $ | 608,254 | |||||||||||||||
| Adjusted EBITDA (page 6) | $ | 146,321 | $ | 138,073 | $ | 571,790 | $ | 556,478 | |||||||||||||||
| NAREIT Funds From Operations (FFO) (page 7) | $ | 119,470 | $ | 111,094 | $ | 463,723 | $ | 453,337 | |||||||||||||||
| NAREIT FFO per diluted share (page 7) | $ | 0.53 | $ | 0.50 | $ | 2.07 | $ | 2.03 | |||||||||||||||
| Core FFO (page 7) | $ | 115,780 | $ | 105,211 | $ | 443,890 | $ | 424,569 | |||||||||||||||
| Core FFO per diluted share (page 7) | $ | 0.52 | $ | 0.47 | $ | 1.99 | $ | 1.90 | |||||||||||||||
| Dividend payout ratio (as % of NAREIT FFO) | 49 | % | 48 | % | 49 | % | 47 | % | |||||||||||||||
| Three Months Ended | |||||||||||||||||||||||||||||
| Summary Operating and Financial Ratios | December 31, 2024 |
September 30, 2024 |
June 30, 2024 |
March 31, 2024 |
December 31, 2023 |
||||||||||||||||||||||||
| NOI margin (page 6) | 74.6 | % | 74.5 | % | 73.8 | % | 73.8 | % | 76.2 | % | |||||||||||||||||||
| NOI margin – retail (page 6) | 75.1 | % | 75.2 | % | 74.3 | % | 74.4 | % | 76.5 | % | |||||||||||||||||||
| Same Property NOI performance (page 5) | 4.8 | % | 3.0 | % | 1.8 | % | 1.8 | % | 2.8 | % | |||||||||||||||||||
| Total property NOI performance (page 5) | 4.9 | % | 1.2 | % | 0.1 | % | 1.3 | % | 2.0 | % | |||||||||||||||||||
| Net debt to Adjusted EBITDA, current quarter (page 9) | 4.7x | 4.9x | 4.8x | 5.1x | 5.1x | ||||||||||||||||||||||||
| Recovery ratio of retail operating properties (page 6) | 92.1 | % | 91.2 | % | 91.6 | % | 91.6 | % | 92.2 | % | |||||||||||||||||||
| Recovery ratio of consolidated portfolio (page 6) | 87.4 | % | 86.6 | % | 87.8 | % | 86.9 | % | 87.4 | % | |||||||||||||||||||
| Outstanding Classes of Stock | |||||||||||||||||||||||||||||
| Common shares and units outstanding (page 18) | 223,859,664 | 223,626,166 | 223,361,957 | 223,310,866 | 222,961,297 | ||||||||||||||||||||||||
| Summary Portfolio Statistics | |||||||||||||||||||||||||||||
| Number of properties | |||||||||||||||||||||||||||||
Operating retail (page 14)(1) |
179 | 179 | 178 | 180 | 180 | ||||||||||||||||||||||||
| Office and other components | 12 | 11 | 11 | 11 | 11 | ||||||||||||||||||||||||
| Development and redevelopment projects (page 13) | 2 | 3 | 2 | 2 | 2 | ||||||||||||||||||||||||
Owned retail operating gross leasable area (GLA)(2) (page 14) |
27.7 | M | 27.7 | M | 27.6 | M | 28.1 | M | 28.1 | M | |||||||||||||||||||
| Owned office GLA | 1.5 | M | 1.4 | M | 1.4 | M | 1.4 | M | 1.4 | M | |||||||||||||||||||
Number of multifamily units(3)(4) |
1,405 | 1,405 | 1,405 | 1,405 | 1,672 | ||||||||||||||||||||||||
| Percent leased – total | 94.2 | % | 94.6 | % | 94.3 | % | 93.8 | % | 93.7 | % | |||||||||||||||||||
| Percent leased – retail | 95.0 | % | 95.0 | % | 94.8 | % | 94.0 | % | 93.9 | % | |||||||||||||||||||
| Anchor | 97.1 | % | 97.0 | % | 96.8 | % | 95.9 | % | 95.5 | % | |||||||||||||||||||
| Small shop | 91.2 | % | 91.2 | % | 90.8 | % | 90.5 | % | 90.8 | % | |||||||||||||||||||
| Annualized base rent (ABR) per square foot | $ | 21.15 | $ | 21.01 | $ | 20.90 | $ | 20.84 | $ | 20.70 | |||||||||||||||||||
| Total new and renewal lease GLA (page 16) | 1,214,390 | 1,651,986 | 1,153,766 | 968,681 | 1,290,090 | ||||||||||||||||||||||||
| New lease cash rent spread (page 16) | 23.6 | % | 24.9 | % | 34.8 | % | 48.1 | % | 43.0 | % | |||||||||||||||||||
| Non-option renewal lease cash rent spread (page 16) | 14.4 | % | 11.9 | % | 14.3 | % | 12.2 | % | 9.2 | % | |||||||||||||||||||
| Option renewal lease cash rent spread (page 16) | 6.8 | % | 7.7 | % | 6.0 | % | 5.3 | % | 7.6 | % | |||||||||||||||||||
| Total new and renewal lease cash rent spread (page 16) | 12.5 | % | 11.1 | % | 15.6 | % | 12.8 | % | 14.5 | % | |||||||||||||||||||
| 2025 Guidance | Current (as of 2/11/25) |
||||
| NAREIT FFO per diluted share | $2.02 to $2.08 | ||||
| Core FFO per diluted share | $1.98 to $2.04 | ||||
| 4th Quarter 2024 Supplemental Financial and Operating Statistics | 2 |
||||
| December 31, 2024 |
December 31, 2023 |
||||||||||
| Assets: | |||||||||||
| Investment properties, at cost | $ | 7,634,191 | $ | 7,740,061 | |||||||
| Less: accumulated depreciation | (1,587,661) | (1,381,770) | |||||||||
| Net investment properties | 6,046,530 | 6,358,291 | |||||||||
| Cash and cash equivalents | 128,056 | 36,413 | |||||||||
|
Tenant and other receivables, including accrued straight-line rent
of $67,377 and $55,482, respectively
|
125,768 | 113,290 | |||||||||
| Restricted cash and escrow deposits | 5,271 | 5,017 | |||||||||
| Deferred costs, net | 238,213 | 304,171 | |||||||||
| Short-term deposits | 350,000 | — | |||||||||
| Prepaid and other assets | 104,627 | 117,834 | |||||||||
| Investments in unconsolidated subsidiaries | 19,511 | 9,062 | |||||||||
| Assets associated with investment property held for sale | 73,791 | — | |||||||||
| Total assets | $ | 7,091,767 | $ | 6,944,078 | |||||||
| Liabilities and Equity: | |||||||||||
| Liabilities: | |||||||||||
| Mortgage and other indebtedness, net | $ | 3,226,930 | $ | 2,829,202 | |||||||
| Accounts payable and accrued expenses | 202,651 | 198,079 | |||||||||
| Deferred revenue and other liabilities | 246,100 | 272,942 | |||||||||
| Liabilities associated with investment property held for sale | 4,009 | — | |||||||||
| Total liabilities | 3,679,690 | 3,300,223 | |||||||||
| Commitments and contingencies | |||||||||||
Limited Partners’ interests in the Operating Partnership |
98,074 | 73,287 | |||||||||
| Equity: | |||||||||||
|
Common shares, $0.01 par value, 490,000,000 shares authorized,
219,667,067 and 219,448,429 shares issued and outstanding at
December 31, 2024 and 2023, respectively
|
2,197 | 2,194 | |||||||||
| Additional paid-in capital | 4,868,554 | 4,886,592 | |||||||||
| Accumulated other comprehensive income | 36,612 | 52,435 | |||||||||
| Accumulated deficit | (1,595,253) | (1,373,083) | |||||||||
| Total shareholders’ equity | 3,312,110 | 3,568,138 | |||||||||
| Noncontrolling interests | 1,893 | 2,430 | |||||||||
| Total equity | 3,314,003 | 3,570,568 | |||||||||
| Total liabilities and equity | $ | 7,091,767 | $ | 6,944,078 | |||||||
| 4th Quarter 2024 Supplemental Financial and Operating Statistics | 3 |
||||
| Three Months Ended December 31, |
Year Ended December 31, |
||||||||||||||||||||||
| 2024 | 2023 | 2024 | 2023 | ||||||||||||||||||||
| Revenue: | |||||||||||||||||||||||
| Rental income | $ | 209,965 | $ | 197,257 | $ | 826,548 | $ | 810,146 | |||||||||||||||
| Other property-related revenue | 4,310 | 2,521 | 10,631 | 8,492 | |||||||||||||||||||
| Fee income | 441 | 498 | 4,663 | 4,366 | |||||||||||||||||||
| Total revenue | 214,716 | 200,276 | 841,842 | 823,004 | |||||||||||||||||||
| Expenses: | |||||||||||||||||||||||
| Property operating | 29,200 | 25,768 | 113,601 | 107,958 | |||||||||||||||||||
| Real estate taxes | 25,646 | 22,093 | 103,893 | 102,426 | |||||||||||||||||||
| General, administrative and other | 13,549 | 14,342 | 52,558 | 56,142 | |||||||||||||||||||
| Depreciation and amortization | 97,009 | 102,898 | 393,335 | 426,361 | |||||||||||||||||||
| Impairment charges | — | — | 66,201 | 477 | |||||||||||||||||||
| Total expenses | 165,404 | 165,101 | 729,588 | 693,364 | |||||||||||||||||||
| Gain (loss) on sales of operating properties, net | — | 133 | (864) | 22,601 | |||||||||||||||||||
| Operating income | 49,312 | 35,308 | 111,390 | 152,241 | |||||||||||||||||||
| Other (expense) income: | |||||||||||||||||||||||
| Interest expense | (32,706) | (27,235) | (125,691) | (105,349) | |||||||||||||||||||
| Income tax benefit (expense) of taxable REIT subsidiaries | 186 | (449) | (139) | (533) | |||||||||||||||||||
| Loss on extinguishment of debt | (180) | — | (180) | — | |||||||||||||||||||
| Equity in earnings (loss) of unconsolidated subsidiaries | 43 | 206 | (1,158) | 33 | |||||||||||||||||||
| Gain on sale of unconsolidated property, net | — | — | 2,325 | — | |||||||||||||||||||
| Other income, net | 5,575 | 334 | 17,869 | 1,991 | |||||||||||||||||||
| Net income | 22,230 | 8,164 | 4,416 | 48,383 | |||||||||||||||||||
| Net income attributable to noncontrolling interests | (406) | (185) | (345) | (885) | |||||||||||||||||||
| Net income attributable to common shareholders | $ | 21,824 | $ | 7,979 | $ | 4,071 | $ | 47,498 | |||||||||||||||
| Net income per common share – basic and diluted | $ | 0.10 | $ | 0.04 | $ | 0.02 | $ | 0.22 | |||||||||||||||
| Weighted average common shares outstanding – basic | 219,666,445 | 219,407,927 | 219,614,149 | 219,344,832 | |||||||||||||||||||
| Weighted average common shares outstanding – diluted | 220,314,836 | 219,795,602 | 219,727,496 | 219,728,283 | |||||||||||||||||||
| 4th Quarter 2024 Supplemental Financial and Operating Statistics | 4 |
||||
| Three Months Ended December 31, | Year Ended December 31, | ||||||||||||||||||||||||||||||||||
| 2024 | 2023 | Change | 2024 | 2023 | Change | ||||||||||||||||||||||||||||||
Number of properties in Same Property Pool for the period(1) |
177 | 177 | 177 | 177 | |||||||||||||||||||||||||||||||
| Leased percentage at period end | 95.0 | % | 94.2 | % | 95.0 | % | 94.2 | % | |||||||||||||||||||||||||||
| Economic occupancy percentage at period end | 92.5 | % | 91.3 | % | 92.5 | % | 91.3 | % | |||||||||||||||||||||||||||
Economic occupancy percentage(2) |
92.4 | % | 91.2 | % | 91.6 | % | 92.0 | % | |||||||||||||||||||||||||||
| Minimum rent | $ | 154,433 | $ | 148,183 | $ | 604,778 | $ | 588,497 | |||||||||||||||||||||||||||
| Tenant recoveries | 42,552 | 36,695 | 166,902 | 157,236 | |||||||||||||||||||||||||||||||
| Bad debt reserve | (1,547) | (1,658) | (5,246) | (4,178) | |||||||||||||||||||||||||||||||
| Other income, net | 3,743 | 3,664 | 10,913 | 11,083 | |||||||||||||||||||||||||||||||
| Total revenue | 199,181 | 186,884 | 777,347 | 752,638 | |||||||||||||||||||||||||||||||
| Property operating | (25,408) | (23,205) | (98,900) | (93,347) | |||||||||||||||||||||||||||||||
| Real estate taxes | (24,763) | (21,561) | (99,624) | (97,500) | |||||||||||||||||||||||||||||||
| Total expenses | (50,171) | (44,766) | (198,524) | (190,847) | |||||||||||||||||||||||||||||||
| Same Property NOI | $ | 149,010 | $ | 142,118 | 4.8 | % | $ | 578,823 | $ | 561,791 | 3.0 | % | |||||||||||||||||||||||
|
Reconciliation of Same Property NOI to most
directly comparable GAAP measure:
|
|||||||||||||||||||||||||||||||||||
| Net operating income – same properties | $ | 149,010 | $ | 142,118 | $ | 578,823 | $ | 561,791 | |||||||||||||||||||||||||||
Net operating income – non-same activity(3) |
10,419 | 9,799 | 40,862 | 46,463 | |||||||||||||||||||||||||||||||
| Total property NOI | 159,429 | 151,917 | 4.9 | % | 619,685 | 608,254 | 1.9 | % | |||||||||||||||||||||||||||
| Other income, net | 6,245 | 589 | 21,235 | 5,857 | |||||||||||||||||||||||||||||||
| General, administrative and other | (13,549) | (14,342) | (52,558) | (56,142) | |||||||||||||||||||||||||||||||
| Loss on extinguishment of debt | (180) | — | (180) | — | |||||||||||||||||||||||||||||||
| Impairment charges | — | — | (66,201) | (477) | |||||||||||||||||||||||||||||||
| Depreciation and amortization | (97,009) | (102,898) | (393,335) | (426,361) | |||||||||||||||||||||||||||||||
| Interest expense | (32,706) | (27,235) | (125,691) | (105,349) | |||||||||||||||||||||||||||||||
| Gain (loss) on sales of operating properties, net | — | 133 | (864) | 22,601 | |||||||||||||||||||||||||||||||
| Gain on sale of unconsolidated property, net | — | — | 2,325 | — | |||||||||||||||||||||||||||||||
|
Net income attributable to noncontrolling
interests
|
(406) | (185) | (345) | (885) | |||||||||||||||||||||||||||||||
| Net income attributable to common shareholders | $ | 21,824 | $ | 7,979 | $ | 4,071 | $ | 47,498 | |||||||||||||||||||||||||||
| 4th Quarter 2024 Supplemental Financial and Operating Statistics | 5 |
||||
| Three Months Ended | |||||||||||||||||||||||||||||
| December 31, 2024 |
September 30, 2024 |
June 30, 2024 |
March 31, 2024 |
December 31, 2023 |
|||||||||||||||||||||||||
| Revenue: | |||||||||||||||||||||||||||||
Minimum rent(1) |
$ | 154,233 | $ | 151,937 | $ | 151,116 | $ | 150,598 | $ | 147,773 | |||||||||||||||||||
| Minimum rent – ground leases | 10,750 | 10,758 | 10,492 | 10,447 | 10,482 | ||||||||||||||||||||||||
| Tenant reimbursements | 44,058 | 42,453 | 44,422 | 43,577 | 37,693 | ||||||||||||||||||||||||
| Bad debt reserve | (1,755) | (1,468) | (1,544) | (589) | (1,452) | ||||||||||||||||||||||||
Other property-related revenue(2) |
3,843 | 1,402 | 2,701 | 841 | 2,107 | ||||||||||||||||||||||||
| Overage rent | 2,680 | 1,253 | 1,350 | 1,780 | 2,761 | ||||||||||||||||||||||||
| Total revenue | 213,809 | 206,335 | 208,537 | 206,654 | 199,364 | ||||||||||||||||||||||||
| Expenses: | |||||||||||||||||||||||||||||
Property operating – recoverable(3) |
24,913 | 23,961 | 24,257 | 23,763 | 21,218 | ||||||||||||||||||||||||
Property operating – non-recoverable(3) |
3,972 | 3,469 | 4,005 | 4,009 | 4,297 | ||||||||||||||||||||||||
| Real estate taxes | 25,495 | 25,083 | 26,350 | 26,373 | 21,932 | ||||||||||||||||||||||||
| Total expenses | 54,380 | 52,513 | 54,612 | 54,145 | 47,447 | ||||||||||||||||||||||||
| NOI | 159,429 | 153,822 | 153,925 | 152,509 | 151,917 | ||||||||||||||||||||||||
| Other (expense) income: | |||||||||||||||||||||||||||||
| General, administrative and other | (13,549) | (13,259) | (12,966) | (12,784) | (14,342) | ||||||||||||||||||||||||
| Fee income | 441 | 455 | 3,452 | 315 | 498 | ||||||||||||||||||||||||
| Total other (expense) income | (13,108) | (12,804) | (9,514) | (12,469) | (13,844) | ||||||||||||||||||||||||
| Adjusted EBITDA | 146,321 | 141,018 | 144,411 | 140,040 | 138,073 | ||||||||||||||||||||||||
| Impairment charges | — | — | (66,201) | — | — | ||||||||||||||||||||||||
| Depreciation and amortization | (97,009) | (96,656) | (99,291) | (100,379) | (102,898) | ||||||||||||||||||||||||
| Interest expense | (32,706) | (31,640) | (30,981) | (30,364) | (27,235) | ||||||||||||||||||||||||
| Equity in earnings (loss) of unconsolidated subsidiaries | 43 | (607) | (174) | (420) | 206 | ||||||||||||||||||||||||
| Gain on sale of unconsolidated property, net | — | — | — | 2,325 | — | ||||||||||||||||||||||||
| Income tax benefit (expense) of taxable REIT subsidiaries | 186 | (35) | (132) | (158) | (449) | ||||||||||||||||||||||||
| Loss on extinguishment of debt | (180) | — | — | — | — | ||||||||||||||||||||||||
| Interest income | 5,453 | 4,333 | 4,364 | 3,739 | 508 | ||||||||||||||||||||||||
| Other income (expense), net | 122 | 38 | (69) | (111) | (174) | ||||||||||||||||||||||||
| Gain (loss) on sales of operating properties, net | — | 602 | (1,230) | (236) | 133 | ||||||||||||||||||||||||
| Net income (loss) | 22,230 | 17,053 | (49,303) | 14,436 | 8,164 | ||||||||||||||||||||||||
Net (income) loss attributable to noncontrolling interests |
(406) | (324) | 665 | (280) | (185) | ||||||||||||||||||||||||
| Net income (loss) attributable to common shareholders | $ | 21,824 | $ | 16,729 | $ | (48,638) | $ | 14,156 | $ | 7,979 | |||||||||||||||||||
| NOI/Revenue – Retail properties | 75.1 | % | 75.2 | % | 74.3 | % | 74.4 | % | 76.5 | % | |||||||||||||||||||
| NOI/Revenue | 74.6 | % | 74.5 | % | 73.8 | % | 73.8 | % | 76.2 | % | |||||||||||||||||||
Recovery Ratios(4) |
|||||||||||||||||||||||||||||
| – Retail properties | 92.1 | % | 91.2 | % | 91.6 | % | 91.6 | % | 92.2 | % | |||||||||||||||||||
| – Consolidated | 87.4 | % | 86.6 | % | 87.8 | % | 86.9 | % | 87.4 | % | |||||||||||||||||||
| 4th Quarter 2024 Supplemental Financial and Operating Statistics | 6 |
||||
| Three Months Ended December 31, |
Year Ended December 31, |
||||||||||||||||||||||
| 2024 | 2023 | 2024 | 2023 | ||||||||||||||||||||
| Net income | $ | 22,230 | $ | 8,164 | $ | 4,416 | $ | 48,383 | |||||||||||||||
| Less: net income attributable to noncontrolling interests in properties | (76) | (56) | (280) | (257) | |||||||||||||||||||
| Less/add: (gain) loss on sales of operating properties, net | — | (133) | 864 | (22,601) | |||||||||||||||||||
| Less: gain on sale of unconsolidated property, net | — | — | (2,325) | — | |||||||||||||||||||
| Add: impairment charges | — | — | 66,201 | 477 | |||||||||||||||||||
|
Add: depreciation and amortization of consolidated and unconsolidated entities,
net of noncontrolling interests
|
97,316 | 103,119 | 394,847 | 427,335 | |||||||||||||||||||
FFO of the Operating Partnership(1) |
119,470 | 111,094 | 463,723 | 453,337 | |||||||||||||||||||
Less: Limited Partners’ interests in FFO |
(2,150) | (1,708) | (7,889) | (6,447) | |||||||||||||||||||
FFO attributable to common shareholders(1) |
$ | 117,320 | $ | 109,386 | $ | 455,834 | $ | 446,890 | |||||||||||||||
| FFO, as defined by NAREIT, per share of the Operating Partnership – basic | $ | 0.53 | $ | 0.50 | $ | 2.08 | $ | 2.04 | |||||||||||||||
| FFO, as defined by NAREIT, per share of the Operating Partnership – diluted | $ | 0.53 | $ | 0.50 | $ | 2.07 | $ | 2.03 | |||||||||||||||
| Weighted average common shares outstanding – basic | 219,666,445 | 219,407,927 | 219,614,149 | 219,344,832 | |||||||||||||||||||
| Weighted average common shares outstanding – diluted | 219,791,253 | 219,795,602 | 219,727,496 | 219,728,283 | |||||||||||||||||||
| Weighted average common shares and units outstanding – basic | 223,694,733 | 222,827,090 | 223,416,919 | 222,514,956 | |||||||||||||||||||
| Weighted average common shares and units outstanding – diluted | 223,819,541 | 223,214,765 | 223,530,266 | 222,898,407 | |||||||||||||||||||
| Reconciliation of NAREIT FFO to Core FFO | |||||||||||||||||||||||
FFO of the Operating Partnership(1) |
$ | 119,470 | $ | 111,094 | $ | 463,723 | $ | 453,337 | |||||||||||||||
| Add: | |||||||||||||||||||||||
| Amortization of deferred financing costs | 1,672 | 924 | 4,650 | 3,609 | |||||||||||||||||||
| Non-cash compensation expense and other | 2,832 | 2,589 | 11,276 | 11,063 | |||||||||||||||||||
| Less: | |||||||||||||||||||||||
| Straight-line rent – minimum rent and common area maintenance | 2,023 | 2,087 | 12,085 | 11,820 | |||||||||||||||||||
| Market rent amortization income | 3,160 | 2,798 | 10,082 | 12,117 | |||||||||||||||||||
| Amortization of debt discounts, premiums and hedge instruments | 3,011 | 4,511 | 13,592 | 19,503 | |||||||||||||||||||
| Core FFO of the Operating Partnership | $ | 115,780 | $ | 105,211 | $ | 443,890 | $ | 424,569 | |||||||||||||||
| Core FFO per share of the Operating Partnership – diluted | $ | 0.52 | $ | 0.47 | $ | 1.99 | $ | 1.90 | |||||||||||||||
| Reconciliation of Core FFO to Adjusted Funds From Operations (“AFFO”) | |||||||||||||||||||||||
| Core FFO of the Operating Partnership | $ | 115,780 | $ | 105,211 | $ | 443,890 | $ | 424,569 | |||||||||||||||
| Less: | |||||||||||||||||||||||
| Maintenance capital expenditures | 7,004 | 13,514 | 25,754 | 26,869 | |||||||||||||||||||
Tenant-related capital expenditures(2) |
17,204 | 26,875 | 90,938 | 92,274 | |||||||||||||||||||
| Total Recurring AFFO of the Operating Partnership | $ | 91,572 | $ | 64,822 | $ | 327,198 | $ | 305,426 | |||||||||||||||
| 4th Quarter 2024 Supplemental Financial and Operating Statistics | 7 |
||||
| Consolidated Investments | ||||||||||||||||||||||||||
| Investments | Total Debt |
Partner Economic
Ownership Interest(1)
|
Partner Share of Debt |
Partner Share of Annual EBITDA |
||||||||||||||||||||||
| Delray Marketplace | $ | 14,600 | 2 | % | $ | 292 | $ | — | ||||||||||||||||||
| One Loudoun – Pads G&H Residential | 95,095 | 10 | % | 9,509 | 840 | |||||||||||||||||||||
| Total | $ | 109,695 | $ | 9,801 | $ | 840 | ||||||||||||||||||||
| Unconsolidated Investments | ||||||||||||||||||||||||||||||||||||||||||||||||||
| Investments | Retail GLA | Multifamily Units |
Total Debt | KRG Economic Ownership Interest |
KRG Share of Debt |
KRG Investment |
KRG Share of Quarterly Adjusted EBITDA |
KRG Share of Quarterly Adjusted EBITDA Annualized |
||||||||||||||||||||||||||||||||||||||||||
|
Three Property Retail
Portfolio
|
415,966 | — | $ | 51,890 | 20 | % | $ | 10,378 | $ | 5,951 | $ | 321 | $ | 1,284 | ||||||||||||||||||||||||||||||||||||
|
Glendale Center
Apartments(2)
|
— | — | — | 11.5 | % | — | 536 | — | — | |||||||||||||||||||||||||||||||||||||||||
|
Embassy Suites at Eddy
Street Commons(3)
|
— | — | — | 35 | % | — | 9,514 | 634 | 2,536 | |||||||||||||||||||||||||||||||||||||||||
| The Corner (development) | 24,000 | 285 | 68,382 | 50 | % | 34,191 | 1,010 | 145 | 580 | |||||||||||||||||||||||||||||||||||||||||
| Other investments | — | — | — | — | % | — | 2,500 | 34 | 136 | |||||||||||||||||||||||||||||||||||||||||
| Total | 439,966 | 285 | $ | 120,272 | $ | 44,569 | $ | 19,511 | $ | 1,134 | $ | 4,536 | ||||||||||||||||||||||||||||||||||||||
| 4th Quarter 2024 Supplemental Financial and Operating Statistics | 8 |
||||
| Senior Unsecured Notes Covenants | |||||||||||
| December 31, 2024 |
Debt Covenant
Threshold(1)
|
||||||||||
| Total debt to undepreciated assets | 36% | <60% | |||||||||
| Secured debt to undepreciated assets | 2% | <40% | |||||||||
| Undepreciated unencumbered assets to unsecured debt | 288% | >150% | |||||||||
| Debt service coverage | 4.6x | >1.5x | |||||||||
| Unsecured Credit Facility Covenants | |||||||||||
| December 31, 2024 |
Debt Covenant
Threshold(1)
|
||||||||||
| Maximum leverage | 33% | <60% | |||||||||
| Minimum fixed charge coverage | 4.1x | >1.5x | |||||||||
| Secured indebtedness | 2.2% | <45% | |||||||||
| Unsecured debt interest coverage | 4.2x | >1.75x | |||||||||
| Unsecured leverage | 31% | <60% | |||||||||
| Senior Unsecured Debt Ratings | |||||||||||
| Fitch Ratings | BBB/Positive | ||||||||||
| Moody's Investors Service | Baa2/Stable | ||||||||||
| Standard & Poor's Rating Services | BBB/Stable | ||||||||||
| Liquidity | |||||||||||
| Cash, cash equivalents and short-term deposits | $ | 478,056 | |||||||||
| Availability under unsecured credit facility | 1,100,000 | ||||||||||
| $ | 1,578,056 | ||||||||||
| Unencumbered NOI as a % of Total NOI | 95 | % | |||||||||
| Net Debt to Adjusted EBITDA | |||||||||||
| Mortgage and other indebtedness, net | $ | 3,226,930 | |||||||||
| Add: Company share of unconsolidated joint venture debt | 44,569 | ||||||||||
| Add: debt discounts, premiums and issuance costs, net | 1,255 | ||||||||||
| Less: Partner share of consolidated joint venture debt | (9,801) | ||||||||||
| Company's consolidated debt and share of unconsolidated debt | 3,262,953 | ||||||||||
| Less: cash, cash equivalents, restricted cash and short-term deposits | (485,280) | ||||||||||
| Company share of Net Debt | $ | 2,777,673 | |||||||||
| Q4 2024 Adjusted EBITDA, Annualized: | |||||||||||
| – Consolidated Adjusted EBITDA | $ | 585,284 | |||||||||
– Unconsolidated Adjusted EBITDA(2) |
4,536 | ||||||||||
– Minority interest Adjusted EBITDA(2) |
(840) | 588,980 | |||||||||
| Ratio of Company share of Net Debt to Adjusted EBITDA | 4.7x | ||||||||||
| 4th Quarter 2024 Supplemental Financial and Operating Statistics | 9 |
||||
| Total Outstanding Debt | Amount Outstanding |
Ratio | Weighted Average Interest Rate |
Weighted Average Years to Maturity |
|||||||||||||||||||
Fixed rate debt(1) |
$ | 3,058,585 | 94 | % | 4.08 | % | 4.4 | ||||||||||||||||
Variable rate debt(2) |
169,600 | 5 | % | 7.64 | % | 1.7 | |||||||||||||||||
| Debt discounts, premiums and issuance costs, net | (1,255) | N/A | N/A | N/A | |||||||||||||||||||
| Total consolidated debt | 3,226,930 | 99 | % | 4.27 | % | 4.3 | |||||||||||||||||
| KRG share of unconsolidated debt | 44,569 | 1 | % | 6.46 | % | 4.0 | |||||||||||||||||
| Total | $ | 3,271,499 | 100 | % | 4.30 | % | 4.3 | ||||||||||||||||
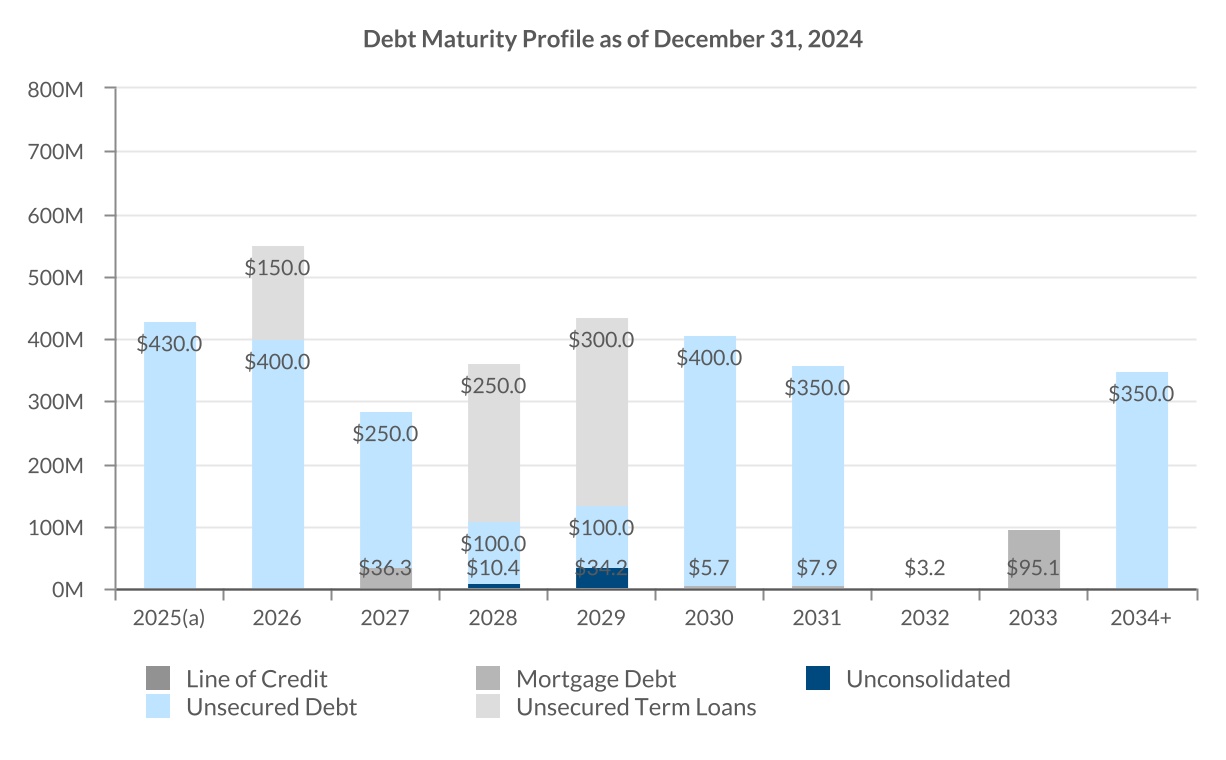
| Schedule of Maturities by Year | |||||||||||||||||||||||||||||||||||
| Secured Debt | |||||||||||||||||||||||||||||||||||
| Scheduled Principal Payments |
Term Maturities |
Unsecured Debt |
Total Consolidated Debt |
Total Unconsolidated Debt |
Total Debt Outstanding |
||||||||||||||||||||||||||||||
| 2025 | $ | 5,248 | $ | — | $ | 430,000 | $ | 435,248 | $ | — | $ | 435,248 | |||||||||||||||||||||||
| 2026 | 4,581 | — | 550,000 | 554,581 | — | 554,581 | |||||||||||||||||||||||||||||
| 2027 | 3,120 | 10,600 | 250,000 | 263,720 | — | 263,720 | |||||||||||||||||||||||||||||
| 2028 | 3,757 | — | 350,000 | (3) |
353,757 | 10,378 | 364,135 | ||||||||||||||||||||||||||||
| 2029 | 4,324 | — | 400,000 | 404,324 | — | 404,324 | |||||||||||||||||||||||||||||
| 2030 and beyond | 23,767 | 92,788 | 1,100,000 | 1,216,555 | 34,191 | 1,250,746 | |||||||||||||||||||||||||||||
| Debt discounts, premiums and issuance costs, net | — | 909 | (2,164) | (1,255) | — | (1,255) | |||||||||||||||||||||||||||||
| Total | $ | 44,797 | $ | 104,297 | $ | 3,077,836 | $ | 3,226,930 | $ | 44,569 | $ | 3,271,499 | |||||||||||||||||||||||
| 4th Quarter 2024 Supplemental Financial and Operating Statistics | 10 |
||||
| Description | Interest Rate(1) |
Maturity Date |
Balance as of December 31, 2024 |
% of Total Outstanding |
||||||||||||||||||||||
| Senior Unsecured Notes | 4.00% | 3/15/2025 | $ | 350,000 | ||||||||||||||||||||||
Senior Unsecured Notes(2) |
SOFR + 365 | 9/10/2025 | 80,000 | |||||||||||||||||||||||
| 2025 Debt Maturities | 4.69% | 430,000 | 13 | % | ||||||||||||||||||||||
Unsecured Term Loan(3) |
2.73% | 7/17/2026 | 150,000 | |||||||||||||||||||||||
| Senior Unsecured Notes | 4.08% | 9/30/2026 | 100,000 | |||||||||||||||||||||||
| Senior Unsecured Notes | 4.00% | 10/1/2026 | 300,000 | |||||||||||||||||||||||
| 2026 Debt Maturities | 3.67% | 550,000 | 17 | % | ||||||||||||||||||||||
| Senior Unsecured Exchangeable Notes | 0.75% | 4/1/2027 | 175,000 | |||||||||||||||||||||||
| Northgate North | 4.50% | 6/1/2027 | 21,681 | |||||||||||||||||||||||
Delray Marketplace(4) |
SOFR + 215 | 8/4/2027 | 14,600 | |||||||||||||||||||||||
Senior Unsecured Notes(2) |
SOFR + 375 | 9/10/2027 | 75,000 | |||||||||||||||||||||||
| 2027 Debt Maturities | 3.17% | 286,281 | 9 | % | ||||||||||||||||||||||
Unsecured Term Loan(5) |
3.94% | 10/24/2028 | 250,000 | |||||||||||||||||||||||
| Senior Unsecured Notes | 4.24% | 12/28/2028 | 100,000 | |||||||||||||||||||||||
| 2028 Debt Maturities | 4.03% | 350,000 | 11 | % | ||||||||||||||||||||||
| Senior Unsecured Notes | 4.82% | 6/28/2029 | 100,000 | |||||||||||||||||||||||
Unsecured Term Loan(6) |
3.72% | 7/29/2029 | 300,000 | |||||||||||||||||||||||
Unsecured Credit Facility(7) |
SOFR + 115 | 10/3/2029 | — | |||||||||||||||||||||||
| 2029 Debt Maturities | 3.99% | 400,000 | 12 | % | ||||||||||||||||||||||
| Rampart Commons | 5.73% | 6/10/2030 | 5,676 | |||||||||||||||||||||||
| Senior Unsecured Notes | 4.75% | 9/15/2030 | 400,000 | |||||||||||||||||||||||
| The Shoppes at Union Hill | 3.75% | 6/1/2031 | 7,930 | |||||||||||||||||||||||
| Senior Unsecured Notes | 4.95% | 12/15/2031 | 350,000 | |||||||||||||||||||||||
| Nora Plaza Shops | 3.80% | 2/1/2032 | 3,203 | |||||||||||||||||||||||
| One Loudoun – Pads G&H Residential | 5.36% | 5/1/2033 | 95,095 | |||||||||||||||||||||||
Senior Unsecured Notes(8) |
4.60% | 3/1/2034 | 350,000 | |||||||||||||||||||||||
| 2030 and beyond Debt Maturities | 4.81% | 1,211,904 | 37 | % | ||||||||||||||||||||||
| Debt discounts, premiums and issuance costs, net | (1,255) | |||||||||||||||||||||||||
| Total debt per consolidated balance sheet | 4.27% | $ | 3,226,930 | 99 | % | |||||||||||||||||||||
| KRG share of unconsolidated debt | ||||||||||||||||||||||||||
| Three Property Retail Portfolio | 4.09% | 7/1/2028 | $ | 10,378 | ||||||||||||||||||||||
The Corner (development)(9) |
SOFR + 286 | 3/4/2029 | 34,191 | |||||||||||||||||||||||
| Total KRG share of unconsolidated debt | 6.46% | 44,569 | 1 | % | ||||||||||||||||||||||
| Total consolidated and KRG share of unconsolidated debt | 4.30% | $ | 3,271,499 | |||||||||||||||||||||||
| 4th Quarter 2024 Supplemental Financial and Operating Statistics | 11 |
||||
| Property Name | Acquisition Date | Metropolitan Statistical Area (“MSA”) |
Key Anchor | GLA | Acquisition Price | |||||||||||||||||||||||||||
| Parkside West Cobb | August 30, 2024 | Atlanta | Sprouts | 141,627 | $ | 40,125 | ||||||||||||||||||||||||||
| Village Commons | January 15, 2025 | Miami | Publix | 170,976 | 68,400 | |||||||||||||||||||||||||||
| Total acquisitions | 312,603 | $ | 108,525 | |||||||||||||||||||||||||||||
| Property Name | Disposition Date | MSA | Key Anchor | GLA | Sales Price | |||||||||||||||||||||||||||
| Ashland & Roosevelt | May 31, 2024 | Chicago | Jewel-Osco | 104,176 | $ | 30,600 | ||||||||||||||||||||||||||
| Property Name | Disposition Date | MSA | Transaction | Sales Price | ||||||||||||||||||||||
| One Loudoun Expansion | December 23, 2024 | Washington, D.C./Baltimore | Sale of land parcel and development rights | $ | 7,625 | |||||||||||||||||||||
| 4th Quarter 2024 Supplemental Financial and Operating Statistics | 12 |
||||
| Project | MSA | KRG Ownership % |
Projected
Completion Date(1)
|
Total Commercial GLA |
Total Multifamily Units |
Total Project Costs – at KRG's Share |
KRG Equity Requirement |
KRG Remaining Spend |
Estimated Stabilized NOI to KRG |
Estimated
Remaining NOI
to Come Online(2)
|
||||||||||||||||||||||||||||||||||||||||||||||||||||
| Active Projects | ||||||||||||||||||||||||||||||||||||||||||||||||||||||||||||||
The Corner – IN(3) |
Indianapolis, IN | 50% | Q1 2025 | 24,000 | 285 | $ | 31,900 | $ | — | $ | — | $1.7M–$1.9M | $1.7M–$1.9M | |||||||||||||||||||||||||||||||||||||||||||||||||
One Loudoun Expansion(4) |
Washington, D.C./Baltimore | 100% | Q4 2026 | 119,000 | — | $81.0M–$91.0M | $65.0M–$75.0M | $65.0M–$75.0M | $4.7M–$6.2M | $3.2M–$4.7M | ||||||||||||||||||||||||||||||||||||||||||||||||||||
| Total | 143,000 | 285 | $112.9M–$122.9M | $65.0M–$75.0M | $65.0M–$75.0M | $6.4M–$8.1M | $4.9M–$6.6M | |||||||||||||||||||||||||||||||||||||||||||||||||||||||
Future Opportunities(5) |
||||||||||||||
| Project | MSA | Project Description | ||||||||||||
| Hamilton Crossing Centre – Phase II | Indianapolis, IN | Addition of mixed-use (multifamily, office and retail) components adjacent to the Republic Airways headquarters. | ||||||||||||
| Carillon | Washington, D.C./Baltimore | Potential of 1.2 million square feet of commercial GLA and 3,000 multifamily units for additional expansion. | ||||||||||||
| One Loudoun Hotel | Washington, D.C./Baltimore | Potential for 1.7 million square feet remaining following the planned approximately 170-room hotel. | ||||||||||||
| One Loudoun Residential | Washington, D.C./Baltimore | Potential for approximately 1,300 multifamily units remaining following the planned 400 additional multifamily units. | ||||||||||||
| Main Street Promenade | Chicago, IL | Potential of 16,000 square feet of commercial GLA for additional expansion. | ||||||||||||
| Downtown Crown | Washington, D.C./Baltimore | Potential of 42,000 square feet of commercial GLA for additional expansion. | ||||||||||||
| Edwards Multiplex – Ontario | Los Angeles, CA | Potential redevelopment of existing Regal Theatre. | ||||||||||||
| Glendale Town Center | Indianapolis, IN | Potential of 200 multifamily units for additional expansion. | ||||||||||||
| 4th Quarter 2024 Supplemental Financial and Operating Statistics | 13 |
||||
| Region/State |
Number of
Properties(1)
|
Owned GLA/NRA(2) |
Total
Weighted
Retail ABR(3)
|
% of
Weighted
Retail ABR(3)
|
||||||||||||||||||||||
| South | ||||||||||||||||||||||||||
| Texas | 44 | 7,493 | $ | 157,891 | 26.7 | % | ||||||||||||||||||||
| Florida | 30 | 3,505 | 69,218 | 11.7 | % | |||||||||||||||||||||
| Maryland | 8 | 1,410 | 35,017 | 5.9 | % | |||||||||||||||||||||
| North Carolina | 8 | 1,535 | 33,700 | 5.7 | % | |||||||||||||||||||||
| Virginia | 7 | 1,107 | 31,857 | 5.4 | % | |||||||||||||||||||||
| Georgia | 11 | 1,849 | 30,581 | 5.2 | % | |||||||||||||||||||||
| Tennessee | 3 | 580 | 8,877 | 1.5 | % | |||||||||||||||||||||
| Oklahoma | 3 | 506 | 8,148 | 1.4 | % | |||||||||||||||||||||
| South Carolina | 2 | 262 | 3,663 | 0.6 | % | |||||||||||||||||||||
| Total South | 116 | 18,247 | 378,952 | 64.1 | % | |||||||||||||||||||||
| West | ||||||||||||||||||||||||||
| Washington | 10 | 1,633 | 31,098 | 5.3 | % | |||||||||||||||||||||
| Nevada | 5 | 841 | 28,526 | 4.8 | % | |||||||||||||||||||||
| Arizona | 5 | 714 | 16,088 | 2.7 | % | |||||||||||||||||||||
| California | 2 | 531 | 12,712 | 2.2 | % | |||||||||||||||||||||
| Utah | 2 | 388 | 8,215 | 1.4 | % | |||||||||||||||||||||
| Total West | 24 | 4,107 | 96,639 | 16.4 | % | |||||||||||||||||||||
| Midwest | ||||||||||||||||||||||||||
| Indiana | 15 | 1,600 | 31,558 | 5.3 | % | |||||||||||||||||||||
| Illinois | 7 | 1,059 | 22,779 | 3.9 | % | |||||||||||||||||||||
| Michigan | 1 | 308 | 6,729 | 1.1 | % | |||||||||||||||||||||
| Missouri | 1 | 453 | 4,402 | 0.7 | % | |||||||||||||||||||||
| Ohio | 1 | 236 | 2,152 | 0.4 | % | |||||||||||||||||||||
| Total Midwest | 25 | 3,656 | 67,620 | 11.4 | % | |||||||||||||||||||||
| Northeast | ||||||||||||||||||||||||||
| New York | 7 | 713 | 25,563 | 4.3 | % | |||||||||||||||||||||
| New Jersey | 4 | 339 | 11,296 | 1.9 | % | |||||||||||||||||||||
| Massachusetts | 1 | 264 | 4,761 | 0.8 | % | |||||||||||||||||||||
| Connecticut | 1 | 206 | 4,008 | 0.7 | % | |||||||||||||||||||||
| Pennsylvania | 1 | 136 | 1,982 | 0.4 | % | |||||||||||||||||||||
| Total Northeast | 14 | 1,658 | 47,610 | 8.1 | % | |||||||||||||||||||||
Total(4) |
179 | 27,668 | $ | 590,821 | 100.0 | % | ||||||||||||||||||||
| 4th Quarter 2024 Supplemental Financial and Operating Statistics | 14 |
||||
| Credit Ratings | |||||||||||||||||||||||||||||||||||||||||||||||
| Tenant | Primary DBA/ Number of Stores |
Number
of Stores(1)
|
Total
Leased
GLA/NRA(2)
|
ABR(3) |
% of
Weighted ABR(4)
|
S&P | Moody’s | ||||||||||||||||||||||||||||||||||||||||
| 1 | The TJX Companies, Inc. | T.J. Maxx (18), Marshalls (13), HomeGoods (11), Homesense (4), T.J. Maxx & HomeGoods combined (2), Sierra (2) | 50 | 1,450 | $ | 16,615 | 2.8 | % | A | A2 | |||||||||||||||||||||||||||||||||||||
| 2 | Best Buy Co., Inc. | Best Buy (15), Pacific Sales (1) | 16 | 633 | 11,447 | 1.9 | % | BBB+ | A3 | ||||||||||||||||||||||||||||||||||||||
| 3 | Ross Stores, Inc. | Ross Dress for Less (32), dd’s DISCOUNTS (1) | 33 | 937 | 11,333 | 1.9 | % | BBB+ | A2 | ||||||||||||||||||||||||||||||||||||||
| 4 | PetSmart, Inc. | 32 | 657 | 10,991 | 1.9 | % | B+ | B1 | |||||||||||||||||||||||||||||||||||||||
| 5 | Michaels Stores, Inc. | Michaels | 28 | 631 | 8,346 | 1.4 | % | N/A | N/A | ||||||||||||||||||||||||||||||||||||||
| 6 | Gap Inc. | Old Navy (25), The Gap (3), Athleta (3), Banana Republic (2) | 33 | 448 | 8,137 | 1.4 | % | BB | Ba3 | ||||||||||||||||||||||||||||||||||||||
| 7 | Dick’s Sporting Goods, Inc. | Dick’s Sporting Goods (12), Golf Galaxy (1) | 13 | 625 | 7,956 | 1.3 | % | BBB | Baa2 | ||||||||||||||||||||||||||||||||||||||
| 8 | Publix Super Markets, Inc. | 14 | 672 | 6,935 | 1.2 | % | N/A | N/A | |||||||||||||||||||||||||||||||||||||||
| 9 | Ulta Beauty, Inc. | 28 | 286 | 6,303 | 1.1 | % | N/A | N/A | |||||||||||||||||||||||||||||||||||||||
| 10 | Total Wine & More | 15 | 355 | 6,152 | 1.0 | % | N/A | N/A | |||||||||||||||||||||||||||||||||||||||
| 11 | The Kroger Co. | Kroger (6), Harris Teeter (2), QFC (1), Smith’s (1) |
10 | 356 | 6,041 | 1.0 | % | BBB | Baa1 | ||||||||||||||||||||||||||||||||||||||
| 12 | Lowe’s Companies, Inc. | 6 | — | 5,838 | 1.0 | % | BBB+ | Baa1 | |||||||||||||||||||||||||||||||||||||||
| 13 | Fitness International, LLC | LA Fitness (5), XSport Fitness (1) | 6 | 241 | 5,696 | 1.0 | % | B | B2 | ||||||||||||||||||||||||||||||||||||||
| 14 | Five Below, Inc. | 32 | 291 | 5,684 | 1.0 | % | N/A | N/A | |||||||||||||||||||||||||||||||||||||||
| 15 | BJ’s Wholesale Club, Inc. | 3 | 115 | 5,515 | 0.9 | % | BB+ | N/A | |||||||||||||||||||||||||||||||||||||||
| 16 |
Petco Health and Wellness
Company, Inc.
|
19 | 273 | 5,135 | 0.9 | % | B | B3 | |||||||||||||||||||||||||||||||||||||||
| 17 | Nordstrom, Inc. | Nordstrom Rack | 9 | 272 | 5,015 | 0.8 | % | BB | Ba2 | ||||||||||||||||||||||||||||||||||||||
| 18 | Kohl’s Corporation | 7 | 265 | 4,980 | 0.8 | % | BB- | Ba3 | |||||||||||||||||||||||||||||||||||||||
| 19 | The Container Store Group, Inc. | 7 | 151 | 4,707 | 0.8 | % | D | N/A | |||||||||||||||||||||||||||||||||||||||
| 20 | Designer Brands Inc. | DSW Designer Shoe Warehouse | 16 | 313 | 4,630 | 0.8 | % | N/A | N/A | ||||||||||||||||||||||||||||||||||||||
| 21 | KnitWell Group | Chico’s (7), Talbots (7), LOFT (5), Soma (4), Ann Taylor (4), White House Black Market (4) | 31 | 134 | 4,571 | 0.8 | % | N/A | N/A | ||||||||||||||||||||||||||||||||||||||
| 22 | Trader Joe's | 11 | 135 | 4,521 | 0.8 | % | N/A | N/A | |||||||||||||||||||||||||||||||||||||||
| 23 | Burlington Stores, Inc. | 10 | 459 | 4,412 | 0.8 | % | BB+ | N/A | |||||||||||||||||||||||||||||||||||||||
| 24 | Sprouts Farmers Market, Inc. | 8 | 222 | 4,384 | 0.7 | % | N/A | N/A | |||||||||||||||||||||||||||||||||||||||
| 25 | Office Depot, Inc. | Office Depot (11), OfficeMax (3) | 14 | 308 | 4,369 | 0.7 | % | N/A | N/A | ||||||||||||||||||||||||||||||||||||||
| Total Top Tenants | 451 | 10,229 | $ | 169,713 | 28.7 | % | |||||||||||||||||||||||||||||||||||||||||
| 4th Quarter 2024 Supplemental Financial and Operating Statistics | 15 |
||||
Comparable Space(1)(2) |
||||||||||||||||||||||||||||||||||||||||||||||||||
|
Category
|
Total
Leases(1)
|
Total
Sq. Ft.(1)
|
Leases | Sq. Ft. | Prior Rent PSF(3) |
New Rent PSF(4) |
Cash Rent Spread |
TI, LL Work,
Lease Commissions PSF(5)
|
||||||||||||||||||||||||||||||||||||||||||
| New Leases – Q4 2024 | 48 | 233,043 | 23 | 97,594 | $ | 25.32 | $ | 31.29 | 23.6 | % | ||||||||||||||||||||||||||||||||||||||||
| New Leases – Q3 2024 | 63 | 284,580 | 35 | 136,874 | 24.11 | 30.11 | 24.9 | % | ||||||||||||||||||||||||||||||||||||||||||
| New Leases – Q2 2024 | 55 | 372,155 | 40 | 219,622 | 18.39 | 24.79 | 34.8 | % | ||||||||||||||||||||||||||||||||||||||||||
| New Leases – Q1 2024 | 38 | 175,087 | 19 | 115,295 | 17.09 | 25.31 | 48.1 | % | ||||||||||||||||||||||||||||||||||||||||||
| Total | 204 | 1,064,865 | 117 | 569,385 | $ | 20.69 | $ | 27.29 | 31.9 | % | $ | 75.45 | ||||||||||||||||||||||||||||||||||||||
| Non-Option Renewals – Q4 2024 | 93 | 447,352 | 69 | 323,610 | $ | 20.67 | $ | 23.65 | 14.4 | % | ||||||||||||||||||||||||||||||||||||||||
| Non-Option Renewals – Q3 2024 | 81 | 477,515 | 59 | 236,747 | 23.69 | 26.50 | 11.9 | % | ||||||||||||||||||||||||||||||||||||||||||
| Non-Option Renewals – Q2 2024 | 69 | 314,899 | 60 | 216,422 | 22.17 | 25.34 | 14.3 | % | ||||||||||||||||||||||||||||||||||||||||||
| Non-Option Renewals – Q1 2024 | 93 | 330,966 | 57 | 174,284 | 25.45 | 28.57 | 12.2 | % | ||||||||||||||||||||||||||||||||||||||||||
| Total | 336 | 1,570,732 | 245 | 951,063 | $ | 22.64 | $ | 25.65 | 13.3 | % | $ | 2.37 | ||||||||||||||||||||||||||||||||||||||
| Option Renewals – Q4 2024 | 29 | 533,995 | 29 | 533,995 | $ | 13.24 | $ | 14.14 | 6.8 | % | ||||||||||||||||||||||||||||||||||||||||
| Option Renewals – Q3 2024 | 61 | 889,891 | 61 | 889,891 | 16.51 | 17.79 | 7.7 | % | ||||||||||||||||||||||||||||||||||||||||||
| Option Renewals – Q2 2024 | 36 | 466,712 | 36 | 466,712 | 15.94 | 16.90 | 6.0 | % | ||||||||||||||||||||||||||||||||||||||||||
| Option Renewals – Q1 2024 | 54 | 462,628 | 54 | 462,628 | 19.23 | 20.25 | 5.3 | % | ||||||||||||||||||||||||||||||||||||||||||
| Total | 180 | 2,353,226 | 180 | 2,353,226 | $ | 16.19 | $ | 17.27 | 6.7 | % | $ | — | ||||||||||||||||||||||||||||||||||||||
| Total – Q4 2024 | 170 | 1,214,390 | 121 | 955,199 | $ | 16.99 | $ | 19.11 | 12.5 | % | ||||||||||||||||||||||||||||||||||||||||
| Total – Q3 2024 | 205 | 1,651,986 | 155 | 1,263,512 | 18.68 | 20.75 | 11.1 | % | ||||||||||||||||||||||||||||||||||||||||||
| Total – Q2 2024 | 160 | 1,153,766 | 136 | 902,756 | 18.03 | 20.84 | 15.6 | % | ||||||||||||||||||||||||||||||||||||||||||
| Total – Q1 2024 | 185 | 968,681 | 130 | 752,207 | 20.34 | 22.95 | 12.8 | % | ||||||||||||||||||||||||||||||||||||||||||
| Total | 720 | 4,988,823 | 542 | 3,873,674 | $ | 18.43 | $ | 20.79 | 12.8 | % | $ | 11.67 | ||||||||||||||||||||||||||||||||||||||
| 4th Quarter 2024 Supplemental Financial and Operating Statistics | 16 |
||||
| Retail Operating Portfolio | ||||||||||||||||||||||||||||||||||||||||||||||||||||||||
Expiring Retail GLA(2) |
Expiring ABR per Sq. Ft.(3) |
|||||||||||||||||||||||||||||||||||||||||||||||||||||||
|
Number of
Expiring
Leases(1)
|
Shop Tenants |
Anchor Tenants |
Expiring ABR (Pro rata) |
Expiring Ground Lease ABR (Pro rata) |
% of Total ABR (Pro rata) |
Shop Tenants |
Anchor Tenants |
Total | ||||||||||||||||||||||||||||||||||||||||||||||||
| 2025 | 423 | 1,001,732 | 975,209 | $ | 45,580 | $ | 2,433 | 8.1 | % | $ | 32.54 | $ | 13.84 | $ | 23.31 | |||||||||||||||||||||||||||||||||||||||||
| 2026 | 494 | 1,108,332 | 2,190,581 | 64,100 | 4,785 | 11.7 | % | 31.09 | 13.90 | 19.68 | ||||||||||||||||||||||||||||||||||||||||||||||
| 2027 | 538 | 1,205,945 | 2,255,715 | 70,633 | 5,587 | 12.9 | % | 32.66 | 14.02 | 20.52 | ||||||||||||||||||||||||||||||||||||||||||||||
| 2028 | 562 | 1,236,450 | 2,747,997 | 85,450 | 6,678 | 15.6 | % | 35.67 | 15.06 | 21.46 | ||||||||||||||||||||||||||||||||||||||||||||||
| 2029 | 562 | 1,236,206 | 3,040,465 | 88,120 | 3,572 | 15.5 | % | 35.55 | 15.40 | 21.23 | ||||||||||||||||||||||||||||||||||||||||||||||
| 2030 | 323 | 818,426 | 1,977,607 | 50,600 | 3,942 | 9.2 | % | 31.12 | 12.97 | 18.29 | ||||||||||||||||||||||||||||||||||||||||||||||
| 2031 | 174 | 469,946 | 675,597 | 26,056 | 2,111 | 4.8 | % | 33.68 | 15.29 | 22.84 | ||||||||||||||||||||||||||||||||||||||||||||||
| 2032 | 180 | 440,150 | 1,131,795 | 30,506 | 466 | 5.2 | % | 32.36 | 14.76 | 19.69 | ||||||||||||||||||||||||||||||||||||||||||||||
| 2033 | 196 | 503,675 | 721,638 | 29,065 | 3,778 | 5.6 | % | 35.44 | 15.60 | 23.76 | ||||||||||||||||||||||||||||||||||||||||||||||
| 2034 | 174 | 375,948 | 645,475 | 25,913 | 2,053 | 4.7 | % | 38.47 | 17.81 | 25.41 | ||||||||||||||||||||||||||||||||||||||||||||||
| Beyond | 176 | 374,406 | 1,162,612 | 34,328 | 5,065 | 6.7 | % | 37.56 | 17.54 | 22.41 | ||||||||||||||||||||||||||||||||||||||||||||||
| 3,802 | 8,771,216 | 17,524,691 | $ | 550,351 | $ | 40,470 | 100.0 | % | $ | 33.79 | $ | 14.82 | $ | 21.15 | ||||||||||||||||||||||||||||||||||||||||||
| 4th Quarter 2024 Supplemental Financial and Operating Statistics | 17 |
||||
| Cash Net Operating Income (“NOI”) | Page | Other Assets(1) |
Page | |||||||||||||||||
| GAAP property NOI (incl. ground lease revenue) | $ | 159,429 | 6 | Cash, cash equivalents and restricted cash | $ | 133,327 | 3 | |||||||||||||
| Non-cash revenue adjustments | (5,183) | Short-term deposits | 350,000 | 3 | ||||||||||||||||
| Other property-related revenue | (3,843) | 6 | Tenant and other receivables (net of SLR) | 58,391 | 3 | |||||||||||||||
| Ground lease (“GL”) revenue | (10,750) | 6 | Prepaid and other assets | 104,627 | 3 | |||||||||||||||
| Consolidated Cash Property NOI (excl. GL) | $ | 139,653 | ||||||||||||||||||
|
Annualized Consolidated Cash Property NOI
(excl. ground leases)
|
$ | 558,612 | ||||||||||||||||||
| Adjustments to Normalize Annualized Cash NOI | Liabilities | |||||||||||||||||||
Remaining NOI to come online from development and redevelopment projects(2) |
$ | 5,750 | 13 | Mortgage and other indebtedness, net | $ | (3,228,185) | 10 | |||||||||||||
| Unconsolidated Adjusted EBITDA | 4,536 | 8 | Pro rata adjustment for joint venture debt | (34,768) | 8 | |||||||||||||||
| General and administrative expense allocable to property management activities included in property expenses ($4.0 million in Q4) | 16,000 | 6, note 3 | Accounts payable and accrued expenses | (202,651) | 3 | |||||||||||||||
| Total Adjustments | 26,286 | Other liabilities | (246,100) | 3 | ||||||||||||||||
Projected remaining under construction development/redevelopment(3) |
(70,000) | 13 | ||||||||||||||||||
|
Annualized Normalized Portfolio Cash NOI
(excl. ground leases)
|
$ | 584,898 | ||||||||||||||||||
| Annualized ground lease NOI | 43,000 | |||||||||||||||||||
Total Annualized Portfolio Cash NOI(4) |
$ | 627,898 | Common shares and Units outstanding | 223,859,664 | ||||||||||||||||
| 4th Quarter 2024 Supplemental Financial and Operating Statistics | 18 |
||||
| 4th Quarter 2024 Supplemental Financial and Operating Statistics | 19 |
||||
| 4th Quarter 2024 Supplemental Financial and Operating Statistics | 20 |
||||