UNITED STATES
SECURITIES AND EXCHANGE COMMISSION
WASHINGTON, D.C. 20549
FORM 6-K
REPORT OF FOREIGN PRIVATE ISSUER
PURSUANT TO RULE 13a-16 OR 15d-16
UNDER THE SECURITIES EXCHANGE ACT OF 1934
For the month of June 2025
Commission File Number: 001-41737
Lifezone Metals Limited
2nd Floor, St George’s Court,
Upper Church Street,
Douglas, Isle of Man, IM1 1EE
(Address of principal executive office)
Indicate by check mark whether the registrant files or will file annual reports under cover of Form 20-F or Form 40-F.
Form 20-F ☒ Form 40- F ☐
Lifezone Metals Limited (the “Company”) is furnishing this current report on Form 6-K to report a June 2025 Kabanga Nickel Project - Technical Report Summary - Initial Assessment.
The Company intends to incorporate this Form 6-K and the accompanying exhibits by reference into its registration statements on Form F-3 (File Nos. 333-272865 and 333-281189) and Form S-8 (File No. 333-274449) and the related prospectuses, respectively as such registration statements and prospectuses may be amended from time to time, and to be a part thereof from the date on which this report is filed, to the extent not superseded by documents or reports subsequently filed or furnished.
Exhibit Index
SIGNATURES
Pursuant to the requirements of the Securities Exchange Act of 1934, the registrant has duly caused this report to be signed on its behalf by the undersigned, thereunto duly authorized.
| LIFEZONE METALS LIMITED | ||
| Date: June 2, 2025 | By: | /s/ Chris Showalter |
| Name: | Chris Showalter | |
| Title: | Chief Executive Officer | |
Exhibit 23.1
CONSENT OF EXPERT
I hereby consent to the use of and reference to my name, Sharron Sylvester, B.Sc. (Geol), RPGeo AIG, and the information listed below that I reviewed and approved, as described or incorporated by reference in Lifezone Metals Limited’s Form F-3 (File Nos. 333-272865 and 333-281189) and Form S-8 (File No. 333-274449) and the related prospectuses, filed with the United States Securities and Exchange Commission and any amendments and/or exhibits thereto (collectively, the “Registration Statements”). I am a “Qualified Person” as defined in Regulation S-K 1300.
I have reviewed and approved the following:
| ● | the Kabanga Nickel Project Initial Assessment Technical Report Summary titled “Initial Assessment - Technical Report Summary” effective June 2, 2025 (the ” IA Technical Report Summary”); and |
| ● | the information derived, summarized, quoted or referenced from the IA Technical Report Summary, or portions thereof, that was prepared by me, that I supervised the preparation of and/or that was reviewed and approved by me, that is included or incorporated by reference in the Registration Statements. |
I consent to the public filing and use of the IA Technical Report Summary as exhibits to the Registration Statements and the Form 6-K of Lifezone Metals Limited to which this consent is an exhibit.
| Dated this 2nd day of June, 2025. | |
| Yours sincerely, | |
| /s/ Sharron Sylvester | |
| Sharron Sylvester, B.Sc. (Geol), RPGeo AIG | |
| Technical Director – Geology | |
| OreWin Pty Ltd |
Exhibit 23.2
CONSENT OF EXPERT
DRA Projects (Pty) Ltd hereby consents to the use of and reference to it and its name, DRA Projects (Pty) Ltd, and the information listed below that it has reviewed and approved, as described or incorporated by reference in Lifezone Metals Limited’s Form F-3 (File Nos. 333-272865 and 333-281189) and Form S-8 (File No. 333-274449) and the related prospectuses, filed with the United States Securities and Exchange Commission and any amendments and/or exhibits thereto (collectively, the “Registration Statements”). DRA Projects (Pty) Ltd is a “Qualified Person” as defined in Regulation S-K 1300.
DRA Projects (Pty) Ltd has reviewed and approved the following:
| ● | the Kabanga Nickel Project Initial Assessment Technical Report Summary titled “Initial Assessment - Technical Report Summary” effective June 2, 2025 (the ” IA Technical Report Summary”); and |
| ● | the information derived, summarized, quoted or referenced from the IA Technical Report Summary, or portions thereof, that were prepared by DRA Projects (Pty) Ltd, that DRA Projects (Pty) Ltd supervised the preparation of and/or that was reviewed and approved by DRA Projects (Pty) Ltd, that is included or incorporated by reference in the Registration Statements. |
DRA Projects (Pty) Ltd consents to the public filing and use of the IA Technical Report Summary as exhibits to the Registration Statements and the Form 6-K of Lifezone Metals Limited to which this consent is an exhibit.
| Dated this 2nd day of June, 2025. | |
| Yours sincerely, | |
| /s/ DRA Projects (Pty) Ltd | |
| For and on behalf of | |
| DRA Projects (Pty) Ltd | |
Exhibit 96.1

 |
/ / Initial Assessment - Technical Report Summary |
 |
TABLE OF CONTENTS
| ABBREVIATIONS | 17 | |||
| UNITS OF MEASURE | 22 | |||
| 1 | EXECUTIVE SUMMARY | 23 | ||
| 1.1 | Introduction | 23 | ||
| 1.2 | Property Description, Mineral Tenure, Ownership, Surface Rights, Royalties, Agreements and Permits | 23 | ||
| 1.3 | Geology | 27 | ||
| 1.3.1 | Geological Setting | 27 | ||
| 1.3.2 | Style of Mineralization | 27 | ||
| 1.3.3 | Exploration History | 27 | ||
| 1.3.4 | Sample Preparation, Analyses, Security and Data Verification | 28 | ||
| 1.4 | Mineral Processing and Metallurgical Testing | 29 | ||
| 1.4.1 | Kabanga Concentrator | 29 | ||
| 1.4.2 | Kahama Refinery | 30 | ||
| 1.5 | Mineral Resource Estimate | 30 | ||
| 1.6 | Mineral Reserve Estimate | 34 | ||
| 1.7 | Mining Methods | 34 | ||
| 1.8 | Processing and Recovery Methods | 36 | ||
| 1.8.1 | Kabanga Concentrator | 36 | ||
| 1.8.2 | Kahama Refinery | 36 | ||
| 1.9 | Project Infrastructure | 37 | ||
| 1.9.1 | Kabanga Site | 37 | ||
| 1.9.2 | Kahama Site | 37 | ||
| 1.9.3 | Logistics | 38 | ||
| 1.10 | Market Studies | 38 | ||
| 1.11 | Environmental, Permitting and Social License | 40 | ||
| 1.12 | Capital and Operating Costs | 41 | ||
| 1.12.1 | Capital Costs | 41 | ||
| 1.12.2 | Operating Costs | 42 | ||
| 1.13 | Economic Analysis | 42 | ||
| 1.14 | Conclusions and Recommendations | 44 | ||
| 1.14.1 | Geology and Mineral Resources | 44 | ||
| 1.14.2 | Project Development | 44 | ||
| 2 | INTRODUCTION | 46 | ||
| 2.1 | Background | 46 | ||
| 2.2 | Registrant for Whom the Technical Report Summary was Prepared | 46 | ||
| 2.3 | Terms of Reference and Purpose of the Report | 46 | ||
| 2.4 | Source of Information and Data | 46 | ||
| 2.5 | Qualified Persons | 47 | ||
| 2.5.1 | QP – Sharron Sylvester | 47 | ||
| 2.5.2 | QP – DRA | 47 | ||
| 2.6 | Details of Personal Inspection | 49 | ||
| 2.6.1 | Site Inspections – Sharron Sylvester | 49 | ||
| 2.6.2 | Site Inspections – DRA | 49 | ||
| 2.7 | Units and Currency | 50 | ||
| 2.8 | Effective Dates | 50 | ||
| 3 | PROPERTY DESCRIPTION | 50 | ||
| 3.1 | Project Location | 50 | ||
| 3.1.1 | Co-ordinates System | 50 | ||
Page
|
/ / Initial Assessment - Technical Report Summary |
|
| 3.2 | Ownership | 51 | ||
| 3.3 | Framework Agreement Summary and Economic Benefits Sharing Principal | 52 | ||
| 3.4 | Special Mining Licence | 52 | ||
| 3.5 | The Refinery and the Refining Licence | 53 | ||
| 3.6 | Special Economic Zone – Kahama | 53 | ||
| 3.7 | BHP Investment in Kabanga Nickel Limited | 54 | ||
| 3.8 | Lifezone Limited-KNL Development, Licensing and Services Agreement | 54 | ||
| 3.9 | Mineral Rights, Surface Rights and Environmental Rights | 54 | ||
| 4 | ACCESSIBILITY, CLIMATE, LOCAL RESOURCES, INFRASTRUCTURE, AND PHYSIOGRAPHY | 56 | ||
| 4.1 | Overview | 56 | ||
| 4.2 | Kabanga Site | 56 | ||
| 4.2.1 | Location | 56 | ||
| 4.2.2 | Accessibility | 56 | ||
| 4.2.3 | Existing Infrastructure | 56 | ||
| 4.2.4 | Physiography and Vegetation (and Habitats/Species of Conservation Importance) | 57 | ||
| 4.2.5 | Climate | 57 | ||
| 4.2.6 | Seismicity | 57 | ||
| 4.2.7 | Catchments and Water Resources | 57 | ||
| 4.3 | Kahama Site | 58 | ||
| 4.3.1 | Location | 58 | ||
| 4.3.2 | Accessibility | 58 | ||
| 4.3.3 | Existing Infrastructure and Local Resources | 59 | ||
| 4.3.4 | Physiography and Vegetation | 59 | ||
| 4.3.5 | Climate | 60 | ||
| 4.3.6 | Catchments and Water Resources | 60 | ||
| 4.4 | Availability of Infrastructure | 60 | ||
| 4.5 | Country and Regional Setting | 60 | ||
| 5 | HISTORY | 61 | ||
| 5.1 | UNDP Era (1976–79) | 61 | ||
| 5.2 | Sutton Era (1990–99) | 61 | ||
| 5.2.1 | Sutton – BHP JV Era (1990–95) | 61 | ||
| 5.2.2 | Sutton (1995–97) | 61 | ||
| 5.2.3 | Sutton – Anglo JV Era (1997–99) | 61 | ||
| 5.3 | Barrick Era (1999–2004) | 62 | ||
| 5.4 | Barrick – Glencore JV Era (2005–18) | 62 | ||
| 5.5 | Tanzanian Mining Law Reform (2018–21) | 63 | ||
| 5.6 | Previous Technical Report Summaries | 63 | ||
| 5.6.1 | March 2023 Technical Report Summary | 63 | ||
| 5.6.2 | November 2023 Technical Report Summary | 63 | ||
| 5.6.3 | December 2024 Technical Report Summary | 63 | ||
| 6 | GEOLOGICAL SETTING, MINERALIZATION, AND DEPOSIT | 64 | ||
| 6.1 | Regional Geological Setting | 64 | ||
| 6.2 | Property Geology | 65 | ||
| 6.3 | Lithologies and Stratigraphy | 66 | ||
| 6.4 | Structural Setting | 67 | ||
| 6.5 | Deposit Description | 67 | ||
| 6.6 | Mineralization Style | 67 | ||
| 6.7 | Alteration and Weathering | 68 | ||
Page
|
/ / Initial Assessment - Technical Report Summary |
|
| 7 | EXPLORATION | 73 | ||
| 7.1 | Exploration Timeline | 73 | ||
| 7.1.1 | Early Regional Exploration 1976–79 | 73 | ||
| 7.1.2 | Sutton Era Exploration | 74 | ||
| 7.1.3 | Barrick Era Exploration | 75 | ||
| 7.1.4 | TNCL Exploration: 2021–Present | 77 | ||
| 7.2 | Exploration and Drillhole Database | 77 | ||
| 7.3 | Drilling, Core Logging, Downhole Survey, and Sampling | 78 | ||
| 7.3.1 | Drilling | 78 | ||
| 7.3.2 | Core Recovery | 78 | ||
| 7.3.3 | Core Logging | 78 | ||
| 7.3.4 | Core Sampling | 78 | ||
| 7.3.5 | Collar Survey | 79 | ||
| 7.3.6 | Downhole Survey | 79 | ||
| 7.3.7 | BHEM Data | 80 | ||
| 7.3.8 | Drillhole Database | 81 | ||
| 7.4 | Density Measurements | 82 | ||
| 7.5 | Planned Drilling Campaigns | 83 | ||
| 7.6 | Exploration Targets | 84 | ||
| 7.6.1 | Safari Link Exploration Target | 84 | ||
| 7.6.2 | Safari Extension Exploration Target | 86 | ||
| 7.6.3 | Rubona Hill Exploration Target | 87 | ||
| 7.6.4 | Block 1 South Exploration Target | 89 | ||
| 7.6.5 | Exploration Target Summary | 90 | ||
| 8.1 | Introduction | 91 | ||
| 8.2 | Sample Preparation | 91 | ||
| 8.3 | Assaying | 91 | ||
| 8.4 | Quality Assurance and Quality Control | 94 | ||
| 8.4.1 | QA/QC Sample Frequency | 94 | ||
| 8.4.2 | Sample Preparation QA/QC – Screen Test | 94 | ||
| 8.4.3 | Duplicates and Check Assays – ALS-Chemex Coarse Reject Duplicates | 95 | ||
| 8.4.4 | Genalysis Pulp Check Assays | 96 | ||
| 8.4.5 | SGS Lakefield Pulp Check Assays | 99 | ||
| 8.4.6 | Quarter Core Replicates | 100 | ||
| 8.4.7 | Certified Reference Material Standards | 101 | ||
| 8.4.8 | Blanks | 107 | ||
| 8.5 | Security | 108 | ||
| 8.6 | QP Opinion | 108 | ||
| 9.1 | Independent Verifications | 109 | ||
| 9.1.1 | Site Visit | 109 | ||
| 9.1.2 | Verifications of Analytical Quality Control Data | 109 | ||
| 9.2 | QP Opinion | 109 | ||
| 10.1 | Background | 110 | ||
| 10.2 | Concentrator | 110 | ||
| 10.2.1 | Concentrator Historical Testwork | 110 | ||
| 10.2.2 | Concentrator Current Testwork (2022-25) | 113 | ||
| 10.2.3 | Concentrator Metallurgical Performance Projection | 122 | ||
| 10.2.4 | QP Opinion – Concentrator | 130 | ||
| 10.3 | Refinery | 130 | ||
| 10.3.1 | Historical Flowsheet Assessments and Metallurgical Testwork | 130 | ||
| 10.3.2 | Refinery Testwork Concentrate Samples | 131 | ||
| 10.3.3 | Refinery Phase 1 Testwork | 132 | ||
Page
|
/ / Initial Assessment - Technical Report Summary |
|
| 10.3.4 | Refinery Phase 2 Testwork | 132 | ||
| 10.3.5 | Refinery Piloting Testwork (2024) | 133 | ||
| 10.3.6 | Refinery Ongoing Testwork | 134 | ||
| 10.3.7 | Refinery Testwork Conclusions | 134 | ||
| 10.3.8 | Refinery Metallurgical Performance | 135 | ||
| 10.3.9 | QP Opinion – Refinery | 135 | ||
| 11 | MINERAL RESOURCE ESTIMATE | 136 | ||
| 11.1 | Mineral Resource Modeling | 136 | ||
| 11.2 | 2024 Mineral Resource Drillhole Database | 136 | ||
| 11.3 | Mineral Resource Domain Interpretations | 136 | ||
| 11.3.1 | Grade and Lithology | 138 | ||
| 11.3.2 | Drillhole Compositing | 144 | ||
| 11.3.3 | Top Cutting | 145 | ||
| 11.3.4 | Boundary Treatment | 145 | ||
| 11.3.5 | Variography | 147 | ||
| 11.3.6 | Search Parameters | 147 | ||
| 11.3.7 | Grade Estimation | 150 | ||
| 11.3.8 | Model Validation | 150 | ||
| 11.3.9 | Classification | 155 | ||
| 11.4 | Mineral Resource Cut-off Grade | 157 | ||
| 11.4.1 | NiEq24 Cut-off Grade | 158 | ||
| 11.4.2 | Cut-off Grade Sensitivity | 162 | ||
| 11.5 | Reasonable Prospects of Economic Extraction | 164 | ||
| 11.6 | Mineral Resource Statement – Kabanga 2024 | 164 | ||
| 11.6.1 | Comparison to Previous Mineral Resource Estimates – All Mineralization Types | 169 | ||
| 11.7 | Mineral Resource Risks and Opportunities | 171 | ||
| 11.7.1 | Specific Identified Risks | 171 | ||
| 11.7.2 | Mineral Resource Opportunities | 172 | ||
| 11.8 | QP Opinion | 172 | ||
| 11.8.1 | Opinion – Geology and Mineral Resources | 172 | ||
| 11.8.2 | QP Opinion – Other | 172 | ||
| 12 | MINERAL RESERVE ESTIMATES | 172 | ||
| 13 | MINING METHODS | 173 | ||
| 13.1 | Summary | 173 | ||
| 13.2 | Mine Geotechnical | 174 | ||
| 13.2.1 | Ground Support | 174 | ||
| 13.2.2 | Stress Environment | 174 | ||
| 13.2.3 | Material Strength Testwork | 175 | ||
| 13.2.4 | Structural Setting | 177 | ||
| 13.2.5 | Stope Spans | 177 | ||
| 13.2.6 | Vertical Development | 178 | ||
| 13.2.7 | Numerical Modeling | 178 | ||
| 13.3 | Hydrogeology | 179 | ||
| 13.4 | Mining Design | 179 | ||
| 13.4.1 | Stope Optimization | 179 | ||
| 13.4.2 | Mining Method | 181 | ||
| 13.4.3 | Development | 182 | ||
| 13.4.4 | Dilution and Recovery | 184 | ||
| 13.4.5 | Scheduling | 184 | ||
| 13.4.6 | Mining Sequence | 185 | ||
| 13.4.7 | Equipment | 186 | ||
Page
|
/ / Initial Assessment - Technical Report Summary |
|
| 13.5 | Backfill | 187 | ||
| 13.5.1 | Backfill Demand | 187 | ||
| 13.5.2 | Testwork and Paste Recipe | 187 | ||
| 13.5.3 | Reticulation | 188 | ||
| 13.5.4 | Fill Strategy | 188 | ||
| 13.6 | Ventilation | 189 | ||
| 13.6.1 | Airflow Requirements | 189 | ||
| 13.6.2 | Ventilation Infrastructure | 190 | ||
| 13.6.3 | Secondary Ventilation | 191 | ||
| 13.7 | Secondary Egress | 191 | ||
| 13.8 | Mining Underground Infrastructure | 192 | ||
| 13.9 | Mining Labor | 192 | ||
| 13.10 | Mine Schedule | 192 | ||
| 13.10.1 | Development Schedule | 193 | ||
| 13.10.2 | Production Schedule (Measured, Indicated, and Inferred Case) | 194 | ||
| 13.10.3 | Production Schedule without Inferred Mineral Resource | 196 | ||
| 13.11 | QP Opinion | 197 | ||
| 14 | PROCESSING AND RECOVERY METHODS | 197 | ||
| 14.1 | Concentrator Processing and Recovery Methods | 197 | ||
| 14.1.1 | Process Overview and Description | 197 | ||
| 14.1.2 | Process Flowsheet and Design Basis | 198 | ||
| 14.1.3 | Process Description | 200 | ||
| 14.2 | Refinery Processing and Recovery Methods | 204 | ||
| 14.2.1 | Process Overview and Description | 204 | ||
| 14.2.2 | Process Description | 206 | ||
| 14.2.3 | Reagents, Utilities and Consumables | 209 | ||
| 14.2.4 | Refinery Demonstration Plant | 210 | ||
| 14.3 | QP Opinion | 210 | ||
| 14.3.1 | Concentrator | 210 | ||
| 14.3.2 | Refinery | 210 | ||
| 15 | INFRASTRUCTURE | 211 | ||
| 15.1 | Kabanga | 211 | ||
| 15.1.1 | Power Supply | 211 | ||
| 15.1.2 | Water Supply | 211 | ||
| 15.1.3 | External and Internal Site Access Roads | 212 | ||
| 15.1.4 | Kabanga Site Infrastructure | 213 | ||
| 15.1.5 | Waste Handling | 215 | ||
| 15.1.6 | Hydrology and Water Balance | 215 | ||
| 15.1.7 | TSF | 215 | ||
| 15.2 | Kahama | 216 | ||
| 15.2.1 | Existing External Power | 216 | ||
| 15.2.2 | Water Supply and Treatment | 217 | ||
| 15.2.3 | External and Internal Site Access Roads | 217 | ||
| 15.2.4 | Kahama Site Infrastructure | 217 | ||
| 15.2.5 | Refinery Waste Management | 218 | ||
| 15.2.6 | Refinery Residue Storage | 218 | ||
| 15.2.7 | Other | 218 | ||
| 15.3 | Logistics | 219 | ||
| 15.3.1 | Construction Logistics | 219 | ||
| 15.3.2 | Operational Logistics | 220 | ||
| 15.4 | QP Opinion | 222 | ||
Page
|
/ / Initial Assessment - Technical Report Summary |
|
| 16 | MARKET STUDIES | 223 | ||
| 16.1 | Market Outlook | 223 | ||
| 16.1.1 | Nickel | 223 | ||
| 16.1.2 | Cobalt | 223 | ||
| 16.1.3 | Copper | 224 | ||
| 16.2 | Market Prices | 225 | ||
| 16.2.1 | Metal Prices – IA | 225 | ||
| 16.2.2 | Metal Prices – Mineral Resource Estimate | 225 | ||
| 16.2.3 | Price Sensitivities | 225 | ||
| 16.3 | Concentrate and Refined Products Marketing | 226 | ||
| 16.3.1 | Concentrate Marketing | 226 | ||
| 16.3.2 | Refinery Marketing | 228 | ||
| 16.3.3 | Refinery Product Specifications | 228 | ||
| 16.4 | QP Opinion | 228 | ||
| 17 | ENVIRONMENTAL STUDIES, PERMITTING, AND PLANS, NEGOTIATIONS, OR AGREEMENTS WITH LOCAL INDIVIDUALS OR GROUPS | 229 | ||
| 17.1 | Summary | 229 | ||
| 17.2 | Licensing Conditions | 229 | ||
| 17.2.1 | Permitting Requirements | 230 | ||
| 17.2.2 | Required Bonds | 230 | ||
| 17.3 | Environmental, Social and Cultural Impact Assessments | 231 | ||
| 17.3.1 | Environmental, Social and Cultural Impact Assessment Background | 231 | ||
| 17.3.2 | Project ESIAs and Baseline Studies | 231 | ||
| 17.3.3 | Environmental, Social and Cultural Baseline Assessment Summary | 232 | ||
| 17.4 | Stakeholder Engagement Considerations | 239 | ||
| 17.5 | Land Access and Resettlement | 239 | ||
| 17.5.1 | Overview | 239 | ||
| 17.5.2 | Resettlement Action Plan | 239 | ||
| 17.5.3 | Stakeholder Engagement | 239 | ||
| 17.5.4 | Compensation Agreements and Process | 239 | ||
| 17.5.5 | Livelihood Restoration | 240 | ||
| 17.5.6 | Land Acquisition and Management Strategy | 240 | ||
| 17.5.7 | Relocation and Land Access Risk Assessment | 241 | ||
| 17.6 | Mine and Facility Closure, Remediation and Reclamation | 241 | ||
| 17.6.1 | Mine and Facility Closure | 241 | ||
| 17.6.2 | Tailings Management and Closure | 242 | ||
| 17.7 | QP Opinion | 242 | ||
| 18 | CAPITAL AND OPERATING COSTS | 243 | ||
| 18.1 | Capital Cost Estimates | 243 | ||
| 18.1.1 | Pre-Production Capex | 244 | ||
| 18.1.2 | Growth Capital | 245 | ||
| 18.1.3 | Sustaining Capital | 245 | ||
| 18.1.4 | Contingency | 246 | ||
| 18.1.5 | Capital Estimate Exclusions | 246 | ||
| 18.2 | Operating Costs | 247 | ||
| 18.2.1 | 2000 - Mining | 247 | ||
| 18.2.2 | A3000/A6000 – Concentrator and Infrastructure | 247 | ||
| 18.2.3 | A5000 – Kahama Refinery | 247 | ||
| 18.2.4 | A8000 – Owner’s Cost, Admin and Overheads | 248 | ||
| 18.2.5 | Product Logistics | 248 | ||
Page
|
/ / Initial Assessment - Technical Report Summary |
|
| 19 | ECONOMIC ANALYSIS | 249 | ||
| 19.1 | General Description | 249 | ||
| 19.2 | Forward-looking Statements | 250 | ||
| 19.3 | Assumptions and Inputs | 251 | ||
| 19.3.1 | Metal Pricing | 251 | ||
| 19.3.2 | Discounting | 251 | ||
| 19.3.3 | General | 251 | ||
| 19.3.4 | Taxes, Duties, Levies, and Depreciation | 251 | ||
| 19.3.5 | Royalties | 253 | ||
| 19.3.6 | Working Capital | 253 | ||
| 19.4 | Economic Analysis Results | 253 | ||
| 19.4.1 | Overview | 253 | ||
| 19.4.2 | Project Economics | 253 | ||
| 19.4.3 | Production Summary | 255 | ||
| 19.4.4 | Sensitivity Analysis | 261 | ||
| 20 | ADJACENT PROPERTIES | 263 | ||
| 21 | OTHER RELEVANT DATA AND INFORMATION | 263 | ||
| 22 | INTERPRETATION AND CONCLUSIONS | 264 | ||
| 22.1 | Geology and Mineral Resources | 264 | ||
| 22.2 | Mining Methods | 264 | ||
| 22.3 | Hydrogeology and Groundwater Modeling | 264 | ||
| 22.4 | Geochemistry | 264 | ||
| 22.5 | Metallurgy and Process | 264 | ||
| 22.5.1 | Kabanga Concentrator | 264 | ||
| 22.5.2 | Kahama Refinery | 265 | ||
| 22.6 | Infrastructure | 265 | ||
| 22.6.1 | Water | 266 | ||
| 22.6.2 | TSF | 266 | ||
| 22.7 | Environmental | 266 | ||
| 22.8 | Market Studies | 266 | ||
| 22.9 | Economic Analysis | 267 | ||
| 22.10 | Risks and Uncertainties | 267 | ||
| 23 | RECOMMENDATIONS | 268 | ||
| 23.1 | Geology and Mineral Resources | 268 | ||
| 23.2 | Mining Methods | 268 | ||
| 23.3 | Hydrogeology and Surface Water | 268 | ||
| 23.4 | Metallurgy and Processing | 268 | ||
| 23.4.1 | Kabanga Concentrator | 268 | ||
| 23.4.2 | Kahama Refinery | 268 | ||
| 23.5 | Infrastructure | 269 | ||
| 23.5.1 | Kabanga Site | 269 | ||
| 23.5.2 | Kahama Site | 269 | ||
| 23.5.3 | Logistics | 269 | ||
| 23.6 | Environmental and Social Studies, Permitting and Plans | 269 | ||
| 23.7 | Economic Analysis | 269 | ||
| 23.8 | The Project Work Plan and Costs for Recommended Work | 269 | ||
| 23.8.1 | QP Opinion – Geology and Mineral Resources | 270 | ||
| 23.8.2 | QP Opinion – Other | 270 | ||
| 24 | REFERENCES | 271 | ||
| 25 | RELIANCE ON INFORMATION PROVIDED BY THE REGISTRANT | 278 | ||
| EFFECTIVE DATE AND QP SIGNATURE PAGE | 279 | |||
| GLOSSARY | 280 | |||
Page
|
/ / Initial Assessment - Technical Report Summary |
|
LIST OF TABLES
| Table 1-1: Kabanga Mineral Resource Estimates as at December 4, 2024 – Tonnes and Grade | 32 |
| Table 1-2: Kabanga Mineral Resource Estimates as at December 4, 2024 –Contained Metals | 33 |
| Table 1-3: Kabanga Long-Term Metal Price Assumptions | 39 |
| Table 1-4: Kabanga Concentrate Typical Specification | 39 |
| Table 1-5: Project Capital Cost Estimate Summary | 42 |
| Table 1-6: Operating Cost Estimate Summary | 42 |
| Table 1-7: Key Project Metrics | 43 |
| Table 2-1: Qualified Persons’ Responsibility Breakdown per Section | 47 |
| Table 2-2: QP Site Inspection Details – Sharron Sylvester | 49 |
| Table 2-3: QP Site Inspection Details – DRA | 49 |
| Table 7-1: Exploration Drilling Summary | 73 |
| Table 7-2: Downhole Survey Statistics for North and Tembo – Survey Method | 79 |
| Table 7-3: Downhole Survey Statistics for North and Tembo – Location | 79 |
| Table 7-4: Safari Link Exploration Target Range Estimates | 86 |
| Table 7-5: Summary of Kabanga Nickel Project Exploration Target Estimates | 90 |
| Table 8-1: Summary of Analytical Techniques for Mineral Resource Drilling | 93 |
| Table 8-2: Frequency of QA/QC Samples 2005–09 | 94 |
| Table 8-3: Kabanga CRMs – Accepted Grades | 101 |
| Table 8-4: Kabanga CRMs – Tracking of Ni% Results 2005–09 | 102 |
| Table 8-5: Kabanga Massive Sulfide CRM – Tracking of Ni% Results by Phase | 103 |
| Table 8-6: Kabanga CRMs – Summary Statistics 2005–09 | 104 |
| Table 8-7: ALS-Chemex Internal Reference Material Standards – Tracking of Ni% Results 2005–09 | 104 |
| Table 8-8: ALS-Chemex Internal Forrest B Standard – Summary Statistics 2005–09 | 105 |
| Table 10-1: Summary of Historical Mini Pilot Plant Mass Balance Results | 111 |
| Table 10-2: Concentrator Tembo Testwork Sample Intervals | 114 |
| Table 10-3: Concentrator North Testwork Sample Intervals | 116 |
| Table 10-4: Summary of Test Data Used for Concentrator Recovery Modeling | 122 |
| Table 10-5: MSSX Recovery Algorithms Based on Mill Feed | 127 |
| Table 10-6: UMAF_1a Recovery Algorithms Based on Mill Feed | 128 |
| Table 10-7: MII Plan Concentrator Summary Mass Balance | 128 |
Page
|
/ / Initial Assessment - Technical Report Summary |
|
| Table 10-8: Concentrate Samples – Feed Blends | 132 |
| Table 10-9: Summary of POX Extractions – Pilot Plant versus Bench-Scale Testwork | 134 |
| Table 10-10: Projected Refinery Recoveries | 135 |
| Table 11-1: Grade Estimation Search Parameters | 148 |
| Table 11-2: Kabanga Metal Prices | 157 |
| Table 11-3: NiEq24 MSSX Input Parameters | 157 |
| Table 11-4: NiEq24 UMAF Input Parameters | 158 |
| Table 11-5: Concentrator Recoveries and Mass Pull Assumptions | 159 |
| Table 11-6: 2024 Cut-off Grade Assumptions | 162 |
| Table 11-7: 2025 IA Sensitivity Assumptions | 163 |
| Table 11-8: Kabanga Mineral Resource Estimates as at December 4, 2024 | 165 |
| Table 11-9: Kabanga Mineral Resource Estimates – Massive Sulfide (subset of Table 11-8) as at December 4, 2024 | 166 |
| Table 11-10: Kabanga Mineral Resource Estimates – Ultramafic1 (subset of Table 11-8) as at December 4, 2024 | 167 |
| Table 11-11: Kabanga Mineral Resource Estimates – Showing Contained Metals as at December 4, 2024 | 168 |
| Table 11-12: Kabanga Mineral Resource Estimates Comparison – Tonnes and Grades | 170 |
| Table 11-13: Kabanga Mineral Resource Estimates Comparison – Contained Metals | 171 |
| Table 13-1: Potential Mill Feed | 173 |
| Table 13-2: Potential Mill Feed Proportion by Zone | 173 |
| Table 13-3: Details of Ground Support Scheme Elements Used | 174 |
| Table 13-4: Material Strength Results from Laboratory Testing | 176 |
| Table 13-5: North Mine Unsupported Stope Span Configuration | 177 |
| Table 13-6: Tembo Mine Unsupported Stope Span Configuration | 178 |
| Table 13-7: Main Mine Unsupported Stope Span Recommendations | 178 |
| Table 13-8: NSR and Stope Optimization Assumptions | 180 |
| Table 13-9: Stope Parameters | 181 |
| Table 13-10: Typical Development Profiles | 182 |
| Table 13-11: Unplanned Dilution Values Applied to North and Main Stopes | 184 |
| Table 13-12: Lateral Development Productivity Rates | 184 |
| Table 13-13: Stope Tonnage and Associated Productivity Rate | 185 |
| Table 13-14: Mobile Equipment List | 186 |
| Table 13-15: Kabanga Backfill Requirements | 187 |
| Table 13-16: Primary Fesh Air Estimates | 190 |
| Table 13-17: Primary Return Air Estimates | 190 |
Page
|
/ / Initial Assessment - Technical Report Summary |
|
| Table 13-18: Ventilation Infrastructure | 191 |
| Table 13-19: Maximum Mining Labor Requirements | 192 |
| Table 13-20: Proposed Mill Feed by Mineral Resource Category | 194 |
| Table 13-21: Potential Mill Feed without Inferred Mineral Resource | 196 |
| Table 14-1: Key Concentrator Process Design Criteria | 199 |
| Table 16-1: Kabanga Metal Prices – IA Economic Assessment | 225 |
| Table 16-2: Kabanga Metal Prices – 2024MRU | 225 |
| Table 16-3: Kabanga Concentrate Typical Specification | 227 |
| Table 16-4: Projected Kahama Nickel Sulfate Specification | 228 |
| Table 16-5: Projected Kahama Cobalt Sulfate Specification | 228 |
| Table 17-1: Summary of the Project EIAs, ESIAs, ESMPs | 231 |
| Table 18-1: Project Capital Cost Estimate Summary | 243 |
| Table 18-2: Foreign Exchange Rates | 244 |
| Table 18-3: Average Project Operating Cost Estimate Summary | 247 |
| Table 19-1: Metal Prices | 251 |
| Table 19-2: The Project’s Cash Flow Summary | 254 |
| Table 19-3: Key Project Metrics | 254 |
| Table 19-4: Preliminary Production Summary | 255 |
| Table 19-5: Project All-in Sustaining Costs | 256 |
| Table 19-6: Mining, Concentrator and G&A Operating Costs | 257 |
| Table 19-7: Project Net Present Value and Discount Rate | 258 |
| Table 19-8: Summary of Project LoM Annual Cash Flow (with Inferred Mineral Resources) | 259 |
| Table 19-9: Summary of Project LoM Annual Cash Flow (without Inferred Mineral Resources) | 260 |
| Table 23-1: Summary of Costs for Recommended Work | 270 |
Page
|
/ / Initial Assessment - Technical Report Summary |
|
LIST OF FIGURES
| Figure 1-1: Kabanga Nickel Project Location in Tanzania | 23 |
| Figure 1-2: Kabanga Special Mining Licence (SML), Site Project Footprint, Resettlement Sites and Southern Access Road | 24 |
| Figure 1-3: Kahama Site at the Buzwagi SEZ | 25 |
| Figure 1-4: Current Ownership Structure of the Kabanga Nickel Project | 26 |
| Figure 1-5: Mine Design and Sequence (in years) | 34 |
| Figure 1-6: Typical Mine Design – North Mine (Isometric 3D) | 35 |
| Figure 1-7: Project Cash Flows (with Inferred Mineral Resources) | 43 |
| Figure 1-8: Project Cash Flows (without Inferred Mineral Resources) | 44 |
| Figure 3-1: Kabanga Nickel Project Location in Tanzania | 50 |
| Figure 3-2: Current Ownership Structure of the Kabanga Nickel Project | 51 |
| Figure 3-3: Location of the Proposed Mine Site showing SML 651/2021 | 53 |
| Figure 4-1: Kamaha Location relative to Mwanza, Kabanga Site and Isaka Dry Port | 58 |
| Figure 6-1: Stratigraphic Column for the Kagera Supergroup | 65 |
| Figure 6-2: Plan View Schematic of Geology of the Kabanga Area (UTM) | 66 |
| Figure 6-3: Typical Stratigraphy Cross-Section Schematics for North and Tembo (local grid) | 67 |
| Figure 6-4: Schematic Projected Long-Section of the Kabanga Mineralized Zones (truncated UTM, looking northwest) | 68 |
| Figure 6-5: Example Schematic Cross-Section* of Mineralization Geometry at Main Zone (truncated UTM) | 69 |
| Figure 6-6: Example Schematic Cross-section* of Mineralization Geometry at MNB Zone (truncated UTM) | 70 |
| Figure 6-7: Example Schematic Cross-section* of Mineralization Geometry at North Zone (with Kima) (truncated UTM) | 71 |
Page
|
/ / Initial Assessment - Technical Report Summary |
|
| Figure 6-8: Example Schematic Cross-section* of Mineralization Geometry at Tembo Zone (truncated UTM) | 72 |
| Figure 7-1: Kabanga Drillhole Locations Proximal to Mineral Resources (truncated UTM) | 81 |
| Figure 7-2: Comparison of Water Immersion Density vs. Pycnometry Specific Gravity for Massive Sulfide | 83 |
| Figure 7-3: Pycnometer Specific Gravity Measurements for Massive Sulfide in North and Tembo | 84 |
| Figure 7-4: Pycnometer Specific Gravity Measurements for UMAF_1a in North and Tembo | 84 |
| Figure 7-5: Location of Safari Link and Safari Extension Exploration Targets with Airborne VTEM Background and Interpreted Major Faults | 87 |
| Figure 7-6: Location of Rubona Hill and Block 1 South Target Areas | 88 |
| Figure 7-7: Rubona Hill MVI Magnetic Contours at 1,200 m Elevation with Historical Holes and Proposed Priority Hole | 88 |
| Figure 7-8: Magnetic Vector Inversion (MVI) Model of Rubona Hill Target with Proposed Drillhole Intercepts | 89 |
| Figure 7-9: Block 1 South Target Potential | 90 |
| Figure 8-1: Percent Reject Passing –2 mm Screen – 2005–09 | 95 |
| Figure 8-2: ALS-Chemex – Percent Relative Difference for Ni Duplicates – 2005–09 | 95 |
| Figure 8-3: ALS-Chemex – Percent Relative Difference for Cu Duplicates – 2005–09 | 96 |
| Figure 8-4: ALS-Chemex – Percent Relative Difference for Co Duplicates – 2005–09 | 96 |
| Figure 8-5: Genalysis vs. ALS-Chemex Pulp Check Assays Percent Relative Difference for Ni Grades 2005–09 – Sequential Analysis for Massive Sulfide Ni > 2% | 97 |
| Figure 8-6: Genalysis vs. ALS-Chemex Pulp Check Assays Percent Relative Difference for Ni Grades 2005–09 | 98 |
| Figure 8-7: Genalysis vs. ALS-Chemex Pulp Check Assays Percent Relative Difference for Cu Grades 2005–09 | 98 |
| Figure 8-8: Genalysis vs. ALS-Chemex Pulp Check Assays Percent Relative Difference for Co Grades 2005–09 | 99 |
| Figure 8-9: SGS Lakefield vs. ALS-Chemex Pulp Check Assays Percent Relative Difference for Ni Grades | 99 |
| Figure 8-10: ALS-Chemex – Percent Relative Difference for Ni Grades for Quarter Core Replicates – 2005–07 | 100 |
| Figure 8-11: ALS-Chemex – Percent Relative Difference for Cu Grades for Quarter Core Replicates – 2005–07 | 100 |
| Figure 8-12: ALS-Chemex – Percent Relative Difference for Co Grades for Quarter Core Replicates – 2005–07 | 101 |
| Figure 8-13: Kabanga Massive Sulfide CRM Ni Values 2005–09 | 102 |
| Figure 8-14: Kabanga Ultramafic CRM Ni Values 2005–09 | 102 |
| Figure 8-15: Kabanga Massive Sulfide CRM Ni% Values by Genalysis 2005–09 | 103 |
| Figure 8-16: ALS-Chemex Internal Forrest B Standard – Results from 2005–09 | 104 |
| Figure 8-17: Kabanga MSSX CRM Cu Values 2005–09 | 105 |
| Figure 8-18: Kabanga UMAF CRM Cu Values 2005–09 | 106 |
| Figure 8-19: Kabanga MSSX CRM Co Values 2005–09 | 106 |
| Figure 8-20: Kabanga UMAF CRM Co Values 2005–09 | 107 |
Page
|
/ / Initial Assessment - Technical Report Summary |
|
| Figure 8-21: Blanks – Ni Results 2005–09 | 107 |
| Figure 10-1: Summary of Historical MPP Testwork Grade Recovery Curves | 112 |
| Figure 10-2: Example of Concentrator Metallurgical Testwork Drill Core Intervals | 113 |
| Figure 10-3: MSSX Metallurgical Testwork Sample Locations | 118 |
| Figure 10-4: UMAF_1a Metallurgical Testwork Sample Locations | 118 |
| Figure 10-5: Nickel Recovery as a Function of Feed Grade: Modeling Output versus Testwork Performance | 124 |
| Figure 10-6: Nickel Recovery as a Function of Concentrate Upgrade Ratio: Modeling Output versus Testwork Performance | 124 |
| Figure 10-7: Cobalt Flotation Recovery as a Function of Nickel Recovery | 125 |
| Figure 10-8: Copper Flotation Recovery as a Function of Copper Feed Grade | 125 |
| Figure 10-9: Pyrrhotite Concentrate Iron Grade as a Function of Iron in Feed | 126 |
| Figure 10-10: Pyrrhotite Concentrate Mass Pull as a Function of Iron in Feed | 127 |
| Figure 10-11: Concentrator Production Profile (MII Plan) | 129 |
| Figure 10-12: Concentrate Tonnage and Contained Nickel Profile (MII Plan) | 130 |
| Figure 10-13: POX Kinetics (Test No. KABA-0145) | 133 |
| Figure 11-1: Schematic Projected Long-Section of the Kabanga Mineralized Zones (looking northwest) | 137 |
| Figure 11-2: Ni Box Plot for all Assayed Lithologies – All Zones | 138 |
| Figure 11-3: Pie Chart of Assayed Lithologies – North Zone | 139 |
| Figure 11-4: Box Plots for a Suite of Elements for the Three Predominant Mineralization Types – North Zone | 140 |
| Figure 11-5: Pie Chart of Assayed Lithologies – Tembo Zone | 141 |
| Figure 11-6: Box Plots for a Suite of Elements for the Three Predominant Mineralization Types – Tembo Zone | 142 |
| Figure 11-7: Box Plot of Grades (Co, Cu, Ni, and S) for North Zone | 143 |
| Figure 11-8: Box Plot of Grades (Co, Cu, Ni, and S) for Tembo Zone | 143 |
| Figure 11-9: Histograms of Sample Lengths –North Zone (where assayed) | 144 |
| Figure 11-10: Histograms of Sample Lengths – Tembo Zone (where assayed) | 145 |
| Figure 11-11: Contact Plots for Ni% Across INTRUSIV:UMAF Boundary | 146 |
| Figure 11-12: Contact Plots for Ni% Across UMAF:MSSX Boundary | 146 |
| Figure 11-13: Example Cross-section* of Ni% Grade Estimates at North Zone (shows Kima) | 151 |
| Figure 11-14: Example Cross-section* of Ni% Grade Estimates at Tembo Zone | 152 |
| Figure 11-15: Example Swath Plots – Ni% Along Strike for North Zone MSSX and UMAF | 153 |
| Figure 11-16: Example Swath Plots – Ni% Along Strike for Tembo Zone MSSX and UMAF | 154 |
Page
|
/ / Initial Assessment - Technical Report Summary |
|
| Figure 11-17: Schematic Projected Long-section of the Kabanga Classification (truncated UTM, looking northwest) | 156 |
| Figure 11-18: MSSX and UMAF Concentrator Nickel Recoveries | 159 |
| Figure 11-19: MSSX and UMAF Concentrator Copper Recoveries | 160 |
| Figure 11-20: MSSX and UMAF Concentrator Cobalt Recoveries | 160 |
| Figure 11-21: MSSX and UMAF Concentrate Nickel Grade | 161 |
| Figure 11-22: MSSX and UMAF Mass PulTl | 161 |
| Figure 13-1: Long-section of the Resource Case Mine Design | 173 |
| Figure 13-2: Kabanga AE Measurement Results Compared to WASM Dataset (a) Ratio of average horizontal to vertical stress (b) Principal stress magnitude chart comparison | 175 |
| Figure 13-3: North Mine and Tembo Mine Groundwater Ingress | 179 |
| Figure 13-4: Stope Optimizer NSR Cut-off Grade by Zone | 180 |
| Figure 13-5: Typical Mine Design at North Mine | 181 |
| Figure 13-6: Longitudinal and Transverse Stoping at North (Oblique 3D) | 182 |
| Figure 13-7: Typical Level Plan – North Mine | 183 |
| Figure 13-8: Typical Level Plan – Tembo Mine | 183 |
| Figure 13-9: Schematic of North Mining Sequence | 185 |
| Figure 13-10: Schematic of Tembo Mining Sequence | 186 |
| Figure 13-11: In-level Filling Arrangement | 188 |
| Figure 13-12: Typical Cross Section Showing the Proposed Tight Filling Strategy | 189 |
| Figure 13-13: Ventilation Rise Locations | 190 |
| Figure 13-14: Example of Safescape Ladder System | 191 |
| Figure 13-15: Escapeway Raise Locations | 192 |
| Figure 13-16: Production Cycle Example | 193 |
| Figure 13-17: Lateral Development by Year | 193 |
| Figure 13-18: Vertical Development by Year | 194 |
| Figure 13-19: Mining Sequence by Year | 194 |
| Figure 13-20: Kabanga Long-Section by Mineral Resource Category | 195 |
| Figure 13-21: MII Production Schedule by Mineral Resource Category | 195 |
Page
|
/ / Initial Assessment - Technical Report Summary |
|
| Figure 13-22: MII Production Schedule by Mining Type | 195 |
| Figure 13-23: MII Production Schedule by Source | 196 |
| Figure 13-24: MI Production Schedule by Source | 196 |
| Figure 14-1: Simplified Concentrator Process Flowsheet | 199 |
| Figure 14-2: Concentrator 3D Model Layout | 203 |
| Figure 14-3: Kahama Refinery Simplified Process Flowsheet | 205 |
| Figure 15-1: Kabanga Site Layout (including TSF) | 213 |
| Figure 15-2: Kabanga Proposed Logistics Route | 221 |
| Figure 15-3: SGR Rail Locomotives | 222 |
| Figure 17-1: Kabanga Project Area and Affected Communities | 233 |
| Figure 17-2: Kahama Site Local Setting | 235 |
| Figure 17-3: Proposed Kahama Site adjacent existing Buzwagi Mine | 236 |
| Figure 17-4: Kabanga Site Project Area and Resettlement Sites | 238 |
| Figure 19-1: Production Schedule with Inferred Mineral Resources | 249 |
| Figure 19-2: Production Schedule without Inferred Mineral Resources | 250 |
| Figure 19-3: Project Cash Flows (with Inferred Mineral Resources) | 257 |
| Figure 19-4: Project Cash Flows (without Inferred Mineral Resources) | 257 |
| Figure 19-5: Sensitivity Analysis of Post-Tax NPV (with Inferred Mineral Resources) | 261 |
| Figure 19-6: Sensitivity Analysis of Post-Tax NPV (without Inferred Mineral Resources) | 261 |
| Figure 19-7: Sensitivity Analysis of Post-Tax IRR (with Inferred Mineral Resources) | 262 |
| Figure 19-8: Sensitivity Analysis of Post-Tax IRR (without Inferred Mineral Resources) | 262 |
Page
|
/ / Initial Assessment - Technical Report Summary |
|
ABBREVIATIONS
Abbreviation |
Definition |
| AACE | Association for the Advancement of Cost Engineering |
| AAS | Atomic Absorption Spectroscopy |
| AE | Acoustic Emission |
| Ai | Bond Abrasion Index |
| AISC | all-in sustaining cost |
| ALS | ALS Metallurgy Pty Ltd |
| ANCOLD | Australian National Committee on Large Dams |
| AARL | Anglo American Research Laboratories |
| BAC | bulk air cooler |
| BECO | Break-even Cut-off |
| BHEM | Borehole Electromagnetic |
| BHP | BHP Billiton (UK) DDS Limited (also refers to BHP Group, subsidiaries & ancestors) |
| BNPU | Banded Pelite stratigraphic unit |
| BV | Bureau Veritas Minerals Pty Ltd |
| BWi | Bond Ball Mill Work Index |
| CET | Common External Tariff |
| CIF | Cost, Insurance and Freight (Incoterms® 2020) |
| CIT | corporate income tax |
| Co | cobalt |
| CoSX | Cobalt Solvent Extraction |
| CRM | Certified Reference Material |
| CSR | Corporate Social Responsibility |
| CRU | CRU International Ltd |
| Cu | copper |
| CuSO4 | copper sulfate |
| CuSX | copper solvent extraction |
| CWi | Bond crusher work index |
| DFS | Definitive Feasibility Study |
| DRA | DRA Projects (Pty) Ltd |
| DRC | Democratic Republic of the Congo |
| DSX | Direct Solvent Extraction |
| DWT | deadweight tonnage |
| EBSP | Economic Benefit Sharing Principle |
| EDH | economically displaced households |
| EIA | Environmental Impact Assessment |
| EIS | Environmental Impact Statement |
| EM | electromagnetic |
| EPCM | Engineering, Procurement and Construction Management |
| ESG | Environmental, Social and Governance |
| ESIA | Environmental and Social Impact Assessment |
Page
|
/ / Initial Assessment - Technical Report Summary |
|
Abbreviation |
Definition |
| ESMP | Environmental and Social Management Plan |
| ESS | Energy Storage Systems |
| EU | European Union |
| EV | electric vehicle |
| EW | electrowinning |
| FAR | fresh air raise |
| FBC | Flexible Bulk Container |
| FID | Final Investment Decision |
| FW | footwall |
| FS | Feasibility Study |
| G&A | General and Administrative |
| GAB | gabbro lithology |
| GAB_KAB | generally unmineralized gabbro/gabbronorite in the Karagwe-Ankole Belt |
| GISTM | Global Industry Standard on Tailings Management |
| Golder | Golder Associates Inc. |
| GoT | Government of Tanzania |
| H2SO4 | sulfuric acid |
| HCFT | High Confidence Flotation Test |
| HCl | hydrochloric acid |
| HDPE | high-density polyethylene |
| HIV | Human Immunodeficiency Virus |
| HW | hanging wall |
| IBIS | IBIS Consulting |
| ICMM | International Council on Mining and Metals |
| ICP | Inductively Coupled Plasma Spectroscopy Analytical Technique |
| ICP-MS | Inductively Coupled Plasma Mass Spectroscopy |
| ICP-OES | Inductively Coupled Plasma Optical Emission Spectroscopy |
| IFC | International Finance Corporation |
| IFC PS | International Finance Corporation Performance Standards |
| IRR | internal rate of return |
| ISO | International Organization for Standardization |
| JFM | Joint Financial Model |
| JV | Joint Venture |
| KAB | Karagwe-Ankole Belt |
| KNCL | Kabanga Nickel Company Limited (pre-Lifezone ownership) |
| KNL | Kabanga Nickel Limited |
| KUWASA | Kahama Urban Water Supply and Sanitation Authority |
| LCT | locked-cycle test |
| LFP | lithium iron phosphate |
| LME | London Metal Exchange |
| LoM | life of mine |
| LRP | Livelihood Restoration Plan |
Page
|
/ / Initial Assessment - Technical Report Summary |
|
Abbreviation |
Definition |
| LRPU | Lower Pelite stratigraphic unit |
| LSSC | Lower Spotted Schist stratigraphic unit |
| LZM | Lifezone Metals Limited |
| M&E | monitoring and evaluation |
| MAF | generic mafic lithology |
| MCC | motor control center |
| MHP | mixed hydroxide precipitate |
| MIA | mine infrastructure area |
| MI | Measured and Indicated Mineral Resource Classifications |
| MII | Measured, Indicated and Inferred Mineral Resource Classifications |
| MineFill | MineFill Services Pty Ltd |
| MP-AES | Microwave Plasma Atomic Emission Spectroscopy |
| MPP | mini pilot plant |
| MRE | Mineral Resource Estimate |
| MRU | Mineral Resource Update |
| MSP | mixed sulfide precipitate |
| MSSX | massive sulfide mineralization |
| MSXI | massive sulfide mineralization with xenolith intrusions |
| MVR | mechanical vapor recompression |
| NATA | National Association of Testing Authorities |
| NEMC | National Environment Management Council |
| Ni | nickel |
| NiEq | nickel equivalent |
| NiSO4.6H2O | nickel sulfate hexahydrate |
| NMC | nickel manganese cobalt |
| No. | number |
| NPV | net present value |
| NSR | net sales return |
| OHL | overhead line (power) |
| OOG | out of gauge |
| OreWin | OreWin Pty Ltd |
| PAF | Paste Aggregate Fill |
| PAH | project-affected household |
| PAP | project-affected person |
| pCAM | precursor cathode active material |
| PCD | pollution control dam |
| PDC | process design criteria |
| PDH | physically displaced household |
| PEX | potassium ethyl xanthate |
| PFS | Pre-feasibility Study |
| PLS | pregnant leach solution |
| POX | pressure oxidation |
Page
|
/ / Initial Assessment - Technical Report Summary |
|
Abbreviation |
Definition |
| PSA | Particle Size Analyzer |
| PSD | particle size distribution |
| PSWP | plant site water pond |
| QA/QC | Quality Assurance/Quality Control |
| QP | Qualified Person |
| RAP | Resettlement Action Plan |
| RAR | Return Air Raise |
| RFL | Refining Licence |
| RO | reverse osmosis |
| RoM | run-of-mine |
| RWG | Resettlement Working Group |
| SADC | Southern African Development Community |
| SEC | U.S. Securities and Exchange Commission |
| SEZ | Special Economic Zone |
| SGR | Standard Gauge Rail |
| SI | International System of Units |
| SML | Special Mining Licence |
| SMM | Shanghai Metals Market |
| SO4 | sulfate |
| SQUID | Superconducting Quantum Interference Device |
| SX | Solvent Extraction |
| TAA | Tanzania Airports Authority |
| TANESCO | Tanzania Electric Supply Company Limited |
| TANROADS | Tanzania National Roads Agency |
Page
|
/ / Initial Assessment - Technical Report Summary |
|
Abbreviation |
Definition |
| TAZARA | Tanzania-Zambia Railway Authority |
| TEM | Transient Electromagnetic |
| TML | Transportable Moisture Limit |
| TNCL | Tembo Nickel Corporation Limited |
| TRC | Tanzania Railways Corporation |
| TRS | Technical Report Summary (as defined in S-K 1300) |
| TSF | tailings storage facility |
| UCS | uniaxial compressive strength |
| UMAF | generic ultramafic lithological unit |
| UMAF_1a | ultramafic-hosted mineralization |
| UMAF_KAB | unmineralized ultramafic |
| UMIN | mineralized UMAF (i.e., UMAF_1a (used as a coding field in Resource modeling work) |
| UNDP | United Nations Development Programme |
| URT | United Republic of Tanzania |
| USD | United States dollars |
| VSD | variable speed drive |
| VTEM | Versatile Time Domain Electromagnetic |
| WASM | Western Australia School of Mines |
| WRD | waste rock dump |
| WSP (AUS) | WSP Australia Ltd |
| WSP (NZ) | WSP New Zealand Ltd |
| WSP (SA) | WSP South Africa (Pty) Ltd |
| WTP | water treatment plant |
| XPS | Xstrata Process Solutions |
| XRF | X-ray Fluorescence |
Page
|
/ / Initial Assessment - Technical Report Summary |
|
UNITS OF MEASURE
Abbreviation |
Definition |
| µm | micrometer/micron |
| Ø | diameter |
| DWT | deadweight tonnage |
| h | hour |
| ha | hectare |
| kg | kilogram |
| kg/m2h | kilogram per square meter per hour |
| km | kilometer |
| kPa(g) | kilo pascal (gauge) |
| ktpa | kilotonnes (metric) per annum |
| kV | kilovolt |
| kVA | kilovolt ampere |
| kWh/t | kilowatt hour per metric tonne |
| L/s | liters per second |
| L | liter |
| m | meter |
| m2 | square meter |
| m3 | cubic meter |
| M | million (mega) |
| Ma | one million years |
| mAMSL | meter above mean sea level |
| mBS | meters below surface |
| min | minute |
| Mm3 | million cubic meters |
| Mtpa | million tonnes (metric) per annum |
| MVA | Megavolt-Amperes |
| MW | Megawatts |
| MWc | Megawatt cooling |
| pH | Quantitative measure of the acidity or basicity of aqueous or other liquid solutions. |
| °C | degrees Celsius |
| t | tonne (metric) |
| tpa | tonnes (metric) per annum |
| tph | tonnes (metric) per hour |
| V | Volts |
| w/w | weight by weight |
SYSTEM OF UNITS
The International System of Units (SI), the metric system, will be used throughout the design in all documentation, specifications, drawings, reports and all other documents associated with the study.
Page
|
/ / Initial Assessment - Technical Report Summary |
|
| 1 | EXECUTIVE SUMMARY |
| 1.1 | Introduction |
DRA Projects (Pty) Ltd (DRA) and OreWin Pty Ltd (OreWin) were engaged by Lifezone Metals Limited (NYSE LZM) (hereafter referred to as “LZM”) to prepare an independent Initial Assessment (IA) Technical Report Summary (TRS) for the Kabanga Nickel Project (hereafter referred to as “the Project”), located in northwest Tanzania. This TRS provides supplemental technical and economic information to support the Mineral Resource Update (MRU) disclosed in LZM’s prior TRS dated December 4, 2024. The TRS was prepared in accordance with the United States Securities and Exchange Commission’s (SEC) Modernized Property Disclosure Requirements under Subpart 229.1300 of Regulation S-K (S-K 1300) and Item 601(b)(96). The purpose of this IA is to provide a preliminary indication that the Project may have potential for technically viable and economically favorable development based on the current Mineral Resources estimate. The IA is intended to serve as a foundation for demonstrating the overall staged development strategy, including advancing the Project to a Feasibility Study (FS), and subsequently, to detailed design, execution, and operation.
The Project, in which LZM holds a 69.713% ownership interest, is a fully integrated, greenfield development that will produce nickel, copper, and cobalt products for the global market. Designed to deliver strong financial returns, the Project is also expected to generate social and economic benefits for local communities. As one of the world’s largest undeveloped high-grade nickel sulfide deposits, the Project offers a strategically important, unencumbered source of nickel ideally suited for the evolving electric vehicle (EV) battery supply chain.
The Project represents a globally significant opportunity aligned with the accelerating transition to a low-carbon economy, driven by the rising demand for responsible and ethically sourced battery minerals essential to EVs and energy storage systems. The Project is positioned to deliver both strategic value to the global supply chain and meaningful economic and social benefits to Tanzania and its citizens.
| 1.2. | Property Description, Mineral Tenure, Ownership, Surface Rights, Royalties, Agreements and Permits |
The Project is located in the northwest of Tanzania, approximately 1,300 km northwest of Dar es Salaam, adjacent to the Burundi border (see Figure 1-1). The Project comprises two sites, the Kabanga Mine and Concentrator and associated infrastructure (hereafter known as “Kabanga Site”) and the Kahama Hydrometallurgical Refinery (hereafter known as the “Refinery”) and associated infrastructure (collectively known as “Kahama Site”), which will be operational five years after first concentrate production.

Figure 1-1: Kabanga Nickel Project Location in Tanzania The Kabanga Site will see the development of an underground mine and the construction of a concentrator, tailings storage facility (TSF), and the associated infrastructure.
Page
|
/ / Initial Assessment - Technical Report Summary |
|
The site is reached by 77 km of unpaved public road (Southern Access Road) from the paved National Route B3 (see Figure 1-2). Grid electricity (33 kV, 9 MVA) is currently supplied to the site by the Tanzania Electric Supply Company Limited (TANESCO) and is sufficient for construction and initial mine development. The development of the site includes the resettlement of economically displaced households (EDHs) and physically displaced households (PDHs) onto seven identified relocation host sites (hereafter known as the “Kabanga Resettlement Sites”).
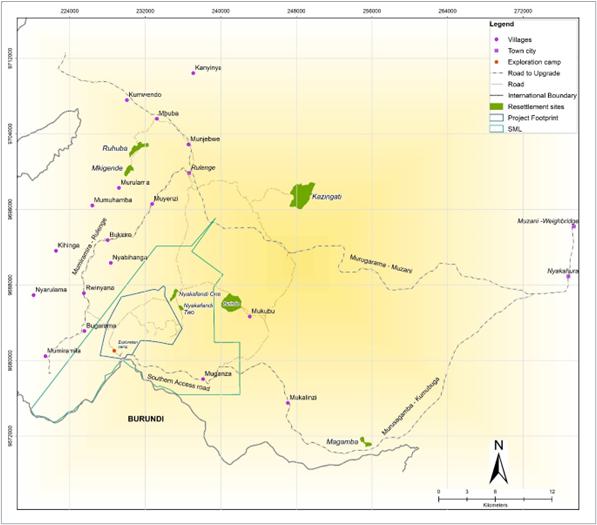
Figure 1-2: Kabanga Special Mining Licence (SML), Site Project Footprint, Resettlement Sites and Southern Access Road
The Kahama Site will be located within the Buzwagi Special Economic Zone (SEZ), located in Kahama, a town with a population of approximately 453,000 (2022 census). The Kahama Site comprises the Refinery, associated infrastructure, and utilities. The Kahama Site is approximately 320 km from the Kabanga Site on the paved B3 highway. The Kahama Site is 32 km from the Isaka Dry Port, which will provide a 982 km Standard Gauge Rail (SGR) link to Dar es Salaam Port via Tabora and Kwala. The site has existing infrastructure consisting of workshops, warehouses, offices, security, and water storage dams. An existing bulk water supply is available from the local Kahama Urban Water Supply and Sanitation Authority (KUWASA). The Kahama Airport (KBH) has commercial domestic flights to and from Dar es Salaam (See Figure 1-3). Bulk (220 kV) power supply from TANESCO is available to the site.
Page
|
/ / Initial Assessment - Technical Report Summary |
|
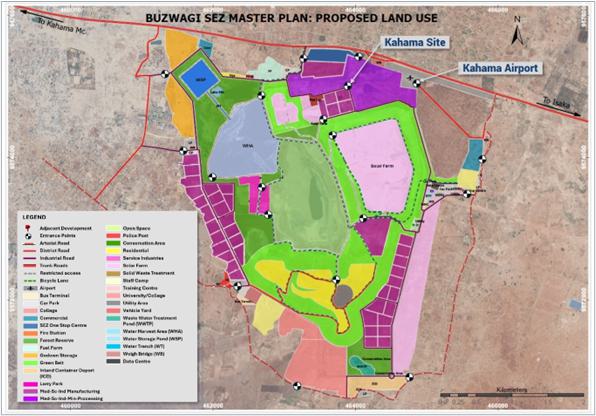
Figure 1-3: Kahama Site at the Buzwagi SEZ
Both sites are situated within a temperate moist sub-humid climatic zone, experiencing bi-modal rainfall patterns with an average annual precipitation of approximately 1,000 mm, and mean annual temperatures around 20°C, allowing for year-round site access.
The Project is owned by Tembo Nickel Corporation Limited (TNCL). TNCL is 84% owned by Kabanga Nickel Limited (KNL) and 16% by the Government of Tanzania (GoT) Treasury Registrar. KNL is jointly owned by LZM (82.992%), through its 100% owned subsidiaries, and by BHP Billiton (UK) DDS Limited (BHP) (17.008%). The LZM attributable ownership is thus 69.713%, after accounting for the GoT and BHP shareholding. The current Project ownership structure is presented in Figure 1-4.
Page
|
/ / Initial Assessment - Technical Report Summary |
|
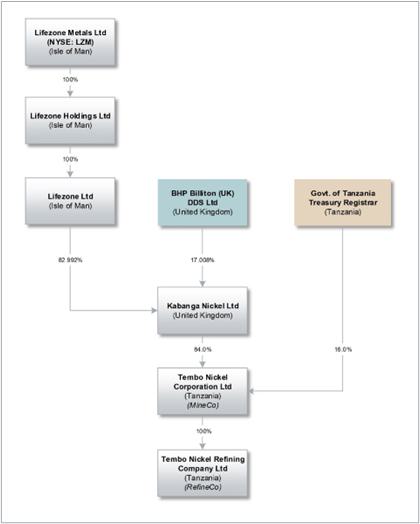
Figure 1-4: Current Ownership Structure of the Kabanga Nickel Project
A Framework Agreement exists with the GoT for the development and operation of the Project, which describes the equitable Economic Benefit Sharing Principle (EBSP) between KNL and the GoT. The overarching principle is that KNL and the GoT equally share income derived from the Project over the Project life, where GoT’s income is derived from dividends, taxes, royalties, duties, and levies.
TNCL holds a 201.85 km2 Special Mining Licence (SML) granted on October 29, 2021, which is valid up to 33 years (2054) and includes all mineralized areas relating to the resource. TNCL also holds a Refining Licence (RFL), granted on March 19, 2024, which confers the right to refine copper, cobalt, and nickel products in the Kahama District, Shinyanga Region. In addition, TNCL holds six prospecting licenses covering a combined area of 101.44 km2, which are not part of the Project.
BHP holds a 17% direct interest in KNL, acquired via a convertible loan in July 2022 and an equity subscription in February 2023. In addition, KNL and LZM’s wholly-owned subsidiary Lifezone Limited entered into an option agreement with BHP in October 2022, pursuant to which KNL would receive an investment from BHP by way of an equity subscription, such that in aggregate, BHP would indirectly own 51% of the total voting and economic equity rights in TNCL and RefineCo (60.71% of the total voting and economic equity rights in KNL on a fully diluted basis). The price is to be determined through an independent expert valuation and the option process commences on the later date on which the Definitive Feasibility Study (DFS) is agreed between BHP and KNL, or the date on which the Joint Financial Model (JFM) in respect of the Project is agreed between BHP, GoT, and Lifezone Limited.
Page
|
/ / Initial Assessment - Technical Report Summary |
|
Lifezone Limited and KNL entered into a Development, Licensing and Services Agreement on October 14, 2022, pursuant to which Lifezone Limited agreed to study the proposed Refinery that will utilize Lifezone Limited’s hydrometallurgical technology.
| 1.3 | Geology |
| 1.3.1 | Geological Setting |
The Kabanga nickel deposit is located within the East African Nickel Belt, which extends approximately 1,500 km along a northeast trend that extends from Zambia in the southwest to Uganda in the northeast. In the northern and central sections of the East African Nickel Belt, a thick package of Paleoproterozoic to Mesoproterozoic metasedimentary rocks, known as the Karagwe-Ankole Belt (KAB), overlies this boundary, within which occurs a suite of broadly coeval, bimodal intrusions that correspond to the Mesoproterozoic Kibaran tectonothermal event between 1,350 Ma and 1,400 Ma.
The Kibaran igneous rocks comprise mafic-ultramafic intrusions, including well-differentiated lopolithic layered intrusions and small, narrow, tube-like sills, often concentrically zoned, called chonoliths. The nickel mineralization zones discovered to date have exclusively been found associated with the mafic-ultramafic intrusions, in particular, along the Kabanga-Musongati Alignment.
The intrusions that host the potentially economic nickel-bearing massive sulfide zones in the Project area, namely, from southwest to northeast, Main, MNB, Kima, North, Tembo, and Safari, are hosted within steeply dipping overturned metasediments (dipping 70° to 80° to the west), with a north–northeast strike orientation (025°) from the Main zone to North zone, changing to a northeast strike orientation (055°) (dipping northwest) from North to Tembo. These zones are located within and at the bottom margin of the mafic ultramafic chonoliths. The chonoliths are concentrically zoned with a gabbronorite margin and an ultramafic cumulate core.
Three lithological groups are present at Kabanga:
| ● | Metasediments comprising a series of pelitic units, schists, and quartzites, forming the hanging wall and footwall of the massive sulfide mineralization. |
| ● | Mafic ultramafic intrusive complex rocks, which display a wide range of metamorphism/metasomatism and can carry significant sulfide mineralization (i.e., UMAF_1a (≥ 30% sulfides)). |
| ● | Remobilized massive sulfide (MSSX) mineralization (i.e., MSSX (> 80% sulfides), which carries 90% of the sulfide occurrence, and massive sulfide mineralization with xenoliths of metasedimentary or gabbro/ultramafic (i.e., MSXI (≥ 50% < 80% sulfides). |
| 1.3.2 | Style of Mineralization |
The principal sulfide in the massive sulfide is pyrrhotite, with up to 15% pentlandite. The pentlandite shows distinct globular recrystallization textures, with crystals reaching up to 5 cm in size. Sulfide mineralization occurs both as:
| ● | Disseminated to net-textured interstitial sulfides within and external to the cumulate core of the chonoliths. |
| ● | Massive and semi-massive bodies along the lower or side margins of the chonolith. |
| 1.3.3 | Exploration History |
Exploration at the Project has been undertaken in several different phases for approximately 50 years, with more than 637 km of drilling completed up to the effective date of the current Mineral Resource estimate (MRE) reported in December 2024.
The first drilling on the deposit was undertaken between 1976 and 1979 by the United Nations Development Programme (UNDP). This program resulted in over 20 km of drilling and the estimation of a Mineral Resource for Main zone.
Page
|
/ / Initial Assessment - Technical Report Summary |
|
In 1990, Sutton Resources Ltd (Sutton) negotiated the mineral rights to the Project. Between 1990 and 1999, Sutton, in two separate joint ventures (JVs), completed over 100 km of drilling that resulted in Mineral Resource estimates for the Main zone and North zone.
In 1999, Barrick Gold Corporation (Barrick) purchased Sutton and commenced a 14-year exploration program. During the first four years of this program, Barrick explored the Main zone and North zone areas further, resulting in the discovery of the MNB zone and the Kima zone, updates to the resource models, and the completion of a scoping study. In 2005, Barrick entered into a JV with Falconbridge Ltd (which became Xstrata plc, then ultimately Glencore plc) that lasted for nine years and resulted in two additional scoping studies, a Pre-Feasibility Study (PFS), an FS and a draft FS update. During this period, over 450 km of drilling was completed, the Tembo zone mineralization was discovered, and Mineral Resource updates were generated for all the zones.
Other historical exploration work completed included the following:
| ● | Geophysical surveys: |
| ‒ | Crone borehole electromagnetic (BHEM) geophysical surveys with physical properties, ground geophysical surveys, and airborne versatile time domain electromagnetic (VTEM) surveys (which were used, in conjunction with historical soil surveys and a BHP GEOTEM® airborne magnetic survey, to target the ground surveys). |
| ‒ | Superconducting quantum interference device (SQUID) and fixed-loop transient electromagnetic (TEM) surface electromagnetic surveys (Crone and UTEM), as well as a helicopter-borne versatile time domain electromagnetic VTEM survey. |
| ● | Collection and testing of metallurgical samples. |
| ● | Geotechnical drilling at proposed infrastructure sites. |
In December 2021, the Project commenced activities at the Kabanga Site, after SML 651/2021 was granted. Since that time, over 52 km of additional drilling has been completed.
In December 2024, a revised Mineral Resource estimate (2024MRU) was generated based on all the Project drilling completed up to June 4, 2024, and this IA is based on that Mineral Resource estimate.
The Project drillhole database is currently maintained using Fusion software. Data collection activities have been performed using industry-standard practices.
| 1.3.4 | Sample Preparation, Analyses, Security and Data Verification |
The Kabanga sample preparation, assaying, quality assurance and quality control (QA/QC) activities and protocols can be summarized as follows:
| ● | Sample preparation was completed in Tanzania at the ALS Metallurgy Pty Ltd (ALS)-Chemex laboratory in Mwanza (ALS-Chemex Mwanza). |
| ● | All the material was crushed to –2 mm, and 2 × 250 g pulp bags were sent to the ALS-Chemex laboratory in Perth, Western Australia (ALS-Chemex Perth) for analysis. |
| ● | The Perth samples were pulverized to –75 µm and analyzed as follows: |
| ‒ | 4-acid digestion/inductively coupled plasma mass spectroscopy (ICP-MS) for Ni, Cu, Co, Ag, Fe, Cr, Mg, Mn, As, Pb, Bi, Cd, and Sb. |
| ‒ | Fire assay/ICP-MS for Au, Pd, and Pt. |
| ‒ | Ni and Cu samples exceeding 10,000 ppm, and Au, Pd, and Pt samples exceeding 1.0 g/t were re-analyzed with a more accurate technique. |
| ‒ | LECO (Laboratory Equipment Corporation) technique for the determination of sulfur. |
| ‒ | Gravimetric method for density determination (pycnometry) on all samples. |
| ● | Not all the samples were assayed for the complete elemental suite: only 66% for North (10,053 of 15,200 samples), and 95% for Tembo (6,422 of 6,717 samples). |
Page
|
/ / Initial Assessment - Technical Report Summary |
|
| ● | An industry-standard QA/QC protocol was used at Kabanga, using certified reference material (CRM) standards, blanks, check assays, and duplicates. |
| ● | ALS is an independent laboratory accredited by the National Association of Testing Authorities (NATA) and complies with international standards such as ISO/IEC 17025 for testing and calibration in laboratories |
All the aspects of the data that could materially impact the integrity of the Mineral Resource estimates (core logging, sampling, analytical results, and database management) were reviewed by OreWin with TNCL staff. OreWin personnel met with the TNCL staff to ascertain exploration and production procedures and protocols. Drill rigs were visited, and core was observed being obtained from the diamond drillholes and being logged at the exploration camp to confirm that the logging information accurately reflects the actual core. The lithology contacts that were checked matched the information reported in the core logs.
| 1.4 | Mineral Processing and Metallurgical Testing |
| 1.4.1 | Kabanga Concentrator |
Extensive historical metallurgical testwork was previously undertaken for the Kabanga Concentrator (hereinafter referred to as the “Concentrator”) over the period 2005 to 2010, including mineralogical, comminution, flotation (bench and pilot scale) and dewatering testwork, which provided a basis for the additional metallurgical testwork undertaken as part of the 2023-25 concentrator testwork program.
As part of this program, comminution and flotation flowsheet development and variability testwork was conducted on 4,616 kg of quarter, half, and full NQ sized (approximately 47.6 mm) drill core. The testwork was conducted to feasibility level, on a range of composite and variability samples which were selected to represent the major feed types and feed blends expected to be processed over the potential life of mine (LoM). Sample selection and composite preparation also considered:
| ● | Grade ranges and expected LoM grades. |
| ● | Spatial coverage, including depth and along strike. |
| ● | Appropriate levels of planned and unplanned mining dilution advised by the relevant mining disciplines. |
| ● | The proportion of MSSX and UMAF_1a tonnage in the overall mine life. |
Testing included comprehensive head grade analysis, mineralogy, comminution (physical crushing and grinding) tests, open circuit and locked-cycle bench-scale flotation tests, open circuit bulk flotation tests, feed oxidation assessments, concentrate regrind, thickening, filtration and rheology testing. The aim of the testwork was to further characterize the flotation response, optimize the flowsheet, generate bulk concentrate samples for the refinery testwork, and to evaluate the degree of variability that could be expected across the deposit.
The comminution testwork confirmed the previous historical testwork findings, demonstrating that the MSSX and MSXI material is characterized as soft to medium with respect to hardness, while the UMAF_1a and waste dilution are characterized as medium-hard to hard. All the samples had a low abrasion tendency.
The flotation testwork demonstrated that a conventional flotation flowsheet, using a typical flotation reagent regime, could be used for the effective separation of pentlandite and chalcopyrite from the pyrrhotite and non-sulfide gangue. It also confirmed the historical optimal flotation circuit feed size of 80% passing 100 µm and a feed solids concentration of 35% (w/w). The regrind testwork highlighted the relatively soft nature of the sulfide rougher concentrate.
The dewatering testwork was aligned with historical testing by equipment vendors, showing the concentrate and tailings could readily thicken to a density > 65% solids (w/w) and is amenable to pressure filtration, achieving a final concentrate moisture level of 9% (w/w). Tailings testwork showed that rheology is not expected to cause pumping issues at design densities.
Page
|
/ / Initial Assessment - Technical Report Summary |
|
The concentrator metallurgical performance projections indicate that the Concentrator will potentially produce over 300 ktpa of nickel-copper-cobalt sulfide flotation concentrate, containing 17.3% nickel over the proposed LoM. The nickel recovery is expected to average 87.3% over the proposed LoM, while the copper and cobalt recoveries are expected to average 95.7% and 89.6%, respectively.
| 1.4.2 | Kahama Refinery |
Refinery testwork was conducted using samples of concentrate generated from the concentrator testwork program, derived from feed containing varying amounts of MSSX, UMAF_1a and waste dilution lithologies, with the dominant minerals in the MSSX being pentlandite, chalcopyrite, and pyrrhotite.
The testwork program included pressure oxidation (POX), primary neutralization, locked-cycle POX and primary and secondary neutralization, copper, cobalt, calcium and impurity solvent extraction (SX), anolyte neutralization, bleed crystallization characterization, and local limestone characterization.
Over 50 POX batch tests demonstrated high leach extractions of nickel (98%), cobalt (99%), and copper (98%) across a range of operating conditions. The pregnant leach solution (PLS) produced was low in impurities, making it well suited to direct electrowinning and battery-grade nickel sulfate production. A high recovery of copper (> 98%) in SX was demonstrated, in line with the vendor’s performance projections.
Key impurities like iron and aluminum were effectively removed during the precipitation process, with minimal loss of valuable metals (< 1% for nickel, cobalt, and copper). Additional tests on CoSX showed that other impurities, including impurities such as calcium and sodium introduced during processing, can be managed. These were successfully rejected while still maintaining high recoveries of nickel and cobalt (> 99%) in the impurity removal circuits.
Limestone samples sourced from the nearby Shinyanga Region in Tanzania were tested and confirmed to have acid neutralization properties consistent with their calcium content, making them suitable for use in the Refinery.
The test results for the pilot plant samples agree with prior tests on the pilot plant concentrate sample and as well as the broader dataset generated from the POX bench-scale testwork on the Kabanga concentrate samples. The hydrometallurgical testwork supports the overall Refinery flowsheet design and demonstrates the potential that London Metal Exchange (LME) grade A copper and battery grade nickel sulfate can be produced. Overall Refinery recoveries of 97.2%, 93.0%, and 97.7% for nickel, copper, and cobalt, respectively, are expected.
| 1.5 | Mineral Resource Estimate |
The 2024MRU was based on industry best practice, is similar in approach to the resource modeling of previous estimates, conforms to the requirements of S-K 1300, and is suitable for reporting as current estimates of Mineral Resources.
The 2024MRU was completed using Datamine software, with macros developed to estimate the full suite of component elements and density for each zone (Main, MNB, North, Kima, and Tembo). All zones were estimated using the ordinary kriging method, with domain-specific search and estimation parameters determined by statistical and geostatistical analyses.
Three distinct mineralization units were interpreted for the Main, MNB, Kima, North, Tembo, and Safari zones:
| ● | Massive sulfide (MSSX), |
| ● | Ultramafic (UMAF), and |
| ● | Intrusive (INTRUSIV/INTR) unit, which is generally poorly mineralized but occurs in close association with the mineralized units. |
Within these three units, additional sub-domains were created based on spatial continuity, intersecting geological structures, and geochemical variability.
Page
|
/ / Initial Assessment - Technical Report Summary |
|
Solid wireframes were constructed for the intrusive bodies at each zone, which predominantly represented the logged generally unmineralized ultramafic (peridotite) (UMAF_KAB) lithology but also served as an ‘umbrella’ unit for any intervals logged as generic mafic (MAF), generally unmineralized gabbro-gabbronorite (GAB_KAB), UMAF_1a, MSSX, and MSXI. The stratigraphic contacts between the Banded Pelite unit (BNPU) and the Lower Pelite unit (LRPU) were also used to interpret folding structures and unconformities to help orient the sulfide mineralization interpretations.
A multivariate statistical analysis was completed for all domains within each zone. It was based on the assay data limited to the samples that have the complete suite of elements assayed.
Some individual domains were combined where they were found to be statistically similar and could be plausibly related in a geological and spatial sense. The classification criteria and zoning used for the 2024MRU were based on a two-stage approach that considered objective criteria and visual observation.
The criteria referenced for the assignment of Inferred and Indicated mineralization globally included the distance from the cell centroid to the drillhole samples and the search pass in which the estimate was achieved. This global classification was then reviewed visually with specific focus on geological factors, including the geometry of the mineralized zones, spatial and geochemical continuity of the mineralization, and the success rate when intersecting the mineralization at predicted locations and thicknesses with the new drilling. Manually defined wireframe solids were then developed to enclose those areas that warrant upgrading to Indicated or Measured. As the Kabanga North and Tembo zones contain multi-element mineralization, a nickel equivalent (NiEq) formula, updated for current metal prices, costs, and other modifying factors, has been used for reporting from the Mineral Resource.
The 2024 nickel-equivalent (NiEq24) formula is as follows:
| ● | MSSX NiEq24% = Ni% + (Cu% x 0.454) + (Co% x 2.497) |
| ● | UMAF NiEq24% = Ni% + (Cu% x 0.547) + (Co% x 2.480) |
The 2024 NiEq cut-off grades are:
| ● | MSSX NiEq24% is 0.73% |
| ● | UMAF NiEq24% is 0.77% |
Metal price assumptions used for cut-off grade determination were USD 9.50/lb for nickel, USD 4.50/lb for copper, and USD 23.00/lb for cobalt. Other input parameters and assumptions used for the NiEq24% formula and determining the cut-off grade are discussed in Section 11.4.
Reasonable prospects for economic extraction for the Mineral Resource determination were assessed by way of an IA, as defined in S-K 1300.
The overall MRE (LZM-attributable) is shown in Table 1-1. Reporting of contained nickel-equivalent metal is shown in Table 1-2. Only the portion of the total mineralization that is attributable to LZM’s interest in the property (69.713%) is shown in Table 1-1 and Table 1-2.
The MREs have an effective date of December 4, 2024 MREs have been reported in accordance with S-K 1300.
Page
|
/ / Initial Assessment - Technical Report Summary |
|
Table 1-1: Kabanga Mineral Resource Estimates as at December 4, 2024 – Tonnes and Grade
Mineral
Resource |
LZM Tonnage2 (Mt) | Grades (%) | Recovery (%) | |||||
| NiEq24 | Ni | Cu | Co | Ni | Cu | Co | ||
| MINERAL RESOURCE ALL ZONES – Massive Sulfide Only | ||||||||
| Measured | 10.3 | 3.14 | 2.49 | 0.33 | 0.20 | 86.2 | 95.1 | 89.2 |
| Indicated | 20.5 | 3.44 | 2.77 | 0.38 | 0.20 | 85.8 | 95.4 | 88.8 |
| Measured + Indicated | 30.9 | 3.34 | 2.68 | 0.36 | 0.20 | 85.9 | 95.3 | 88.9 |
| Inferred | 9.4 | 2.89 | 2.32 | 0.32 | 0.17 | 85.2 | 94.9 | 88.1 |
| MINERAL RESOURCE ALL ZONES – Ultramafic Only | ||||||||
| Measured | 5.5 | 1.24 | 0.96 | 0.13 | 0.08 | 65.7 | 77.8 | 68.0 |
| Indicated | 10.4 | 1.23 | 0.95 | 0.15 | 0.08 | 65.6 | 78.3 | 67.8 |
| Measured + Indicated | 16.0 | 1.23 | 0.95 | 0.14 | 0.08 | 65.6 | 78.2 | 67.9 |
| Inferred | 1.9 | 1.05 | 0.83 | 0.12 | 0.06 | 62.7 | 77.2 | 64.3 |
| MINERAL RESOURCE ALL ZONES – Massive Sulfide plus Ultramafic | ||||||||
| Measured | 15.9 | 2.48 | 1.95 | 0.26 | 0.16 | 82.7 | 92.0 | 85.4 |
| Indicated | 31.0 | 2.69 | 2.16 | 0.30 | 0.16 | 82.9 | 92.6 | 85.3 |
| Measured + Indicated | 46.8 | 2.62 | 2.09 | 0.29 | 0.16 | 82.8 | 92.4 | 85.3 |
| Inferred | 11.3 | 2.59 | 2.08 | 0.28 | 0.15 | 83.7 | 93.7 | 86.5 |
| ● | Mineral Resources in Table 1-1 are reported exclusive of Mineral Reserves. |
| ● | Mineral Resources are reported showing only the LZM-attributable tonnage portion, which is 69.713% of the total. |
| ● | Cut-off applies to NiEq24, which is derived using a nickel price of USD 9.50/lb, copper price of USD 4.50/lb, and cobalt price of USD 23.00/lb with allowances for recoveries, payability, deductions, transport, and royalties. |
| ● | NiEq24 formulae are: MSSX NiEq24 = Ni + (Cu x 0.454) + (Co x 2.497) and UMAF NiEq24 = Ni + (Cu x 0.547) + (Co x 2.480). |
| ● | The point of reference for Mineral Resources is the point of feed into a concentrator. |
| ● | All Mineral Resources in the 2024MRU were assessed for reasonable prospects for economic extraction by reporting only material above cut-off grades of: MSSX NiEq24>0.73% and UMAF NiEq24>0.77%. |
| ● | Totals may vary due to rounding. |
Page
|
/ / Initial Assessment - Technical Report Summary |
|
Table 1-2: Kabanga Mineral Resource Estimates as at December 4, 2024 –Contained Metals
Mineral
Resource |
LZM
Tonnage2 (Mt) |
Grades (%) | Contained Metals (kt) | ||||||
| NiEq24 | Ni | Cu | Co | NiEq24 | Ni | Cu | Co | ||
| MINERAL RESOURCE ALL ZONES – Massive Sulfide Only | |||||||||
| Measured | 10.3 | 3.14 | 2.49 | 0.33 | 0.20 | 325 | 257 | 34 | 21 |
| Indicated | 20.5 | 3.44 | 2.77 | 0.38 | 0.20 | 706 | 570 | 77 | 40 |
| Measured + Indicated | 30.9 | 3.34 | 2.68 | 0.36 | 0.20 | 1,031 | 827 | 111 | 61 |
| Inferred | 9.4 | 2.89 | 2.32 | 0.32 | 0.17 | 274 | 220 | 30 | 16 |
| MINERAL RESOURCE ALL ZONES – Ultramafic Only | |||||||||
| Measured | 5.5 | 1.24 | 0.96 | 0.13 | 0.08 | 69 | 53 | 7 | 5 |
| Indicated | 10.4 | 1.23 | 0.95 | 0.15 | 0.08 | 128 | 99 | 15 | 8 |
| Measured + Indicated | 16.0 | 1.23 | 0.95 | 0.14 | 0.08 | 197 | 152 | 23 | 13 |
| Inferred | 1.9 | 1.05 | 0.83 | 0.12 | 0.06 | 20 | 15 | 2 | 1 |
| MINERAL RESOURCE ALL ZONES – Massive Sulfide plus Ultramafic | |||||||||
| Measured | 15.9 | 2.48 | 1.95 | 0.26 | 0.16 | 394 | 311 | 42 | 25 |
| Indicated | 31.0 | 2.69 | 2.16 | 0.30 | 0.16 | 833 | 668 | 93 | 49 |
| Measured + Indicated | 46.8 | 2.62 | 2.09 | 0.29 | 0.16 | 1,227 | 979 | 134 | 74 |
| Inferred | 11.3 | 2.59 | 2.08 | 0.28 | 0.15 | 293 | 235 | 32 | 17 |
| ● | Mineral Resources are reported in Table 1-2 exclusive of Mineral Reserves. |
| ● | Mineral Resources are reported showing only the LZM-attributable tonnage portion, which is 69.713% of the total. |
| ● | Cut-off applies to NiEq24, which is derived using a nickel price of USD 9.50/lb, copper price of USD 4.50/lb, and cobalt price of USD 23.00/lb with allowances for recoveries, payability, deductions, transport, and royalties. |
| ● | NiEq24 formulae are: MSSX NiEq24 = Ni + (Cu x 0.454) + (Co x 2.497) and UMAF NiEq24 = Ni + (Cu x 0.547) + (Co x 2.480) |
| ● | The point of reference for Mineral Resources is the point of feed into a concentrator. |
Page
|
/ / Initial Assessment - Technical Report Summary |
|
| ● | All Mineral Resources in the 2024MRU were assessed for reasonable prospects for economic extraction by reporting only material above cut-off grades of: MSSX NiEq24>0.73% and UMAF NiEq24>0.77% |
| ● | Totals may vary due to rounding. |
Comparison of the current (December 4, 2024) MRE with the previous MRE (November 30, 2023) shows an increase of 3.3 Mt (+7% relative) in Measured + Indicated in 2024 and a decrease of 6.2 Mt (–35%) in the Inferred category. The additional Measured + Indicated tonnage is associated with an increase in grade (+2% relative NiEq24%), making more metal available to the mine planning process (+9% NiEq24 metal), achieved through ‘tightening’ the interpretation (improved sedimentary host strata model, reinterpretation of the mineralization, and smaller sub-celling along the boundaries. The overall increase is slightly offset by revised NiEq24 formulae and higher cut-off grades, removing 0.66% of metal overall.
| 1.6 | Mineral Reserve Estimate |
This section is not relevant to this TRS.
| 1.7 | Mining Methods |
The Project is currently not being mined, and the proposed mine plan has been prepared using the 2024MRU.
The total planned production for the economic analysis Measured, Indicated, and Inferred (MII) case is 68 Mt at 1.93% Ni, 0.26% Cu, and 0.14% Co (100% basis), from the North and Kima (65%), Tembo (25%), and Main and MNB zones (10%). The Measured and Indicated (MI) case is 52 Mt at 1.98%Ni, 0.27% Cu and 0.15% Co (100% basis).
The preliminary mine plan assumes a four-year construction and ramp-up period, forecast to reach steady-state production of 3.4 Mtpa in Year 4. It is expected that around two-thirds of the mill feed will be sourced from North, with Tembo contributing the remaining third. In the final years, Kima, Main and MNB are also expected to supplement mill feed. Figure 1-5 illustrates the preliminary mine design and annual production schedule.

Figure 1-5: Mine Design and Sequence (in years)
Page
|
/ / Initial Assessment - Technical Report Summary |
|
In the proposed mine design, North (50 m to 1,500 m deep) and Tembo (120 m to 650 m deep) are each accessed via 5.5 m (W) x 5.8 m (H) declines starting from small boxcuts and portals on the surface, while the Main and MNB zones (200 m to 900 m deep) are accessed from the North Mine. Longhole stoping with paste backfill is the proposed mining method. Level spacing is typically 25 m floor-to-floor and stope strike lengths will vary between 20 m and 30 m, depending on mineralization depth and thickness. Most stopes are to be extracted via longitudinal retreat stoping, except in thicker mineralized areas in the North Mine, where transverse retreat stoping from the hanging wall drives will be implemented. Mine tonnes are transported to the surface via conventional trucking.
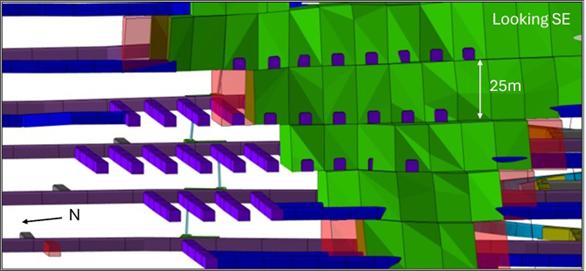
Figure 1-6: Typical Mine Design – North Mine (Isometric 3D)
A geotechnical assessment (MineGeoTech, 2024) has been carried out with the view to provide geotechnical parameters for the mine designs at the Project based on 2023 diamond drilling and extensive historical datasets. Ground Support Standard recommendations were derived from empirical rock mass quality assessment, kinematic analysis, and numerical modeling. Four acoustic emission (AE) stress measurements were collected and indicate that Kabanga is in a low stress environment. The major fault model developed by Golder Associates Inc. (Golder) in 2009 was reviewed and verified with 2022–23 drilling. A three-dimensional finite element modeling was conducted for the proposed North and Tembo mines to assess global stability based on rock mass quality, material strength, faults, and foliation, using the planned mine geometry and extraction sequence. This modeling indicated that the approach can be adapted based on favorable results, providing flexibility in the sequence.
Ventilation models were constructed to size and position ventilation infrastructure. Cooling requirements are predicted at North and Tembo in the deeper areas where loading operations occur.
Based on laboratory testing of multiple paste recipes for Kabanga, the proposed backfill system comprises two plants that would use non-pyrrhotite tailings, crushed waste rock, and low-heat cement to produce a stable Paste Aggregate Fill (PAF)
DRA has prepared designs for the underground infrastructure for pumping, mine services, workshops, electrical, explosives storage, and instrumentation and control.
It is proposed that an experienced mining contractor is engaged to operate the mine during the first five years of production, with responsibility for key underground activities including development, drilling, mucking, haulage, pastefill, raiseboring, mine infrastructure, and explosives management. The contractor would also procure, operate, and maintain all underground equipment, including 24 trucks, 17 load haul dump (LHD) units, 12 development jumbos, and nine production drill rigs. The Project has sourced indicative pricing among tier-1 contractors with relevant experience in Africa.
A maximum of 96 L/s of groundwater ingress (along with mine service water) is projected to be pumped from underground to high-rate settlers placed on surface. Excess water will be pumped to the Concentrator. The proposed mine is slightly water positive, and the Kabanga Site is approximately water neutral.
Page
|
/ / Initial Assessment - Technical Report Summary |
|
| 1.8 | Processing and Recovery Methods |
| 1.8.1 | Kabanga Concentrator |
The Concentrator has been designed to process 3.4 Mtpa of run-of-mine (RoM) trucked to the stockpile pad and includes crushing, wet grinding, flotation, and dewatering required to produce a nickel-copper-cobalt sulfide concentrate ready for transport to the Refinery. Tailings are separated by flotation into a non-pyrrhotite tailings stream for use in the backfill mix, and a pyrrhotite tailings stream to be disposed of in the TSF. The flowsheet is conventional and well known in industry, uses common reagents, and has historically been proven as a suitable processing route for base metal sulfide ores.
The proposed TSF is a valley-type downstream constructed lined facility located 7 km to the east of the Concentrator. The footprint will be 120 ha and is designed to hold 50 Mt of tailings solids, with embankments constructed as a starter wall and five subsequent lifts using borrow materials from the TSF basin and surrounding area. The main embankment has a maximum height of 72 m, while the saddle embankment has a height of 9 m and each phase will be equipped with an emergency spillway.
Due to the acid generating potential of the tailings, subaqueous deposition will be used, both by spigot and a floating barge deposition system, always maintaining a minimum water cover of 0.8 m above the tailings. Water return will be by submersible barge pump to the pumpstation for return to the Concentrator. A liner leakage collection system and a spring water transfer system have been included.
The TSF design was undertaken by WSP Australia Pty Ltd (WSP (AUS)) building on earlier PFS and basic engineering level work completed between 2006 and 2014 and supplemented by additional geophysical and geotechnical investigations in 2023. Relevant parts of Australian National Committee on Large Dams (ANCOLD) and Global Industry Standard on Tailings Management (GISTM) standards have been met, and the residual risks have been reduced to as low as reasonably practicable.
| 1.8.2 | Kahama Refinery |
The Refinery is designed as a hydrometallurgical facility, incorporating POX, neutralization, solvent extraction, electrowinning, and crystallization to process the Kabanga concentrates at the Kahama Site. The flowsheet achieves high base metal recovery rates while maintaining low levels of deleterious impurities in the final high-grade nickel sulfate, cobalt sulfate, and copper metal products. The Refinery will come online five years after the first concentrate production from Kabanga.
The Refinery has a maximum production capacity of 50 ktpa of nickel in nickel sulfate. This equates to approximately 225 ktpa of nickel sulfate product based on 22.3% nickel content. Any excess concentrate is sold on the international market. Nickel concentrate is transported from Kabanga in flexible bulk containers (approximately 9.4 t each), then stored, handled, and repulped before processing.
The POX circuit operates in two stages at 3,000 kPa(g) and 220°C with oxygen injection:
| ● | Stage 1 extracts 85%–90% of the metals within 15 minutes, followed by thickening. |
| ● | Stage 2 extracts the remaining metals over 75 minutes. |
Acid is neutralized in a three-stage process using limestone, which precipitates impurities while minimizing valuable metal losses.
Copper is extracted from the PLS using SX, following a 2-extract, 1-wash, 2-strip process with electrowinning to produce LME Grade A copper cathodes. SX with a nickel preload system is used for calcium and manganese removal. Cobalt separation is performed by solvent extraction, employing multi-stage scrubbing.
For crystallization, nickel and cobalt sulfates undergo pre-concentration followed by forced circulation evaporation, producing battery-grade nickel sulfate hexahydrate and cobalt sulfate heptahydrate, which are dried and packaged in 1 m³ bulk bags and loaded into shipping containers for export.
Residues, including filter cake and process bleeds, are neutralized to pH of 8 and pumped to the adjacent former Buzwagi Gold Mine pit.
Page
|
/ / Initial Assessment - Technical Report Summary |
|
The Refinery benefits from existing infrastructure at the Kahama Site, including power, roads, buildings, and water systems. Key reagents used in the process will include oxygen (produced on-site), limestone (locally sourced), and caustic soda (imported). The process generates steam during slurry cooling, which is reused for evaporation and heating.
| 1.9 | Project Infrastructure |
| 1.9.1 | Kabanga Site |
Key infrastructure that will be required at the Kabanga Site includes:
| ● | Bulk earthworks and terracing with materials from local borrow pits. |
| ● | Upgraded access road and internal roads with concrete surfacing on steep haul road sections. |
| ● | A comprehensive water drainage system for management of contact and non-contact water. |
| ● | Water supply by boreholes and abstraction from the Ruvubu River. |
| ● | Modular potable water and sewage treatment facilities and high-density sludge and reverse osmosis water treatment plants. |
| ● | A new 88 km 220 kV overhead line, with transformers stepping power down to 33 kV on-site. Backup diesel generation provides redundancy for critical systems. |
| ● | Operational and support buildings (offices, workshops, laboratory, training rooms, etc.) and phased accommodation facilities for up to 936 personnel. |
| ● | Lined waste rock dumps (WRDs) with water management. |
| ● | A central incinerator and landfill facility for recyclable, hazardous, and domestic waste. |
| ● | Two backfilling pastefill plants. |
| ● | Surface fans and refrigeration plant included from Year 5. |
| 1.9.2 | Kahama Site |
The proposed Refinery site is 320 km southeast of the Kabanga Site at the Buzwagi SEZ, leveraging existing infrastructure from the decommissioned Buzwagi Gold Mine. The site benefits from established access via the B3 highway, proximity to the Kahama Airport and existing power, water, administration building, and village infrastructure. Key infrastructure at the Kahama Site includes:
| ● | 4 km of gravel internal roads, a new 6 m-wide service road connecting key site facilities, a dual weighbridge, and a truck staging area. |
| ● | Stormwater systems to manage non-contact stormwater and contact water, plus required treatment facilities to make it suitable for reuse or discharge. |
| ● | An existing water storage pond (supplied from the KUWASA reservoir) and water harvest area with sufficient capacity to meet peak demand. Existing water infrastructure, including a 1.5 Mm³ storage pond and modular potable water plant, and existing sewerage treatment plant with 250 m³/day capacity. |
| ● | 220 kV power available at the Buzwagi substation. Substation upgrades and a new dual 33 kV overhead line will support the refinery’s load. Diesel generators will provide emergency backup. |
| ● | Existing mine buildings (offices, workshops, clinic, etc.) to be repurposed. New facilities include laboratory, control rooms, warehouses, and access control infrastructure. |
| ● | The existing village camp accommodating 408 personnel. |
| ● | An existing 3 m concrete perimeter wall, enhanced fencing and access control in high-security areas will be incorporated. |
| ● | Comprehensive solid and hazardous waste handling facilities, including incinerators, bunded segregation zones and a domestic landfill. |
Page
|
/ / Initial Assessment - Technical Report Summary |
|
| 1.9.3 | Logistics |
Construction Logistics
A detailed logistics study has been completed, covering transport of abnormal loads from Dar es Salaam to both the Kabanga and Kahama Sites, including route assessments and logistical constraints.
Operational Logistics
The Project will implement a comprehensive logistics system to transport concentrate from mine to port and bulk shipping to an offtaker, at approximately 300 ktpa for the initial five-year period until the Refinery is commissioned. At the mine site, concentrate will be loaded under a covered area into reuseable Flexible Bulk Containers (FBC), containing approximately 9.4 t per bag, and onto contractor provided flatbed trucks for the 348 km haul to the Isaka Dry Port.
From Isaka, the FBCs will be railed 894 km to the Kwala dry port in dedicated low-sided flatbed wagons via the SGR, which is currently under construction and expected to be operational at Isaka by March 2026. The typical freight train will consist of 40 wagons, with each wagon carrying five FBCs, delivering a train payload of approximately 1,880 t with departures every 48 hours. At Kwala, FBCs will be stored in a leased area with sufficient capacity to cater for the approximately monthly approximately 25,000 t shipments. From Kwala, the concentrate will travel the final 88 km to Dar es Salaam Port via a dedicated “Port Link”.
At Dar es Salaam, DP World will handle the loading of dedicated bulk carriers using land-based cranes to bottom discharge from the FBCs into the vessel holds. The 20,000–30,000 deadweight tonnage (DWT) bulk carrier will dock at the destination port, whereafter the customer would offload, store, load, and rail/truck the concentrate to their smelter.
Once the Refinery has commenced production, the same logistics route will be used, with concentrate trucked from Kabanga to the Kahama Refinery approximately 320 km by road. The Refinery products, consisting of containerized bulk bags of nickel sulfate and cobalt sulfate, as well as copper cathode secured on pallets, would be transported approximately 32 kilometers by truck to the Isaka rail terminal. Products would then be loaded onto wagons, and railed through Kwala for intermediate storage, then railed to Port where it will be loaded in containers onto shipping lines.
| 1.10 | Market Studies |
Markets for nickel, copper, and cobalt metals are well established, and demand for these metals is expected to continue to grow in the long term, given the global trend of decarbonization and electrification. All three metals are key components in batteries, consumer electronics, energy storage, and renewable energy capacity, and the outlook for these sectors remains robust. Information on supply and demand includes data and forecasts for metals pricing prepared in May 2025 by CRU International Ltd (CRU).
Nickel demand is forecasted to exceed 4 Mtpa in 2028, with demand driven by increasing stainless steel consumption, which remains the largest consumer of nickel, and battery consumption, which is expected to increase at the fastest rate of all the major categories. Most of this is consumed in Asia, specifically China, with modest consumption in Europe and the Americas. Nickel demand is forecast to be strong over the short, medium, and long term due to increasing EV and other Energy Storage Systems (ESS) including residential battery storage, portable power, and motive battery demand, overlaying steady stainless steel consumption growth. Nickel demand for battery applications is forecast to double over the next five years and triple by 2035. (IDTechEx, (2023))
There are a number of key long-term nickel price drivers. Upside factors include onshoring critical mineral supply chains, driven by regulations like the U.S. Executive Order on Critical Minerals, promoting low-carbon emissions and secure supply chain nickel. Rising Indonesian production costs due to declining ore grades, higher energy needs, increasing royalties, and higher tailings storage/ environment, social, and governance (ESG) costs should also support prices. Downside risks include expanded low-cost Indonesian ferronickel, nickel pig iron, and high-pressure acid leaching (HPAL) capacity. Additionally, battery technology shifts to manganese-rich or lithium iron phosphate (LFP) cathodes and increased nickel recycling could dampen demand.
Page
|
/ / Initial Assessment - Technical Report Summary |
|
Cobalt demand is propelled by EVs and renewable energy, despite declining cobalt intensity in batteries due to the uptake of LFP and cobalt-lean nickel-manganese-cobalt (NMC) cathodes. Supply, primarily a by-product of nickel and copper mining, is concentrated in the Democratic Republic of the Congo (DRC), raising supply chain and ESG concerns, especially with the European Union’s (EU) Critical Raw Materials Act. Long-term cobalt demand is expected to outstrip supply.
Concentrate will be sold to the export market for the first five years of operations and the Project has received indicative, non-binding offtake terms for 100% of the concentrate during this period with potential customers providing payment and delivery terms. The market for nickel concentrate is well established, and demand for this high-grade product is strong, particularly due to Kabanga’s high-grade and low impurities.
Once constructed at Kahama, the Refinery will produce final battery grade nickel sulfate, cobalt sulfate, and copper metal, with transport of these final products to the Port of Dar es Salaam for export. Approximately 13.6% of the total concentrate produced will still be exported as and when the concentrate tonnage exceeds the Refinery’s 50 ktpa nickel production capacity.
Nickel and cobalt sulfates are key raw material to produce nickel-based batteries. High-purity nickel sulfate is an efficient feedstock relative to nickel and cobalt metal because, according to potential customers, it is easily dissolved, leading to a more streamlined and cost-effective process for end-users. Nickel sulfate pricing used in the IA has been provided by Project Blue and relates to the Shanghai Metals Market (SMM), the largest and most transparent source of sulfate pricing. Cobalt sulfate has been modeled on parity with the LME cobalt metal consensus price forecast.
Table 1-3: Kabanga Long-Term Metal Price Assumptions
Metal |
Long-Term Price (USD/lb) |
| Nickel | 8.49 |
| Copper | 4.30 |
| Cobalt | 18.31 |
The Kabanga concentrate product has a high nickel grade, contains payable levels of copper and cobalt, and low, unpenalizable levels of impurities. Deleterious elements such as arsenic, antimony, lead and zinc, which can potentially attract penalties in nickel concentrates, have been determined through both historical and current testwork not to reach threshold limits.
Metallurgical algorithms have been developed from testwork to model concentrate grades based on the mine production schedule. The algorithms consider the different feed types, feed grades, and feed blends to determine annualized recoveries and concentrate grades for the payable metals, specifically nickel, copper, and cobalt. The recoveries and concentrate grades of sulfur, iron and magnesium/magnesia have also been modeled based on recovery algorithms derived from the testwork and the concentrate mass recovery. Minor element grades are based on comprehensive assays of flotation testwork concentrate samples.
The proposed LoM concentrate grade is 17.3% nickel, 2.6% copper, and 1.3% cobalt. Over the same period, the concentrate has a calculated sulfur grade of 32%, iron grade of 39%, and a low magnesium grade of 0.4%. The typical Kabanga concentrate specifications are presented in Table 1-4.
Table 1-4: Kabanga Concentrate Typical Specification
Element |
Unit | Typical | Minimum | Maximum |
| Ni | % | 17.3 | 16 | 18 |
| Co | % | 1.3 | 1.0 | 1.5 |
| Cu | % | 2.6 | 2.0 | 3.0 |
| Fe | % | 39 | 37 | 40 |
| S | % | 32 | 31 | 33 |
Page
|
/ / Initial Assessment - Technical Report Summary |
|
Element |
Unit | Typical | Minimum | Maximum |
| Pt | ppm | 0.25 | 0.05 | 0.45 |
| Pd | ppm | 0.35 | 0.2 | 0.5 |
| MgO | % | 0.8 | 0.5 | 1.1 |
| SiO2 | % | 7 | 5 | 9 |
| Al | % | 0.7 | <1 | |
| Ca | % | 0.2 | <0.5 | |
| Mn | % | 0.03 | <0.05 | |
| Cr | % | 0.1 | <0.2 | |
| As | ppm | 50 | <50 | 100 |
| Bi | ppm | 5 | <10 | |
| Sb | ppm | 5 | <10 | |
| Pb | ppm | 200 | <500 | |
| Zn | ppm | 150 | <200 | |
| Cd | ppm | 10 | <20 | |
| Cl + F | ppm | <200 | <500 | |
| Au | ppm | 0.5 | ||
| Ag | ppm | 7 | ||
| Fe/MgO | # | 46 | 36 | 75 |
| Moisture | % w/w | 9.0 | > DEM | < TML |
Note : DEM: Dust Extinction Moisture; TML: Transportable Moisture Limit
The IA uses a concentrate metal payability for nickel, copper and cobalt respectively based on Cost, Insurance and Freight (Incoterms® 2020) (CIF) delivery terms to the destination port as per the indicative terms provided by potential customers.
| 1.11 | Environmental, Permitting and Social License |
The Project is committed to responsible mining practices that protect environmental resources, promote social welfare and engagement, and ensure transparent and accountable governance.
The Project aligns with key international standards, including International Finance Corporation (IFC) Performance Standards, the Equator Principles, and the GISTM. Regulatory approvals are required for the development of the Project and operation of the facilities. These include the Environmental and Social Impact Assessments (ESIAs) and permits for the Kabanga Site, Kahama Site, and the Kabanga Resettlement Sites.
ESIAs were completed for the Kabanga Site, Kahama Site, and the Kabanga Resettlement Sites, securing approval certificates from the National Environment Management Council (NEMC). International standard ESIAs have been completed for the Kabanga Site and the Kabanga Resettlement Sites, with the ESIA for the Kahama Site for completion in June 2025.
The key environmental and social licenses and permits submitted for the Project include:
Kabanga Site:
| ● | Environmental Impact Assessment (EIA) Certificate (EC/EIS/824) – granted June 2021 |
| ● | Ruvubu River Water Use Permit (95100766) – granted September 2024 |
| ● | Resettlement of host sites: EIA Certificate (EC/EIA/2023/6288) – granted September 2024 |
Page
|
/ / Initial Assessment - Technical Report Summary |
|
Kahama Site:
| ● | EIA Certificate (EC/EIA/2022/1169) – granted February 2024 |
| ● | Variation of EIA (EC/EIA/2022/1169) – granted April 2025 |
Land Access and Resettlement
In order to develop the Kabanga Mine and Concentrator, the Project requires a footprint of 4,073 ha from which 353 households will be physically displaced, while 967 households will be economically displaced (land used for agriculture only).
A Resettlement Action Plan (RAP) has been developed to restart the process of adequately managing the physical and economic resettlement of the project-affected persons (PAPs) during the project land acquisition process in a sustainable manner. The RAP addresses the socio-economic impact on the project-affected households (PAH) and is informed by the Kabanga Relocation Host Site ESIA, which focuses on the seven host sites where PDHs will be relocated to. The resettlement process is aligned with both national and international standards. Ninety-six percent of cash compensation agreements have been signed since November 2023 and the PAHs have indicated their willingness to be resettled, allowing the Project to commence with building of houses and relocation from priority areas as required.
Mine and Facility Closure
The mine closure strategy has been developed to align with Tanzanian legislation and global standards, such as the IFC, International Council on Mining and Metals (ICMM), and GISTM standards, focusing on responsible environmental rehabilitation, financial assurance, stakeholder engagement, and the development of an eco-enterprise legacy, while ensuring regular plan updates, regulatory compliance, and sustainable tailings management for long-term community and environmental protection.
| 1.12 | Capital and Operating Costs |
| 1.12.1 | Capital Costs |
Pre-production capital scope includes the design, construction and commissioning on an Engineering, Procurement and Construction Management (EPCM) basis of the Kabanga Mine and Concentrator and the associated on-site and off-site infrastructure such as the TSF, accommodation camps, access road upgrades, and electrical grid connection. Funding of the relocation and livelihood restoration plans has also been included in this construction phase. An Association for the Advancement of Cost Engineering (AACE) 18-R.97 Class 5 Cost Estimate with an accuracy range of ±50% has been delivered, meeting the expectations of an IA.
The sustaining capital cost estimate (Sustaining Capex) includes capitalized maintenance, fleet replacement, ventilation and cooling, TSF wall raises, and closure costs. The Kahama Refinery is planned to come online five years after the first concentrate is produced and has hence been included in the Growth Capex category.
The capital cost estimate (exclusive of escalation) presents capital expenditure (Capex) in United States dollars (USD), base dated Q1 2025. Table 1-5 provides a summary of the Project’s capital cost estimate, including Pre-Production, Sustaining, Growth, and Closure Capex, categorized by major Project areas in accordance with the Work Breakdown Structure.
Page
|
/ / Initial Assessment - Technical Report Summary |
|
Table 1-5: Project Capital Cost Estimate Summary
Capex Areas |
Pre-Production Capex | Sustaining Capex |
Growth Capex | Closure Capex |
| USD Million | ||||
| 2000 – Mining | 238.13 | 1,227.41 | 17.42 | - |
| 3000 – Concentrator | 254.66 | 50.12 | - | - |
| 5000 – Kahama Refinery | - | 70.04 | 610.24 | - |
| 6000 – Infrastructure, Utilities and Ancillaries | 213.92 | 113.41 | - | - |
| 8000 – Owners Cost, Administration and Overheads | 89.65 | 7.96 | - | 82.81 |
| 10000 – Land Access and Resettlement | 77.05 | 5.54 | - | - |
| Contingency | 117.89 | - | 123.79 | - |
| Total Capex | 991.31 | 1,474.48 | 751.45 | 82.81 |
| 1.12.2 | Operating Costs |
The AACE 18-R.97 Class 5 estimate has been developed, with an accuracy range of ±50%, in line with the expectations of an IA.
The operating cost estimates (Opex) for the Concentrator, Refinery, and infrastructure were developed using a zero-based approach, incorporating comprehensive testwork, engineering inputs, and consultations with industry experts. The estimates incorporate labor, power, water, reagents and consumables, maintenance, materials handling, laboratory and concentrate transport, and are divided into fixed and variable costs. The mining costs were developed by applying the mining physicals and pricing from a well-advanced contract mining tender process.
The operating cost estimate (exclusive of escalation) presents Opex in USD, base dated Q1 2025. Table 1-6 provides a summary of the Project’s operating cost estimate.
Table 1-6: Operating Cost Estimate Summary
Area |
Project
Cost (USD Million) |
Project
Cost per Tonne Processed (USD/t) |
Project
Cost per Pound Nickel (USD/lb Ni) |
| 2000 – Mining | 3,685.91 | 54.24 | 1.60 |
| 3000/6000 – Concentrator and Infrastructure | 840.69 | 12.37 | 0.36 |
| 5000 – Kahama Refinery | 1,332.31 | 18.57 | 0.55 |
| 8000 – Owner’s Cost, Administration and Overhead Costs | 256.15 | 4.88 | 0.15 |
| Total Opex | 6,111.06 | 90.06 | 2.67 |
| 1.13 | Economic Analysis |
The Project economic results and Project cash flows, with and without Inferred Mineral Resources, are shown in Table 1-7, Figure 1-7 and Figure 1-8. This IA is preliminary in nature and the economic analysis includes Inferred Mineral Resources that are considered too speculative geologically to have modifying factors applied to them that would enable them to be categorized as Mineral Reserves and there is no certainty that this economic assessment will be realized. Approximately 23% of the Mineral Resources used in the IA were classified as Inferred. Unlike Mineral Reserves, Mineral Resources do not have demonstrated economic viability.
Other key assumptions and results of the economic analysis are summarized in Section 19.3.
Page
|
/ / Initial Assessment - Technical Report Summary |
|
Table 1-7: Key Project Metrics
Item |
Unit |
Value (with Inferred Mineral Resources) |
Value (without Inferred Mineral Resources) |
| Key Summary Results | |||
| Pre-Production Capex | USD Million | 991 | 991 |
| Capitalized Opex | USD Million | 152 | 149 |
| Growth Capex | USD Million | 751 | 732 |
| Sustaining Capex (incl. Closure) | USD Million | 1,557 | 1,210 |
| AISC (net of by-product credits) | USD/lb Refined Ni | 2.71 | 2.73 |
| Project Life | Years | 24 | 20 |
| Discount Rate | % | 8.0 | 8.0 |
| NPV | USD Million | 2,374 | 2,020 |
| IRR | % | 22.9 | 23.0 |
| Payback Period | Years | 9.8 | 9.7 |
| Capital Efficiency (NPV/Pre-production Capex (incl. capitalized Opex) | Ratio | 2.1 | 1.7 |
| Capital Efficiency (NPV/Pre-production + Growth Capex) | Ratio | 1.3 | 1.1 |
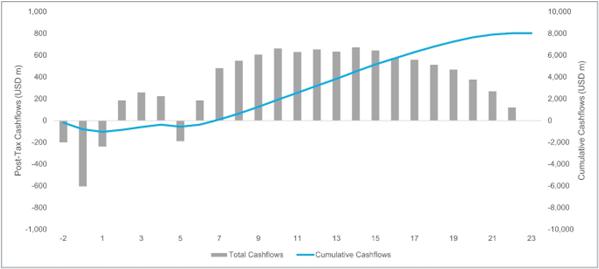
Figure 1-7: Project Cash Flows (with Inferred Mineral Resources)
Page
|
/ / Initial Assessment - Technical Report Summary |
|
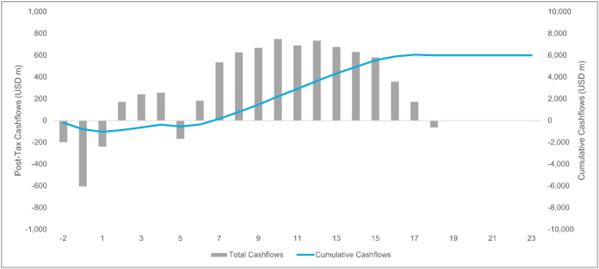
Figure 1-8: Project Cash Flows (without Inferred Mineral Resources)
| 1.14 | Conclusions and Recommendations |
| 1.14.1 | Geology and Mineral Resources |
The Mineral Resource estimates in this report are based on resource modeling completed and published in December 2024. The Qualified Person (QP) has prepared the modeling and reviewed supplied data and considers the MRE to be acceptable.
Mineral Resource estimates in the IA TRS are reported in accordance with U.S. Regulation S-K subpart 1300 rules for Property Disclosures for Mining Registrants (S-K 1300).
The IA TRS Mineral Resource estimates were shown to meet reasonable prospects for economic extraction through an IA analysis prepared by DRA. The IA has been prepared to demonstrate reasonable prospects of economic extraction, not the economic viability of the MRE. The IA is preliminary in nature, it includes Inferred Mineral Resources that are considered too speculative geologically to have modifying factors applied to them that would enable them to be categorized as Mineral Reserves, and there is no certainty that this economic assessment will be realized.
Key recommendations regarding Geology and Mineral Resources are:
| ● | Continue to update and evaluate the Mineral Resources as additional information becomes available. |
| ● | Test for further extensions of mineralization, such as at Safari Link, and develop a regional exploration program to test other identified geophysical anomalies, such as Rubona Hill. |
| ● | Additional infill drilling and interpretation to convert Inferred Mineral Resources to Measured and Indicated Mineral Resources. |
| 1.14.2 | Project Development |
The preliminary economic analysis shows a positive business case for the Project at 3.4 Mtpa of mill feed over a proposed 22-year LoM (on the MII basis) producing a nickel sulfide concentrate for the first five years and thereafter nickel and cobalt sulfates and copper cathode products. Overall, the Project is considered to have reasonable prospects for economic extraction as described in this IA.
The QP recommends the following workstreams to be prioritized:
| ● | Progress the FS that is currently underway for the initial phase of project development to further define the Kabanga Mine and Concentrator: |
| ● | A Framework Agreement was signed between the GoT and KNL in 2021, followed by an SML for the development and operation of the Project, which included local beneficiation. The current plan is for a high-grade nickel sulfide concentrate to be exported for five years before the refinery is brought online, whereafter refined products are to be exported. LZM should continue to engage with the GoT to revise the current Framework Agreement to align with the staged development plan of the Project. |
Page
|
/ / Initial Assessment - Technical Report Summary |
|
| ● | An Equitable EBSP is outlined in the Framework Agreement and describes the requirement for a JFM to guide the management and operations and how and when the GoT will derive income from taxes, royalties, duties, levies, and dividends from its 16% interest in the Project. The JFM currently exists in draft between KNL and the GoT, and LZM should continue to engage with the GoT to ensure that this is finalized. |
| ● | Responsibility for the development of the 88 km, 220 kV overhead line (OHL) Kabanga electrical supply rests with TANESCO. The Project should engage regularly to ensure that TANESCO is progressing with permitting and planning to ensure timeous completion. In addition, TANESCO is also responsible for undertaking ESIAs and potential RAP required for construction. The engagement needs to ensure alignment with the Project’s commitment to the implementation of IFC Performance Standards and Equator Principles. |
| ● | To support timely access to the Kabanga Site and maintain alignment with the proposed Project schedule, it is recommended that the relocation of project-affected persons (PAPs) be completed in accordance with the Resettlement Action Plan (RAP), which has been developed in compliance with national regulations and IFC Performance Standard 5. While approximately 96% of the required cash compensation has been paid, prioritizing resettlement in identified critical areas is essential. Continued engagement through the established Resettlement Working Group (RWG) is recommended to facilitate implementation and monitor progress in line with RAP commitments. |
| ● | Close out the additional work for the upliftment of the Project’s ESIA, RAP, and Livelihood Restoration Plan (LRP) activities to meet IFC Performance Standards and Equator Principles. |
| ● | In addition to the key environmental, social, and technical permits already obtained from the GoT, the Project should prioritize and expedite all outstanding permits and licenses required, including those which relate to the Project’s critical path to avoid schedule risk. |
| ● | Improve definition for the Kahama Refinery by progressing a PFS and develop the Refinery demonstration plant to treat the Kabanga concentrate when available. |
| ● | Engage with Tanzania Railways Corporation (TRC) for the completion of the SGR line between Tabora and Isaka, including associated sidings, to not impact the Project critical path (construction, concentrate export, and operations), as well as to secure the Project capacity on the line. |
| ● | The Project has appointed DRA to finalize an FS to be completed in 2025. |
Page
|
/ / Initial Assessment - Technical Report Summary |
|
The Project encompasses the potential development of an underground mine, the construction of a concentrator, and the establishment of the required infrastructure to support these proposed facilities at the Kabanga Site in northwest Tanzania.
Additionally, this Technical Report Summary (TRS) addresses the potential development of the Kahama Refinery and its associated infrastructure near the town of Kahama, which is considered an integral component of the overall Project.
The report’s contents have been prepared by various consultants, namely DRA, OreWin, WSP (SA, AUS and NZ), and personnel employed by LZM and its associated entities.
LZM has advised that the book value of the property and its associated plant and equipment at KNL group level as of April 2025 is USD 129.9 million.
The report was prepared with reference to the requirements of the United States Securities and Exchange Commission (SEC) Regulation S-K 1300.
| 2.1 | Background |
DRA and OreWin have been requested by LZM to prepare an S-K 1300 TRS on the IA of the Kabanga Nickel Project, located in the Ngara District of Northwest Tanzania and the associated hydrometallurgical refinery in Kahama. The majority owner of the Project, KNL, of which LZM holds an 82.992% ownership interest, is the primary source of the information presented in this TRS. LZM is a public company listed on the New York Stock Exchange (NYSE).
| 2.2 | Registrant for Whom the Technical Report Summary was Prepared |
This report was prepared as an IA level Technical Report Summary in accordance with the SEC S-K 1300 regulations (Title 17, Part 229, Items 601 and 1300 through 1305) for LZM.
| 2.3 | Terms of Reference and Purpose of the Report |
The key objective of the IA TRS is to provide a preliminary assessment, based on the current Mineral Resource estimate, indicating that the Project may have the potential to be developed and operated in a technically viable and economically favorable manner
The quality of information, conclusions, and estimates contained herein is based upon the following:
| i. | Information available at the time of preparation; and |
| ii. | The assumptions, conditions, and qualifications set forth in this report. |
This report is intended for use by LZM subject to the terms and conditions of its contract with DRA and relevant securities legislation. The contract permits LZM to file this report as a Technical Report Summary with United States securities regulatory authorities pursuant to the SEC S-K regulations, more specifically Title 17, Subpart 229.600, item 601(b)(96) - Technical Report Summary and Title 17, Subpart 229.1300 - Disclosure by Registrants Engaged in Mining Operations.
The IA is preliminary in nature. It includes Inferred Mineral Resources that are considered too speculative geologically to have the economic considerations applied to them that would enable them to be categorized as Mineral Reserves, and there is no certainty that the economic assessment will be realized.
| 2.4 | Source of Information and Data |
The TRS relies on historical information and recent data generated by the Project. The report uses information from previous public filings and studies related to the Project.
Historical information prepared by previous owners and information from publicly available sources were utilized in this IA TRS. The information sources and references relied upon are discussed in the relevant sections.
Page
|
/ / Initial Assessment - Technical Report Summary |
|
This IA TRS uses information from historical geological investigations, as well as drillhole samples provided from recent drilling campaigns undertaken by the Project. The assessment, use and verification of this data is described in Section 9.
Geophysical, geotechnical, and geohydrological investigations were undertaken by WSP (SA). The assessment and use of this data are described in Sections 13.3 and 15.1.
The design of the Concentrator plant is based on historical testwork data and data generated from the metallurgical testwork program undertaken within the scope of this study, as described in Sections 10 and 14.
The design of the Refinery is based on information from data generated from the metallurgical testwork program undertaken within the scope of this study, as well as data provided by LZM as described in Section 10. Proprietary confidential information provided by LZM to DRA was relied upon in the development of this IA TRS. This information is described in Section 14.2.
Information from an FS carried out by TANESCO was relied upon with respect to the development of the 220 kV supply to the Kabanga Site as described in Section 15.
| 2.5 | Qualified Persons |
This IA TRS was prepared by DRA and Sharron Sylvester.
The Qualified Person (QP)/third-party firm responsibilities for each report section are detailed in Table 2-1.
| 2.5.1 | QP – Sharron Sylvester |
Sharron Sylvester, BSc (Geol), RPGeo AIG (10125), is employed as Technical Director – Geology, OreWin Pty Ltd, and was responsible for the preparation of the sections relating to geology and Mineral Resources as the QP (individual).
| 2.5.2 | QP – DRA |
DRA is a third-party firm comprising mining experts in their respective fields in accordance with 17 CFR § 229.1302(b)(1). LZM has determined that the appointed consultants meet the qualifications specified under the definition of QP in 17 CFR § 229.1300.
Table 2-1: Qualified Persons’ Responsibility Breakdown per Section
No. |
Section Title | QP or Third-Party Firm |
| 1 | Executive Summary (except 1,3,1.5 and 1.14.1) | DRA |
| 1.3 | Geology | Sharron Sylvester |
| 1.5 | Mineral Resource Estimate | Sharron Sylvester |
| 1.14.1 | Conclusions and Recommendations – Geology and Mineral Resources | Sharron Sylvester |
| 2 | Introduction (except 2.5.1 and 2.6.1) | DRA |
| 2.5.1 | QP – Sharron Sylvester | Sharron Sylvester |
| 2.6.1 | Site Inspections – Sharron Sylvester | Sharron Sylvester |
| 3 | Property Description | DRA |
| 4 | Accessibility, Climate, Local Resources, Infrastructure, and Physiography | DRA |
| 5 | History | Sharron Sylvester |
| 6 | Geological Setting, Mineralization, and Deposit | Sharron Sylvester |
| 7 | Exploration | Sharron Sylvester |
Page
|
/ / Initial Assessment - Technical Report Summary |
|
No. |
Section Title | QP or Third-Party Firm |
| 8 | Sample Preparation, Analyses, and Security | Sharron Sylvester |
| 9 | Data Verification | Sharron Sylvester |
| 10 | Mineral Processing and Metallurgical Testing | DRA |
| 11 | Mineral Resource Estimates (except sections 11.4, 11.5 and 11.8.2) | Sharron Sylvester |
| 11.4 | Mineral Resource Cut-off Grade | DRA |
| 11.5 | Reasonable Prospects of Economic Extraction | DRA |
| 11.8.2 | QP Opinion - Other | DRA |
| 12 | Mineral Reserve Estimates | DRA |
| 13 | Mining Methods | DRA |
| 14 | Processing and Recovery Methods | DRA |
| 15 | Project Infrastructure | DRA |
| 16 | Market Studies | DRA |
| 17 | Environmental Studies, Permitting, and Plans, Negotiations, or Agreements with Local Individuals or Groups | DRA |
| 18 | Capital and Operating Costs | DRA |
| 19 | Economic Analysis | DRA |
| 20 | Adjacent Properties | DRA |
| 21 | Other Relevant Data and Information | DRA |
| 22 | Interpretation and Conclusions (except section 22.1) | DRA |
| 22.1 | Interpretation and Conclusions – Geology and Mineral Resources | Sharron Sylvester |
| 23 | Recommendations (except sections 23.1 and 23.8.1) | DRA |
| 23.1 | Recommendations – Geology and Mineral Resources | Sharron Sylvester |
| 23.8.1 | QP Opinion – Geology and Mineral Resources | Sharron Sylvester |
| 24 | References (except “Section 5-9,11: Geology and Mineral Resources”) | DRA |
| 24.5-9,11 | “Section 5-9,11: Geology and Mineral Resources” | Sharron Sylvester |
| 25 | Reliance on Information Provided by the Registrant | DRA / Sharron Sylvester |
Page
|
/ / Initial Assessment - Technical Report Summary |
|
| 2.6 | Details of Personal Inspection |
Table 2-2 and Table 2-3 summarize the details of the personal inspections on the property by the QP and third-party firm, respectively.
| 2.6.1 | Site Inspections – Sharron Sylvester |
Table 2-2 summarizes the details of the personal inspections on the property by the qualified person Sharron Sylvester.
Table 2-2: QP Site Inspection Details – Sharron Sylvester
Expertise |
QP | Date of Visit | Details of Site Inspection |
| Geology/Mineral resource | Sharron Sylvester |
October
27–30, 2023
|
The site visits included briefings from KNL exploration and corporate personnel, and site inspections of the drill rigs, proposed mine, and plant and infrastructure locations at the Project.
Sharron Sylvester, OreWin Technical Director – Geology and QP, visited the SGS assay laboratories at Mwanza in Tanzania, had discussions with SGS management, and inspected the facilities.
All aspects that could materially impact the integrity of the data informing the Mineral Resource estimates (core logging, sampling, analytical results, and database management) were reviewed with LZM staff. The QP met with KNL staff to ascertain exploration and production procedures and protocols. The QP observed the core from diamond drillholes and confirmed that the logging information accurately reflects the actual core. The lithology contacts checked by the QP matched the information reported in the core logs. |
| 2.6.2 | Site Inspections – DRA |
Table 2-3 summarizes the details of the personal inspections on the property by the third-party firm DRA.
Table 2-3: QP Site Inspection Details – DRA
Expertise |
QP | Date of Visit | Details of Site Inspection |
| Mining | DRA | May 5–8, 2025 |
The site visit included the following:
● Discussions and viewing of bulk infrastructure which include power supply, water supply and both the southern & northern access roads.
● Viewing of existing and proposed project Infrastructure facilities, which include camp sites, laydown areas, processing plant, TSF, boxcuts & waste dumps, road infrastructure and waste handling.
● Reviewed and discussed the permitting process and progress thereof.
● Reviewed and discussed the resettlement program. Inspected two of the model houses.
● Visited and inspected the SEZ and the refinery site at Kahama
● Inspected portions of the new SGR line between Isaka and Mwanza.
● Engaged with Grindrod and inspected the M.V Mpungu ferry operating on Lake Victoria at Mwanza. |
| Metallurgy testwork/ Mineral recovery/ infrastructure/ Refinery | DRA | October
8–9, 2023 and May 6–7, 2025; February 8–9, 2023; March 9–13, 2023 |
Kabanga and Kahama inspections on available infrastructure |
| Refinery | DRA | October
8–9, 2023; May 7–8, 2025 |
Existing infrastructure, Stormwater inspections |
| Logistics | DRA | May 8, 2025 | Isaka Dryport inspection |
Page
|
/ / Initial Assessment - Technical Report Summary |
|
| 2.7 | Units and Currency |
This TRS uses U.S. English spelling and metric units of measure. Any reference to tonnes, or when abbreviated as “t” should always be deemed as metric tonnes.
Costs are presented in constant U.S. dollars, as of March 31, 2025.
| 2.8 | Effective Dates |
The effective date of this TRS is June 2, 2025, while the effective date of the Mineral Resource Estimate is December 4, 2024.
| 3.1 | Project Location |
The Kabanga nickel deposit is located in the Ngara District of the Kagera Region in Northwest Tanzania, south of the town of Rulenge, southeast of the nearest town of Bugarama, and close to the border with Burundi. The Project is spread over two locations, the Kabanga Site, including the Kabanga Mine and Concentrator, located at Kabanga, and the Kahama Site, including the Refinery, located in the Kahama District of the Shinyanga Region. Figure 3-1 shows the proposed Kabanga Site and Kahama Site locations in Tanzania.
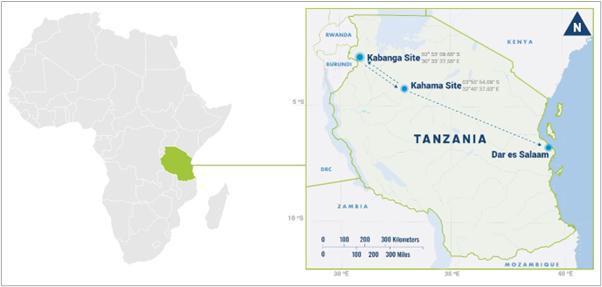
Figure 3-1: Kabanga Nickel Project Location in Tanzania
The Kabanga Site will comprise an underground mine, a concentrator, and supporting infrastructure, all of which will be within the Special Mining Licence (SML) issued to Tembo Nickel Mining Company Limited (MineCo). The Kahama Site incorporates a refinery to be located in Kahama. A Refining Licence (RFL) has been issued to Tembo Nickel Refining Company Limited (RefineCo), which confers the right to refine copper, cobalt, and nickel products in the Kahama District, Shinyanga Region.
The proposed Refinery will utilize the hydrometallurgical processing technology that has been developed by LZM’s wholly-owned subsidiary Lifezone Limited, based on Lifezone Limited’s proprietary processing know-how and expertise. The hydrometallurgical technology will be applied to refine a nickel sulfide concentrate originating from the proposed Kabanga Nickel Project into saleable nickel, cobalt, and copper refined products.
| 3.1.1 | Co-ordinates System |
All co-ordinates presented in this TRS are Universal Transverse Mercator (UTM) projection, unless otherwise specified. The Project is located within UTM zone 36M as seen in Figure 3-1. The Kabanga Site is situated at 2° 53’ S latitude (227,636 mE) and 30° 33’ E longitude (9,681,009 mN). The Kahama Site is situated at 03°50′ S latitude (464,161 mE) and 32°40’ E longitude (9,574,628 mN).
Page
|
/ / Initial Assessment - Technical Report Summary |
|
| 3.2 | Ownership |
The Project is owned by Tembo Nickel Corporation Limited (TNCL). TNCL is 84% owned by Kabanga Nickel Limited (KNL) and 16% by the Government of Tanzania (GoT) Treasury Registrar. KNL is jointly owned by LZM (82.992%), through its 100% owned subsidiaries, and by BHP Billiton (UK) DDS Limited (BHP) (17.008%). The LZM attributable ownership is thus 69.713%, after accounting for the GoT and BHP shareholding. The current Project ownership structure is presented in Figure 3-2.

Figure 3-2: Current Ownership Structure of the Kabanga Nickel Project
The going-forward corporate structure for the Tanzanian operating entities is expected to comprise MineCo and RefineCo being separate legal entities sitting side-by-side. Meetings and discussions between the Project and the GoT have been ongoing since Q2 2024 to effectuate the future corporate structure. KNL and the Tanzania Treasury Registrar will hold 84% and 16% of respective, direct equity interests in both MineCo and RefineCo post-reorganization.
Page
|
/ / Initial Assessment - Technical Report Summary |
|
| 3.3 | Framework Agreement Summary and Economic Benefits Sharing Principal |
A Framework Agreement was signed on January 19, 2021, between the GoT and KNL (the Parties) for the development and operation of the Project, a mining, processing, and refining operation. Initially, MineCo will produce and sell offshore a high-grade nickel sulfide mineral concentrate, also containing copper and cobalt, for the first five years of production. When the Kahama Refinery is operational, RefineCo is expected to purchase the mineral concentrate from MineCo, then process and refine the material in Tanzania to produce nickel sulfate, cobalt sulfate, and copper cathode products for sale. Any surplus concentrate, not taken by the Refinery, will be sold as concentrate.
The Framework Agreement is focused on an equitable EBSP between KNL (formerly LZ Nickel Ltd) and the GoT outlined in Article 3 of that agreement. The key principles of the Framework Agreement are intended to underline and guide the development of the Project for the mutual benefit of the Parties. The key principles include:
| ● | The application of EBSP over the life of the Project, comprising the proposed mine and Refinery. |
| ● | Having a JFM to guide the management and operations of MineCo and RefineCo. |
| ● | Jointly managing the resident project companies (MineCo and RefineCo) pursuant to the current shareholders’ agreement for MineCo (and a new shareholders’ agreement for RefineCo as part of the reorganization). |
| ● | Agreeing on the fiscal assumptions underlying the EBSP. |
| ● | Establishing minerals beneficiation facilities at Kahama township in the Shinyanga Region in Tanzania. |
The Parties agree equitably to share the economic benefits derived from the Project in accordance with the JFM. The EBSP underpins the philosophy of the Framework Agreement and will be defined in and governed by the JFM on a going-forward basis, which is currently in draft form between KNL and the GoT. The overarching principle of the EBSP is that over the life of the Project, KNL and the GoT equally share (50/50) income derived from the Project, on an undiscounted basis. The GoT’s source of income is derived from taxes, royalties, duties, levies, and dividends from its 16% interest in the resident project companies. KNL’s source of income is derived from its 84% interest in the resident project companies.
| 3.4 | Special Mining Licence |
Following the signing of the Framework Agreement, the GoT granted SML number 651/2021, on October 29, 2021, to MineCo for the Kabanga Nickel Project, to conduct mining operations in the Ngara District, Kagera Region, QDS 29/3, 29W/4. The SML is currently in force as of the date of this TRS. It confers to MineCo the exclusive right to search for, mine, dig, mill, process, refine, transport, use, and/or market nickel or other minerals found to occur in association with that mineral, in vertically under the SML area, and execute such other works as are necessary for that purpose. The SML shall remain valid for a period of the estimated life of the proposed mine indicated in the IA TRS or such period as the applicant may request, unless it is cancelled, suspended, or surrendered in accordance with the law. The current SML area is 201.85 km2, and the SML and Project outline are shown in Figure 3-3
An Export Permit is to be obtained for the initial period of concentrate production until the Refinery is operational.
Page
|
/ / Initial Assessment - Technical Report Summary |
|
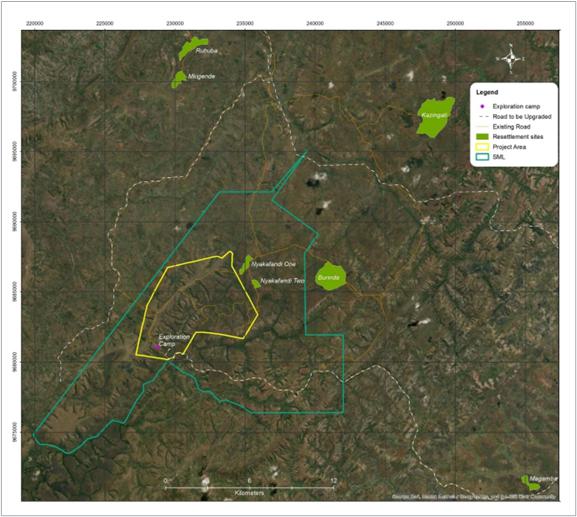
Figure 3-3: Location of the Proposed Mine Site showing SML 651/2021
| 3.5 | The Refinery and the Refining Licence |
The Kahama Site is located within a Special Economic Zone (SEZ) gazetted over the Buzwagi Mining Area (Buzwagi SEZ). On March 19, 2024, the GoT granted an RFL, No. RFL 006/2024, to RefineCo to conduct refining operations in the Kahama District, Shinyanga Region, QDS 63/3. The RFL allocates an area of approximately 100 ha to the RefineCo. The RFL requires an annual licence fee and is granted for 10 years from date of issue. The licence can be renewed prior to its expiration. MineCo will transport and sell nickel sulfide concentrate material to RefineCo for refining after the Refinery has come online.
| 3.6 | Special Economic Zone – Kahama |
RefineCo will make an application to the Tanzanian Export Processing Zones Authority to be a SEZ developer within the SEZ area. It is the intention for the Refinery to be located within the Buzwagi SEZ area and for RefineCo to be the developer of the same. RefineCo will need to apply for and obtain two SEZ licences from the Export Processing Zones Authority, namely:
| ● | A developer’s license (Category A): A developer is an investor with rights over land in an SEZ held for the purpose of developing infrastructure in an SEZ. RefineCo will need a developer’s license during both phases of construction and development of the Refinery in the Buzwagi SEZ. |
| ● | An operator’s license (Category C): An operator is a company incorporated in Tanzania to operate in an SEZ in Mainland Tanzania. RefineCo will need an operator’s license to conduct refining operations in the Buzwagi SEZ. |
Page
|
/ / Initial Assessment - Technical Report Summary |
|
Key Category A and Category C fiscal incentives include a 10-year tax holiday in relation to withholding tax (corporate income tax, rent, and dividends) and property tax, in addition to an exemption of import taxes for machinery, equipment, and construction materials.
| 3.7 | BHP Investment in Kabanga Nickel Limited |
LZM, KNL, and BHP have three commercial agreements:
| 1. | KNL entered into a loan agreement with BHP dated December 24, 2021 (the T1A Agreement), pursuant to which KNL received investment of USD 40 million from BHP by way of a convertible loan, which was subsequently converted into an 8.9% equity interest in KNL on July 1, 2022. |
| 2. | KNL entered into an equity subscription agreement with BHP dated October 14, 2022 (the T1B Agreement). All the conditions precedent of the T1B Agreement were satisfied or waived on, or before, February 8, 2023, and in accordance with the T1B Agreement, BHP subscribed USD 50 million for an additional 8.9% equity interest in KNL on February 15, 2023, giving BHP a total equity interest in KNL of 17.0%. |
| 3. | KNL and LZM’s wholly-owned subsidiary, Lifezone Limited, entered into an option agreement with BHP (the T2 Agreement) dated October 14, 2022, pursuant to which KNL will (at BHP’s option) receive investment from BHP by way of an equity subscription. The option grants BHP the right, subject to certain conditions, to subscribe for the required number of KNL shares that, in aggregate with its existing KNL shareholding, would result in BHP indirectly owning 51% of the total voting and economic equity rights in MineCo and RefineCo on a fully diluted basis as at closing at a price to be determined through an independent expert valuation process. If exercised as at the date of the agreement, the option would result in BHP owning 60.71% of the total voting and economic equity rights in KNL on a fully diluted basis. The T2 Agreement option process commences on the latter of the date on which: |
| ● | The DFS relating to the Project is agreed (or finally determined) between BHP and KNL; and |
| ● | The JFM in respect of the Project is agreed between BHP, GoT, and Lifezone Limited. |
| 3.8 | Lifezone Limited-KNL Development, Licensing and Services Agreement |
On October 14, 2022, Lifezone Limited and KNL entered into the Development, Licensing and Services Agreement, pursuant to which Lifezone Limited agreed to:
| ● | Develop the proposed Refinery that will utilize Lifezone Limited’s hydrometallurgical technology. |
| ● | Once developed, license that technology to KNL for use by or on behalf of KNL initially in connection with an FS and thereafter in connection with the Project. |
| ● | Provide a variety of related services. |
| 3.9 | Mineral Rights, Surface Rights and Environmental Rights |
Under the Framework Agreement, the GoT is committed to assisting MineCo in acquiring the necessary mineral and surface rights, along with environmental approvals for the Project. MineCo needs surface use rights for up to 4,073 ha of land, which will cause physical and economic displacement of households in the affected villages.
An FS final draft was completed in 2014 (KNCL, 2014a), under a previous joint venture agreement between Glencore plc (Glencore) and Barrick Gold Corporation (Barrick), with Glencore as the operating partner. As the Project required land, a RAP was created in 2013, serving as the foundational Resettlement Policy Framework (RPF). Following the recommencement of the Project in 2022, and under the conditions of the SML, a RAP was developed to restart the process of adequately managing the physical and economic resettlement of the PAPs during the project land acquisition process in a sustainable manner. Independent consultants were engaged to update the RAP, and a new RAP was submitted to Tanzanian regulatory standards in 2023, receiving approval on August 16, 2023. Further work has been conducted to enhance the RAP to meet international standards.
Page
|
/ / Initial Assessment - Technical Report Summary |
|
As part of the Kabanga Nickel Project, several ESIAs and permits have been completed. The key environmental and social licenses and permits include:
Kabanga Site:
| ● | Special Mining Licence (SML) 651/2021 – granted October 29, 2021 |
| ● | EIA Certificate (EC/EIS/824) – granted June 2021 |
| ● | EIA Certificate update – granted June 2023 |
| ● | Ruvubu River Water Use Permit (95100766) – granted September 2024 |
Kahama Site:
| ● | Refining Licence (RFL) 006/2024 – granted March 19, 2024 |
| ● | EIA Certificate (EC/EIA/2022/1169) – granted February 2024 |
Resettlement Sites:
| ● | EIA Certificate (EC/EIA/2023/6288) for resettlement host sites – granted September 2024 |
ESIAs were completed for the Project sites, namely the Kabanga, Kahama, and Resettlement Sites, securing approval certificates from the NEMC.
Project changes, including an increase in mine production throughput of 3.4 Mtpa, and the disposal of residue at the Buzwagi pit have triggered a requirement to notify NEMC of these changes. This has necessitated amendments to the existing Environmental and Social Management Plan (ESMP) for the Project at the Kabanga Site, and variations in the ESIA for the Kahama Site. The variation of the certificate for the Kahama Site was granted in April 2025, and the Kabanga Site ESMP update is currently in progress.
Efforts to upgrade these ESIAs to meet international standards are ongoing and are expected to be concluded in Q2 2025.
Following a review of the current supplied information, the opinion of the QPs is that the current plans appear adequate to address any known issues related to environmental compliance, permitting, and local individuals or groups.
Page
|
/ / Initial Assessment - Technical Report Summary |
|
| 4.1 | Overview |
The Project encompasses the development of two Project areas: the Kabanga Site and the Kahama Site in northwest Tanzania.
| 4.2 | Kabanga Site |
| 4.2.1 | Location |
The Kabanga Site, where the mining and concentrating activities will take place, is situated 5 km from the village of Bugarama and 44 km, by road, south of Rulenge. The Port of Dar es Salaam is approximately 1,300 km southeast.
The Kabanga Site lies in the Ruvubu River sub-watershed of the Kagera River, a major river that flows into Lake Victoria. The Ruvubu River, which originates in Burundi and flows in a general northerly direction, defines a portion of the international boundary between Tanzania and Burundi near the Project area. Thereafter, the Ruvubu River continues northwards through Tanzania, and joins the Kagera River at the international boundary with Rwanda, and then flows north, and then east to Lake Victoria.
The Concentrator plant will be constructed near the North boxcut, with the TSF located 7 km east of the Concentrator plant.
| 4.2.2 | Accessibility |
The Kabanga Site is accessible via unpaved roads with two main access routes linking to paved highways. The southern access route, a 72 km unpaved road, connects to National Route B3 at Muzani. The northern access route connects to paved roads to the north, near the town of Ngara. The roads in the surrounding area are managed and maintained by the Tanzanian National Roads Agency (TANROADS), a government agency.
Currently, the northern access road is used for heavy vehicle traffic, while the southern access road will be upgraded to be used during operations, as this offers the shortest and most direct routing to the Refinery, Dar es Salaam, and the interior of Tanzania.
The northern access road also provides a link to the Ngara Airport, 89 km away, which is the closest airport.
| 4.2.3 | Existing Infrastructure |
The area surrounding the Kabanga Site is rural and the local economy is underpinned by small-scale agriculture. The closest village is Bugarama, 5 km to the northwest. Bugarama is a small market village with no notable infrastructure. The town nearest to the Kabanga Site is Rulenge, approximately 44 km to the north. Rulenge has a population of ±23,300 people as per the 2022 census. The district capital, Ngara, is a further 50 km away and has a similar-sized population.
The Kabanga Site has an existing exploration camp, initially used to support drilling activities. This camp is well-maintained, enclosed by a perimeter fence, and includes office buildings, security access control, and facilities for geological assessment, technical services, and community relations. Additional amenities include a canteen, clinic, workshops, staff housing, and space for sample and core storage. The Kabanga Site is equipped with mobile telephone networks and video conferencing facilities for communication. Cell phone reception, via Vodacom and Simba network service providers, is well established.
The exploration camp is currently serviced by a newly upgraded 33 kV electrical supply from TANESCO. This supply is limited to 9 MVA of electrical power, which is suitable for construction and initial mine development. However, this capacity is insufficient for steady state operation and consequently, an overhead transmission line and substation are planned to deliver a 220 kV feed and transformers as part of the Project development.
Page
|
/ / Initial Assessment - Technical Report Summary |
|
The Kabanga Site lacks a nearby railhead, but the Isaka Dry Port, 347 km southeast and 32 km from the Kahama Refinery, offers access to the rail link from Dar es Salaam to Isaka. From there, cargo can be transferred to road transport for delivery to Kabanga. Isaka functions as an inland container terminal and dry port. The rail line is currently being upgraded from a meter gauge to an SGR to enhance capacity and reliability.
| 4.2.4 | Physiography and Vegetation (and Habitats/Species of Conservation Importance) |
The Kabanga Site is situated at 2° 53’ S latitude and 30° 33’ E longitude, within the Ruvubu River sub-watershed of the Kagera River. This major river flows into Lake Victoria, with elevations ranging between 1,375 and 1,730 m above mean sea level (mAMSL). The local topography features a prominent plateau oriented in a northeast-southwest direction, set within an undulating landscape interspersed with valleys. On-site vegetation consists of grasslands with a broadleaf understorey and scattered deciduous trees, providing an intermittent canopy.
The region has a long history of subsistence agriculture, resulting in a highly modified landscape with few mature trees and limited wildlife. Although Tanzania is renowned for its extensive game reserves and diverse wildlife, the local area is predominantly devoid of large mammals. EIAs have identified reptiles, birds, and small rodents as the most common fauna. All plant communities in the area have been somewhat impacted by human activity.
| 4.2.5 | Climate |
The Kabanga Site is situated within the moist sub-humid climate zone of east-central Africa, characterized by monsoonal weather patterns. Historical data indicate an average annual rainfall of 1,014.7 mm, with the majority occurring during the wet season from November to April. Rainfall exhibits a bimodal distribution, with long rains from March to May and short rains from October to December. April is the wettest month, receiving an average of 151.3 mm of rainfall, while June and July are typically the driest months, often experiencing minimal rainfall.
Evapotranspiration in the Kabanga Site is estimated at 1,580.3 mm per year, with potential evaporation peaking from June to October. The average annual air temperature is 20 °C, with a monthly variation of 2 °C and a daytime temperature variation of approximately 8 °C. Relative humidity averages 66% annually, with the lowest levels observed between June and October.
The climate will allow for year-round operation of the Kabanga Mine and Concentrator.
| 4.2.6 | Seismicity |
The Kabanga Site is in a complex geological region combining the East African Rift System, Tanzanian Craton, and East African Plateau. The East African Rift System includes the West Rift (135 km west of Kabanga) and the East Rift (600 km east). The site is in the Kibaran Orogenic Belt, west of the Tanzania Craton, characterized by infrequent and widely dispersed earthquakes and an absence of Quaternary faults.
In 2008, Golder evaluated potential surface fault rupture hazards at the proposed TSF site, concluding that none of the faults were active or conditionally active, posing no significant fault rupture hazard.
A 2024 Seismic Hazard Analysis (SHA) concluded that the estimated 85th percentile ground motion from the maximum credible earthquake is much lower than the 1:10,000 annual exceedance probability (AEP) which means uniform hazard spectra from the probabilistic seismic assessment. Therefore, the results of the probabilistic seismic assessment are used in the relevant design assessments.
| 4.2.7 | Catchments and Water Resources |
Water to the exploration camp is currently sourced from a borehole located 900 m northwest of the camp. For the operation of the Kabanga Site, water from underground operations will be the primary source, with water extracted from the Ruvubu River at a point within the SML supplementing the supply. In the event that the Kabanga Site is water positive, treated water will be discharged back to the Ruvubu River.
Page
|
/ / Initial Assessment - Technical Report Summary |
|
| 4.3 | Kahama Site |
| 4.3.1 | Location |
The Project plans to develop a hydrometallurgical refinery, 9 km from the town of Kahama, in the Kahama Urban District of the Shinyanga Region in Northwest Tanzania. The Refinery will be located at the newly formed Buzwagi SEZ, which is on the site of the decommissioned Buzwagi Gold Mine.
The Refinery is 536 km northwest of Dodoma (Tanzania’s capital) and 988 km inland from the Port of Dar es Salaam. The Refinery at Kahama lies 320 km southeast of the Kabanga Nickel Mine (see Figure 4-1).
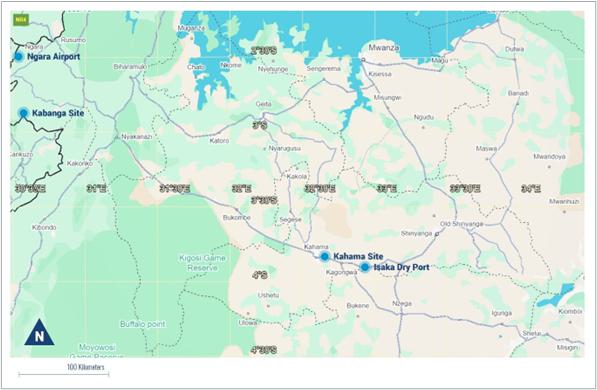
Figure 4-1: Kamaha Location relative to Mwanza, Kabanga Site and Isaka Dry Port
The Kahama Site benefits from the existing infrastructure and amenities available in the nearby town of Kahama, which is a significant enabler for the Refinery. Existing infrastructure includes the Kahama Airport, Kahama Municipal Hospital, market, hotels, and some light industrial engineering businesses providing services to the local mining industry.
Kahama had a population of 453,654 (based on the 2022 census), which would have increased at the projected annual growth rate of 8.7%. The town houses the headquarters of the Kahama District Administration.
| 4.3.2 | Accessibility |
Access to the Refinery is by an asphalt road (the B3), a main trunk road part of Tanzania’s national road network. The Refinery is connected via various paved highways (B3, B141, B129, and A7) to the port of Dar es Salaam via Dodoma.
Kahama Airport (KBH), which was historically managed and operated by the Buzwagi Gold Mine, has been handed over to the Tanzania Airports Authority. The Kahama Airport terminal building was recently upgraded, increasing the airport’s current capability to 200 travelers per day and smaller-sized cargo to fly to Kahama Airport on a regular basis. The airport has direct flights from Dar es Salaam and is located adjacent to the Buzwagi SEZ.
Page
|
/ / Initial Assessment - Technical Report Summary |
|
The nearest railhead is the Isaka Dry Port, 32 km from the Kahama refinery by road. It is currently served by a narrow-gauge railway that connects Isaka to Dar es Salaam. However, this is being upgraded to a standard-gauge rail line that will continue onto Mwanza in the north of Tanzania and provide a rail link to Rwanda.
| 4.3.3 | Existing Infrastructure and Local Resources |
The nearby town of Kahama, with a population exceeding 450,000, offers several advantages for the Project, particularly in terms of staff recruitment and housing. This includes potential recruitment from individuals previously employed at Buzwagi Gold Mine and accommodation for Refinery staff. Kahama is a well-equipped town, providing amenities such as restaurants, guest lodges, retail shopping, and established community infrastructure, including primary and secondary schools, places of worship, and sports fields. Additionally, Kahama has a functioning general hospital supported by local dispensaries.
In addition to the benefits provided by Kahama, the Refinery will leverage some of the infrastructure developed for the decommissioned Buzwagi Gold Mine, including an existing electrical supply.
The existing water infrastructure can provide water to the Refinery from three main sources:
| ● | The main KUWASA reservoir, via a break-pressure tank, can supply 7,500 m³/day. This supply is distributed through three lines already connected to the Buzwagi water storage pond. |
| ● | The rainwater harvest pond, which offers an average volume of 3,000 m³/day, although this supply is seasonal and dependent on rainfall. This source also feeds into the water storage pond. |
| ● | The KUWASA high-pressure transmission line from the Mondo draw-off point with a capacity of 3,500 m³/day. This line is 2.65 km from the Refinery location and would require a new connection to the Refinery supply line. |
The decommissioned Buzwagi Gold Mine open pit presents an opportunity for residue storage. Additionally, the Buzwagi waste rock dump has undergone rehabilitation and could be used as a source of material for earthworks and concrete aggregate.
Various workshops, warehouses, and offices from the mining operations in the SEZ remain and can be utilized to reduce capital costs.
Power to the Kahama Refinery will be supplied from the existing TANESCO Buzwagi substation, already connected to the national grid. While the capacity of the incoming 220 kV supply line is sufficient, the required electrical loads of the Refinery will require the installation of additional transformers at the substation. However, the existing electrical supply is more than adequate for the required construction power. The existing main 33 kV overhead line (OHL) to the decommissioned Buzwagi Gold Plant will be relocated to the south of the Refinery prior to construction and used to supply power to the Refinery.
Accommodation for the staff is available in the town of Kahama. Due to previous mining activities, the town is expected to provide a pool of workers who can be retrained and upskilled to operate the Refinery. An existing village, previously part of the gold mine, is available to house expatriate staff or people recruited from outside the region as needed. The village has a total of 408 beds.
| 4.3.4 | Physiography and Vegetation |
The Refinery features relatively flat terrain with gently rolling topography, with elevations ranging from 1,195 m to 1,235 mAMSL and surface slopes of 3% or less. Positioned on a natural high point, the site slopes away in all directions, specifically towards the northeast and northwest.
The Refinery is bordered to the north by the old plant site water pond (PSWP) and to the west by the decommissioned Buzwagi Gold Plant. To the south lies the Buzwagi Gold Mine TSF, capped by the previous owner.
Page
|
/ / Initial Assessment - Technical Report Summary |
|
| 4.3.5 | Climate |
The Kahama Site is situated within the moist sub-humid climate zone of east-central Africa. Rainfall patterns conform to the regional bimodal pattern, with the highest rainfall occurring in two periods: November to January and March to April. The wettest months are April and December, with average rainfall exceeding 140 mm.
Consistent annual temperatures, with average maximum temperatures around 30 °C and minimum temperatures around 18 °C throughout the year, are experienced. October is typically the warmest month, with temperatures reaching up to 36 °C, while June to August are the coolest months, with temperatures ranging between 18 °C and 29 °C.
Relative humidity at the Kahama Site drops to approximately 60% between June and August, coinciding with the driest period of the year. For the rest of the year, average relative humidity ranges between 64% and 66%, with peaks up to 70% becoming more frequent in recent years. The climate suits year-round operations.
| 4.3.6 | Catchments and Water Resources |
The Refinery also benefits from an existing high-density polyethylene (HDPE)-lined water storage pond with a capacity of 1.5 Mm³ fed by water from a 72.65 ha Water Harvesting Area. The water harvesting is supplemented by a supply of treated water from the KUWASA supply reservoir via three pipelines capable of supplying a total of 7,500 m³/day.
The Kahama Refinery area already has installed water treatment and sewerage handling facilities suitable for use during operation. The existing PSWP was designed to collect stormwater run-off from the gold mining operations for recycling within that process. The PSWP will be refurbished and used in the same application for the Refinery.
| 4.4 | Availability of Infrastructure |
Dar es Salaam, Tanzania’s largest city, hosts the country’s principal port, with a capacity of 14.1 Mt for dry cargo and 6.0 Mt for bulk liquid cargo. The existing port, road and rail infrastructure is being upgraded and expanded, and the electrical grid’s generating capacity is set to double within the project establishment timeframe.
The GoT is increasing the national power generation capacity of 2,100 to 5,000 MW. A key component of this is the Julius Nyerere Hydropower Project, which has a total capacity of 2,100 MW. The project is nearing completion with eight of the nine power-generating units operational.
The SGR development will increase the capacity of the current Meter Gauge Railway (MGR) train loads from 800 tonnes per train by a significant factor.
The Isaka dry port infrastructure will also facilitate the transfer of loads from rail to road transport at both Kabanga and Kahama, substantially lowering operational transport costs. Furthermore, customs clearance can be completed at the Isaka Dry Port for goods imported into Tanzania as well as those intended for export. This arrangement provides the advantage of conducting these formalities at a location closer to the Project, therefore allowing better control and reducing potential delays.
| 4.5 | Country and Regional Setting |
Tanzania, located on the east coast of Africa, has maintained relative political stability since its independence in 1961. The United Republic of Tanzania was formed in 1964 following the union of Tanganyika and Zanzibar. The country operates as a constitutional multi-party democracy with two governments: the Union Government for the mainland and the Zanzibar Government. Tanzania is a member of several international and regional organizations, including the East African Community which facilitates a customs union with neighboring countries. Political stability has enabled Tanzania to foster a conducive environment for economic growth and development.
Tanzania is the most populous country in East Africa, with an estimated population of 69.4 million in 2024, characterized by a youthful and predominantly rural demographic. Economic growth has been robust, with a reported GDP growth of 5.5% in 2024 and projections for 6% in 2025. This growth is fueled by expanding exports, a good agricultural season, and increased electricity supply. Swahili and English serve as the official languages, with Swahili widely spoken and English used in commerce and administration. The administrative structure of Tanzania is highly organized, with the Kabanga Nickel Project situated in the Kagera region, known for its proximity to the Rwanda and Burundi borders. Local governance and community relations are pivotal for Project success, given the centralized system extending to the village level.
The mining sector is a significant contributor to Tanzania’s economy, targeted to reach 10% of GDP by 2025. The country is rich in various minerals, including nickel, gold, and diamonds. The government’s focus on increasing mineral beneficiation aligns with the Kabanga Nickel Project, which aims to process concentrate within Tanzania. This initiative is part of a broader strategy to attract foreign investment and expand the mining industry, following the privatization and liberalization reforms of the 1990s. Tanzania’s stable political climate and strategic economic policies continue to position it as a key player in the regional and global mining sectors.
Page
|
/ / Initial Assessment - Technical Report Summary |
|
Exploration at the Project has been undertaken in several different phases for over 45 years, with more than 637 km of drilling having been completed up to the effective date of the Mineral Resource Estimate.
| 5.1 | UNDP Era (1976–79) |
The first drilling on the deposit was undertaken between 1976 and 1979 by the United Nations Development Programme (UNDP), as part of a regional targeting for ultramafic bodies to identify nickel sulfide and nickel laterite mineralization within the East African Nickel Belt in western Tanzania and Burundi.
In the Project licence area, 61 UNDP drillholes were completed, with work focused on two areas of interest at that time, known as Block 1 and Block 2. These holes intersected five separate mafic-ultramafic bodies over a 7.5 km strike length and culminated in the delineation of an Indicated Mineral Resource for the area now known as the Main zone.
An outbreak of hostilities between Tanzania and Uganda in 1978–79 caused work at the Project to be halted.
| 5.2 | Sutton Era (1990–99) |
| 5.2.1 | Sutton – BHP JV Era (1990–95) |
Following a 10-year government moratorium on exploration, Sutton Resources Ltd (Sutton) negotiated the mineral rights to the Project and formed Kabanga Nickel Company Limited (KNCL) and Kagera Mining Company Limited in 1990. Initial work on the Main zone was expanded in 1992 to include the Kagera licence area to the northwest, through the formation of a JV with BHP.
Exploration of the Kagera licence was undertaken from the Mururama exploration camp, located approximately 30 km northwest of the current Kabanga camp. The Kabanga exploration camp was established in its current location in 1993. Work continued to focus on the two Blocks outlined by the UNDP.
During 1993, drilling was undertaken approximately 1 km north of the Main zone, targeting the down-dip extension of a gossan ridge associated with a geophysical anomaly. A small, pipe-like ultramafic body was identified, with more than 100 m of massive sulfide mineralization intersected (drilled along plunge). This area is now known as the North zone. Drilling at the Project continued until the end of 1995, at which time BHP exited the JV. By this time, Main zone and North zone Mineral Resources had been reported.
| 5.2.2 | Sutton (1995–97) |
After the withdrawal of BHP, Sutton approached the market to obtain funding for continuing work at Kabanga and Kagera. Several companies assessed the Project, and in July 1997, Anglo American Corporation (Anglo) entered into a JV agreement on both properties.
| 5.2.3 | Sutton – Anglo JV Era (1997–99) |
In July 1997, Sutton and Anglo entered into a JV on both properties. Drilling recommenced in October 1997 following refurbishment of the Kabanga camp. The initial focus of this drilling campaign was to extend the North zone high-grade massive sulfide resource, which appeared to be open at depth to the north. The deepest intersection from this program was 9 m of massive sulfide mineralization at approximately 800 m below the surface.
In April 1998, after completion of a total of 53 drillholes, an updated North zone Mineral Resource of 14.3 Mt at 2.56% Ni was reported.
Despite the lure of the open mineralization at North zone, the recognition of the need for additional shallower mineralization to increase early throughput of the plant to an economic level led to a shift of exploration focus back to the Main zone area. Drilling recommenced in May 1998 and continued until October 1998. The main zone was remodeled, concentrating on the contact-associated massive sulfide mineralization. Updated Mineral Resources were estimated for the Main zone and the North zone, but these were not published.
Page
|
/ / Initial Assessment - Technical Report Summary |
|
| 5.3 | Barrick Era (1999–2004) |
In 1999, Barrick, through its purchase of Sutton, gained control of Bulyanhulu and other gold properties, thereby becoming ground holders at Kabanga and JV partners with Anglo.
After Anglo withdrew from the project in 2000, Barrick recommenced exploration of the down-dip extension of the North zone massive sulfide body. Drilling in January 2001 intersected mineralization at depth, which appeared to be separate from the North zone and similar in style to the Main zone mineralization. This zone, located between Main zone and North zone, was named MNB.
Drilling through to 2002 refocused on the North zone, extending the massive sulfide body to the north. Deep drilling below the North zone (1,500–1,700 m below surface) intersected massive sulfide mineralization that was interpreted in 2007 to be part of the zone now known as Kima.
In 2003, Barrick completed a scoping study that was largely based on its work with Anglo. This scoping study relied on unpublished Mineral Resource estimates generated in 2002 using drilling completed up to the end of 2001.
In February 2004, Barrick began negotiations with Falconbridge Limited (Falconbridge) (which would later become part of Xstrata plc (Xstrata) and eventually Glencore plc (Glencore)) to form a JV partnership. No further exploration work was undertaken for the remainder of 2004.
| 5.4 | Barrick – Glencore JV Era (2005–18) |
In 2005, Barrick issued a press release announcing a JV partnership with Falconbridge (Falconbridge was acquired in 2006 by Xstrata, which then merged into Glencore in 2013). In the press release, Barrick also announced an Inferred Mineral Resource estimate for the Project of 26.4 Mt at 2.6% Ni, which represented the sum of the Main zone and North zone models from 2002.
A total of 64,957 m across 127 drillholes was completed between January 2005 and March 2006 for a scoping study (Phase I scoping study). Work focused on verifying and infilling the models at the Main, North, and MNB zones.
Other exploration work was completed during this time to support the Phase I scoping study. This included: geophysical surveys proximal to the North and Main zones, collection and shipping of metallurgical samples, and geotechnical drilling at proposed infrastructure sites.
Between April and November 2006, a total of 81,256 m across 148 drillholes was completed for Phase II of the scoping study. This drilling program was designed to continue to improve the confidence of the resource and to discover additional shallow, large-tonnage mineralization to improve the economics of the Project. This work focused on verifying and infilling the mineralization in the North and MNB zones. Additional metallurgical sample was also acquired for preliminary grinding/flotation testing at Xstrata Process Solutions (XPS) in Canada. Updated resource models were generated for the Main, MNB, and North zones, and a new model for the newly-defined Tembo zone.
In mid-2006, Xstrata purchased Falconbridge and acquired 50% ownership of the Project.
A total of 242,347 m across 555 drillholes was completed between December 2006 and November 2008 for a PFS. This drilling program was designed to further improve confidence in the North zone and Tembo zone resources and to discover additional mineralization to improve the economics of the Project within a 15 km trucking distance of the planned mine infrastructure. Further metallurgical samples were also acquired for two pilot plant test runs. During 2007, the Kima zone massive sulfide was interpreted beneath North zone.
Regional exploration drilling tested seven high-priority regional exploration targets at Bonde, Nyoka, Jabali, Balima, Kilimanjaro, Safari, and Nyundo (Keza-3). In November 2007, massive sulfide mineralization was intersected at the Safari target with the discovery hole grading 1.88% Ni over 10.1 m as-drilled width.
Mineral Resource estimates were reported for the 2008 models in the 2008 Xstrata annual report.
Page
|
/ / Initial Assessment - Technical Report Summary |
|
From December 2008 through August 2009, a total of 21,368 m of drilling was completed. This drilling program was successful in transferring a portion of the resources in the mid North zone from Inferred to Indicated status. Independent quality assurance and quality control (QA/QC) and resource audits were completed during this time.
From 2010 through 2014, extensive geological/geophysical interpretation was carried out over the Kabanga licence area, coupled with assaying of unsampled historical BHP / Anglo holes in the Main zone area, and led to the development of several high-tenor nickel targets in the southern part of the Project area. Regional exploration work in this period was confined to geological mapping over regional licences and establishing access routes for planned 2011 programs. Subsequent drilling in 2014 was limited to four holes, which were drilled to test two new target areas, and an additional two holes drilled into the Tembo North mineralization.
In 2015, the Project was widely reported to be on the market as Barrick and Glencore reconsidered their portfolios.
| 5.5 | Tanzanian Mining Law Reform (2018–21) |
The Kabanga licence held by the Barrick – Glencore JV was due to expire in 2019, however, Tanzanian mining law changed in 2018, and one result was that all Tanzanian Retention Licences were cancelled; hence, the Barrick – Glencore JV effectively lost its rights to the Project.
During this period of legislative reform, the Barrick – Glencore JV reported that it was engaged in constructive dialogue with the GoT with a view to reinstating its rights over the Project.
On January 19, 2021, LZ Nickel Limited (predecessor of KNL) announced that it had signed a binding Framework Agreement with the GoT for development of the Kabanga Nickel Project through the establishment of the TNCL and the granting of an SML – the first of its kind – and a Refining Licence (RFL).
In parallel, KNL entered into an agreement with the Barrick – Glencore JV to exclusively acquire all data and information relating to the previous mineral resource estimation, all metallurgical testwork and piloting data, analyses and studies, including a comprehensive draft FS report produced in 2014 and subsequent updates.
| 5.6 | Previous Technical Report Summaries |
| 5.6.1 | March 2023 Technical Report Summary |
In March 2023, the Kabanga 2023 Mineral Resource Technical Report Summary was prepared by Lifezone Holdings Ltd. (LHL), filed by LZM in April 2023 (LHL, 2023).
| 5.6.2 | November 2023 Technical Report Summary |
In December 2023, the Kabanga 2023 Mineral Resource Update Technical Report Summary was filed by LZM (OreWin, 2023). The 2023 Mineral Resource estimates were based on the Project drillhole database available as at September 17, 2023, which totaled 622,484 m.
| 5.6.3 | December 2024 Technical Report Summary |
The December 2024 Mineral Resource Update TRS (2024MRU) was based on all Project drilling completed to December 4, 2024, which equated to 637,749 m. The 2024MRU was reported in the Kabanga 2024 Mineral Resource Update Technical Report Summary, dated December 4, 2024 (OreWin, 2024).
Page
|
/ / Initial Assessment - Technical Report Summary |
|
| 6.1 | Regional Geological Setting |
Geologically, the Kabanga nickel deposit is located within the East African Nickel Belt, which extends approximately 1,500 km along a northeast trend that extends from Zambia in the southwest, though the Democratic Republic of the Congo (DRC), Burundi, Rwanda, Tanzania, and Uganda in the northeast, and straddles the western boundary of the Tanzania Craton to the east, and the eastern boundary of the Congo Kasai Craton to the west.
In the northern and central sections of the East African Nickel Belt, a thick package of Paleoproterozoic to Mesoproterozoic metasedimentary rocks, from the Karagwe-Ankole Belt (KAB), overlies this boundary, within which occurs a suite of broadly coeval, bimodal intrusions (Evans et al., 2016). These igneous rocks correspond to the Mesoproterozoic Kibaran tectonothermal event between 1,350–1,400 Ma (Kokonyangi et al., 2007; Tack et al., 2010).
The KAB has been divided into several broad domains (Tack et al., 1994):
| ● | An Eastern Domain (ED) that is characterized by lower degrees of metamorphism and tectonism, and the absence of Kibaran-aged granite magmatism, |
| ● | A Western Domain (WD) characterized by higher degrees of metamorphism and polyphase deformation, and the voluminous Kibaran granite intrusion, and |
| ● | A Transitional Domain (TD) between the other two domains, which is marked by a northeast-trending line of mafic-ultramafic intrusions known as the Kabanga-Musongati Alignment, (Tack et al, 1994). |
The sedimentary rocks of the ED and WD form uncorrelated and distinct sub-basins, both comprising alternating arenaceous and pelitic rocks, including quartzites, schists, greywackes, and conglomerates developed in long-lived, shallow water intracratonic and pericontinental basins, (Fernandez Alonso et al., 2012).
The Kibaran igneous rocks comprise mafic-ultramafic intrusions, including well-differentiated lopolithic layered intrusions and small, narrow, tube-like sills, often concentrically zoned, called chonoliths. The nickel mineralization zones discovered to date have exclusively been found associated with the mafic-ultramafic intrusions, in particular, along the Kabanga-Musongati Alignment (Deblond and Tack, 1999; Evans et al, 2000). Felsic intrusions occur coeval with the mafic ultramafic intrusions. Recent ages (zircon U Pb SHRIMP) from Kabanga date the marginal mafic rocks of the intrusion at 1,403 ± 14 Ma, (Maier et al., 2007).
Page
|
/ / Initial Assessment - Technical Report Summary |
|
Figure 6-1 shows a stratigraphic column of the regional geology of the area.

Note: KNL, 2023 (modified from Fernandez Alonso et al. (2012), and Koegelenberg et al. (2016)).
Figure 6-1: Stratigraphic Column for the Kagera Supergroup
| 6.2 | Property Geology |
The intrusions that host the potentially economic nickel-bearing massive sulfide zones known to occur in the Project area, namely Main, MNB, Kima, North, Tembo, and Safari, are hosted within steeply-dipping overturned metasediments (dipping 70° to 80° to the west), with a north–northeast strike orientation (025°) from Main to North zone, changing to a northeast strike orientation (055°) (dipping northwest) from North to Tembo. The zones are located within and at the bottom margin of the mafic-ultramafic chonoliths. The chonoliths are concentrically zoned with a gabbronorite margin and an ultramafic cumulate core zone that ranges in composition from sulfidic dunite, plagioclase-peridotite, orthopyroxenite, to olivine melanorite, (Evans et al., 2000).
The metasediments comprise approximately 90% metapelites and metasandstones, with the remainder comprising clean arenitic metasandstones or quartzites, (Evans et al., 2016). Lenses and bands of iron sulfides (up to 5% modal of pyrrhotite) and graphite are common in the more-pelitic rocks, and it has been demonstrated that the sulfur within the different zones has similar isotopic signatures, indicating significant assimilation of external sulfur from the KAB sediments, (Maier and Barnes, 2010).
Page
|
/ / Initial Assessment - Technical Report Summary |
|
A plan view of the geology of the Project area is shown in Figure 6-2.
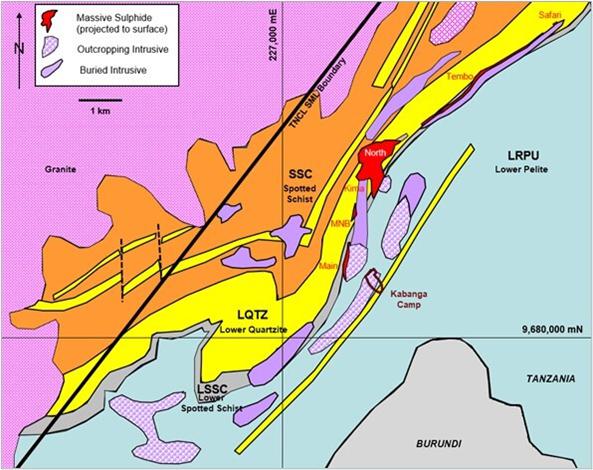
Figure 6-2: Plan View Schematic of Geology of the Kabanga Area (UTM)
| 6.3 | Lithologies and Stratigraphy |
Three lithological groups are present at Kabanga:
| ● | Metasediments comprising a series of pelitic units, schists, and quartzites, forming the hanging wall and footwall of the mineralization. |
| ● | Mafic-ultramafic intrusive complex rocks, which display a wide range of metamorphism/ metasomatism. These lithologies can carry significant sulfide mineralization, such as in the ultramafic unit termed UMAF_1a (≥30% sulfides, located adjacent to the massive sulfide mineralization, present at Tembo and North). |
| ● | Remobilized massive sulfide mineralization (>80% sulfides) (MSSX), which carries 90% of the sulfide occurrence, and massive sulfide mineralization with xenoliths of metasedimentary or gabbro/ultramafic rock (≥50% < 80% sulfides) (MSXI). |
The principal sulfide in the massive sulfide is pyrrhotite, with up to 15% pentlandite. The pentlandite shows distinct globular recrystallization textures, with crystals reaching up to 5 cm in size. Accessory sulfides include chalcopyrite and traces of pyrite, galena, arsenopyrite, cubanite, niccolite, cobaltite, and mackinawite.
Page
|
/ / Initial Assessment - Technical Report Summary |
|
Typical Main and Tembo zone cross-sections displaying the local stratigraphy are shown in Figure 6-3.

Figure 6-3: Typical Stratigraphy Cross-Section Schematics for North and Tembo (local grid)
| 6.4 | Structural Setting |
The Kabanga sulfide lenses are thought to have been remobilized within a large shear zone, initially conforming to early-phase folding geometries, and subsequently modified and partitioned by low-angle thrusting and cross-faulting. The Project area has been found to be structurally complex, with five fault sets identified to date. The complexity of the structural setting is illustrated by the interpreted satellite imagery and a schematic three-dimensional (3D) interpretation.
Of note is the existence of a rock quality designation (RQD) model completed by an independent consultancy (2008–09) to support the current structural interpretation of the Project area.
| 6.5 | Deposit Description |
The Project comprises six distinct mineralized zones, namely (from southwest to northeast) Main, MNB, Kima, North, Tembo, and Safari, which occur over a strike length exceeding 7.5 km. The five mineralized zones that contribute to the Mineral Resource estimate (Main, MNB, Kima, North, and Tembo) extend over a total strike length of 6 km and for up to 1.7 km below the surface.
Figure 6-4 is a projected long-section schematic showing all the mineralized zones identified to date at Kabanga.
| 6.6 | Mineralization Style |
Kabanga sulfide mineralization occurs both as:
| ● | Disseminated to net-textured interstitial sulfides located within the cumulate core of the Kabanga chonoliths, as well as externally, and |
| ● | Massive and semi-massive sulfide bodies along the lower and side margins of the chonolith, that being the contact with the stratigraphic host, (Evans et al., 1999). |
The massive sulfides, defined as having >80% modal sulfide, comprise dominantly pyrrhotite, with trace to 15% pentlandite. These account for the majority of the Mineral Resource estimates reported for the Project. Pentlandite exhibits distinct recrystallization textures expressed as globules up to 5 cm in diameter. Accessory sulfides include chalcopyrite and trace pyrite, galena, arsenopyrite, cubanite, niccolite, cobaltite, and mackinawite. Remobilized, generally pyrrhotite-rich, massive sulfides also occur as cross-cutting and conformable veins within the ultramafic units. Remobilized, generally pyrrhotite-rich, massive sulfides also occur as cross-cutting and conformable veins within the ultramafic units.
Page
|
/ / Initial Assessment - Technical Report Summary |
|
The tenor composition of the sulfides (as represented by the percentage of nickel in 100% sulfide) ranges from 5% to 6% near the basal margins to 0.5% to 1% in the upper cumulates, (Evans et al., 1999; Maier and Barnes, 2010). Tenor also varies between mineralized zones, generally the smaller intrusive bodies (by cross-sectional area) that occur lower in the stratigraphy, such as North and Tembo, are more richly endowed.
The mineralization geometry at each zone is shown on example cross-sections in Figure 6-5 through Figure 6-8.
| 6.7 | Alteration and Weathering |
At the surface, the ultramafic bodies are completely weathered to saprolite. The depth of oxidation ranges from 40–100 m in the Project area. At North, massive sulfides are weathered to depths of 80–100 m. The Tembo massive sulfides horizon is located 98% in fresh, unoxidized material. In general, nickel laterite formation over the associated ultramafic is weakly developed with minor nickel-bearing serpentine and rare garnierite.
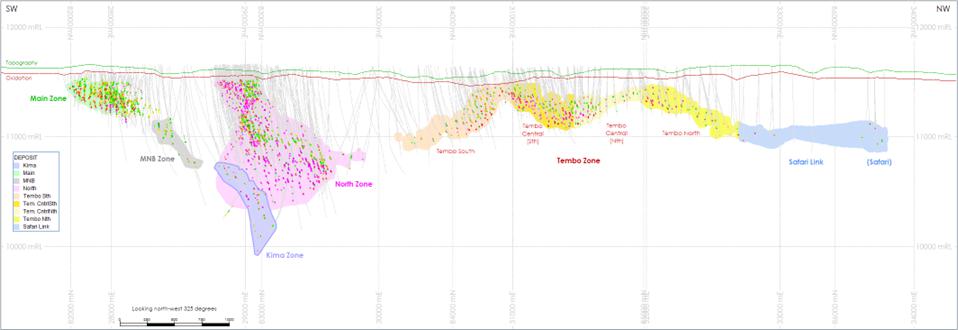
Note: Topography and oxidation wireframes are sliced on the long-section plane, whereas the drillholes and model are projected onto the plane (hence some drillholes appear to collar above topography
Figure 6-4: Schematic Projected Long-Section of the Kabanga Mineralized Zones (truncated UTM, looking northwest)
Page
|
/ / Initial Assessment - Technical Report Summary |
|

Note: * Oblique cross-section looking 030°, +/- 15 m projection.
Figure 6-5: Example Schematic Cross-Section* of Mineralization Geometry at Main Zone (truncated UTM)
Page
|
/ / Initial Assessment - Technical Report Summary |
|
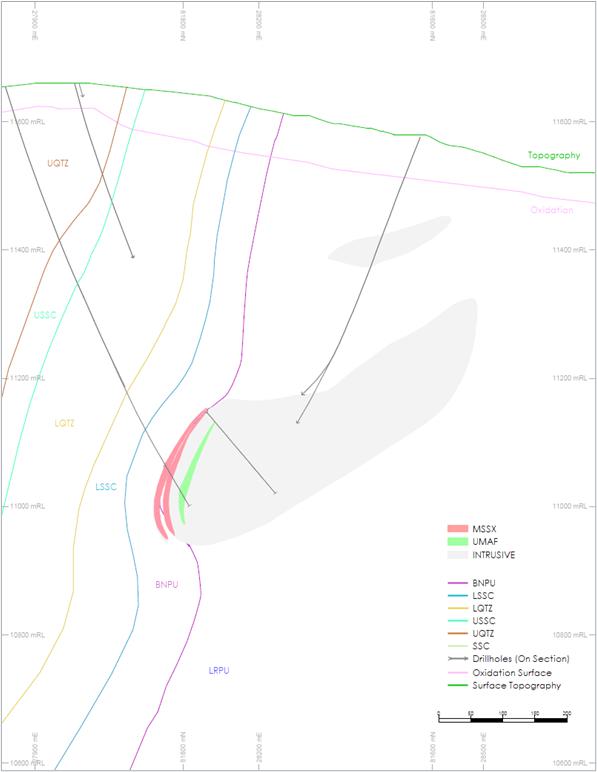
Note: * Oblique cross-section looking 030°, +/- 15 m projection.
Figure 6-6: Example Schematic Cross-section* of Mineralization Geometry at MNB Zone (truncated UTM)
Page
|
/ / Initial Assessment - Technical Report Summary |
|

Note: * Oblique cross-section looking 030°, +/- 15 m projection
Figure 6-7: Example Schematic Cross-section* of Mineralization Geometry at North Zone (with Kima) (truncated UTM)
Page
|
/ / Initial Assessment - Technical Report Summary |
|
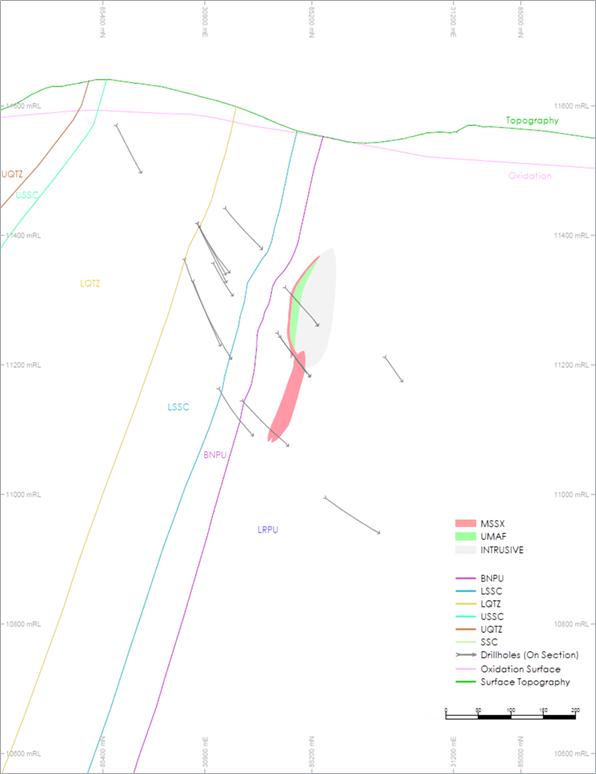
Note: * Oblique cross-section looking 038°, +/- 15 m projection
Figure 6-8: Example Schematic Cross-section* of Mineralization Geometry at Tembo Zone (truncated UTM)
Page
|
/ / Initial Assessment - Technical Report Summary |
|
Exploration of the Project has been undertaken in several different phases for over 45 years, with more than 637 km of drilling having been completed in total (to the effective date of the current Mineral Resource Estimate). This drilling is summarized in Table 7-1.
Table 7-1: Exploration Drilling Summary
Years |
Companies | Meters Drilled | Discovery | Location//Purpose |
| 1976–79 | UNDP | 20,068 | Main | Exploration |
| 1991–92 | Sutton | 12,974 | Main/Resource Definition | |
| 1993–95 | Sutton-BHP JV | 37,947 | North | Main and North / Resource Definition |
| 1997–99 | Sutton-Anglo JV | 56,227 | North/Resource Definition | |
| 2000–04 | Barrick Gold Corp. | 39,931 | MNB | North/Resource Definition |
| 2005–08 | Barrick-Glencore JV | 64,957 81,256 242,347 |
North
Deep, Tembo, Safari, and Kima |
Phase
I Scoping Study Phase II Scoping Study North and Tembo/PFS. |
| 2008–09 2011–12 2014 |
Barrick-Glencore JV | 21,368 5,303 3,320 |
North, Main and Tembo / FS | |
| 2021–23 | TNCL | 23,913 8,192 9,919 4,416 4,540 1,071 |
Tembo
(infill and extension) Safari North (infill) Tembo and North / (met.) Tembo and North / (geotech.) Tembo and North Boxcut / (geotech.) |
|
| Total | 637,749 |
| 7.1 | Exploration Timeline |
| 7.1.1 | Early Regional Exploration 1976–79 |
The first drilling on the deposit was undertaken between 1976 and 1979 by the UNDP, as part of a regional targeting for ultramafic bodies to identify nickel sulfide and nickel laterite mineralization within the East African Nickel Belt in western Tanzania and Burundi.
In the Project licence area, 61 UNDP drillholes were completed, with work focused on two areas of interest at that time, known as Block 1 and Block 2. These holes intersected five separate mafic-ultramafic bodies over a 7.5 km strike length and culminated in the delineation of an Indicated Mineral Resource for the area now known as Main zone.
The UNDP work delineated a further 48 geochemical stream anomalies (21 Ni anomalies and 27 Cu, Co, Cr, and Zn indicator anomalies) and 30 magnetic / radiometric anomalies. A second-phase follow-up program evaluated a number of these targets, of which 12 magnetic / Ni geochemical anomalies were highlighted and recommended for additional follow-up.
An outbreak of hostilities between Tanzania and Uganda in 1978–79 caused work at the Project to be halted.
Page
|
/ / Initial Assessment - Technical Report Summary |
|
| 7.1.2 | Sutton Era Exploration |
| 7.1.2.1 | Sutton – BHP JV: 1990–95 |
Following a 10-year government moratorium on exploration, Sutton negotiated the mineral rights to the Project and formed KNCL and the Kagera Mining Company Limited in 1990.
Initial work on the Main zone was expanded in 1992 to include the Kagera licence to the northwest, through the formation of a JV with BHP.
Exploration of the Kagera licence was undertaken from the Mururama exploration camp, located approximately 30 km northwest of the current Kabanga camp. The Kabanga exploration camp was established in its current location in 1993. Work continued to focus on the two Blocks outlined by the UNDP.
During 1993, drillhole KN93-36 was drilled approximately 1 km north of Main zone, targeting the down-dip extension of a gossan ridge associated with a geophysical anomaly. This hole intersected a small, pipe-like ultramafic body with greater than 100 m of massive sulfide mineralization intersected (drilled along plunge). This area is now known as North zone.
Nine holes were drilled in southern Main zone, with the best result 1.2% Ni over 2.15 m in drillhole KN95-99 (Block 1 South). This drilling program also intersected numerous zones of low Ni-tenor massive sulfide to the east of Main zone, with the best result 0.4% Ni over 34.6 m in drillhole KN91-11. Two holes were drilled in the area now known as Tembo zone, but no mineralization was intersected at this time.
Drilling at the Project continued until the end of 1995, at which time BHP exited the JV. By this time, Main zone and North zone Mineral Resources had been reported, which included a Main zone Indicated Mineral Resource of 5.95 Mt at 1.16% Ni, and a North zone Indicated Mineral Resource of 4.18 Mt at 2.21% Ni.
| 7.1.2.2 | Sutton – Anglo JV 1997–99 |
In July 1997, Sutton and Anglo entered into a JV on both properties. Drilling recommenced in October 1997 following refurbishment of the Kabanga camp. The initial focus of this drilling campaign was to extend the North zone high-grade massive sulfide resource, which appeared to be open at depth to the north.
An initial drilling program of 18,000 m was planned. This was subsequently extended to 26,000 m following the discovery of continuous mineralization extending to depth. Up to this time, little drilling had been completed at depths greater than approximately 400 m below the surface. The deepest mineralized intersection from the 1997 program was 9 m of massive sulfide mineralization at approximately 800 m below surface in drillhole KN98-45.
In April 1998, after completion of a total of 53 drillholes, a North zone Mineral Resource of 14.3 Mt at 2.56% Ni was estimated.
Despite the open-ended nature of the mineralization at North zone, the recognition of the need for additional shallower mineralization to increase yearly throughput of the plant to an economic level led to a shift of exploration focus back to the Main zone area. Drilling recommenced in May 1998 and continued until October 1998. Main zone was remodeled, concentrating on the contact-associated massive sulfide mineralization. Updated Mineral Resources were estimated for Main zone and North zone, but these were not published.
The Sutton and Anglo JV undertook additional drilling in the Block 1 South area (36 holes), and Nyanzali/Luhuma target areas, with low-grade (<1% Ni) mineralization encountered In 1999, Barrick Gold Corporation (Barrick), through its purchase of Sutton, gained control of Bulyanhulu and other gold properties, thereby becoming ground holders at Kabanga and JV partners with Anglo.
Page
|
/ / Initial Assessment - Technical Report Summary |
|
| 7.1.3 | Barrick Era Exploration |
| 7.1.3.1 | Barrick 1999–2004 |
After Anglo withdrew from the Project in 2000, Barrick recommenced exploration of the down-dip extension of the North zone massive sulfide body. Drilling in January 2001 intersected mineralization at depth, which appeared to be separate from North zone and similar in style to Main zone mineralization. This zone, located between Main zone and North zone, was named MNB.
Initial interpretations suggested a 2 km long body at the base of an ultramafic conduit, which could be interpreted as an extension to Main zone. Drilling through to 2002 focused on North zone, extending the massive sulfide body to the north with an additional six holes. Deep drilling below North zone (1,500–1,700 m below surface) intersected massive sulfide mineralization that was interpreted to be part of the zone now known as Kima. Four exploration holes were completed by Barrick in the area now known as the Tembo zone without encountering any nickel sulfide mineralization.
In 2003, Barrick completed a scoping study that was largely based on data obtained during its work with Anglo. This scoping study was based on unpublished Mineral Resource estimates generated in 2002 using drilling completed up to the end of 2001.
In late-2003, an updated resource model was generated by the exploration group to incorporate all holes up to and including the 2003 drilling program.
In addition to the primary Kabanga licence, Barrick also controlled eight Prospecting Licence (PL) areas at the Project. Reports to the end of 2003 indicate that little work was conducted on these licences other than litho-geochemical research studies (mafic ultramafic rocks and gossans) and geochemical surveys (soil and stream sediment). Exploration grids for soil surveys were implemented in 2000 on three PLs, where a total of 805 samples were taken. The results of the geochemical soil programs showed tight linear and coherent Ni, Cu, and Co anomalies coincident with known occurrences of mafic and ultramafic bodies. Stream sediment sampling (130 samples) was carried out on a regional PL in 2003 to coincide with a reconnaissance mapping program.
In February 2004, Barrick began negotiations with Falconbridge, (which later became Xstrata and then Glencore) seeking a JV partnership. No further exploration work was undertaken for the remainder of 2004.
In January 2005, with JV negotiations still in progress, work resumed on an infill drilling program at Main zone. A total of 10,557 m of drilling had been completed by the time the JV agreement was formalized on April 22, 2005.
| 7.1.3.2 | Barrick – Glencore JV: 2005–18 |
In 2005, Barrick issued a press release announcing a JV partnership with Falconbridge (which later became Xstrata and then Glencore. All are referred to as Glencore from hereon). In the press release, Barrick also announced an Inferred Mineral Resource estimate of 26.4 Mt at 2.6% Ni, representing the sum of the Main zone and North zone models from 2003.
A total of 64,957 m across 127 drillholes was completed between January 2005 and March 2006 for a scoping study (known as the Phase I scoping study). Work focused on verifying and infilling the models at the Main, North, and MNB zones.
Other exploration work was completed during this time to support the Phase I scoping study. This included:
| ● | Geophysical surveys: |
| ‒ | 285 Crone borehole electromagnetic (BHEM) surveys with physical properties in 42 drillholes, 1,677 line-km of ground geophysical surveys (352 km UTEM Lamontagne, 1,325 Crone FLEM), and 4,878 line-km of Geotech airborne VTEM surveys. The VTEM airborne surveys, in conjunction with historical soil surveys and a BHP GEOTEM airborne magnetic survey, were used to target the ground FLEM and UTEM surveys. |
Page
|
/ / Initial Assessment - Technical Report Summary |
|
| ‒ | 17.6 km of superconducting quantum interference device (SQUID) and 12 km of fixed loop TEM surface electromagnetic surveys, as well as an airborne helicopter VTEM survey (2,615 km). |
| ● | These geophysical survey programs commenced with baseline surveys over the known mineralization zones to determine their geophysical signature. Most of the surveys were proximal to the North and Main zones, moving outwards to regional properties. |
| ● | Collection of metallurgical samples was undertaken between April and July 2005. A total of 2,908 kg of sample was shipped for metallurgical testing. |
| ● | Five holes were drilled for geotechnical purposes at proposed infrastructure sites. |
Between April and November 2006, a total of 81,256 m across 148 drillholes was completed for Phase II of the scoping study. This program was designed to continue to improve the confidence of the resource and to discover additional shallow, large-tonnage mineralization to improve the economics of the Project. BHEM surveys with physical properties were completed in 95 drillholes. This work focused on verifying and infilling the resource models in the North and MNB zones. Additional metallurgical sample was also acquired for preliminary grinding/flotation testing at XPS in Canada. A further 2,600 kg of sample was shipped to the Falconbridge Technology Centre for metallurgical testing. Updated models were generated for the Main, MNB, North, and Tembo zones.
In mid-2006, Xstrata purchased Falconbridge and acquired 50% ownership of the Project.
| 7.1.3.3 | Barrick – Glencore JV: 2006–08 |
A total of 242,347 m across 555 drillholes was completed for a PFS between December 2006 and November 2008. Of this total, 121,051 m was completed across 246 holes at North zone and 105,735 m across 280 holes at Tembo zone. This exploration program was designed to further improve confidence in the North and Tembo resources and to discover additional mineralization to improve the economics of the Project within a 15 km trucking distance of the planned mine infrastructure. Further metallurgical samples were also acquired for two pilot plant test runs. During 2007, the Kima massive sulfide zone was interpreted beneath North zone.
BHEM surveys with physical properties were completed in 134 drillholes.
In 2007, an additional drilling program that totaled 6,836 m tested 10 target horizons outside the then-current modeled limits. Nickel sulfide mineralization was intersected in two of the drillholes, which increased the North mineralization by approximately 125 kt at 2.51% Ni and extended the Kima mineralization. BHEM surveys were completed in all 2007 holes.
Regional exploration drilling totaled 8,725 m across 19 holes, testing seven high-priority regional exploration targets at Bonde, Nyoka, Jabali, Balima, Kilimanjaro, Safari, and Nyundo (Keza-3), along with 16 BHEM surveys. In November 2007, massive sulfide mineralization was intersected at the Safari target with the discovery hole grading 1.88% Ni over 10.1 m (as-drilled width).
Mineral Resource estimates were reported for the 2008 models in the 2008 Xstrata annual report.
| 7.1.3.4 | Barrick – Glencore JV: 2008–10 |
From December 2008 through August 2009, a total of 21,368 m of drilling was completed. This drilling program was successful in transferring an estimated 2.8 Mt in the mid-North area from Inferred to Indicated status.
From October 2009 through September 2010, work focused on: updating all resource models; completing a new North UMAF resource estimate; adding estimates of deleterious component (Cr, As, Pb, and MgO) into the models; estimating density values by kriging methods; and conducting new variographic studies for the North and Tembo zones. Waste models were also produced for the North and Tembo zones.
An independent consultancy firm performed both a QA/QC audit and a Mineral Resource audit during this period, with final reports submitted in August 2009.
Page
|
/ / Initial Assessment - Technical Report Summary |
|
| 7.1.3.5 | Barrick – Glencore JV: 2010–14 |
From 2010 through 2014, extensive geological/geophysical interpretation was carried out over the Kabanga licence area, coupled with assaying of unsampled historical BHP / Anglo holes in the Main zone area, and led to the development of several high-tenor nickel targets in the southern part of the Project area.
Crone FLEM surveys were conducted from November 25, 2010 through December 17, 2010, a total of eight loops (40 line-km) were surveyed. Preliminary results indicated a >500 m length 50 Siemen conductor associated with known high-tenor nickel drillhole intercepts in the BNPU footwall to the Main zone; this was the best drill result to that date at 8.36% Ni over 4.6 m (known as the Water Pump target).
Regional exploration work in this period was confined to geological mapping over regional licences and establishing access routes for planned 2011 programs.
Subsequent drilling in 2014 was limited to four holes at North (KN14-01 through KN14-04 (2,507 m)), which were drilled to test two new target areas, and an additional two holes were drilled into the Tembo North area (KL14-01 and KL14-01A (813 m)).
Figure 7-1 shows the collar locations of all of the drillholes completed on the Project licence to date, which are included within the current database, as well as the vertically projected outlines of the main mineralized zones
| 7.1.3.6 | Historical Regional Exploration |
The regional exploration program tested six high-conductance fixed loop EM (FLEM) target areas with a total of eight drillholes. All the surface geophysical S1 conductors targeted for drilling have been attributed to sulfidic metasediments considered to have masked any response from nickel-bearing massive sulfide.
FLEM surveys were conducted over 84.6 line-km. These surveys were targeted over conductors identified by the 2005 and 2008 VTEM airborne surveys, and also over magnetic highs from the 1992 GEOTEM airborne survey. The FLEM surveys conducted over regional licences were primarily Lamontagne UTEM surveys, with minor Crone FLEM follow-up surveys.
Detailed FLEM surveys were also conducted over the Panda/ Mto target area to determine if lower frequencies were capable of better resolving massive sulfide targets. It was found that the lower frequency work was not capable of distinguishing known mineralization / BHEM plate from conductive metasediments. A discrete, 300 m-long, high conductance FLEM conductor coincident with the magnetic high was outlined at the Mto South target area in 2012 (untested by drilling).
Regional exploration work also included geological mapping over nine licence areas and a soil sampling survey over the southern part of the Kili FLEM conductor.
| 7.1.4 | TNCL Exploration: 2021–Present |
In December 2021, TNCL commenced activities after the granting of SML 651 / 2021. A total of 52,051 m of drilling across 112 holes has been completed since that time, including:
| ● | Resource definition drilling – 42,278 m (including 10,173 m across 13 holes at North, 23,912 m across 52 holes at Tembo and 8,192 m across 13 holes at Safari and Safari Link), |
| ● | Drilling to obtain metallurgical samples – 4,163 m (including 1,731 m across nine holes at North and 2,432 m across five holes at Tembo), |
| ● | Drilling for geotechnical purposes – 4,540 m (including 985 m across three holes at North and 3,555 m across eight holes at Tembo), and |
| ● | Portal drilling – 1,071 m (including 715 m across five holes at the proposed North boxcut location and 356 m across four holes at the proposed Tembo boxcut location). |
| 7.2 | Exploration and Drillhole Database |
The Project drillhole database history spans from 1976 to present. The drilling database is currently maintained using Fusion software. Globally, including regional data outside the area now covered by the SML, the database totals over 658 km of diamond drilling.
Page
|
/ / Initial Assessment - Technical Report Summary |
|
| 7.3 | Drilling, Core Logging, Downhole Survey, and Sampling |
| 7.3.1 | Drilling |
Drilling has been completed exclusively by diamond drilling, with holes generally collared at PQ diameter (core approximately 85 mm) to drill through the highly weathered quartzite, then downsizing to HQ diameter (core approximately 63.5 mm) down to 300–600 m downhole, and then typically finishing in NQ diameter (core approximately 47.6 mm) for drilling into the deeper parts of the North and Kima area. The PQ/HQ/NQ combination was considered essential to be able to successfully drill through the thick Rubona quartzite formation, which contains frequent narrow schist interbeds that can cause deflection issues. At Tembo, over 90% of the historical holes were collared using HQ diameter down to 50–100 m downhole, and then continued with NQ coring to target depth due to the reduced amount of quartzite that will be encountered.
| 7.3.2 | Core Recovery |
Core recovery was assessed by trained geotechnical technicians at the Kabanga Site, based on the average 3 m core runs. All core was re-oriented by hand, and any intervals of missing core were noted in the logs. In the massive sulfide intervals, the most common reason for any missing core was grinding by the drill bit, since massive sulfide is less hard than the hanging wall metasediments. This issue was addressed by informing the drill crews of the expected depth of intercept and slowing down the drill rate when approaching this depth. All Kabanga, drill logs have a separate database table for core recovery.
Core recovery throughout the drill programs has been excellent, with an average core recovery of 98%.
| 7.3.3 | Core Logging |
Kabanga geologists used a standardized geological unit classification comprising the following principal geological units:
| ● | Massive sulfides (MSSX (without country rock xenoliths), MSXI (with xenoliths)) |
| ● | Net-textured sulfides to semi-massive sulfides in ultramafic matrix (UMAF_1a) |
| ● | Generally-unmineralized ultramafic (peridotite) (UMAF_KAB) |
| ● | Generally-unmineralized gabbro/gabbronorite (GAB_KAB) |
| ● | Quartzites – Upper and Lower (UQTZ and LQTZ respectively) |
| ● | Spotted Schist – Upper and Lower (USSC and LSSC respectively) |
| ● | Banded Pelite (BNPU) |
| ● | Lower Pelite (LRPU) |
Massive sulfide mineralization is broken into two logged units: remobilized massive sulfide (>80% sulfide) (MSSX), which carries 90% of the sulfide occurrence, and massive sulfide with xenoliths of metasedimentary, or gabbro / ultramafic rock (≥50% to 80% sulfides) (MSXI). The ultramafic-hosted UMAF was logged primarily as unit UMAF_1a and varies from net textured to heavily disseminated to semi-massive sulfide.
The stratigraphic sequence at Kabanga is overturned, therefore, while it dips to the west–northwest, the younging direction is towards the east–southeast.
| 7.3.4 | Core Sampling |
Samples are taken for all mineralized zones, with a typical 2–3 m selvedge of samples into adjacent non-mineralized material either side (hanging wall and footwall).
Sampling procedures at Kabanga were essentially unchanged from 2001 through 2023:
| ● | All geological contacts were respected when determining sample lengths. |
Page
|
/ / Initial Assessment - Technical Report Summary |
|
| ● | Mineralized intervals, including massive sulfide, were sampled with a typical maximum of 1 m sample length and a minimum of 0.25 m sample length. |
| ● | Weakly mineralized intervals (mainly within ultramafic) were sampled with a typical maximum of 2 m sample length. |
| 7.3.5 | Collar Survey |
All drillhole collars from 2001 through 2009 were surveyed to decimeter-scale accuracy using either a TCR703 Leica, or Thales Promark 3 instrument.
Differential global positioning system (DGPS) was used following the demobilization of Direct Systems Australia from the site in late-2009.
| 7.3.6 | Downhole Survey |
Downhole survey was completed for all Tembo drillholes (100% by Gyro method), and all but 1% of the drillholes for North (82% by Gyro method, 17% by Maxibor method).
Table 7-2 summarizes all surveyed drillholes utilized for the 2024 resource model. In addition, repeat Gyro surveys were conducted in a minimum of 10% of all drillholes drilled at Kabanga from 2005 onwards, and progressive Gyro surveys were conducted in all deep drillholes at the North zone. Several historical holes at North were re-entered for Gyro surveys, and 15 drillholes at North (shallow and mid-depth holes) were excluded from the MSSX model due to either erroneous historical survey data or being replaced by 2005–09 KNCL holes.
In addition, drillholes drilled for metallurgical/geotechnical purposes were generally only used to shape the interpretation wireframe, as no samples were taken in the massive sulfide zone. As a verification measure, multi-shot surveys were conducted by the drilling companies in all 2001–09 drilling at a nominal 30 m interval and compared with the Gyro surveys. In addition, all holes surveyed by BHEM used a RAD orientation tool (234 holes at North and Tembo). These results were also compared to Gyro surveys.
Table 7-2: Downhole Survey Statistics for North and Tembo – Survey Method
Mineralized Zone |
No.
of Drillholes used in the 2024 Model |
Downhole Survey Method | |
| Gyro | Single/Multi-Shot | ||
| North – Massive Sulfide | 380 | 90% | 10% |
| North – Ultramafic | 86 | 80% | 20% |
| Tembo – Massive Sulfide | 240 | 100% | 0% |
| Tembo – Ultramafic | 99 | 100% | 0% |
Table 7-3 provides the statistics in terms of downhole survey for the complete North and Tembo drillhole database.
Table 7-3: Downhole Survey Statistics for North and Tembo – Location
Survey Type |
North | Tembo |
| Gyro + Multi-shot | 82% | 100% |
| Maxibor | 17% | none |
| No Survey | 1% | none |
Page
|
/ / Initial Assessment - Technical Report Summary |
|
The drilling, core logging, downhole survey, and sampling activities can be summarized as follows:
| ● | Diamond drilling is used exclusively, collared in PQ diameter (core approximately 85 mm), then downsizing to HQ diameter (core approximately 63.5 mm) down to 300–600 m, then typically finishing in NQ diameter (core approximately 47.6 mm) at North; and collared in HQ down to 50–100 m, and typically finishing in NQ diameter at Tembo. |
| ● | Geology and geotechnical core logging were performed by experienced geologists following standardized logging codes. |
| ● | Collar survey was completed to within 30 cm accuracy. |
| ● | Downhole survey was completed for all Tembo drillholes (100% by Gyro method), and all but 1% of the drillholes for North (82% by Gyro method, 17% by Maxibor method). |
| ● | The average core recovery is 98%. |
| ● | Sampling was routinely done on 1 m intervals, with a maximum of 2 m intervals in weakly mineralized zones. All samples respected geological contacts. |
Drillhole collar locations are shown in Figure 7-1.
| 7.3.7 | BHEM Data |
During the various exploration campaigns, BHEM surveys have been completed on a significant number of drillholes: 42 drillholes in the Phase I scoping study, 95 in the Phase II scoping study, and 134 in the PFS. All BHEM surveys at Kabanga were completed by Crone Geophysics using Crone 3-component sensors and step response processing.
The data obtained is representative of the physical properties of the terrain, and it is likely that the data measured could be used as indicators/confirmation of mineralogical/physical ground properties such as:
| ● | Temperature = reactive ground relative to sulfide abundance exposed to oxygen; potential mineralization marker. |
| ● | Conductivity = sulfides would be more conductive, abundance giving greater results; potential mineralization marker. |
| ● | Magnetic susceptibility = likely associated with Fe (magnetite) alteration, which probably follows the sulfides. Possibly some other minerals present too. |
| ● | Gamma tool (K, Th, U) = indicative of marker horizons such as shale (higher K, and possible Th). There may be some U alteration markers also that are potentially useful to help follow the stratigraphy. |
Page
|
/ / Initial Assessment - Technical Report Summary |
|
| 7.3.8 | Drillhole Database |
Fusion data management software was used to facilitate the storage and movement of data between a central database and a local database. Distributed database upgrades were responsible for moving any changes made to the configuration of the central database down to the local database. DHLogger was the data capture tool used for logging and editing drillhole data. Database validations were undertaken routinely
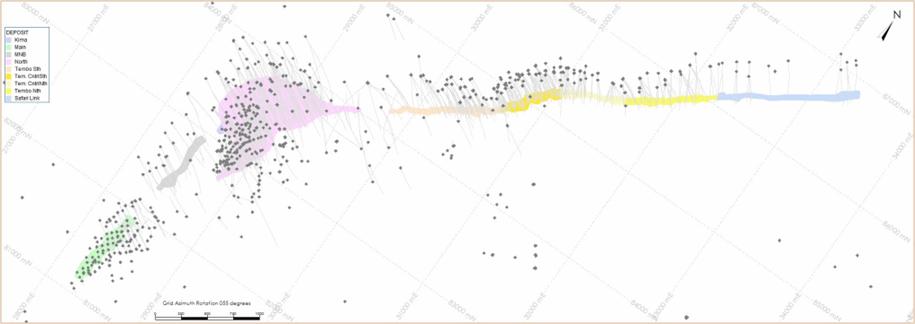
Figure 7-1: Kabanga Drillhole Locations Proximal to Mineral Resources (truncated UTM)
Page
|
/ / Initial Assessment - Technical Report Summary |
|
| 7.4 | Density Measurements |
The massive sulfide (MSSX and MSXI) and mineralized ultramafic (UMAF) that comprise the mineralization within the Mineral Resources at all Kabanga zones lie below the level of oxidation (nominally 90–100 m below surface) and are competent, unaltered rock units that have no notable porosity.
The upper limit of the North mineralization wireframe was trimmed to exclude all weathered/oxidized massive sulfide (based on visual examination of drill core/drill core photos and sulfur content). The massive sulfide horizon at the Tembo zone is more than 98% within fresh material, with minor oxidation present in the upper southern and northern parts of the mineralization.
Almost all Tembo assayed samples and 80% of North assayed samples have specific gravity measurements, which were obtained by pycnometry (i.e., by gravimetric method on pulverized pulp) as part of the assay batch submissions. Measurement of density by pycnometry started in 2003. Prior to this, during the BHP / Anglo exploration period, 4,831 water immersion measurements (Archimedes method) were completed. In 2005, it was decided to exclude the immersion measurement data from the resource database as the technique as practiced at Kabanga by BHP / Anglo resulted in a subset of erroneous data in the massive sulfide samples (Figure 7-2), possibly due to issues with repeatability by various technicians, calibration problems, and/or errors in manual data entry into the database.
An additional theoretical mineralogical density check calculation was made using the quantitative mineralogical data of samples from the pilot plant product. This was applied to the averaged resource grades for North and Tembo mineralized material to derive quantitative mineralogy profiles. The theoretical mineralogical density check values obtained for each material type fall within the expected limits.
Densities for pre-2003 samples (North and Main zones) were calculated using a regression equation based on sulfur (see below). In the mineralized zones, density is highly correlated with sulfur content, as shown in the scatter plots in Figure 7-3 for massive sulfide and Figure 7-4 for mineralized ultramafic.
The following density-to-sulfur linear equations were used to assign density values to North and Main intervals that had no pycnometry measurements:
| ● | MSSX specific gravity = 0.04 x S% + 2.93 based on 4,889 measurements, with r2 = 0.82 |
| ● | UMAF specific gravity = 0.04 x S% + 2.85 based on 1,325 measurements, with r2 = 0.80 |
With the exception of the upper part of North (which is not incorporated into the Mineral Resource estimates), all Tembo and North mineralized material comprises unweathered rock. The massive sulfide material, as shown by core photos, is a competent massive lithology, and it is considered that the pycnometer method is suited to density determination at Kabanga.
Page
|
/ / Initial Assessment - Technical Report Summary |
|

Figure 7-2: Comparison of Water Immersion Density vs. Pycnometry Specific Gravity for Massive Sulfide
| 7.5 | Planned Drilling Campaigns |
In 2023, KNL planned a drilling program comprising 34 km of drilling across 62 holes in the Safari Link area, which is the 1.4 km along-strike area between the northeastern end of the Tembo zone to the northeastern extent of the Safari BHEM target. The purpose of this program was to demonstrate the presence and architecture (depth, width, orientation) of mineralization anticipated to occur between the known mineralization at Tembo and the show of similar mineralization in the three holes at Safari. The presence of mineralization at both along-strike ends of the Safari Link area provides a solid basis for the anticipated continuation of the mineralization in this area, further supported by surface geophysics.
The program was commenced and halted in late-2023. There remains some 26 km of exploration drilling across 50 holes to complete this program.
Samples from the future Safari Link drilling will also be used for metallurgical testwork, as required.
Page
|
/ / Initial Assessment - Technical Report Summary |
|

Figure 7-3: Pycnometer Specific Gravity Measurements for Massive Sulfide in North and Tembo
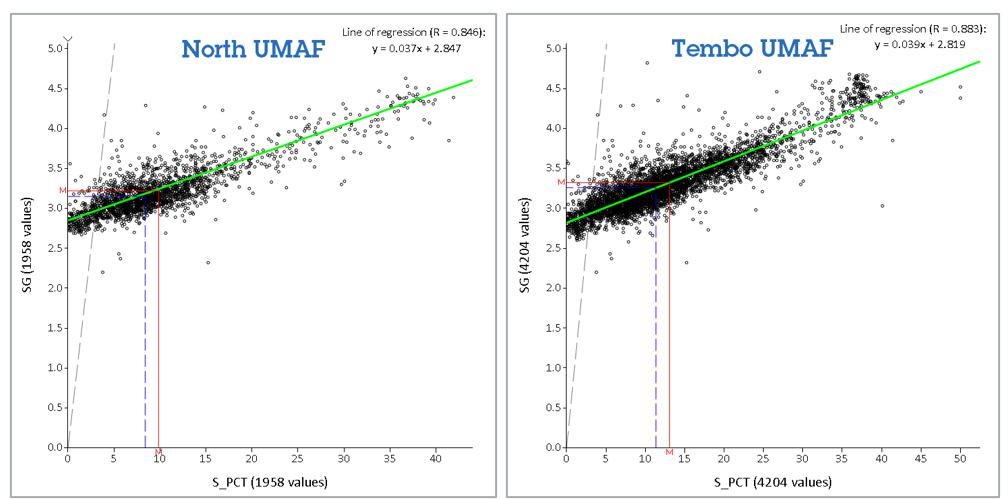
Figure 7-4: Pycnometer Specific Gravity Measurements for UMAF_1a in North and Tembo
| 7.6 | Exploration Targets |
There are currently four zones of nickel mineralization at the Kabanga Nickel Project that, while having been shown through historical exploration work to be prospective, currently have insufficient data on which to base Mineral Resource estimates. These four zones – Sarari Link, Safari Extension, Rubona Hill, and Block 1 South – have been estimated as Exploration Targets, as discussed below.
| 7.6.1 | Safari Link Exploration Target |
A Tembo-style high-conductance electromagnetic (EM) geophysical anomaly exists to the northeast of Tembo. This EM response is generally of similar caliber to, and contiguous and in alignment with, that of Tembo and is therefore considered to be a possible strike extension (continuation) of the Tembo mineralization.
Page
|
/ / Initial Assessment - Technical Report Summary |
|
Drilling in November 2007 tested for the presence of mineralization at the Safari zone, which is located approximately 1.4 km northeast of Tembo North. Massive sulfide mineralization was intersected in the Safari discovery hole (KR0713) grading 1.83% Ni over 10.1 m (as drilled width). Ultramafic mineralization was also intersected in this hole (3.78 m at 0.91% Ni). Two other holes drilled at Safari in 2007 (KR07-11 and KR07-14D) intersected mineralization, confirming that the architecture (depth, width, orientation) of the mineralization encountered at Safari shares similar characteristics with the mineralization encountered at Tembo.
No further drilling was undertaken at Safari until 2022, at which time KNL commenced a drilling campaign intended to test the gap between the existing drilling at Tembo North and Safari – this target area is known as Safari Link.
KNL’s Safari Link drilling campaign was designed to be completed in three phases:
| ● | Phase 1: 22 holes for approximately 12,000 m – designed to confirm the presence and continuity of mineralization along the strike length between Tembo North and Safari and challenge the characteristics of that mineralization in the vertical plane. |
| ● | Phase 2: 24 holes for approximately 13,000 m – designed to infill Phase 1, with the aspiration of bringing interpreted mineralization up to Inferred status. |
| ● | Phase 3: 16 holes for approximately 9,000 m – designed to infill further, with the aspiration of bringing interpreted mineralization up to Indicated status. |
Thirteen (13) Phase 1 holes were drilled in 2022–23, after which time drilling was put on hold to enable LZM to focus on studies related to the development of the existing Mineral Resources.
Ten (10) of these 13 holes were drilled between Tembo North and Safari, covering a strike length of approximately 675 m into the Safari Link area. The remaining three holes were drilled proximal to the 2007 Safari holes, covering a lateral extent of approximately 125 m. There is currently a strike length of approximately 850 m of the Safari Link geophysical anomaly that remains untested by drilling.
While geophysics data indicates that Tembo-style mineralization continues throughout Safari Link, constraining that mineralization in the vertical plane was considered to be an important goal in Phase 1 of the LZM drilling campaign, given the observed vertical undulation in the mineralization at Tembo (see Figure 6-4). Many of the Phase 1 drilled holes were designed to test and constrain the vertical extent of the mineralization to assist the targeting of the drillholes in the subsequent phases of infill drilling. As such, it was anticipated that some of the Phase 1 holes would overshoot (intersect above or below) the vertical extent of the mineralization, and this transpired to be the case. However, while mineralization was not intersected in all Phase 1 holes drilled to date, most of the holes that missed mineralization did intersect lithological markers that are indicative of the nearby presence of mineralization, such as sulfide banding and graphitic zones, thus supporting the likely presence of the mineralization above or below.
The Safari and Safari Link drilling was incorporated into the project-wide geological reinterpretation. Massive sulfide and ultramafic mineralization interpretations were developed, and these were used to extend the cell model from the northeastern extent of Tembo North through to the northeastern extent of Safari. This model of Safari Link was used to estimate an Exploration Target for this zone.
Grade estimation was conducted in the Safari Link model using the same methods as the Tembo Mineral Resource. Estimation parameters were similar to those applied to Tembo, however the estimates in the Safari Link model were achieved using only the drillholes located in the Safari Link area; likewise, the estimates in the Tembo model were kept isolated from the Safari Link drillholes.
Because the Safari Link model is informed by fewer drillholes, the Safari Link estimates are at insufficient confidence level to define the estimates as a Mineral Resource and are therefore reported as an Exploration Target.
An Exploration Target of 4.5–5.5 Mt of mixed massive sulfide and ultramafic mineralization grading 2.1%–2.3% NiEq24 has been estimated at Safari Link (see Table 7-4). The potential quantity and grade are conceptual in nature, and there has been insufficient exploration at Safari Link to define the mineralization as a Mineral Resource. It is uncertain if further exploration will result in the Safari Link Exploration Target being delineated as a Mineral Resource in the future.
Completion of the remaining drilling in Phase 1 through Phase 3, as well as additional geophysical surveys, are part of the future exploration program at the Project.
Page
|
/ / Initial Assessment - Technical Report Summary |
|
Table 7-4: Safari Link Exploration Target Range Estimates
Mineralization Type |
Estimated
Tonnage Range (Mt) |
Estimated
Grade Range (NiEq24%) |
||
| From | To | From | To | |
| UMAF | 1.5 | 2.0 | 1.2 | 1.4 |
| MSSX | 3.0 | 3.5 | 2.5 | 2.8 |
| ALL COMBINED | 4.5 | 5.5 | 2.1 | 2.3 |
| 7.6.2 | Safari Extension Exploration Target |
The Safari Extension area consists of a 1.0 km-long, fault-bound strike length that is located directly to the north of Safari Link and is interpreted as a possible offset extension of Safari mineralization. One shallow drillhole, completed in 2007 (KR07-12), indicated sinistral movement of stratigraphy within this fault-bound block relative to Safari. BHEM interpretation from KR07-12 also detected a strong, off-hole conductor 55 m past the end of the hole. The airborne VTEM magnetic anomaly at Safari Extension appears stronger than the magnetic response observed at Safari Link. Potential mineralization at Safari Extension is interpreted to lie at least 300 m vertically below surface.
An Exploration Target of 3–4 Mt of mixed massive sulfide and ultramafic mineralization grading 1.8%–2.0% NiEq24 has been estimated at Safari Extension. The potential quantity and grade are conceptual in nature, and there has been insufficient exploration to define the mineralization at Safari Extension as a Mineral Resource. It is uncertain if further exploration will result in the Safari Extension Exploration Target being delineated as a Mineral Resource in the future.
An exploration work program has been proposed to further test Safari Extension, consisting of three drillholes (2,000 m) at a nominal 250 m spacing and associated BHEM surveys to evaluate the potential for nickel sulfide mineralization. Hole KR07-12 will also be re-entered and extended approximately 100 m to test the off-hole BHEM target.
Page
|
/ / Initial Assessment - Technical Report Summary |
|
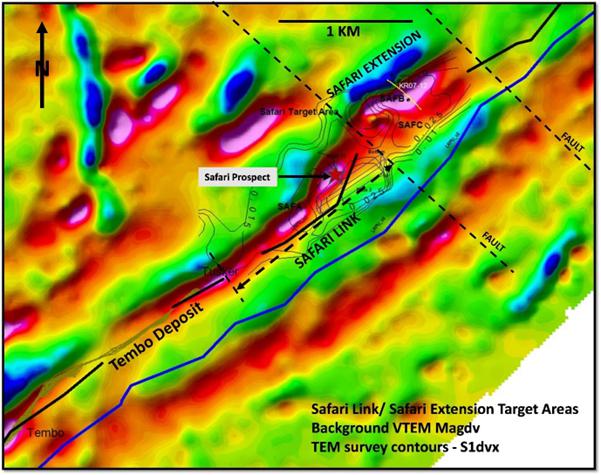
Figure 7-5: Location of Safari Link and Safari Extension Exploration Targets with Airborne VTEM Background and Interpreted Major Faults
| 7.6.3 | Rubona Hill Exploration Target |
The Rubona Hill area lies 2.5 km to the southwest of the current Main zone Mineral Resource (see Figure 7-6) and consists of the only untested, probable near-surface, ultramafic intrusive on the SML (SML 651/2021). A total of five historical (UNDP, Anglo, and Barrick–Glencore) drillholes failed to intersect intrusives, due likely to inappropriate magnetic modeling. Definitive Magnetic Vector Inversion (MVI) modeling was conducted in late-2014 to outline the ultramafic (see Figure 7-8) following completion of a two-drillhole program. There were no modern EM surveys conducted in any of the drillholes.
The Rubona Hill ultramafic body is interpreted to intrude at or near the BNPU / LRPU contact in the same shear systems as the host of the Kabanga Mineral Resource. MVI modeling interprets the ultramafic body as having a principal strike length of approximately 400 m and plunging steeply to the southwest from 300 to 1,000 m vertical depth (see Figure 7-8). Surface fixed-loop EM surveying (1.5 km x 1.5 km) in 2012 outlined a strong conductor at 250 m vertical depth, interpreted from 2014 drilling to be related to sulfidic metasediments with enhanced conductivity in the hangingwall of the potential mineralized zone. No BHEM surveys were conducted in the 2014 drillholes.
Page
|
/ / Initial Assessment - Technical Report Summary |
|
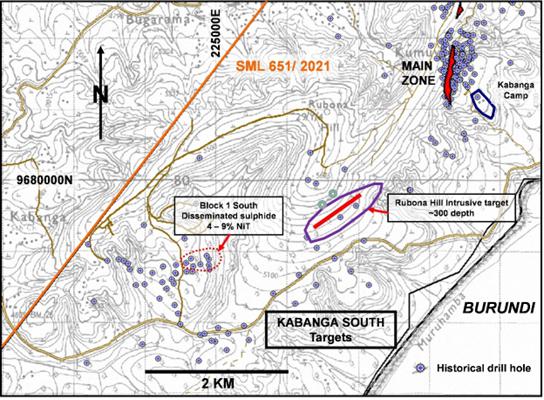
Figure 7-6: Location of Rubona Hill and Block 1 South Target Areas
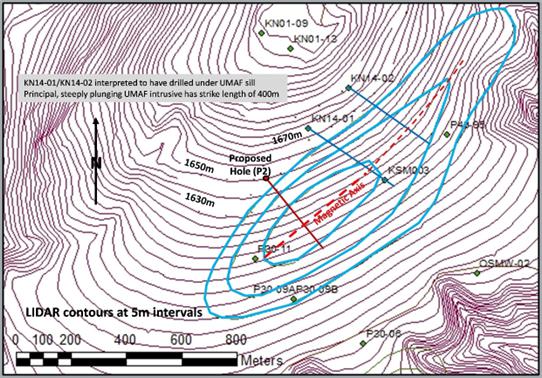
Figure 7-7: Rubona Hill MVI Magnetic Contours at 1,200 m Elevation with Historical Holes and Proposed Priority Hole An Exploration Target of 8–10 Mt of ultramafic-style mineralization grading 1.8%–2.0% NiEq24 has been estimated at Rubona Hill.
Page
|
/ / Initial Assessment - Technical Report Summary |
|
The potential quantity and grade are conceptual in nature, and there has been insufficient exploration to define the mineralization at Rubona Hill as a Mineral Resource. It is uncertain if further exploration will result in the Rubona Hill Exploration Target being delineated as a Mineral Resource in the future.
Further drilling (22 holes – 20,000 m) has been proposed to evaluate the economic potential of the untested ultramafic intrusive at Rubona Hill. BHEM surveys are proposed in conjunction with the drilling, including re-entry and surveying of 2014 holes KN14-01 and KN14-02.
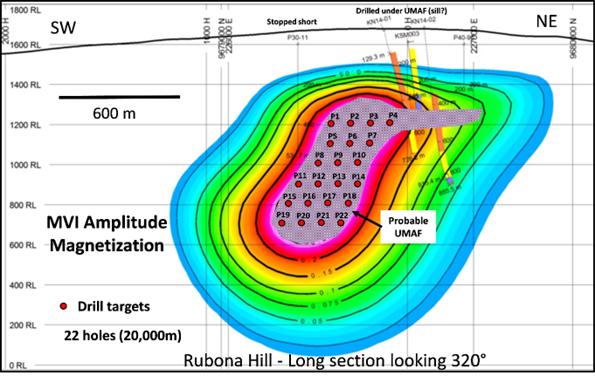
Figure 7-8: Magnetic Vector Inversion (MVI) Model of Rubona Hill Target with Proposed Drillhole Intercepts
| 7.6.4 | Block 1 South Exploration Target |
The Block 1 South area lies 5 km to the southwest of Main zone (see Figure 7-9). A total of 45 drillholes were completed in the Block 1 South area by the UNDP, BHP, and Anglo up until the late 1990s. This drilling targeted two separate ultramafic intrusives. Disseminated nickel sulfide mineralization was intersected within the eastern part of the northern-most ultramafic sill with the best intercept being 0.35% Ni over 47.6 m in hole KB1015 (see Figure 7-9). The Ni tenor in all intercepts in this area ranges from 4% to 9%. No near-surface indication of massive sulfide mineralization was detected by modern surface fixed-loop EM surveys.
An Exploration Target of 2–4 Mt of ultramafic style mineralization grading 1.8%–2.0% NiEq24 has been estimated at Block 1 South. The potential quantity and grade are conceptual in nature, and there has been insufficient exploration to define the mineralization at Block 1 South as a Mineral Resource. It is uncertain if further exploration will result in the Block 1 South Exploration Target being delineated as a Mineral Resource in the future.
An exploration work program has been proposed for Block 1 South, consisting of re-entry of several historical BHP / Anglo holes to conduct modern BHEM surveys with step response processing to detect potential zones of nickel sulfide mineralization, followed by drilling to test the target conductive plates and drilling of two holes to the east of all historical drilling.
Page
|
/ / Initial Assessment - Technical Report Summary |
|
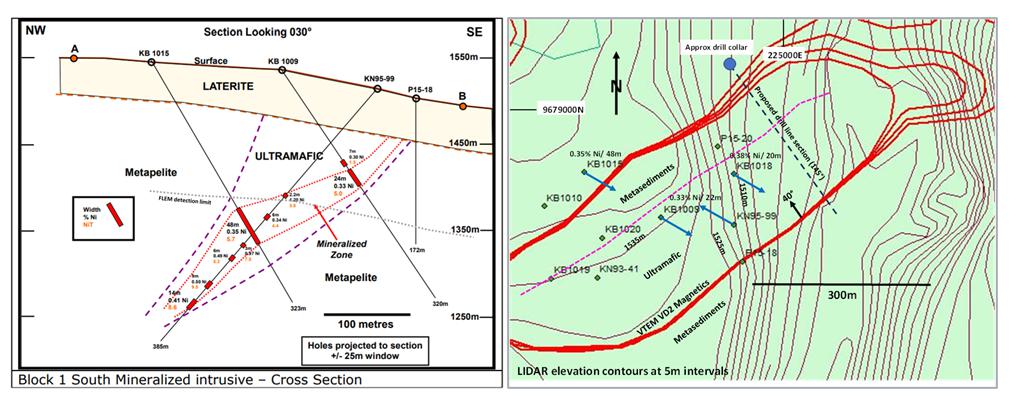
Figure 7-9: Block 1 South Target Potential
| 7.6.5 | Exploration Target Summary |
The Exploration Targets at Kabanga Nickel Project are summarized in Table 7-5.
Table 7-5: Summary of Kabanga Nickel Project Exploration Target Estimates
Location |
Mineralization Type | Estimated
Tonnage Range (Mt) |
Estimated
Grade Range (NiEq24%) |
||
| From | To | From | To | ||
| Safari Link | Ultramafic | 1.5 | 2.0 | 1.2 | 1.4 |
| Massive Sulfide | 3.0 | 3.5 | 2.5 | 2.8 | |
| Total | 4.5 | 5.5 | 2.1 | 2.3 | |
| Safari Extension | Massive Sulfide plus Ultramafic | 3.0 | 4.0 | 1.8 | 2.0 |
| Rubona Hill | Ultramafic | 8.0 | 10.0 | 1.8 | 2.0 |
| Block 1 South | Ultramafic | 2.0 | 4.0 | 1.8 | 2.0 |
| TOTAL ALL | 17.5 | 23.5 | 1.9 | 2.1 | |
Page
|
/ / Initial Assessment - Technical Report Summary |
|
| 8.1 | Introduction |
Kabanga sample preparation, assaying, QA/QC activities, and protocols can be summarized as follows:
| ● | Sample preparation was completed in Tanzania at ALS-Chemex laboratory in Mwanza. |
| ● | All material was crushed to –2 mm and 2 x 250 g pulp bags were sent to ALS-Chemex Perth laboratory for analysis. |
| ● | Perth samples were pulverized to –75 µm and analyzed as follows: |
| ‒ | 4-acid digest / ICP for Ni, Cu, Co, Ag, Fe, Cr, Mg, Mg, Mn, As, Pb, Bi, Cd, and Sb. |
| ‒ | Fire assay / ICP-MS for Au, Pd, and Pt. |
| ‒ | Ni and Cu samples exceeding 10,000 ppm, and Au, Pd, and Pt samples exceeding 1.0 g/t were re-analyzed with a more accurate technique. |
| ‒ | LECO method for the determination of S. |
| ‒ | Gravimetric method for density determination (pycnometry) on all samples. |
| ● | Not all samples have been assayed for the complete suite: only 66% for North (10,053 of 15,200 samples), and 95% for Tembo (6,422 of 6,717 samples). |
| ● | An industry standard QA/QC protocol was followed at Kabanga with the use of certified reference material (CRM) standards, blanks, check assays, and duplicates. |
| ● | ALS is an independent laboratory accredited by the NATA and complies with international standards such as ISO/IEC 17025 for testing and calibration in laboratories. |
| 8.2 | Sample Preparation |
From 2003 onwards, sample preparation was completed in Tanzania at ALS-Chemex laboratory in Mwanza. Drill core was crushed to –2 mm and 2 x 250 g pulps were nitrogen purged and vacuum sealed in plastic bags and sent to the ALS-Chemex Perth laboratory (with duplicate insertion at a rate of 1 in every 40 samples), where samples were pulverized to –75 µm prior to analysis.
Prior to February 2007, quarter core samples (NQ core) were sent for assaying (only North zone), thereafter, half core samples (NQ core) were used for assaying.
All coarse rejects (–2 mm crusher rejects) were preserved in vacuum-sealed, nitrogen-purged bags, stored at the Kabanga site.
All unused pulverized pulp material was hermetically sealed in a cryovac bag for long-term storage in Perth.
| 8.3 | Assaying |
The ALS-Chemex Perth laboratory was the primary analytical laboratory for the majority of the Tembo assay results available in the database. For North, all 1994–95, and 2001–09 assay results are from ALS-Chemex, but for the 42 holes drilled in this zone by Anglo in 1997–98, most of the results are from the Anglo American Research Laboratories (AARL) in Johannesburg using the ICP technique. The Anglo drillholes used for the North 2021 model update account for 11% of the total meters used to estimate the Mineral Resources.
A detailed list of the analytical laboratories and assaying techniques used by drilling campaign is given below, with details in Table 8-1:
| ● | 1991–92 | Sutton – Cominco AA – Main zone only |
| ● | 1992–95 | BHP – ALS-Chemex acid digest / ICP primarily – Main and North zones |
| ● | 1997–99 | Anglo – AARL acid digest / ICP primarily – Main and North zones |
| ● | 2001–04 | Barrick – ALS-Chemex acid digest / ICP – Main, MNB, and North zones |
| ● | 2005–14 | KNCL JV – ALS-Chemex acid digest / ICP – Main, MNB, North and Tembo zones |
Page
|
/ / Initial Assessment - Technical Report Summary |
|
At the ALS-Chemex Perth laboratory, pulps were analyzed as follows:
| ‒ | 4-acid digest / ICP for Ni, Cu, Co, Ag, Fe, Cr, Mg, Mn, As, Pb, Bi, Cd, and Sb |
| ‒ | Fire assay / ICP-MS for Au, Pd, and Pt |
| ‒ | Ni and Cu samples exceeding 10,000 ppm, and Au, Pd, and Pt samples exceeding 1.0 g/t, were re-analyzed by a 3-acid digest / ICP finish with a high degree of accuracy and precision |
| ‒ | All Au, Pd, and Pt analyses exceeding 1.0 g/t also were assayed by a more accurate fire assay / ICP-MS technique (see note below) |
| ‒ | LECO method for S |
| ‒ | Gravimetric method for density (pycnometry) on all samples |
| ● | 2021–24 | KNL – primary assaying at SGS laboratory in Mwanza: |
| ‒ | Ni, Cu, Co, As, Pb, Bi, Sb, Cd, Sn, Mn, Zn, Cr, Fe, Si, Mg, Al, Ca by Na peroxide fusion / ICP-MS / ICP-OES |
| ‒ | Ag by 2-acid digest / AAS |
| ‒ | Au, Pt, Pd by Fire Assay / ICP-OES |
| ‒ | S by ICP and/ or combustion/ infrared detection |
| ‒ | SG determination by Pycnometer on pulps |
| ● | 2021–24 check assaying undertaken at the Nesch Mintech laboratory in Mwanza: |
| ‒ | Ni, Cu, Co by 4-acid digest ICP / MP-AES (2022 metallurgical drilling) |
| ‒ | Ni, Cu, Co by microwave digestion with AAS / MP-AES finish (exploration drilling 2023 onwards) |
| ‒ | S by Combustion/ Infrared detection |
Page
|
/ / Initial Assessment - Technical Report Summary |
|
Notes:
| ● | Not all samples were assayed for the complete suite, for example, only 66% for North (10,053 of 15,200 samples), and 95% for Tembo (6,422 of 6,717 samples). |
| ● | The acid digest / ICP method has very limited incorporation of Ni originating from silicate minerals. However, as demonstrated by the results obtained from umpire assays on Kabanga massive sulfide samples by SGS using the X-ray Fluorescence (XRF) technique, there are essentially no significant nickel-bearing silicates in Kabanga MSSX, and all nickel mineralization is present as sulfides. In the ultramafic UMAF_1a material, however, the SGS XRF results report clearly higher total Ni in comparison to the acid digest / ICP results due to the presence of nickel silicates in this material. |
Table 8-1: Summary of Analytical Techniques for Mineral Resource Drilling
Years |
Campaign | Number of: | Analytical Techniques | |
| Drillholes | Analyses | |||
| 1976–79 | UNDP Regional Exploration | 17 | 3,435 | <unknown> |
| 1991–92 | Sutton Resources | 34 | 3,897 | Cominco low-level Ni assay (AA) |
| 1993–95 | Sutton–BHP JV | 58 | 3,898 | Acid digest / ICP, Na peroxide fusion / ICP |
| 1997–98 | Sutton–Anglo JV | 81 | 3,903 | Acid digest / AAS, |
| 1999 | Sutton–Anglo JV | 25 | 1,170 |
Acid digest / ICP, Na peroxide fusion / ICP |
| 2001–04 | Barrick Gold Corporation | 56 | 2,419 | Acid digest / ICP |
| 2005–06 |
Barrick–Glencore JV Phase I Scoping Study |
78 | 6,046 | Acid digest / ICP |
| 2006 |
Barrick–Glencore JV Phase II Scoping Study |
114 | 2,769 | Acid digest / ICP |
| 2006–08 | Barrick–Glencore JV PFS | 436 | 12,441 | Acid digest / ICP |
| 2008–13 | Barrick–Glencore JV FS | 74 | 2,277 | Acid digest / ICP |
| 2014 | Barrick–Glencore JV Regional | 6 | 73 | Acid digest / ICP |
| 2021–23 | KNL infill and extension | 75 | 1,556 | Na peroxide fusion / ICP-OES |
| Total | 1,054 | 43,884 | ||
Page
|
/ / Initial Assessment - Technical Report Summary |
|
| 8.4 | Quality Assurance and Quality Control |
| 8.4.1 | QA/QC Sample Frequency |
An industry-standard QA/QC protocol was used at Kabanga with screen tests and the use of duplicates (coarse rejects, core), pulp check assays, certified CRMs, and blanks to monitor sample preparation and assaying quality.
Table 8-2 detailed QA/QC information and overall frequencies at which QA/QC samples were inserted in the sample batch stream from 2005 through 2009.
Notes:
| ● | 100% of the assays in the Project database from 2001–09 are from ALS-Chemex Perth. There are no Genalysis or SGS Lakefield results in the database used for the Mineral Resource estimation. |
| ● | Since routine QA/QC procedures started in 2005, 73% of the North data and 100% of the Tembo data has been subjected to standard QA/QC protocols. |
Table 8-2: Frequency of QA/QC Samples 2005–09
QA/QC |
Laboratory | Number
of Samples |
Frequency (1 per …) |
| Screen Tests | ALS-Chemex Mwanza | 1,075 | 20 |
| Coarse Reject Duplicates | ALS-Chemex Perth | 510 | 40 |
| Quarter
Core Replicate (2005–07 only) |
ALS-Chemex Mwanza Perth | 353 | 50 |
| Pulp Check Analysis |
Genalysis SGS Lakefield |
1,006 52 |
20 |
|
CRMs – KNCL – ALS |
ALS-Chemex Perth ALS-Chemex Perth |
872 1,593 |
30 15 |
| Blanks | ALS-Chemex Perth | 378 | 60 |
| 8.4.2 | Sample Preparation QA/QC – Screen Test |
From January through May 2005, Barrick requested that the ALS-Chemex sample preparation laboratory in Mwanza meet a p75 passing –2 mm criterion. Starting in May 2005, this was re-specified to p95 passing. This criterion was met by 99.9% of all crushed reject pulps from 2005 through 2009. The Barrick p75 screen criteria only affect samples prepared for the Main zone, not North or Tembo.
A total of 1,075 screen tests were performed on coarse pulp rejects (–2 mm crushed rejects) at ALS preparation laboratory in Mwanza from 2005 through 2009. Figure 8-1 shows the results of these screen tests.
Page
|
/ / Initial Assessment - Technical Report Summary |
|
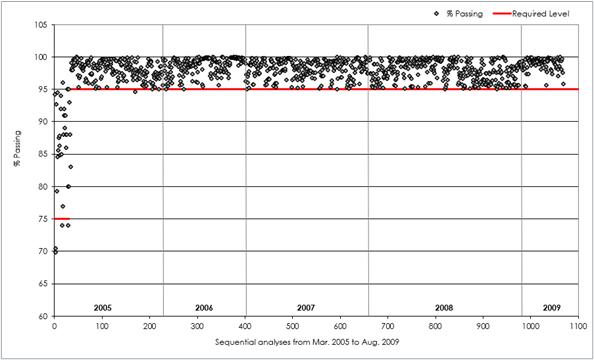
Figure 8-1: Percent Reject Passing –2 mm Screen – 2005–09
| 8.4.3 | Duplicates and Check Assays – ALS-Chemex Coarse Reject Duplicates |
KNCL routinely submitted coarse reject duplicate samples produced by splitting the –2 mm crusher product (crusher duplicates) from the Mwanza sample preparation laboratory at a rate of one duplicate in every 20 samples. The duplicates, destined to be analyzed by the primary laboratory ALS-Chemex Perth, were sent in the same batch as the original sample. The comparison between original samples and duplicates is charted as percent relative difference according to grade in Figure 8.2 through Figure 8.4 for Ni, Cu, and Co from 2005 through 2009. These results indicate adequate precision and an absence of bias within grade ranges.
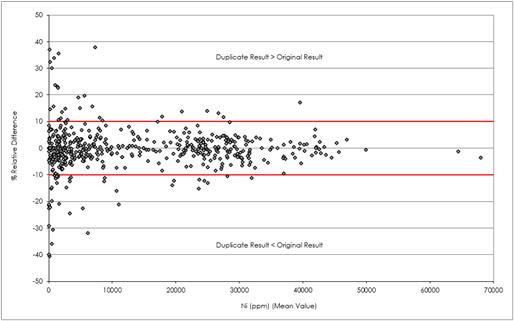
Figure 8-2: ALS-Chemex – Percent Relative Difference for Ni Duplicates – 2005–09
Page
|
/ / Initial Assessment - Technical Report Summary |
|
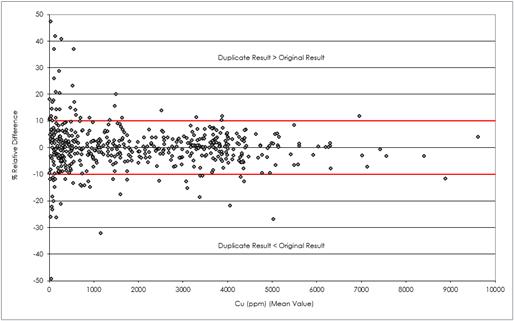
Figure 8-3: ALS-Chemex – Percent Relative Difference for Cu Duplicates – 2005–09
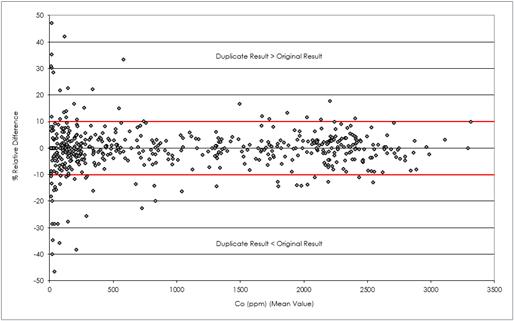
Figure 8-4: ALS-Chemex – Percent Relative Difference for Co Duplicates – 2005–09
| 8.4.4 | Genalysis Pulp Check Assays |
In addition to the primary laboratory coarse rejects duplicates, since May 2005, duplicate pulverized sample pulps (every 20th sample) were prepared by ALS-Chemex Perth and forwarded to Genalysis, Perth for analysis by the same method as ALS (4-acid digest / ICP). ALS-Chemex nitrogen-purged and sealed all check assay pulps at the same time as samples were prepared for analyses at their laboratory. Genalysis conducted analyses for the same suite of elements as ALS-Chemex, using the same techniques.
Figure 8-5 through Figure 8-8 compare the Genalysis and ALS-Chemex pulp results for Ni, Cu, and Co by charting percent relative difference (Figure 8.5 is Ni% charted as sequential over time, while the remaining three figures are Ni%, Cu ppm and Co ppm charted according to increasing grade).
Page
|
/ / Initial Assessment - Technical Report Summary |
|
In early-2008, 97 check analysis results indicated that for samples grading above 2.0% Ni (Figure 8-5), 74% displayed <10% relative difference in Ni grade (over 60 comparative values). However, as highlighted on the chart, a reduction in Ni grade (increase in the negative difference between grades) was noted in the early-2008 Genalysis values in comparison to the ALS-Chemex results. This difference was subsequently explained by the effect of oxidation over time of the sample pulps on the liberation of Ni during assaying, as demonstrated in a small study in 2005 at the ALS-Chemex laboratory. In this study, 47 pulp samples were re-analyzed sequentially over time, with the results demonstrating that the oxidation of pulverized sample pulps causes the Ni assay result to decrease in a linear way over from the day of pulverization to the time of analysis. In the case of the Genalysis pulp checks, in early 2008, 27 pulps were prepared at ALS-Chemex but not immediately vacuum sealed, and therefore oxidized prior to their shipment to Genalysis, resulting in the low bias for Ni% highlighted on Figure 8-5.
When considering check analyses above 1% Ni, 94.7% of values displayed <10% relative difference (34 comparative values) and for samples grading above 2% Ni (generally massive sulfide), 100% of values showed <10% difference. For samples grading above 1% Ni, results from Genalysis averaged 2.2% (relative) higher overall than those from ALS-Chemex. A limited number (eight) of massive sulfide CRMs (average of 2.89% Ni) indicated that Genalysis was also high-biased for nickel by approximately 3.2% relative to ALS-Chemex during the FS phase; Correcting for the shifted CRM value indicates very close comparative values for massive sulfide during this time. This divergence between the ALS-Chemex and Genalysis results prompted KNCL to conduct additional assay tests using a different analysis method – a pyrosulfate fusion followed by XRF at SGS Lakefield.
The Genalysis check assays show that the Genalysis results presented a fairly consistent low bias of 0.02% Cu grade in comparison to ALS results (as shown in Figure 8-7), which corroborates the comparison Genalysis vs. ALS-Chemex for the CRM results.
For Co, both laboratories returned comparable results over the 2005 through 2009 period (Figure 8-8).
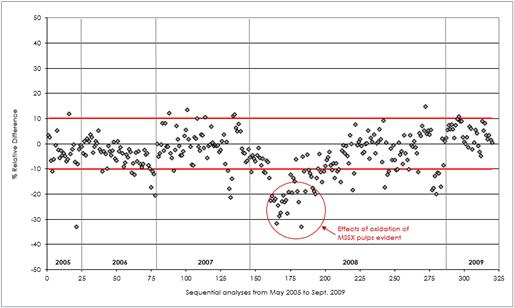
Figure 8-5: Genalysis vs. ALS-Chemex Pulp Check Assays Percent Relative Difference for Ni Grades 2005–09 – Sequential Analysis for Massive Sulfide Ni > 2% Figure 8-6: Genalysis vs. ALS-Chemex Pulp Check Assays Percent Relative Difference for Ni Grades 2005–09
Page
|
/ / Initial Assessment - Technical Report Summary |
|
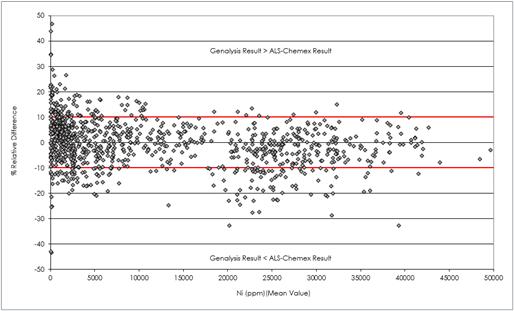
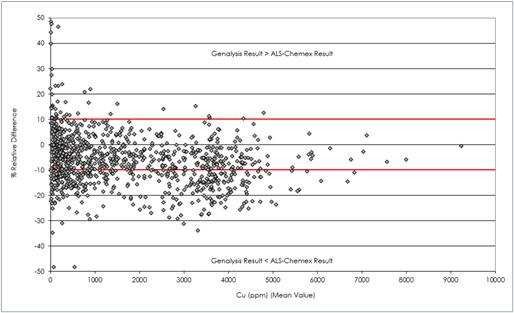
Figure 8-7: Genalysis vs. ALS-Chemex Pulp Check Assays Percent Relative Difference for Cu Grades 2005–09 Figure 8-8: Genalysis vs. ALS-Chemex Pulp Check Assays Percent Relative Difference for Co Grades 2005–09
Page
|
/ / Initial Assessment - Technical Report Summary |
|
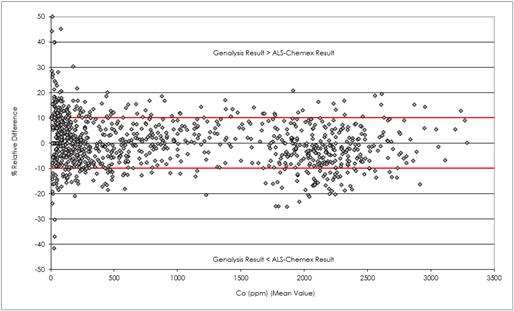
| 8.4.5 | SGS Lakefield Pulp Check Assays |
For umpire checks on the primary ALS laboratory 4-acid digest / ICP analyses, a total of 52 pulp samples (in nitrogen-purged and vacuum-sealed bags) were sent to SGS Lakefield. Relative difference percentages are shown in Figure 8-9. Results for 25 MSSX samples grading >2% Ni indicate that ALS was high-biased by 0.04% Ni relative to the SGS XRF technique. Note that the XRF technique results for Ni for ultramafic-hosted mineralization are higher than ICP results because XRF assays total Ni, (i.e., contained in sulfides and silicates).

Figure 8-9: SGS Lakefield vs. ALS-Chemex Pulp Check Assays Percent Relative Difference for Ni Grades Quarter core replicates were prepared from April 2005 through February 2007 for a total of 353 samples.
Page
|
/ / Initial Assessment - Technical Report Summary |
|
| 8.4.6 | Quarter Core Replicates |
The charted percent relative differences vs. grades are shown in Figure 8-10 through Figure 8-12 for Ni, Cu, and Co, respectively.
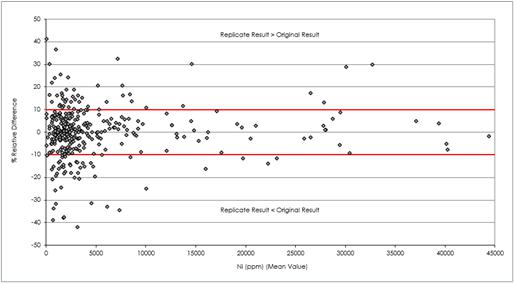
Figure 8-10: ALS-Chemex – Percent Relative Difference for Ni Grades for Quarter Core Replicates – 2005–07
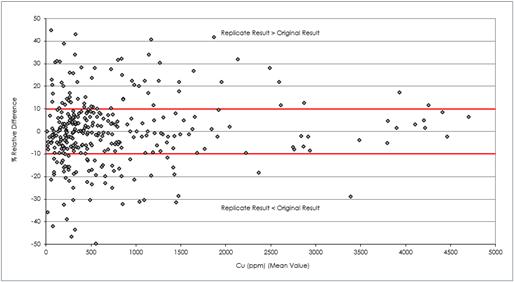
Figure 8-11: ALS-Chemex – Percent Relative Difference for Cu Grades for Quarter Core Replicates – 2005–07 Figure 8-12: ALS-Chemex – Percent Relative Difference for Co Grades for Quarter Core Replicates – 2005–07
Page
|
/ / Initial Assessment - Technical Report Summary |
|
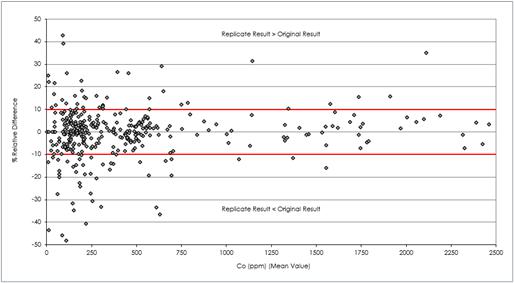
| 8.4.7 | Certified Reference Material Standards |
CRMs for the Project were collected in 2004 by Barrick from North zone. These were then shipped to the OREAS laboratory in Australia for certification using industry-accepted practice. A ‘round robin’ analytical exercise was conducted at seven laboratories worldwide using 4-acid digest / ICP finish for base metals, and fire assay / ICP for Au, Pd, and Pt. Two standards were certified: a massive sulfide standard and a disseminated (ultramafic-hosted) sulfide standard.
The massive sulfide and ultramafic material used to prepare the Kabanga CRMs was collected from North zone at depths of 150 m and 400 m below the surface. The Ni, Cu, and Co accepted grades for the Kabanga CRMs are as shown in Table 8-3.
Table 8-3: Kabanga CRMs – Accepted Grades
CRM |
Ni% | Cu% | Co% |
| Kabanga Massive Sulfide | 2.68 | 0.38 | 0.23 |
| Kabanga Ultramafic | 0.678 | 0.096 | 0.061 |
The two Kabanga CRMs were stored as nitrogen-purged aliquots at the ALS-Chemex laboratory in Perth and inserted into the sample sequence according to the overall frequency presented in Table 8-2, using the appropriate CRM to match the submitted samples, either massive sulfide material or ultramafic material.
Following an audit of QA/QC procedures in May 2009, the Ni% value for the massive sulfide CRM was modified from 2.68% Ni to 2.71% Ni, with all scoping study and PFS CRM charts updated. There was no change to the ultramafic accepted grade of 0.659% Ni. Results from the massive sulfide CRM analyses indicate 74% of all values lie within acceptable limits. Throughout the FS, however, there had been a consistent average elevated mean value for this CRM of 2.80% Ni (27 samples) vs. the (2009 revised) accepted mean value of 2.71% Ni. Figure 8-13 and Figure 8-14 show the Ni% analytical results for both Kabanga CRMs since the start of the scoping study in early 2005. Table 8-4 and Table 8-5 show the Kabanga CRMs Ni% average values from 2005 through 2009.
Page
|
/ / Initial Assessment - Technical Report Summary |
|
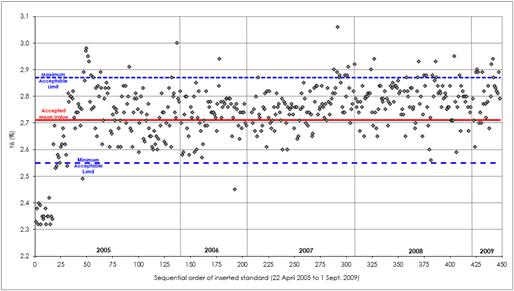
Figure 8-13: Kabanga Massive Sulfide CRM Ni Values 2005–09

Figure 8-14: Kabanga Ultramafic CRM Ni Values 2005–09
Table 8-4: Kabanga CRMs – Tracking of Ni% Results 2005–09
CRM |
Accepted Ni% Value |
Average Ni% | No. of Samples | ||||
| MSSX | 2.71 | 2.75 | 2.72 | 2.77 | 2.78 | 2.80 | 412 |
| UMAF | 0.68 | 0.66 | 0.64 | 0.64 | 0.66 | 0.67 | 429 |
Page
|
/ / Initial Assessment - Technical Report Summary |
|
Table 8-5: Kabanga Massive Sulfide CRM – Tracking of Ni% Results by Phase
Accepted Value 2.71% Ni |
|||
| Phase | Years | Number of Analyses | Average Ni% Values |
| Scoping Study | 2005–06 | 173 | 2.74 |
| Pre-feasibility Study | 2006–08 | 212 | 2.77 |
| Feasibility Study | 2008–09 | 27 | 2.80 |
| Total | 2005–09 | 412 | 2.76 |
The observed elevated massive sulfide CRM values during the FS period were further investigated. Because the two Kabanga CRMs were inserted in all sample batches submitted to both the primary laboratory, ALS-Chemex, and the check laboratory, Genalysis, it is possible to follow over time the evolution of the reported CRM results from both laboratories. The overall rising trend in Ni% values for the massive sulfide CRM from 2005 is noted at both laboratories, as shown in Figure 8-15 for the sequential Genalysis chart.
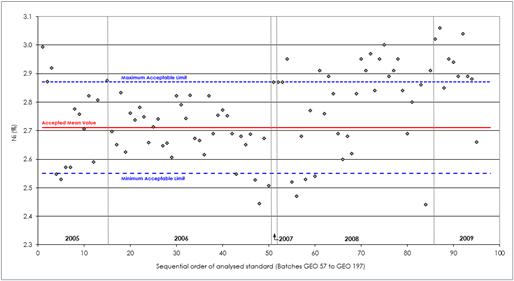
Figure 8-15: Kabanga Massive Sulfide CRM Ni% Values by Genalysis 2005–09
The cause of the overall rising trend of Ni% grade for the Kabanga massive sulfide CRM has not been definitively proven, but it is suspected that the Kabanga massive sulfide CRM may have lost its homogeneity during transport and handling of the pails of bulk material with the separation and settling of the denser nickel minerals (pentlandite has a density of 4.6–5.0 t/m3) from the pyrrhotite (which is the main nickel-bearing mineral in the Kabanga massive sulfide and has a density of 4.6 t/m3).
It was noted that the Kabanga ultramafic CRM did not suffer the same issue over the period, and there was no appreciable variance during the FS for the ultramafic CRM (0.01% Ni), as shown in Table 8-4. This further supports the theory that density separation is a potential cause of the overall rising trend of Ni% grade for the Kabanga massive sulfide CRM.
The statistical results, including accuracy and precision, for the Kabanga CRMs over the 2005–09 period are detailed in Table 8-6.
Page
|
/ / Initial Assessment - Technical Report Summary |
|
Table 8-6: Kabanga CRMs – Summary Statistics 2005–09
CRM |
Massive Sulfide | Ultramafic | ||||
|
Ni (%) |
Cu (ppm) |
Co (ppm) |
Ni (%) |
Cu (ppm) |
Co (ppm) |
|
| Number of Samples | 443 | 443 | 443 | 429 | 429 | 429 |
| Accepted Value | 2.71 | 3,820 | 2,310 | 0.68 | 962 | 605 |
| Mean | 2.74 | 3,757 | 2,161 | 0.66 | 944 | 564 |
| Median | 2.76 | 3,770 | 2,160 | 0.65 | 939 | 563 |
| Minimum | 2.32 | 2,310 | 1,645 | 0.57 | 827 | 487 |
| Maximum | 3.06 | 4,960 | 2,590 | 0.74 | 1,080 | 647 |
| Standard Deviation | 0.12 | 274 | 134 | 0.03 | 41 | 29 |
| Accuracy | 1.03 | –1.93 | –6.87 | –3.53 | –2.04 | –7.15 |
| Precision (at 95%) | 2.90 | 5.54 | 5.27 | 3.14 | 2.73 | 4.40 |
| Note: | Accuracy is calculated as the mean of the percent relative differences. | |
| Precision (at 95%) is calculated as 1.96 x standard deviation of the absolute percent relative differences / 2. |
Results for the ALS-Chemex internal reference material standard (‘Forrest B’) are summarized in Table 8-7 and shown in Figure 8-16 with details for Forrest B in Table 8-8.
These results corroborate the fact that the high Ni bias issue observed on the Kabanga massive sulfide CRM for both ALS-Chemex and Genalysis is inherent to the Kabanga CRM itself rather than a drift of the ALS-Chemex laboratory results. Note that in 2005, ALS-Chemex results for the Forrest B standard show several occurrences outside of the acceptable limits. The quality of the results improves from 2006 onwards, likely due to a better calibration of ALS-Chemex’s analytical equipment to these grade ranges.
Table 8-7: ALS-Chemex Internal Reference Material Standards – Tracking of Ni% Results 2005–09
ALS-Chemex
|
Accepted Ni% Value |
Average Ni% | No. of Samples | ||||
| 2005 | 2006 | 2007 | 2008 | 2009 | |||
| Forrest B | 4.52 | 4.61 | 4.51 | 4.53 | 4.58 | 4.54 | 452 |
| BM-44 | 1.27 | 1.29 | 1.27 | 1.28 | 1.29 | – | 354 |
| GBM306-12 | 0.95 | – | – | – | 0.96 | 0.94 | 150 |
| BM-64 | 0.60 | 0.63 | 0.61 | 0.60 | 0.62 | – | 475 |
| GBM398-4c | 0.41 | – | – | – | 0.40 | 0.40 | 162 |
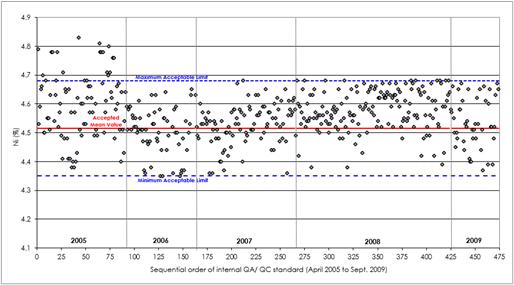
Figure 8-16: ALS-Chemex Internal Forrest B Standard – Results from 2005–09
Page
|
/ / Initial Assessment - Technical Report Summary |
|
Table 8-8: ALS-Chemex Internal Forrest B Standard – Summary Statistics 2005–09
Measure |
Ni% |
| Number of Samples | 452 |
| Accepted Value | 4.515 |
| Mean | 4.56 |
| Median | 4.56 |
| Minimum | 4.35 |
| Maximum | 5.01 |
| Standard Deviation | 0.09 |
| Accuracy | 0.95 |
| Precision (at 95%) | 1.40 |
| Note: | Accuracy is calculated as the mean of the percent relative differences. | |
| Precision (at 95%) is calculated as 1.96 x standard deviation of the absolute percent relative differences / 2. |
A comparison between the ALS-Chemex massive sulfide CRM results and those obtained by Genalysis showed that the Genalysis results were consistently higher than the ALS-Chemex results.
The phenomenon observed on Ni grades on the massive sulfide CRM results did not occur for Cu results, as shown in Figure 8-17 and Figure 8-18 (massive sulfide and ultramafic, respectively), which display the ALS-Chemex sequential results for the Kabanga CRMs for Cu from 2005 through 2009.
Co grades for the massive sulfide and ultramafic CRMs are shown in Figure 8-19 and Figure 8-20 , respectively. These show that approximately half of the Co grade results are below the minimum acceptable value.
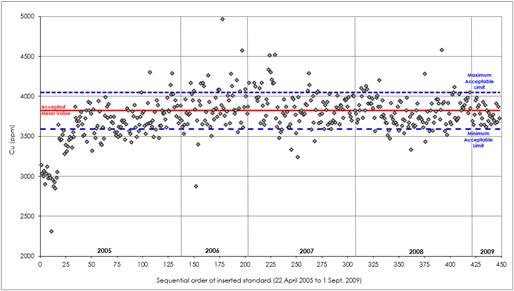
Figure 8-17: Kabanga MSSX CRM Cu Values 2005–09
Page
|
/ / Initial Assessment - Technical Report Summary |
|
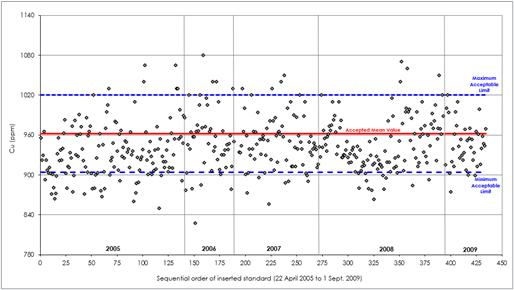
Figure 8-18: Kabanga UMAF CRM Cu Values 2005–09
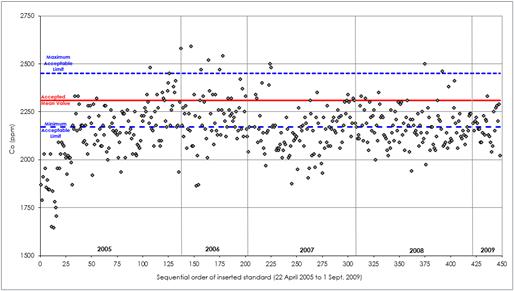
Figure 8-19: Kabanga MSSX CRM Co Values 2005–09
Page
|
/ / Initial Assessment - Technical Report Summary |
|
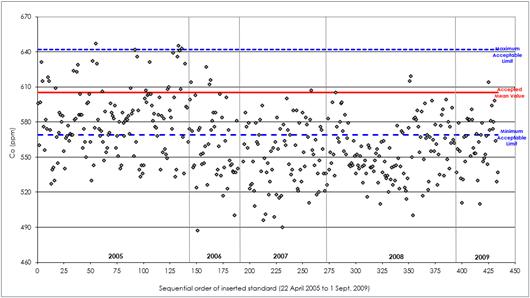
Figure 8-20: Kabanga UMAF CRM Co Values 2005–09
| 8.4.8 | Blanks |
Pure quartzite blanks were prepared and pulverized on site, then inserted into the sample series to monitor possible contamination at the sample preparation stages in Tanzania and in Perth. A total of 378 blanks were analyzed from 2005 through 2009. Figure 8-21 shows the results for potential Ni contamination.
An increase (mainly to Warning Level) in contamination for Ni, Cu, and Co was noted in January and February 2009. This was addressed at the ALS laboratory in Perth through more thorough cleaning of the pulverizing machines between samples. The 2009 QA/QC audit report recommended a decrease of the acceptable level for Ni contamination to 25 ppm (approximately) from 300 ppm, which was based on the official Ni protocol of 1/20th of the cut-off grade. This discussion was deemed at the time to be largely academic, as there is no significant effect on the Kabanga samples due to nickel contamination.
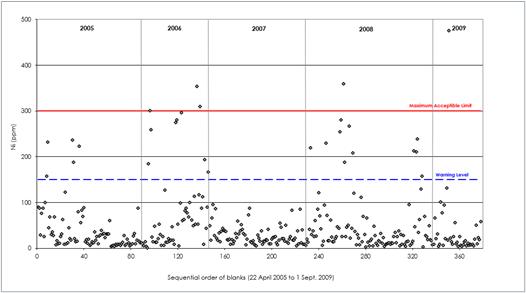
Figure 8-21: Blanks – Ni Results 2005–09
Page
|
/ / Initial Assessment - Technical Report Summary |
|
| 8.5 | Security |
Standard operating procedures exist and are followed to ensure the appropriate collection, transportation and security of samples.
Sample collection from the drill core is undertaken on site by geotechnicians following mark-ups on the core that are made by the logging geologist. A senior geologist oversees these activities.
Assay registers are used to allocate sample numbers while keeping track of the origins of each sample. A sampling logbook ensures the consistent insertion of QA/QC samples.
Samples are packed into labeled plastic bags, nitrogen-purged, sealed, weighed, then placed into plastic pails on a hole-by-hole basis. The pails are transported to the laboratory in a Project-owned and operated light vehicle.
On arriving at the laboratory, the standard operating procedures associated with sample receipt, sample preparation, and assaying are followed.
Data received from the laboratory is reviewed for acceptance by a senior geologist and uploaded into the on-site database.
The database is backed up on the company server. There are password limits on editorial access to the database, and all of the personnel permitted to edit data are experienced geologists and know the importance of data security.
| 8.6 | QP Opinion |
In the opinion of the QP, the sample preparation, security, and analytical procedures meet industry standards for data quality and integrity. There are no factors related to sampling or sample preparation that would materially impact the accuracy or reliability of the samples or the assay results. Recent infill drilling results have corroborated historical results. The outcomes of the QA/QC procedures indicate that the assay results are within acceptable levels of accuracy and precision and the resulting database is sufficient to support the estimation of Mineral Resources.
Page
|
/ / Initial Assessment - Technical Report Summary |
|
| 9.1 | Independent Verifications |
| 9.1.1 | Site Visit |
OreWin personnel visited the Project on October 20–21, 2022, March 21–30, 2023, and October 27–30, 2023. The site visits included briefings from the Project’s exploration and corporate personnel, and site inspections of the drill rigs, proposed mine, and plant and infrastructure locations.
The 2021-onwards primary laboratory, SGS Laboratories in Mwanza, Tanzania, was visited to inspect the facilities and discussions were held with SGS management.
| 9.1.2 | Verifications of Analytical Quality Control Data |
All aspects of the data that could materially impact the integrity of the Mineral Resource estimates (core logging, sampling, analytical results, and database management) were reviewed with the Project’s staff. OreWin personnel met with staff to ascertain exploration and production procedures and protocols. Drill rigs were visited, and core was observed being obtained from diamond drillholes and logged at the exploration camp to confirm that the logging information accurately reflects actual core. The lithology contacts checked matched the information reported in the core logs.
Analytical quality control data typically comprises analyses from reference material standards, blank samples, and a variety of duplicate data. Analyses of data from reference material standards and blank samples typically involve time series plots to identify extreme values (outliers), or trends, which may indicate issues with the overall data quality. To assess the repeatability of assay data, several tests can be performed, most of which rely on statistical tools. The following charts for duplicate data are routinely assessed:
| ● | Bias charts |
| ● | Quantile-quantile (Q-Q) charts |
| ● | Mean vs. relative difference charts |
| ● | Mean vs. absolute relative difference charts |
| ● | Ranked absolute relative difference charts |
| ● | From 2021-onwards, check assaying undertaken at the Nesch Mintech laboratory in Mwanza. |
| 9.2 | QP Opinion |
The QP’s review of results from recent drilling undertaken by the Project has corroborated the location of the mineralized zones and the tenor of the mineralization.
Page
|
/ / Initial Assessment - Technical Report Summary |
|
| 10.1 | Background |
The Project has a history of concentrator metallurgical testwork undertaken by various parties since the mid-1990s, with more extensive testing programs undertaken after 2005. The key metallurgical testwork programs included:
| ● | Metallurgical flotation testwork undertaken by AARL as part of an appraisal study PFS in 1999. |
| ● | Metallurgical testwork for the February 2006 Scoping Study was undertaken by the Falconbridge Technology Centre and included mineralogical, comminution testwork, bench-scale open-circuit and locked-cycle flotation testwork, concentrate dewatering testwork and concentrate self-heating tests. |
| ● | Metallurgical testwork for the September 2008 PFS and October 2009 Kabanga 2.2 Mtpa Engineering Study undertaken by SNC Lavalin, and for the July 2011 FS and December 2013 Draft FS update (unpublished) both by Lycopodium Limited (Lycopodium). A series of testwork campaigns were undertaken for these studies, which included comminution testwork, bench-scale open-circuit flotation testwork, mini pilot plant (MPP) flotation testwork, settling, filtration and rheology testwork, feed oxidation tests, and concentrate self-heating tests. The majority of the test program was conducted at XPS with supporting testwork by SGS Lakefield, Larox Inc., Sudbury, Ontario and Outotec, Burlington, Ontario. |
| ● | Metallurgical testwork over the period 2022–25 as part of the current study program, under the management of technical teams from KNL, DRA and LZM. The testwork program included both concentrator and refinery testwork. The majority of the concentrator testwork program was undertaken at Bureau Veritas Minerals Pty Ltd (BV) in Perth, with support from ALS Global (ALS) in Perth for a small portion of the comminution testwork scope. Additionally, concentrate regrind testwork was conducted by Swiss Tower Mills Minerals AG (STM) at the ALS test facility, settling and filtration testwork was conducted by Metso in Perth, and tailings pumping, and rheological characterization tests were conducted by Paterson & Cooke Consulting Engineers (Pty) Ltd in Cape Town. The refinery testwork was undertaken by Simulus Laboratories (Simulus), located in Perth, Australia (owned by LZM since July 2023). |
The current 2022–25 concentrator metallurgical testwork was performed on core samples originating from the Kabanga deposit. Samples were selected to represent the major lithology types and blends expected to be processed over the proposed LoM. The aim of the testwork was to further characterize the flotation response, optimize the flowsheet, generate bulk concentrate samples for the refinery testwork and vendor testwork, and to evaluate the degree of variability that could be expected across the deposit. The historical concentrator metallurgical testwork has also been referenced and used in combination with the current testwork.
The current refinery metallurgical testwork was performed on concentrate samples generated from the 2022–24 flotation testwork campaign. Samples were selected to represent a range of feed blends and concentrate grades expected to be processed over the proposed LoM. The aim of the hydrometallurgical testwork was to support the Refinery flowsheet development, derive design parameters and to evaluate the degree of variability that could be expected across the deposit.
| 10.2 | Concentrator |
| 10.2.1 | Concentrator Historical Testwork |
Extensive historical metallurgical testwork has been undertaken for the Kabanga Concentrator. This testwork included mineralogical, comminution, flotation and dewatering testwork. The original testing was primarily focused on blends with a high proportion of massive sulfides (~81% to 84%) and minor amounts of mineralized ultramafic material (~2% to 5%) containing pentlandite, pyrrhotite and chalcopyrite (sulfides) with varying amounts of sedimentary and ultramafic gangue (~12% to 15%). The historical testwork was aimed at producing a flotation concentrate that was to be shipped to Glencore’s Sudbury smelter and to other concentrate customers.
Page
|
/ / Initial Assessment - Technical Report Summary |
|
Various metallurgical testwork campaigns were conducted at the Falconbridge Technology Centre, SGS Lakefield, XPS and at vendor laboratories such as Larox and Metso, predominantly over the period 2005–10 but with initial appraisal testing dating back to the mid-1990s. The key findings from the historical testwork can be summarized as follows:
| ● | The samples were reported to reflect a massive sulfide feed type, containing pentlandite, pyrrhotite and chalcopyrite with varying amounts of sedimentary and ultramafic gangue. The pentlandite grain sizes were reported to be coarse, averaging from 200 μm to 300 μm. The ratio of pyrrhotite to pentlandite ranged from 7 to 12. Pentlandite was identified as the predominant nickel and cobalt-bearing mineral. The nickel grade in solid solution in pyrrhotite was reported to average 0.2%. The dominant copper mineral was identified as chalcopyrite. |
| ● | Bond ball mill work index (BWi) tests were performed at a 100 μm closing size with a reported BWi value of 9.1 kWh/t to 10.2 kWh/t for the massive sulfide (MSSX) samples and 15.5 kWh/t to 21.3 kWh/t for the sedimentary and ultramafic waste samples. The MSSX material was classified as being relatively soft compared to the harder mineralized ultramafic (UMAF_1a) and even harder waste samples. |
| ● | Soft SMC Test® ‘A × b’ values of 169 to 330 were reported for the MSSX samples compared to hard values of 18 to 21 for the waste and UMAF_1a samples. Similarly, the MSSX sample’s ‘ta’ values ranged from 1.5 to 2.8 compared to 0.2 to 0.3 for the waste samples. This further supported the highly competent nature of the UMAF_1a and waste lithology types, and the comparatively soft nature of the MSSX feed types. |
| ● | The crushed massive sulfide samples were found to be reactive when left exposed under warm, humid conditions, resulting in oxidation which reduced flotation recovery within a period of one to four weeks. |
| ● | The optimum flotation feed grind size was found to be 80% passing 100 μm. |
| ● | The metallurgical performance of the North and Tembo massive sulfide blend composites was found to be similar. Differences in the flotation grade and recovery response were attributed to feed grade variances. |
| ● | The MPP results achieved nickel recoveries ranging from 83% to 90% at a concentrate nickel grade of 17% to 22%, as summarized in Table 10-1. |
Table 10-1: Summary of Historical Mini Pilot Plant Mass Balance Results
MPP Campaign |
Composite ID | Blend (%) | Nickel (%) | Copper (%) | ||||||
| MSSX | UMAF_1a | Dilution | Feed Grade | Conc. Grade | Recovery | Feed Grade | Conc. Grade | Recovery | ||
| MPP1 | North | 81 | 4 | 15 | 2.59 | 21.2 | 88.5 | 0.36 | 3.07 | 91.6 |
| MPP1 | North | 81 | 4 | 15 | 2.51 | 21.3 | 86.6 | 0.36 | 3.20 | 90.7 |
| MPP1 | LoM | 83 | 5 | 12 | 2.41 | 19.6 | 89.3 | 0.34 | 2.86 | 89.3 |
| MPP2 | Y1 to Y4 | 83 | 2 | 15 | 2.38 | 22.0 | 83.3 | 0.34 | 3.33 | 78.4 |
| MPP2 | LoM #2 | 84 | 2 | 14 | 2.39 | 17.4 | 90.5 | 0.35 | 2.47 | 90.5 |
| MPP2 | Tembo | 83 | 3 | 14 | 2.16 | 19.6 | 88.6 | 0.31 | 3.02 | 93.6 |
As illustrated by the comparative grade-recovery curves in Figure 10-1, the historical MPP results showed improved grade and recovery responses relative to the bench-scale testing (High Confidence Flotation Test (HCFT)) results.
Page
|
/ / Initial Assessment - Technical Report Summary |
|
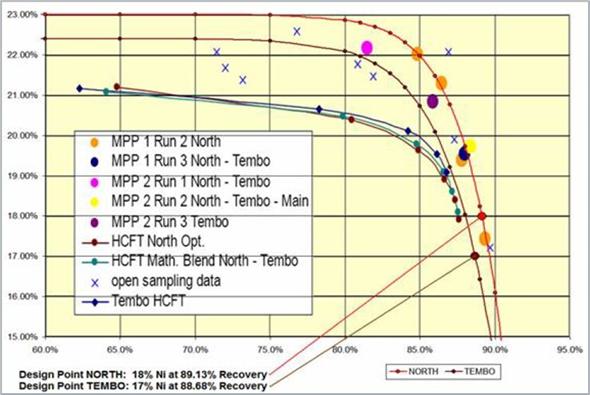
Source: Kabanga Nickel Project Draft Feasibility Study, Lycopodium (December 2013)
Figure 10-1: Summary of Historical MPP Testwork Grade Recovery Curves
| ● | The historical flotation testwork demonstrated that a relatively simple, conventional flotation flowsheet, using a typical flotation reagent regime, could be used for the effective separation of pentlandite and chalcopyrite from the pyrrhotite and non-sulfide gangue, generating high nickel grade concentrates with payable cobalt and copper grades at high metal recoveries. |
| ● | The measurement of the dissolved oxygen levels and lime consumption to maintain the pH indicated the level of completeness of oxidation in the aeration stage. |
| ● | The recycling of flotation process water did not have a detrimental impact on flotation performance. |
| ● | The flotation testwork and Quantitative Evaluation of Minerals by Scanning Electron Microscopy (QEMSCAN) analysis conducted on the MPP products demonstrated that a high-grade concentrate with low levels of deleterious elements could be produced. |
| ● | The historical testwork procedure included heating the flotation feed slurry to 38 °C to reflect the expected ambient flotation feed conditions after milling. This was reportedly based on benchmarked flotation feed slurry temperature measurements for a nearby Tanzanian flotation operation. It was reported that the higher process water temperature improved the concentrate grade for the same recovery; however, the flotation kinetics were slower, requiring a longer rougher flotation residence time with increased xanthate collector addition. |
| ● | The results of the thickening testwork recommended an optimal thickening flux of 0.26 t/m2h for the concentrate duty and 1.12 t/m2h for the tailings duty. A thickener underflow solids concentration of > 75% (w/w) was achieved for both applications. |
| ● | The pressure filtration testwork on the concentrate achieved a lower product moisture of 8% (w/w) to 11% (w/w) with filtration fluxes ranging from 382 kg/m2h to 687 kg/m2h. |
| ● | The tailings rheology testwork indicated that the tails samples exhibited similar slurry rheology and that the pumping of solids at densities of up to 60% (w/w) solids using centrifugal pumps was not expected to be problematic. |
| ● | The concentrate was found to exhibit a degree of self-heating due to its high pyrrhotite content. |
Page
|
/ / Initial Assessment - Technical Report Summary |
|
This historical testwork provided a basis for the metallurgical testwork and development undertaken as part of the current study program of work.
| 10.2.2 | Concentrator Current Testwork (2022-25) |
In support of the Kabanga studies, additional metallurgical testwork was undertaken over the period March 2022–July 2024. This metallurgical testwork program used the historical testwork as a basis from which to further optimize the flowsheet and characterize the comminution and flotation response. The program was completed in two phases and included flowsheet development and optimization testing as well as variability testing. Additionally, concentrate materials handling characterization testwork on concentrate product samples from the 2022–24 campaign was also completed in April 2025.
The majority of testwork programs were undertaken at the accredited BV laboratory in Perth, with support from other specialist laboratories. Testing included comprehensive head grade analysis, mineralogy, comminution (physical crushing and grinding) tests, open circuit and locked-cycle bench-scale flotation tests, open circuit bulk flotation tests, feed oxidation assessments, concentrate regrind, thickening, filtration, rheology, tailings and paste geochemistry, and concentrate materials handling testing.
The aim of the program was to further characterize the flotation response, optimize the flowsheet, generate bulk concentrate samples for the refinery testwork and to evaluate the degree of variability that could be expected across the deposit.
| 10.2.2.1 | Current Testwork Samples |
The concentrator metallurgical testwork was conducted on 4,616 kg of quarter, half and full N-size (NQ) drill core sample intervals delivered to BV over the period March 2022 to January 2024. The core sample intervals were placed in cold freezer storage to minimize oxidation.
The sample intervals included material from the North and Tembo zones representing the primary massive sulfide (MSSX), massive sulfide with xenoliths intrusions (MSXI), mineralized ultramafic (UMAF_1a) comprising semi-massive to net- and reverse net-textured sulfides hosted within ultramafic bodies, and mining waste dilution (lower pelite unit (LRPU), banded pelite unit (BNPU), hornblende (HORN), and unmineralized ultramafic (UMAF_KAB)). The MSSX, MSXI and UMAF_1a samples comprised pentlandite, pyrrhotite, and chalcopyrite as the primary sulfide minerals.
An example of some of the drill core intervals used in the current testwork programs is presented in Figure 10-2.
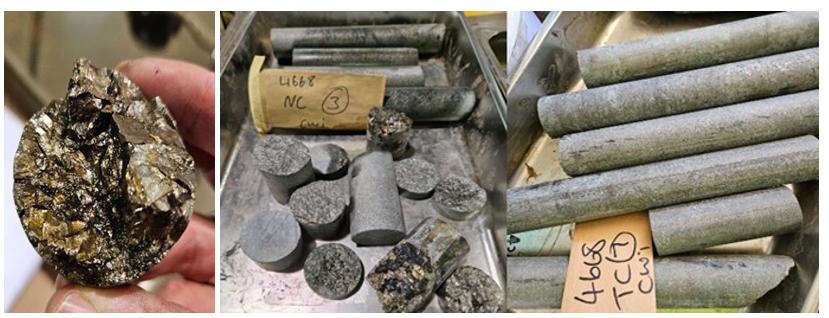
Figure 10-2: Example of Concentrator Metallurgical Testwork Drill Core Intervals
The Tembo and North drill core sample intervals are listed in Table 10-2 and Table 10-3, respectively.
Page
|
/ / Initial Assessment - Technical Report Summary |
|
Table 10-2: Concentrator Tembo Testwork Sample Intervals
Hole Number |
Phase | Rock Unit |
From (m) |
To (m) |
Width (m) |
Weight (kg) |
| KL21-01 | 1 | LRPU | 367 | 370 | 3 | 11 |
| KL21-01 | 1 | MSSX | 370 | 390 | 20 | 102 |
| KL21-01 | 1 | UMAF_1a | 390 | 393 | 3 | 12 |
| KL21-01 | 1 | MSSX | 393 | 394 | 1 | 4 |
| KL21-01 | 1 | LRPU | 394 | 397 | 3 | 10 |
| KL21-02 | 1 | LRPU | 573 | 576 | 3 | 10 |
| KL21-02 | 1 | MSSX | 576 | 594 | 18 | 93 |
| KL21-02 | 1 | LRPU | 594 | 596 | 2 | 7 |
| KL22-01 | 1 | LRPU | 369 | 372 | 3 | 11 |
| KL22-01 | 1 | MSSX | 372 | 392 | 21 | 108 |
| KL22-01 | 1 | LRPU | 392 | 395 | 3 | 9 |
| KL22-02 | 1 | LRPU | 313 | 316 | 3 | 10 |
| KL22-02 | 1 | MSSX | 316 | 336 | 19 | 100 |
| KL22-02 | 1 | LRPU | 336 | 338 | 2 | 7 |
| KL22-03 | 1 | LRPU | 579 | 581 | 2 | 10 |
| KL22-03 | 1 | MSSX | 581 | 585 | 5 | 37 |
| KL22-03 | 1 | UMAF_1a | 585 | 591 | 6 | 39 |
| KL22-03 | 1 | MSSX/MSXI | 592 | 593 | 1 | 8 |
| KL22-03 | 1 | UMAF | 631 | 637 | 6 | 30 |
| KL22-04 | 1 | UMAF_1a | 495 | 507 | 12 | 27 |
| KL22-04 | 1 | UMAF | 507 | 510 | 3 | 3 |
| KL22-05 | 1 | UMAF_1a | 435 | 442 | 7 | 16 |
| KL22-05 | 1 | UMAF | 442 | 444 | 2 | 2 |
| KL22-06 | 1 | UMAF_1a | 386 | 392 | 6 | 14 |
| KL22-06 | 1 | UMAF | 392 | 394 | 2 | 2 |
| KL22-08 | 1 | UMAF_1a | 228 | 237 | 9 | 22 |
| KL22-08 | 1 | UMAF | 237 | 239 | 2 | 2 |
| KL22-09 | 1 | UMAF_1a | 232 | 236 | 4 | 8 |
| KL21-01A | 1 | LRPU | 369 | 371 | 2 | 12 |
| KL21-01A | 1 | MSSX | 371 | 396 | 24 | 187 |
| KL21-01A | 1 | LRPU | 396 | 399 | 3 | 15 |
| KL07-06A | 1 | LRPU | 327 | 331 | 4 | 18 |
| KL07-06A | 1 | MSSX | 331 | 337 | 6 | 46 |
| KL07-06A | 1 | UMAF_1a | 337 | 349 | 12 | 74 |
| KL07-06A | 1 | UMAF | 349 | 352 | 3 | 16 |
Page
|
/ / Initial Assessment - Technical Report Summary |
|
Hole Number |
Phase | Rock Unit |
From (m) |
To (m) |
Width (m) |
Weight (kg) |
| KL23-10 | 2 | LRPU | 634 | 637 | 3 | 6 |
| KL23-10 | 2 | MSSX | 637 | 646 | 9 | 28 |
| KL23-10 | 2 | UMAF_1a | 646 | 650 | 4 | 10 |
| KL23-10 | 2 | UMAF | 650 | 653 | 2 | 5 |
| KL23-23 | 2 | LRPU | 645 | 647 | 2 | 5 |
| KL23-23 | 2 | MSSX | 647 | 650 | 3 | 11 |
| KL23-23 | 2 | UMAF_1a | 650 | 658 | 8 | 23 |
| KL23-23 | 2 | UMAF | 658 | 660 | 2 | 5 |
| KL23-17A | 2 | LRPU | 571 | 576 | 5 | 25 |
| KL23-17A | 2 | MSSX | 576 | 581 | 4 | 31 |
| KL23-17A | 2 | UMAF_1a | 581 | 589 | 8 | 49 |
| KL23-17A | 2 | UMAF | 589 | 594 | 5 | 28 |
| KL23-21A | 2 | LRPU | 673 | 678 | 5 | 24 |
| KL23-21A | 2 | MSSX | 678 | 680 | 2 | 13 |
| KL23-21A | 2 | UMAF_1a | 680 | 689 | 9 | 56 |
| KL23-21A | 2 | UMAF | 689 | 694 | 5 | 27 |
| GT23-05 | 2 | LRPU | 216 | 217 | 1 | 5 |
| GT23-05 | 2 | UMAF_1a | 231 | 237 | 6 | 35 |
| GT23-05 | 2 | UMAF_KAB | 237 | 238 | 1 | 5 |
| GT23-08 | 2 | LRPU | 282 | 284 | 2 | 2 |
| GT23-08 | 2 | MSSX | 284 | 310 | 26 | 41 |
| GT23-08 | 2 | LRPU | 310 | 312 | 2 | 2 |
| GT23-06 | 2 | LRPU | 242 | 247 | 5 | 25 |
| GT23-06 | 2 | MSSX | 247 | 255 | 8 | 60 |
| GT23-06 | 2 | UMAF_1a | 255 | 269 | 14 | 95 |
| GT23-06 | 2 | UMAF_KAB | 269 | 274 | 5 | 26 |
| GT23-07 | 2 | LRPU | 302 | 307 | 5 | 24 |
| GT23-07 | 2 | MSSX | 307 | 330 | 23 | 181 |
| GT23-07 | 2 | LRPU | 330 | 335 | 5 | 24 |
Page
|
/ / Initial Assessment - Technical Report Summary |
|
Table 10-3: Concentrator North Testwork Sample Intervals
Hole Number |
Phase | Rock Unit | From
(m) |
To
(m) |
Width
(m) |
Weight
(kg) |
| KN22-01 | 1 | BNPU | 361 | 363 | 2 | 6 |
| KN22-01 | 1 | BNPU | 368 | 369 | 1 | 4 |
| KN22-01 | 1 | MSSX | 369 | 397 | 28 | 142 |
| KN22-01 | 1 | GAB | 397 | 400 | 3 | 10 |
| KN22-02 | 1 | BNPU | 435 | 437 | 2 | 6 |
| KN22-02 | 1 | MSSX | 437 | 452 | 15 | 77 |
| KN22-02 | 1 | UMAF | 452 | 458 | 6 | 24 |
| KN22-03 | 1 | BNPU | 238 | 244 | 6 | 25 |
| KN22-03 | 1 | MSSX | 244 | 284 | 40 | 198 |
| KN22-03 | 1 | LRPU | 284 | 290 | 6 | 25 |
| KN22-01A | 1 | MSSX | 369 | 380 | 11 | 87 |
| KN22-01A | 1 | MSSX | 380 | 397 | 17 | 133 |
| KN08-21A | 1 | BNPU | 1,008 | 1,012 | 4 | 17 |
| KN08-21A | 1 | MSSX | 1,012 | 1,037 | 25 | 199 |
| KN08-21A | 1 | LRPU | 1,037 | 1,040 | 3 | 12 |
| KN08-21B | 1 | BNPU | 1,008 | 1,012 | 3 | 17 |
| KN08-21B | 1 | MSSX | 1,012 | 1,036 | 25 | 197 |
| KN08-21B | 1 | LRPU | 1,036 | 1,039 | 2 | 12 |
| KN08-61A | 1 | BNPU | 911 | 916 | 4 | 16 |
| KN08-61A | 1 | MSSX | 916 | 958 | 42 | 312 |
| KN08-61A | 1 | LRPU | 958 | 961 | 3 | 12 |
| KN08-61B | 1 | BNPU | 911 | 914 | 3 | 16 |
| KN08-61B | 1 | MSSX | 929 | 954 | 25 | 192 |
| KN08-61B | 1 | UMAF_1a | 954 | 957 | 4 | 23 |
| KN08-61B | 1 | MSSX | 914 | 929 | 14 | 97 |
| KN08-04A | 1 | BNPU | 1,071 | 1,075 | 4 | 22 |
| KN08-04A | 1 | MSSX | 1,075 | 1,097 | 22 | 175 |
| KN08-04A | 1 | LRPU | 1,097 | 1,100 | 3 | 12 |
| KN22-02 | 1 | UMAF | 458 | 466 | 9 | 44 |
| KN23-02 | 2 | BNPU | 1,046 | 1,048 | 2 | 5 |
| KN23-02 | 2 | MSXI | 1,048 | 1,056 | 8 | 23 |
| KN23-02 | 2 | BNPU | 1,056 | 1,058 | 2 | 5 |
| KN23-02 | 2 | BNPU | 1,067 | 1,068 | 1 | 3 |
| KN23-02 | 2 | MSSX | 1,068 | 1,073 | 5 | 16 |
| KN23-02 | 2 | LRPU | 1,073 | 1,077 | 4 | 4 |
| KN23-04 | 2 | BNPU | 767 | 769 | 2 | 2 |
| KN23-04 | 2 | MSSX | 769 | 783 | 13 | 21 |
| KN23-04 | 2 | UMAF_1a | 783 | 790 | 7 | 10 |
| KN23-04 | 2 | UMAF_KAB | 790 | 792 | 2 | 2 |
Page
|
/ / Initial Assessment - Technical Report Summary |
|
Hole Number |
Phase | Rock Unit | From
(m) |
To
(m) |
Width
(m) |
Weight
(kg) |
| KN23-05 | 2 | BNPU | 798 | 800 | 2 | 2 |
| KN23-05 | 2 | MSSX | 800 | 805 | 5 | 8 |
| KN23-05 | 2 | UMAF_1a | 805 | 815 | 11 | 15 |
| KN23-05 | 2 | UMAF_KAB | 815 | 817 | 2 | 3 |
| KN23-06 | 2 | BNPU | 1,227 | 1,229 | 2 | 2 |
| KN23-06 | 2 | MSSX | 1,229 | 1,245 | 16 | 24 |
| KN23-06 | 2 | LRPU | 1,245 | 1,247 | 2 | 2 |
| GT23-09 | 2 | BNPU | 311 | 313 | 2 | 5 |
| GT23-09 | 2 | MSSX | 313 | 322 | 9 | 29 |
| GT23-09 | 2 | LRPU | 322 | 324 | 2 | 5 |
| GT23-10 | 2 | BNPU | 174 | 176 | 2 | 2 |
| GT23-10 | 2 | MSSX | 176 | 186 | 9 | 15 |
| GT23-10 | 2 | UMAF_1a | 186 | 196 | 10 | 13 |
| GT23-10 | 2 | UMAF_KAB | 196 | 198 | 2 | 3 |
| KN23-09 | 2 | LSSC | 1,224 | 1,226 | 2 | 2 |
| KN23-09 | 2 | MSSX | 1,226 | 1,249 | 23 | 37 |
| KN23-09 | 2 | LRPU | 1,249 | 1,251 | 2 | 2 |
| KN23-04A | 2 | BNPU | 765 | 770 | 5 | 24 |
| KN23-04A | 2 | MSSX | 770 | 782 | 11 | 86 |
| KN23-04A | 2 | UMAF_1a | 782 | 790 | 8 | 55 |
| KN23-04A | 2 | UMAF_KAB | 790 | 794 | 5 | 26 |
| GT23-11 | 2 | BNPU | 167 | 170 | 3 | 14 |
| GT23-11 | 2 | MSSX | 170 | 172 | 2 | 16 |
| GT23-11 | 2 | UMAF_1a | 172 | 181 | 9 | 57 |
| GT23-11 | 2 | UMAF_KAB | 181 | 184 | 3 | 17 |
Note: LSSC/GAB reflects sediment dilution
The sample selection was based on the zones and grade profiles indicated in the North and Tembo underground block model. The locations of the MSSX and UMAF_1a sample intervals are shown in Figure 10-3 and Figure 10-4, respectively.
Page
|
/ / Initial Assessment - Technical Report Summary |
|
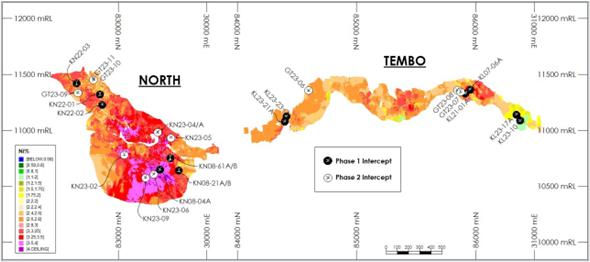
Figure 10-3: MSSX Metallurgical Testwork Sample Locations
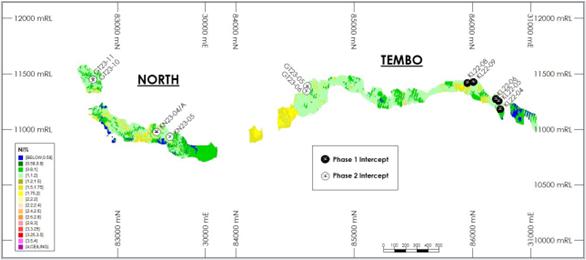
Figure 10-4: UMAF_1a Metallurgical Testwork Sample Locations
The drill core intervals as presented in Table 10-2 and Table 10-3 were used to prepare various composites and point samples for the current study concentrator metallurgical testwork program as follows:
| ● | Blend composites representing blends of end members from various drill core samples (for example, a blend of 73% MSSX, 12% UMAF_1a, and 15% dilution using sample intervals selected from a selection of drill core holes. |
| ● | Domain composites representing blends of individual end members from various drill core samples (for example, a blend of Tembo MSSX from the Tembo drill core holes). |
| ● | Domain point samples representing the individual end members from individual drill core samples (for example, a North MSSX interval from drill core hole KN22-01). |
| ● | Point sample blend composites representing the individual end members from individual drill core samples and inclusive of dilution (for example, a blend of 89% UMAF_1a and 11% UMAF_KAB dilution from drill core hole KN23-04). |
The testwork samples were selected and prepared in consultation with the project team’s geology, metallurgy and mining representatives and included suitable intervals of dilution (LRPU, BNPU, HORN and UMAF_KAB) above, below and within the MSSX, MSXI and UMAF_1a end member sample intervals.
Page
|
/ / Initial Assessment - Technical Report Summary |
|
Sample selection and composite preparation also considered grade ranges and expected LoM grades, spatial coverage including depth and along strike, appropriate levels of planned and unplanned mining dilution as advised by the relevant mining disciplines, the proportion of MSSX and UMAF_1a tonnage in the overall mine life, and other factors.
The testwork samples covered a nickel feed grade ranging from 1.5% to 3.7% for the MSSX material, 0.7% to 1.7% for UMAF_1a, and blends of MSSX and UMAF_1a ranging from 1.6% to 2.4% nickel (Ni).
Following composite preparation, all samples were placed in cold, freezer storage to minimize oxidation.
| 10.2.2.2 | Summary of Current Testwork Results |
This section summarizes the results and key findings from the current concentrator metallurgical testwork program carried out in support of the IA and ongoing studies.
Feed Characterization and Mineralogy
Mineralogy and feed characterization assessments on the current samples were aligned to historical testwork findings, indicating the following:
| ● | The primary lithologies reflect massive sulfides (MSSX containing 71% to 98% sulfides), massive sulfide with xenoliths of metasedimentary or gabbro/ultramafic rock (MSXI containing 55% to 61% sulfides), and semi-massive to net and reverse net-textured sulfides hosted within ultramafic bodies (UMAF_1a containing 36% to 63% sulfides). |
| ● | Samples were comprised of pentlandite, pyrrhotite, and chalcopyrite as the primary sulfide minerals in combination with varying amounts of sedimentary and ultramafic gangue. |
| ● | The nickel is predominantly present as pentlandite with some violarite. |
| ● | Copper is contained in the chalcopyrite and the primary gangue mineral is pyrrhotite. |
| ● | Cobalt deportment in the feed was not indicated; however, the mineralogical analysis of the flotation tailings and concentrate product streams determined that cobalt was deported within the pentlandite. This is aligned with the historical mineralogical findings, where pentlandite was reported to contain approximately 2.4% cobalt. |
| ● | Nickel was well liberated at the feed grind size of 80% passing 100 µm, with the > 90% liberation class ranging from 92% to 95% for the MSSX samples, 83% to 93% for the MSXI samples and 73% to 92% for the UMAF_1a samples. Poorly liberated nickel predominantly occurred as binary particles associated with pyrrhotite and silicates. Copper was also found to be well liberated. The samples also contained approximately 0.2 g/t of platinum-group elements (PGEs). |
| ● | The magnesium in the feed was low in the MSSX (<1%) samples but elevated in the UMAF_1a samples (~7.5%) and increased relative to the proportion of UMAF_1a in the blend samples. |
| ● | These samples contained low levels of mercury (<0.02 ppm), arsenic (46–175 ppm), bismuth (1.7–9.9 ppm), lead (49–251 ppm), zinc (136–286 ppm). |
| ● | The mineralogical and chemical analysis data show that the massive and semi-massive sulfides (MSSX and MSXI) from both North and Tembo have a similar mineral abundance, nickel and iron deportment, and liberation characteristics. Similarly, the UMAF_1a samples from both North and Tembo also had similar mineralogical characteristics. |
| ● | Comparatively, the primary MSSX end member samples, the MSXI samples had a similar nickel mineralization; however, the MSXI samples were less liberated (~4% lower), had a marginally finer grain size and were of a lower grade, containing higher levels of impurities. The UMAF_1a samples also had a similar nickel mineralization to that of the MSSX samples; however, the UMAF_1a samples were less liberated (~8% lower), exhibited a finer grain size and were of a lower grade, with higher levels of impurities. |
Page
|
/ / Initial Assessment - Technical Report Summary |
|
Mineralogy has demonstrated the material characteristics of the Kabanga samples are amenable to processing using conventional comminution and flotation techniques.
Comminution Testwork
The comminution testwork included the Bond crusher work index (CWi), BWi, and Ai tests in combination with GrindMill batch milling tests. The comminution testwork confirmed the previous testwork findings, demonstrating that:
| ● | The MSSX samples can be classified as soft with respect to crushing, with an average CWi of 5.7 kWh/t to 6.5 kWh/t. In comparison, the UMAF_1a samples exhibited a significant variance in hardness, with the North sample classified as soft with a CWi of 11.6 kWh/t, while the Tembo UMAF_1a composite was classified as hard, with a CWi of 20.3 kWh/t. The waste composite was classified as medium hard, with a CWi of 17.7 kWh/t. |
| ● | The MSSX samples were classified as soft to medium hard with respect to ball milling, with a BWi ranging from 8.4 kWh/t to 10.9 kWh/t. In comparison, the BWi ranged from 13.2 kWh/t to 16.9 kWh/t for the UMAF_1a samples, classifying them as medium to hard. The LRPU/BNPU waste composite had an average BWi of 14.3 kWh/t, which was similar to the BWi of the UMAF_1a samples, while an average BWi of 17.7 kWh/t was reported for the UMAF_KAB waste sample, classifying it as hard. |
| ● | All the samples had a low abrasion tendency, with an Ai ranging from 0.05 to 0.16 and averaging 0.061. For reference, an Ai of 0.2 to 0.5 is considered to reflect a medium abrasion tendency, while an Ai greater than 0.5 is considered abrasive. |
| ● | Regrind testwork highlighted the relatively soft nature of the sulfide rougher concentrate, requiring a specific grinding energy of 3.9 kWh/t to reduce the 80% passing particle size from 55 µm to 35 µm. |
The current comminution testwork, in combination with the historical testwork, provided sufficient data to derive comminution circuit design parameters for a flowsheet trade-off assessment, which resulted in the selection of a two-stage crushing circuit, and two identical 1.7 Mtpa ball milling trains for a combined capacity of 3.4 Mtpa.
Ni-Cu-Co Flotation Testwork
In addition to the historical MPP flotation testing, extensive, open-circuit, locked-cycle and bulk flotation testwork has been conducted for the current IA and ongoing studies.
The flotation program included flowsheet development and optimization assessments, followed by open-circuit variability testing to quantify the expected metallurgical performance and highlight the degree of variability to be expected when processing blends of MSSX, MSXI, UMAF_1a and waste dilution. The key results and findings can be summarized as follows:
| ● | The optimal flotation circuit feed size of 80% passing 100 µm and a feed solids concentration of 35% (w/w) was confirmed. |
| ● | The inclusion of rougher concentrate regrinding improved the final concentrate nickel grade by approximately 1.0% to 2.0% when compared to tests with no regrind. |
| ● | Flowsheet development tests indicated that split cleaner configuration including the Jameson Cell in the final high-grade cleaner and medium-grade re-cleaner duties improved the nickel upgrade profile, also increasing the nickel grade by approximately 2% to 3%. |
| ● | The addition of 500 g/t to 650 g/t of carboxymethyl cellulose (CMC) to depress magnesium silicate gangue minerals was found to be beneficial to the UMAF_1a and blend samples, which contained > 2% magnesium in the feed. |
| ● | The addition of 100 g/t to 300 g/t of sodium sulfite to depress iron in the cleaner circuit was found to be beneficial to the MSSX and MSXI samples. The sodium sulfite addition showed no benefit for the UMAF_1a samples. |
| ● | Testwork program included a series of open-circuit cleaner variability tests on 26 MSSX, MSXI, UMAF_1a, and blend samples. A variable performance was observed, where the MSSX samples (> 80% sulfides) achieved a superior upgrade profile in comparison to the MSXI samples, which in turn showed a superior upgrade profile relative to the UMAF_1a samples. For all the end member types, the final concentrate open-circuit test nickel recovery and grade increased as the head grade increased. |
Page
|
/ / Initial Assessment - Technical Report Summary |
|
| ● | The blend testwork showed good agreement between the actual blend results and the modeled math blend results using the respective MSSX and UMAF_1a recovery and grade modeling correlations for blends containing up to 20% UMAF_1a with potential for a reduced concentrate grade and recovery for blends containing approximately 35% to 40% UMAF_1a and above. This finding is aligned with the historical testwork findings. |
| ● | The flotation testwork also highlighted a difference in flotation performance between the bench-scale tests and the larger bulk-scale tests, with the bulk-scale tests typically achieving a higher nickel grade at a similar recovery. A similar observation was made in the historical testwork, where the MPP runs were able to achieve higher concentrate grades than the bench-scale flotation tests. |
Four locked-cycle tests were conducted, indicating the potential to achieve:
| ‒ | A nickel recovery of 88.8% to 89.5% at a final concentrate nickel grade of 18% for the MSSX-rich samples. |
| ‒ | A nickel recovery of 74.2% at a final concentrate nickel grade of 12% for a UMAF_1a composite sample. |
| ‒ | A nickel recovery of 84.4% at a final concentrate nickel grade of 15% for a blend sample (containing 57% MSSX, 32% UMAF_1a and 11% dilution). Based on the mine plan data at the time, this sample was expected to represent the upper extremity of UMAF_1a in the mill feed blend. |
| ● | Locked-cycle performance projections derived from open circuit cleaner data were found to be in good agreement with the actual locked-cycle test results. |
| ● | The feed oxidation tests reflecting simulated warm, humid conditions for the relatively finely crushed material (< 30 mm) with a high degree of surface exposure showed a reduction in rougher recovery after the first week for the MSSX samples and after two to six weeks for the UMAF_1a samples. It was, however, not possible to test the oxidation potential of the coarser RoM material (< 800 mm) using the core samples. |
Based on the flotation testwork findings, the Ni-Cu-Co flotation circuit flowsheet will incorporate a pre-aeration stage in a controlled alkaline environment to depress pyrrhotite ahead of the alkaline rougher and cleaner flotation circuits for the recovery of nickel, copper and cobalt sulfide minerals to the final concentrate. The cleaner flowsheet includes Jameson Cell dilution cleaning of the high-grade rougher concentrate in combination with regrind, cleaning and Jameson Cell dilution re-cleaning of the medium-grade rougher concentrate. A cleaner scavenger circuit will treat the cleaner tailings to ensure optimal nickel recovery.
To ensure optimal flotation performance, the mine production will be managed to maintain the proportion of UMAF_1a in the concentrator feed nominally below 20% UMAF_1a and limited to a maximum of 30%, with a design allowance for stockpiling and blending of the UMAF_1a material ahead of the Concentrator to ensure a consistent blend ratio of ≤ 20% UMAF_1a in the concentrator feed.
The potential for feed oxidation will also be mitigated by adopting a coarse blast fragmentation particle size distribution (PSD), limit the time between blasting and processing, limit the storage time of the crushed RoM material ahead of the milling circuit and the use covered concrete silos for crusher circuit product storage ahead of the mills.
Pyrrhotite Flotation Testwork
The testwork program also included pyrrhotite flotation testwork, which aimed to evaluate the potential for the recovery of pyrrhotite from the nickel-copper-cobalt flotation tailings. The testwork was conducted on nickel-copper-cobalt rougher tailings samples generated from the main Ni-Cu-Co flotation program.
Page
|
/ / Initial Assessment - Technical Report Summary |
|
The pyrrhotite rougher flotation variability tests achieved an iron stage recovery of 67% to 94%, averaging 83%. Testing on blend samples achieved a pyrrhotite rougher flotation stage recovery of 89% to 90% at an average concentrate iron grade of 60%, producing a non-pyrrhotite tails stream with an iron grade ranging from 16% to 20% and a sulfur grade of 3% to 5%. This was confirmed in the bulk flotation testwork, which produced a pyrrhotite tailings stream containing approximately 59% iron (theoretical ~62%) and a non-pyrrhotite rougher tailings stream with a sulfur content typically ranging from 5% to 10%.
Concentrate and Tailings Characterization Testwork
Concentrate regrind testwork, settling and filtration testwork, material handling characterization testwork, and tailings rheology testwork were also conducted, providing sufficient data to derive the required Concentrator design parameters and can be summarized as follows:
| ● | The regrind testwork highlighted the relatively soft nature of the sulfide rougher concentrate. |
| ● | The dewatering testwork was in good agreement with historical testing by equipment vendors, showing the concentrate and tailings to readily thicken to high density (> 65% solids (w/w)) and be amenable to pressure filtration, achieving a final concentrate moisture level of < 10% (w/w) with a design of 9%. |
| ● | Tailings rheology testwork showed that the rheology is not expected to cause pumping issues at the tailings disposal design solids concentration and that rheology only becomes significant at a solids concentration of > 65% w/w. |
| ● | Concentrate characterization testwork indicated a Transported Moisture Limit (TML) of 9.0–9.7%, an angle of repose of 41–46° and compacted bulk density of 2.2–2.4 t/m3. |
| 10.2.3 | Concentrator Metallurgical Performance Projection |
| 10.2.3.1 | Summary of Testwork Data Used |
Closed-circuit performance projections derived from the open-circuit bench and bulk flotation testwork data were used in combination with the locked-cycle test results and historical MPP test results to derive a metallurgical performance projection for the Kabanga Concentrator.
A summary of all the test data used for Concentrator metallurgical performance modeling is presented in Table 10-4.
Table 10-4: Summary of Test Data Used for Concentrator Recovery Modeling
Sample ID |
Test Type1 | Feed Blend Ratio | Feed (%) | Concentrate (%) | |||||||
| MSSX | MSXI | UMAF_1a | Diln. | Ni
Grade |
Mass Pull |
Ni Grade |
Ni Rec. |
Co Rec. |
Cu Rec. |
||
| V6 | OCP | 100 | – | – | – | 2.78 | 11.9 | 20.9 | 89.5 | 94.1 | 97.0 |
| V5 | OCP | 100 | – | – | – | 3.08 | 13.8 | 20.1 | 90.0 | 94.8 | 97.2 |
| V1 | OCP | 100 | – | – | – | 3.05 | 15.7 | 17.6 | 90.4 | 91.2 | 97.5 |
| V3 | OCP | 100 | – | – | – | 3.74 | 17.5 | 19.5 | 91.2 | 92.1 | 97.2 |
| V4 | OCP | 100 | – | – | – | 3.73 | 18.9 | 18.2 | 92.4 | 93.1 | 97.6 |
| V10 | LCT | 100 | – | – | – | 3.47 | 16.8 | 18.5 | 89.5 | 91.7 | 99.3 |
| TF2 | OCP | 89 | – | – | 11 | 1.46 | 10.7 | 11.0 | 80.1 | 87.7 | 92.0 |
| NF4 | OCP | 92 | – | – | 8 | 2.89 | 16.0 | 16.0 | 88.8 | 91.9 | 96.9 |
| Comp 3 | OCP | 81 | – | 3 | 16 | 2.66 | 13.3 | 17.5 | 87.3 | 87.4 | 97.6 |
| Comp 4 | LCT | 81 | – | 3 | 16 | 2.03 | 10.0 | 18.0 | 88.8 | 91.8 | 98.5 |
| TF1 | OCP | – | 93 | – | 7 | 1.70 | 10.1 | 14.0 | 83.6 | 87.7 | 97.1 |
Page
|
/ / Initial Assessment - Technical Report Summary |
|
Sample ID |
Test Type1 | Feed Blend Ratio | Feed (%) | Concentrate (%) | |||||||
| MSSX | MSXI | UMAF_1a | Diln. | Ni
Grade |
Mass Pull |
Ni Grade |
Ni Rec. |
Co Rec. |
Cu Rec. |
||
| NF1 | OCP | – | 84 | – | 16 | 2.08 | 11.3 | 15.4 | 84.2 | 90.1 | 93.3 |
| V7 | OCP | – | – | 100 | – | 0.66 | 3.2 | 11.2 | 55.1 | 57.7 | 82.5 |
| V8 | OCP | – | – | 100 | – | 1.45 | 7.4 | 14.7 | 75.0 | 78.7 | 83.2 |
| V9 | OCP | – | – | 100 | – | 1.36 | 7.2 | 14.1 | 74.6 | 76.1 | 83.8 |
| V13 | LCT | – | – | 100 | – | 1.18 | 6.4 | 13.1 | 71.3 | 73.8 | 80.5 |
| NF13 | OCP | – | – | 100 | – | 1.30 | 7.2 | 13.0 | 72.4 | 69.6 | 87.0 |
| NF14 | OCP | – | – | 91 | 9 | 0.91 | 4.8 | 11.7 | 62.1 | 61.4 | 85.3 |
| FC3 | OCP | – | – | 93 | 7 | 1.11 | 5.8 | 12.9 | 68.0 | 65.7 | 86.1 |
| TF7 | OCP | – | – | 89 | 11 | 1.40 | 9.2 | 11.5 | 75.2 | 76.7 | 78.6 |
| TF8 | OCP | – | – | 87 | 13 | 0.86 | 4.7 | 11.8 | 63.7 | 65.6 | 78.9 |
| NF12 | OCP | – | – | 89 | 11 | 1.56 | 8.4 | 13.6 | 73.1 | 72.5 | 87.9 |
| V14 | LCT | 57 | – | 32 | 11 | 1.75 | 9.8 | 15.0 | 84.4 | 88.2 | 94.4 |
| FC1 | OCP | 68 | – | 13 | 18 | 2.35 | 12.0 | 17.2 | 87.8 | 89.8 | 96.6 |
| FC2 | OCP | 37 | 20 | 34 | 10 | 1.62 | 9.6 | 13.0 | 76.7 | 81.3 | 92.3 |
| FC4 | OCP | 58 | 7 | 17 | 18 | 2.04 | 10.4 | 16.8 | 85.8 | 88.9 | 94.2 |
| V2 | OCP | 24 | 31 | – | 45 | 1.65 | 10.7 | 13.2 | 85.5 | 85.3 | 96.7 |
| TF5 | OCP | 52 | 26 | 12 | 10 | 1.83 | 11.3 | 13.7 | 84.8 | 88.9 | 96.6 |
| North Comp | MPP | 81 | – | 4 | 15 | 2.55 | 10.5 | 21.3 | 87.6 | – | 90.2 |
| Tembo Blend | MPP | 83 | – | 3 | 14 | 2.16 | 9.8 | 19.6 | 88.6 | – | 93.6 |
| LoM Blend | MPP | 83 | – | 5 | 12 | 2.41 | 11.0 | 19.6 | 89.3 | – | 91.6 |
| Year 1-4 Blend | MPP | 83 | – | 2 | 15 | 2.38 | 9.0 | 22.0 | 83.3 | – | 78.4 |
| LoM Comp 2 | MPP | 84 | – | 2 | 14 | 2.39 | 11.3 | 18.8 | 88.9 | – | 88.2 |
Note: OCP = open-circuit projection, LCT = locked-cycle test, MPP = mini pilot plant projection
| 10.2.3.2 | Nickel Recovery Model Development |
The testwork showed a strong relationship between the nickel feed grade, the concentrate mass pull, the concentrate nickel upgrade ratio (concentrate grade to feed grade) and recovery for all the samples. The nickel upgrade ratio (the percentage of nickel in the concentrate to the percentage of nickel in the feed) decreased with an increase in feed grade, while the concentrate mass pull increased as the upgrade ratio decreased.
Correlations were developed to describe the relationship between mass pull, upgrade ratio and nickel recovery. The combination of these mass pull, grade and recovery correlations result in a nickel recovery projection as a function of the nickel feed grade and concentrate upgrade ratio for the respective MSSX and UMAF_1a feed types as shown in Figure 10-5 and Figure 10-6 respectively.
Page
|
/ / Initial Assessment - Technical Report Summary |
|
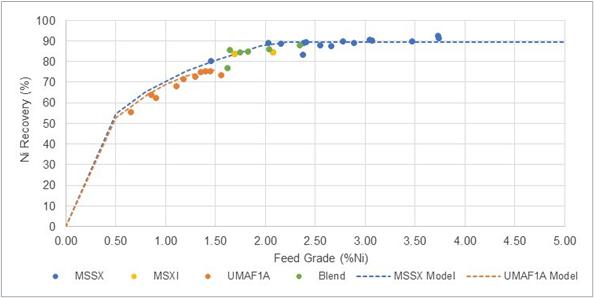
Figure 10-5: Nickel Recovery as a Function of Feed Grade: Modeling Output versus Testwork Performance
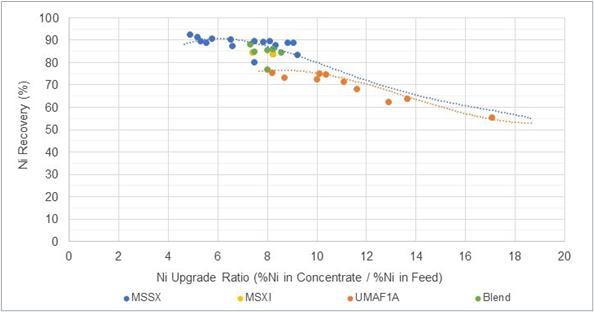
Figure 10-6: Nickel Recovery as a Function of Concentrate Upgrade Ratio: Modeling Output versus Testwork Performance
| 10.2.3.3 | Copper and Cobalt Recovery Model Development |
The flotation testwork showed a strong relationship between cobalt recovery and nickel recovery, as shown in Figure 10-7. This is aligned with the expectations based on the mineralogy, which showed the cobalt in the concentrate to be deported within the pentlandite.
Page
|
/ / Initial Assessment - Technical Report Summary |
|
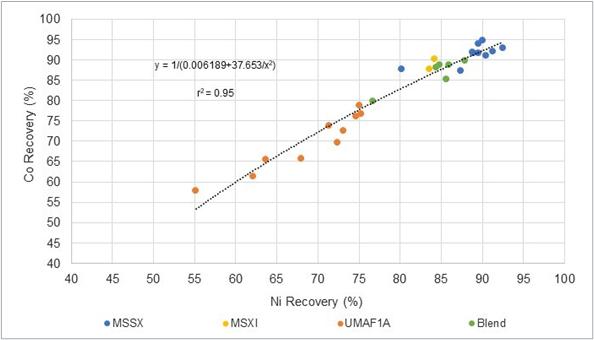
Figure 10-7: Cobalt Flotation Recovery as a Function of Nickel Recovery
The copper recovery was dependent on the copper feed grade, as shown in Figure 10-8.
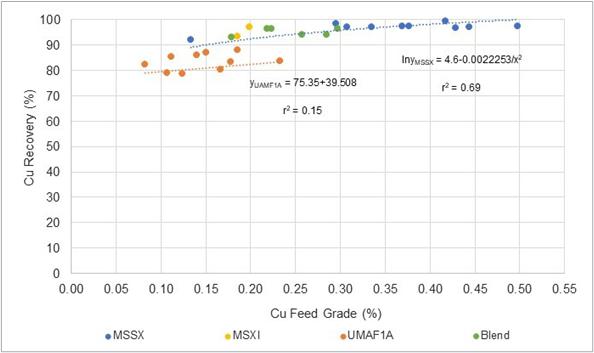
Figure 10-8: Copper Flotation Recovery as a Function of Copper Feed Grade The nickel grade and recovery modeling outcomes highlighted a difference in nickel recovery and concentrate grade performance between the MSSX and UMAF_1a material.
Page
|
/ / Initial Assessment - Technical Report Summary |
|
| 10.2.3.4 | Blend Processing |
The MSXI results were aligned with the MSSX performance curves, while the blend sample results were dependent on the proportion of UMAF_1a in the feed.
Further analysis was undertaken to confirm the accuracy of the blend performance projections of the weighted mathematical average math blend when applying the respective MSSX and UMAF_1a correlations to the individual end members in the composite. This evaluation showed good agreement between the actual blend results and the modeled math blend using the respective MSSX and UMAF_1a recovery and grade modeling correlations for blends containing up to 20% UMAF_1a, but with the potential for a reduced concentrate grade and recovery for blends containing approximately 35% to 40% UMAF_1a. This finding is aligned with the historical XPS flotation testwork findings, which indicated that blend processing achieved a result aligned with the expected math blend for a blend containing 10% UMAF_1a; however, a reduced performance was achieved for a blend containing 30% UMAF_1a.
To ensure optimal flotation performance, the mine production will be managed to maintain the proportion of UMAF_1a in the concentrator feed nominally below 20% UMAF_1a and limited to a maximum of 30%.
| 10.2.3.5 | Mill Scats |
The comminution circuit modeling indicated an increase in scats production for the harder, lower-grade feed material (UMAF_1a and waste dilution) compared to the higher-grade MSSX material, which is comparatively less competent. The Concentrator recovery modeling thus incorporates provision for the production of mill scats aligned with the comminution circuit design and modeling outcomes.
| 10.2.3.6 | Pyrrhotite Concentrate Grade and Recovery |
The Concentrator flowsheet includes a pyrrhotite rougher flotation circuit, which will aim to recover and upgrade pyrrhotite to the concentrate stream. The separation of pyrrhotite allows it to be stored separately from the non-pyrrhotite tailings, which will be used for mine pastefill. It also allows for the pyrrhotite to be potentially repurposed in the future.
The pyrrhotite flotation testwork results were used to derive pyrrhotite rougher flotation concentrate iron grade and mass pull correlations for the MSSX and UMAF_1a samples as shown in Figure 10-9 and Figure 10-10.
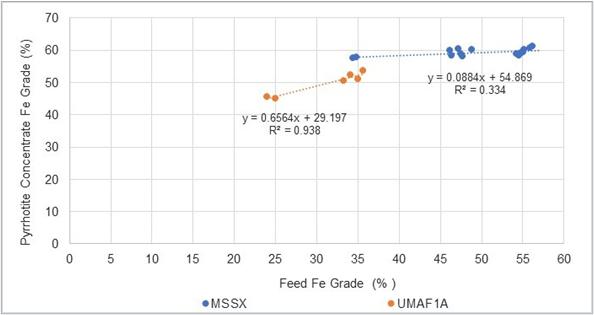
Figure 10-9: Pyrrhotite Concentrate Iron Grade as a Function of Iron in Feed Figure 10-10: Pyrrhotite Concentrate Mass Pull as a Function of Iron in Feed
Page
|
/ / Initial Assessment - Technical Report Summary |
|
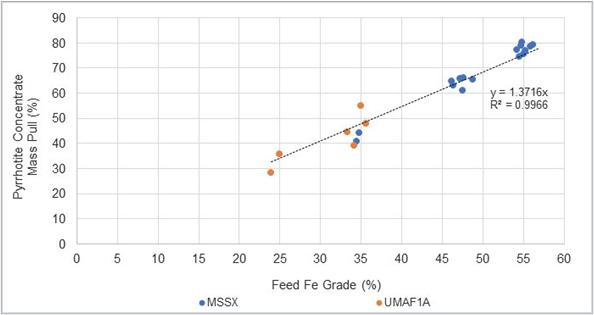
| 10.2.3.7 | Summary of Recovery Algorithms |
The recovery and grade algorithms for MSSX and UAMF_1A based on the mill feed grade profile, including simplified modeling parameters to account for the mill scats, are summarized in Table 10-5 and Table 10-6 respectively.
Table 10-5: MSSX Recovery Algorithms Based on Mill Feed
Parameter |
Unit |
MSSX Algorithm Based on Mill Feed |
Cap | Feed Grade Range |
| Nickel-Copper-Cobalt Concentrate | ||||
| Concentrate Mass Pull1 | % |
−1.67933 + 117.056(12.31Ni Grade in Mill Feed−0.603)−1.093
× |
– | – |
| Nickel Recovery1 | % | −1.77 + 36.658(Mass Pull)0.3864 |
89.3 | > 0.2 |
| Copper Recovery | % | 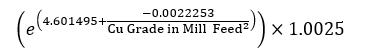 |
98.5 | > 0.027 |
| Cobalt Recovery | % | 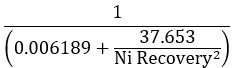 |
– | > 0.017 |
| Magnesium Recovery1 | % | −1.722 × ln(Mg Grade in Mill Feed) + 5.1791 |
– | 0 to 10 |
| Iron Grade | % | 116.35 × Ni Grade in Concentrate−0.384 |
42 | - |
| Sulfur Grade | % | 0.391 × (Ni + Cu + Co + Fe)Grade in Concentrate + 8.527 |
32 | – |
| Pyrrhotite Concentrate | ||||
| Mass Pull | % | 1.3716 × (Fe Grade in Mill Feed) |
– | < 60 |
| Iron Grade | % |
Fe in Feed > 15%: 0.0884 × (Fe Grade in Mill Feed) + 54.869 Fe in Feed > 15%: 50 |
– | < 60 |
1ln = natural logarithm
Page
|
/ / Initial Assessment - Technical Report Summary |
|
Table 10-6: UMAF_1a Recovery Algorithms Based on Mill Feed
Parameter |
Unit |
UMAF_1a Algorithm Based on Mill Feed |
Cap | Feed Grade Range |
| Nickel-Copper-Cobalt Concentrate | ||||
| Concentrate Mass Pull1 | % |
−1.67933 + 117.056(12.31 × Ni Grade in Mill Feed−0.603)−1.093
× |
– | – |
| Nickel Recovery1 | % | −3.77 + 36.658 × (Mass Pull)0.3864 × |
76.1 | > 0.2 |
| Copper Recovery | % | (75.35 + 39.50827 × Cu Grade in Mill Feed) × 0.991 |
82.6 | > 0.027 |
| Cobalt Recovery | % | 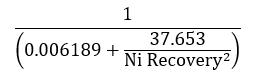 |
– | > 0.017 |
| Magnesium Recovery1 | % | −1.722 × ln(Mg Grade in Mill Feed) + 5.1791 |
– | 0 to 10 |
| Iron Grade | % | 446.14 × Ni Grade in Concentrate−0.9 |
42 | – |
| Sulfur Grade | % | 0.391 × (Ni + Cu + Co + Fe)Grade in Concentrate + 8.527 |
32 | – |
| Pyrrhotite Concentrate | ||||
| Mass Pull | % | 1.3716 × (Fe Grade in Mill Feed) |
– | < 60 |
| Iron Grade | % | 0.6564 × (Fe Grade in Mill Feed) + 29.197 |
– | < 60 |
1ln = natural logarithm
| 10.2.3.8 | Concentrator Performance Estimate |
The Concentrator metallurgical performance projection was derived based on the IA MII mine plan in combination with the recovery algorithms as presented in Table 10-5 and Table 10-6. The resulting weighted average mass balance for the Concentrator aligned to the IA mine production schedule is summarized in Table 10-7.
Table 10-7: MII Plan Concentrator Summary Mass Balance
Description |
Mass | Grade (%) | Recovery (%) | |||||||||
| Mt | % | Ni | Co | Cu | Fe | S | Ni | Co | Cu | Fe | S | |
| Concentrator Balance: | ||||||||||||
| RoM Feed | 67.9 | 100 | 1.93 | 0.14 | 0.26 | 34.8 | 23.8 | 100 | 100 | 100 | 100 | 100 |
| Mill Scats | 4.5 | 6.6 | 0.10 | 0.01 | 0.01 | 11.2 | 2.1 | 0.35 | 0.34 | 0.22 | 2.1 | 0.59 |
| Ni-Cu-Co Concentrate | 6.6 | 9.7 | 17.3 | 1.32 | 2.58 | 38.9 | 32.1 | 87.3 | 89.6 | 95.7 | 10.9 | 13.1 |
| Pyrrhotite Tailings | 32.5 | 47.8 | 0.41 | 0.02 | 0.02 | 56.4 | 30.3 | 10.3 | 8.2 | 3.1 | 78.9 | 61.0 |
| Non-Pyrrhotite Tailings | 24.4 | 36.0 | 0.11 | 0.01 | 0.01 | 7.88 | 16.7 | 2.00 | 1.80 | 1.00 | 8.1 | 25.3 |
The scheduled Concentrator throughput and nickel concentrate production profile over the proposed LoM are summarized in Figure 10-11. The concentrate tonnage and contained nickel profile is presented in Figure 10-12.
Page
|
/ / Initial Assessment - Technical Report Summary |
|
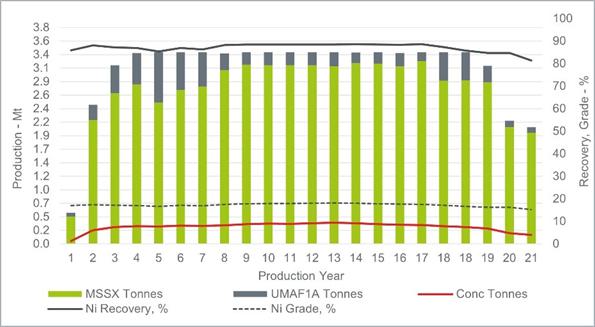
Figure 10-11: Concentrator Production Profile (MII Plan)
These recovery and concentrate tonnage and grade profiles were based on the concentrator feed type and feed grade profiles in the IA mine schedule and include provision for ramp-up, commissioning and optimization. They reflect the steady-state performance and do not consider any transient operations.
The Concentrator will produce approximately 337 ktpa of nickel-copper-cobalt flotation concentrate, containing 17.3% nickel, at the full steady-state 3.4 Mtpa production rate. The nickel recovery is expected to average 87.3% over the proposed LoM, while the copper and cobalt recoveries are expected to average 95.7% and 89.6%, respectively. The concentrate is expected to contain approximately 2.6% copper, 1.3% cobalt, 32% sulfur, and less than 1% magnesium on average.
The IA mine plan includes material from the Main, MNB, and Kima zones in the later years of operation from Year 15 onwards. This material constitutes under 10% of the proposed LoM Concentrator feed but has not been tested as part of the current IA. The historical testwork included only preliminary mineralogical and flotation assessments on Main material during the early scoping study, which indicated that, after optimization, the metallurgical response of the Main zone could potentially be similar to that of the North and Tembo massive sulfides. It has thus been assumed that the North and Tembo MSSX and UMAF_1a recovery assumptions can be applied to the Main, MNB, and Kima material. Future testwork is required to validate this assumption.
Page
|
/ / Initial Assessment - Technical Report Summary |
|
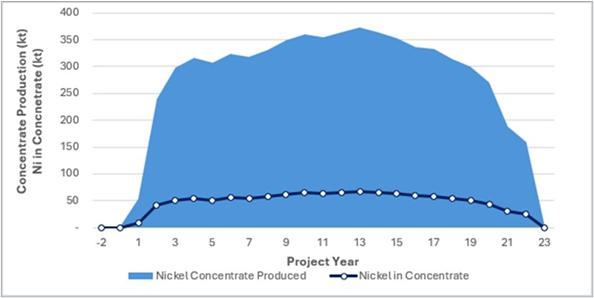
Figure 10-12: Concentrate Tonnage and Contained Nickel Profile (MII Plan)
| 10.2.4 | QP Opinion – Concentrator |
The concentrator testwork has again demonstrated that a relatively simple, conventional crushing, grinding and flotation flowsheet, using a typical flotation reagent regime, could be used for the effective separation of pentlandite and chalcopyrite from the pyrrhotite and non-sulfide gangue.
It is the opinion of DRA, responsible and acting as the QP for the Kabanga Concentrator, that the mineral processing and metallurgical testing undertaken in support of the Concentrator design is at a level that meets and exceeds that required for an IA and represents good industry practice.
| 10.3 | Refinery |
| 10.3.1 | Historical Flowsheet Assessments and Metallurgical Testwork |
The technical assessment and development of LZM’s hydrometallurgical technology, specifically its application to the processing of the Kabanga concentrates, began in 2020. This work commenced with the review of potential treatment options and product types, with a particular focus on refining the concentrates in-country, i.e. Tanzania. Based on these findings, testwork on key process units was undertaken at both bench and MPP scale on representative concentrate generated from Kabanga samples as part of the current concentrator testwork program.
In February 2020, an initial desktop economic assessment of the nickel sulfide concentrate treatment options was undertaken. The primary outcome of the assessment was that the choice of leach conditions was a trade-off between competing benefits, specifically:
| ● | Fully oxidizing the concentrate achieves the highest metal extraction and overall recovery and avoids the need for chloride addition to leaching. It also reduces dependence on grind size and produces a leach tail without acid-forming potential, i.e. from residual sulfides. |
| ● | Partial-oxidizing at a lower temperature but still under pressure and assisted with chloride addition (TECK CESL Process style) is also expected to achieve a high extraction and recovery and offers the benefit of a lower capital cost and lower operating cost due to the reduced oxygen requirement; however, there is increased complexity and a narrower operating window with increased metal extraction risk. The risk of molten sulfur forming accretions in the autoclave also needs to be considered, along with the potential for lower iron re-precipitation and chloride-associated materials of construction and final product impurity management. |
| ● | Lower temperature leach options (AlbionTM, Activox®) have merit in a reduced capital cost but rely on ultrafine grinding and also have increased metal extraction risk. The additional risk of molten sulfur forming accretions in the autoclave also needs to be considered, as well as lower iron re-precipitation. |
Page
|
/ / Initial Assessment - Technical Report Summary |
|
The fully oxidizing POX route is considered the most robust process option and was selected as the basis on which to develop the refinery flowsheet.
Following on from this, comparative studies for several POX downstream processing options were completed for various intermediate and final nickel and cobalt product combinations, including:
| ● | Mixed sulfide precipitate (MSP) intermediate: |
| ‒ | 1a. POX – MSP – nickel sulfate and cobalt sulfate (SO4) |
| ‒ | 1b. POX – MSP - precursor cathode active material (pCAM) |
| ‒ | 1c. POX – MSP - metal cathode |
| ● | Mixed hydroxide precipitate (MHP) intermediate: |
| ‒ | 2a. POX – MHP - SO4 |
| ‒ | 2b. POX – MHP - pCAM |
| ‒ | 2c. POX – MHP - metal cathode |
| ● | Direct solvent extraction (DSX): |
| ‒ | 3a. POX – DSX - SO4 |
| ‒ | 3b. POX – DSX - pCAM |
| ‒ | 3c. POX – DSX - cathode |
The work was subsequently expanded to include the assessment of the following key project value drivers of the different products:
| ● | Impact of freight costs of plant location (concentrate and final products) |
| ● | Impact of split plant locations |
| ● | Impact of various limestone supply locations |
Testwork was undertaken investigating the processing options available. Following on from the assessment of this information and broader market considerations, and potential customers’ preferred product types, the Project has selected a high-grade nickel sulfate and cobalt sulfate product flowsheet with copper (metal) cathode also generated.
| 10.3.2 | Refinery Testwork Concentrate Samples |
Refinery testwork was conducted using samples of concentrate generated from the concentrator testwork program. The concentrates were prepared by compositing flotation test products and were kept in cold storage to minimize oxidation of samples prior to testing. Notably, a concentrate sample was also deliberately exposed to oxidizing conditions (moist atmosphere at ~50 °C for eight weeks) prior to leaching as part of a concentrate oxidation assessment.
The concentrates tested were derived from samples containing varying amounts of MSSX, UMAF_1a, and waste dilution lithologies as per the compositions shown in Table 10-8. The sulfur speciation assays show varying degrees of oxidation. Concentrate PSD analyses indicated a typical particle size of 80% passing (P80) approximately 35 µm. The mineralogy of the concentrate indicates the dominant minerals in the MSSX being pentlandite, chalcopyrite and pyrrhotite.
Page
|
/ / Initial Assessment - Technical Report Summary |
|
Table 10-8: Concentrate Samples – Feed Blends
Lithology |
Unit | Tembo
Comp 1 |
North Shallow Comp 2 |
North
Deep Comp 3 |
Early
Years Blend* Comp 4 |
Tembo UMAF_1a Comp V13 |
North
and Tembo Mine Blend FC4 |
| MSSX | % | 75 | 84 | 81 | 81 | 0 | 65 |
| UMAF_1a | % | 8 | 0 | 3 | 3 | 100 | 17 |
| Waste dilution | % | 16 | 16 | 16 | 16 | 0 | 18 |
| TOTAL | % | 100 | 100 | 100 | 100 | 100 | 100 |
Note: *Early Years Blend = 2 parts North Shallow Comp 2 to 1 part Tembo Comp 1
| 10.3.3 | Refinery Phase 1 Testwork |
Two phases of refinery bench testwork have been undertaken for the Kabanga Nickel Project by LZM and its Simulus Laboratory, a specialist in hydrometallurgical testing. Key stages of the Phase 1 program, conducted between January and August 2023, included:
| ● | Pressure oxidation |
| ● | Primary neutralization |
| ● | Copper solvent extraction (CuSX) |
| ● | Secondary neutralization |
| ● | Different solvent extraction options, including DSX and Cobalt Solvent Extraction (CoSX) |
| ● | Intermediate product precipitation (MHP) |
The emphasis of this work was to support the proposed flowsheet options, and specifically maximize POX leach extractions, optimize neutralization using locally sourced limestone, and ensure efficacious solvent extraction for impurity removal, and the production of high-grade metal products. The Phase 1 Refinery testwork program provided a strong basis for the development and optimization of the flowsheet. The key outcomes of the program were:
| ● | Consistent and very high base metal extractions in pressure oxidation, |
| ● | Consistent and very low base metal precipitation in the neutralization circuits, |
| ● | High copper recovery in CuSX, |
| ● | High base metal recovery in the MHP. This intermediate product stage was subsequently removed from the flowsheet as it was demonstrated that it was not required for rejection of impurities or needed for the production of a transportable or saleable intermediate product. |
The Phase 1 results were reviewed as part of the continuous optimization of the Project, resulting in an adjustment to the proposed flowsheet and associated testwork. One key aspect of the review was the solution purity and the impact of commercial-grade reagents on the MHP grades.
| 10.3.4 | Refinery Phase 2 Testwork |
The Phase 2 testwork program was undertaken, from August 2023 through June 2024, to confirm the benefits identified in the Phase 1 review. A significant outcome of the work was to confirm and demonstrate very high, rapid and robust POX extractions across a range of concentrate blends, and impurity deportment and the potential impact on the flowsheet. The key tests completed comprised the following:
| ● | Pressure oxidation (open circuit and locked-cycle in batch mode in 2 L and 15 L autoclaves) |
| ● | Primary neutralization |
Page
|
/ / Initial Assessment - Technical Report Summary |
|
| ● | Locked-cycle pressure oxidation and primary neutralization |
| ● | Copper solvent extraction |
| ● | Secondary neutralization (Stages 1 and 2) |
| ● | Cobalt solvent extraction |
| ● | Calcium solvent extraction |
| ● | Impurity solvent extraction |
| ● | Anolyte neutralization (Stages 1 and 2) |
| ● | Bleed crystallization characterization |
| ● | Local limestone characterization |
The Phase 2 metallurgical testwork was again conducted on representative samples of the concentrate derived from the Kabanga drill samples, to support the process design for the proposed hydrometallurgical flowsheet at that time producing high-purity metal cathode products. The POX testing (over 50 tests) demonstrated high leach extractions of nickel (98%), cobalt (99%), and copper (98%) across a range of operating conditions with 60 minutes residence time, and marginally higher extractions at the proposed 90 minutes residence time now incorporated into the design. The PLS produced was low in impurities, making it well suited to the selected CoSX and EW or sulfate product flowsheets. A high recovery of copper (> 98%) in solvent extraction was demonstrated, in line with the vendor performance projections. An example POX Kinetics test on a representative concentrate sample is presented in Figure 10-13. The low iron extraction is desirable.
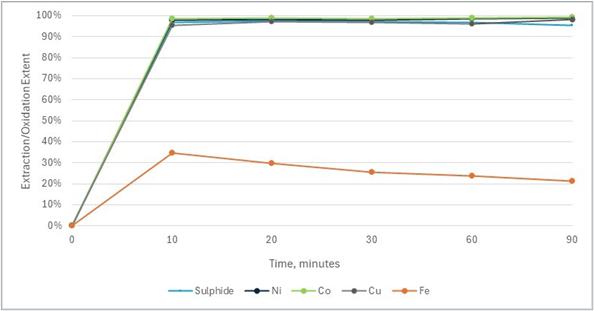
Figure 10-13: POX Kinetics (Test No. KABA-0145)
The most significant impurities in the concentrate (iron and aluminum) were selectively removed in the precipitation stages with low losses of value metals (< 1% nickel, cobalt, and copper). The testing indicated that impurities including calcium and sodium introduced by reagents used in the process can be effectively managed by rejection in the CoSX and associated impurity removal circuits while achieving high recoveries of nickel and cobalt (> 99% expected based on testwork-informed process modeling).
| 10.3.5 | Refinery Piloting Testwork (2024) |
Piloting of a preliminary flowsheet was conducted on a semi-continuous basis due to the limited concentrate sample mass available. The full pilot plant program was operated in two campaigns between May and August 2024. The final proposed products have since changed from nickel and cobalt metal cathodes and rounds respectively, to nickel and cobalt sulfates. The copper product is metal cathode in both cases. The veracity of the piloting data can be utilized in the revised back end of the refinery flowsheet.
Page
|
/ / Initial Assessment - Technical Report Summary |
|
The results of the piloting support the design metal recoveries and losses for the various plant circuits. The test results for the pilot plant samples agree well with both the prior tests on the pilot plant concentrate sample and the larger program of POX bench-scale testwork on the Kabanga concentrate samples across the larger data set (Table 10-9). Overall, the pilot plant campaign successfully demonstrated that the proposed refinery hydrometallurgical flowsheet is robust, can be quickly ramped up, and encountered few technical issues, all of which were quickly and readily resolved.
Table 10-9: Summary of POX Extractions – Pilot Plant versus Bench-Scale Testwork
Program |
Data Set | Extraction (%) | |||||
| Co | Cu | Ni | Fe | Mg | |||
| Pilot plant | All POX | Average 29 tests | 99.1 | 98.2 | 97.9 | 3.0 | 59.5 |
| Pilot plant | POX 60 min | Average 12 tests | 99.2 | 98.4 | 97.7 | 3.3 | 55.8 |
| Bench testwork | All POX 60 min | Average 27 tests | 98.6 | 97.9 | 97.7 | 7.9 | 44.5 |
| Bench testwork | Blend variability 60 min | Average 5 tests | 99.4 | 99.7 | 98.3 | 4.7 | 46.9 |
| Bench testwork | All POX 90 min | Average 23 tests | 98.9 | 97.8 | 98.3 | 6.8 | 47.5 |
| Pilot plant | All POX | Standard deviation | 0.3 | 0.6 | 0.6 | 3.0 | 8.4 |
| Pilot plant | POX 60 min | Standard deviation | 0.3 | 0.7 | 0.6 | 3.0 | 7.9 |
| Bench testwork | All POX 60 min | Standard deviation | 1.6 | 2.1 | 1.4 | 6.7 | 10.5 |
| Bench testwork | Blend variability 60 min | Standard deviation | 0.2 | 0.2 | 0.8 | 1.3 | 3.7 |
| Bench testwork | All POX 90 min | Standard Deviation | 0.6 | 1.2 | 5.5 | 0.8 | 13.3 |
| 10.3.6 | Refinery Ongoing Testwork |
Additional testwork at bench-scale is being undertaken to evaluate opportunities for optimization. The key areas of focus include POX testing to support the two-stage leaching design and solvent extraction impurity removal tests.
| 10.3.7 | Refinery Testwork Conclusions |
Overall, the refinery testwork program:
| ● | Supports the Refinery flowsheet design |
| ● | Demonstrates the concentrate is suited to base metal recovery via pressure oxidation, with consistent and very high base metal extractions across a wide range of operating conditions and concentrate blends. This provides a wide operating window for the treatment of the Kabanga concentrate. |
| ● | The testing of individual concentrates (MSSX and UMAF), along with blends progressing from MSSX-rich blends to UMAF-rich blends, consistently providing a very high metal extraction in pressure oxidation irrespective of concentrate blend and extractions were not deleteriously affected by oxidation of the concentrate. |
| ● | The locally sourced limestone used for neutralization performed well and is suitable for use in the Refinery. |
| ● | Impurity rejection from the Kabanga concentrate leach solution can be achieved with conventional solvent extraction circuits and reagents. |
| ● | The pilot plant campaign, despite a subsequent change to the final products, supports the refinery flowsheet design while also demonstrating a number of further opportunities for optimization. |
Page
|
/ / Initial Assessment - Technical Report Summary |
|
| ● | The pilot plant campaign demonstrated that LME nickel, copper and cobalt metal grades, e.g. above 99.8% for nickel and cobalt, with very low levels of deleterious elements, can be produced using the proposed refinery flowsheet, with similar findings expected for the production of high battery grade sulfates based on the clean solution chemistries from testwork, process modeling and laboratory experience generating sulfate products from similar feed types. |
| 10.3.8 | Refinery Metallurgical Performance |
This pressure leaching, neutralization and solvent extraction testwork, combined with Simulus’ existing hydrometallurgical knowledge, testwork and design on similar projects, and fundamental chemistry, including for nickel and cobalt sulfate products, has been used to inform the Refinery design for the IA. The POX and overall extractions based on metallurgical testing and piloting data with a 90-minute POX residence time, third party/vendor solid residue wash recoveries, mass and energy modeling, and an additional allowance for minor miscellaneous losses provide the following overall plant recoveries presented in Table 10-10. These metal recoveries have been used in the IA economic model.
Table 10-10: Projected Refinery Recoveries
Metal Deportment |
Unit | Metal Recoveries (%) | ||
| Ni | Cu | Co | ||
| Overall Refinery Recovery | % | 97.2% | 93.0% | 97.7% |
| 10.3.9 | QP Opinion – Refinery |
The hydrometallurgical testwork has demonstrated the amenability of the proposed refinery flowsheet for the treatment of the Kabanga nickel concentrates, supports the proposed refinery process units, provided inputs for design purposes and has demonstrated that nickel, copper and cobalt refined products, can be produced using the proposed refinery flowsheet.
It is the opinion of DRA, acting as the QP for the Kahama Refinery, that the mineral processing and metallurgical testing undertaken in support of the Refinery design is at a level that meets and exceeds that required for an IA and represents good industry practice.
Page
|
/ / Initial Assessment - Technical Report Summary |
|
The December 2024 Mineral Resource estimates for the Project are based on industry best practices, conform to the requirements of S-K 1300, and are suitable for reporting as current estimates of Mineral Resources. The Mineral Resource estimates discussed in this section are those prepared for the Project by the QP in December 2024.
| 11.1 | Mineral Resource Modeling |
Mineral Resources for the Project have been estimated using industry best practices and conform to the requirements of S-K 1300 for reporting as Mineral Resource estimates.
The 2024 Mineral Resource estimate was completed by OreWin using Datamine software, with macros developed to estimate the full suite of component elements and density for each zone. All zones were estimated using the ordinary kriging method, with domain specific search and estimation parameters determined by variography and statistical analyses.
The estimate was completed on a truncated UTM grid (MG09 grid), with the following conversions:
| ● | Subtract 200,000 from the easting |
| ● | Subtract 9,600,000 from the northing |
| ● | Add 10,000 to the elevation |
Model cell size of 5 m x 15 m x 10 m (X x Y x Z), with sub-celling permitted, is the same as in previous models. The analysis used to determine the cell sizes was reviewed and is still considered valid.
| 11.2 | 2024 Mineral Resource Drillhole Database |
The cut-off date for geological and analytical data for the 2024 Mineral Resource estimates was June 4, 2024.
Holes that had been drilled up to this date, but for which there remained outstanding assays or downhole survey information, were excluded. Prior to importing and desurveying drillhole data, the raw data was checked for any notable inconsistencies or errors.
Once imported into Datamine, drillholes were viewed in conjunction with surface topography to visually inspect and validate collar locations, hole traces, lithology, and mineralization.
| 11.3 | Mineral Resource Domain Interpretations |
Three distinct units were interpreted for the Main, MNB, Kima, North, and Tembo zones; the massive sulfide (domain field MSSX), the ultramafic (domain field UMAF), and an intrusive (domain field INTRUSIV/INTR) unit, which was allowed to encompass any intrusive lithology. Within these three units, additional mineralization domains were created based on spatial continuity, intersecting geological structures, and geochemical variability.
Solid wireframes were constructed for the intrusive bodies at each zone, which predominantly represented the logged UMAF_KAB lithology but also served as an ‘umbrella’ categorization for any intervals logged as MAF, GAB_KAB, UMAF_1a, MSSX, and MSXI. The stratigraphic contacts between the Banded Pelite (BNPU) and the Lower Pelite (LRPU) were also used to interpret folding structures and unconformities to help orient the sulfide mineralization interpretations.
Mineralization was interpreted interactively on-screen using strings that were ‘snapped’ (attached) to drillhole intersections on 5–10 m spaced cross-sections that were aligned perpendicular to the strike of mineralization. Owing to the gradual change in strike from south to north (Main strikes approximately 005° while Tembo strikes approximately 045°), the cross-section plane was not always exactly parallel to the adjacent cross-section.
The mineralization modeling targeted massive sulfides (MSSX) or massive sulfides with xenoliths (MSXI) in combination for each zone. Lower grade mineralization (disseminated sulfides) in the adjacent ultramafic rocks was interpreted separately for the semi-massive nickel mineralization hosted in the UMAF_1a unit for each zone (UMAF).
Page
|
/ / Initial Assessment - Technical Report Summary |
|
No nominal grade cut-off was used in the interpretation phase. Interpretations were initially based on logged lithology. These were later refined to attempt to exclude any drillhole intervals with disparate nickel tenor or absent assays. MSSX interpretations were at times permitted to capture logged BNPU or LRPU intervals of notable nickel grade (>0.6%) where these were in direct contact with MSSX or MSXI. For the ultramafic-hosted mineralization, intervals logged as any intrusive lithology with greater than 0.6% Ni were also considered for inclusion within the mineralization boundary.
At the peripheries of the drillhole dataset, end plate interpretation strings were created by projecting the last cross-section interpretation string past the extent of the drilling to distances of half the nominal drillhole spacing in the local area, with consideration for the vertical behavior of the mineralized zone by locating the end plate up-dip or down-dip (as appropriate) from the last drilled cross section.
Estimation was completed separately for each of the mineralized domains at each of the zones, and these zone models were then combined into one model representing the mineralization of the entire Project. Because of the vertical undulation evident along strike in the Tembo mineralization, this domain was split into four domains to isolate southwesterly plunging and northeasterly plunging sub-zones (identified from southwest to northeast as Tembo South (TS), Tembo Central South (TCS), Tembo Central North (TCN), and Tembo North (TN) (see Figure 11-1)). Samples in each of these sub-zones were kept separate from the other sub-zones during all the resource estimation work.
The basal contact of the oxidized weathering zone was interpreted from the drillhole data and used to trim the top of the mineralized domains at Main zone and the southern end of North zone. Almost the entirety (98%) of the mineralization at Tembo is below the level of oxidation. Figure 11-1 is a 3D schematic long-section of the modeled mineralized zones.
A multivariate statistical analysis was completed for all domains within each zone. Some individual domains were combined where they were found to be statistically similar and could be plausibly related in a geological and spatial sense.

Note: Topography and oxidation wireframes are sliced on the long-section plane, whereas the drillholes and model are projected onto the plane (hence some drillholes appear to collar above topography)
Figure 11-1: Schematic Projected Long-Section of the Kabanga Mineralized Zones (looking northwest)
Page
|
/ / Initial Assessment - Technical Report Summary |
|
| 11.3.1 | Grade and Lithology |
The primary mineralized lithologies encountered at Kabanga are:
| ● | Massive sulfide (MSSX) and a massive sulfide with xenoliths (MSXI). |
| ● | Ultramafics that contain two types of disseminated sulfides: UMAF_1a and UMAF_KAB. |
| ● | Pelites: sedimentary country rock at the contact with the massive sulfides or ultramafics. There are two types of pelite: the Banded Pelite (BNPU), and the Lower Pelite (LRPU). |
Other lithologies, (gabbro, quartzite, etc.), for which samples have been assayed, are not significant in terms of mineralization tenor and frequency.
The Ni% box plot in Figure 11-2 shows all the represented lithologies across the Project.
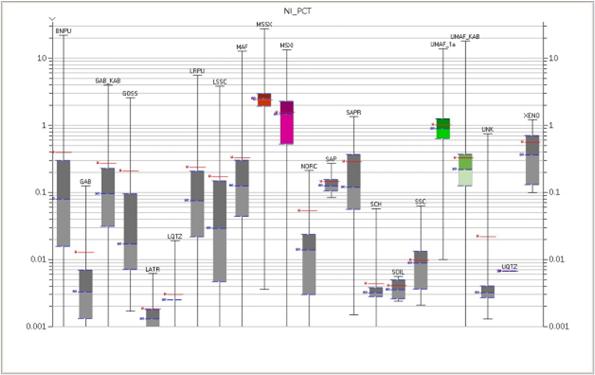
Figure 11-2: Ni Box Plot for all Assayed Lithologies – All Zones
Subsequent discussion in this section will generally focus on the specifics of the North and Tembo zones, which collectively provide the most significant contribution to the overall Mineral Resource inventory.
Page
|
/ / Initial Assessment - Technical Report Summary |
|
| 11.3.1.1 | North Zone |
The pie chart in Figure 11-3 shows that the main lithology of interest, in terms of number of assayed samples, is MSSX.
The grade characteristics of the mineralization types at North are shown in the box plots in Figure 11-4.

Figure 11-3: Pie Chart of Assayed Lithologies – North Zone Figure 11-4: Box Plots for a Suite of Elements for the Three Predominant Mineralization Types – North Zone
Page
|
/ / Initial Assessment - Technical Report Summary |
|
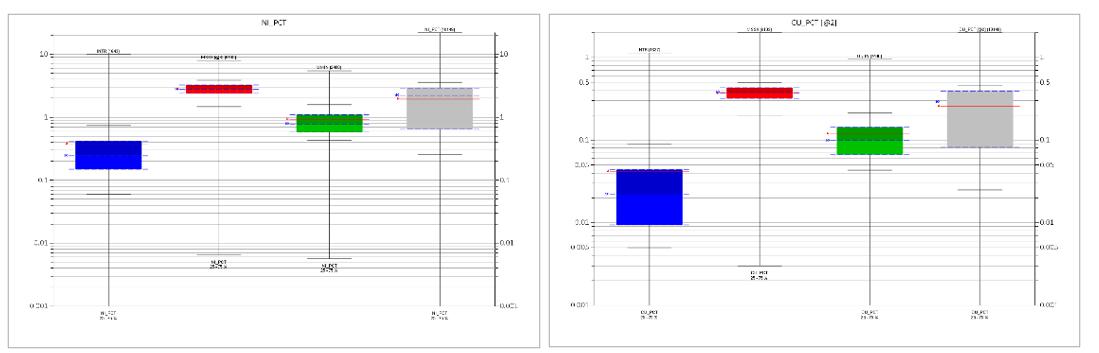
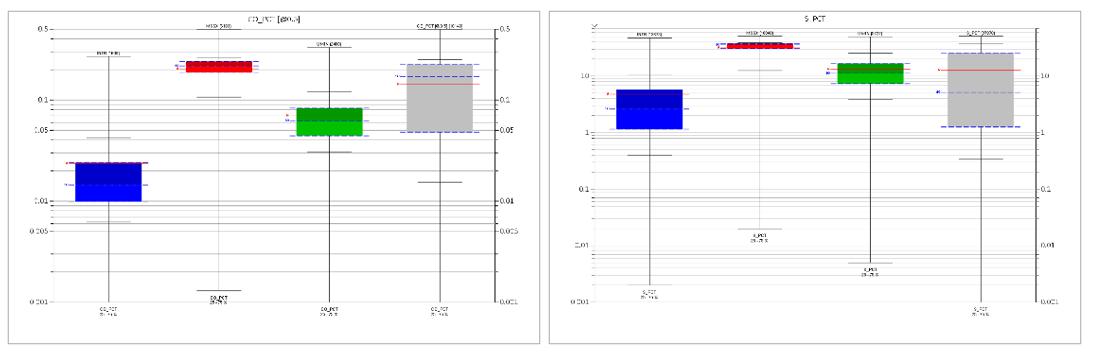
Page
|
/ / Initial Assessment - Technical Report Summary |
|
| 11.3.1.2 | Tembo Zone |
For Tembo, a pie chart and box plots are shown in Figure 11-5 and Figure 11-6 respectively. Again, the main lithology of interest, in terms of number of assayed samples, is MSSX.
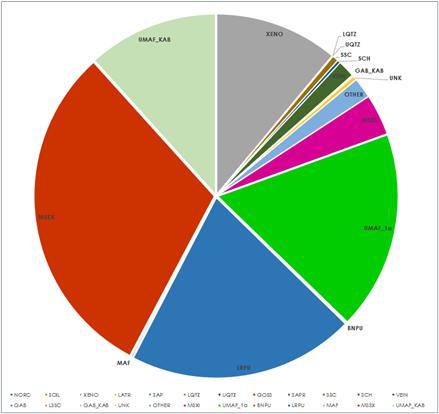
Figure 11-5: Pie Chart of Assayed Lithologies – Tembo Zone
The box and whisker plots in Figure 11-7 and Figure 11-8 summarize the grades for the main elements of interest in the combined MSSX and UMAF mineralization types for North and Tembo respectively. A comparison of these plots shows clearly that North has higher tenor mineralization than Tembo.
Page
|
/ / Initial Assessment - Technical Report Summary |
|
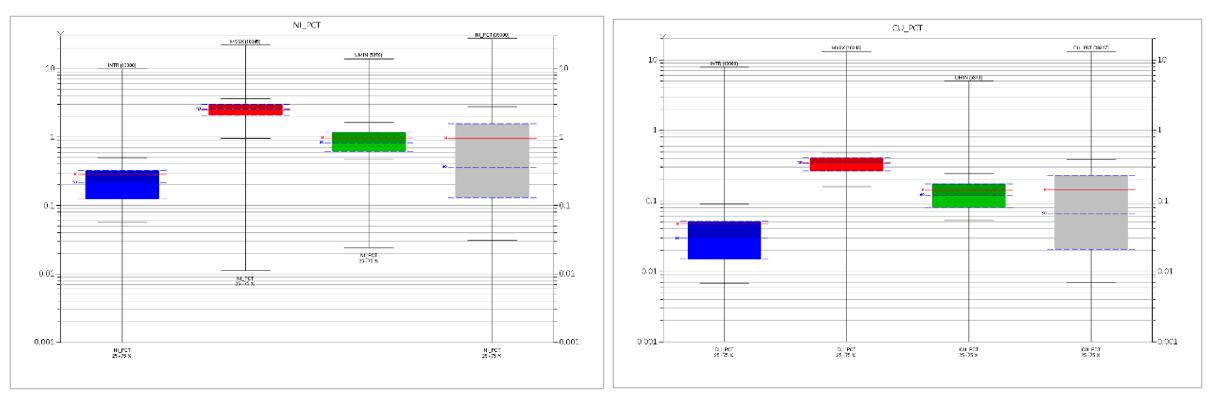
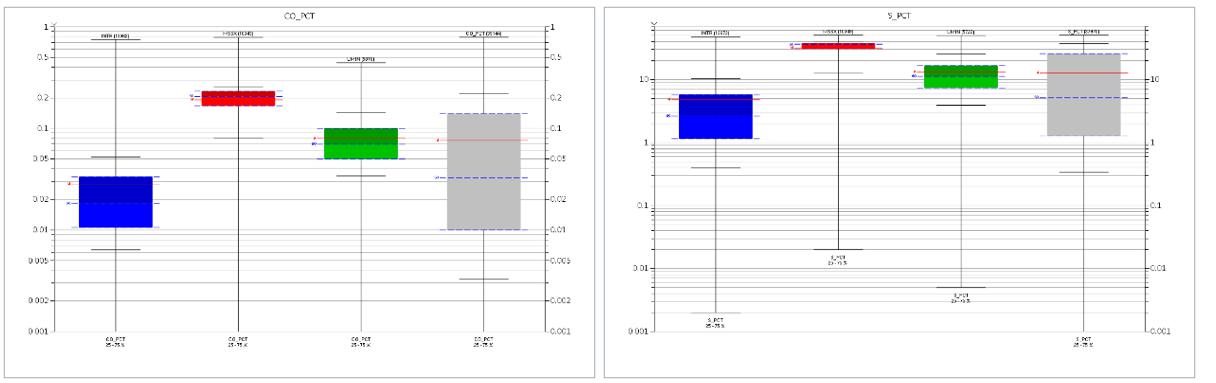
Figure 11-6: Box Plots for a Suite of Elements for the Three Predominant Mineralization Types – Tembo Zone Figure 11-7: Box Plot of Grades (Co, Cu, Ni, and S) for North Zone
Page
|
/ / Initial Assessment - Technical Report Summary |
|
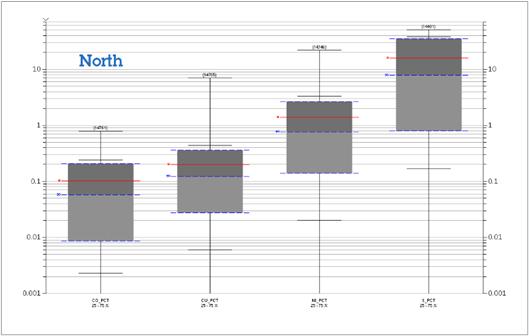
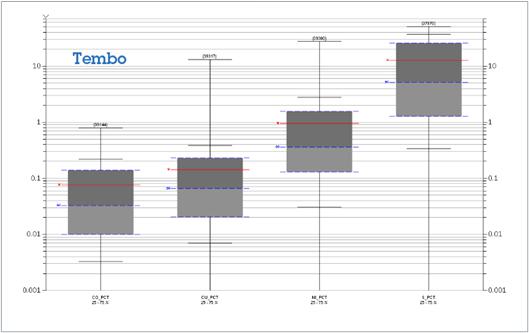
Figure 11-8: Box Plot of Grades (Co, Cu, Ni, and S) for Tembo Zone The purpose of compositing drillhole samples is to ensure that all samples have the same sample support.
Page
|
/ / Initial Assessment - Technical Report Summary |
|
| 11.3.2 | Drillhole Compositing |
The term ‘sample support’ is a geostatistical concept that relates to the space on which an observation is defined (i.e., length of a sample interval, volume of sampled material, percentage recovery, etc.).
While an analysis of drillhole sample lengths should always be undertaken, the act of compositing is not necessarily an essential step in the resource modeling and estimation process; it is only warranted in cases where sample support is disrupted by high variability of raw sample lengths in the dataset. The decision to composite or not, and what composite length to use if proceeding, (i.e., in the case where compositing is considered necessary), should therefore be based on statistical analysis of the particular dataset in question.
A review was undertaken of the raw sample lengths of the samples in the data from each zone. Sample length statistics examined for the 2024 work for North are shown in Figure 11-9 and for Tembo in Figure 11-10. The histograms show that the most prevalent sample length is 1 m. There is a second population of samples less than 1 m in length at all zones, and a population of samples of 2 m length at North.
Because of the large number of 1 m samples relative to any other length of sample, it was felt that compositing the 1 m samples to a coarser sample length would result in a statistically significant reduction in variance of the overall assay data, which is undesirable. Furthermore, the splitting of larger samples into smaller (1 m) samples would also result in an artificial reduction in variance by creating exact duplicate intervals from the larger original sample interval.
It was therefore decided to not composite the dataset to a common length on the basis that sample support was already reasonable, and the negative ramifications of compositing may, in this instance, outweigh any potential benefit from making the dataset more consistent in length.
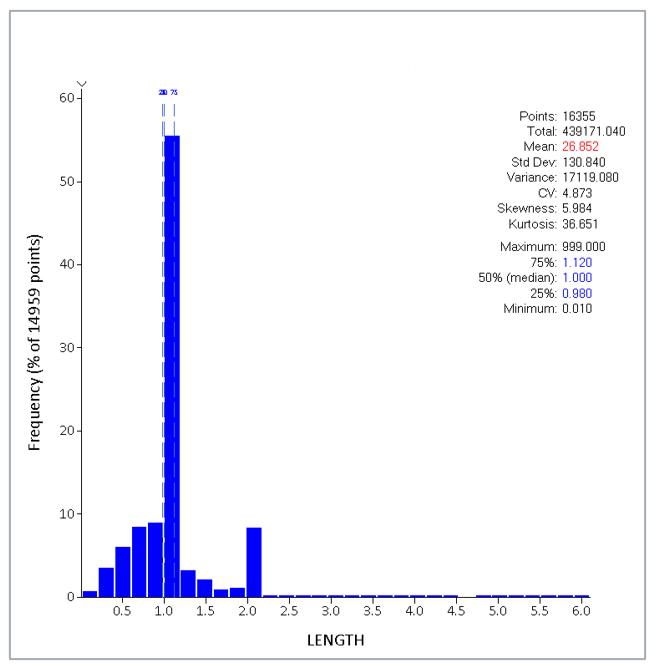
Figure 11-9: Histograms of Sample Lengths –North Zone (where assayed)
Page
|
/ / Initial Assessment - Technical Report Summary |
|
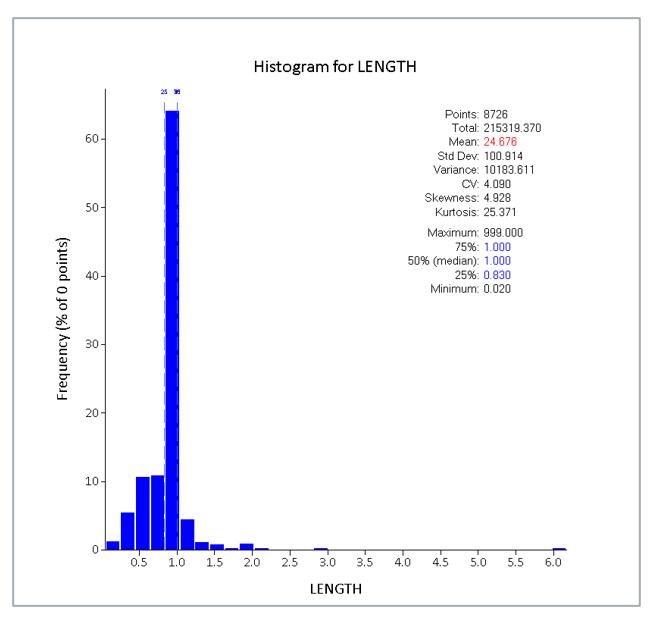
Figure 11-10: Histograms of Sample Lengths – Tembo Zone (where assayed)
| 11.3.3 | Top Cutting |
Top cutting is a strategy used in grade estimation to limit the influence of anomalously high values, which may otherwise cause the overestimation of grades, by cutting their value back to a ceiling value determined using statistics or eliminating the data completely if the result is considered invalid.
Anomalously high values are generally readily observable on a log probability plot as being ‘off-trend’ of the lower grade values in the same domain (an inflection in the probability plot).
While an analysis of population statistics to determine the presence of anomalous values should always be undertaken, the act of top cutting is not necessarily an essential step in the resource modeling and estimation process; it is only warranted in cases where (a) influential anomalous populations exist, and (b) these occur in a spatial configuration that renders them unsuitable for segregation into separate domains (i.e. scattered pervasively, rather than co-located). The decision to top cut or not, and which data to cut (i.e., in the case where cutting is considered necessary), should therefore be based on statistical analysis of the dataset in question.
A statistical analysis was undertaken of the Ni, Cu, Co, and S grades within each mineralization type at each zone. While several high grades were identified, these were able to be constrained throughout the grade estimation process, therefore, no top cutting was applied.
One drillhole (P60-12) was removed from the dataset on the basis that it appears to be incongruent with the surrounding information. This hole has no survey data and is therefore assumed to be vertical – this could be the cause of the disparity in grade characteristics down the hole. This hole also has no lithological log, rendering it unable to be compared lithologically to surrounding holes.
| 11.3.4 | Boundary Treatment |
Contact analysis was undertaken on all major component elements in each zone to determine the optimal treatment of samples at the boundaries of different zones of mineralization. Some examples of the contact plots are shown for Ni% across the INTR:UMAF boundary at North and Tembo (Figure 11-11) and across the UMAF:MSSX boundary (Figure 11-12).
This analysis showed that the contrast between samples on either side of a mineralization boundary was definitive. This is not an unexpected finding given the differential in tenor of grade that was clearly evident at the time of interpretating the boundaries between the different mineralization types.
Page
|
/ / Initial Assessment - Technical Report Summary |
|
As a result, the decision was taken to treat all boundaries between different mineralization types as ‘hard’ boundaries that do not allow the intermingling of samples from adjacent domains.
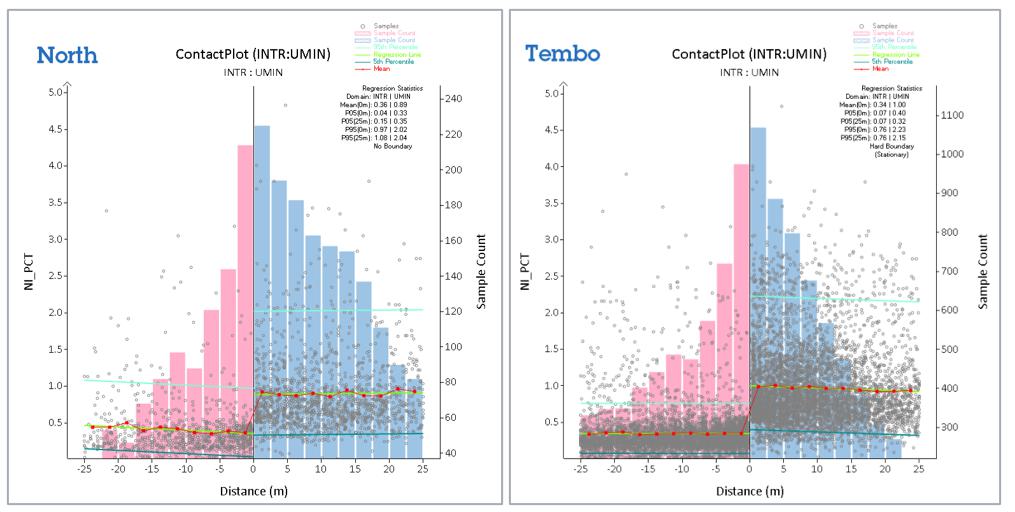
Figure 11-11: Contact Plots for Ni% Across INTRUSIV:UMAF Boundary Where sufficient samples existed, variograms were generated for all estimated constituents, including density, for all mineralization domains (MSSX, UMAF, and INTRUSIV), in all zones.
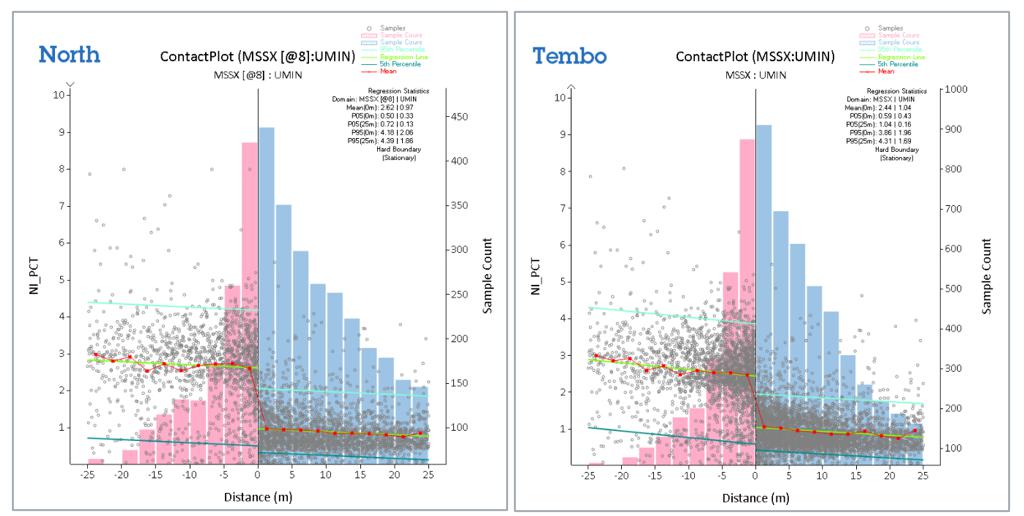
Figure 11-12: Contact Plots for Ni% Across UMAF:MSSX Boundary
Page
|
/ / Initial Assessment - Technical Report Summary |
|
| 11.3.5 | Variography |
For the MSSX, it was often the case that the variograms were erratic from one lag to the next. It is considered that this reflects the narrow nature of the MSSX domains, resulting in small pair counts at any given lag, which can magnify the variability. Despite this, continuity was invariably able to be modeled where sufficient samples occur to form the variogram. Downhole variograms were generally robust.
Estimation of grades for all elements was undertaken by ordinary kriging using the variogram parameters that had been obtained for each component. Where a component / domain had insufficient samples to develop standalone variogram parameters, alternative parameters were assigned from a comparable domain that was selected following review of the statistical and geometrical characteristics of the domains in question.
| 11.3.6 | Search Parameters |
Each mineralization type and zone combination had its own search strategy based on the learnings from the preceding statistical analyses and from visual observation or the characteristics of each.
The search strategy used is based on a four-pass approach to maximize the number of cells receiving estimates, while maintaining reasonably tight search ellipses in the first three passes.
The first search volume is an ellipse generally of the order of 120 x 120 x 40 m. Cells that fail to receive an estimate in the first search pass are then processed through a second search volume, which has a dimension multiplier generally (but not always) 2.5-times the initial volume. Likewise, cells that remain un-estimated are processed through a third search pass, with a search volume multiplier set to 5 times the initial volume. The fourth search volume is set to 20-times the initial volume in an effort to populate as many cells as possible.
Each search pass has its own minimum and maximum numbers of samples parameters. While the maximum rarely changed, the minimum number reduced slightly in each subsequent pass to permit estimation to succeed with slightly fewer samples thereby moderating the search distances within the larger search volumes of the second and third passes.
The maximum number of samples per drillhole criteria was utilized to help assure that estimates were based on more than one drillhole.
For some domains (not all), octant restrictions were imposed to force selection of a samples from a variety of directions. For select domains, the process of ‘Dynamic Anisotropy’ was used to orient the search ellipse used to estimate each cell based on local variations in the interpreted mineralization boundaries. This process enables better capture of relevant samples for estimation, resulting in estimates that are locally appropriate.
Search parameters used for grade estimation are shown in Table 11-1.
Page
|
/ / Initial Assessment - Technical Report Summary |
|
Table 11-1: Grade Estimation Search Parameters
| Zone | Domain Description (and Domain No. where required) |
Search Pass No. | Search Distances | Search Angles | Octant Searching | Min. No. Samp’s | Search Vol. 2 | Search Vol. 3 | Max. No. Samp’s per Hole | Dynamic Aniso-tropy Used (Y/–) | |||||||||
| 1 | 2 | 3 | 1 | 2 | 3 | Used (Y/–) |
Min. No. Octants |
Min. Samp’s per Octant |
Max. Samp’s per Octant |
Vol. Factor | Min. No. Samp’s | Vol. Factor | Min. No. Samp’s | ||||||
| MAIN | MSSX | 1/2/3 | 60 | 60 | 10 | 095 | 65 | 15 | Y | 2 | 2 | 6 | 8 | 2.5 | 7 | 5 | 6 | 5 | Y |
| MAIN | MSSX #3 | 1/2/3 | 60 | 60 | 20 | 095 | -25 | 0 | Y | 2 | 2 | 6 | 6 | 5 | 5 | 10 | 4 | 5 | Y |
| MAIN | UMIN | 1/2/3 | 60 | 40 | 20 | 095 | 60 | 15 | Y | 2 | 1 | 6 | 8 | 2.5 | 7 | 5 | 6 | 5 | – |
| MAIN | UMIN 16/17/18 | 1/2/3 | 60 | 40 | 20 | 095 | 60 | 15 | – | – | – | – | 2 | 2.5 | 2 | 5 | 2 | 5 | – |
| MAIN | INTR | 1/2/3 | 100 | 80 | 20 | 095 | 60 | 15 | Y | 2 | 1 | 6 | 8 | 2.5 | 7 | 5 | 6 | 5 | – |
| MAIN | MSSX | 4 | 1,200 | 1,200 | 400 | 095 | 65 | 15 | – | 2 | – | – | 6 | – | – | – | – | 8 | Y |
| MAIN | MSSX #3 | 4 | 2,400 | 2,400 | 800 | 095 | -25 | 0 | – | 2 | – | – | 6 | – | – | – | – | 8 | Y |
| MAIN | UMIN | 4 | 1,200 | 1,200 | 400 | 095 | 60 | 15 | – | 2 | – | – | 6 | – | – | – | – | 8 | – |
| MAIN | UMIN 16/17/18 | 4 | 1,200 | 1,200 | 400 | 095 | 60 | 15 | – | 0 | – | – | 2 | – | – | – | – | 8 | – |
| MAIN | INTR | 4 | 1,200 | 1,200 | 400 | 095 | 60 | 15 | – | 2 | – | – | 6 | – | – | – | – | 8 | – |
| MNB | MSSX | 1/2/3 | 60 | 40 | 20 | 105 | -75 | -35 | – | – | – | – | 6 | 2.5 | 5 | 5 | 4 | 5 | Y |
| MNB | UMIN | 1/2/3 | 60 | 40 | 20 | 105 | -75 | -35 | – | – | – | – | 6 | 2.5 | 5 | 5 | 4 | 5 | – |
| MNB | INTR | 1/2/3 | 40 | 60 | 10 | 115 | -45 | 45 | – | – | – | – | 8 | 5 | 8 | 10 | 6 | 5 | – |
| MNB | MSSX | 4 | 1,200 | 1,200 | 400 | 105 | -75 | -35 | – | – | – | – | 6 | – | – | – | – | 8 | Y |
| MNB | UMIN | 4 | 2,400 | 2,400 | 800 | 105 | -75 | -35 | – | – | – | – | 6 | – | – | – | – | 8 | – |
| MNB | INTR | 4 | 1,200 | 1,200 | 400 | 115 | -45 | 45 | – | – | – | – | 4 | – | – | – | – | 8 | – |
| NORTH | MSSX | 1/2/3 | 60 | 60 | 10 | 130 | -65 | -15 | – | – | – | – | 8 | 2.5 | 8 | 5 | 6 | 5 | Y |
| NORTH | UMIN | 1/2/3 | 60 | 60 | 10 | 130 | -65 | -15 | – | – | – | – | 8 | 2.5 | 8 | 5 | 6 | 5 | – |
| NORTH | INTR | 1/2/3 | 60 | 60 | 10 | 130 | -85 | -15 | – | – | – | – | 8 | 2.5 | 8 | 5 | 6 | 5 | – |
| NORTH | MSSX | 4 | 1,200 | 1,200 | 400 | 130 | -65 | -15 | – | – | – | – | 6 | – | – | – | – | 8 | Y |
| NORTH | UMIN | 4 | 2,400 | 2,400 | 800 | 130 | -65 | -15 | – | – | – | – | 6 | – | – | – | – | 8 | – |
Page
|
/ / Initial Assessment - Technical Report Summary |
|
| Zone | Domain Description (and Domain No. where required) |
Search Pass No. | Search Distances | Search Angles | Octant Searching | Min. No. Samp’s | Search Vol. 2 | Search Vol. 3 | Max. No. Samp’s per Hole | Dynamic Aniso-tropy Used (Y/–) | |||||||||
| 1 | 2 | 3 | 1 | 2 | 3 | Used (Y/–) |
Min. No. Octants |
Min. Samp’s per Octant |
Max. Samp’s per Octant |
Vol. Factor | Min. No. Samp’s | Vol. Factor | Min. No. Samp’s | ||||||
| NORTH | INTR | 4 | 1,200 | 1,200 | 400 | 130 | -85 | -15 | – | – | – | – | 6 | – | – | – | – | 8 | – |
| KIMA | MSSX | 1/2/3 | 60 | 60 | 10 | 130 | -65 | -15 | – | – | – | – | 8 | 2.5 | 8 | 5 | 6 | 5 | Y |
| KIMA | UMIN/INTR | 1/2/3 | 60 | 60 | 10 | 130 | -65 | -15 | – | – | – | – | 8 | 2.5 | 8 | 5 | 6 | 5 | – |
| KIMA | MSSX | 4 | 1,200 | 1,200 | 400 | 130 | -65 | -15 | – | – | – | – | 4 | – | – | – | – | 8 | Y |
| KIMA | UMIN/INTR | 4 | 1,200 | 1,200 | 400 | 130 | -65 | -15 | – | – | – | – | 4 | – | – | – | – | 8 | – |
| TEMBO | TS & TCN UMIN/INTR | 1/2/3 | 60 | 60 | 20 | 145 | -80 | 20 | – | – | – | – | 8 | 2.5 | 8 | 5 | 6 | 5 | – |
| TEMBO | TCS & TN UMIN/INTR | 1/2/3 | 60 | 60 | 20 | 145 | -75 | -30 | – | – | – | – | 6 | 2.5 | 8 | 5 | 6 | 5 | – |
| TEMBO | TS & TCN MSSX | 1/2/3 | 60 | 60 | 20 | 145 | -80 | 20 | – | – | – | – | 8 | 2.5 | 8 | 5 | 6 | 5 | Y |
| TEMBO | TCS & TN MSSX | 1/2/3 | 60 | 60 | 20 | 145 | -75 | -30 | – | – | – | – | 6 | 2.5 | 8 | 5 | 6 | 5 | Y |
| TEMBO | TS & TCN UMIN/INTR | 4 | 1,200 | 1,200 | 400 | 145 | -80 | 20 | – | – | – | – | 4 | – | – | – | – | 8 | – |
| TEMBO | TCS & TN UMIN/INTR | 4 | 1,200 | 1,200 | 400 | 145 | -75 | -30 | – | – | – | – | 6 | – | – | – | – | 8 | – |
| TEMBO | TS & TCN MSSX | 4 | 1,200 | 1,200 | 400 | 145 | -80 | 20 | – | – | – | – | 4 | – | – | – | – | 8 | Y |
| TEMBO | TCS & TN MSSX | 4 | 1,200 | 1,200 | 400 | 145 | -75 | -30 | – | – | – | – | 6 | – | – | – | – | 8 | Y |
Notes:
| ● | The maximum number of samples permitted in each Search Volume = 14. |
| ● | The rotation of the Search Angles occurs around axes 3 : 1 : 3. |
| ● | ‘UMIN’ is the domain field name in the cell model and drillhole files to denote the presence or absence of ultramafic mineralization (which is abbreviated to ‘UMAF’ or ‘UMAF_1a’ throughout this report). |
| ● | ‘INTR’ in this table is a shortening of ‘INTRUSIV’, which is the domain field name in the cell model and drillhole files to denote the presence or absence of intrusive lithology. |
Page
|
/ / Initial Assessment - Technical Report Summary |
|
| 11.3.7 | Grade Estimation |
Grade (and density) estimation was undertaken using ordinary kriging for each domain.
Inverse distance weighting to the power of 2 (ID2) was used to estimate a select group of components in each domain for validation purposes. The global tonnes and grades were compared for each estimation method, as a check for gross errors in the kriging parameters.
An example cross-section showing Ni% grade estimates at North zone is shown in Figure 11-13 and at Tembo zone in Figure 11-14.
| 11.3.8 | Model Validation |
The models were validated visually and statistically for all grade elements estimated and the density. Visually, the models were reviewed on cross-sections against the input drilling data to ensure that the models honor the grade profiles and continuity. The following specific verification steps were taken:
| ● | Cross-sections of the estimated grades were reviewed to ensure the estimates honor drillhole data and the geological interpretation. |
| ● | Histograms of the drillhole data were overlain with the estimated model Ni grades to assess grade distribution. |
| ● | Cumulative frequency plots for each of the estimation methods and the drillhole grades illustrate a modest grade distribution distortion. |
| ● | Swath plots were generated for each of the domains within each zone to review and assess the grade distributions. Some example swath plots along strike are shown for North in Figure 11-15 and Tembo in Figure 11-16. |
Page
|
/ / Initial Assessment - Technical Report Summary |
|
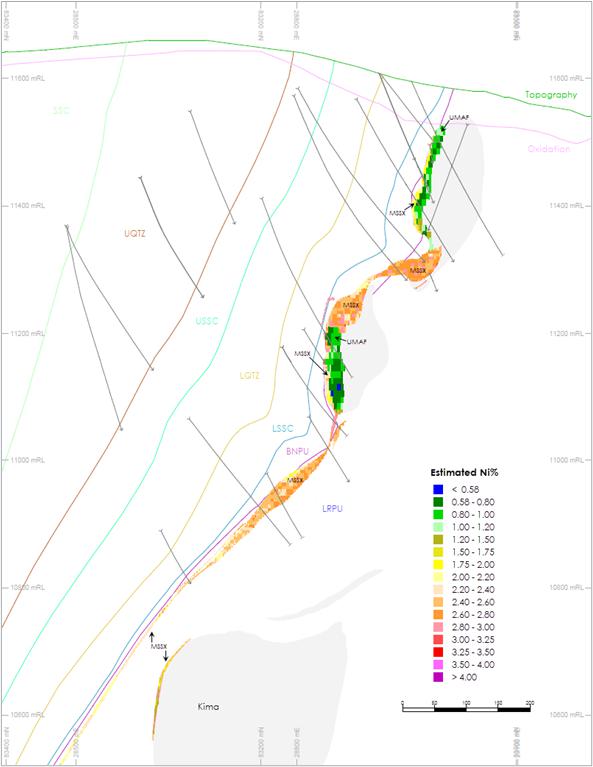
Note: * Oblique cross-section looking 030°, +/- 15 m projection.
Figure 11-13: Example Cross-section* of Ni% Grade Estimates at North Zone (shows Kima)
Page
|
/ / Initial Assessment - Technical Report Summary |
|

Note: * Oblique cross-section looking 038°, +/- 15 m projection.
Figure 11-14: Example Cross-section* of Ni% Grade Estimates at Tembo Zone
Page
|
/ / Initial Assessment - Technical Report Summary |
|
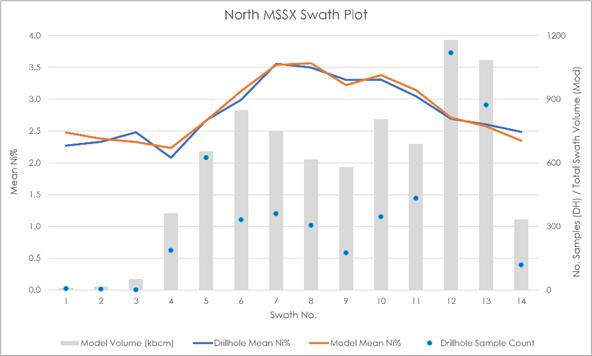
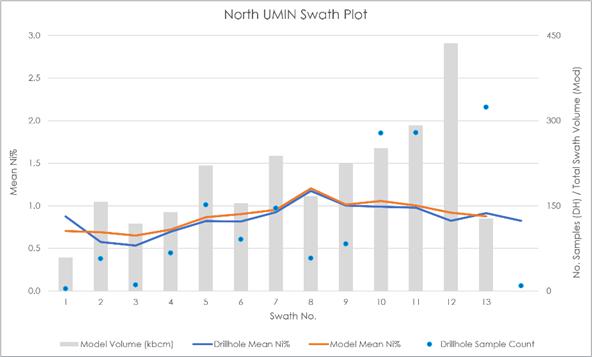
Figure 11-15: Example Swath Plots – Ni% Along Strike for North Zone MSSX and UMAF
Page
|
/ / Initial Assessment - Technical Report Summary |
|
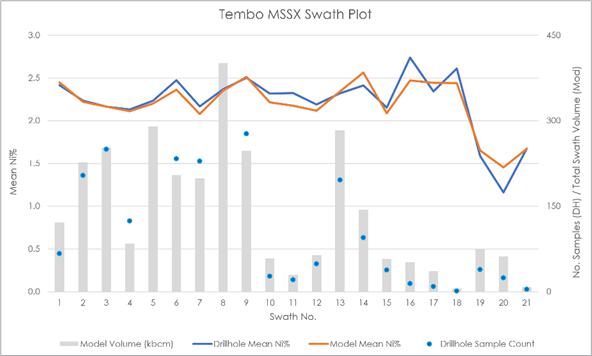
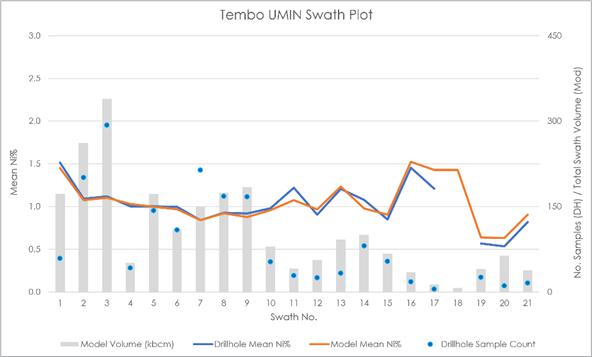
Figure 11-16: Example Swath Plots – Ni% Along Strike for Tembo Zone MSSX and UMAF
Page
|
/ / Initial Assessment - Technical Report Summary |
|
| 11.3.9 | Classification |
The 2024MRU was classified after reviewing the previous classification criteria and is based on a variety of factors, including the geometry and spatial and geochemical continuity of the Mineral Resource, as well as the success rate at predicting mineralization locations and thicknesses when intersecting the interpreted mineralization with recent (2021–23) drilling. Manually defined wireframe solids were produced to enclose areas to be defined as Inferred, Indicated, or Measured.
Significant emphasis and time were given to ‘tightening’ the geological and mineralogical interpretation throughout the entire Project area in the 2024 work. This tightening was achieved through:
| ● | The development of a sedimentary host strata model. The host sedimentary stratigraphy comprises a reliably predictable sequence of known strata on a whole-Project scale that is very well supported by the drillhole logging database. The robust strata model helps to guide and control the interpreted extent and shape of the later intrusives. |
| ● | A full and comprehensive reinterpretation of the mineralization in all mineralized zones. |
| ● | Smaller subcelling along the boundaries of the mineralized units (MSSX and UMIN), forcing tighter constraint of the volumes within these domains (note: ‘UMIN’ is the domain field name in the cell model and drillhole files to denote the presence or absence of ultramafic mineralization (which is abbreviated to ‘UMAF’ or ‘UMAF_1a’ throughout this report). |
The tightened geological and mineralogical interpretation achieved in 2024 had the downside effect of slightly reducing the overall mineralization tonnage, but positively influenced confidence in the interpretation at a local and deposit scale, resulting in an upgrade in classification in several locations and an overall increase in the tonnages in the Measured + Indicated inventory.
A schematic of the classification is shown in Figure 11-17.
Page
|
/ / Initial Assessment - Technical Report Summary |
|
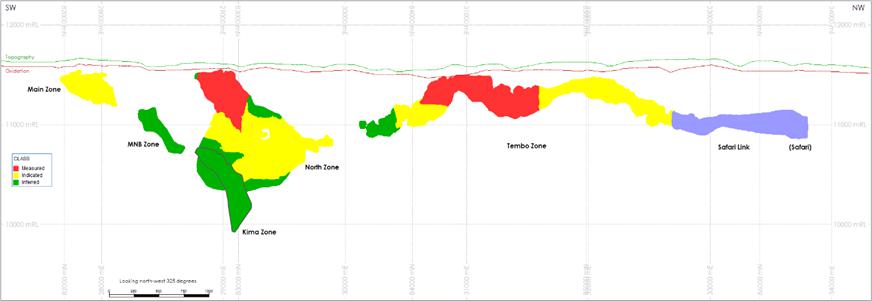
Note: Topography and oxidation wireframes are sliced on the long-section plane, whereas the model is projected onto the plane
Figure 11-17: Schematic Projected Long-section of the Kabanga Classification (truncated UTM, looking northwest)
Page
|
/ / Initial Assessment - Technical Report Summary |
|
| 11.4 | Mineral Resource Cut-off Grade |
As the Kabanga mineralized zones contain multi-element mineralization, a grade-equivalent formula has been used for reporting from the Mineral Resource estimates.
DRA reviewed the grade equivalent formulae and the cut-off grade assumptions that were used for the Kabanga 2024MRU dated December 4, 2024. It was determined through this review that the assumptions remain appropriate for informing the grade-equivalence strategy and Mineral Resource cut-off in this IA TRS.
The metal prices recommended by DRA for the MRE are based on its assessment of recent market prices, long-term forward curve prices, and consensus prices from analysts and institutions. The metal prices selected are at the upper range of long-term consensus price forecasts over the last 10 years; this is an optimistic view of prices for use in the cut-off grade analysis to ensure that the reasonable prospect of economic extraction considerations does not exclude material that may be able to be included in future studies for defining Mineral Reserves. For the MRE in the IA TRS, the recommended metal prices are the same as those used in the 2024MRU; these are presented in Table 11-2.
Table 11-2: Kabanga Metal Prices
| Metal |
Long-Term Price (USD/lb)
|
| Nickel | 9.50 |
| Copper | 4.50 |
| Cobalt | 23.00 |
With nickel being the primary payable metal, a formula was used to convert other payable metals in each model cell, to a nickel-equivalent value, by using the individual metal prices and expected recoveries, compared to those of nickel. This results in a total nickel-equivalent (NiEq) grade for each model cell.
The 2024 nickel-equivalent (NiEq24) formulae are as follows:
| ● | MSSX NiEq24 = Ni + (Cu x 0.454) + (Co x 2.497) |
| ● | UMAF NiEq24 = Ni + (Cu x 0.547) + (Co x 2.480) |
The 2024 NiEq cut-off grades are:
| ● | MSSX = 0.73% NiEq24 |
| ● | UMAF = 0.77% NiEq24 |
Metal price and recovery assumptions used for the NiEq24 and cut-off grade determination are shown for MSSX and UMAF in Table 11-3 and Table 11-4 respectively.
Table 11-3: NiEq24 MSSX Input Parameters
| Metals |
Metal Prices (USD/lb) |
Recoveries (%) |
Net Recovered (USD/lb) |
NiEq Ratio | |
| Concentrator | Refinery | ||||
| Nickel | 9.50 | 66.6 | 96.5 | 6.11 | 1.000 |
| Copper | 4.50 | 63.4 | 97.2 | 2.77 | 0.454 |
| Cobalt | 23.00 | 68.2 | 97.3 | 15.26 | 2.497 |
Page
|
/ / Initial Assessment - Technical Report Summary |
|
Table 11-4: NiEq24 UMAF Input Parameters
| Metals |
Metal Prices (USD/lb) |
Recoveries (%) |
Net Recovered (USD/lb) |
NiEq Ratio | |
| Concentrator | Refinery | ||||
| Nickel | 9.50 | 64.0 | 96.5 | 5.87 | 1.000 |
| Copper | 4.50 | 76.9 | 97.2 | 3.36 | 0.574 |
| Cobalt | 23.00 | 65.0 | 97.3 | 14.55 | 2.480 |
| 11.4.1 | NiEq24 Cut-off Grade |
The NiEq24 cut-off grade used is a ‘breakeven cut-off (BECO) grade’. It is defined as the Ni grade of a model cell in the resource model at which the Net Sales Return is equal to the cost for producing nickel cathode (Cost).
The 2024MRU is based on the following key assumptions:
| ● | Mining rate: an underground mining rate of 3.4 Mtpa. |
| ● | Mining method: underground stoping with backfill, feeding an onsite concentrator. |
| ● | Processing rate: a concentrator located on-site at Kabanga with a capacity of 3.4 Mtpa feed. |
| ● | Concentrate is assumed to be transported to a hydrometallurgical refining facility at Kahama to produce final LME grade nickel, copper, and cobalt metals. The Kahama refinery capacities are assumed to be: concentrate feed 347 ktpa and total metal production 77.7 ktpa (63.0 ktpa nickel, 9.0 ktpa copper, and 5.7 ktpa cobalt). |
| ● | Transport of nickel and copper cathode and cobalt rounds to Dar es Salaam for sale locally or for export. |
| ● | All power requirements are assumed to be supplied from the national grid. |
Modifying factors were estimated using the above Project scenario and comparisons with studies of similar projects. The cost accuracy level is approximately ±50% with a contingency level of 25%.
Table 11–6 details the input assumptions used for determination of the cut-off grade.
NiEq24 has been calculated in the resource model to account for the grades of all three payable metals. In the cut-off grade calculation, only the revenue from nickel is considered for the Net Sales Return. In model cells where there are no Cu and Co grades, the Net Sales Return calculated from Ni only can then be applied to the NiEq24.
A description of the formulae for calculating Net Sales Return (NSR) and Cost follows.
| 11.4.1.1 | Net Sales Return |
| ● | Mass Pull | = | Ni Grade * Concentrator Recovery / Concentrate Ni Grade |
| ● | NSR | = | ((Nickel Price* Concentrate Ni Grade * Refinery Recovery) * (1 - Royalties) | |
| - | (Transport + Insurance)) * Mass Pull |
| 11.4.1.2 | Concentrator Recoveries, Mass Pull and Concentrate Grades |
Concentrator recoveries, mass pull, and concentrate grades formulae were estimated using the testwork results and other assumptions for the production scenario. The assumptions are shown in Table 11-5. The Concentrator recoveries, when plotted with the relevant feed grades, are curves where the lower feed grades have lower recoveries. The recoveries at the cut-off grades have been used in the cut-off grade calculations. For example, the nickel grade of 0.77% Ni has an MSSX concentrator recovery of 66.6%, a grade of 2.0% Ni would have a recovery of 89.2% for MSSX and 76.1% Ni for UMAF.
Page
|
/ / Initial Assessment - Technical Report Summary |
|
The Concentrator Recovery and Mass Pull relationships are presented in Table 11-5. The Concentrator recoveries for nickel, copper, and cobalt for both MSSX and UMAF as a function of feed grades are shown in Figure 11-18 to Figure 11-20. The nickel concentrate grades as a function of feed grade are shown in Figure 11-21, and the mass pull as a function of nickel grade is shown in Figure 11-22.
Table 11-5: Concentrator Recoveries and Mass Pull Assumptions
| MSSX Nickel Recovery % |
| (–1.77+36.658 * (Mass Pull)0.3864) * (–0.022 * ln(Ni Feed Grade) + 1.0277) + 0.63 |
| UMAF Nickel Recovery % |
| (–3.77+36.658 * (Mass Pull)0.3864) * (–0.022 * ln(Ni Feed Grade) + 1.0215) - 0.68 |
| MSSX Copper Recovery % |
| e(4.601495 - 0.0022253/(Cu Feed Grade * Cu Feed Grade)) * 1.0025 |
| UMAF Copper Recovery % |
| (75.35 + 39.508272 * Cu Feed Grade) * 0.991 |
| MSSX Cobalt Recovery % |
| 1 / (0.0061895713 + 37.653048 / (Ni Recovery * Ni Recovery)) |
| UMAF Cobalt Recovery % |
| 1 / (0.0061895713 + 37.653048 / (Ni Recovery * Ni Recovery)) |
| MSSX and UMAF Mass Pull % |
| –1.67933 + 117.056 * ((12.31 * (Ni Feed Grade)-0.603)-1.093) * (0.0009 * ln(Ni Feed Grade) + 0.982) |
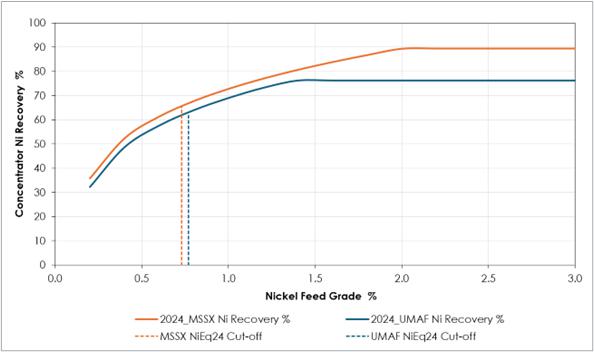
Figure 11-18: MSSX and UMAF Concentrator Nickel Recoveries
Page
|
/ / Initial Assessment - Technical Report Summary |
|
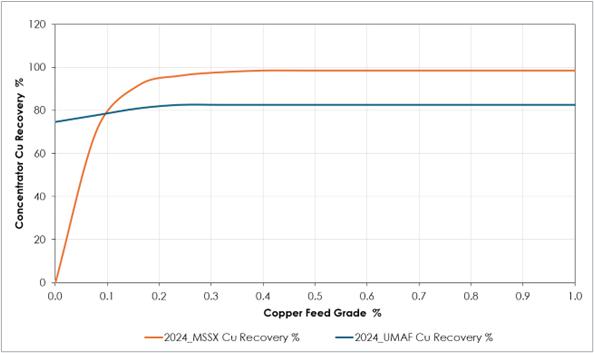
Figure 11-19: MSSX and UMAF Concentrator Copper Recoveries
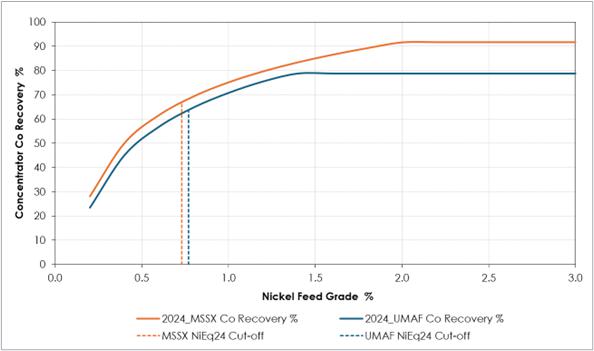
Figure 11-20: MSSX and UMAF Concentrator Cobalt Recoveries
Page
|
/ / Initial Assessment - Technical Report Summary |
|
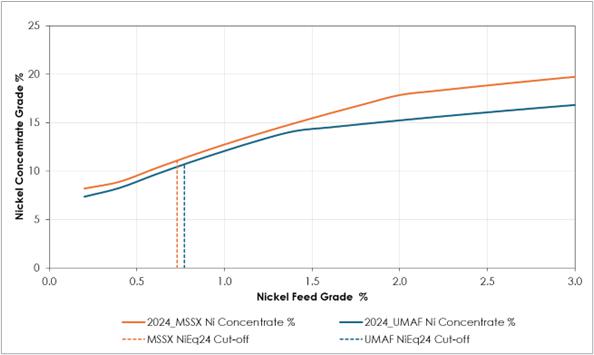
Figure 11-21: MSSX and UMAF Concentrate Nickel Grade
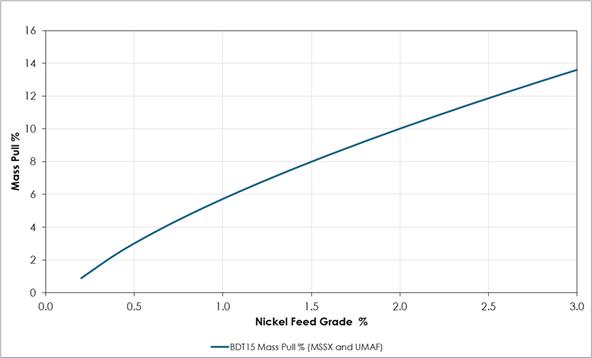
Figure 11-22: MSSX and UMAF Mass Pull
Page
|
/ / Initial Assessment - Technical Report Summary |
|
| 11.4.1.3 | Cost |
| ● | Refinery Cost = (Refinery Cost per lb) * (lb/t) * Concentrate Ni Grade * Mass Pull |
| ● | Breakeven Cost = Mining + Process + Refining + G&A |
| 11.4.1.4 | Breakeven Cut-off Grade |
| ● | Cut-off Grade is the Ni Grade when Net Sales Return = Cost |
Table 11-6: 2024 Cut-off Grade Assumptions
| Description | Unit | Value |
| Metal Prices | ||
| Nickel | USD/lb | 9.50 |
| Copper | USD/lb | 4.50 |
| Cobalt | USD/lb | 23.00 |
| Refinery Recovery | ||
| Nickel | % | 96.50 |
| Copper | % | 97.20 |
| Cobalt | % | 97.30 |
| Concentrate | ||
| Moisture Content | % | 9 |
| Transport Cost | USD/t.km Concentrate | 0.08 |
| Royalties and Fees | ||
| Royalties and Fees | % | 6.47 |
| Refining | ||
| Refinery to Port Transport Cost | USD/t.km Metal | 0.05 |
| Port and Sea Freight Cost | USD/t Metal | 102.02 |
| Insurance Cost | % freight value | 0.40 |
| Refining Cost | USD/lb recovered metal | 0.99 |
| Mine Operating Costs | ||
| Underground Mining | USD/t Mined | 50.07 |
| Processing | USD/t Processed | 12.64 |
| General and Administration | USD/t Processed | 8.69 |
| 11.4.2 | Cut-off Grade Sensitivity |
As part of the 2025 IA, a sensitivity assessment to changes in the key assumptions to the cut-off grades was undertaken based on the updated project scenario and most recent cost estimates. Changes included selling nickel and cobalt sulfates and copper cathode, instead of exclusively metal cathode products.
The latest costs from recent project studies were used in this sensitivity, with all the assumptions that changed captured in Table 11-7.
Page
|
/ / Initial Assessment - Technical Report Summary |
|
Table 11-7: 2025 IA Sensitivity Assumptions
| Description | Unit | Value |
| Refinery Recovery | ||
| Nickel | % | 97.20 |
| Copper | % | 93.00 |
| Cobalt | % | 97.70 |
| Refining | ||
| Refinery to Port Transport Cost | USD/t | 51.41 |
| Sea Freight Cost | USD/t | 50.00 |
| Port Handling Costs | USD/t | 27.22 |
| Refining Cost | USD/t feed | 18.57 |
| Mine Operating Costs | ||
| Underground Mining | USD/t Mined | 54.24 |
| Processing | USD/t Processed | 12.37 |
| General and Administration | USD/t Processed | 4.88 |
After updating the assumptions as detailed in Table 11-7, it is observed that the NiEq break-even cut-off grade is very similar to those calculated for the 2024 MRU. These are summarized below.
The 2025 IA NiEq cut-off grades are:
| ● | MSSX = 0.75% NiEq25 |
| ● | UMAF = 0.78% NiEq25 |
This represents a 0.02% and 0.01% nickel-equivalent grade difference from the MSSX and UMAF cut-off grades estimated in the 2024MRU. Therefore, it is the opinion of the QP that there is no requirement to change the cut-off grades applied to the 2024MRU and the 2024 MRE remains current.
Page
|
/ / Initial Assessment - Technical Report Summary |
|
| 11.5 | Reasonable Prospects of Economic Extraction |
The MRE used in this IA is based on the 2024MRU, which was prepared in accordance with S-K 1300. The MRU was supported by a cut-off grade analysis that incorporated conceptual assumptions including underground mining at a rate of 3.4 Mtpa using stoping with backfill, processing at an on-site concentrator, and transport of concentrate to an off-site hydrometallurgical refinery producing nickel, cobalt, and copper metals. These assumptions were used to evaluate reasonable prospects for economic extraction at the time of the MRU and remain the basis for the MRE carried forward into this IA.
To support the determination of reasonable prospects for economic extraction, a preliminary cash flow analysis was completed as part of this IA. This analysis incorporated updated assumptions, including the production of nickel and cobalt sulfate as final products. A cut-off grade sensitivity analysis was also conducted to evaluate the robustness of the 2024 MRU under the revised economic framework.
Based on this review, the QP concluded that the assumptions underlying the 2024MRU remain appropriate for the purposes of this IA. No changes to the reported cut-off grades were required, and the existing MRE is considered to continue to demonstrate reasonable prospects for economic extraction under the updated scenario.
All Mineral Resources are reported in accordance with Item 1302(d) of Regulation S-K 1300 and use economic parameters appropriate for an IA. These Mineral Resources do not represent Mineral Reserves, and no assessment of economic viability has been completed.
| 11.6 | Mineral Resource Statement – Kabanga 2024 |
The Mineral Resource estimates are shown in Table 11-8. The subset of the Mineral Resource estimates that relates to the massive sulfide mineralization is shown in Table 11-9. The subset of the Mineral Resource estimates that relates to the ultramafic mineralization is shown in Table 11-10. Reporting of contained nickel-equivalent metal is shown in Table 11-11. Only the portion of the total mineralization that is attributable to LZM’s interest in the property is shown in Table 11-8 through Table 11-11
The Mineral Resource estimates have an effective date of December 4, 2024. Mineral Resource estimates have been reported in accordance with S-K 1300.
Page
|
/ / Initial Assessment - Technical Report Summary |
|
Table 11-8: Kabanga Mineral Resource Estimates as at December 4, 2024
| Mineral Resource Classification |
LZM Tonnage3 (Mt) | Grades (%) | Recovery (%) | |||||
| NiEq24 | Ni | Cu | Co | Ni | Cu | Co | ||
| MAIN – Massive Sulfide plus Ultramafic | ||||||||
| Measured | – | – | – | – | – | – | – | – |
| Indicated | 8.7 | 1.53 | 1.18 | 0.19 | 0.10 | 73.4 | 85.9 | 75.6 |
| Measured + Indicated | 8.7 | 1.53 | 1.18 | 0.19 | 0.10 | 73.4 | 85.9 | 75.6 |
| Inferred | – | – | – | – | – | – | – | – |
| MNB – Massive Sulfide plus Ultramafic | ||||||||
| Measured | – | – | – | – | – | – | – | – |
| Indicated | – | – | – | – | – | – | – | – |
| Measured + Indicated | – | – | – | – | – | – | – | – |
| Inferred | 1.8 | 1.59 | 1.25 | 0.18 | 0.10 | 75.3 | 88.9 | 78.6 |
| KIMA – Massive Sulfide plus Ultramafic | ||||||||
| Measured | – | – | – | – | – | – | – | – |
| Indicated | – | – | – | – | – | – | – | – |
| Measured + Indicated | – | – | – | – | – | – | – | – |
| Inferred | 3.4 | 2.01 | 1.60 | 0.24 | 0.12 | 81.4 | 92.3 | 84.2 |
| NORTH – Massive Sulfide plus Ultramafic | ||||||||
| Measured | 7.9 | 2.66 | 2.12 | 0.28 | 0.16 | 83.3 | 92.9 | 86.1 |
| Indicated | 16.8 | 3.44 | 2.80 | 0.37 | 0.19 | 85.1 | 94.8 | 88.0 |
| Measured + Indicated | 24.7 | 3.19 | 2.58 | 0.34 | 0.18 | 84.6 | 94.3 | 87.5 |
| Inferred | 5.8 | 3.25 | 2.62 | 0.35 | 0.19 | 85.8 | 95.2 | 88.7 |
| TEMBO – Massive Sulfide plus Ultramafic | ||||||||
| Measured | 8.0 | 2.30 | 1.79 | 0.25 | 0.15 | 81.9 | 91.1 | 84.5 |
| Indicated | 5.5 | 2.22 | 1.75 | 0.24 | 0.14 | 82.0 | 90.5 | 84.9 |
| Measured + Indicated | 13.5 | 2.27 | 1.78 | 0.24 | 0.15 | 82.0 | 90.9 | 84.7 |
| Inferred | 0.3 | 2.49 | 2.01 | 0.23 | 0.15 | 84.2 | 90.3 | 87.0 |
| MINERAL RESOURCE ALL ZONES – Massive Sulfide plus Ultramafic | ||||||||
| Measured | 15.9 | 2.48 | 1.95 | 0.26 | 0.16 | 82.7 | 92.0 | 85.4 |
| Indicated | 31.0 | 2.69 | 2.16 | 0.30 | 0.16 | 82.9 | 92.6 | 85.3 |
| Measured + Indicated | 46.8 | 2.62 | 2.09 | 0.29 | 0.16 | 82.8 | 92.4 | 85.3 |
| Inferred | 11.3 | 2.59 | 2.08 | 0.28 | 0.15 | 83.7 | 93.7 | 86.5 |
Notes:
| ● | Table 11-8 reports the Mineral Resources for the combined massive sulfide and ultramafic mineralization types. |
| ● | Mineral Resources are reported exclusive of Mineral Reserves. |
| ● | Mineral Resources are reported showing only the LZM-attributable tonnage portion, which is 69.713% of the total. |
| ● | Cut-off applies to NiEq24, which is derived using a nickel price of USD 9.50/lb, copper price of USD 4.50/lb, and cobalt price of USD 23.00/lb with allowances for recoveries, payability, deductions, transport, and royalties. |
| ● | NiEq24 formulae are: MSSX NiEq24 = Ni + (Cu x 0.454) + (Co x 2.497) and UMAF NiEq24 = Ni + (Cu x 0.547) + (Co x 2.480) |
| ● | The point of reference for Mineral Resources is the point of feed into a concentrator. |
| ● | All Mineral Resources in the 2024MRU were assessed for reasonable prospects for eventual economic extraction by reporting only material above cut-off grades of: MSSX NiEq24>0.73% and UMAF NiEq24>0.77% |
| ● | Totals may vary due to rounding. |
Page
|
/ / Initial Assessment - Technical Report Summary |
|
Table 11-9: Kabanga Mineral Resource Estimates – Massive Sulfide (subset of Table 11-8) as at December 4, 2024
| Mineral Resource Classification |
LZM Tonnage3 (Mt) | Grades (%) | Recovery (%) | |||||
| NiEq24 | Ni | Cu | Co | Nickel | Copper | Cobalt | ||
| MAIN – Massive Sulfide Only | ||||||||
| Measured | – | – | – | – | – | – | – | – |
| Indicated | 2.9 | 2.18 | 1.71 | 0.27 | 0.14 | 82.3 | 94.1 | 85.6 |
| Measured + Indicated | 2.9 | 2.18 | 1.71 | 0.27 | 0.14 | 82.3 | 94.1 | 85.6 |
| Inferred | – | – | – | – | – | – | – | – |
| MNB – Massive Sulfide Only | ||||||||
| Measured | – | – | – | – | – | – | – | – |
| Indicated | – | – | – | – | – | – | – | – |
| Measured + Indicated | – | – | – | – | – | – | – | – |
| Inferred | 1.2 | 1.90 | 1.49 | 0.21 | 0.13 | 79.1 | 92.2 | 82.5 |
| KIMA – Massive Sulfide Only | ||||||||
| Measured | – | – | – | – | – | – | – | – |
| Indicated | – | – | – | – | – | – | – | – |
| Measured + Indicated | – | – | – | – | – | – | – | – |
| Inferred | 2.6 | 2.31 | 1.84 | 0.28 | 0.13 | 84.1 | 94.4 | 87.3 |
| NORTH – Massive Sulfide Only | ||||||||
| Measured | 5.5 | 3.32 | 2.65 | 0.35 | 0.21 | 86.2 | 95.3 | 89.2 |
| Indicated | 14.2 | 3.86 | 3.14 | 0.42 | 0.21 | 86.2 | 95.7 | 89.2 |
| Measured + Indicated | 19.7 | 3.71 | 3.00 | 0.40 | 0.21 | 86.2 | 95.6 | 89.2 |
| Inferred | 5.5 | 3.39 | 2.74 | 0.36 | 0.20 | 86.2 | 95.4 | 89.2 |
| TEMBO – Massive Sulfide Only | ||||||||
| Measured | 4.9 | 2.94 | 2.31 | 0.31 | 0.20 | 86.2 | 94.9 | 89.2 |
| Indicated | 3.4 | 2.73 | 2.16 | 0.29 | 0.18 | 86.2 | 94.5 | 89.2 |
| Measured + Indicated | 8.3 | 2.85 | 2.25 | 0.30 | 0.19 | 86.2 | 94.8 | 89.2 |
| Inferred | 0.2 | 2.76 | 2.25 | 0.23 | 0.16 | 86.2 | 93.0 | 89.2 |
| MINERAL RESOURCE ALL ZONES – Massive Sulfide Only | ||||||||
| Measured | 10.3 | 3.14 | 2.49 | 0.33 | 0.20 | 86.2 | 95.1 | 89.2 |
| Indicated | 20.5 | 3.44 | 2.77 | 0.38 | 0.20 | 85.8 | 95.4 | 88.8 |
| Measured + Indicated | 30.9 | 3.34 | 2.68 | 0.36 | 0.20 | 85.9 | 95.3 | 88.9 |
| Inferred | 9.4 | 2.89 | 2.32 | 0.32 | 0.17 | 85.2 | 94.9 | 88.1 |
Notes:
| ● | Table 11-9 reports the Mineral Resources for the massive sulfide mineralization only. |
| ● | Mineral Resources are reported exclusive of Mineral Reserves. |
| ● | Mineral Resources are reported showing only the LZM-attributable tonnage portion, which is 69.713% of the total. |
| ● | Cut-off applies to NiEq24, which is derived using a nickel price of USD 9.50/lb, copper price of USD 4.50/lb, and cobalt price of USD 23.00/lb with allowances for recoveries, payability, deductions, transport, and royalties. |
| ● | NiEq24 formulae are: MSSX NiEq24 = Ni + (Cu x 0.454) + (Co x 2.497) and UMAF NiEq24 = Ni + (Cu x 0.547) + (Co x 2.480) |
| ● | The point of reference for Mineral Resources is the point of feed into a concentrator. |
| ● | All Mineral Resources in the 2024MRU were assessed for reasonable prospects for eventual economic extraction by reporting only material above cut-off grades of: MSSX NiEq24>0.73% and UMAF NiEq24>0.77% |
| ● | Totals may vary due to rounding. |
Page
|
/ / Initial Assessment - Technical Report Summary |
|
Table 11-10: Kabanga Mineral Resource Estimates – Ultramafic (subset of Table 11-8) as at December 4, 2024
| Mineral Resource Classification |
LZM Tonnage3 (Mt) | Grades (%) | Recovery (%) | |||||
| NiEq24 | Ni | Cu | Co | Nickel | Copper | Cobalt | ||
| MAIN – Ultramafic Only | ||||||||
| Measured | – | – | – | – | – | – | – | – |
| Indicated | 5.7 | 1.20 | 0.91 | 0.15 | 0.08 | 64.6 | 78.5 | 66.7 |
| Measured + Indicated | 5.7 | 1.20 | 0.91 | 0.15 | 0.08 | 64.6 | 78.5 | 66.7 |
| Inferred | – | – | – | – | – | – | – | – |
| MNB – Ultramafic Only | ||||||||
| Measured | – | – | – | – | – | – | – | – |
| Indicated | – | – | – | – | – | – | – | – |
| Measured + Indicated | – | – | – | – | – | – | – | – |
| Inferred | 0.6 | 0.99 | 0.78 | 0.11 | 0.06 | 61.1 | 77.0 | 62.5 |
| KIMA – Ultramafic Only | ||||||||
| Measured | – | – | – | – | – | – | – | – |
| Indicated | – | – | – | – | – | – | – | – |
| Measured + Indicated | – | – | – | – | – | – | – | – |
| Inferred | 0.8 | 1.09 | 0.85 | 0.12 | 0.07 | 63.1 | 77.2 | 64.9 |
| NORTH – Ultramafic Only | ||||||||
| Measured | 2.4 | 1.18 | 0.93 | 0.12 | 0.07 | 65.0 | 77.2 | 67.2 |
| Indicated | 2.6 | 1.16 | 0.93 | 0.13 | 0.07 | 65.1 | 77.4 | 67.2 |
| Measured + Indicated | 5.1 | 1.17 | 0.93 | 0.12 | 0.07 | 65.0 | 77.3 | 67.2 |
| Inferred | 0.4 | 1.01 | 0.80 | 0.10 | 0.06 | 62.4 | 76.4 | 64.1 |
| TEMBO – Ultramafic Only | ||||||||
| Measured | 3.1 | 1.29 | 0.99 | 0.15 | 0.09 | 66.2 | 78.2 | 68.6 |
| Indicated | 2.1 | 1.39 | 1.07 | 0.16 | 0.09 | 68.2 | 78.7 | 70.9 |
| Measured + Indicated | 5.2 | 1.33 | 1.02 | 0.15 | 0.09 | 67.1 | 78.4 | 69.5 |
| Inferred | 0.1 | 1.50 | 1.15 | 0.23 | 0.09 | 69.5 | 80.3 | 72.4 |
| MINERAL RESOURCE ALL ZONES – Ultramafic Only | ||||||||
| Measured | 5.5 | 1.24 | 0.96 | 0.13 | 0.08 | 65.7 | 77.8 | 68.0 |
| Indicated | 10.4 | 1.23 | 0.95 | 0.15 | 0.08 | 65.6 | 78.3 | 67.8 |
| Measured + Indicated | 16.0 | 1.23 | 0.95 | 0.14 | 0.08 | 65.6 | 78.2 | 67.9 |
| Inferred | 1.9 | 1.05 | 0.83 | 0.12 | 0.06 | 62.7 | 77.2 | 64.3 |
Notes:
| ● | Table 11-10 reports the Mineral Resources for the ultramafic mineralization only. |
| ● | Mineral Resources are reported exclusive of Mineral Reserves. |
| ● | Mineral Resources are reported showing only the LZM-attributable tonnage portion, which is 69.713% of the total. |
| ● | Cut-off applies to NiEq24, which is derived using a nickel price of USD 9.50/lb, copper price of USD 4.50/lb, and cobalt price of USD 23.00/lb with allowances for recoveries, payability, deductions, transport, and royalties. |
| ● | NiEq24 formulae are: MSSX NiEq24 = Ni + (Cu x 0.454) + (Co x 2.497) and UMAF NiEq24 = Ni + (Cu x 0.547) + (Co x 2.480) |
| ● | The point of reference for Mineral Resources is the point of feed into a concentrator. |
| ● | All Mineral Resources in the 2024MRU were assessed for reasonable prospects for eventual economic extraction by reporting only material above cut-off grades of: MSSX NiEq24>0.73% and UMAF NiEq24>0.77% |
| ● | Totals may vary due to rounding. |
Page
|
/ / Initial Assessment - Technical Report Summary |
|
Table 11-11: Kabanga Mineral Resource Estimates – Showing Contained Metals as at December 4, 2024
| Mineral
Resource Classification |
LZM Tonnage3 (Mt) | Grades (%) | Contained Metals (kt) | ||||||
| NiEq24 | Ni | Cu | Co | Nickel Equiv. |
Nickel | Copper | Cobalt | ||
| Massive Sulfide Mineral Resource | |||||||||
| Measured | 10.3 | 3.14 | 2.49 | 0.33 | 0.20 | 325 | 257 | 34 | 21 |
| Indicated | 20.5 | 3.44 | 2.77 | 0.38 | 0.20 | 706 | 570 | 77 | 40 |
| Measured + Indicated | 30.9 | 3.34 | 2.68 | 0.36 | 0.20 | 1,031 | 827 | 111 | 61 |
| Inferred | 9.4 | 2.89 | 2.32 | 0.32 | 0.17 | 274 | 220 | 30 | 16 |
| Ultramafic Mineral Resource | |||||||||
| Measured | 5.5 | 1.24 | 0.96 | 0.13 | 0.08 | 69 | 53 | 7 | 5 |
| Indicated | 10.4 | 1.23 | 0.95 | 0.15 | 0.08 | 128 | 99 | 15 | 8 |
| Measured + Indicated | 16.0 | 1.23 | 0.95 | 0.14 | 0.08 | 197 | 152 | 23 | 13 |
| Inferred | 1.9 | 1.05 | 0.83 | 0.12 | 0.06 | 20 | 15 | 2 | 1 |
| Total Mineral Resource – Massive Sulfide plus Ultramafic | |||||||||
| Measured | 15.9 | 2.48 | 1.95 | 0.26 | 0.16 | 394 | 311 | 42 | 25 |
| Indicated | 31.0 | 2.69 | 2.16 | 0.30 | 0.16 | 833 | 668 | 93 | 49 |
| Measured + Indicated | 46.8 | 2.62 | 2.09 | 0.29 | 0.16 | 1,227 | 979 | 134 | 74 |
| Inferred | 11.3 | 2.59 | 2.08 | 0.28 | 0.15 | 293 | 235 | 32 | 17 |
Notes:
| ● | Table 11-11 reports the Mineral Resources for the massive sulfide and ultramafic mineralization types. |
| ● | Mineral Resources are reported exclusive of Mineral Reserves. |
| ● | Mineral Resources are reported showing only the LZM-attributable tonnage portion, which is 69.713% of the total. |
| ● | Cut-off applies to NiEq24, which is derived using a nickel price of USD 9.50/lb, copper price of USD 4.50/lb, and cobalt price of USD 23.00/lb with allowances for recoveries, payability, deductions, transport, and royalties. |
| ● | NiEq24 formulae are: MSSX NiEq24 = Ni + (Cu x 0.454) + (Co x 2.497) and UMAF NiEq24 = Ni + (Cu x 0.547) + (Co x 2.480) |
| ● | The point of reference for Mineral Resources is the point of feed into a concentrator. |
| ● | All Mineral Resources in the 2024MRU were assessed for reasonable prospects for eventual economic extraction by reporting only material above cut-off grades of: MSSX NiEq24>0.73% and UMAF NiEq24>0.77% |
| ● | Totals may vary due to rounding. |
Page
|
/ / Initial Assessment - Technical Report Summary |
|
| 11.6.1 | Comparison to Previous Mineral Resource Estimates – All Mineralization Types |
The following comparison relates to the LZM-attributable component of the estimates.
Comparison of the previous Mineral Resource estimate (which was effective as at November 30, 2023) to the updated December 2024 Mineral Resource estimate (detailed in Table 11-8 shows an increase of 3.3 Mt (+7% relative) in Measured + Indicated (Table 11-12). The additional Measured + Indicated tonnage is associated with an increase in grade (+2% relative NiEq24%), making more metal available to the mine planning process (+9% NiEq24 metal) (Table 11-13).
There is a decrease of 6.2 Mt (–35%) in the Inferred category, (Table 11-12).
Upgrade of Measured and Indicated classification is evident, with an overall total (LZM-attributable) of 46.8 Mt of Measured + Indicated reported in December 2024, versus 43.6 Mt Measured + Indicated in the previous estimates (7% tonnage increase).
These outcomes are the product of significant emphasis in the 2024 work on ‘tightening’ the interpretation throughout the entire Project area. This tightening has been achieved through:
| ● | The development of a sedimentary host strata model. The host sedimentary stratigraphy comprises a reliably predictable sequence of known strata on a whole-Project scale that is very well supported by the drillhole logging database. The robust strata model helps to guide and control the interpreted extent and shape of the later intrusives. |
| ● | A full and comprehensive reinterpretation of the mineralization in all mineralized zones. |
| ● | Smaller subcelling along the boundaries of the mineralized units (MSSX and UMIN), forcing tighter constraint of the volumes within these domains (note: ‘UMIN’ is the domain field name in the cell model and drillhole files to denote the presence or absence of ultramafic mineralization (which is abbreviated to ‘UMAF’ or ‘UMAF_1a’ throughout this report). |
| ● | Re-evaluation of classification considerations in light of the more robust geological and mineralogical interpretation. |
Changes to the NiEq formulae and increases in the cut-off grades have slightly reduced the quantities that report through to all categories of Mineral Resource. The revised NiEq24 formulae and cut-off grades account for a loss of only 0.6% of the metal in Measured + Indicated, and 0.66% loss of NiEq24 metal overall.
Page
|
/ / Initial Assessment - Technical Report Summary |
|
Table 11-12: Kabanga Mineral Resource Estimates Comparison – Tonnes and Grades
| Mineral Resource Classification |
LZM Tonnage (Mt) |
Grades (%) | |||
| NiEq24 | Ni | Cu | Co | ||
| December 2024 – Massive Sulfide plus Ultramafic | |||||
| Measured | 15.9 | 2.48 | 1.95 | 0.26 | 0.16 |
| Indicated | 31.0 | 2.69 | 2.16 | 0.30 | 0.16 |
| Measured + Indicated | 46.8 | 2.62 | 2.09 | 0.29 | 0.16 |
| Inferred | 11.3 | 2.59 | 2.08 | 0.28 | 0.15 |
| November 2023 – Massive Sulfide plus Ultramafic | |||||
| Measured | 14.1 | 2.61 | 2.03 | 0.28 | 0.17 |
| Indicated | 29.5 | 2.55 | 2.02 | 0.28 | 0.15 |
| Measured + Indicated | 43.6 | 2.57 | 2.02 | 0.28 | 0.16 |
| Inferred | 17.5 | 2.79 | 2.23 | 0.31 | 0.16 |
| ABSOLUTE DIFFERENCE (Dec’24 minus Nov’23) | |||||
| Measured | 1.8 | –0.14 | –0.08 | –0.02 | –0.01 |
| Indicated | 1.4 | 0.14 | 0.14 | 0.02 | 0.01 |
| Measured + Indicated | 3.3 | 0.05 | 0.07 | 0.01 | 0.00 |
| Inferred | –6.2 | –0.20 | –0.16 | –0.03 | 0.00 |
Notes:
| ● | Table 11-12 reports the Mineral Resources for the combined massive sulfide and ultramafic mineralization types. |
| ● | Mineral Resources are reported showing only the LZM-attributable tonnage portion, which is 69.713% of the total. |
| ● | Totals may vary due to rounding. |
The key differences between the penultimate and the current Mineral Resource estimates are (a) the increase in Measured and Indicated tonnages in 2024, which is associated with an increase in grade, and (b) the reduction in Inferred Mineral Resource (tonnage and grade) in 2024. These outcomes are the product of significant emphasis on ‘tightening’ the interpretation throughout the entire Project area.
Page
|
/ / Initial Assessment - Technical Report Summary |
|
Table 11-13: Kabanga Mineral Resource Estimates Comparison – Contained Metals
| Mineral Resource Classification |
LZM Tonnage (Mt) |
Contained Metals (kt) | |||
| Nickel Equiv. |
Nickel | Copper | Cobalt | ||
| December 2024 – Massive Sulfide plus Ultramafic | |||||
| Measured | 15.9 | 394 | 311 | 42 | 25 |
| Indicated | 31.0 | 833 | 668 | 93 | 49 |
| Measured + Indicated | 46.8 | 1,227 | 979 | 134 | 74 |
| Inferred | 11.3 | 293 | 235 | 32 | 17 |
| November 2023 – Massive Sulfide plus Ultramafic | |||||
| Measured | 14.1 | 368 | 286 | 39 | 24 |
| Indicated | 29.5 | 753 | 595 | 83 | 45 |
| Measured + Indicated | 43.6 | 1,121 | 881 | 122 | 69 |
| Inferred | 17.5 | 489 | 391 | 54 | 27 |
| ABSOLUTE DIFFERENCE (Dec’24 minus Nov’23) | |||||
| Measured | 1.8 | 26 | 25 | 2 | 2 |
| Indicated | 1.4 | 81 | 73 | 10 | 4 |
| Measured + Indicated | 3.3 | 106 | 98 | 12 | 6 |
| Inferred | –6.2 | –196 | –156 | –22 | –10 |
| PERCENTAGE DIFFERENCE (Dec’24 minus Nov’23/ Nov’23) | |||||
| Measured | 13% | 7% | 9% | 6% | 6% |
| Indicated | 5% | 11% | 12% | 12% | 9% |
| Measured + Indicated | 7% | 9% | 11% | 10% | 8% |
| Inferred | –35% | –40% | –40% | –41% | –37% |
Notes:
| ● | Table 11-13 reports the Mineral Resources for the combined massive sulfide and ultramafic mineralization types. |
| ● | Mineral Resources are reported showing only the LZM-attributable tonnage portion, which is 69.713% of the total. |
| ● | Totals may vary due to rounding. |
| 11.7 | Mineral Resource Risks and Opportunities |
| 11.7.1 | Specific Identified Risks |
Risk factors that could materially impact the Mineral Resource estimates and cost/revenue assumptions, and therefore the reporting cut-off grade include:
| ● | Metal price and exchange rate assumptions. |
| ● | Changes in the interpretations of mineralization geometry and continuity of mineralized zones as additional information becomes available. |
| ● | Changes to geotechnical, mining, and metallurgical recovery assumptions. |
| ● | Changes to the assumptions related to the continued ability to access the site, retain mineral and surface right titles, maintain environment and other regulatory permits, and maintain the license to operate. |
Page
|
/ / Initial Assessment - Technical Report Summary |
|
The classification of the estimate of Mineral Resources may be materially affected by environmental, permitting, legal, title, taxation, socio-political, marketing, or other relevant issues. At present there are no known environmental, permitting, legal, title, taxation, socio-economic, marketing, or political issues that would adversely affect the Project Mineral Resource estimates presented in this TRS. However, Mineral Resources, which are not Mineral Reserves, do not have demonstrated economic viability. There is no assurance that the Project will be successful in obtaining any or all of the requisite consents, permits or approvals, regulatory or otherwise, for the Project.
| 11.7.2 | Mineral Resource Opportunities |
In terms of discovery, the mineralization has not yet been closed off between the North and Tembo zones, and between the Tembo and Safari zones. There remains opportunity to identify extensions of the mineralization in these areas and at depth. Regional targets, including the Exploration Targets discussed in Section 7.6, also provide opportunities for potential additional mineralization.
| 11.8 | QP Opinion |
| 11.8.1 | Opinion – Geology and Mineral Resources |
The Mineral Resource estimates in the IA TRS are based on resource modeling completed in 2024. The QP has prepared the updated modeling and reviewed supplied data and considers the estimates to be acceptable.
Mineral Resource estimates in the IA TRS are reported in accordance with subpart 1300 of U.S. Regulation S-K subpart 1300 rules for Property Disclosures for Mining Registrants (S-K 1300).
The IA TRS Mineral Resource estimates are shown to meet reasonable prospects for eventual economic extraction through an IA prepared by DRA’s QP. The IA has been prepared to demonstrate reasonable prospects of economic extraction, not the economic viability of the Mineral Resource estimates. The IA is preliminary in nature, it includes Inferred Mineral Resources that are considered too speculative geologically to have modifying factors applied to them that would enable them to be categorized as Mineral Reserves, and there is no certainty that this economic assessment will be realized.
| 11.8.2 | QP Opinion – Other |
A variety of factors may affect the MRE, including, but not limited to: changes in nickel price assumptions; re-interpretation of the geology; geometry and continuity of mineralized zones; updates to mining and metallurgical recovery factors; and results from future infill or step-out drilling campaigns.
The QP concludes that all material technical and economic factors that could reasonably be expected to affect the prospect of economic extraction have been identified, and that any outstanding matters can be addressed through additional technical work during subsequent study phases.
There is no Mineral Reserve estimate for the Project. An IA was completed, including Mineral Resource classified as Inferred.
The SEC defines an Initial Assessment as “a preliminary technical and economic study of the economic potential of all or parts of mineralization to support the disclosure of mineral resources. The Initial Assessment must be prepared by a qualified person and must include appropriate assessments of reasonably assumed technical and economic factors, together with any other relevant operational factors that are necessary to demonstrate, at the time of reporting, that there are reasonable prospects for economic extraction. An Initial Assessment is required for disclosure of mineral resources but cannot be used as the basis for disclosure of mineral reserves.”
Page
|
/ / Initial Assessment - Technical Report Summary |
|
| 13.1 | Summary |
The current IA conceptual mine plan has been prepared using the 2024MRU. The total planned production for the IA case is 68 Mt at 1.93% Ni, 0.26% Cu and 0.14% Co. The Mineral Resource assumes production from the North and Kima, Tembo, Main, and MNB zones. The relative locations of the zones are shown in Figure 13-1. The proposed mining method for all zones is longhole stoping with paste backfill. Following four years of construction and ramp-up, steady-state production at 3.4 Mtpa will be achieved in Year 4 and is expected to continue to Year 19, after which there is a three-year ramp-down period.
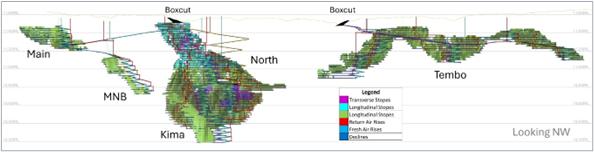
Figure 13-1: Long-section of the Resource Case Mine Design
In the proposed mine design, North and Tembo are each accessed from declines at the surface. North Mine includes a second decline for the majority of the depth of the mineralization; lower North zone is accessed by a single decline only. This second decline assists in traffic management by allowing one-way travel from the surface and back. Kima zone is located at the lower portion of the North Mine and utilizes access from the North decline and hanging wall drives. Main Mine is accessed via a decline from North, with MNB accessed from the lower portion of Main, capitalizing on the infrastructure required to access Main. Potential mill feed from each mine is shown in Table 13-1. The proportions of the potential mill feed by zone are shown in Table 13-2.
Table 13-1: Potential Mill Feed
| Mine | Tonnes (kt) | Ni (%) | Cu (%) | Co (%) |
| North + Kima | 44,288 | 2.17 | 0.29 | 0.15 |
| Tembo | 16,884 | 1.57 | 0.22 | 0.13 |
| Main + MNB | 6,777 | 1.26 | 0.18 | 0.10 |
| Total | 67,950 | 1.93 | 0.26 | 0.14 |
Table 13-2: Potential Mill Feed Proportion by Zone
| Proportion of Mill Feed | % | kt |
| North + Kima | 65% | 44,288 |
| Tembo | 25% | 16,884 |
| Main + MNB | 10% | 6,777 |
| Total | 100% | 67,950 |
Page
|
/ / Initial Assessment - Technical Report Summary |
|
| 13.2 | Mine Geotechnical |
A geotechnical assessment (MGT, 2024) has been carried out with the view to provide geotechnical parameters for preliminary mine designs at the Project.
| 13.2.1 | Ground Support |
Ground support scheme requirements were derived from:
| ● | Empirical rock mass quality assessment, based on geotechnical core logging. |
| ● | Kinematic analysis using minor structural sets, joint conditions assigned based on geotechnical domain from geotechnical rock mass logging. |
| ● | Numerical modeling, to investigate mining depth where there is a step change in the stress/strength ratio. |
A ground support scheme has been recommended for each profile and broken into four depth ranges (below surface), to account for the different weathering and impact of stress at depth as the mine develops. Table 13-3 summarizes the ground support scheme elements used in the mine design for the proposed Mine.
Table 13-3: Details of Ground Support Scheme Elements Used
| Ground Support Scheme Element | Description |
| Weld Mesh | Australian standard - 5.6 mm diameter galvanised weld mesh – 100 mm*100 mm, 2.4 m W*4.5 m L |
| Fibrecrete | Australian standard - fibre-reinforced, 50 mm thick. |
| Friction Stabilizer | 47 mm diameter Friction Stabiliser (Spilt Set) - length as indicated. Standard accessories: 300*280 mm Combi domed Plate |
| Solid Rebar Resin Bolt | Length as indicated. Standard accessories: Resin cartridge Med/Slow set resin with 300*280 mm Combi domed plate |
| Friction Stabilizer - Stubby | 39 mm diameter, 0.9 m Friction Stabiliser (Stubby). Standard accessories - 150*150 mm domed plate - for insert into 47 mm FS as required |
| Friction Stabilizer - Chubby | 47 mm diameter, 0.9 m Friction Stabiliser (Chubby). Standard Accessories: 300*280 mm Combi domed plate - for pinning mesh as required |
| Cable - Production Drives | 17.8 mm Single Plain Strand Cable - 6.3 m long. Standard Accessories: 300*300*12 mm Plate and barrel and wedge |
| Cable - Intersections | 15.2 mm Twin-Strand, Bulbed Cable - 6.3 m long. Standard Accessories: 300 mm*300 mm*12 mm Plate, barrel and wedge for both strands. |
| 13.2.2 | Stress Environment |
The in-situ stress environment at Kabanga was examined through two approaches. An initial desktop study was conducted to support early geotechnical analysis for mine planning, and the second approach includes Acoustic Emission (AE) stress measurements on core samples. The main geotechnical analysis is based on the AE stress measurements on core samples, which were carried out by the Western Australian School of Mines (WASM) at Curtin University. These samples, comprising three samples for the Tembo Mine and one sample for the North Mine, were selected onsite and sent to the laboratory in Kalgoorlie, Western Australia.
Page
|
/ / Initial Assessment - Technical Report Summary |
|
Reviewing these results against the WASM dataset (Figure 13-2) indicates that the Kabanga stress environment is lower than many other mines.
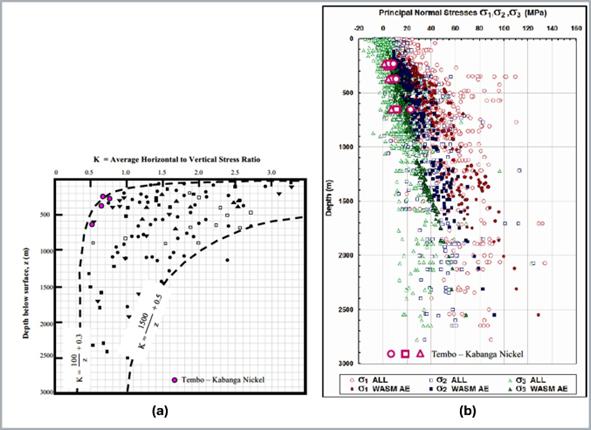
Figure 13-2: Kabanga AE Measurement Results Compared to WASM Dataset (a) Ratio of average horizontal to vertical stress (b) Principal stress magnitude chart comparison
| 13.2.3 | Material Strength Testwork |
Laboratory testing was completed on rock samples with the objective of achieving a spatial and statistical representation of each of the geotechnical domains across the project area. The collated data set includes 197 single-stage Hoek Triaxial tests and 68 Brazilian tests. The following objectives were achieved:
| ● | Target samples to investigate intact material strength of stratigraphy units, intrusives and mineralization. |
| ● | Target samples to investigate the strength of the foliation in the stratigraphy units. |
| ● | Sample and test similar units at North to determine whether results are within the same data population. |
The resulting intact material strength properties are summarized in Table 13-4.
Page
|
/ / Initial Assessment - Technical Report Summary |
|
Table 13-4: Material Strength Results from Laboratory Testing
| Geotechnical Design Domain | Total No. of HTRX Tests | No. of Valid HTRX | Average
Density (t/m3) |
Std Dev Density | Ave Valid Modulus | Std Dev Modulus (MPa) | UCSci Intact Rock Strength (MPa) | UCSci Intact Rock Strength Std Dev | Average Tensile (MPa) | Hoek-Brown (mi) | Cohesion (MPa) | Friction Angle (°) |
| BNPU | 13 | 13 | 2.85 | 0.09 | 25609 | 5495 | 98 | 10.9 | -11.9 | 11 | 12.4 | 37.4 |
| LRPU | 52 | 46 | 2.79 | 0.07 | 17593 | 95 | 12.5 | -9.9 | 10 | 9.5 | 33.8 | |
| MSSX | 11 | 7 | 4.45 | 0.55 | 23706 | 8100 | 78 | 10.7 | -13.3 | 10 | - | - |
| UMAF_1a | 6 | 6 | 4.07 | 0.63 | 27123 | 7706 | 80 | 9.3 | -12.3 | 11 | - | - |
| Intrusive | 31 | 23.00 | 2.89 | 0.08 | 18148 | 98 | 17.5 | -12.0 | 10 | - | - |
Notes:
| ● | HTRX | = Hoek Triaxial |
| ● | UCSci | derived or estimated value of the uniaxial compressive strength (UCS) based on regression analysis of multiple test datasets—specifically, triaxial compression tests and Brazilian tensile strength tests (indirect tensile strength), obtained as the y-intercept of a fitted line. |
| ● | mi | = A constant in the Hoek-Brown (H-B) criterion, a fundamental parameter required for determining the compressive strength of rock. |
Page
|
/ / Initial Assessment - Technical Report Summary |
|
| 13.2.4 | Structural Setting |
The major fault structural model was developed by Golder in 2009. The model was reviewed by MineGeoTech using 2022–23 diamond drilling to identify drillhole intercepts and, where possible, inspect core photos, rock mass quality and structural logging to verify characterization and extent of the individual fault wireframes.
This review validated the Golder model with recent drilling and confirmed the appropriateness of use for the study. These outcomes enabled identification of which major faults warranted inclusion in three-dimensional numerical modeling.
| 13.2.5 | Stope Spans |
Stable unsupported stope spans for both North Mine and Tembo Mine were determined using Mathew’s empirical methodology. North mine was separated into six depth ranges. Four mining horizons were provided based on similar stope design geometry, with the fourth zone further segmented to investigate sensitivity of stress at depth. The results are summarized in Table 13-5.
Table 13-5: North Mine Unsupported Stope Span Configuration
| Depth Ranges | Depth From and to (mBS) | Weathering zone | Mean Q’ | ||
| Single/Double Option | Strike (m) | width (m) | |||
| Depth 1 | 0 to 125 mBS | Fresh | single | 55 | 20 |
| double | 28 | 20 | |||
| Depth 2 | 125 m to 225 mBS | Fresh | single | 55 | 20 |
| double | 28 | 20 | |||
| Depth 3 | 225 m to 350 mBS | Fresh | single | 47 | 20 |
| double | 26 | 20 | |||
| Depth 4 | 350 m to 600 mBS | Fresh | single | 50 | 20 |
| double | 28 | 20 | |||
| Depth 5 | 600 m to 1,000 mBS | Fresh | single only | 35 | 20 |
| Depth 6 | 1,000 m to 1,350 mBS | Fresh | single only | 20 | 20 |
Notes:
| ● | mBS meters below surface |
| ● | Q’ is a modified version of the Q-System rock mass classification that excludes the Stress Reduction Factor (SRF) during logging and represents the rock mass quality based on core logging before stress conditions are considered. |
Tembo Mine has been divided into three depth ranges. Only a single dip direction was used for each wall; no sensitivity to change of orientation was undertaken for this work. Results are summarized in Table 13-6 Main Mine unsupported stope span recommendations for the mean are presented in Table 13-7.
Page
|
/ / Initial Assessment - Technical Report Summary |
|
Table 13-6: Tembo Mine Unsupported Stope Span Configuration
| Depth Ranges | Weathering Zone | Mean Q’ | ||
| Single/Double Option | Strike (m) | Width (m) | ||
| Depth 1 | Fresh | single | 60 | 20 |
| double | 40 | 20 | ||
| Depth 2 | Fresh | single | 60 | 20 |
| double | 50 | 20 | ||
| Depth 3 | Fresh | single | 60 | 20 |
| double | 38 | 20 | ||
Note: Q’ is a modified version of the Q-System rock mass classification that excludes the Stress Reduction Factor (SRF) during logging and represents the rock mass quality based on core logging before stress conditions are considered.
Spans were derived considering results from all the Geotechnical Design Domains. Both single (25 m) and double (50 m) lifts were assessed, however not all depths and rock mass quality supported a double lift option.
Table 13-7: Main Mine Unsupported Stope Span Recommendations
| Depth Ranges | Weathering Zone | Mean Q’ | ||
| Single/Double Option | Strike (m) | Width (m) | ||
| Depth 1 | Transitional | single only | 20 | 20 |
| Fresh | single | 33 | 20 | |
| double | 21 | 20 | ||
| Depth 2 | Fresh | single | 23 | 20 |
| double | n/a | n/a | ||
| Depth 3 | Fresh | single | 28 | 20 |
| double | 19 | 20 | ||
Note: Q’ is a modified version of the Q-System rock mass classification that excludes the Stress Reduction Factor (SRF) during logging and represents the rock mass quality based on core logging before stress conditions are considered.
| 13.2.6 | Vertical Development |
An empirical assessment was completed to determine possible stable unsupported diameters in the LRPU unit.
To provide guidance to enable mine design and budgeting, a range of possible diameters were investigated with this empirical method using variations of the rock mass quality. For this, the mean and the 10th, 25th, 75th, and 90th percentile Q’ values for the LRPU unit for each mine were assessed.
The results indicate that a 5 m to 5.5 m diameter raisebore is possible in the LRPU unit.
| 13.2.7 | Numerical Modeling |
Three-dimensional finite element modeling was conducted for the proposed North and Tembo mines to assess global stability based on rock mass quality, material strength, faults, and foliation, using the planned mine geometry and extraction sequence. The models included annually sequenced development and stoping voids over 20 stages, with geologically defined wireframes.
Page
|
/ / Initial Assessment - Technical Report Summary |
|
Numerical modeling shows the North Mine may experience localized stope and development damage, foliation slip, and potential fault slip, all manageable with appropriate ground support and monitoring. Tembo Mine is more stable, with minor development issues and expected foliation and fault slip, also manageable with planned support measures. Stress increases with depth at both sites but are accounted for in current designs and are within expectations that have already been incorporated into mine planning dilution assumptions.
| 13.3 | Hydrogeology |
Water inflow values used to determine the mine’s dewatering requirements were sourced from WSP (SA)’s Preliminary Water and Salt Balance Report (41104544-REP-00015_ WSP(SA), September 2024). This information was supplemented with later information as inflow models were updated. Groundwater ingress to the underground mine is expected to be relatively low due to the low permeability of the surrounding rock, and it is not considered a ‘wet mine’.
Figure 13-3 describes the expected groundwater ingress for both mines. North Mine is expected to reach a maximum ingress of 78 L/s over a 24-hour period. Tembo Mine is expected to reach a maximum ingress of 28 L/s for the same period, with a total mine inflow of 96 L/s.
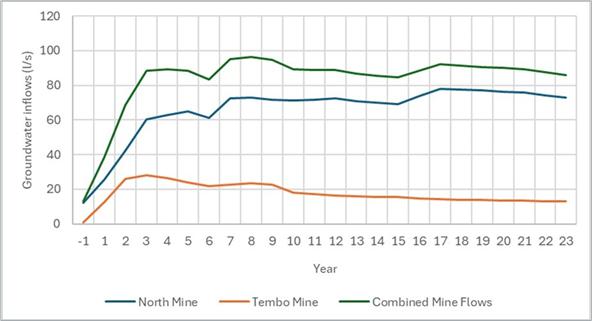
Figure 13-3: North Mine and Tembo Mine Groundwater Ingress
Mine service water is calculated at 0.4 m3 per tonne of production. The water balance for both mines, along with the daily flows per underground pump stations have been designed to account for the inflows indicated by the hydrogeology study, with additional capacity built into the underground dewatering network to ensure any excess rainfalls or inflows can be managed.
| 13.4 | Mining Design |
| 13.4.1 | Stope Optimization |
Assumptions used to calculate the Net Sales Return (NSR) of each block in the 2024 Mineral Resource Model and the stope optimization are summarized in Table 13-8.
Page
|
/ / Initial Assessment - Technical Report Summary |
|
Table 13-8: NSR and Stope Optimization Assumptions
| Parameter | Unit | Value | |
| Revenue | |||
| Nickel Price | USD/lb | 8.50 | |
| Copper Price | USD/lb | 4.24 | |
| Cobalt Price | USD/lb | 18.34 | |
| Concentrator Recovery | % | Formula | |
| Transport | USD/t Conc. (wet) | 209.75 | |
| Royalties | % | 7.30 | |
| Costs | MSSX | UMIN | |
| Mining | USD/t | 53.20 | 53.20 |
| Processing | USD/t | 10.38 | 11.69 |
| G&A | USD/t | 8.18 | 8.18 |
| TSF | USD/t | 2.21 | 2.21 |
| Surface Infrastructure | USD/t | 1.60 | 1.60 |
| Total Costs | USD/t | 75.57 | 76.89 |
| Cut-off | MSSX | UMIN | |
| NSR | USD/t | 75.57 | 76.89 |
| NiEq | % | 0.90 | 0.95 |
The NSR break-even cut-off (BECO) value was determined for MSSX and UMIN as USD 75.57/t feed and USD 76.89/t feed respectively. In NiEq terms, the BECO value for MSSX and UMIN is 0.90% and 0.95%, respectively.
An elevated cut-off value was applied to each zone to improve payback and improve the project economics. The NSR cut-off applied to each zone is USD 170/t at North (upper), USD 100/t at North (lower), Kima, and Tembo, and USD 85/t at Main and MNB. These cut-off values are shown Figure 13-4.
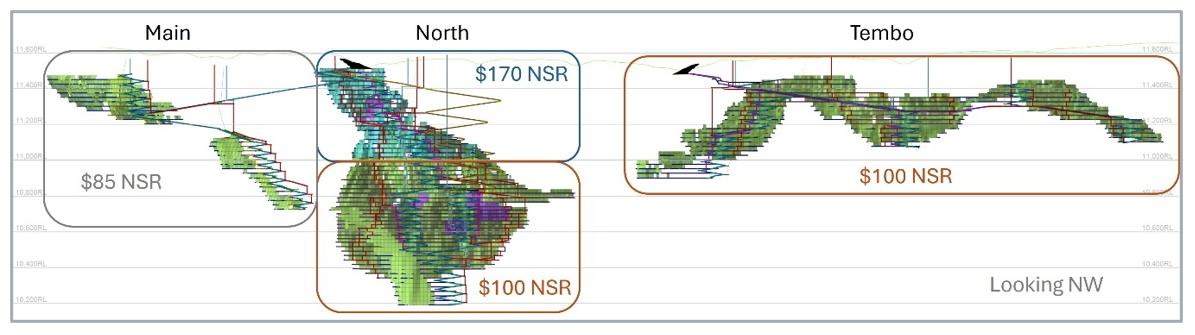
Note: 1) North upper and North lower are differentiated at approximately 600 mBS.
Figure 13-4: Stope Optimizer NSR Cut-off Grade by Zone
Deswik Stope Optimizer was used to generate the stope shapes for the mine design. All stopes used six-point resolution, controlled by mineralization wireframes, and have a 45° maximum change between adjacent stopes. The stope parameters are summarized by mining areas in Table 13-9.
Page
|
/ / Initial Assessment - Technical Report Summary |
|
Table 13-9: Stope Parameters
| Parameter | Unit | North Upper | North Lower/ Kima |
Tembo | Main / MNB |
| Stope Strike | m | 30 | 20 | 30 | 20 |
| Minimum Stope Width | m | 3 | 3 | 3 | 3 |
| Minimum Pillar Length | m | 8 | 8 | 8 | 8 |
| Stope Height (floor to floor) | m | 25 | 20–25 | 25 | 25 |
| HW and FW minimum angle | degrees | 45 | 45 | 45 | 45 |
| 13.4.2 | Mining Method |
Several underground mining methods were evaluated, longhole stoping with paste backfill was ultimately chosen due to its suitability for the mineralized area’s geometry and dip, as well as its advantages in selectivity, operational flexibility, and recovery. Level spacing is typically 25 m floor-to-floor, except for a section at North Mine where the mineralized area dip is flatter and level spacing has been reduced to 20 m. A combination of top-down and bottom-up sequencing is used at micro and macro levels, with the preference leaning towards the top-down center-out sequence due to its favorable geotechnical characteristics. Stope strike lengths will vary between 20 m and 30 m, depending on depth and mineralization thickness. Most stopes are to be extracted via longitudinal retreat stoping, except in thicker mineralized areas at North Mine, where transverse retreat stoping from hanging wall drives will be implemented. Figure 13-5 illustrated a typical mine design for the North Mine, and Figure 13-6 illustrated longitudinal and transverse stoping at the North Mine.
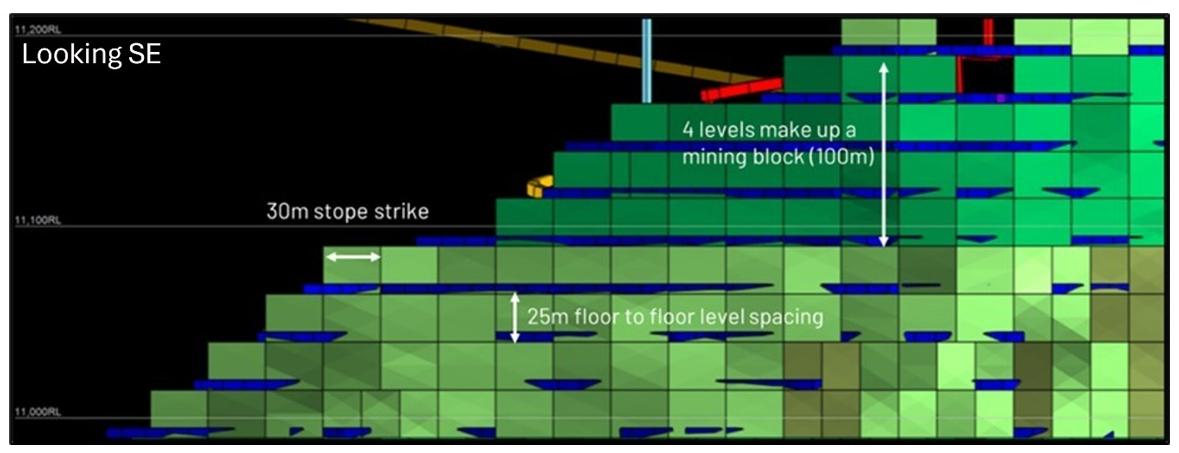
Figure 13-5: Typical Mine Design at North Mine
Page
|
/ / Initial Assessment - Technical Report Summary |
|

Figure 13-6: Longitudinal and Transverse Stoping at North (Oblique 3D)
| 13.4.3 | Development |
Development profiles are summarized in Table 13-10. Drift dimensions were dictated by ventilation requirements in conjunction with minimum clearances required for the selected mobile mining equipment. Typical layouts for stoping levels are shown in Figure 13-7 and Figure 13-8 for the North and Tembo mines, respectively.
Table 13-10: Typical Development Profiles
| Development Type | Design Size (meters width x meters height) |
| Decline | 5.5 x 5.8 |
| Trucking Decline | 5.5 x 5.8 |
| Access | 5.5 x 5.5 |
| Vent drives | 5.5 x 5.5 |
| Pump stations | 5.5 x 6.0 |
| Footwall drives | 5.0 x 5.5 |
| Escapeway drives | 4.5 x 4.5 |
| Cross-Cut drives | 5.0 x 5.0 |
| FAR access drives | 5.0 x 5.0 |
| Secondary RAR drives | 4.5 x 4.5 |
| Infra drive (paste cuddy) | 5.0 x 5.0 |
| UG magazine | 5.0 x 5.0 |
| Production Drives | 5.0 x 5.0 |
| Stockpiles | 5.0 x 6.0 |
| Sumps | 4.5 x 5.0 |
| Decline Passing bays | 10.0 x 5.8 |
Page
|
/ / Initial Assessment - Technical Report Summary |
|
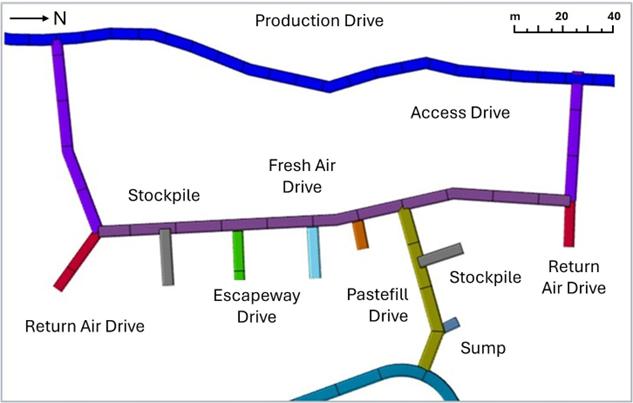
Figure 13-7: Typical Level Plan – North Mine
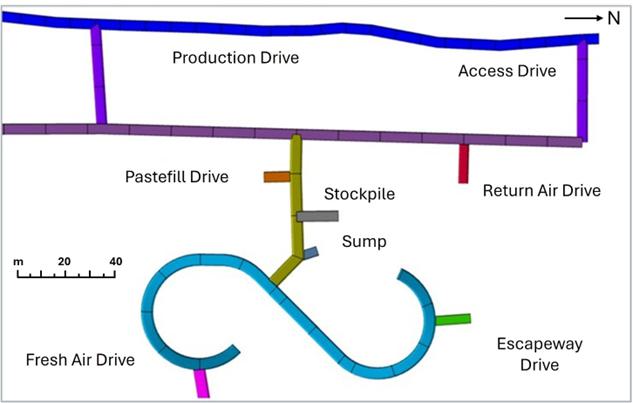
Figure 13-8: Typical Level Plan – Tembo Mine
Page
|
/ / Initial Assessment - Technical Report Summary |
|
| 13.4.4 | Dilution and Recovery |
External (or unplanned) dilution has been included in the stoping as an overbreak allowance. This is included as a total amount of overbreak and varies based on the width and height of the stopes. The external dilution at North and Kima zones averages 9.8% of tonnes, at Tembo 10.0%, and at Main and MNB 10.8%. The average expected external dilution for the Project is 9.9%.
Several dilution figures were applied to the stopes at North Mine and Main Mine given that the geometry changes much more compared with Tembo Mine (all Tembo stopes have an allowance for 10% unplanned dilution). Table 13-11 summarizes the unplanned dilution values applied to the North and Main stopes in Deswik based on stope dip and width.
Table 13-11: Unplanned Dilution Values Applied to North and Main Stopes
| Stope Geometry | Stope Dilution (%) | ||||
| Lower North and Main | 0–8 m | 8–12.5 m | 12.5–17 m | 17–21 m | 21 m+ |
| Hanging wall Dip 60°+ | 13% | 9% | 8% | 6% | 6% |
| Hanging wall Dip 45°-60⁰ | 18% | 13% | 10% | 8% | 7% |
| Hanging wall Dip 30°-45⁰ | 27% | 19% | 14% | 12% | 10% |
As a result of the dip and geometry of the mineralized zones, there is some internal dilution within the Stope Optimizer shapes generated in Deswik, which can be referred to as ‘planned dilution’. This planned dilution at North and Kima mines is 18.1%, at Tembo 16.1%, and at Main and MNB 19.4%. and the average project planned dilution is 17.7%.
All stopes have an assumed mining recovery of 90%.
| 13.4.5 | Scheduling |
The proposed production schedule has been designed to follow geotechnical guidelines, maintain safe and efficient mining rates, and ensure a consistent feed of 3.4 Mtpa to the processing plant. To minimize the risk of mineralized material oxidation, stockpiles are kept to a minimum during normal operation.
The scheduling of both mine development (such as tunnel creation) and mineralized material extraction (stoping) was built using planning tools in Deswik software. Schedule productivity rates are summarized in Table 13-12 and Table 13-13. Vertical development activities are scheduled at rates between 2 m/d and 3 m/d depending on the type and size.
Table 13-12: Lateral Development Productivity Rates
| Lateral Development Description | Single Heading Rate (m/month) |
| Access Drive | 90 |
| Crosscut Drive | 90 |
| Decline | 120 |
| Footwall Drive | 90 |
| Production Drive | 60 |
To capture the range of difference stopes sizes and geometry (tonnage, dip and thickness), different stope activity rates have been used. These have been applied based on the stope tonnage and are summarized in Table 13-13 In the upper section of North Mine, where the stress environment is relatively low, it is planned that higher-value stopes will be mined preferentially.
Page
|
/ / Initial Assessment - Technical Report Summary |
|
Table 13-13: Stope Tonnage and Associated Productivity Rate
| Stope Tonnage | Bogging Rates (mined t/month) |
Backfill (m3/day) |
Production Drilling (m/day) |
| > 50,000 t | 40,000 | 1,000 | 240 |
| > 30,000 t | 30,000 | 1,000 | 240 |
| > 20,000 t | 22,000 | 850 | 200 |
| > 15,000 t | 18,000 | 750 | 180 |
| < 15,000 t | 15,000 | 750 | 180 |
| 13.4.6 | Mining Sequence |
This approach is advantageous because access to these areas is feasible while the processing plant is still under construction. Generally, the mining sequence will follow a top-down approach, with some localized bottom-up mining as needed to address specific operational requirements.
In the deeper sections of North Mine, the proposed mining sequence will be a conventional center-out sequence, as shown in Figure 13-9. Geotechnical modeling has indicated that this approach can be adapted based on favorable results, providing flexibility in the sequence.
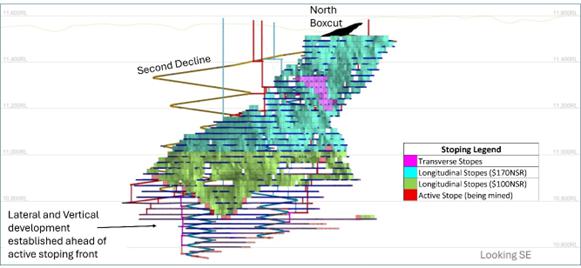
Figure 13-9: Schematic of North Mining Sequence
The planned Tembo Mine sequencing employs similar mining principles, utilizing a center-out approach combined with top-down mining where feasible. Due to the extensive three-kilometer strike length of the Tembo mineralized zone, multiple mining fronts will be established, allowing efficient management across the strike. Higher-value stopes will be accessed and mined early to leverage their availability. Notably, Tembo Mine’s operations would commence seven months after those at North Mine. Since the Tembo mineralized zone does not extend below a depth of 700 m, sequence-induced damage is not anticipated. The sequence of mine development for Tembo is illustrated in Figure 13-10.
Page
|
/ / Initial Assessment - Technical Report Summary |
|

Figure 13-10: Schematic of Tembo Mining Sequence
The planned access for Main and MNB will be via a decline that will be mined off the North decline in the later years of the mine life. Appropriate ventilation and escapeways will be established that service both Main and MNB. The mining sequence at Main and MNB will follow a mostly top-down echelon retreat with longitudinal stopes exclusively.
| 13.4.7 | Equipment |
It is proposed that an experienced mining contractor is engaged for the initial five years, and would be responsible for the procuring, operating and maintaining of all underground equipment.
Conventional trucking is the proposed method of haulage from underground, with the haulage analysis completed based on defined assumptions. Fleet hours were used to estimate equipment requirements and cumulative usage, supporting maintenance, rebuilding, and replacement planning and these were finalized by checking mine physicals.
Drill numbers were based on scheduled development and advance rates. Equipment estimates for the proposed mine life and the first five years were aligned with contractor estimates. Equipment quantities were rounded up with an extra unit added for availability, and replacement schedules were derived from equipment life.
The anticipated mobile equipment list, along with average and peak requirements, is shown in Table 13-14.
Table 13-14: Mobile Equipment List
| Description | Example | Max Qty. |
| Production Drill | CAT Raptor 7X | 9 |
| Development Jumbo | CAT Troidon 66XL | 12 |
| Large LHD | CAT R2900XE | 17 |
| Underground Truck | CAT AD63 | 24 |
| Charge Rig | Epiroc AARD UV100 | 5 |
Page
|
/ / Initial Assessment - Technical Report Summary |
|
| Description | Example | Max Qty. |
| Spraymec | Normet SF 050 D | 3 |
| Agi | Normet LF 700 | 4 |
| ITC Medium | CAT 930 | 6 |
| ITC Large | CAT 962 | 4 |
| Grader | CAT 140 | 3 |
| Workshop Telehandler | Kanu Equipment Kemach 50H130 | 3 |
| Workshop Forklift | Kanu Equipment Kemach D3.5 | 3 |
| Utility / Delivery Truck | Epiroc AARD UV100 | 3 |
| LV (Light Vehicle) | Toyota Landcruiser 79 Double Cab | 37 |
| Camp Transit Bus | Toyota Coaster Bus | 6 |
| 13.5 | Backfill |
| 13.5.1 | Backfill Demand |
The anticipated annual backfill requirement for each zone is summarized in Table 13-15, which contains the proposed LoM and average annual fill requirements during peak demand in cubic meters (m3). The annual demand in Table 13-15 has been used to evaluate the system requirements.
Table 13-15: Kabanga Backfill Requirements
| Mineralized area | Backfill Requirements (m3) | |
| Proposed LoM | Average Annual Design | |
| North/Kima | 9,939,502 | 480,000 |
| Tembo | 3,915,778 | 250,000 |
| Main/MNB | 1,579,238 | 234,000 |
| 13.5.2 | Testwork and Paste Recipe |
MineFill Services (MineFill) has conducted a testwork program, covering 41 tests based on various recipes and products made and available at Kabanga. Testwork included the use of:
| ● | Non-Pyrrhotite tailings (waste steam from the Concentrator) |
| ● | Crushed and screened waste rock from underground mining |
| ● | Refinery residues |
| ‒ | Iron Hydroxide |
| ‒ | Siliceous Residues |
| ‒ | Binder aid (salts) |
| ● | General Purpose (GP) Cement |
| ● | Tanzanian Low Heat (LH) cement |
The preliminary basis of design is to use Non-Pyrrhotite tails from the Kabanga Concentrator and waste rock from underground development, crushed and screened to <5 mm. This is to enable the use of a positive displacement paste pump to ensure all stopes can be backfilled. Backfill will be referred to as a PAF. The proposed PAF blend is a 55% non-pyrrhotite and 45% waste rock with LH cement. Testwork results indicate the strengths required for vertical and horizontal exposure are achieved using this proposed recipe.
Page
|
/ / Initial Assessment - Technical Report Summary |
|
| 13.5.3 | Reticulation |
Two PAF plants are proposed to be located on the surface, one at North Mine (servicing North, Kima, Main, MNB) and the other at Tembo Mine. The PAF plants would be required to mix non-pyrrhotite tailings, additional tailings for rheology control, crushed and screened waste rock and LH binder to produce 95 m3/h of PAF.
Surface boreholes will transport the PAF (via gravity and pumps where required) underground and into a main trunkline, which includes interlevel boreholes and level pipework, delivering the fill to the designated stoping levels.
Filling activities for the Main mineralized area would be undertaken through a 1.7 km overland pipe from the North PAF plant to a surface borehole located above the mineralization.
| 13.5.4 | Fill Strategy |
Two options are possible for the filling of stopes from underground. These are typically referred to as in-level filling and tight filling. Narrower stopes can adopt the in-level strategy as per Figure 13-11, whereas large stopes requiring tight-fill to manage span stability should adopt this option, as shown in Figure 13-12.
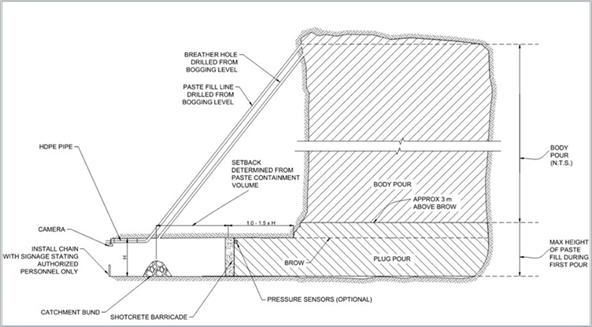
Figure 13-11: In-level Filling Arrangement
Page
|
/ / Initial Assessment - Technical Report Summary |
|
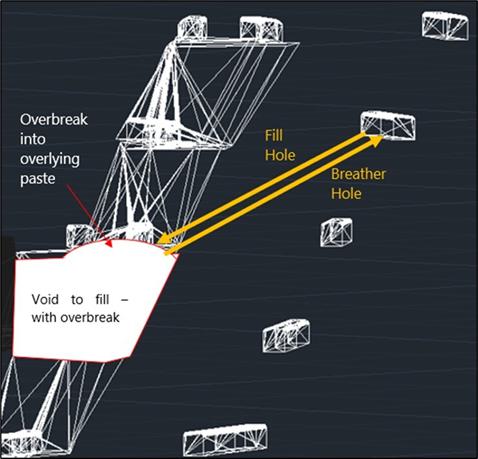
Figure 13-12: Typical Cross Section Showing the Proposed Tight Filling Strategy
| 13.6 | Ventilation |
Ventilation and cooling requirements have been estimated considering climatic conditions, mining depth, surrounding rock, diesel, and electrical equipment. Design criteria and production assumptions are then applied to estimate heat loads and ventilation requirements based on best practices that comply with Tanzanian legislation. Ventsim ventilation models were constructed to validate calculations.
The current work includes ventilation and heat load modeling to confirm the following points:
| ● | Workplace environmental conditions |
| ● | Positioning of intake and return raises |
| ● | Ventilation layout and controls |
| ● | Design and phase-in of the major ventilation and cooling infrastructure |
| ● | Capital estimates and profiles |
| 13.6.1 | Airflow Requirements |
The expected maximum airflow requirements were estimated for the proposed North/Kima, Tembo, and Main/MNB mines. Table 13-16 and Table 13-17 present the airflow requirements to meet and balance the air demand.
Page
|
/ / Initial Assessment - Technical Report Summary |
|
Table 13-16: Primary Fesh Air Estimates
| North/Kima Mine |
Volume kg/s |
Main/MNB Mine |
Volume kg/s |
Tembo Mine |
Volume kg/s |
| South decline * | 66 | Main Decline | 71 | South decline * | 194 |
| North decline ** | 68 | Main FAR1 | 162 | North decline ** | 4 |
| South FAR | 88 | Main FAR2 | 145 | South FAR | 311 |
| Central FAR | 427 | Escape raise | 15 | Central FAR | 363 |
| North FAR | 434 | ||||
| Total | 1,083 | Total | 391 | Total | 872 |
Notes:
| ● | FAR fresh air raise, RAR return air raise |
| ● | * Primary |
| ● | ** Secondary |
Table 13-17: Primary Return Air Estimates
| North/Kima Mine |
Volume kg/s |
Main /MNB Mine |
Volume kg/s |
Tembo Mine |
Volume kg/s |
| South RAR | 357 | Main RAR 1 | 393 | South RAR | 218 |
| North RAR 1 | 380 | Central RAR | 373 | ||
| North RAR 2 | 346 | North RAR | 281 | ||
| Total | 1,083 | Total | 393 | Total | 872 |
FAR and RAR locations are illustrated in Figure 13-13.
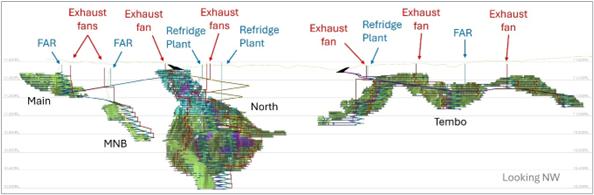
Figure 13-13: Ventilation Rise Locations
| 13.6.2 | Ventilation Infrastructure |
It is proposed to use Bifurcated Centrifugal and Axial fans, as summarized in Table 13-18. This will result in two primary fan stations at North, one at Main, and three at Tembo as a result of the extensive strike of the mineralized area at Tembo.
Page
|
/ / Initial Assessment - Technical Report Summary |
|
Table 13-18: Ventilation Infrastructure
| North Mine |
Operational Equipment |
Main Mine |
Operational Equipment |
Tembo Mine |
Operational Equipment |
| South Fan station | Bifurcation with 2 x centrifugal fans | Main Fan station | Bifurcation with 2 centrifugal fans | South Fan station | Bifurcation with 2 x Axial fans |
| North Fan station 1 | Bifurcation with 2 x centrifugal fans | Central Fan station | Bifurcation with 2 x Axial fans | ||
| North Fan station 2 | Bifurcation with 2 x centrifugal fans | North Fan station | Bifurcation with 2 x Axial fans | ||
| Central BAC | 5.0 MWc BAC | South BAC | 5.0 MWc BAC | ||
| North BAC | 5.0 MWc BAC |
Note: BAC = bulk air cooler
To manage temperatures underground, refrigeration plans are proposed at North, Kima and Tembo mines. The bulk air cooler (BAC) is supplied with chilled water from a refrigeration plant comprising refrigeration machines, condenser cooling towers (CCT), chilled water and CCT water circuits. The air-coolers are mechanical, induced-draft type air-coolers. Axial-flow fans draw air through each air-cooler and push the cooled air down the raises. Tembo Mine will require cooling from Year 5, and North Mine from Year 7.
| 13.6.3 | Secondary Ventilation |
All development ends would be force-ventilated using dual stage 110 kW fans (Clemcorp or similar dual stage fan).
The production level ends would be force-ventilated using dual stage dual speed 75 kW fans (Clemcorp or similar dual stage fan).
| 13.7 | Secondary Egress |
It is proposed that Kabanga implement the Safescape Escapeway System across all underground workings due to its proven global performance and numerous safety and operational advantages. The system is corrosion-resistant, quick to install with minimal excavation, and designed for enhanced stability, visibility, and ease of use. Its ergonomic, low-maintenance design includes a fall arrest system and allows for removal and reuse up to 100 m installations. It can be installed in various excavation types without the need for airleg bolting. An example of the system is shown in Figure 13-14, with the proposed escapeway raise locations shown in Figure 13-15 DRA has prepared designs for the underground infrastructure including pumping, mine services, workshops, electrical, explosives storage, and instrumentation and control, which have been used to inform pricing and schedule, which have been incorporated into the project studies.
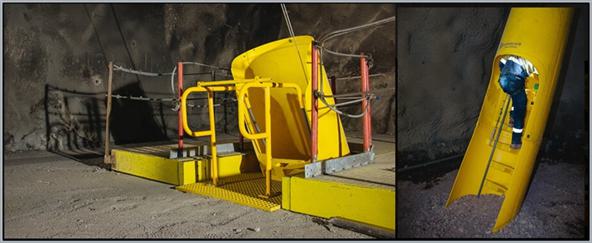
Figure 13-14: Example of Safescape Ladder System
Page
|
/ / Initial Assessment - Technical Report Summary |
|
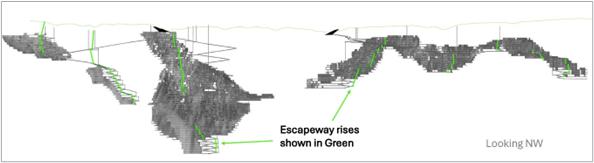
Figure 13-15: Escapeway Raise Locations
| 13.8 | Mining Underground Infrastructure |
| 13.9 | Mining Labor |
Workforce requirements have been estimated using the equipment fleet requirements as well as estimates of the required supervision and technical personnel. A summary of the peak labor requirements across the mining positions is summarized in Table 13-19.
Table 13-19: Maximum Mining Labor Requirements
| Mining Department | Maximum Number |
| Management | 41 |
| Supervision | 4 |
| Mine Technical Services | 36 |
| Engineering | 179 |
| Mining | 575 |
| Total | 812 |
Consideration has been given to the mining method and the need for successful planning, backfill and drill and blast practices when determining the labor estimated. The Mining Technical services human resources structure has been established considering the level of technical support required at Kabanga.
Key mining positions, for specific underground roles that have been identified as challenging to retain or source in Tanzania, have been considered in the labor estimate.
| 13.10 | Mine Schedule |
The proposed mine schedule has been developed in Deswik by using the activity rate, productivity rates, quantity limits and geotechnical sequencing discussed earlier in this section. Development meters have been limited by applying equipment build-up as the mine grows and more work areas are available in Figure 13-16.
The primary scheduling constraint in the mining sequence involves the pastefill links between stopes. These links are essential for ensuring the stability of the mine and are dictated by the backfill testwork conducted by MineFill, which aligns with geotechnical strength requirements. The schedule is impacted by the need to observe delays between adjacent stopes that are horizontally and vertically exposed. Typically, there is a 7-day delay required for side-exposure to allow the pastefill to gain sufficient strength before the next stope can be fired. For undercutting, a more extended delay of 28 days is necessary to ensure that the backfill has fully cured and achieved the required strength. These constraints are crucial for maintaining safety and structural integrity within the Kabanga Mine but can affect the overall pace of extraction. An example of the schedule sequence is shown in Figure 13-16 where each stope follows the required production cycle.
Page
|
/ / Initial Assessment - Technical Report Summary |
|
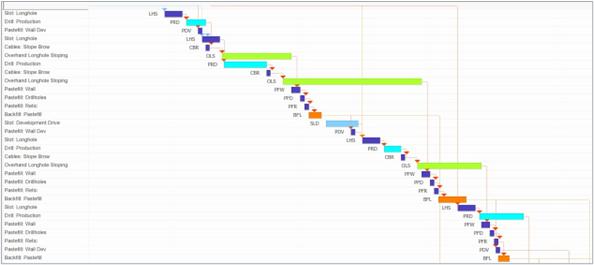
Figure 13-16: Production Cycle Example
The first period of underground mining is focused on development, while the Concentrator is under construction. This gives the mine time to ramp-up and prepare production areas, while also establishing critical infrastructure such as primary ventilation rises, power, dewatering and backfill systems.
In the conceptual plan, priority was given to higher grade areas stopes, particularly the North Mine, which can allow for targeting higher value stopes in the shallow portion of the mine.
As the mines progress, a center out retreat sequence is applied, as illustrated in Figure 13-9, particularly in the deep areas of North Mine to ensure stress and deformation can be managed.
| 13.10.1 | Development Schedule |
The proposed development schedule by period is shown in Figure 13-17 for lateral development and Figure 13-18 for vertical development.
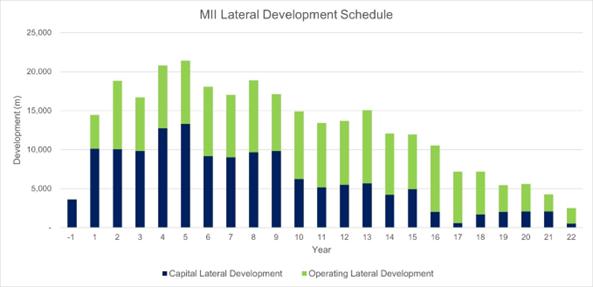
Figure 13-17: Lateral Development by Year
Page
|
/ / Initial Assessment - Technical Report Summary |
|
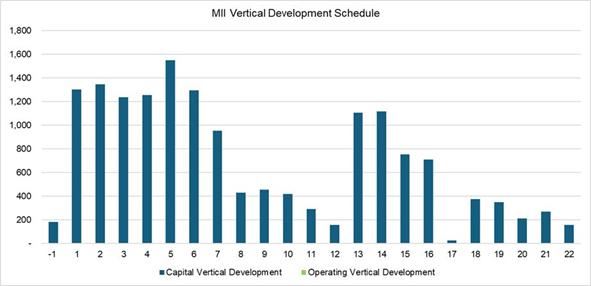
Figure 13-18: Vertical Development by Year
| 13.10.2 | Production Schedule (Measured, Indicated, and Inferred Case) |
Quantity limits have been applied to the global mineralized material tonnage, while also governing the tonnage from each mine to achieve the 3.4 Mtpa target rate. The production split by mine is provided in Table 13-2 and by Mineral Resource category Table 13-20. Figure 13-19 displays the conceptual mine design sequence shaded by color gradient on a yearly basis.
Table 13-20: Proposed Mill Feed by Mineral Resource Category
| Resource Category | Tonnes (kt) | Ni (%) | Cu (%) | Co (%) |
| Measured | 17,883 | 1.84 | 0.25 | 0.15 |
| Indicated | 36,670 | 2.05 | 0.28 | 0.14 |
| Inferred | 13,397 | 1.73 | 0.24 | 0.13 |
| Total | 67,950 | 1.93 | 0.26 | 0.14 |

Figure 13-19: Mining Sequence by Year
The Measured, Indicated, and Inferred (MII) case for the IA includes Inferred material. The Inferred tonnage represents approximately 3% of the total planned production in the first five years and 6.4% over the first 10 years. Sustainable mining of the mineralized area necessitates the inclusion of Inferred material at appropriate points in the mining sequence to maintain practical and continuous operations. A long section of the mine plan by Mineral Resource category can be seen in Figure 13-20. The production schedule shown by Mineral Resource category is shown Figure 13-21.
Page
|
/ / Initial Assessment - Technical Report Summary |
|
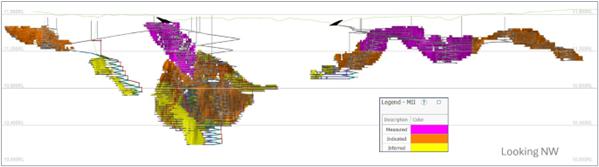
Figure 13-20: Kabanga Long-Section by Mineral Resource Category
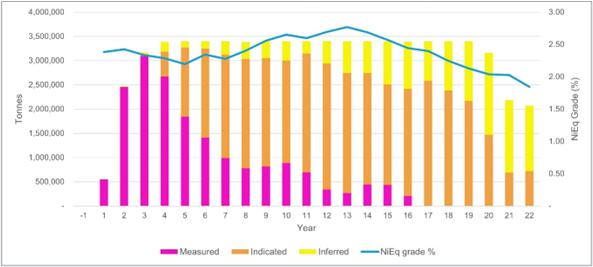
Figure 13-21: MII Production Schedule by Mineral Resource Category
The proposed production schedule showing the stoping and development split is shown Figure 13-22.

Figure 13-22: MII Production Schedule by Mining Type
The proposed production schedule shown by source is shown in Figure 13-23.
Page
|
/ / Initial Assessment - Technical Report Summary |
|
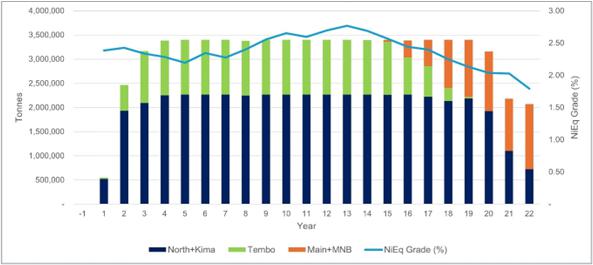
Figure 13-23: MII Production Schedule by Source
| 13.10.3 | Production Schedule without Inferred Mineral Resource |
An additional production schedule has been produced with Measured and Indicated (MI) Mineral Resource only, excluding the Inferred material to assess risk to the potential cash flow. The resulting inventory of the MI case is 52 Mt at 1.98%Ni, 0.27% Cu and 0.15% Co (100% basis) shown in Table 13-21 and Figure 13-24.
Table 13-21: Potential Mill Feed without Inferred Mineral Resource
| Mine | Tonnes (kt) | Ni (%) | Cu (%) | Co (%) |
| North | 30,475 | 2.32 | 0.31 | 0.16 |
| Tembo | 16,467 | 1.58 | 0.22 | 0.13 |
| Main | 5,283 | 1.25 | 0.18 | 0.09 |
| Total | 52,225 | 1.98 | 0.27 | 0.15 |
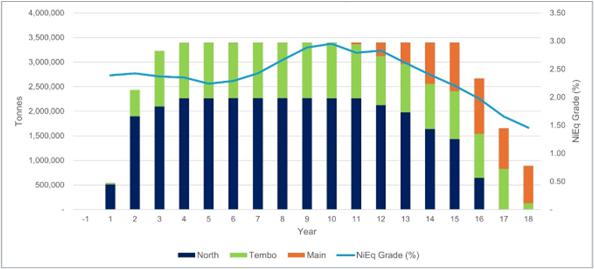
Figure 13-24: MI Production Schedule by Source
Page
|
/ / Initial Assessment - Technical Report Summary |
|
| 13.11 | QP Opinion |
The mining study discussed in Section 13 demonstrating that the proposed mining strategy is technically sound and appropriate for an IA under S-K 1300. Supporting studies, including geotechnical, ventilation, and backfill, have contributed to the development of preliminary mine plans, with consideration given for both a case based on Measured, Indicated and Inferred Mineral Resources and a case without Inferred Mineral Resources. It is recommended that this work continue to advance the Project toward a Feasibility Study.
In the opinion of DRA, acting as the QP for the Kabanga Mine, the mining studies completed to date meet or exceed the requirements for an IA under S-K 1300 and are based on sound engineering, consistent with industry best practices, and demonstrate reasonable prospects for economic extraction.
| 14.1 | Concentrator Processing and Recovery Methods |
| 14.1.1 | Process Overview and Description |
The proposed Concentrator will be built at the Kabanga Site and has been sized to process 3.4 Mtpa of RoM feed to match the steady state underground mining production rate. The Concentrator will treat the MSSX (massive and semi massive sulfides) and UMAF_1a (disseminated ultramafic-mafic intrusive lithology sulfides) feed types in the mine production profile, for recovery of nickel, copper, and cobalt sulfide minerals. Iron sulfide minerals are expected to be recovered as a byproduct of processing but are not considered in this IA as a Mineral Resource or in the economic analysis.
The flowsheet consists of crushing, wet grinding and flotation to produce a Ni-Cu-Co sulfide concentrate, and separate pyrrhotite flotation concentrate and non-pyrrhotite tailings streams. The flowsheet is conventional and well-known, uses common reagents, and has historically been proven as a suitable processing route for base metal sulfide ores.
For the first five years, it is expected that approximately 240 ktpa to 315 ktpa of concentrate will be produced. The concentrate will be trucked and railed to the Port of Dar es Salaam for shipment to international customers. Five years after production of first concentrate, the Kahama Refinery is planned to commence operations, and concentrate will be processed at the Kahama Refinery. The design throughput of the proposed Refinery is approximately 300 ktpa (dry) concentrate, and the production capacity is 50 ktpa of nickel contained in nickel sulfate. This equates to approximately 225 ktpa of nickel sulfate product based on 22.3% nickel content. Once the Refinery is operational, any concentrate production exceeding the 50 ktpa capacity of the Refinery will be shipped to international customers
Once the Refinery is operational, an average steady state concentrate production rate of 341 ktpa is expected to be achieved at the Concentrator, and excess concentrate, averaging approximately 55 ktpa, will continue to be shipped and sold to the overseas market.
Page
|
/ / Initial Assessment - Technical Report Summary |
|
| 14.1.2 | Process Flowsheet and Design Basis |
The Concentrator process design is based on historical studies, testwork findings and assessments, various desktop-level trade-off studies, and relevant DRA design information.
The flowsheet is based on a conventional two-stage crushing and ball milling circuit followed by flotation and dewatering. The design is based on a facility, executed in a single phase, with two 1.7 Mtpa milling and flotation modules. The milling and flotation modules share a common primary and secondary crushing circuit, tailings pumping circuit, and concentrate handling circuit, as well as shared utilities and services. The modular design philosophy was selected based on the mine production ramp-up profile, the feed characteristics of the different lithology types and a comminution circuit options trade-off study, allowing for variations and flexibility in feed types and rates and maximum throughput operating window. This approach allows for increased processing flexibility and introduces redundancy.
The flowsheet includes the following conventional size reduction and mineral beneficiation unit processes:
| ● | Primary and Secondary Crushing and Screening |
| ● | Milling and Classification |
| ● | Aeration and Conditioning |
| ● | Ni-Cu-Co Rougher Flotation |
| ● | Ni-Cu-Co Rougher Flotation Concentrate Regrind |
| ● | Ni-Cu-Co Cleaner, Re-Cleaner and Cleaner Scavenger Flotation |
| ● | Ni-Cu-Co Concentrate Dewatering, bagging and dispatch |
| ● | Pyrrhotite Rougher Flotation |
| ● | Pyrrhotite Tailings Dewatering and Pumping | |
| ● | Non-Pyrrhotite Tailings Dewatering and Pumping |
Page
|
/ / Initial Assessment - Technical Report Summary |
|
| ● | Reagent Delivery, Make-up, and Dosing Facilities |
| ● | Services: Air and Water Supply and Distribution |
A simplified Concentrator block flow diagram is presented in Figure 14-1.
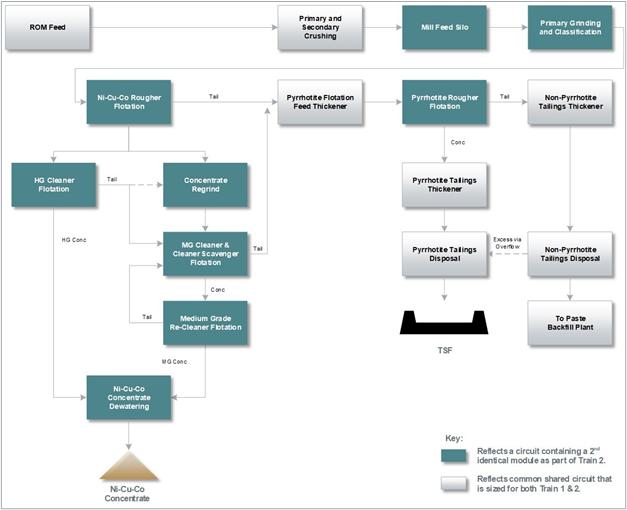
Figure 14-1: Simplified Concentrator Process Flowsheet
A high-level summary of the Concentrator design basis is presented in Table 14-1.
Table 14-1: Key Concentrator Process Design Criteria
| Parameter | Unit | Value1 | |
| Design Throughput | Mtpa (dry) | 3.4 | |
| Nickel feed grade (range/average) | % | 1.44–2.25 | 1.93 |
| Cobalt feed grade (range/average) | % | 0.11–0.16 | 0.14 |
| Copper feed grade (range/average) | % | 0.20–0.31 | 0.26 |
| Sulfur feed grade (range/average) | % | 22.3–25.7 | 23.8 |
| Iron feed grade (range/average) | % | 33.8–38.0 | 34.8 |
| Iron design feed grade | % | 42.0 | |
Page
|
/ / Initial Assessment - Technical Report Summary |
|
| Parameter | Unit | Value1 |
| Design Throughput | Mtpa (dry) | 3.4 |
| Design feed blend – MSSX:UMAF_1a | % | 70.30 |
| Design feed blend dilution | % | 25 |
| ROM feed moisture | %w/w | 5 |
| Design solids specific gravity | t/m3 | 4.26 |
| Crusher circuit annual run time | hrs | 6,000 |
| Design primary crushing throughput | tph | 567 |
| Milling and flotation annual run time | hrs | 8,000 |
| Number of milling and flotation trains | No. | 2.0 |
| Design milling and flotation throughput | tph (dry) | 425 |
| Design milling and flotation throughput per train | tph (dry) | 212.5 |
| RoM feed size (F95/F100) | mm | 600/800 |
| Flotation feed size (F80) | µm | 100 |
| Target nickel concentrate grade | % | >16 |
| Design nickel concentrate mass pull | 9.7–11.0 | |
| Target nickel concentrate moisture | % | 9±1 |
1Values have been rounded
| 14.1.3 | Process Description |
| 14.1.3.1 | Crushing |
The crushing circuit will treat RoM material, with a maximum (top) feed size (F100) of 800 mm, at a design throughput rate of 567 tph (dry). The circuit comprises a primary jaw crusher and two secondary cone crushers, which will be operated in closed circuit with a classification screen to produce a crusher product of 100% passing (P100) 30 mm. The crusher circuit classification screen undersize material will be conveyed to the covered concrete mill feed silos.
| 14.1.3.2 | Milling |
Two identical milling circuits will be installed, each with a capacity of 1.7 Mtpa to achieve a combined throughput of 3.4 Mtpa.
Each milling circuit will consist of a single 4.88 m diameter (Ø) x 7.16 m effective grinding length ball mill, with a 15 mm grate discharge arrangement and 3.5 MW variable speed drive (VSD). Each ball mill will operate in closed circuit with a classification cyclone cluster to achieve a throughput rate of 212.5 tph (dry) while targeting a cyclone overflow product stream of 80% passing 100 µm. Process water will be added in the mill feed hopper to achieve an in-mill solids concentration of 72%–75% (w/w). Lime will also be added into the mill feed hopper to achieve a target pH of 9.0–9.5.
The +8 mm mill scats will be removed by trommel screen and deposited onto a scats stockpile, which will be reclaimed via front-end loader (FEL). Depending on the assayed metal content, the scats will be transported to the waste rock stockpile or get reprocessed if the grade is high enough to warrant this.
Load cells will be installed on each mill to measure total mill load, and mill power will also be measured to assist with the process control strategy and speed variation. The mill operating parameters will be controlled using an advanced mill control system, to optimize throughput and grind while catering for feed hardness and/or changes in the feed particle size distribution (PSD). Additionally, the design includes allowance for a particle size analyzer (PSA) to continuously measure the mill cyclone overflow product size. Provision has been made for ball loading systems to load grinding media into the mills.
Page
|
/ / Initial Assessment - Technical Report Summary |
|
| 14.1.3.3 | Flotation |
Two identical flotation circuits will be installed, each with a capacity of 1.7 Mtpa to achieve a combined throughput of 3.4 Mtpa.
The flowsheet includes a Ni-Cu-Co flotation circuit, consisting of pre-aeration and conditioning, rougher flotation, high-grade cleaner flotation, rougher concentrate regrind, a medium-grade cleaner and re-cleaner flotation and cleaner scavenger flotation.
The Ni-Cu-Co flotation tailings will be thickened before treatment through a pyrrhotite rougher flotation circuit for recovery of pyrrhotite from these tailings.
Each of the 1.7 Mtpa flotation circuits is described in more detail below.
Pre-Aeration and Conditioning
The flotation feed slurry, at 35% solids (w/w) will be pumped to a single bank of five 70 m3, forced air, flotation tank cells in series with a total residence time of 35 minutes. Lime will be added to achieve a target pH of 9.0–10.0. Low pressure blower air will be introduced into the aeration tank cells to selectively partially oxidize the pyrrhotite surface to suppress its flotation properties.
The aeration circuit product will gravitate to an agitated pH adjustment and conditioning tank, where lime is added to achieve a target pH of 9.0–10.0. The pH adjustment tank overflows to an agitated reagent conditioning tank where collector and promotor are added and feed is conditioned prior to flotation.
Ni-Cu-Co Flotation
The Ni-Cu-Co flotation circuit includes a rougher flotation circuit comprising of six 70 m3, forced air, tank cells operating in series to achieve a residence time of 48 minutes.
Two Ni-Cu-Co rougher concentrates will be produced, namely a high-grade and medium-grade concentrate. The high-grade rougher concentrate from the first rougher cell will report directly to a high-grade Jameson cleaner flotation cell for recovery of a final high-grade cleaner concentrate to the froth phase. The tailings slurry will be recycled to the medium-grade Jameson re-cleaner, or the concentrate regrind circuit.
The medium-grade rougher concentrate will be pumped to the concentrate regrind circuit which includes feed classification cyclones followed by regrind of the coarse cyclone underflow stream in a vertical type stirred regrind mill. The regrind mill will use ceramic grinding media and be operated in open circuit to achieve a target grind of 80% passing 35–45 µm for the combined mill product and cyclone overflow.
The concentrate regrind circuit product slurry will be pumped to the medium-grade cleaner flotation circuit, comprising five 30 m3, forced air, tank cells to achieve a residence time of 25 minutes. The medium-grade cleaner concentrate will be collected to the froth phase and pumped to the medium-grade re-cleaner flotation circuit, comprising a single Jameson flotation cell.
The high-grade Jameson cleaner concentrate and medium-grade Jameson re-cleaner concentrate will be combined and pumped to the concentrate product dewatering circuit. The medium-grade cleaner flotation tailings will flow by gravity to a cleaner scavenger flotation circuit, which comprises four 30 m3, forced air, tank cells to achieve a residence time of 31 minutes. Cleaner scavenger concentrate will be collected to the froth phase and get pumped to the medium-grade cleaner. Alternatively, this stream can be optionally routed to the concentrate regrind circuit feed tank.
The design caters for staged addition of collector, promotor, lime, sodium sulfite and frother throughout the Ni-Cu-Co flotation circuit. Carboxymethyl cellulose will also be dosed in the roughers to depress carbonate and talcaceous gangue when processing feed blends with a magnesium level >2% in the feed. Lime addition will be controlled by online pH meters.
Page
|
/ / Initial Assessment - Technical Report Summary |
|
Pyrrhotite Flotation
The Ni-Cu-Co rougher and cleaner scavenger flotation tailings will be pumped to a Ø30 m thickener for recovery of water for re-use in the milling and Ni-Cu-Co flotation circuits. Flocculant will be dosed at a controlled rate to aid solids settling. The pyrrhotite flotation circuit thickener underflow, at approximately 65% solids (w/w), will undergo pH adjustment, repulping and reagent conditioning ahead of the pyrrhotite rougher flotation circuit, which comprises five 70 m3, forced air, tank cells to achieve a residence time of 35 minutes. The pyrrhotite rich, rougher concentrate will be pumped to a pyrrhotite tails thickener and the pyrrhotite rougher flotation tailings will report to the non-pyrrhotite tailings thickener. The design caters for staged addition of collector, activator, sulfuric acid, and frother in the pyrrhotite flotation circuit.
| 14.1.3.4 | Concentrate Handling |
A single Ø25 m concentrate thickener has been selected to treat the combined Ni-Cu-Co concentrate. Flocculant will be added to the thickener. The thickened concentrate at 65% solids (w/w) will be filtered to achieve a target moisture content of 9% (w/w). The concentrate filter is a vendor package consisting of a Larox pressure filter, and associated high pressure compressors, air receivers, wash water tanks, and pumps. The filter cake concentrate product will be reclaimed from the bunkers within the concentrate shed and transferred into flexible bulk containers (FBCs) using a loading and bag frame arrangement, then loaded onto trucks, then weighed over a weighbridge before dispatch.
| 14.1.3.5 | Tailings Handling |
Non-Pyrrhotite Tailings
The combined non-pyrrhotite flotation tailings will be pumped to a Ø25 m thickener where flocculant will be dosed at a controlled rate to aid settling. The thickener overflow water will be collected in the pyrrhotite flotation process water tank and recycled to the pyrrhotite flotation circuit. The thickener underflow at 55%–65% solids (w/w) will be pumped to the agitated non-pyrrhotite tailings disposal tank before being pumped to the North paste backfill plant at a concentration of approximately 55%–60% solids (w/w).
The non-pyrrhotite tailings tank will overflow directly into the pyrrhotite tailings transfer tank, when full. This allows for pumping the combined the non-pyrrhotite and pyrrhotite tailings to the TSF when the Concentrator is producing more non-pyrrhotite tailings than required in the paste mix or the paste backfill plants are down for maintenance.
Pyrrhotite Tailings
The combined pyrrhotite rougher flotation concentrate slurry will be pumped to a Ø30 m thickener where flocculant will be dosed at a controlled rate to aid settling. The thickener overflow water will be collected in the pyrrhotite flotation process water tank and recycled to the pyrrhotite flotation circuit. The thickener underflow at 55%–65% solids (w/w) will be pumped to an agitated pyrrhotite tailings disposal tank and combined with high-density sludge plant sludge, reverse osmosis (RO) plant brine and excess non-pyrrhotite tailings before being pumped to the subaqueous TSF. A small amount of lime may also be added to the pyrrhotite tailings disposal tank to provide additional alkalinity as required to neutralize potential acidity associated with thiosalts in the tailings water and TSF water cover.
| 14.1.3.6 | Sampling, Analysis and Process Control |
The plant will have a central control room from where mechanical equipment will be controlled and monitored. The design also makes provision for advanced mill and flotation control systems. Metal accounting slurry samples will be collected via a primary cross-cut and secondary sampler arrangement. The mill feed will be sampled via manual belt cut samples and each final concentrate truck shipment will be sampled via a manual auger sampler for QA/QC purposes. The Concentrator samples will be processed through an onsite laboratory.
For metal accounting purposes, weightometers will be located on the primary jaw crusher discharge conveyor, secondary crushing circuit feed conveyor and both mill feed conveyors. All concentrate shipments will also be recorded on the Concentrator plant weighbridge. Tailings mass reconciliation will be determined by density gauges and flowmeters.
In addition to the primary metal accounting samples, the design provides process control sampling via inline pressure pipe samplers in combination with continuous online analysis via Courier® and Blue Cube® online analyzers. The online continuous assay values will be used to derive a metallurgical balance which will be continuously measured and displayed on the process automation system to facilitate grade and recovery optimization during operation.
Page
|
/ / Initial Assessment - Technical Report Summary |
|
| 14.1.3.7 | Concentrator Engineering Design and Layout |
The Concentrator design considers appropriate engineering practice, regulatory compliance, ergonomics, health and safety. Structural and civil engineering designs follow the requirements of the mechanical engineering layouts, while the electrical design is based on the electrical needs of the mechanical equipment. A snapshot of the Concentrator 3D model output is presented in Figure 14-2.
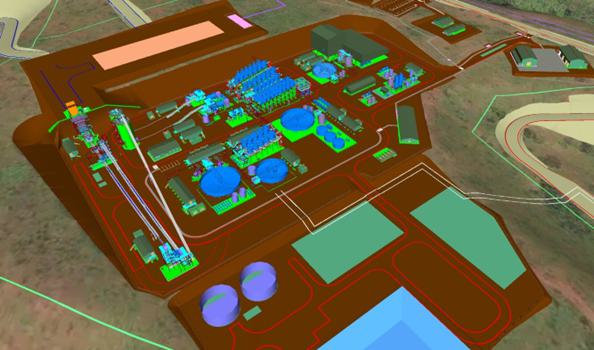
Figure 14-2: Concentrator 3D Model Layout
| 14.1.3.8 | Reagents and Consumables |
The design caters for the following reagent storage, make-up and dosing systems:
| ● | Lime which is used as a pH modifier to target a pH ranging from 9.0–10.0 |
| ● | Potassium ethyl xanthate (PEX) collector |
| ● | Aero 3477 promoter |
| ● | Aerophine 3418A promoter |
| ● | Sodium sulfite (Na2SO3) as a pyrrhotite depressant. |
| ● | Methyl isobutyl carbinol frother |
| ● | Carboxymethyl cellulose to depress magnesium silicate gangue minerals |
| ● | Sulfuric acid (H2SO4) as a pH modifier to target the lower pH of approximately 8 required to float pyrrhotite |
| ● | Copper sulfate (CuSO4) as an activator in the pyrrhotite flotation circuit |
Grinding media is the primary processing consumable which will be required for the primary ball mills (high chrome steel media) and concentrate regrind mills (ceramic media).
Reagents and consumables will be stored in a warehouse inside the plant and transported to the respective make-up and dosing area via a forklift as required. A storage capacity of seven days has been allowed for local supply items and 30 days for imported supply items based on supply chain risk assessments and African operational norms.
Page
|
/ / Initial Assessment - Technical Report Summary |
|
| 14.1.3.9 | Air and Water Services |
The Concentrator air supply system makes provision for supply of low-pressure flotation air which will be generated by rotary lobe blowers and introduced down the flotation cell agitator shafts at a controlled rate. High-pressure air for the filtration, instrument and plant air systems will be supplied by rotary screw compressors.
The design includes provision for the supply of raw water from underground mine dewatering which will be supplemented, when necessary, with water abstracted from the Ruvubu River. Within the milling and flotation circuits, process water will be recovered and recycled. The design also incorporates potable water and fire water supply systems.
In addition to the potable and sewerage water treatment requirements, the design also incorporates provision for water treatment via a high-density sludge system to treat excess mine water and a reverse osmosis (RO) plant which will treat excess water from the TSF return water.
The Concentrator water supply systems have been based on the design requirements derived from the mass and water balance in combination with the site wide water balance December modeling outputs, (WSP (SA), 2023).
| 14.1.3.10 | Electrical Reticulation & Control |
The Project’s electrical reticulation system is designed to ensure reliable power supply across the site. Bulk power will be provided by TANESCO via a new 220 kV overhead line terminating at a TANESCO-owned substation outside the mine. From there, the Project will construct a 220 kV line to a Mine Consumer Substation, where power will be stepped down to 33 kV for site-wide distribution.
Electrical distribution will utilize a 33 kV ring-fed overhead network. Emergency power will be supplied by generators to critical equipment, supported by an automated load control system and 60-minute battery backup for lighting to enable safe evacuation if needed.
The system operates across standard voltage levels—from 220 kV bulk supply to 400 V low-voltage distribution—with equipment and motors sized accordingly. Earthing and lightning protection systems are implemented throughout, with separate provisions for medium and low voltage systems.
Low-voltage power is supplied through standardized 1,600 kVA transformers feeding the motor control centers (MCCs), which in turn distribute 400 V power to equipment. Intelligent motor protection and VSDs are applied based on load requirements.
| 14.2 | Refinery Processing and Recovery Methods |
| 14.2.1 | Process Overview and Description |
The proposed Kahama Refinery will treat nickel-copper-cobalt sulfide concentrate, which will be trucked from the Concentrator, located approximately 320 km away by road. The final products will be battery-grade nickel sulfate, cobalt sulfate, and LME Grade A copper cathode.
The Refinery has a design production capacity of 50 ktpa nickel contained in nickel sulfate. The associated copper and cobalt production is approximately 7 ktpa and 4 ktpa, respectively. Actual production changes on an annualized basis as a function of the Kabanga Mine and concentrate grades. The Refinery sizing has been selected to align with the Concentrator’s long-term steady-state production capacity. In the years when the tonnage of recoverable nickel in concentrate exceeds 50 ktpa, excess concentrate will continue to be sold to international customers.
The Refinery capacity is primarily driven by the concentrate tonnage, sulfur, and nickel grades. The Refinery throughput capacity on a feed basis is approximately 300 ktpa (dry) concentrate. The concentrate itself is rich in nickel, copper and cobalt, and contains significant amounts of sulfur and iron.
Page
|
/ / Initial Assessment - Technical Report Summary |
|
The Refinery unit operations selected are well proven and commonly used in the hydrometallurgical industry to provide high recoveries of base metals. The Refinery process involves several key unit operations. The key components of the design are summarized as follows and as presented in the simplified block flow diagram in Figure 14-3.
| ● | Concentrate Management: A facility for receiving, storing and repulping the concentrate into slurry for processing |
| ● | Leaching Circuit: POX in two stages of autoclaves for leaching (oxidizing) the sulfides to extract base metals into solution and reprecipitating iron residues |
| ● | Limestone Neutralization/Precipitation: Three circuits dedicated to bulk impurity control and pH management |
| ● | Residue Filtration: A combined residue filtration and washing process to separate the gangue solids from the valuable metals in solution |
| ● | Solvent Extraction: to separate and purify the metals in solution |
| ● | Electrowinning: For the electrochemical production of copper as cathode plates |
| ● | Crystallization of separate nickel and cobalt sulfates |
| ● | Support Systems: residue transfer to storage, and the necessary reagents, services, utilities, process control systems and instrumentation |
Pressure leaching, neutralization, and solvent extraction testwork have been completed to support the process design criteria. Simulus’ existing knowledge, based on testwork on similar projects, and fundamental chemistry were also relied upon in developing the process design criteria and integrated mass and energy balance for the Project.
The Kahama Refinery benefits from the location, on the former Buzwagi Gold Mine, due to its proximity to the regional City of Kahama. It is an established site with existing infrastructure including electrical power to site, roads, buildings and water systems that can be re-purposed for the Refinery. The Refinery aims to align with GoT’s vision for full in country beneficiation through the production of final products.
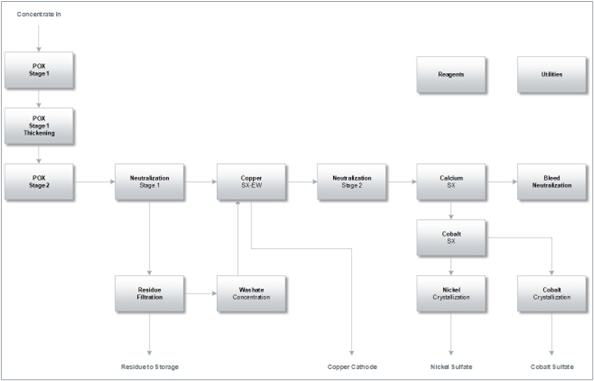
Figure 14-3: Kahama Refinery Simplified Process Flowsheet
Page
|
/ / Initial Assessment - Technical Report Summary |
|
| 14.2.2 | Process Description |
| 14.2.2.1 | Concentrate Handling |
Concentrate will be delivered to the Refinery in the same FBCs used to transport concentrate to the Port of Dar es Salaam in the initial years of operation. The weatherproof FBCs contain approximately 9.4 tonnes of wet concentrate. Concentrate management includes storage on a dedicated laydown area, handling via a dedicated hoist and recovery in dedicated bunkers. Concentrate is drawn from the bunkers in a controlled manner by feeders for repulping in recycled neutralized liquor from the neutralization circuit to generate a slurry suitable for processing.
| 14.2.2.2 | Pressure Oxidation |
This slurry, containing approximately 55% solids, is screened to remove any tramp or oversized materials and stored in the autoclave feed tank before being fed into the leach circuit. In the POX stage, the slurry undergoes high-pressure leaching in an autoclave operating at an elevated pressure of 3,000 kPa(g) and temperature of 220 °C, providing 800 kPa oxygen over pressure. This step, which includes the sparging of oxygen, is crucial for oxidizing sulfides to enable the extraction of base metals from solids into the liquor as metal sulfates. Ferric sulfate, which is also produced, then hydrolyzes to produce insoluble iron oxides and sulfuric acid.
Pressure oxidation is undertaken in two stages, with a thickening step in between. The staged POX approach utilizes the rapid leach extraction kinetics of the high-grade sulfides, with Stage 1 extracting approximately 85%–90% of the value metals in under 15 minutes. Quench liquor is recycled from neutralization to control the temperature and to increase the nickel tenor in the liquor. The Stage 1 discharge slurry is cooled indirectly in three stages from 220 °C to approximately 90 °C. Cooling the slurry indirectly produces steam for use in downstream processes for energy recovery. The discharge is agitated to dissolve any crystallized nickel sulfate prior to being thickened. The thickener overflow is pumped to Neutralization Stage 1.
The thickened underflow slurry is pumped to the second stage of POX, operated under the same conditions for a further 75 minutes to extract the remaining nickel from solids. In parallel, ferric sulfate hydrolyses to produce iron oxides and sulfuric acid. Due to the smaller mass of remaining sulfide, only a minor amount of quench liquor is added along the length of the second autoclave to control the temperature to a setpoint, maintaining a high slurry density and small volume. The difference in slurry volume allows for the two autoclaves to be the same size. The Stage 2 quench and cooling system is over-sized to allow the use of either autoclave in Stage 1 duty, ensuring up to 90% nickel recovery is maintained should maintenance be required on either autoclave. The cooled Stage 2 discharge slurry flows to the Neutralization Stage 1 circuit.
| 14.2.2.3 | Neutralization Stage 1 |
Following pressure oxidation, the POX Stage 1 liquor and POX Stage 2 slurry are combined and pumped into a series of agitated neutralization tanks. The objective of the process is to remove the majority of free acid and some iron, aluminum and chromium, while minimizing co-precipitation of the valuable nickel, cobalt and copper. The high free acid content in the liquor is first used to redissolve nickel and cobalt bearing minor recycled streams, then limestone is added to neutralize free acid, producing a gypsum waste residue.
As the feed slurry is above 80 °C, goethite precipitation is favored over ferric hydroxide; goethite is a more stable and easily thickened or filtered precipitate than ferric hydroxide. Limestone (predominately calcium carbonate) slurry at nominally 40% solids (w/w) is added to each tank to reach a target pH of 2.0–2.5. The discharge slurry is thickened, with thickener overflow split and pumped to the POX quench liquor tanks or clarified before being pumped separately to copper solvent extraction. Thickener underflow is pumped to the residue filtration feed tank.
Partially neutralized and thickened pressure leach discharge slurry is fed to vertical plate and frame pressure filters for dewatering and washing. Hot water is used to wash the residual acid and dissolved base metals from the residue solids (filter cake). Washing is completed with a two-stage, counter-current washing of the cake in each cycle. The final cake containing around 75% solids is transferred by belt feeder and conveyors to residue storage. Filtrate and wash liquor are collected and recycled back to the first stage of neutralization. The filtered residue is repulped in process bleed solutions and pumped to the adjacent historical open pit mine for in-pit residue storage.
Page
|
/ / Initial Assessment - Technical Report Summary |
|
| 14.2.2.4 | Copper Solvent Extraction and Electrowinning |
CuSX is fed with the neutralized PLS through a plate heat exchanger to transfer heat from the PLS (CuSX feed) to the raffinate (CuSX discharge) to keep the CuSX circuit cool enough for solvent extraction and to minimize the amount of steam required in Neutralization Stage 2 downstream. Copper is extracted from the PLS solution by solvent extraction, using a 2-extract, 1-wash, 2-strip arrangement with LIX 84I reagent or equivalent as the extractant. Copper electrolyte is pumped to electrowinning where copper cathode is produced by electrowinning of the copper strong electrolyte. The spent electrolyte is returned to copper solvent extraction and used to recover (strip) the copper from the solvent. Discharge liquor is pumped to Neutralization Stage 2 for further processing.
The copper produced is LME Grade A cathode. Final copper cathode is stripped in a dedicated stripping machine, loaded onto pallets and strapped in 2-tonne lots, ready for transport by truck and rail to the Port of Dar es Salaam.
| 14.2.2.5 | Neutralization Stage 2 |
The second stage of neutralization treats the copper SX raffinate. The objective of the process is to remove the majority of the remaining iron, aluminum and chromium, whilst limiting the co-precipitation of the valuable nickel and cobalt. The free acid content is first used to redissolve nickel and cobalt recycled from the bleed neutralization circuit, then limestone is added to neutralize the bulk of the remaining free acid, producing gypsum and precipitating iron as goethite and aluminum as hydroxides.
As is the case for Neutralization Stage 1, the feed slurry is above 80 °C and goethite precipitation is favored over ferric hydroxide, to produce a more stable and easily thickened or filtered precipitate. Limestone slurry at nominally 40% solids (w/w) is added to each tank to reach a target pH of 4.5–5.0. The discharge slurry is thickened, with thickener overflow clarified prior to being pumped to the Calcium SX circuit. Thickener underflow is pumped to Neutralization Stage 1 to recover any minor precipitated metals as previously described.
| 14.2.2.6 | Bleed Neutralization |
Liquors from downstream solvent extraction scrubbing circuits and crystallizer bleeds are combined in the bleed neutralization tanks. Lime is added with the objective recovering nickel and cobalt by precipitation, while minimizing precipitation of manganese and magnesium. Lime slurry at nominally 20% solids (w/w) is added to each tank to reach a target pH of 7.5–8.0. The discharge slurry is thickened, with thickener overflow being used to repulp the residue filter cake for pumping to residue storage. The thickener underflow is pumped back to the second stage of neutralization to redissolve the value metals, as described above.
| 14.2.2.7 | Calcium Solvent Extraction |
The removal of calcium and manganese, key impurities remaining in solution, is achieved via solvent extraction using the commonly used specialty chemical D2EHPA. To avoid the introduction of sodium into the raffinate (the nickel and cobalt bearing stream), a nickel preload system is used. Overall, the calcium SX stages are:
| ● | Nickel preload – pH adjustment with caustic soda |
| ● | Extraction – for calcium, manganese and other minor gangue elements |
| ● | Scrub – weakly acidic water scrub for cobalt and nickel with sulfuric acid |
| ● | Strip – calcium and manganese strip with hydrochloric acid |
Any nickel remaining on the organic from the preload plus extracted cobalt is scrubbed with mildly acidic water. The pH is controlled by the addition of sulfuric acid. Calcium and manganese are stripped with hydrochloric acid to prevent gypsum formation. The raffinate, now free from calcium and manganese, is advanced to the cobalt solvent extraction area. The spent scrub stream is sent to bleed neutralization and the strip liquor is sent to residue repulp.
Page
|
/ / Initial Assessment - Technical Report Summary |
|
| 14.2.2.8 | PLS Pre-concentration |
Steam is used to preconcentrate the nickel sulfate solution to 30% solids (w/w) nickel sulfate concentration prior to crystallization. This is achieved in a pre-concentration four effect evaporator. The pre-concentrator improves the operability of the crystallizer by providing consistent feed composition and minimizing the amount of water to be evaporated.
| 14.2.2.9 | Cobalt Solvent Extraction |
The separation of cobalt and nickel sulfate is achieved via solvent extraction with the commonly used specialty chemical Cyanex 272 acting as the extractant. The cobalt solvent extraction (CoSX) plant also separates any other gangue metals away from the cobalt and nickel. To avoid the introduction of sodium into the raffinate (the nickel-bearing stream), a nickel preload system is used. Overall, the stages are:
| ● | Nickel preload – pH adjustment with caustic soda |
| ● | Extraction – for cobalt, magnesium and other minor gangue elements |
| ● | Scrub 1 – weakly acidic water scrub for nickel |
| ● | Scrub 2 – weakly acidic scrub for magnesium |
| ● | Strip – cobalt strip with sulfuric acid |
| ● | Scrub 3 – full strip for any zinc, iron or copper |
All circuits below use sulfuric acid for pH control. Any nickel remaining on the organic from the preload is scrubbed with mildly acidic water. The spent scrub is returned to the extraction stage.
Magnesium is scrubbed at a lower pH prior to cobalt stripping. The spent scrub is sent to bleed neutralization for recovery of minor nickel and cobalt content.
Cobalt is stripped from the loaded organic with sulfuric acid and water to control the cobalt tenor in the final cobalt sulfate solution.
The final scrub, at low pH, is designed to remove any minor amounts of iron, copper or zinc extracted from the PLS. The spent scrub is sent to residue repulp.
The separate nickel sulfate and cobalt sulfate streams are then advanced to the sulfate crystallization circuits.
| 14.2.2.10 | Nickel and Cobalt Sulfate Crystallization, Drying and Bagging |
Purified nickel and cobalt sulfate solutions are stored in surge tanks to provide the following process requirements:
| ● | Decoupling from upstream circuits and surge to allow operational flexibility for maintenance |
| ● | A stock of nickel sulfate and cobalt nickel sulfate solution for use in the solvent extraction preload systems |
Nickel sulfate crystallization is achieved by a forced circulation mechanical vapor recompression (MVR) type evaporator. Crystals are harvested continuously, filtered and washed. A centrate bleed allows for the bleeding of minor impurities.
Cobalt sulfate crystallization is achieved by a forced circulation MVR evaporator. Crystals are harvested continuously, filtered and washed. A centrate bleed allows for the bleeding of minor impurities.
Nickel sulfate and cobalt sulfate are dried separately in rotary dryers. Steam is used to preheat air for direct contact with the sulfate crystals to dry the crystals and evaporate the contained water without removing the waters of hydration of the crystals. The final products are high-grade battery nickel sulfate hexahydrate (NiSO4.6H2O) and cobalt sulfate heptahydrate (CoSO4.7H2O).
Dry sulfate crystals are conveyed pneumatically to the bagging plants with integrated surge hoppers. Four identical batching modules are included, nominally two for nickel sulfate, one for cobalt sulfate and one stand-by for maintenance requirements. Bagging will be done in double-lined 1 m3 (1.5 to 2 tonne) bulk bags, packed into standard 20-foot sea containers for transport by truck and rail to the Port of Dar es Salaam.
Page
|
/ / Initial Assessment - Technical Report Summary |
|
| 14.2.2.11 | Residues |
The main residue streams from the process are:
| ● | Residue filter cake: a combination of iron residue from POX and gypsum precipitated in neutralization |
| ● | Bleed Neutralization discharge liquor |
| ● | Calcium and zinc strip liquors |
It is proposed that all the streams are combined, repulped, and pumped to the adjacent historical open-pit mine for in-pit residue storage. All liquors are neutralized to pH 8 prior to being used for filter cake repulping.
| 14.2.3 | Reagents, Utilities and Consumables |
A range of other reagents, utilities and consumables are incorporated into the design and associated operating costs. The major reagents used in the process are:
| ● | Oxygen (produced onsite from air and electrical energy) |
| ● | Limestone |
| ● | Caustic soda |
| ● | Lime |
| ● | Sulfuric acid |
| ● | Hydrochloric acid |
| ● | Flocculant |
| ● | Coagulant |
| ● | Cyanex 272 |
| ● | D2EHPA |
| ● | Diluent (for solvent extractant) |
The major utilities are water systems, steam and electrical power. The Refinery flowsheet requires low chloride content water systems to produce high-grade nickel sulfate crystals, necessitating the use of demineralized water or recycled condensate within the main process plant.
Steam is generated onsite in the POX slurry coolers during slurry cooling. The steam is primarily used for evaporation of process liquors prior to crystallization, as described and is available for general process heating as required.
The power for site comes from the local grid via a 220 kV supply with letdown transformers on site to 33 kV. Site electrical power generation from excess steam supplements the grid power.
The major variable operating costs are electrical energy for air separation (oxygen production needed for POX), caustic soda for calcium and cobalt solvent extraction, and limestone for neutralization of excess acid and for preliminary metal recovery. Oxygen is generated onsite by a dedicated oxygen plant. Limestone is supplied locally from Shinyanga, with deposits located approximately 120 km from the Refinery. Lime is sourced from established Tanzanian operations. Caustic soda is procured from the international market and supplied, along with other reagents and consumables, through the Port of Dar es Salaam, then railed and trucked to site.
Page
|
/ / Initial Assessment - Technical Report Summary |
|
| 14.2.4 | Refinery Demonstration Plant |
A refinery demonstration plant will be constructed and operated at the Kahama Site once nickel concentrate is available from the Kabanga Mine and Concentrator, but prior to the full-scale Refinery construction and operation. This will be undertaken to optimize and finalize the flowsheet, further de-risk the hydrometallurgical facility, to begin establishing the Kahama facility and supporting infrastructure and services including the laboratory, and to support the development and training of local technical and operating personnel.
| 14.3 | QP Opinion |
| 14.3.1 | Concentrator |
The Concentrator design and supporting engineering has proposed a conventional crushing, grinding and flotation flowsheet, using a typical flotation reagent regime, based on testwork demonstrated its suitability for the effective production of a high-grade nickel concentrate.
It is the opinion of DRA, responsible and acting as the QP for the Kabanga Concentrator, that the design undertaken for the processing and recovery methods for the proposed Concentrator is at a level that meets and exceeds that typically required for an IA and represents good industry practice.
| 14.3.2 | Refinery |
The proposed Refinery flowsheet for the treatment of Kabanga nickel concentrates comprises POX, neutralization, solvent extraction (SX), and crystallization circuits. Metallurgical testwork undertaken to date, fundamental hydrometallurgical chemistry, validated by modeling, supports the flowsheet to produce nickel and cobalt sulfate and copper cathode. In addition, further developmental work is ongoing, with a Kahama demonstration plant planned to help de-risk the refinery and confirm performance at scale.
It is the opinion of DRA, acting as the QP for the Kahama Refinery, that the design undertaken for the processing and recovery methods for the proposed Refinery is at a level that meets the requirement for an IA and represents good industry practice.
Page
|
/ / Initial Assessment - Technical Report Summary |
|
The Project scope includes the design and development of appropriate infrastructure to support the operation of the Kabanga Mine and Concentrator, located in the Kagera District, and the Refinery to be operated near the town of Kahama.
| 15.1 | Kabanga |
| 15.1.1 | Power Supply |
TANESCO will construct and commission a new 220 kV OHL to supply power to the Kabanga Site. The proposed 220 kV Nyakanazi–Kabanga transmission line will be approximately 87.6 km in length. The 220 kV line corridor is planned to originate from the Nyakanazi substation from where it will be constructed within a 35 m wide corridor to a metering point at the Kabanga Site boundary.
The metering point will consist of a substation managed by TANESCO. The Project will complete the last section of the 220 kV transmission line to the consumer substation located at the Kabanga Site. The Project will install 2 x 30 MVA transformers with space allocation for an additional two transformers if required. The estimated demand for the Project site is 48 MVA.
The main areas that require medium voltage feeds are the Concentrator, North Mine, Tembo Mine, permanent camp, construction camp, ventilation shafts, and Ruvubu pump station.
The 33 kV distribution will be stepped down to 400 VAC, three-phase electrical power at the various areas by a mix of distribution transformers, minisubs, and pole-mounted transformers.
Back-up power for emergency loads will be provided by three off 3.5 MVA generators and ancillary equipment that will connect to the grid in the event of a TANESCO grid power failure. The back-up power plant will be equipped with fuel tanks, switchgear, and transformers to provide emergency power at 33 kV.
| 15.1.2 | Water Supply |
| 15.1.2.1 | Site Bulk Water requirements |
The bulk supply of water will be directed to five water systems, namely:
| ● | Potable water for on-site personnel; drinking and domestic use, including cooking and sanitation. |
| ● | Construction water for contractors, including dust suppression, earthworks and concrete mixing. |
| ● | Service water for the mining contractor and the owners mining operations; drilling and other mining activities. |
| ● | Concentrator raw water make-up. |
| ● | Fire water system consisting of tanks and pumps. |
Four sources of water are available to the Kabanga Site:
| ● | Ground water. |
| ● | Fissure water inflows, and the associated underground mine dewatering. |
| ● | Rainwater capture. |
| ● | The Ruvubu River. |
The existing exploration camp is currently supplied with ground water extracted from existing, equipped boreholes. Water from the boreholes is stored in HDPE storage tanks at the exploration camp. This water is used to supply the current potable water needs of the camp and was used for exploration drilling activities.
The net operational water demand is estimated to ramp-up from 3,400 m³/day at startup of the operation to an average of 8,000 m³/day during the full capacity of the Project, when the Kabanga Mine and Concentrator reach steady-state production of 3.4 Mtpa feed. The bulk of this water will be provided by underground mine dewatering, but will be supplemented by the Ruvubu River during the TSF first fill and in early production. The WSP (SA) site-wide water balance estimated that a maximum extraction rate of 1,800 m3/day will be required from the Ruvubu River during this start up period.
Page
|
/ / Initial Assessment - Technical Report Summary |
|
Four production boreholes have been drilled and pump-tested on the Kabanga Site. The recommended extraction capacity for the boreholes is 635 m3/day. During operations, the balance of the service water requirements in excess of that from the underground dewatering will be extracted from the Ruvubu River. TNCL has received the permit to extract water from the Ruvubu River up to a maximum of 9,000 m3/day, less than half of one percent of the river flow during the dry season. The Ruvubu River raw water pipeline will also be used to discharge treated, excess Kabanga Site water, back to the Ruvubu River which will be a more common scenario.
| 15.1.2.2 | Site Potable Water |
A central water treatment plant (WTP) will be installed during construction on the ridge next to the existing drilling camp. Potable water will be reticulated from the WTP to the North Mine infrastructure area (MIA), Concentrator, Tembo MIA, drilling camp, contractor’s camps and exploration camp. An additional WTP will be procured for the permanent camp to provide a dedicated water supply to the camp.
| 15.1.3 | External and Internal Site Access Roads |
| 15.1.3.1 | External Roads & Regional infrastructure |
The Kabanga Site can be accessed by two gravel roads: the northern access road and the southern access road. The northern access road ties up with the sealed B3 paved highway 55 km away to the north, near the village of Nyabisindu. The southern access road is a 72 km gravel road that connects to the B3 sealed paved highway at the village of Nyakahura.
The 77 km gravel road connecting the Kabanga Site to the B3 highway will be upgraded during construction to facilitate the safe delivery of construction equipment to site. However, the road is in a reasonable state with only minor upgrades required before commencing operations.
The closest airstrip to the Kabanga Site is Ngara Airport located 92 km to the north (by road), near the town of Ngara.
| 15.1.3.2 | Internal Site Roads |
All roads within the Kabanga Site perimeter have natural gravel-wearing course surfaces. Concrete surfacing is applied on haul road sections with steep inclines to improve safety and production. Parking areas and pedestrian walkways are covered by interlocking concrete paving blocks. Main access roads make up approximately 20 km of the total roads, with haul roads comprising approximately 4 km and service roads approximately 7 km. The existing northern access road will provide initial construction access to the Concentrator for daily heavy vehicle deliveries until the southern access road has been upgraded to acceptable standards. Existing access tracks will be used for early construction of the North boxcut and mine infrastructure area, Tembo boxcut and Concentrator. The main internal access road to the Concentrator and TSF is required prior to commissioning of the Concentrator.
Page
|
/ / Initial Assessment - Technical Report Summary |
|
| 15.1.4 | Kabanga Site Infrastructure |
| 15.1.4.1 | Site Plot Plan Development |
Existing infrastructure at Kabanga includes an exploration camp, which can provide accommodation for 300 people, an existing 33 kV electrical connection, offices and water supply from local boreholes. There is another smaller drilling camp, used mostly for exploration drill core storage.
The development of the Kabanga Site will take place in a single construction phase. Construction will commence with the development of the North Mine boxcut and infrastructure, followed by the permanent camp, Tembo boxcut, Concentrator, TSF, pollution control dams (PCDs), as well as WRDs. These facilities will be linked by roads and service roads of various specifications. The proposed Kabanga Site layout is presented in Figure 15-1.
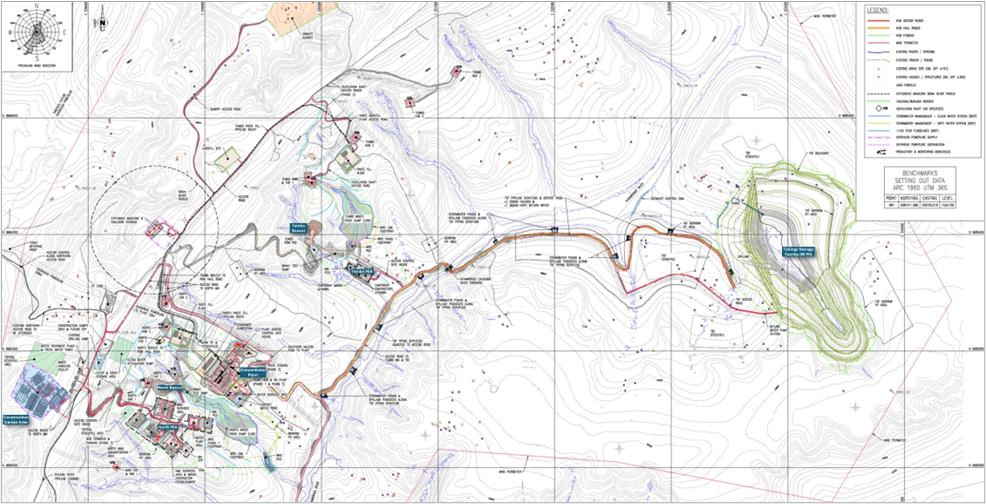
Figure 15-1: Kabanga Site Layout (including TSF)
Page
|
/ / Initial Assessment - Technical Report Summary |
|
| 15.1.4.2 | Site Bulk Earthworks |
The undulating landscape necessitates the creation of flat terraces for Mine and Concentrator infrastructure, buildings and structures, as well as stormwater management purposes. Various historical geotechnical investigation reports are available for the Kabanga Site with information on 47 historic geotechnical boreholes (BH) and 151 historical test pits (TPs).
There are no heavy dynamic structures located on the North MIA terraces and normal cut-and-fill construction is allowed for in the design. The North Mine terraces include around 711,179 m3 of bulk earthworks. The Concentrator beneficiation circuit includes a primary crusher, secondary crusher and screening structures, two concrete mill feed silos and two ball mills. These are all classified as heavy dynamic structures with deep raft foundations. Most of the Concentrator terraces are in-cut, to reach the suitable in-situ bearing pressures and include 871,250 m3 of bulk earthworks. There are no heavy dynamic structures located on the Tembo MIA terrace and normal cut-and-fill construction is allowed, including 267,856 m3 of bulk earthworks.
| 15.1.4.3 | Site Stormwater Management |
The surface stormwater run-off flows as sheet flow from the top of the ridge into defined natural drainage valleys down to the Nyamwongo river. The Nyamwongo river merges with and becomes the Muruhamba river forming the Burundi border. The Muruhamba river flows south into the Ruvubu River at the southern extent of the Kabanga Site. Most of the infrastructure is positioned on the ridge to minimize upstream catchment areas and avoid influencing natural drainage lines. The 1:100-year flood line levels were modeled by WSP (SA) as part of the TSF dam break assessment (DBA). The total length of stormwater contact and non-contact drains is approximately 50 km.
| 15.1.4.4 | Permanent Accommodation Camp |
The permanent camp will be located north of the plant and constructed during the execution phase to be ready for operations. It will be sized to accommodate 636 people and constructed using modular prefabricated units. Combined with the exploration camp facilities, 936 beds will be available for permanent operations accommodation.
| 15.1.4.5 | Site Building Infrastructure |
Building infrastructure layouts were developed to support the Kabanga Mine and Concentrator operations. The total architectural and prefabricated Kabanga surface buildings cover 18,728 m2. The Kabanga electrical substations, motor control center (MCC) buildings, and transformer bays will cover 2,458 m2.
| 15.1.4.6 | Site Sewage Treatment |
A centrally located sewage treatment plant with a capacity of 200 m3/day will be installed at the North Mine area to service the North boxcut and MIA, drilling camp, contractor’s camps, exploration camp, and the Concentrator. A dedicated sewage treatment plant of 100 m3/day will be installed at the permanent accommodation camp.
| 15.1.4.7 | Site Waste Rock Dumps |
The Kabanga North and Tembo WRDs were sized and optimized according to the material balance between the mine production schedule, waste rock development, and the backfill plant requirements. Additional geotechnical information will be required to complete the detailed designs on the WRDs as geotechnical fieldwork investigations were not completed during the study. The North and Tembo WRD capacities are designed for the peak tonnage with additional buffer storage. A significant portion of the waste rock is re-used over time in the pastefill for the underground. At the end of the proposed LoM, the remaining waste rock will be used as part of the TSF closure bulk fill material used beneath the impervious capping.
Page
|
/ / Initial Assessment - Technical Report Summary |
|
| 15.1.4.8 | Site Construction Facilities |
The Project will provide construction laydown areas for the earthworks; infrastructure; mining contractors; civils and buildings contractors; steel, mechanical, plate work and piping (SMPP) contractor; and electrical control and instrumentation contractors. It is estimated that 13.6 ha of laydown areas are required for the construction phase. The available laydown areas on the Kabanga Site total 21.3 ha. Peak construction labor is estimated at 2,546 people (including mining, owners’ team, administration and security). At peak, an estimated 1,688 beds will be required at Kabanga for the construction camps; only 936 will be constructed to meet operational requirements, with the balance will be pushed back to contractors. The mining contractor will construct their own camp at the existing exploration camp. The owners’ team will provide contractors with a cleared hard stand to establish accommodation units and facilities.
| 15.1.5 | Waste Handling |
A central recyclable waste segregation and community reclaim facility is planned at the existing drilling camp. The central waste facility will consist of concrete bunded areas, hydrocarbon storage, skip bins, a baler and refuse bins for sorting recyclable waste. Separate smaller satellite waste segregation and reclaim facilities are allowed at the individual areas, including the North MIA, Concentrator, Tembo MIA, and permanent camp.
| 15.1.6 | Hydrology and Water Balance |
A site-wide stochastic water and salt balance model (GoldSim) using the IA mine plan V5.3 was developed to size water storage and pumping systems, assess water treatment needs, and evaluate reuse potential. The model confirmed that groundwater ingress and run-off largely meet site demand, with intermittent top-up from the Ruvubu River (maximum 1,800 m³/day), and a 7,000 m³/day abstraction capacity was recommended for reliability. The construction phase water needs will be met from boreholes, WRD PCDs, and groundwater inflows. Post-treatment water is reused across the site or discharged to the Ruvubu River.
The water balance incorporates climate data (1992–2022). This shows a mean annual precipitation (MAP) of 1,016 mm and evaporation of 1,580 mm, with seasonal variations considered in the stormwater design. A 12%–15% increase in rainfall Intensity-Duration-Frequency (IDF) curves was adopted for climate change resilience. Stormwater infrastructure separates clean and contact water, with PCDs and sediment control structures managing storage and discharge for a 1:100-year event.
Water management supports subaqueous tailings deposition and includes high-density-sludge and RO treatment plants for contact and process water. Treatment reliability is key, with modular designs and 24-hour contingency storage in place.
At the end of proposed LoM, treated water will be used to accelerate underground void filling, reducing the closure duration. An extended duration for post-closure water treatment has been catered for in the closure cost estimates to ensure environmental compliance and best practice.
| 15.1.7 | TSF |
The Project proposes to construct and operate a TSF at the Kabanga Site, adhering to a number of national and international guidelines.
The TSF, designed by WSP (AUS), will be constructed in the southern tributary valley of the Nyamwongo River. At the calculated tails tonnage to be stored, it will have an impoundment area of approximately 92 ha at the end of its life, with a design that allows up to 120 ha. The embankments will be constructed using materials borrowed from areas around the TSF. The facility will be formed by the construction of a cross-valley embankment (main embankment) and during the later raises, an additional saddle dam (saddle embankment) to 1,513 mAMSL. The TSF will be built in six stages: an initial starter embankment followed by five main embankment raises. It is designed to hold approximately 42.5 Mt of tailings under the MII mine plan, with contingency planning in place to increase capacity to 50 Mt if needed. The final embankment height is expected to reach about 68 meters, with the option to raise it to 72 m (1517 mAMSL) if future requirements demand.
Due to the oxidation characteristics of the pyrrhotite component of the tailings and the geochemical assessment, subaqueous deposition is proposed for the facility. The facility will be fully lined to minimize seepage and further reduce the geochemical risk. A liner leakage collection system (LLCS) has been included in the design to intercept the potential leakage from the facility and return it to the TSF. Two springs have been identified in the valley of the facility. A spring water transfer system is proposed to collect and transfer the spring water downstream of the TSF to maintain the water flow downstream of the facility as far as practically possible.
Page
|
/ / Initial Assessment - Technical Report Summary |
|
A minimum water cover of 0.8 m depth will be maintained above the tailings at all times. The facility will have stormwater holding capacity of a 1:10,000 annual exceedance probability (AEP), 72-hour storm event. This design storm event is associated with an ‘Extreme’ consequence category dam in accordance with the GISTM and has a rating of ‘Very High A’ against Tanzanian Dam Safety Guidelines requirements. The facility will be equipped with emergency spillways at each stage of development. The spillways have been designed to manage the critical duration of a probable maximum flood (PMF).
Supplementary investigations (geophysical and geotechnical) were carried out for the TSF as part of the current studies. The geophysical investigations included electrical resistivity imaging (ERI), seismic refraction, multi-channel analysis of surface waves (MASW), and a vertical seismic profiling (VSP) survey. The geotechnical investigation comprised drilling BHs, in-situ standard penetration testing, tube sampling, TP excavation, bulk sampling and laboratory testing (of foundation and construction materials).
To support the facility design, WSP (SA) carried out a dam break study, water balance, geochemical assessments, groundwater response, and contaminant transport modeling. Design analyses have also been undertaken for the TSF, including seepage and stability analyses, tailings consolidation assessment, simplified deformation assessment, freeboard assessment, and piping erosion assessment. WSP New Zealand (WSP (NZ)) has undertaken a site-specific seismic hazard analysis (SHA) for the TSF to support the design.
Cognizant of the outcomes of the geochemical assessment and subsequent recommendations, the closure of the facility includes development of a water shedding structure to reduce surface water infiltration into the tailings. The final landform will be gently graded towards a closure spillway to be located adjacent to the saddle embankment. For closure, a cover layer will be placed above the tailings, comprising general fill (to facilitate grading the final surface), a low permeability layer (to reduce surface water infiltration) and topsoil (for vegetation growth).
A safety in design (SiD) assessment has been undertaken for the facility. It identified potential health and safety hazards and proposed controls to manage those with unacceptable risk. A quantitative risk assessment was carried out to determine if the risks are as low as reasonably practicable, which requires that all reasonable measures be taken with respect to ‘tolerable’ or acceptable risks to reduce them until the cost or other impacts of additional risk reduction are grossly disproportionate to the benefit. The risks identified during the current stage of the TSF design are within the limits of tolerability defined by ANCOLD when individual failure and overall collective risk modes are considered. The quantification of risk for each failure mode is, however, contingent on the design defenses being installed as designed and functioning as expected, and TSF design intent being met throughout the TSF lifecycle, including construction and operations.
Ongoing reviews of the TSF design have been conducted by an Independent Tailings Review Board, a Tanzanian Ministry of Water Approved Professional Person (APP), and other subject matter experts, who continue to be engaged.
| 15.2 | Kahama |
The Refinery is located approximately 320 km southeast of the Kabanga Site (by road) and will be constructed in the Buzwagi SEZ centered on the decommissioned Buzwagi Gold Mine. The refinery is bordered to the west by the former Buzwagi Gold Plant, the capped Buzwagi Gold Mine TSF to the south, with the existing plant PSWP and Kahama Airport to the north and forested area to the east.
The Refinery is surrounded by existing infrastructure from the old Buzwagi Gold Mine. Existing infrastructure of note includes the decommissioned gold plant and infrastructure buildings, water harvest area and water storage pond, Kahama airstrip, TSF, WRD, open pit and village.
| 15.2.1 | Existing External Power |
There is an existing bulk electrical connection to the Kahama Refinery. TANESCO is also currently expanding nationwide generating capacity. A single power line feeds the existing Buzwagi outdoor substation from the Shinyanga substation about 100 km away. Currently, the substation is equipped with two 30 MVA, 220/33 kV power transformers.
Page
|
/ / Initial Assessment - Technical Report Summary |
|
| 15.2.2 | Water Supply and Treatment |
| 15.2.2.1 | Existing Water Supply and Treatment |
The existing water storage pond is lined with an HDPE liner, has a capacity of 1.5 Mm3 and receives water from the 72.7 ha HDPE-lined Water Harvest Area. The pond also receives water from the KUWASA main reservoir via three pipelines. A pipeline from the pond supplies raw water to the existing Raw Water Pond (RWP) in the gold plant area through a 2.5 km long pipe. The existing RWP has a capacity of 11,000 m3.
The PSWP collects contact stormwater run-off from the existing gold plant. The PSWP will be repurposed to serve as the refinery’s main pollution control dam to collect contact water. Silt traps are planned at all inlets to the PSWP.
A modular potable WTP is located at the village with a capacity of 500 m3 potable water per day. The existing sewage treatment plant uses an aerobic and anaerobic treatment process, has a maximum capacity of 250 m3/d and is situated adjacent to the waste handling site close to the Buzwagi Mine Village.
| 15.2.2.2 | Refinery Water Supply |
A new overland pipe will tie into the existing HPDE pipe from the water storage pond to supply raw water to the new raw water tank at the Refinery. This will also be used to supply the construction water, including drinking and raw water. The existing modular potable WTP at the village will treat borehole water to produce drinking quality water. Raw water requirements for dust suppression, earthworks, washdown, and service water have also been incorporated into the design.
| 15.2.3 | External and Internal Site Access Roads |
The B3 highway to the north of the Refinery is a sealed asphalt road. The existing Buzwagi Gold Mine entrance road connects to the B3 highway and will be repurposed for the refinery main access road. A dual weighbridge will be installed on the main access road before the Refinery.
The Refinery internal roads have a gravel surface and a chamfer of 3% for stormwater drainage. A gravel surface truck staging and parking area is allowed for, staging eight trucks at the main entrance in the event of faulty weighbridge operation or other delays. A new light delivery vehicle (LDV) parking area is provided at the refinery offices. Allowance is included for a main access road, SEZ and administration access roads, approximately 4 km internal refinery roads.
| 15.2.4 | Kahama Site Infrastructure |
| 15.2.4.1 | Kahama Site Plot Plan Development |
The Refinery will be developed in a single execution construction phase capable of refining Kabanga concentrate to produce 50 ktpa of contained nickel as nickel sulfate. It is being developed to be ready for the first refined products five years after the first concentrate is produced at the Kabanga Concentrator.
| 15.2.4.2 | Repurposed Infrastructure |
The following existing infrastructure will be re-used:
| ● | Gatehouse |
| ● | Administration offices |
| ● | Medical clinic |
| ● | Village consisting of 184 senior and 224 junior accommodation beds. |
Page
|
/ / Initial Assessment - Technical Report Summary |
|
| ● | Heavy mobile equipment workshop including a light vehicle workshop, 200-person change house, crib room and warehouse. |
| ● | Two reagent stores located east of the existing RWP. |
| ● | Fuel farm facilities |
| ● | Waste handling facilities include a waste sorting area and incinerator. |
| 15.2.4.3 | Refinery Bulk Earthworks |
A geotechnical investigation was completed in April 2021 for closure design purposes of the original Buzwagi Gold Mine TSF. The investigation included six geotechnical BHs north and east of the existing TSF close to the Refinery. Knight Piésold Consulting completed a slope stability analysis of the TSF final closure profile in June 2021 based on the geotechnical investigation. A new geotechnical investigation was completed by WSP (SA) in November 2023. Six geotechnical BHs were drilled, and 22 TPs were excavated over the refinery to obtain a general surface geotechnical profile.
A sloped terrace was designed for the refinery infrastructure, buildings and structures, and efficient stormwater management. The Refinery terrace will be cut to reach the suitable in-situ bearing pressures required for the various structures and filled with engineered layerworks to final terrace level.
| 15.2.4.4 | Refinery Construction Facilities and Borrow Pits |
Two external natural gravel borrow pits are located outside the Buzwagi Site boundary. A borrow pit for engineered layer works has been identified on the southern part of the refinery site. A commercial sand source from Didia is available 46 km from Kahama. A granite quarry is available 14 km away for concrete aggregates. The material balance indicates that there will be a surplus of material which will be spoiled onto the existing WRD. A topsoil stockpile will be generated and material will be borrowed from the Refinery and southern borrow pit.
| 15.2.5 | Refinery Waste Management |
Existing solid waste handling facilities on the Buzwagi Mine Site includes a waste management center at the village, consisting of concrete bunded waste segregation areas. The facility includes sorting of solid waste, bioremediation of hydrocarbon-contaminated material, an incinerator and waste material baler, a domestic landfill site, hydrocarbon storage, contaminated soil handling and a hazardous waste storage facility. Existing waste handling facilities will be used by the refinery during construction and operations.
| 15.2.6 | Refinery Residue Storage |
The Project proposes in-pit storage for the refinery residues using the historic open pit mine void. This was selected as the preferred option after a multi-criteria assessment (MCA) was undertaken. It was selected due to it having the lowest technical and overall risk, best environmental and social outcomes, best operability, lowest capital and operating costs amongst other measures. Preliminary studies indicate that the pit is sufficiently sized to contain the entire refinery residue tonnage at which point, it will still be well below the water table and will continue to act as a water sink (groundwater flows into the pit rather than out of the pit) with no/limited anticipated impact to the surrounding groundwater.
Following pressure oxidation, the discharge slurry is neutralized, thickened, filtered and washed to separate the solid iron and gypsum residue from the liquid phase which contains the value metals. The solid residue filter cake is re-slurried in neutralized process bleed solution and pumped to the in-pit disposal facility. Decant water can be pumped back to the refinery for re-use as process water.
| 15.2.7 | Other |
In addition to the repurposed site infrastructure described above, the Refinery will be supported by new infrastructure typical of this type of facility, including additional administration and engineering buildings, maintenance workshops, training facilities, warehousing, laydown areas and an owner operated laboratory equipped to meet the needs of a hydrometallurgical processing facility. Refinery specific site fencing will be installed to control access separately to the existing SEZ access control. This additional infrastructure is allowed for in the associated capital cost estimate.
Page
|
/ / Initial Assessment - Technical Report Summary |
|
The Kahana Refinery infrastructure also benefits from the city of Kahama including a large population with the associated public facilities, the Kahama Airport (also known as the Buzwagi Airport) which is used for domestic flights and for mining operations, the B3 highway connecting Kahama to other major Tanzanian cities including the capital Dodoma and through to Dar es Salaam, as well as the nearby Isaka rail terminal (32 km) which will have the electrified SGR scheduled for completion well before the commencement of the Refinery.
| 15.3 | Logistics |
| 15.3.1 | Construction Logistics |
A logistics study evaluated the Project’s requirements for construction and operational logistics. A primary focus was the movement of all construction-related equipment and loads from points of origin globally to the Kabanga Site and Kahama Refinery. The report evaluated four transport methodologies that were considered optimal:
| ● | Importation via road freight: for goods manufactured/procured from South Africa or the East African Community (EAC). |
| ● | Importation via ocean freight: for goods sourced internationally outside the Southern African Development Community or EAC. |
| ● | Air freight: for emergency procurement deliveries during construction. |
| ● | Domestic rail/road freight: for inland transport of goods from ports/Tanzanian sources to the Kabanga and Kahama Sites. |
The report includes route surveys to determine the requirements and constraints related to the transport of abnormal loads from the Dar es Salaam port to both the Kabanga Site and Kahama Refinery. In addition, an evaluation of the bridges enroute from Dar es Salaam to Kahama was conducted to ensure the suitability of these for the transportation of out-of-gauge (OOG) cargo/abnormal loads. The study identified bridges that were of potential concern, bypasses for these and mitigation measures, although based on current equipment sizes no bridge upgrades would be required.
For the purpose of the IA, it was assumed that road freight would be utilized for all construction related equipment and material deliveries from the port of Dar es Salaam to the respective sites. During the next phase, the viability of using the SGR line to Isaka for construction related equipment and material will also be evaluated.
Upgrades to the southern access road will include essential temporary upgrades to allow delivery of the expected OOG cargo and abnormal loads required for the construction of the mine and concentrator. These loads include the mill shells, mill ends, concentrate filters and 30 MVA transformers.
The proposed upgrades to the southern access road to the Kabanga Site include cutting and widening of the steep sections on the road, widening sharp switchbacks, and extending the associated stormwater infrastructure to facilitate the OOG deliveries during construction. Temporary slip lanes are planned where the road is too narrow to allow bi-directional traffic during transport of the OOG loads. Traffic on the road will be managed and batched during the delivery period to avoid long delays for regular road users and for safety considerations.
Page
|
/ / Initial Assessment - Technical Report Summary |
|
| 15.3.2 | Operational Logistics |
Operations commence with the sale of the nickel-copper-cobalt concentrate from the Kabanga Site through the Port of Dar es Salaam to international customers. Once the Refinery commences production, concentrate will be trucked to the Kahama Site for refining. The refinery products, high-grade nickel sulfate, cobalt sulfate and LME grade copper cathode, will be transported to Dar es Salaam for shipping to customers, as well as any excess concentrate that cannot be processed through the Refinery. The proposed logistics route is shown in Figure 15-2.
Concentrate tonnage varies over the initial years of production depending on the mine production plan and concentrator feed grades. Approximately 300 ktpa of concentrate will be transported through to the final delivery destination ports on a CIF basis. The logistics will consist of road transport from Kabanga to Isaka, rail from Isaka to Kwala with temporary storage, rail to port, loading, and shipping to customers.
At the Mine, nickel concentrate product will be loaded into re-usable Flexible Bulk Containers (FBCs) for transport to the quayside in Dar es Salaam. Each sealed FBC will contain approximately 9.4 t of wet product.
The FBCs will be loaded onto flatbed road trucks at the mine using heavy duty forklifts. These trucks will be provided by a third-party road haulage supplier under a long-term contract. The vehicles are expected to load with either two FBCs (standard truck) or three FBCs on a tri-axle vehicle. The road haulage route of approximately 348 km to the Isaka rail terminal is expected to take one day and driving will be restricted to daylight hours for safety reasons.
At Isaka there are existing rail sidings for the current meter gauge railway network, but by March 2026 the new SGR is expected to arrive in Isaka. The Project will be able to load larger and faster freight trains on this wider gauge. The current plans for the SGR layout in Isaka include provision for a general loadout siding and laydown/storages areas.
Rail will be to Kwala approximately 88 km outside the port of Dar es Salaam, a key staging point for imports and exports used to reduce congestion at port by removing the need for quayside warehousing. The Kwala Dry Port is a large site with direct rail access situated. The facility has been designed for handling shipping containers and bulk materials and is managed and operated by the Tanzania Ports Authority on behalf of the Port of Dar es Salaam. It is currently connected to the port by the meter gauge railway network, with plans to build a ‘Port Link’ from the end of the SGR.
Page
|
/ / Initial Assessment - Technical Report Summary |
|
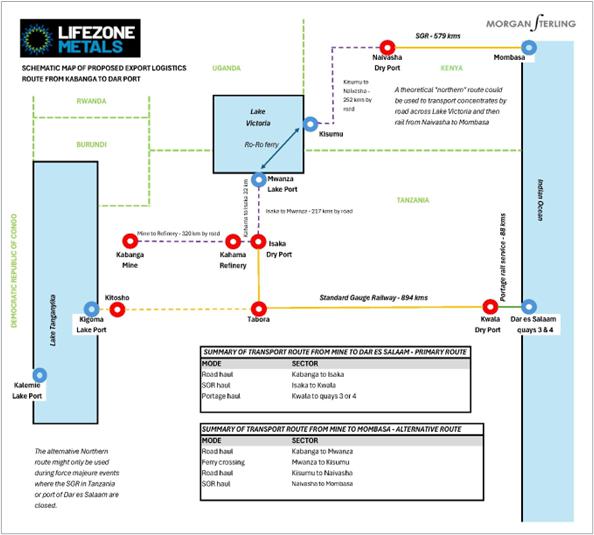
Figure 15-2: Kabanga Proposed Logistics Route
The typical SGR freight train is expected to be a rake of 40 low sided flatbed wagons each with a capacity of five FBCs, driven by a double headed electric locomotive power unit. This would deliver a train payload of approximately 1,880 t with a schedule of releasing a full train every 48 hours, and backhaul of reagents, diesel or other mine supplies. Kabanga has engaged with the Tanzania Railways Corporation (TNC) relating to access and rates which have been used in the study. Two swing sets of wagons (one loading/unloading at each end) plus one set in motion have been allowed for in the capital cost estimate.
From the end of the ‘Port Link’ branch line, FBCs would be transported using forklift trucks to a staging or ‘vessel stack’ area close to the bulk material quays (numbers 3 or 4) in advance of vessel docking. Shipment parcel sizes of 10,000–25,000 t have been assumed in bulk vessels comprising hold capacities of approximately 5,000 t each. Typically, vessels would be loaded using land-based cranes – two per ship – and these could use spreader bars and move between two and three FBCs per lift. FBCs would be emptied and discharged once craned over the open hold by pulling a rip cord and allowing the whole base of the FBC to fall away at loading rates of 6,000 t per crane per day.
DP World have investment plans to construct covered conveyor loading systems to both quays 3 and 4 at the port which connect with a general bulk material stockpile point about 900 m away from the dock. This facility will then be a multi-user facility to unload grains and sulfur, and load concentrates. Loading rates of 2,000 tph are predicted once this is installed.
Page
|
/ / Initial Assessment - Technical Report Summary |
|
Shipping costs for ocean going freight and offloading from Dar es Salaam to customer destination ports have been provided by multiple reputable shipowners including parcel carriers and multi-purpose ships. Parcel carriers operate larger vessels ranging from 28,000 to 56,000 deadweight tonnage (DWT) and load a variety of cargoes on each ship which are separated by different holds. Parcel carriers generally load and discharge at a variety of ports which results in longer transit times. Multi-purpose shipowners operate smaller vessels ranging from 10,000–18,000 DWT and would be more likely to ship a full and complete (i.e. single) cargo.
Quotes using April and May 2025 rates are reflective of the current shipping market conditions. They were based on a number of specified terms such as maximum and minimum freight size, geared (own cranes) vessels, load and unload rates and loading days, allowance for laytime, cargo type and classification and a maximum vessel age of 20 years to avoid excessive marine insurance. The remaining terms and conditions requested are as per a Baltic and International Maritime Council (BIMCO) charterparty. BIMCO is one of the largest international shipping associations representing shipowners. These have been used in the cost estimation.
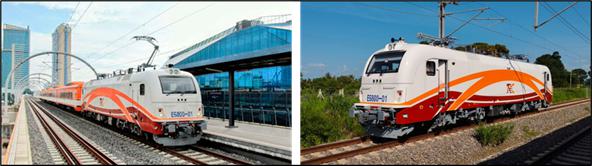
Figure 15-3: SGR Rail Locomotives
Once the Refinery has commenced production, the same logistics route will be used, with concentrate trucked from Kabanga to the Kahama Refinery approximately 320 km by road. The refinery products, bulk bags of nickel sulfate and cobalt sulfate, are loaded into containers, and 2 t of copper cathode strapped to pallets and also stored in containers, will be trucked to the Isaka rail terminal located approximately 32 km away. These would be loaded onto freight train wagons, and railed through Kwala for intermediate storage, then railed to Port where it will be loaded in containers onto shipping lines.
The Port of Dar es Salaam is a major gateway for Tanzania and landlocked countries and handles a significant portion of the country’s international trade. It is the busiest port in Tanzania and the fourth largest on Africa’s Indian Ocean Coastline after Durban, Mombasa, and Maputo with facilities focused on containerized trade. Any excess concentrate unable to be processed through the refinery will continue to be transported through the proposed concentrate logistics solution.
Transport costs for concentrate, sulfate products, and copper cathode have been estimated on this basis, using current quotations received from reputable logistics providers.
| 15.4 | QP Opinion |
DRA is of the opinion that the proposed supporting project infrastructure and sources and prices of power and water is well understood and have been interpreted from reliable studies and evaluations.
It is the opinion of DRA, responsible and acting as the QP for the Kabanga and Kahama Site infrastructure, that the level of assessment and design are appropriate for an IA and represent good industry practice.
Page
|
/ / Initial Assessment - Technical Report Summary |
|
| 16.1 | Market Outlook |
The following information on supply and demand is summarized from information provided by CRU, a leading independent data intelligence company focusing on the mining, metals and fertilizers industry. CRU data and forecasts were prepared in May 2025.
Markets for nickel, copper, and cobalt are well established and demand for these metals is expected to continue to grow in the long-term given the global trend of decarbonization and electrification. All three metals are key components in batteries, consumer electronics, energy storage and renewable energy capacity, and the outlook for these sectors remains robust.
| 16.1.1 | Nickel |
Nickel demand spans several categories, including stainless steel, batteries, plating, alloy and steel castings, non-ferrous alloys, and other products. Demand is forecast to exceed 4 Mtpa by 2028, which aligns with a projected decline in supply, eventually falling slightly below consumption levels.
Global supply is predominantly concentrated in Indonesia and China, which together account for approximately 75% of total production. Demand is primarily driven by the stainless-steel sector—the largest end-use of nickel—and increasingly by the battery sector, which is projected to grow at the fastest rate among major demand categories. The majority of nickel consumption occurs in Asia, particularly China, with comparatively lower demand in Europe and the Americas.
Nickel demand is expected to remain strong over the short, medium, and long term due to increasing demand for EVs, Energy Storage Systems (ESS), and other portable power and motive batteries, alongside steady growth in stainless steel consumption. Nickel demand for battery applications is forecast to double over the next five years and triple by 2035.
Based on CRU’s assessment, key longer-term drivers to the nickel price include:
| ● | Onshoring of Critical Mineral Supply Chains: Environmental and country-of-origin regulations, such as the Foreign Entity of Concern sourcing obligations in the U.S. Inflation Reduction Act, are driving a preference for low carbon emissions and/or secure nickel supply chains, with incentives offered for domestic or trusted sources, aiming to reduce reliance on sources from jurisdictions with less stringent environmental and labor standards. |
| ● | Increasing Marginal Costs in Indonesia: The cost of producing nickel in Indonesia may rise due to factors like declining ore grades, higher energy costs, increased feed ore prices, higher royalty costs, and more expensive tailings storage. |
| ● | Expansion of Low-Cost Production Capacity: Continued growth in Indonesian ferronickel, nickel pig iron (NPI), and high-pressure acid leaching (HPAL) capacity has reduced the need for other new nickel projects, subsequently lowering the price required to economically incentivize new nickel output. |
| ● | Advancements in Battery Technology: The increased adoption of manganese-rich cathodes and lithium iron phosphate (LFP) batteries, particularly outside China, could reduce demand for nickel from the battery sector, exerting downward pressure on nickel prices. |
| ● | Increased Recycling: Demand for primary nickel may be lower than forecast due to faster-than-anticipated recycling of nickel from batteries, driven by shorter battery lifespans and improved collection and recovery rates. Additionally, China may accelerate its use of scrap in stainless steel production. |
| 16.1.2 | Cobalt |
The growth in the EV market is expected to drive long-term cobalt demand, despite a substantial decline in cobalt intensity within EV batteries due to the increased adoption of cobalt-free LFP and nickel-rich, cobalt-lean nickel-manganese-cobalt (NMC) cathodes. The cobalt market will face significant challenges in the coming years, with rising demand from EVs and the renewable energy sectors balanced against supply chain and ethical sourcing concerns.
Page
|
/ / Initial Assessment - Technical Report Summary |
|
Cobalt is primarily produced as a by-product of nickel or copper production, making its price typically more volatile than either primary metal. Despite recent oversupply driven by historically high copper prices boosting production in the DRC, the longer-term outlook for cobalt remains positive. Demand forecasts are strong, and it is expected to outstrip supply in the medium to long term.
Key Price Drivers for Cobalt:
| ● | Concentration of Production: Cobalt production is limited to a few countries, with the DRC accounting for a significant portion of global output. Even as Indonesian production rises, the DRC will be the main source of global cobalt throughout the 2020s and 2030s. This concentration increases supply risk and reduces supply chain resilience. The realization of this risk in practice is seen in 2025, as the DRC has banned cobalt exports for a period of four months due to low market prices. However, major producers such as CMOC Group Limited or Glencore are even less likely to curtail cobalt production. In all likelihood, many producers will continue producing cobalt, assuming the ban will last only four months. This could create storage challenges for those accumulating several months’ worth of hydroxide production on site. Regardless, any curtailments are unlikely to amount to more than 20 ktpa Co capacity, much lower than the expected cobalt surplus this year. |
| ● | ESG Concerns: ESG issues in cobalt mining may have an impact on the supply chain, especially with the EU’s Critical Raw Materials Act coming into effect this year. Regulatory changes in the European Union will require companies to address ESG issues or risk losing access to financing in the EU. |
| ● | Rapid Changes in Battery Chemistry: The pace of change in battery chemistry is swift, with higher cobalt prices and supply chain uncertainties driving a shift towards lower or no-cobalt battery types in some markets. |
| 16.1.3 | Copper |
Copper is a primary driver for EVs, energy storage, and renewable energy sectors, reflecting demand growth across transport and utility industries. On the supply side, copper-producing regions like Chile and Peru face regulatory changes, environmental concerns, aging mines, and declining ore grades, all which challenge output. This is compounded by insufficient new project tonnage coming online to replace exhausted assets and meet additional demand.
Copper prices have historically been volatile due to the limited availability of substitutes in many applications. Strong demand is expected as industries continue with electrification, decarbonization, and energy transition, particularly in the EV and renewable energy sectors.
Key Price Drivers for Copper:
| ● | Economic Activity: Copper demand is closely tied to global economic activity, often considered a bellwether for the global economy. |
| ● | Geopolitical Factors: Trade wars, sanctions, and political instability in major copper-producing nations significantly impact copper prices. |
| ● | Energy Transition: Over and above economic activity, copper will be more intensively used through the green energy transition, leading to an intensity step-change as much more of the global economy electrifies items that once were powered by fossil fuels. |
Page
|
/ / Initial Assessment - Technical Report Summary |
|
| 16.2 | Market Prices |
| 16.2.1 | Metal Prices – IA |
The metal prices used in the IA are based on an assessment by LZM, in collaboration with the QP, of recent market prices, long-term forward curve prices, and consensus prices from analysts and institutions. The values used in the economic analysis undertaken for the IA are taken from the May 2025 consensus pricing for nickel, copper and cobalt. The specific values are presented in Table 16-1 and are in real terms. Battery specification nickel sulfate price is based on Project Blue forecasts and reference the Shanghai Metals Market (SMM), trading at a small premium to nickel metal in the long term. Cobalt sulfate has been modeled on parity with the LME cobalt metal consensus price forecast.
Table 16-1: Kabanga Metal Prices – IA Economic Assessment
| Metal |
Long Term Price |
| Nickel | 8.49 |
| Copper | 4.30 |
| Cobalt | 18.31 |
| 16.2.2 | Metal Prices – Mineral Resource Estimate |
The metal prices recommended for the MRE are based on the QP’s assessments of recent market prices, long-term forward curve prices, and consensus prices from analysts and institutions. The metal prices selected are at the upper range of long-term consensus price forecasts over the last 10 years; this is an optimistic view of prices for use in the cut-off grade analysis to ensure that the reasonable prospect of economic extraction considerations does not exclude material that may be able to be included in future studies for defining Mineral Reserves.
The metal prices used in this IA TRS are the same as those used for the 2024MRU, which are presented in Table 16-2.
Table 16-2: Kabanga Metal Prices – 2024MRU
| Metal |
Long-Term Price (USD/lb) |
| Nickel | 9.50 |
| Copper | 4.50 |
| Cobalt | 23.00 |
| 16.2.3 | Price Sensitivities |
The range of sensitivities considered for the IA is ±30% of the metal prices, as shown below:
| ● | Nickel: USD 5.00/lb to USD 11.00/lb |
| ● | Copper: USD 2.00/lb to USD 7.00/lb |
| ● | Cobalt: USD 15.00/lb to USD 35.00/lb |
Page
|
/ / Initial Assessment - Technical Report Summary |
|
| 16.3 | Concentrate and Refined Products Marketing |
| 16.3.1 | Concentrate Marketing |
| 16.3.1.1 | Concentrate Sales to the Export Market |
A nickel-rich sulfide concentrate containing payable levels of copper and cobalt and low, unpenalizable levels of impurities is proposed to be produced on the Kabanga Site. Concentrate will be sold to the export market for the first five years of operations. Potential concentrate customers have been engaged, and indicative, non-binding concentrate payment and delivery terms for 100% of the concentrate during this period have been provided to support the study. This concentrate will initially be trucked, railed and shipped to international customers. Concentrate transport, logistics and freight contracts would be established for this.
Section 100(C) of the Mining Act (Amendment) 2019 prohibits the export of raw minerals, including concentrates. There are however exceptions to this prohibition. Exportation may be authorized under special agreements or arrangements, particularly through Framework Agreements between the Government of Tanzania and the investing company. The GoT may therefore grant export approval, provided that the request is supported by a Framework Agreement, studies, and clear strategic alignment with national beneficiation goals. There are examples of Tanzanian mining operations and projects with exemptions in order to export concentrates, and a number of small-scale projects which are allowed to export minerals.
TNCL formally notified the GoT of changes to the Project’s implementation strategy, including that the DFS and economic analysis have been completed and submitted to the Mining Commission, the updated strategy prioritizes bringing the Kabanga Mine and Concentrator to steady-state production (3.4 Mtpa), and concentrate produced during the initial 3–5 years will be sold to international customers and a demonstration refinery to generate early cash flows. These proceeds will be used to help fund the deferred construction of the Kahama Refinery. This phased approach is intended to enhance the Project economics, de-risk the refinery investment for both GoT and private investors and improve access to Project financing. The GoT has been informed of this approach.
The market for nickel concentrate is well established, and demand for the Kabanga product is strong, particularly due to the high-grade and low impurity specification making it ideal to blend with incumbent lower grade, higher impurity feedstocks being used by smelters; and due to a significant tonnage of third-party concentrate coming off the market in recent years due to several notable closures including the Nickel West and IGO operations.
| 16.3.1.2 | Concentrate Typical Specification |
The concentrate product has a high nickel grade, contains payable levels of copper and cobalt, and low, unpenalizable levels of impurities. Deleterious elements such as arsenic, antimony, lead, zinc, fluoride and chloride, which can potentially attract penalties in nickel concentrates, have been determined through both historical and current testwork not to reach threshold limits.
Metallurgical algorithms have been developed from testwork to model concentrate grades based on the mine production schedule. The algorithms consider the different feed types, feed grades and feed blends to determine annualized recoveries and concentrate grades for the payable metals, specifically nickel, copper and cobalt. The recoveries and concentrate grades of sulfur, iron and magnesium/magnesia have also been modeled based on recovery algorithms derived from the testwork and the concentrate mass recovery. Minor element grades are based on comprehensive assays of flotation testwork concentrate samples.
The proposed LoM concentrate grade is 17.3% nickel, 2.6% copper, and 1.3% cobalt. Over the same period, the concentrate has a calculated sulfur grade of 32%, iron of 39% and a low magnesium grade of 0.4%. The typical Kabanga concentrate specifications are presented in Table 16-3.
Page
|
/ / Initial Assessment - Technical Report Summary |
|
Table 16-3: Kabanga Concentrate Typical Specification
| Element | Unit | Typical | Minimum | Maximum |
| Ni | % | 17.3 | 16 | 18 |
| Co | % | 1.3 | 1.0 | 1.5 |
| Cu | % | 2.6 | 2.0 | 3.0 |
| Fe | % | 39 | 37 | 40 |
| S | % | 32 | 31 | 33 |
| Pt | ppm | 0.25 | 0.05 | 0.45 |
| Pd | ppm | 0.35 | 0.2 | 0.5 |
| MgO | % | 0.8 | 0.5 | 1.1 |
| SiO2 | % | 7 | 5 | 9 |
| Al | % | 0.7 | <1 | |
| Ca | % | 0.2 | <0.5 | |
| Mn | % | 0.03 | <0.05 | |
| Cr | % | 0.1 | <0.2 | |
| As | ppm | 50 | <50 | 100 |
| Bi | ppm | 5 | <10 | |
| Sb | ppm | 5 | <10 | |
| Pb | ppm | 200 | <500 | |
| Zn | ppm | 150 | <200 | |
| Cd | ppm | 10 | <20 | |
| Cl + F | ppm | <200 | <500 | |
| Au | ppm | 0.5 | ||
| Ag | ppm | 7 | ||
| Fe/MgO | # | 46 | 36 | 75 |
| Moisture | % w/w | 9.0 | > DEM | < TML |
DEM: Dust Extinction Moisture; TML: Transportable Moisture Limit
The IA uses a concentrate metal payability for nickel, copper and cobalt respectively based on Cost, Insurance and Freight (Incoterms® 2020) (CIF) delivery terms to the destination port as per the indicative terms provided by potential customers.
| 16.3.1.3 | Concentrate Sales to Kahama Refinery |
Under the terms of the Framework Agreement, it is the undertaking of the Project to establish a Refinery at Kahama, Shinyanga Region, referred to as a Multipurpose Mineral Processing Facility in the Framework Agreement, to process the concentrate produced at the Kabanga Mine to beneficiate the concentrate to refined products.
Once refining operations commence, variable amounts of concentrate will continue to be exported, at market terms. This will be required when the anticipated nickel quantities recovered from the concentrate exceed the Refinery’s 50 ktpa nickel output capacity limitation. As a result, approximately 900 kt of concentrate, on a dry basis, will be exported due to refinery production constraints. This represents 13.6% of the total concentrate produced over the proposed LoM.
The proposed hydrometallurgical refinery located at Kahama, which forms part of this study, will be a related party to the planned mining operation, due to a shared ownership structure. Owing to this, and in line with local transfer pricing requirements, concentrate from the Kabanga Mine will be sold to the Kahama Refinery at arm’s length pricing, based on benchmarked terms and conditions from global nickel smelters.
Page
|
/ / Initial Assessment - Technical Report Summary |
|
A benchmark of the sale terms and conditions of the Kabanga concentrate and determine the market value of the Kabanga concentrate for this purpose. To establish a suitable arms-length transfer price for the concentrate from the Kabanga Mine to the Refinery, CRU considered the sale of the Kabanga concentrate to existing nickel smelters outside Tanzania. This considered the concentrate transport costs, which are built into this pricing to account for the trucking distance of approximately 320 km, compared to the cost of transporting to international customers. A concentrate transport contract would be established for this.
| 16.3.2 | Refinery Marketing |
Battery grade nickel sulfate and cobalt sulfate will be loaded into bulk bags and shipped in standard containers to customers globally. Copper (metal) cathode will also be containerized for shipping to global markets.
| 16.3.3 | Refinery Product Specifications |
Based on the Kabanga concentrate tested, testwork results and processing modeling, the forecast nickel sulfate specification is listed in Table 16-4.
Table 16-4: Projected Kahama Nickel Sulfate Specification
| Element | Unit | Typical |
| Ni | % minimum | 22.3 |
| Co | ppm maximum | 10 |
| Cu | ppm maximum | 1 |
| Fe | ppm maximum | 1 |
| Na | ppm maximum | 100 |
| Ca | ppm maximum | 20 |
Based on the Kabanga concentrate tested, testwork results and processing modeling, the forecast cobalt sulfate specification is listed in Table 16-5.
Table 16-5: Projected Kahama Cobalt Sulfate Specification
| Element | Unit | Typical |
| Co | % minimum | 20.7 |
| Ni | ppm maximum | 20 |
| Cu | ppm maximum | 20 |
| Fe | ppm maximum | 20 |
| Na | ppm maximum | 20 |
| Ca | ppm maximum | 20 |
Based on the Kabanga concentrate tested, testwork results and processing modeling, the forecast copper cathode specification is LME Grade A.
| 16.4 | QP Opinion |
There is a market for high-grade,
low impurity nickel sulfide concentrates as well as battery grade nickel sulfate, cobalt sulfate, and copper (metal) cathode. This supports
the conclusion that KNL will be able to sell the products from the Project. Macroeconomic trends, taxes, royalties, data and assumptions,
interest rates, and marketing information and plans are outside the expertise of the QP and are within the control of the registrant.
Page
|
/ / Initial Assessment - Technical Report Summary |
|
| 17.1 | Summary |
The Project encompasses two primary locations: the mine and Concentrator located at the Kabanga Site, and the Refinery located at the Kahama Site. The Kabanga Resettlement is also a component of the Project, aimed at the relocation of households that are physically and economically displaced due to Project activities at the Kabanga Site. The Kabanga Resettlement provides new housing, infrastructure, compensation, and livelihood restoration programs for PDHs. EDHs receive compensation and targeted support to restore or improve their livelihoods. The Project is committed to responsible mining practices that protect and manage environmental resources, promote social welfare, and ensure transparent and accountable governance. By adhering to the ESG principles, the Project aims to achieve regulatory compliance while contributing positively to the local communities and the environment, ensuring the long-term sustainability of the Project.
The Project is committed to aligning with both Tanzanian regulatory requirements and internationally recognized ESG standards. The Project operates within the legal framework of the United Republic of Tanzania, complying with national laws related to environmental protection, social impact management, land access, resettlement, and permitting.
Regulatory approvals are required for the development and operation of the Project. These include permits for the Kabanga, Kahama, and relocation sites. The Project permitting team oversees the permitting process, maintaining a structured and efficient approach to meeting regulatory obligations.
Key internal policies guiding the Projects ESG strategy include a Code of Conduct and Human Rights Policy Statement (extending human rights commitments to third parties), a Corporate Social Responsibility Policy (emphasizing community development), and an Environmental Policy (focused on sustainable resource use and minimizing environmental impact).
In addition to national requirements, the Project seeks alignment with leading international ESG frameworks. These include the IFC Performance Standards (IFC PS), Equator Principles, GISTM, and guidelines issued by ANCOLD and ICMM, ensuring the adoption of sustainable and responsible mining practices.
| 17.2 | Licensing Conditions |
To uphold strict environmental and social standards, the SML holders must comply with a comprehensive set of stipulated licensing. Under the EIA Certificates, general conditions include the safe disposal of all waste types, adherence to environmental management plans, and the implementation of periodic audits, monitoring, and reporting. Facilities must continually improve these plans by incorporating new developments, engaging environmental experts for guidance, and ensuring compliance with all proposed mitigation measures. Specific conditions in the EIA Certificates mandate establishing a proper ecological management organization and effective liaison with key regulatory institutions.
For the SML, holders must comply with the Environmental Management Act of 2004 and all relevant safeguards, managing waste production, storage, transportation, treatment, and disposal per environmental principles. Regular ecological audits and evaluations are necessary to prevent degradation and minimize the release of hazardous substances. The ESIAs for the Project specify requirements such as minimizing pollution, maintaining safe buffer zones, and ongoing site rehabilitation.
Additional licensing conditions include specific measures related to water management, such as compliance with the Culvert Construction Permit and Water Use Permits, which dictate pollution prevention, proper drainage, water abstraction limits, and regular reporting to the Lake Victoria Basin Water Board.
The Kahama Site EIA Certificate conditions further emphasize the need to properly manage hazardous waste, residue, brine solutions, stormwater, and wastewater and implement management plans for transporting materials to minimize environmental and safety risks.
Page
|
/ / Initial Assessment - Technical Report Summary |
|
In addition to environmental compliance, social licensing conditions are critical to ensuring responsible interaction with affected communities. The EIA Certificates mandate continuous stakeholder engagement, compliance with national legislation, and preparation of emergency and contingency plans. For the Project, these conditions also include addressing resettlement and compensation issues before the Project begins, conducting environmental quality monitoring in affected areas, and formalizing Corporate Social Responsibility (CSR) commitments through Memorandum of Understanding with local communities and authorities. At the relocation sites, the Project must ensure safe waste management, a smooth handover of resettlement areas, and access to essential services for the relocated populations. The Project emphasizes health and safety management, road safety during material transport, and the ongoing implementation of CSR programs to support local development.
These conditions collectively ensure that the holder adheres to national and international standards, promote sustainable mining practices, and maintain transparency and accountability to stakeholders.
| 17.2.1 | Permitting Requirements |
The key environmental and social licenses and permits submitted for the Project include:
| ● | Kabanga Site |
| ‒ | EIA Certificate (EC/EIS/824) – granted June 2021 |
| ‒ | Ruvubu River Water Use Permit (95100766) – granted September 2024 |
| ‒ | EIA Certificate (EC/EIA/2023/6288) for resettlement host sites – granted September 2024 |
| ● | Kahama Site |
| ‒ | EIA Certificate (EC/EIA/2022/1169) – granted February 2024 |
| ‒ | Variation of EIA (EC/EIA/2022/1169) – granted April 2025 |
| 17.2.2 | Required Bonds |
The Mining Act [Cap 123 R.E. 2019] requires that each mine has an environmental management plan and a closure plan, and that mineral wastes be managed as provided for in the environmental management plan and relevant regulations. It also requires that the abovementioned plans and license conditions are implemented. Furthermore, it provides for the posting of a rehabilitation bond to finance the costs of rehabilitating and making the mining area safe on termination of mining operations if the holder of the SML fails to meet obligations.
The Mining (Safety, Occupational Health, and Environmental Protection) Regulations 2010 (Mining Regulations 2010) require mine closure plans to be submitted by applicants for an SML, and for the posting of adequate financial assurance for mine closure by holders of an SML. Closure related topics in the regulations include Land Productivity (Regulation 198), Physical Stability (Regulation 199), National Heritage (Regulation 200), Reclamation of Mine Facilities (Regulations 201 and 204), Monitoring (Regulation 205), Mine Closure Plan (Regulation 206), and Posting of a Rehabilitation Bond (Regulation 207).
The closure plan must be updated regularly, reviewed, deliberated, and approved by the National Mine Closure Committee. This committee, convened by the Ministry of Minerals, must include representatives of ministries responsible for the management of the environment, land use and natural resources. It must also include regional and district authorities.
Rehabilitation bonds can take the form of an escrow account, capital bond, insurance guarantee bond, or bank guarantee bond. They are coupled with an agreement between the mining licence holder and the GoT.
Page
|
/ / Initial Assessment - Technical Report Summary |
|
| 17.3 | Environmental, Social and Cultural Impact Assessments |
| 17.3.1 | Environmental, Social and Cultural Impact Assessment Background |
ESIAs are critical tools for evaluating the potential environmental and social consequences of projects before they are implemented. A strategic commitment to sustainable development and risk management is fostered when guided by the IFC PS, the Equator Principles, and the Organization for Economic Cooperation and Development (OECD) Guidelines for Multinational Enterprises. Sound environmental and social practices are promoted, and transparency and accountability are encouraged, thus positively impacting development.
These frameworks collectively prioritize ESG considerations, advocating for practices that protect human rights, encourage economic development, and preserve the environment. Nevertheless, their successful implementation and integration into business operations often demand a nuanced understanding and strategic tailoring to align with specific industry contexts and regional dynamics.
| 17.3.2 | Project ESIAs and Baseline Studies |
Several ESIAs have been completed for key components of the Project, including the Kabanga Site, the Kahama Site, and the Resettlement (Relocation Host Site). These are summarized in Table 17-1, which outlines the relevant EIAs, ESIAs, ESMPs, socio-economic baseline data, and planned uplift measures for the Project.
Table 17-1: Summary of the Project EIAs, ESIAs, ESMPs
| Kabanga | Kahama | Kabanga Resettlement Sites | |
| Description and Background |
Proposed Kabanga Nickel Mine, Ngara.
Under previous ownership, ESIA study carried out between 2007 and 2013, EIA Certificate historically approved and certified by the NEMC in September 2013.
|
Proposed Refinery at Kahama, Shinyanga.
The proposed Refinery at Kahama is sited on the Buzwagi Gold Mine site previously owned by Barrick.
|
To address potential physical and economic displacement, a RAP has been developed and is currently in implementation. The RAP outlines seven resettlement sites located within Ngara District, situated outside the mining footprint area, to accommodate displaced households. |
| ESIA/ESMP |
In 2022, TNCL commissioned MTL Consulting Company Limited (MTL Consulting) to update the ESMP to capture changes between 2007 and 2022, and to reflect the current baseline conditions.
The ESMP update was completed in May 2023.
|
In 2022, TNCL commissioned MTL Consulting to undertake an ESIA for the proposed Refinery in Kahama. This was largely to meet the Tanzanian national requirements.
The ESIA was completed in December 2023.
|
In 2023, TNCL commissioned RSK Environmental Ltd to undertake a combined ESIA for the proposed developments within the seven resettlement sites.
The ESIA to Tanzania national requirements was completed in July 2024.
|
| EIA Certificate | Transfer of the EIA Certificate from historical owners to TNCL in June 2021. | EIA Certificate was granted in February 2024. | EIA Certificate for host sites to national standards was granted in September 2024. |
| Current Status | The 2022 updated ESMP to national standards was approved by the NEMC in June 2023. No new EIA certificate was issued as the original EIA certificate remains valid. | 2022 ESIA (to national standards) was approved by the NEMC in February 2024 and EIA certificate granted. | 2024 ESIA (to national standards) was approved by the NEMC in September 2024 and EIA certificate granted. |
| Planned Changes |
The following changes resulted from further optimization:
|
The following changes resulted from optimization:
● development of an above ground dry stack facility1 at |
N/A |
| 1 | The proposed design has subsequently changed to exclude the dry stack and will be assessed. |
Page
|
/ / Initial Assessment - Technical Report Summary |
|
| Kabanga | Kahama | Kabanga Resettlement Sites | |
|
● change in Project production throughput from 2.2 Mtpa to 3.4 Mtpa;
● change in location and footprint of WRD and other facilities; and
● rerouting of water pipeline from Ruvubu River to pass within the SML area. |
Kahama for the storage of residues to replace transport of waste residues (via trucks) to Kabanga Site.
● Other minor technical changes.
|
||
| Impact of Changes/Additional Work | Changes communicated to NEMC – response on 12 June 2024 from the NEMC required TNCL to update the ESMP to reflect the Project amendments, which will subsequently be reviewed and approved by the NEMC. | Change was communicated to the NEMC – response on 15 April 2024 which guided TNCL to undertake a variation of EIA certificate. | N/A |
| Timing of Changes |
MTL Consulting was engaged to update the ESMP as guided by NEMC.
Environmental management plan update process has completed, TNCL is awaiting final approval from NEMC. Final approval is anticipated in Q2 2025.
|
MTL Consulting was engaged to undertake the variation EIA as per guidance from NEMC.
The variation of EIA certificate was approved by NEMC and received in April 2025.
|
N/A |
| Uplift to International Standards Performance Standards (IFC PS) and best practice | The Tanzanian Mining Commission has granted approval to award a contract to a partnership between SLR Consulting (Africa) Proprietary Limited and City Engineering Company Limited (CECL), as required by the Mining Local Content Regulations of 2018, for the ESIA uplift scope. Supplementary studies and the ESIA uplift process have been completed in May 2025. | The Tanzanian Mining Commission has granted approval to award a contract to a partnership between SLR Consulting (Africa) Proprietary Limited and City Engineering Company Limited (CECL), as required by the Mining Local Content Regulations of 2018, for the ESIA uplift scope. Supplementary studies and the ESIA uplift process are nearing completion. Final report is anticipated in June 2025. | The uplift of ESIA to international standards for the proposed developments within the resettlement sites completed May 2025. |
| Socio-economic Data and Baseline | Socio-economic data collection, public consultation and participation formed part of the ESIA. | Socio-economic data, collection, public consultation and participation formed part of the ESIA. | Socio-economic data collection, public consultation and participation formed part of the ESIA. |
| 17.3.3 | Environmental, Social and Cultural Baseline Assessment Summary |
The physical, biological and social baseline assessments for the Kabanga Site, Resettlement, and Kahama Sites have been summarized below.
| 17.3.3.1 | Kabanga Site Location and Baseline |
Kabanga Site
The Kabanga Site, which is a greenfield site located in Northwest Tanzania. The site is approximately 1,300 km northwest of Dar es Salaam and about 130 km southwest of Lake Victoria. The site is located in the Ngara District, 42 km south of the town of Rulenge, 5 km southeast of the nearest village of Bugarama, and close to the border with Burundi and borders the Ruvubu National Park. The Ruvubu River originates in Burundi and defines the international boundary between Tanzania and Burundi to the southwest of the site.
Page
|
/ / Initial Assessment - Technical Report Summary |
|
The villages, Rwinyana, Bugarama, Mukubu, Muganza, and Nyabiganga, are located within the allocated SML area and will need to be relocated as part of the Project.
The Kabanga Site can be accessed through either the North Access Road or Southern Access Road. The North Access Road is 30 km from Ngara via Rulenge, and the Southern Access Road is 70 km from Nyakahura center to the Kabanga Site. Both roads are unpaved and fall under TANROADS and the Ngara District as part of the public road network within the Kagera Region. These public roads will require regular improvements before being used to service the mine activities. The site infrastructure will predominantly be developed within the Nyamwongo River catchment area. The Nyamwongo River, a tributary of the Muruhamba River, flows through the center of the site. Meanwhile, the Muruhamba River, which runs along the southern boundary of the Project area, merges with the Ruvubu River. The Ruvubu River, forming the natural border between Tanzania and Burundi, continues its journey northeastward towards Lake Victoria.
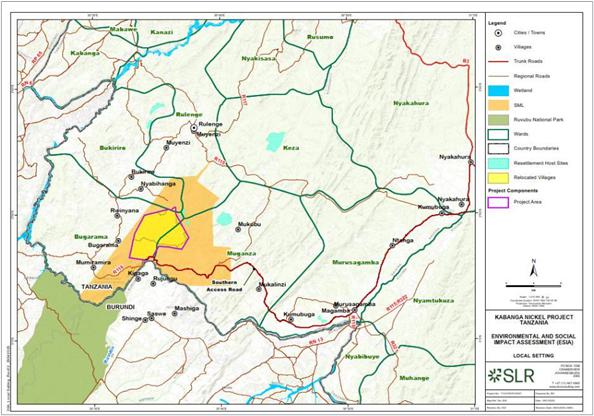
Figure 17-1: Kabanga Project Area and Affected Communities
Baseline Assessment Summary
Baseline Environment – Biophysical Environment
The Kabanga Site is located in a hilly, highland area of northwest Tanzania, within the Ruvubu River sub-catchment draining to Lake Victoria. The region features rocky ridges, steep valleys, and a bimodal rainfall pattern averaging 1,023 mm annually, which influences surface water and streamflow. Wetlands and tributaries support groundwater recharge, ecosystem health, and community water needs.
Both surface and groundwater are vital for domestic use, farming, and livestock. Water quality generally aligns with WHO standards, though natural fluoride and uranium levels occasionally exceed limits. Air quality is influenced by dust, vehicle emissions, and biomass burning; noise remains low due to the rural setting. Soils range from erosion-prone uplands to fertile valley soils used for agriculture.
Page
|
/ / Initial Assessment - Technical Report Summary |
|
The site falls within the Central Zambezian Miombo Woodlands ecoregion, comprising woodlands, grasslands, wetlands, and modified areas. IFC-aligned habitat assessments identified critical, natural, and modified habitats. The Ruvubu River riparian zone is a critical habitat due to species like the endangered Ashy Red Colobus. Other key fauna include the Grey Crowned Crane and Red-faced Barbet.
Surface water ecosystems have been impacted by small-scale agriculture but still perform essential functions such as flood control, streamflow regulation, and habitat connectivity. Notable plant species include the near-threatened African Blackwood and vulnerable Long-tubed aloe. Despite modification for agriculture, wetlands remain ecologically important for water-dependent species and community use.
Baseline Environment – Cultural Heritage
The Ngara District holds significant cultural and archaeological value, linked to the historic Bugufi and Bushubi chiefdoms. Key sites include sacred landscapes such as Shunga Mountain, and archaeological locations like Kirinzi, Goyagoya Hills, and Nyakafandi 2, reflecting Later Stone Age and Iron Age settlements. Although the Batwa no longer reside in the area, their historical presence is reflected through trade and pottery. Archaeological surveys recorded a number or archaeological sites, heritage sites and 364 graves.
Community consultations in Bugarama, Rwinyana, and Nyabihanga wards revealed a strong sense of cultural identity, despite a decline in traditional rituals. Oral histories highlight transboundary links with the Batwa, including trade, intermarriage, and shared customs. Family burial grounds are marked by living tree monuments, a tradition still practiced today. Local heritage also includes harvest dances such as Ngoma wa Saba and spiritual healing practices, with local healers serving as custodians of ancestral knowledge. Several sacred trees and plants remain in the Project area but are under threat from expanding agriculture and development.
Baseline Environment – Current Land Uses
Primary land uses within the Project area are subsistence agriculture and livestock farming, with crop cultivation and grazing being the dominant land uses.
Staple crops like maize, beans, cassava, and permanent crops such as bananas and coffee (the only cash crop) are grown, while livestock including goats, pigs, cattle, and poultry are raised, often on hilltops and ridges. Wetlands support dry-season farming, and beekeeping is also practiced.
Villages are scattered, with houses built from local materials. Infrastructure is limited, with Bugarama as the nearest village to the Kabanga Site, and Rulenge (42 km away) as the closest urban center. Healthcare is basic, mostly provided by dispensaries and one main hospital, with some reliance on traditional healers. Education is relatively well developed, with primary and secondary schools in each village or ward, and vocational centers in larger towns.
Waste management is poorly organized, leading to random dumping or burning. Formal markets are rare, with most trade occurring in informal village centers. Christianity is the dominant religion, with a few mosques present. The natural environment is mainly savanna and grassland, with some woodland, and locals use a variety of plants for medicine, fuel, and building materials.
| 17.3.3.2 | Kahama Site Location and Baseline |
Kahama Site Location
The majority of the Kahama Site is a brownfield site located in the Buzwagi SEZ in the northwest of Tanzania. The site is approximately 800 km west of the main port of Dar Es Salaam and 160 km south of Lake Victoria.
The site is situated in the Kahama District of the Shinyanga Region, in the southeastern part of the Kahama Municipal Council, approximately 4 km east of the town of Kahama. The proposed site is located near the urban town of Kahama, in an area that was extensively developed for gold mining activities. Aside from a forest area to the east, the site is mainly devoid of vegetation.
Page
|
/ / Initial Assessment - Technical Report Summary |
|
The Project footprint requires an area of approximately 300,000 m² for the development of the Kahama Refinery and associated infrastructure, out of an initial allocation of 743,000 m² from the Buzwagi SEZ. The site can be accessed from the B3 paved highway, which connects the towns of Isaka and Kahama, the 1,580 m Kahama Airport, and the Isaka railway hub, which connects to the Port of Dar es Salaam.
The site infrastructure will be developed along the watershed boundary between the Hindagi and Kagozi River catchment areas. The Hindagi River and its tributaries flow in a northwest direction, draining towards Lake Victoria, while the Kagozi River drains towards Lake Tanganyika.
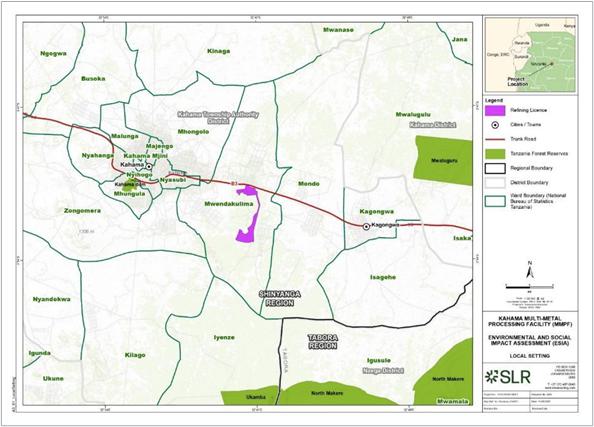
Figure 17-2: Kahama Site Local Setting
Baseline Assessment Summary
Baseline Environment – Biophysical Environment
The area features mostly flat to gently rolling terrain, with elevations between 1,195 and 1,235 mAMSL and gentle slopes under 3%. The Kahama Site experiences two wet seasons (January–May and August–December) separated by a dry period, with annual rainfall averaging 1,121 mm and temperatures ranging from 17.5 °C to 30 °C. Soils are varied but generally low in fertility and can be acidic or sandy.
Hydrologically, the site sits on a topographic divide between two river catchments but lacks significant nearby rivers or streams. Groundwater is vital for local communities and site operations, with water accessed via wells and boreholes. The site contains no natural freshwater bodies, only man-made borrow pits with limited aquatic life, though these may still have some ecological significance.
The Project area falls within the Central Zambezian Wet Miombo Woodlands Ecoregion, adjacent to natural Miombo woodlands and grasslands, but also includes cleared and previously mined land. Species of concern include the Red Aloe, Purple Dalbergia, Fischer’s Ebony, and Java Plum. Wildlife surveys recorded 16 mammal species (none of concern), 115 bird species (one of concern: Tawny Eagle), as well as amphibians and reptiles.
Air quality is affected by domestic fuel use, waste burning, vehicle emissions, and mining activities, with wood and charcoal being major contributors to pollution. Noise levels are influenced by mine closure activities, village life, and natural sounds, with heavy machinery prominent during the day and quieter, natural sounds at night.
Page
|
/ / Initial Assessment - Technical Report Summary |
|
Baseline Environment – Cultural Heritage
The Kahama region is known for its vibrant customs, traditional religion, diverse arts, storytelling, and cultural festivals, with key heritage sites such as the Kahama Old Railway Station and Memorial Park. Local cuisine, shaped by agriculture, is central to cultural life. However, archaeological studies found no significant tangible or intangible cultural heritage at the proposed Kahama Site or nearby, with the nearest important site 13 km away at the Kahama Chiefdom, which features historical buildings and artifacts reflecting precolonial and colonial history. Additional heritage resources, like the “Ngw’anamaludi footprints” and Wasukuma grinding surfaces, are found 20 km away, highlighting the region’s living traditions and oral histories. No significant paleontological resources were identified in the study area.
Baseline Environment – Current Land Uses
The site has historically been used exclusively for mining activities, resulting in a landscape characterized by disturbed ground, residual mining infrastructure, and altered topography (See the Figure 17-3) of the existing Buzwagi Gold Mine infrastructure. It is located within the urbanizing Kahama Municipal Council (KMC) in Tanzania’s Shinyanga Region, a strategic trade hub along routes to neighboring countries. The local economy is driven by mining and trade, but small-scale miners face unstable incomes and regulatory barriers, with women experiencing limited land and financial rights. While most households have durable housing, access to electricity, clean water, and sanitation is uneven.
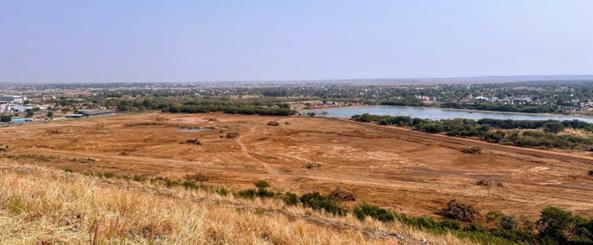
Figure 17-3: Proposed Kahama Site adjacent existing Buzwagi Mine
Agriculture, especially rice and maize, accounts for over half of KMC’s economy and employs about 40% of the workforce, with rice milling and exports being significant. Healthcare services are overstretched, with high rates of malaria, respiratory infections, HIV, and gender-based violence. Crime, including gold smuggling and drug-related violence, is rising, particularly in mining areas.
| 17.3.3.3 | Impact Assessment |
The Kabanga and Kahama Sites’ key environmental, cultural, and social impacts, both positive and negative, were identified based on the nature of the development and the receiving environment, which have been assessed by the ESIA team or specialists.
The Kabanga Site, the site’s ecological sensitivity and the close proximity of surrounding communities have led to the identification of several key impacts. Notable among these are potential impacts on biodiversity, including habitat disturbance and species displacement, air quality degradation from dust and emissions, elevated noise levels from mining activities, and the disturbance or loss of cultural heritage (tangible and intangible) resources. In addition, the social fabric of nearby communities may be affected through increased traffic, in-migration, land use changes, and pressures on local infrastructure and services.
Page
|
/ / Initial Assessment - Technical Report Summary |
|
As the Kahama Site is located within a brownfield Buzwagi SEZ with limited natural vegetation and minimal anticipated environmental impacts. Due to its previously disturbed condition, the area does not contain sites of cultural heritage significance. However, as the Refinery is situated within the town of Kahama, the primary concerns relate to social impacts, including potential effects on local communities, infrastructure, and services.
| 17.3.3.4 | Mitigation, Management Plans and Monitoring |
An ESMP has been developed for the Kabanga and Kahama Sites to address impacts identified in the ESIA. The ESMP serves as a practical framework for managing, mitigating (through detailed mitigation measures and management Plans), and monitoring the environmental and social impacts identified in the ESIA. It ensures that adverse effects are minimized and benefits maximized throughout the Project lifecycle. The ESMP serves as a foundational framework that informs the later development and implementation of the Environmental and Social Management System, ensuring that the Project’s environmental and social management is robust and comprehensive.
| 17.3.3.5 | Kabanga Resettlement Location and Baseline |
Kabanga Resettlement Location
The seven Resettlement/Relocation Sites are situated within five wards across four different villages and one hamlet within Ngara District as further detailed in Figure 17-4. Moreover, Nyakafandi 1 and Nyakafandi 2 are located within the Kabanga SML area but lie outside of the Kabanga Site footprint, approximately 2 km away. Conversely, the remaining five sites are situated outside the SML area.
The accessibility of all seven sites varies due to their different locations, However, despite their distinct locations, being within the same district allows for both air and road access.
The developments within the relocation sites will include construction of new houses, infrastructure, and related services to ensure the physical and socio-economic wellbeing of individuals affected by the Project. However, after construction and commissioning of the relocation sites, the proposed relocation sites will be handed over to Ngara District Council as ultimate owner and operator as detailed in the environmental impact assessment certificate granted for the Project. Therefore, operation and maintenance of the relocation sites will be under the district authorities.
Further, the Project will not acquire the land in the relocation sites, all land shall remain within the respective village authority and Ngara District Council as the overall authority in charge of the villages. Overall, the Project will undertake construction and other proposed developments within the sites, relocate PAPs and upon completion all sites will be handed over to the respective village and district authorities as the overseer and fully responsible for the operation and maintenance.
Page
|
/ / Initial Assessment - Technical Report Summary |
|
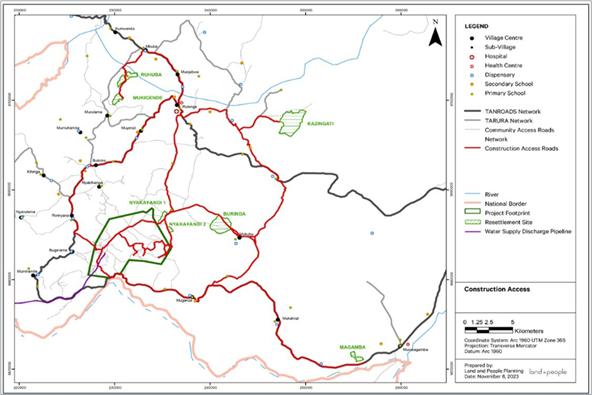
Figure 17-4: Kabanga Site Project Area and Resettlement Sites
Baseline Assessment Summary
A combined ESIA has been completed to both national and international standards, which assesses all seven relocation host sites individually. While all seven relocation host sites have relatively similar baseline characteristics to the Kabanga Site, detailed biophysical, cultural and land uses for each respective site have been assessed and detailed in the ESIA.
Impact Assessment, Mitigation and Monitoring
Key environmental and social impacts, both positive and negative, were identified based on the nature of the respective seven relocation host sites, because of the development and relocation of the PAPs from the Project footprint.
Several impacts were considered ‘high’, for majority of the relocation host sites, including pressure on natural resources, strain on education and healthcare facilities, population influx, occupational health and safety risks, higher traffic accident rates, disease transmission, community safety and security concerns (including gender-based violence), social dislocation, elevated noise and nuisance during construction, introduction of invasive species, and greater habitat fragmentation and ecological disturbance. These impacts along with any ‘high’ impacts were reduced to medium or lower under a mitigated scenario.
Summary of Management Plans and Monitoring
Effective management and ongoing monitoring of environmental and social impacts are essential, with detailed management plans and monitoring required for each of the relocation host sites.
Several management plans have already been developed, and additional plans are recommended for development as part of the ESIA in accordance with international standards, including a Health, Safety and Environment Management Plan throughout the construction phase, Traffic Management Plan, Project Induced In-migration Management Plan, and a Gender Based Violence Management Plan.
Page
|
/ / Initial Assessment - Technical Report Summary |
|
| 17.4 | Stakeholder Engagement Considerations |
Stakeholder Engagement Plans and Assessments have been considered as part of the Project ESIAs and ESMPs, and as part of the RAP. They aim to identify, analyze, and understand the perspectives, interests, and concerns of all stakeholders affected by or interested in the Project. This process ensures that stakeholder voices, including local communities, government agencies, non-governmental organizations (NGOs), and other relevant parties, are actively considered in project planning and decision-making. Engaging stakeholders early and continuously fosters transparency, builds trust, and enhances the Project’s social license to operate. It also helps identify potential social, economic, and environmental impacts, ensuring that management plans are inclusive, responsive, and aligned with stakeholder needs and expectations.
Continuous monitoring and integration of feedback into project planning and updates for the IA ensure that the Project remains compliant with national and international guidelines.
| 17.5 | Land Access and Resettlement |
| 17.5.1 | Overview |
To develop and construct the Kabanga Site, the Project will need to acquire 4,073 ha of land under the SML and implement a RAP to manage land acquisition and resettlement. The RAP addresses the socio-economic impact on the project-affected households (PAH) and is supported by the Kabanga Relocation Host Site ESIA, which focuses on the seven host sites where physically displaced households (PDH) will be relocated. The Projects Social Performance Program encompasses several key plans, including the RAP, livelihood restoration plans, and stakeholder engagement plans, ensuring that the resettlement process is aligned with both national and international standards.
| 17.5.2 | Resettlement Action Plan |
The resettlement process for the Project commenced in early 2022, with a moratorium on new construction declared in July 2022. The RAP was originally prepared in 2013 under a previous joint venture but was paused in 2014. The Project reactivated the RAP in 2022. The Level 1 RAP was completed in August 2023. This foundational plan outlines the resettlement framework, compensation strategies and stakeholder engagement processes, ensuring compliance with Tanzanian regulations. The plan was updated in July 2024, and then in May 2025 to align with international standards, particularly the IFC PS.
The primary goal of the RAP is to restore and, where possible, enhance the quality of life for PAH, ensuring that livelihoods are improved to at least pre-displacement levels. Key elements include minimizing physical and economic displacement, ensuring fair and timely compensation, improving socio-economic conditions, and providing targeted support to vulnerable populations.
| 17.5.3 | Stakeholder Engagement |
Stakeholder engagement is a cornerstone of the resettlement process, ensuring that local communities and key stakeholders are actively involved in decision-making. A Resettlement Stakeholder Engagement Plan (RSEP) was prepared in July 2022 and has continuously been updated to guide all the resettlement-related consultation and engagement activities. As part of the engagement process, the Resettlement Working Group (RWG), previously established in 2012/2013, was reinstated in August 2022, with monthly meetings including representatives from the affected villages, local institutions, and district officials.
| 17.5.4 | Compensation Agreements and Process |
The RAP outlines two primary categories of displacement: physical and economic. Physical displacement involves the loss of dwellings, non-residential structures, and other assets due to land acquisition. Economic displacement refers to the loss of income or access to livelihoods caused by the acquisition of land or restrictions on natural resource use. A total of 353 households will be physically displaced, while 967 households will be economically displaced.
Page
|
/ / Initial Assessment - Technical Report Summary |
|
The RAP aims to mitigate these impacts by providing fair compensation and resettlement to resettlement sites with access to services and grazing land, and addressing supplementary needs such as compensating tenants and conducting additional valuations for unidentified land parcels. The Resettlement Host Site ESIA, completed in 2024 to national standards, and in 2025 to international standards, defines specific mitigation measures to minimize environmental and community impacts at the resettlement sites. Eligibility categories for compensation have been based on the findings of the socio-economic and asset surveys that commenced on July 22, 2022.
PAHs are entitled to compensation under both Tanzanian law and international standards. Compensation schedules were prepared and approved by the Chief Valuer on May 6, 2023, with additional entitlements provided to meet international requirements. Individual compensation agreements, based on census and valuation data, were developed for each PAH and signed by the PAH, TNCL, and village leaders, allowing households to choose their preferred compensation options, including in-kind options for those physically displaced.
The resettlement site selection was based on a review of sites identified during the previous RAP processes and the identification of potential new sites. The chosen resettlement sites were finalized based on hydrology, geotechnical studies and soil assessments. The PAHs were involved in the site selection, leading to a comprehensive agreement on the chosen sites for resettlement. MOUs were signed in October 2023 between TNCL, the Ngara District Council, and village councils, formalizing responsibilities and confirming that resettlement land remains under village and district authority, not TNCL ownership.
| 17.5.5 | Livelihood Restoration |
The Project has committed to comply with the requirements of the IFC PS regarding the impact of the Project on the livelihoods of affected people (whether physically displaced or economically displaced). One of the objectives of IFC PS 5 is “to improve, or restore, the livelihoods and standards of living of displaced persons”. The IFC also encourages resettlement as a sustainable development initiative, i.e., an initiative that leads to an improved standard of living for displaced people.
The Project has developed a Level 1 RAP in 2023, a Level 2 RAP in 2025 and has almost completed all cash compensation payments for PAHs. As part of livelihood restoration planning, the PAHs will be engaged to co-design and consider their livelihood restoration program options before implementation of such programs.
While the underlying objectives of livelihood restoration given the displacement impacts (already addressed by the RAP) will not fundamentally change, the approach and programs will be continually evolved (both short and medium-term) by the Project team and supported by the Monitoring and Evaluation (M&E) Plan.
| 17.5.6 | Land Acquisition and Management Strategy |
The Land Access and Resettlement Project Execution Plan adopts a phased approach to land acquisition and relocation. This strategy, contingent on procurement, engineering and compensation processes, divides the resettlement process into priority areas to ensure a systematic and manageable transition for the affected households.
Physical relocation will only begin once construction of the resettlement housing and essential services is complete. The Project will develop a detailed relocation schedule, outlining resource needs and providing regular progress updates through the RWG and community meetings. The LRP will be implemented alongside the relocation process, providing both immediate and long-term livelihood support. Initiatives under the LRP include agricultural improvements, vocational training and supplementary income-generating activities.
To support the needs of vulnerable groups, the Project has developed a Vulnerable Peoples Plan (VPP), which identifies individuals requiring additional assistance and ensures that they are provided with the resources and support necessary to make informed choices regarding their resettlement and livelihood restoration.
Page
|
/ / Initial Assessment - Technical Report Summary |
|
| 17.5.7 | Relocation and Land Access Risk Assessment |
The Project appointed IBIS Consulting (IBIS) to conduct independent reviews and monitoring of the resettlement process. The primary objective is to ensure that the resettlement activities adhere to the RAP and international standards, particularly IFC Performance Standard 5. Risk assessments have identified key challenges, including potential Project delays, land security issues, livelihood restoration risks, and community integration concerns. Mitigation strategies are in place to address these risks, with regular updates and reviews incorporated into the ongoing resettlement planning process.
By ensuring careful planning, effective stakeholder engagement, and compliance with both national and international standards, the Project aims to achieve a successful and sustainable resettlement process for the Project.
| 17.6 | Mine and Facility Closure, Remediation and Reclamation |
The Projects closure strategy is aligned with the Tanzanian legislation governing environmental management, mining, water, land use, and societal considerations. To ensure that all the closure activities meet the legal obligations addressing environmental rehabilitation, financial provisioning and stakeholder engagement.
The Mine and Facility Closure Plan will comply with globally recognized standards, including the IFC Environmental, Health and Safety Guidelines, the ICMM Closure Framework, and the GISTM.
The Project will follow global best practices when carrying out mine closure activities for the Project, with a particular focus on responsible and sustainable tailings management and closure.
The closure strategy for the Project is focused on the closure of the Kabanga Mine infrastructure, Concentrator, and TSF at the Kabanga Site, and the decommissioning and closure of the Refinery and associated facilities at the Kahama Site all aligned to the closure vision.
To ensure the progressive development of the closure strategy, the Project has drafted a preliminary closure vision, which focuses on developing an eco-enterprise solution with hospitality and training facilities by repurposing infrastructure and facilitating conservation through rehabilitation to establish regional biodiversity corridors to leave a positive legacy. The vision sets the foundation for how the overall strategy will be developed, rolled out and ultimately lead to the development of a comprehensive closure plan with key objectives and targets being set to ultimately ensure the vision can be achieved.
| 17.6.1 | Mine and Facility Closure |
The ICMM is a global industry body that promotes sustainable development in the mining and metals industry. The 10 ICMM Principles set the standard for responsible mining practices, including mine closure.
The Project intends to adhere to the ICMM Principles to ensure that the Project is conducted responsibly and in alignment with global sustainability objectives. The Mining Principles will guide the Project’s approach to determining responsible mine closure that also aligns with broader sustainability goals.
The Mining (Safety, Occupational Health, and Environmental Protection) Regulations 2010 (Mining Regulations 2010) require mine closure plans to be submitted by applicants for an SML, and for the posting of adequate financial assurance for mine closure by holders of SML. Closure related topics in the regulations include land productivity (Regulation 198), physical stability (Regulation 199), national heritage (Regulation 200), reclamation of mine facilities (Regulations 201 and 204), monitoring (Regulation 205), mine closure plan (Regulation 206), and posting of a rehabilitation bond (Regulation 207).
The Project commits to ensure that the closure plan is updated regularly and submitted to the National Mine Closure Committee for review, deliberation, and approval. This committee is convened by the Ministry of Minerals. It must include representatives of ministries responsible for the management of the environment, land use and natural resources. It must also include regional and district authorities. The Project will ensure that, as the closure strategy transitions towards a final closure plan, best practice guidelines and legislative requirements are incorporated, and ongoing stakeholder engagement is undertaken to ensure the positive legacy the Project has envisioned is achieved.
Page
|
/ / Initial Assessment - Technical Report Summary |
|
| 17.6.2 | Tailings Management and Closure |
Global best standards and principles will be applied by the Project during design, operation and closure of the Project tailings facilities, including the potential management of long-term impacts that could arise, such as ongoing post closure water treatment. Several different options for this will be considered during the operational phase and will further be integrated into the operating philosophy of the Project.
These include the GITSM and the ANCOLD guidelines.
Adherence to these standards and principles will ensure integration of social, environmental, and technical considerations into the design and monitoring of tailings facilities and establishment of robust emergency preparedness and response plans to mitigate the risks associated with potential tailings dam failures. Best practice tailings dam management will apply from design through closure. Post-closure plans will comply with the guidelines to ensure the long-term safety and stability of the facilities, ultimately with the aim of protecting the environment and health and safety of the surrounding communities.
| 17.7 | QP Opinion |
In accordance with Section 17 of the TRS report, it is the QP’s opinion, based upon information supplied by the registrant, that the Project, as currently described, has completed relevant studies, permitting processes, and relevant plans, negotiations, or agreements, which are appropriate and sufficient to support the IA. The Project, as described, identified the significant risks to and from environment, social and resettlement, and closure and the Project has adequate provisions to mitigate or eliminate such risks. As the Project evolves, the risks will be reviewed periodically and the mitigations updated as required. The Project has conducted continuous stakeholder engagement and will continue to prioritize this consultation and engagement as the Project progresses. Based on available data and current regulatory frameworks, the QP believes there are reasonable grounds to conclude that necessary permits can be obtained and that no fatal flaws have been identified that would materially impact the potential for eventual Project development, subject to continued compliance with applicable environmental, permitting, social and resettlement and closure requirements.
Page
|
/ / Initial Assessment - Technical Report Summary |
|
This section presents the capital cost estimate (Capex), operating cost estimate (Opex), and sustaining capital cost estimate (Sustaining Capex) prepared for the Project as part of the IA. The estimates are classified as being at an AACE Class 5 level, with an accuracy range of ±50%, consistent with early-stage evaluation standards under Regulation S-K 1300. These estimates support the economic analysis undertaken for the IA and demonstrate the reasonable prospects for economic extraction of the reported Mineral Resources.
The cost estimates are directly underpinned by the technical inputs presented in preceding sections of this report. Specifically, the mining capital and operating costs are based on the schedules, equipment, and development metrics outlined in Section 13; the concentrator and refinery estimates reflect the flowsheets, recovery assumptions, and equipment specifications described in Section 14, and the infrastructure and utilities estimates are aligned with the project-wide infrastructure scope described in Section 15. These interdependencies are consistent across the technical and economic aspects of the IA and provide a coherent basis for the preliminary economic analysis presented in Section 19.
The Capex, Opex, and Sustaining Capex estimates presented below are based on a mine plan that includes Inferred Mineral Resources. A mine plan excluding Inferred Mineral Resources would result in a shorter mine life and correspondingly lower proposed LoM Sustaining Capex and Opex, while Pre-Production Capital Expenditure remains unchanged across both cases. Section 19 presents a comparative evaluation of both scenarios, including and excluding Inferred Mineral Resources.
The Capex and Opex estimates summarized in this section are considered sufficient to support the reasonable prospects of economic extraction required under S-K 1300 for an IA. These estimates support the preliminary economic evaluation discussed in Section 19.
| 18.1 | Capital Cost Estimates |
The Project Capex estimate base date is Q1 2025, and the estimate is presented in United States dollars (USD). The costs of items priced in other currencies were converted to USD. Table 18-1 summarizes the total Project Capex. This includes the Pre-Production Capex, Sustaining Capex (which incorporates underground mine development), Growth Capex largely attributed to construction of the Refinery, and Closure Capex.
Table 18-1: Project Capital Cost Estimate Summary
| Capex Areas | Pre-Production Capex |
Sustaining Capex |
Growth Capex | Closure Capex |
| USD Million | ||||
| 2000 - Mining | 238.13 | 1,227.41 | 17.42 | - |
| 3000 - Concentrator | 254.66 | 50.12 | - | - |
| 5000 - Kahama Refinery | - | 70.04 | 610.24 | - |
| 6000 - Infrastructure, Utilities and Ancillaries | 213.92 | 113.41 | - | - |
| 8000 - Owner’s Cost, Administration and Overheads | 89.65 | 7.96 | - | 82.81 |
| 10000 - Land Access and Resettlement | 77.05 | 5.54 | - | - |
| Contingency | 117.89 | - | 123.79 | - |
| Total Capex | 991.31 | 1,474.48 | 751.45 | 82.81 |
This Capex estimate was prepared as an AACE Class 5 estimate in accordance with AACE International guidelines. It represents a conceptual-level estimate with an anticipated accuracy of ±50%, making it suitable for early-stage project appraisal. The figures are based on the mine, infrastructure, and processing facility designs described in the prevailing sections of this report and originate from a combination of estimates built on detailed and semi-detailed unit costs backed up by market enquiries, internal data, historical benchmarks, and indicative pricing from prior studies and prospective suppliers.
Page
|
/ / Initial Assessment - Technical Report Summary |
|
Vendor quotations not provided in the base currency have been converted to U.S. dollars using the exchange rates displayed in Table 18-2. This estimate excludes any escalation beyond the base date and does not account for future foreign-exchange fluctuations.
Table 18-2: Foreign Exchange Rates
| Currency | Exchange Rate (USD) |
| AUD | 1.5946 |
| EUR | 0.9510 |
| USD | 1.0000 |
| ZAR | 18.5066 |
| TZS | 2,577.1200 |
| CNY | 7.2725 |
| GBP | 0.7945 |
| JPY | 152.5420 |
| 18.1.1 | Pre-Production Capex |
Pre-Production Capex is defined as all capital costs incurred prior to the commencement of revenue generation. For the purposes of this study, Pre-Production Capex encompasses all Capex scheduled to occur before the calendar year 2029, which marks the forecast commencement of operations, first production, and realization of first revenue.
| 18.1.1.1 | A2000 – Mining |
All underground mine development activities scheduled up to 2029 are classified as Pre-Production Capex. Development cost estimates were derived using a first-principles approach, incorporating unit rates for mining activities based on pricing from experienced mining contractors.
| 18.1.1.2 | A3000/A6000 - Concentrator and Infrastructure |
Major equipment costs were developed based on vendor quotations obtained in 2024, which were either revalidated or escalated to reflect the Q1 2025 cost base. Capital cost estimates for the process plant align with the flowsheet and design methodology outlined in Section 14. Where applicable, material quantities were derived from a 3D model and supporting general arrangement drawings.
| 18.1.1.3 | A8000 – Owner’s Cost, Administration and Overheads |
Pre-Production Capex for the Owner’s Costs, Administration and Overheads were developed using a first-principles approach, based on organizational charts and time-phased resource planning aligned with the Project schedule. These costs encompass EPCM services, specialist consulting, the owner’s execution team, general administrative functions, and operational readiness. Insurance estimates were derived from standard industry benchmarks, while closure costs were estimated using adjudicated market rates applied to quantities provided by specialist consultants.
| 18.1.1.4 | A10000 – Land Access and Resettlement |
Enquiries were issued to regional contractors for housing, infrastructure, stormwater control, water systems, and site works. Costs for resettlement, livelihood restoration, and government permitting were based on historical site-specific data, benchmarks, and contractor proposals reviewed by the Project team.
Page
|
/ / Initial Assessment - Technical Report Summary |
|
| 18.1.2 | Growth Capital |
Growth Capex refers to Capex invested beyond the scope of sustaining operations or maintaining initial production levels. For this study, Growth Capex is associated largely with a hydrometallurgical refinery constructed at Kahama and commencing operation in Year 5 of operation, along with further exploration drilling at Kabanga.
| 18.1.2.1 | A2000 – Mining |
Mining Growth Capex has been allocated to support exploration drilling and geophysical surveys across five priority targets: Rubona Hill, Safari Link, Safari Extension, Block 1 South, and regional geophysics. These programs aim to delineate additional mineral resources beyond the current mine plan and support potential future expansions.
| 18.1.2.2 | A5000 – Kahama Refinery |
The Kahama Refinery Capex was developed using a mechanical equipment list derived from the Kahama process flow diagrams, with sizing completed for over 90% of items based on mass and energy balances, flow data, and material properties. Design allowances were applied according to equipment type, duty, and plant area. Vendor quotations, recent project benchmarks, and updated cost databases (within the last six months) were used to determine mechanical equipment costs. These costs served as the primary basis for estimating direct costs, including civil, structural, earthworks, piping, electrical, instrumentation, coatings, spares, first fills, and site buildings, through appropriate factoring. Indirect costs, including Owner’s costs, EPCM, freight, mobilization, temporary facilities, commissioning, and contingency, were also factored proportionally from the mechanical equipment base.
| 18.1.3 | Sustaining Capital |
Sustaining Capex is defined as all Capex incurred following the commencement of revenue-generating operations. It is in addition to the maintenance operating costs. It is required to maintain nameplate production capacity and ensure ongoing legal and regulatory compliance at both the Kabanga and Kahama facilities.
| 18.1.3.1 | A2000 – Mining |
Following the commencement of Project revenue, any subsequent equipment acquisitions and underground capital development required to support ongoing mining activities are categorized as Sustaining Capex.
| 18.1.3.2 | A3000/A6000 – Kabanga Concentrator and Infrastructure |
Kabanga Concentrator and Infrastructure Sustaining Capex were developed using vendor-quoted replacement costs and assigned a service life for key mechanical equipment. The estimate reflects the likelihood of replacement for major plant systems and includes the phased development of supporting infrastructure. This was then benchmarked against other comparable operations and assessed against typical unit costs per tonne of feed treated. The Concentrator Sustaining Capex is tapered in the final years of operation in the economic model.
The TSF raises beyond the initial starter wall are classified as Sustaining Capex, with quantities and costs derived from engineered designs and adjudicated contractor rates. These provisions ensure the ongoing operational integrity, compliance, and capacity of the facility throughout the mine life.
| 18.1.3.3 | A5000 – Kahama Refinery |
The Refinery Sustaining Capex has been estimated using factoring of the Refinery pre-production capital costs. This is a typical method used for this purpose and is commensurate for this scoping level of study. This was benchmarked against other comparable operations and assessed against typical unit costs per tonne of feed treated. The Refinery Sustaining Capex is tapered in the final years of operation in the economic model. This tail minimizes unnecessary capital spend at the end of the proposed LoM.
Page
|
/ / Initial Assessment - Technical Report Summary |
|
| 18.1.4 | Contingency |
The overall contingency applied to the Project is USD 241.68 million representing 16.1% of the Pre-Production and Growth Capex base estimate of USD 1,501.07 million.
| 18.1.4.1 | Pre-production Capex Contingency |
The contingency applied to Pre-Production Capex is 13.5%, equivalent to USD 117.89 million on a base cost of USD 873.42 million. Area-specific contingency percentages were determined based on the level of engineering definition, scope complexity, and risk exposure associated with each project area. Lower contingencies of 10% were applied to the Mining (Area 2000) and Concentrator (Area 3000) areas, reflecting the availability of vendor quotes, benchmarked unit rates, and established technical designs. Contingency of 15% was applied to Infrastructure (Area 6000) and Site Costs (Area 7000), recognizing moderate scope definition and exposure to logistical and environmental variables. A higher contingency of 25% was applied to Owner’s Costs (Area 8000) due to the level of uncertainty in administrative, management, and indirect cost components at this stage. Land Access and Resettlement (Area 10000) carries an 18% contingency due to potential variability in social engagement outcomes.
| 18.1.4.2 | Growth Capex Contingency |
Contingency applied to Growth Capex totals USD 123.79 million, representing 19.7% of the base estimate of USD 627.66 million. This allocation reflects the early-stage nature of the growth scope, which includes the planned expansion of mining activities and the development of the Kahama Refinery. A 10% contingency was applied to the Mining (Area 2000) component, where cost confidence is relatively high due to established exploration parameters. A 20% contingency was applied to the Kahama Refinery (Area 5000), reflecting increased uncertainty associated with future-phase engineering, evolving process integration, and potential design optimization.
These contingency allowances are consistent with the AACE Class 5 estimate classification, reflect industry norms for IA-level studies and meet S-K 1300 requirements.
| 18.1.5 | Capital Estimate Exclusions |
The Capex estimate presented in this report is preliminary in nature and intended for early-stage evaluation purposes only. It does not represent a commitment or guarantee of actual future capital expenditure. The estimate is subject to change as project definition advances and is based on information available at the time of this assessment. The following items are expressly excluded from the capital cost estimate:
| 18.1.5.1 | Commercial, Financial, and Corporate Costs |
Commercial, financial and corporate costs include:
| ● | Financing charges (e.g., interest during construction). |
| ● | Working capital (addressed in Section 18). |
| ● | Corporate overheads and administrative expenses. |
| ● | Vendor price escalation or opportunistic pricing not covered by quotations. |
| ● | Taxes, duties, royalties, and statutory levies unless explicitly stated (incorporated directly into the economic modeling). |
| 18.1.5.2 | Technical Scope and Economic Adjustments |
| ● | Forward escalation or inflation beyond the study base date. |
| ● | Salvage or residual value of temporary construction assets. |
| ● | Disruptions in global supply chains or logistics beyond vendor-quoted terms. |
| ● | Currency fluctuations beyond fixed exchange assumptions. |
These exclusions are consistent with the classification and level of accuracy appropriate for this stage of study.
Page
|
/ / Initial Assessment - Technical Report Summary |
|
| 18.2 | Operating Costs |
An operating cost estimate has been developed for the Mine, the Concentrator and Infrastructure, the Kahama Refinery, and Owner’s Costs. The Opex base date is Q1 2025 and is presented in USD.
Table 18-3 summarizes the total Project Opex. The product logistics costs are built directly into the economic model.
Table 18-3: Average Project Operating Cost Estimate Summary
| Area | Project Cost (USD Million) |
Project Cost per Tonne Processed (USD/t) |
Project Cost per Pound Nickel (USD/lb Ni) |
| 2000 – Mining | 3,685.91 | 54.24 | 1.60 |
| 3000/6000 – Concentrator and Infrastructure | 840.69 | 12.37 | 0.36 |
| 5000 – Kahama Refinery | 1,332.31 | 18.57 | 0.58 |
| 8000 – Owner’s Cost, Administration and Overhead Costs | 256.15 | 4.88 | 0.12 |
| Total Opex | 6,111.06 | 90.06 | 2.67 |
| 18.2.1 | 2000 - Mining |
Mining costs were based on pricing received from Tier-1 mining contractors with relevant experience relating to the mining methods and African experience. These contractor-supplied unit rates were then applied to mining physicals from an initial Mine Plan, which was then annualized and updated based on the Production Schedule (MII basis) used in this IA. The operating costs are the costs associated with direct access, extraction and handling of mineralized tonnes.
| 18.2.2 | A3000/A6000 – Concentrator and Infrastructure |
The Concentrator and Infrastructure operating cost estimate was developed from a zero base, using first principles. The cost estimate includes all labor, power, reagents, materials, utilities and consumables and has been derived based on testwork, mass balances, engineering, as well as other discipline inputs and vendor pricing. They are a combination of fixed and variable costs and are adjusted in the economic model on an annualized basis.
Fixed costs include labor, environmental and permitting costs, and the fixed portion of the plant maintenance costs. They benefit from economies of scale at higher throughput, resulting in a lower unit cost per tonne milled as throughput increases. Variable costs are defined as overall costs that vary depending on the level of production, but on a unit per tonne rate, remain constant. These costs are based on unit consumption rates and are the costs that are incrementally incurred as production rates vary. The variable costs include reagents, most electrical power, water, variable consumable costs (e.g., mill and crusher liners), some elements of the laboratory, and concentrate handling and transport costs.
| 18.2.3 | A5000 – Kahama Refinery |
The Refinery operating cost has been built up from first principles, and includes electrical power, reagents, labor, maintenance, laboratory, and other general and administrative costs. They are a combination of fixed and variable costs and are adjusted in the economic model on an annualized basis. The variable cost component is calculated from the concentrate feed tonnage and the contained sulfur, nickel, copper and cobalt grades. The key Refinery operating cost drivers are the reagents and electrical power (particularly operating the oxygen plant for POX), which make up 57% of the costs, maintenance which comprises 20%, and labor which contributes 11%.
Page
|
/ / Initial Assessment - Technical Report Summary |
|
The build-up of these costs uses conventional engineering practices and meets the expectations of an IA. Reagent consumptions are based on metallurgical testwork and the mass balance consumptions multiplied by current public domain and vendor reagent pricing, incorporating transport costs. Electrical power is based on the mechanical equipment and electrical load list assigned with typical power factors and equipment online time. Labor is built up from a detailed refinery organogram and industry pay-scales, incorporating all labor on-costs. Maintenance is factored from mechanical equipment.
| 18.2.4 | A8000 – Owner’s Cost, Admin and Overheads |
The G&A estimate was developed by identifying the core roles required to support the Project, then applying on-costs such as salaries, allowances, training, and legislated pension and insurance contributions, to build a comprehensive estimate. Assumptions were guided by typical organizational structures and expected support needs, with estimates informed by historical data, industry benchmarks, and vendor quotes.
| 18.2.5 | Product Logistics |
The product logistics costs are built directly into the economic model and incorporate road, rail and ocean shipping to international customers, for both concentrate and final refined products. They are a function of the operational logistics plan as described in Section 15.3.2. Logistics costs for each aspect of product transport have been provided by established and reputable providers obtained as part of a comprehensive logistics study. As part of this workstream there has been engagement with key providers and contractors, including the TRC and TPA.
Page
|
/ / Initial Assessment - Technical Report Summary |
|
| 19.1 | General Description |
LZM has developed an economic model to evaluate the Project on a real basis. The analysis assumes the Project is 100% equity funded. The economic model was prepared on an annual basis, from the projected start of project execution, and continuing through the proposed LoM and closure. The economic model has been audited by SLR Consulting (Canada) Ltd. This section outlines the principal assumptions that underpin the economic model, along with the resulting indicative Project economics. Unless otherwise stated, all monetary values are presented in United States dollars (USD).
This analysis is preliminary in nature and is based solely on mineral resources. The assessment includes Inferred Mineral Resources, which are geologically speculative and lack the level of confidence required for the application of modifying factors. Mineral Resources, in contrast to Mineral Reserves, do not have demonstrated economic viability. Consequently, these Mineral Resources cannot be classified as Mineral Reserves. There is no assurance that the outcomes of this economic assessment will be realized.
The economic model is based on preliminary mine plans, with and without Inferred Mineral Resources, that were developed in accordance with the methodologies described in preceding sections as depicted in the product schedules in Figure 19-1 and Figure 19-2. Inferred material comprises approximately 19% of the total tonnage incorporated within the mine plan. For transparency, this section presents the economic results of the Project both inclusive and exclusive of Inferred Mineral Resources. Inferred tonnes represent approximately 3% of the total production in the first five years and approximately 6% over the first ten years. Sustainable mining of the deposit necessitates the inclusion of Inferred material at appropriate points in the mining sequence to maintain practical and continuous operations.

Figure 19-1: Production Schedule with Inferred Mineral Resources
Page
|
/ / Initial Assessment - Technical Report Summary |
|
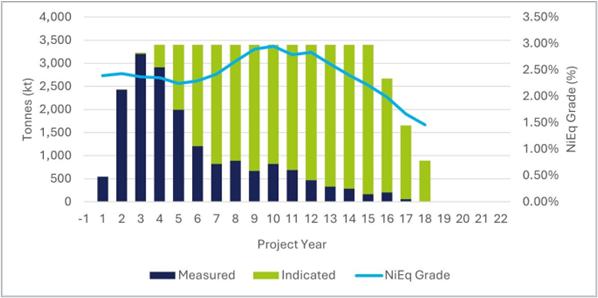
Figure 19-2: Production Schedule without Inferred Mineral Resources
Capital and operating cost estimates, including cost build-ups, contingency allowances, and estimate classification, are detailed in previous sections of this report. All economic results and associated technical and cost data are reported on a 100% Project ownership basis, reflecting the interests held by TNCL, unless otherwise stated. The GoT has a 16% free carry on the Project, through its 16% ownership of TNCL with LZM owning 69.713% on a look-through basis.
As with all economic evaluations of this nature, the analysis presented herein is forward-looking and inherently subject to uncertainty. The outcomes are dependent on a range of assumptions, including forecast macroeconomic conditions, project execution strategies, and future technical and operational data, which may evolve as additional studies are completed.
| 19.2 | Forward-looking Statements |
This document contains “forward-looking statements” within the meaning of the United States Private Securities Litigation Reform Act of 1995. These statements, referred to herein as “forward-looking statements,” are provided as of the date of this document and relate to future events or performance. They reflect current estimates, expectations, projections, or beliefs regarding such future events. Forward-looking statements include, but are not limited to, statements with respect to:
| ● | The estimated quantity and grade of Mineral Resources. |
| ● | Capital cost estimates related to mining and processing (Concentrator and Refinery), infrastructure construction, production commencement, ongoing operations, sustaining capital requirements, and projected payback periods. |
| ● | Forecasts of future production volumes, including tonnes of material processed and contained nickel (and associated by-products) recovered. |
| ● | Estimates of operating costs, Project costs, projected net cash flows, net present value (NPV), and anticipated economic returns from operations. |
| ● | The underlying assumptions supporting the various technical and economic estimates. |
All forward-looking statements are based on the QP’s current understanding, a range of assumptions, and information available as of the date of this report. These assumptions, which are described throughout this TRS, include, but are not limited to:
| ● | The presence, continuity, and estimated grade of nickel mineralization within the defined geological domains. |
Page
|
/ / Initial Assessment - Technical Report Summary |
|
| ● | The geotechnical, hydrogeological, and metallurgical characteristics of the deposit conforming to results obtained from sampling and testing programs. |
| ● | The quantity and quality of water resources available during mining and processing operations. |
| ● | The reliability, performance, and availability of mining and processing equipment and associated infrastructure. |
| ● | Anticipated levels of mining dilution and recovery. |
| ● | Achieved metallurgical recoveries based on representative tests. |
| ● | Reasonable contingency amounts. |
Readers are cautioned that forward-looking statements are inherently subject to various risks and uncertainties, many of which are beyond the control of the issuer. Actual results may differ materially from those expressed or implied by such statements, depending on future events and circumstances, changes in assumptions, and availability of additional technical and economic data.
| 19.3 | Assumptions and Inputs |
| 19.3.1 | Metal Pricing |
Metal prices for the economic analysis were estimated using consensus industry metal price forecasts and compared to those used in other published studies and forecasts by independent research organizations. The metal prices used for the economic analysis are representative of industry forecasts.
The first production from the Project is planned for three years after project commencement, which falls within the long-term period of these forecasts. For this reason, a single price, expressed in 2025 real terms, has been used for all years. The long-term nickel, copper and cobalt price assumptions are shown in Table 19-1.
Table 19-1: Metal Prices
| Metal | Long Term Price (USD/lb) |
| Nickel | 8.49 |
| Copper | 4.30 |
| Cobalt | 18.31 |
The nickel sulfate pricing used in the economic analysis has been provided by Project Blue and relates to the SMM, the largest and most transparent source of sulfate pricing.
| 19.3.2 | Discounting |
A real discount rate of 8% is used for calculating NPV.
The cash flow estimates have been prepared on a 2025 real basis, with discounting commencing in the first year of capital expenditure for construction.
| 19.3.3 | General |
In the analysis, carry balances such as tax calculations are based on real dollars for use in the integrated cash flow calculation.
| 19.3.4 | Taxes, Duties, Levies, and Depreciation |
| 19.3.4.1 | Taxation, Customs and Import Duties |
Taxation assumptions for the Project were provided by Clyde & Co Tanzania, based on applicable Tanzanian legislation that governs taxes, levies, duties, and royalties.
Page
|
/ / Initial Assessment - Technical Report Summary |
|
Both MineCo and RefineCo are subject to corporate income tax (CIT), which is levied at a rate of 30% on net income.
Withholding tax (WHT) applies at varying rates depending on the nature of the payment and the residency status of the recipient: 15% on services provided by offshore non-resident companies to Tanzanian residents, 5% on services between resident entities, 10% on dividends paid to non-resident shareholders, 15% on design fees and technology licensing royalties, and 10% on interest payments.
As a member of the EAC, Tanzania applies a Common External Tariff (CET) structure to imports, comprising four bands: 0% for raw materials and capital goods, 10% for semi-finished goods, 25% for finished consumer goods, and 35% for specified products. Import duties are calculated on the CIF value of the imported goods. However, machinery and spare parts imported by MineCo and used directly in mining operations are exempt from import duty under mining-specific exemptions. Additionally, RefineCo—located within the SEZ—qualifies as a Category A investor and is exempt from import duties during the Refinery development period, consistent with SEZ investment incentives.
The Railway Development Levy (RDL) is imposed at a rate of 2% on the CIF value of imported goods. However, the RDL is waived for items that are exempt from import duty. As such, eligible machinery and spare parts imported by MineCo for use in mining activities, which qualify for import duty exemption, are also exempt from the RDL. These assumptions reflect current interpretations of applicable laws and are subject to change in response to future legislative or regulatory developments.
| 19.3.4.2 | Levies |
Several statutory levies are applicable to the Project and have been incorporated into the operational expenditure assumptions. A fuel levy of TZS 513 (approximately USD 0.19) per liter and a petroleum levy of TZS 100 (approximately USD 0.04) per liter are applied to petroleum products, including diesel, and are included in the delivered fuel cost. A City Service Levy (CSL) of up to 0.3% may be charged by Local Government Authorities, based on turnover generated within their jurisdiction. Additionally, a Skills Development Levy (SDL) is imposed at a rate of 3.5% on the gross cash remuneration of employees and is accounted for within labor-related operating costs. There is also a 1% inspection fee on concentrate exports calculated off the gross value of the concentrate.
| 19.3.4.3 | Depreciation |
As per the Framework Agreement, the application of straight-line pooled asset depreciation at a rate of 20% per annum is permitted. Capital that has not had sufficient time to fully depreciate before the end of the Project’s life is written off in the final year. The amount written off is added to the depreciation amount in the final year.
| 19.3.4.4 | Tax Losses |
For a mining company in a loss-making position, there is the ability to carry-forward losses indefinitely, offsetting these losses against taxable income in any given tax year subject to a cap of 70% of the taxable income in a given tax year.
| 19.3.4.5 | SEZ Fiscal Incentives |
The SEZ will provide defined fiscal and non-fiscal benefits to RefineCo as outlined in Section 3. Fiscal incentives include but are not limited to:
| ● | A 10-year tax holiday in relation to: |
| ‒ | CIT |
| ‒ | WHT on rent, dividends, and interest |
| ‒ | Property tax |
| ‒ | CSL |
Page
|
/ / Initial Assessment - Technical Report Summary |
|
| ● | Exemption from: |
| ‒ | Payment of import taxes and duties for machinery, equipment, heavy duty vehicles, building and construction materials, and capital goods during the development period of refinery (Category A investors only). |
| ‒ | Pre-shipment or destination customs inspection requirements. |
| ● | Remission of: |
| ‒ | Customs duty, VAT, and any other taxes charged on importation of raw materials and capital goods during operations of the Refinery (Category C investor only). |
| 19.3.5 | Royalties |
The GoT imposes 6% mineral royalty on the gross revenue generated by MineCo from the sale of nickel sulfide concentrate. This concentrate is either exported or sold to RefineCo under arm’s-length terms benchmarked by CRU, based on comparable global nickel smelter agreements. Transfer pricing assumptions were developed by LZM, with legal input from Clyde & Co Tanzania. In addition to the royalty, MineCo is subject to an annual Mining Licence Rent payable to the Tanzanian Government. Royalties payable to Lifezone Limited, related to the use of its proprietary hydrometallurgical technology at the Refinery, per the Lifezone-KNL Development, Licensing and Services Agreement.
| 19.3.6 | Working Capital |
Working capital adjustments for both MineCo and RefineCo are as follows:
| ● | Accounts Payable (A/P): 30-day delay |
| ● | Accounts Receivable (A/R): 40-day delay |
| ● | Zero opening balance for A/R and A/P |
| 19.4 | Economic Analysis Results |
| 19.4.1 | Overview |
The IA consists of the Kabanga Mine and Concentrator as well as the Kahama hydrometallurgical refinery.
The IA
| ● | Analyses a production case, underpinned by mineral resources from discrete zones, namely North, Tembo, Main, MNB, and Kima with Inferred tonnes; and North, Tembo and Main without Inferred tonnes. |
| ● | Incorporates the Concentrator processing facilities and associated infrastructure, located at the Kabanga Site, that are required to support 3.4 Mtpa throughput. |
| ● | Assesses the Refinery located at the Kahama Site, commencing operations five years after the first concentrate is produced. Associated development capital, sustaining capital and operating costs are also considered. |
The economic analysis was prepared on a 100% Project basis using the mineral resource-based production schedule, operating, and capital assumptions on an annual basis. The assumptions for taxes and royalties were provided by Clyde & Co Tanzania.
| 19.4.2 | Project Economics |
The Project economics are underpinned by the size and quality of the asset, discussed in previous sections. In addition, payable copper and cobalt credits lower the cash costs significantly, making the Project a globally significant, low-cost producer with robust operating margins. Despite the Project’s sensitivity to nickel price, the economics remain attractive even in a low-price environment.
A summary of the IA cash flow with and without Inferred Mineral Resources is presented in Table 19-2.
Page
|
/ / Initial Assessment - Technical Report Summary |
|
Table 19-2: The Project’s Cash Flow Summary
| Cash Flow Summary | Unit | Value (with Inferred Mineral Resources) |
Value (without Inferred Mineral Resources) |
| Total Revenue from Sales | USD million | 23,680 | 18,198 |
| Realization Costs (Freight and Freight Insurance) | USD million | (1,022) | (818) |
| Net Revenue | USD million | 22,659 | 17,381 |
| Royalty | USD million | (1,347) | (1,034) |
| Operating Costs | USD million | (6,306) | (4,742) |
| EBITDA | USD million | 15,005 | 11,604 |
| Capital (Pre-production and sustaining) | USD million | (3,452) | (3,083) |
| Working Capital Adjustment | USD million | (75) | (18) |
| Pre-tax Cash Flow (undiscounted) | USD million | 11,478 | 8,504 |
| Corporate Tax | USD million | (3,452) | (2,515) |
| Post-tax Cash Flow (undiscounted) | USD million | 8,026 | 5,988 |
| Post-tax Cash Flow (discounted 8%) | USD million | 2,374 | 2,020 |
The Project capital, related to construction, is defined as follows:
| ● | Pre-production Capex: All capital costs incurred prior to the commencement of commercial production. This includes direct and indirect costs associated with mine development, process plant and infrastructure construction, EPCM, and Owner’s costs. It also includes the capitalization of applicable operating costs up to the point of commercial production. |
| ● | Growth Capex: Capital costs incurred to expand the scale of operations through development of the Refinery and extend the mine life through the conversion of Inferred Mineral Resources to higher confidence categories. |
Key project metrics are summarized in Table 19-3, highlighting the Project’s robust economics.
Where Inferred Mineral Resources are excluded, the slightly higher average feed grade (due to the removal of lower-grade Inferred material) results in a minor uplift in internal rate of return (IRR), though with a lower overall NPV compared to the case that includes Inferred tonnes.
Table 19-3: Key Project Metrics
| Item | Unit | Value (with Inferred Mineral Resources) |
Value (without Inferred Mineral Resources) |
| Key Summary Results | |||
| Pre-Production Capex | USD million | 991 | 991 |
| Capitalized Opex | USD million | 152 | 149 |
| Growth Capex | USD million | 751 | 732 |
| Sustaining Capex (incl. Closure) | USD million | 1,557 | 1,210 |
| AISC (net of by-product credits) | USD/lb Refined Ni | 2.71 | 2.73 |
| Project Life | Years | 24 | 20 |
| Discount Rate | % | 8.0 | 8.0 |
Page
|
/ / Initial Assessment - Technical Report Summary |
|
| Item | Unit | Value (with Inferred Mineral Resources) |
Value (without Inferred Mineral Resources) |
| NPV | USD million | 2,374 | 2,020 |
| IRR | % | 22.9 | 23.0 |
| Payback Period | Years | 9.8 | 9.7 |
| Capital Efficiency (NPV/Pre-production Capex (including capitalized Opex) | - | 2.1 | 1.7 |
| Capital Efficiency (NPV/Pre-production + Growth Capex) | - | 1.3 | 1.1 |
| 19.4.3 | Production Summary |
The production summary that underpins the economic model is shown in Table 19-4, with and without Inferred Mineral Resources.
Table 19-4: Preliminary Production Summary
| Item | Unit | Value (with Inferred Mineral Resources) |
Value (without Inferred Mineral Resources) |
| Production | |||
| Concentrator Feed | kt | 67,950 | 52,225 |
| Head Grade | |||
| Nickel Head Grade | % | 1.93% | 1.98% |
| Copper Head Grade | % | 0.26% | 0.27% |
| Cobalt Head Grade | % | 0.14% | 0.15% |
| Concentrator Recovery | |||
| Nickel Recovery | % | 87.3% | 87.1% |
| Copper Recovery | % | 95.7% | 95.5% |
| Cobalt Recovery | % | 89.6% | 89.5% |
| Concentrate Produced | kt | 6,609 | 5,171 |
| Concentrate Grade | |||
| Concentrate Grade - Nickel | % | 17.3% | 17.5% |
| Concentrate Grade - Copper | % | 2.6% | 2.6% |
| Concentrate Grade - Cobalt | % | 1.3% | 1.3% |
| Metal Production (Mine Sales) | |||
| Nickel Recovered to Concentrate - Exports | kt | 361 | 359 |
| Copper Recovered to Concentrate - Exports | kt | 52 | 52 |
| Cobalt Recovered to Concentrate - Exports | kt | 28 | 28 |
| Nickel Recovered to Concentrate - Refinery | kt | 785 | 543 |
| Copper Recovered to Concentrate - Refinery | kt | 118 | 82 |
| Cobalt Recovered to Concentrate - Refinery | kt | 59 | 40 |
| Total Nickel Recovered to Concentrate | kt | 1,146 | 903 |
| Total Copper Recovered to Concentrate | kt | 171 | 134 |
Page
|
/ / Initial Assessment - Technical Report Summary |
|
| Item | Unit | Value (with Inferred Mineral Resources) |
Value (without Inferred Mineral Resources) |
| Total Cobalt Recovered to Concentrate | kt | 87 | 69 |
| Refinery Recoveries | |||
| Refinery Recovery - Nickel | % | 97.2% | 97.2% |
| Refinery Recovery - Copper | % | 93.0% | 93.0% |
| Refinery Recovery - Cobalt | % | 97.7% | 97.7% |
| Refined Metal in Product | |||
| Nickel in Sulfate | kt | 762 | 527 |
| Copper Cathode | kt | 110 | 76 |
| Cobalt in Sulfate | kt | 57 | 39 |
| Refined Product Production | |||
| Nickel Sulfate | kt | 3,419 | 2,364 |
| Copper Cathode | kt | 110 | 76 |
| Cobalt Sulfate | kt | 272 | 187 |
The average estimated all-in sustaining cost (AISC) over the Project life, for both scenarios, (with and without Inferred Mineral Resources) is shown in Table 19-5. Credits from copper and cobalt are included in the cost breakdown.
Table 19-5: Project All-in Sustaining Costs
| Item | Value (with Inferred Mineral Resources) |
Value (without Inferred Mineral Resources) |
| USD/lb Payable Ni* | ||
| Mining | 1.60 | 1.56 |
| Concentrator | 0.36 | 0.37 |
| G&A | 0.12 | 0.15 |
| Concentrate Transport and Insurance | 0.22 | 0.26 |
| Refinery - Kahama, Transport and Insurance | 0.81 | 0.74 |
| Total Cash Cost (Pre By-Product Credits) | 3.11 | 3.08 |
| Royalties | 0.72 | 0.70 |
| Sustaining Capex | 0.64 | 0.63 |
| Total AISC (Pre By-Product Credits) | 4.47 | 4.41 |
| Cu By-Product Credit | (0.56) | (0.54) |
| Co By-Product Credit | (1.20) | (1.15) |
| Total AISC | 2.71 | 2.73 |
Note: *Payable Ni is revenue generated from concentrate exports and refined nickel
Some of the key operating costs are presented Table 19-6.
Page
|
/ / Initial Assessment - Technical Report Summary |
|
Table 19-6: Mining, Concentrator and G&A Operating Costs
| Item | Unit |
Value (with Inferred |
Value (without Inferred |
| Mining | USD/t Milled | 54.24 | 53.34 |
| Concentrator | USD/t Milled | 12.37 | 12.66 |
| G&A | USD/t Milled | 4.88 | 5.68 |
The production profile and the costs described above result in positive Project cash flows. The post-tax annual cash flow and cumulative cash flows with and without Inferred Mineral Resources are presented in Figure 19-3 and Figure 19-4 respectively.
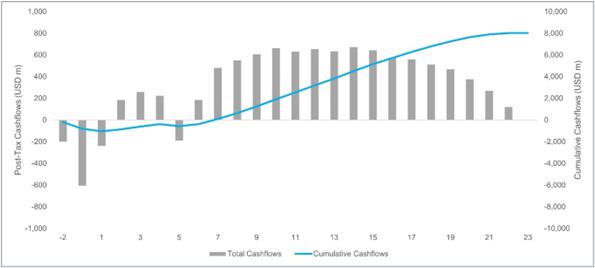
Figure 19-3: Project Cash Flows (with Inferred Mineral Resources)
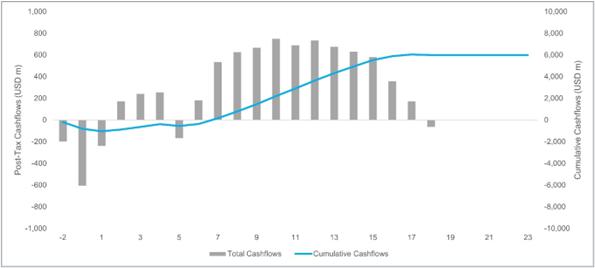
Figure 19-4: Project Cash Flows (without Inferred Mineral Resources)
The financial results with and without the Inferred Mineral Resources are presented in Table 19-8 and Table 19-9 respectively.
Page
|
/ / Initial Assessment - Technical Report Summary |
|
TABLE 19-7: PROJECT NET PRESENT VALUE AND DISCOUNT RATE
|
Description |
Discount |
Project Before Tax | Project After Tax | ||
| Value (with Inferred Mineral Resources) |
Value (without Inferred Mineral Resources) |
Value (with Inferred Mineral Resources) |
Value (without Inferred Mineral Resources) |
||
| Net Present Value (USD Million) | Undiscounted | 11,478 | 8,504 | 8,026 | 5,988 |
| 5.00% | 5,561 | 4,542 | 3,744 | 3,054 | |
| 8.00% | 3,664 | 3,135 | 2,374 | 2,020 | |
| 10.00% | 2,781 | 2,446 | 1,738 | 1,515 | |
| Internal Rate of Return (%) | 28.4% | 28.9% | 22.9% | 23.0% | |
| Project Payback Period (Years) | 8.8 | 8.7 | 9.8 | 9.7 | |
Page
|
/ / Initial Assessment - Technical Report Summary |
|
Table 19-8: Summary of Project LoM Annual Cash Flow (with Inferred Mineral Resources)
| Description | LoM (yrs) | -2 | -1 | 1 | 2 | 3 | 4 | 5 | 6 | 7 | 8 | 9 | 10 | 11+ |
| USD Million | ||||||||||||||
| Gross Revenue | 23,680 | - | - | 153 | 700 | 856 | 895 | 849 | 1,021 | 1,199 | 1,265 | 1,336 | 1,373 | 14,034 |
| Freight Costs | (972) | - | - | (0) | (42) | (53) | (56) | (54) | (52) | (43) | (47) | (51) | (53) | (522) |
| Freight Insurance | (50) | - | - | (0) | (2) | (2) | (2) | (2) | (2) | (2) | (2) | (3) | (3) | (28) |
| Net Revenue | 22,659 | - | - | 152 | 655 | 801 | 837 | 792 | 967 | 1,154 | 1,216 | 1,282 | 1,317 | 13,484 |
| Royalties, Fees and Levies | (1,347) | - | - | (11) | (53) | (65) | (68) | (64) | (65) | (56) | (61) | (66) | (69) | (769) |
| Operating Costs | (6,306) | - | - | (7) | (218) | (267) | (271) | (201) | (292) | (309) | (311) | (306) | (317) | (3,808) |
| EBITDA | 15,005 | - | - | 133 | 385 | 469 | 499 | 528 | 610 | 789 | 844 | 910 | 932 | 8,907 |
| Pre-production Capex (incl. capitalized Opex) | (1,143) | (198) | (598) | (347) | - | - | - | - | - | - | - | - | - | - |
| Growth Capex | (751) | (1) | (7) | (10) | (5) | - | (106) | (425) | (178) | - | (6) | - | - | (12) |
| Sustaining Capital | (1,474) | - | - | - | (105) | (119) | (81) | (203) | (55) | (80) | (108) | (102) | (64) | (557) |
| Closure | (83) | - | - | - | - | - | - | - | (1) | - | - | - | - | (82) |
| Working Capital Adjustment | (75) | - | - | (15) | (35) | (11) | (3) | (1) | (48) | (74) | (6) | (7) | (3) | 129 |
| Pre-tax Cash Flow (undiscounted) | 11,478 | (199) | (605) | (239) | 239 | 339 | 308 | (102) | 327 | 635 | 724 | 802 | 865 | 8,384 |
| Corporate Tax | (3,452) | - | - | - | (54) | (81) | (84) | (87) | (143) | (154) | (174) | (196) | (203) | (2,276) |
| Post-tax Cash Flow (undiscounted) | 8,026 | (199) | (605) | (239) | 185 | 258 | 224 | (189) | 184 | 481 | 550 | 606 | 662 | 6,108 |
Page
|
/ / Initial Assessment - Technical Report Summary |
|
Table 19-9: Summary of Project LoM Annual Cash Flow (without Inferred Mineral Resources)
| Description | LoM (yrs) | -2 | -1 | 1 | 2 | 3 | 4 | 5 | 6 | 7 | 8 | 9 | 10 | 11+ |
| USD Million | ||||||||||||||
| Gross Revenue | 18,198 | - | - | 149 | 688 | 888 | 927 | 871 | 994 | 1,274 | 1,378 | 1,468 | 1,496 | 8,065 |
| Freight Costs | (788) | - | - | (0) | (42) | (54) | (57) | (55) | (51) | (47) | (53) | (58) | (60) | (302) |
| Freight Insurance | (39) | - | - | (0) | (2) | (2) | (2) | (2) | (2) | (3) | (3) | (3) | (3) | (16) |
| Net Revenue | 17,381 | - | - | 149 | 645 | 832 | 867 | 814 | 941 | 1,224 | 1,322 | 1,407 | 1,433 | 7,747 |
| Royalties, Fees and Levies | (1,034) | - | - | (11) | (52) | (67) | (70) | (65) | (64) | (62) | (69) | (76) | (78) | (420) |
| Operating Costs | (4,742) | - | - | (7) | (214) | (273) | (272) | (202) | (292) | (307) | (311) | (305) | (316) | (2,243) |
| EBITDA | 11,604 | - | - | 131 | 378 | 492 | 526 | 546 | 585 | 855 | 941 | 1,026 | 1,039 | 5,085 |
| Pre-production Capex (incl. capitalized Opex) | (1,140) | (198) | (598) | (345) | - | - | - | - | - | - | - | - | - | - |
| Growth Capex | (732) | (1) | (7) | (10) | (5) | - | (106) | (425) | (177) | - | - | - | - | - |
| Sustaining Capital | (1,132) | - | - | - | (115) | (148) | (71) | (197) | (48) | (61) | (99) | (113) | (47) | (233) |
| Closure | (78) | - | - | - | - | - | - | - | (1) | - | - | - | - | (77) |
| Working Capital Adjustment | (18) | - | - | (15) | (35) | (15) | (4) | 0 | (43) | (85) | (9) | (9) | (2) | 198 |
| Pre-tax Cash Flow (undiscounted) | 8,504 | (199) | (605) | (238) | 223 | 329 | 345 | (77) | 316 | 709 | 833 | 904 | 989 | 4,973 |
| Corporate Tax | (2,515) | - | - | - | (52) | (88) | (90) | (92) | (134) | (175) | (206) | (237) | (240) | (1,201) |
| Post-tax Cash Flow (undiscounted) | 5,988 | (199) | (605) | (238) | 172 | 241 | 255 | (168) | 182 | 534 | 627 | 667 | 750 | 3,772 |
Page
|
/ / Initial Assessment - Technical Report Summary |
|
| 19.4.4 | Sensitivity Analysis |
The QP analyzed the sensitivity of NPV and IRR to key variables by adjusting each metric between -30% and +30% in 10% increments. Variables included nickel price, nickel concentrate payability, capital costs, operating costs and discount rate. The analyses are presented graphically for post-tax NPV and IRR, showing that sensitivity is highest for the nickel price, followed by discount rate. Sensitivity to metal price is comparable to other production drivers, like nickel grade, nickel concentrator recoveries and grade. Sensitivities to NPV and IRR are presented in Figure 19-5 to Figure 19-8: Sensitivity Analysis of Post-Tax IRR (without Inferred Mineral Resources)

Figure 19-5: Sensitivity Analysis of Post-Tax NPV (with Inferred Mineral Resources)

Figure 19-6: Sensitivity Analysis of Post-Tax NPV (without Inferred Mineral Resources)
Page
|
/ / Initial Assessment - Technical Report Summary |
|
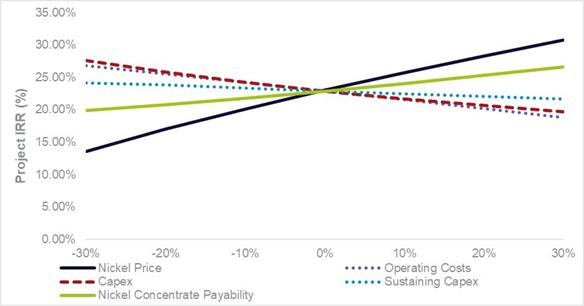
Figure 19-7: Sensitivity Analysis of Post-Tax IRR (with Inferred Mineral Resources)
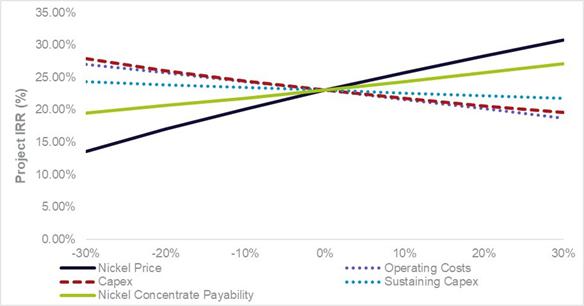
Figure 19-8: Sensitivity Analysis of Post-Tax IRR (without Inferred Mineral Resources)
Page
|
/ / Initial Assessment - Technical Report Summary |
|
In addition to SML 651/2021, TNCL holds six prospecting licences (101.44 km2) in the surrounding area, which were granted in 2022. Five of these licences are considered to cover ground prospective for nickel sulfide mineralization, whereas the sixth licence was staked to cover a back-up potential granite aggregate source.
The SML is also surrounded by nine prospecting licences fully or jointly held by Adavale Resources Limited, with most of these licences originally held by previous owners of the Project. These licence areas were relinquished primarily due to their perceived low potential to host economic nickel sulfide mineralization at the time.
Northwest Tanzania is an established mining region, hosting several major mines, with gold mining being predominant. Notable operations have included Golden Pride and the Williamson Diamond Mine; Bulyanhulu, North Mara, and Buzwagi Gold Mines operated by Barrick and the Geita Gold Mine operated by AngloGold Ashanti.
No other relevant data / information has been supplied.
Page
|
/ / Initial Assessment - Technical Report Summary |
|
| 22.1 | Geology and Mineral Resources |
The Mineral Resource estimates in this report are based on resource modeling completed and published in December 2024. The QP has prepared the modeling and reviewed supplied data and considers the MRE to be acceptable.
Mineral Resource estimates in the IA TRS are reported in accordance with U.S. Regulation S-K subpart 1300 rules for Property Disclosures for Mining Registrants (S-K 1300).
The IA TRS Mineral Resource estimates were shown to meet reasonable prospects for economic extraction through an IA analysis prepared by DRA. The IA has been prepared to demonstrate reasonable prospects of economic extraction, not the economic viability of the MRE. The IA is preliminary in nature, it includes Inferred Mineral Resources that are considered too speculative geologically to have modifying factors applied to them that would enable them to be categorized as Mineral Reserves, and there is no certainty that this economic assessment will be realized.
| 22.2 | Mining Methods |
There is no Mineral Reserve estimate. The work on the mining section meets the requirements of an S-K 1300 IA. The IA was completed assuming two decline systems would be suitable to access the North, Tembo, Main, Kima, and MNB zones, with the mining method being longhole stoping with paste backfill. The mining rate ramps up to a sustained 3.4 Mtpa of mill feed being hauled to the Concentrator. Indicative pricing was received from suitably experienced and qualified mining contractors, which has been used as both the basis for costing and mine scheduling. The IA cash flow includes Inferred Mineral Resources that are considered too speculative geologically to demonstrate economic viability. The Inferred Mineral Resources, however, only make up 3% of the scheduled production in the first five years, and 6.4% in the first ten years. The mining costs in the economic analysis are informed by a detailed level mine design.
| 22.3 | Hydrogeology and Groundwater Modeling |
Hydrogeological investigations confirm limited groundwater use in the area, primarily for domestic and agricultural purposes. Groundwater ingress to the underground mine is expected to be relatively low due to the low permeability of the surrounding rock, and it is not considered a ‘wet mine’. The mine dewatering will provide the bulk of raw water required for the Kabanga Mine and Concentrator operations. Dewatering will induce a drawdown cone, potentially affecting springs; however, no direct impact on human receptors is anticipated due to the planned community relocation. Groundwater baseflow reduction is predicted to be minor (<6%) and unlikely to impact surface water significantly. Groundwater recovery post-closure is expected within 15 years, with spring flow resuming. Mine void decant may occur 17 years post-closure, necessitating active decant water management.
| 22.4 | Geochemistry |
Geochemical testing has been undertaken on waste rock, feed, tailings and paste samples. Both pyrrhotite and non-pyrrhotite tailings are acid-generating. Kinetic and sub-aqueous leach tests demonstrate ongoing potential for acid and metal release under weathering and submerged conditions, though sub-aqueous conditions significantly reduce contaminant concentrations over time. Process water quality modeling from both tailings types indicates risks of contamination and thus the need for robust tailings and water management strategies to mitigate long-term environmental impacts.
Waste rock will largely be used in mine backfill, reducing geochemical impacts.
| 22.5 | Metallurgy and Process |
| 22.5.1 | Kabanga Concentrator |
The Concentrator has been sized to process 3.4 Mtpa of feed and includes all feed processing requirements from the RoM storage pad through to final Ni-Cu-Co concentrate product load-out, and pumping of the tailings to the TSF and backfill plants. The flowsheet consists of crushing, wet grinding, flotation and dewatering, and a pyrrhotite flotation circuit that produces a separate pyrrhotite flotation concentrate (referred to as pyrrhotite tailings) and a non-pyrrhotite tailings stream that can be used in the backfill process.
Page
|
/ / Initial Assessment - Technical Report Summary |
|
The process design has been developed based on extensive testwork and technical assessments, historical data and DRA design information. The flowsheet is based on a conventional two-stage crushing and ball milling circuit, followed by flotation and utilizes conventional size reduction and mineral beneficiation unit processes, which are well established in industry. The flowsheet also uses a conventional reagent regimen which has historically been proven as a suitable processing route for base metal sulfide ores, including nickel, copper and cobalt minerals. The proposed Concentrator design and sizing adopts standard engineering practices, incorporates typical design allowances, and is a robust and flexible design.
The engineering design has been undertaken with reference to international and national standards and applicable laws. The design has also taken cognizance of the environmental and social impact of the Concentrator and has sought to minimize the impact of noise, dust, light and visual pollution, whilst ensuring safe construction and operation.
| 22.5.2 | Kahama Refinery |
The Refinery has been designed to process the Kabanga concentrate and generates 50 ktpa of nickel contained in nickel sulfate. Production from the Refinery commences 5 years after the first concentrate production. The Refinery includes all equipment from concentrate storage through to final refined products, specifically battery grade nickel sulfate, cobalt sulfate, and LME Grade A copper cathode. The flowsheet consists of concentrate storage and repulping, POX to extract the base metals, neutralization of the POX discharge with limestone, solvent extraction to separate and purify the metals, electrowinning for copper metal production, crystallization of separate nickel and cobalt sulfates, and product bagging. Residue and liquor bleed streams from the plant are pumped to the adjacent decommissioned Buzwagi Gold Mine pit for tailings storage.
The process design was developed based on extensive testwork programs conducted as part of separate studies for the Project, combined with LZM’s hydrometallurgical technology. The flowsheet has been adapted to suit the mineralogical and chemical characteristics of the Kabanga concentrate and selected final products. The unit operations in the flowsheet are based on conventional industry practice, arranged to capitalize on the low impurities present in the Kabanga concentrate.
A refinery demonstration plant will be constructed and operated at the Kahama Site once nickel concentrate is available from the Kabanga Site, but prior to the full-scale Refinery construction and operation. This will be undertaken to optimize and finalize the flowsheet and further derisk the Refinery.
| 22.6 | Infrastructure |
Tanzania has an established and successful mining industry supported by the necessary national and regional infrastructure. In addition, the Government is expanding Tanzania’s national infrastructure with a number of major projects already well underway to increase power generation and distribution, rail capacity – specifically an upgrade to an electrified SGR, water supply and ports. The Port of Dar es Salaam has sufficient capacity to support Project construction and operation.
The Kabanga Site and Kahama Site infrastructure and logistics have been designed and optimized based on reasonable engineering testwork and assumptions. The infrastructure engineering design ensures compliance with local and international regulations, guaranteeing safety, sustainability and functionality.
The Kahama Site further benefits from being close to an established urban area, with direct connections to paved roads and a national highway connecting it to Dodoma and Dar es Salaam. The site is within close proximity to a railhead at Isaka with the SGR, expected to reach this terminal in 2026. Existing connections are available to a bulk water supply and the national energy grid. The existing infrastructure at the Kahama Site includes roads, buildings and water treatment facilities.
Page
|
/ / Initial Assessment - Technical Report Summary |
|
| 22.6.1 | Water |
At the Kabanga Site, groundwater inflows into the underground mine, surface run-off, and recycling of process water are expected to largely meet the Kabanga Mine and Concentrator’s water needs, with occasional top-ups from the Ruvubu River. Excess water can be treated and discharged to the river as required. Acidic mine water and seepage from WRDs will be collected in PCDs and reused after treatment. An extended duration for post-closure water treatment has been catered for in the closure cost estimates to ensure environmental compliance and best practice.
| 22.6.2 | TSF |
The TSF will be a lined, engineered, valley-type structure with pyrrhotite tailings deposition under a minimum 0.8 m water cover due to its oxidizing nature. With seepage containment systems and proper functioning of liners and underdrains, the environmental impact remains low. System failure could result in localized groundwater and surface water contamination, reinforcing the importance of robust design and monitoring. A water balance for the TSF, has been combined with a geochemical model to enable a comprehensive simulation. The geochemical interactions between tailings leachate and the environment are simulated, incorporating the dynamics of water movement and associated geochemical changes.
| 22.7 | Environmental |
The Project’s approach to ESG reflects a comprehensive strategy that ensures compliance, fosters transparency and promotes sustainable development. Through strong governance policies, continuous stakeholder engagement, and alignment with international standards, the Project is well-positioned to achieve its environmental and social objectives while contributing to Tanzania’s economic growth. The Project is set to demonstrate responsible mining, ensuring long-term success and positive contributions to the local communities and the environment.
| 22.8 | Market Studies |
Markets for nickel, copper, and cobalt are well established and demand for these metals is expected to grow in the long term, given the global trend of decarbonization and electrification. All three metals are key components in batteries, consumer electronics, energy storage and renewable energy capacity, and the outlook for these sectors remains robust.
A nickel-rich sulfide concentrate containing payable levels of copper and cobalt and low, unpenalizable levels of impurities will be produced at the Kabanga Site. Initially, concentrate will be sold to the export market for the first five years of operations. The Project has received indicative, non-binding offtake terms for 100% of the concentrate during this period. Once operational, the Kahama Refinery will refine concentrate to high-grade products. Any concentrate production exceeding the Refinery capacity, will be exported.
Project partners, potential investors and customers have been engaged in the determination of the preferred final refined nickel and cobalt products. This has supported the selection of battery-grade nickel sulfate and cobalt sulfate products for the purposes of the IA.
The metal prices used in the IA are based on an assessment by LZM, in collaboration with the QP, of recent market prices, long-term forward curve prices, and consensus prices from analysts and institutions. The values used in the economic analysis undertaken for the IA are taken from Q2 2025 consensus pricing for nickel, copper and cobalt.
Pricing for refined products has been provided by Project Blue and considers the SMM, the largest and most transparent source of sulfate pricing.
The assessment of the long-term metal prices has been made using industry standard practices and is suitable for use in the IA.
Page
|
/ / Initial Assessment - Technical Report Summary |
|
| 22.9 | Economic Analysis |
The IA TRS is based on Mineral Resources only. The Project has been evaluated using long-term consensus nickel pricing of USD 8.49/lb. The base case after tax cash flow for the Project with the Inferred Mineral Resource, provides an NPV of USD 2,374 million at an 8% discount rate, with an after-tax IRR of 22.9% and a payback of 9.8 years.
The economic analysis is supported by advanced study data for the Kabanga Site, detailed tax and royalty calculations, and concentrate payabilities based on indicative, non-binding agreements.
| 22.10 | Risks and Uncertainties |
| ● | Tanzania is a constitutional multi-party democracy and due to the political dominance of the governing CCM party the regulatory environment is expected to remain stable. Tanzania has low unemployment and a fast-growing economy supported by ongoing infrastructure development. |
| ● | Recent negotiated settlements and policy clarifications have improved investor sentiment, but risks around regulatory predictability and resource nationalism remain. |
| ● | A Framework Agreement was signed between the GoT and KNL in 2021, followed by an SML for the development and operation of the Project, which included the requirement to construct a refining operation. The current plan is for a high-grade nickel sulfide concentrate to be exported for five years before the Refinery is brought online, whereafter refined products are to be exported. LZM will continue to engage with GoT to ensure that the proposed Project schedule is acceptable, given the stipulation in the SML, or have the license updated if required to reflect this. Tanzania encourages in-country beneficiation, which aligns with the Project strategy to develop a refinery in the country at the appropriate time. The Project will require an export permit to sell un-beneficiated concentrate during the first five years, and when refinery capacity is fully utilized. There is, however, a precedent in that at least four other mining companies have been issued an export permit for un-beneficiated product by the GoT, and LZM is confident that it too will be granted one. |
| ● | An equitable EBSP is outlined in the Framework Agreement and describes the requirement for a Joint Financial Model (JFM) to guide the management and operations and how and when the GoT will derive income from taxes, royalties, duties, levies and dividends from its 16% interest in the Project. The JFM currently exists in draft between KNL and the GoT, and LZM will continue to engage with the GoT to ensure that this is finalized and signed by the parties, giving investors certainty on the quantum of taxes, royalties, duties, etc. Finalization of the JFM is a condition precedent for Project FID and therefore any delays could impact the overall Project execution timeline. |
| ● | Responsibility for the development of the 220 kV bulk electrical supply rests with TANESCO. There is a schedule and completion risk to the Project, and LZM will continue to engage regularly and closely with TANESCO to progress permitting and planning to ensure timely completion. TANESCO also retains the responsibility to undertake ESIAs and relocations required for construction. |
| ● | For the Project to proceed, the relocation of PAPs will need to be completed to provide access to the Project construction areas. A RAP aligned with both national and international standards has been developed to address the socio-economic impact on the PAHs. 96% of the required cash compensation agreements have been signed, and the PAHs have indicated their willingness to be resettled, allowing the Project to commence with the building of houses and relocation from priority areas. Ongoing engagement through the established RWG is planned to ensure that early resettlements proceed without delay after FID. |
| ● | No fatal flaws have been identified that would materially impair the technical or economic viability of the Project. Risks remain typical for this stage of project development and have been appropriately disclosed and considered in sensitivity analyses. |
Page
|
/ / Initial Assessment - Technical Report Summary |
|
The QPs recommend advancing the Project as described in the IA TRS by finalizing the data collection, engineering, and design required to complete the FS for the Kabanga Mine and Concentrator. Furthermore, it is recommended to continue with government engagement, Project permitting processes, and critical resettlement workstreams.
| 23.1 | Geology and Mineral Resources |
Key recommendations regarding Geology and Mineral Resources are:
| ● | Continue to update and evaluate the Mineral Resources as additional information becomes available. |
| ● | Test for further extensions of mineralization, such as at Safari Link, and develop a regional exploration program to test other identified geophysical anomalies, such as Rubona Hill. |
| ● | Additional infill drilling and interpretation to convert Inferred Mineral Resources to Measured and Indicated Mineral Resources. |
| 23.2 | Mining Methods |
| ● | Continue with geotechnical, ventilation, and mine planning studies and design to support the FS completion and Project development. |
| ● | Continue to advance mining contractor tender process. |
| 23.3 | Hydrogeology and Surface Water |
| ● | The hydrogeological model should be updated to reflect any future changes in the mine plan, tailings deposition and WRD dump size, and continually validated using ongoing monitoring data to maintain its reliability. |
| ● | A monitoring program for groundwater levels and quality around the TSF has already commenced and should continue monthly (levels) and quarterly (quality), both pre- and post-operationally, to verify modeling assumptions. |
| ● | The overall water and salt balance should be revalidated upon finalization of the mine plan, WRD and TSF designs, which will likely result in a reduction in planned water treatment, both during operations and at closure. |
| 23.4 | Metallurgy and Processing |
| 23.4.1 | Kabanga Concentrator |
| ● | Conduct oxidation testing, iron feed grade and pyrrhotite tailings tonnage investigations with further concentrate characterization for materials handling. |
| ● | Review plant layout and other capital optimizations. |
| ● | Finalize Concentrator flowsheet. |
| 23.4.2 | Kahama Refinery |
| ● | Undertake supporting testwork and marketing studies to confirm the production of nickel and cobalt sulfate as final products. |
| ● | Commence Refinery PFS and stage gate approval. |
| ● | Commence with the design and construction of a demonstration plant at Kahama Site. |
| ● | The demonstration plant should process the Kabanga concentrate. |
Page
|
/ / Initial Assessment - Technical Report Summary |
|
| 23.5 | Infrastructure |
| 23.5.1 | Kabanga Site |
| ● | Continue engagement with TANESCO to ensure the delivery of the 220 kV overhead line in accordance with the Project schedule. |
| ● | Advance the Kabanga TSF studies with continued adherence to national and international guidelines including the Tanzanian Dam Safety Guidelines requirements and the GISTM standards, with ongoing reviews of the TSF design by an Independent Tailings Review Board, a Tanzanian Ministry of Water Approved Professional Person (APP), and other subject matter experts, who continue to be engaged. |
| ● | The future inclusion of an aerodrome at the Kabanga Site should be investigated to reduce the amount of road traffic during operations, improve emergency response, and mitigate security risks. |
| 23.5.2 | Kahama Site |
| ● | Additional geotechnical and hydrogeological studies, assessments and continued water monitoring to confirm the suitability of the Buzwagi open pit for refinery residue deposition. |
| 23.5.3 | Logistics |
| ● | Engage with TRC regarding the completion of the SGR line between Tabora and Isaka, including associated sidings and to secure the Project capacity on the line. |
| ● | Investigate opportunities to utilize the SGR line for the execution phase of the Project. |
| ● | Further engagements with GoT port authorities and freight forwarding agents. |
| 23.6 | Environmental and Social Studies, Permitting and Plans |
| ● | Finalize the remaining ESIAs to IFC standards. |
| ● | Prioritize effective and internationally compliant resettlement and livelihood restoration. |
| ● | Continue with regular, transparent communication channels with all Project stakeholders. |
| ● | Continue GoT engagement on all outstanding Project permits and licenses. |
| 23.7 | Economic Analysis |
| ● | Continue negotiations for concentrate offtake agreements. |
| ● | Negotiate and finalize the JFM, including taxes, royalties, duties, levies, dividends, and terms of the financing of the GoT’s 16% free carry, as outlined in the Framework Agreement. |
| ● | Negotiate and finalize shipping rates, port charges and freight forwarding handling fees. |
| 23.8 | The Project Work Plan and Costs for Recommended Work |
| ● | The Project has appointed DRA and other specialized consultants to finalize an FS for the Kabanga Mine & Concentrator, with anticipated completion in 2025. The FS will conclude a comprehensive work program, which commenced in 2022, comprising resource drilling, engineering studies, a RAP, Owner’s team and in-country operations with a total spend of approximately USD 140 million, of which 98% is committed. |
| ● | The estimated costs associated with the IA recommendations are provided in Table 23-1. It should be noted that approximately USD 400,000 of the estimated costs for the Kabanga Site are included as part of the USD 140 million budget. |
Page
|
/ / Initial Assessment - Technical Report Summary |
|
Table 23-1: Summary of Costs for Recommended Work
| Discipline | Description | Kabanga Site and FS Cost |
Kahama Site Cost |
| (USD '000) | |||
| Mining Methods | FS Mining studies | 200 | |
| Mining Methods | Geotechnical drilling & testwork | 700 | |
| Hydrogeology & Surface Water | Modeling updates and revised salt and water balance | 70 | |
| Metallurgy and Processing | Feed oxidation testwork and concentrate characterization | 50 | |
| Metallurgy and Processing | Refinery testwork and PFS | 1,200 | |
| Infrastructure | Kabanga TSF studies | 50 | |
| Infrastructure | Kahama residue pit disposal studies | 450 | |
| Infrastructure | Logistics studies & engagements | 60 | |
| Environmental & Permitting | ESIAs to IFC standard & ongoing engagements | 80 | 20 |
| TOTAL | 1,210 | 1,670 | |
| 23.8.1 | QP Opinion – Geology and Mineral Resources |
The QP believes that the level of uncertainty has been adequately reflected in the classification of Mineral Resources for the Project. Notwithstanding this, the MRE presented in Section 11 may be materially impacted by any future changes in the break-even cut-off grade, which may result from changes in mining method selection, mining costs, processing recoveries and costs, metal price fluctuations, or significant changes in geological knowledge.
| 23.8.2 | QP Opinion – Other |
It is the opinion of DRA, responsible and acting as the QP for the Project, that the recommendations made are appropriate for advancing the Project through to the completion of the FS currently underway.
Page
|
/ / Initial Assessment - Technical Report Summary |
|
Section 1: Executive Summary
U.S. Securities and Exchange Commission (SEC), 2020. Regulation S-K, Item 1302 – Description of Property. 17 CFR §229.1302. https://www.ecfr.gov/current/title-17/chapter-II/part-229/section-229.1302
U.S. Securities and Exchange Commission (SEC), 2020. Regulation S-K, Item 601(b)(96) – Technical Report Summary Requirements. 17 CFR §229.601. Available at: https://www.ecfr.gov/current/title-17/chapter-II/part-229/section-229.601
The White House, (2025, March 20). Immediate Measures to Increase American Mineral Productionhttps://www.whitehouse.gov/presidential-actions/2025/03/immediate-measures-to-increase-american-mineral-production/
Framework Agreement between the GoT of the United Republic of Tanzania and LZ Nickel Limited, (Jan 2021)
IDTechEx, (2023). Critical Battery Materials 2025–2035: Technologies, Players, Markets, and Forecasts. https://www.idtechex.com/en/research-report/critical-battery-materials-2025-2035-technologies-players-markets-and-forecasts/1075?utm_source=chatgpt.com
Section 4: Accessibility, Climate, Local Resources, Infrastructure, and Physiography
(URT), Ministry of Finance and Planning, Tanzania National Bureau of Statistics and President’s Office - Finance and Planning, Office of the Chief Government Statistician, Zanzibar. The 2022 Population and Housing Census: Administrative Units Population Distribution Report; Tanzania, December 2022
https://data.maptiler.com/downloads/dataset/osm/africa/tanzania/?projection=globe#7.24/-3.728/32.791
https://www.unfpa.org/data/world-population-dashboard
WSP, Climate Assessment Report, Reference 41104544-358521-1, June 2023
Golder Associates, Environmental Impact Statement, Reference 09-1118-0024, October 2012
https://www.ports.go.tz/index.php/en/ports/mtwara
https://www.citypopulation.de/en/tanzania/admin/shinyanga/1705__kahama_municipality/
Kahama Municipal Council Investment Information, Version 1, 2023 (https://kahamamc.go.tz/storage/app/uploads/public/650/1be/1d6/6501be1d62ffc407177614.pdf)
SGR Project Information – Tanzania Invest Website https://www.tanzaniainvest.com/sgr
41104544-REP-00006 – Kahama Refinery Project - Climate Assessment Report (FINAL) (Aug 2024)
https://www.tic.go.tz/sectors
https://www.worldbank.org/en/country/tanzania/overview
Section 5-9, 11: Geology and Mineral Resources
AMEC (2009), Kabanga Mineral Resource Audit Final, September 2009
AMEC (2009), Kabanga Ni Resource Audit Geology Database QAQC Final, September 2009
Barrick (2016), Announcement; Barrick Gold Corporation Annual Information Form for the year ended December 31, 2016, 24 March 2017
Deblond, A. and Tack, L. (1999). Main characteristics and review of mineral resources of the Kabanga-Musongati mafic-ultramafic alignment in Burundi. Journal of African Earth Sciences, Vol. 29, No. 2, pp. 313–328.
Page
|
/ / Initial Assessment - Technical Report Summary |
|
Evans, D.M., Boadi, I., Byemelwa, L., Gilligan, J., Kabete. J. and Marcet, P., (2000). Kabanga magmatic nickel sulphide deposits, Tanzania: morphology and geochemistry of associated intrusions, Tanzania. Journal of African Earth Sciences, Vol. 30, No. 3, pp. 651–674.
Evans, D.M., Byemelwa, L. and Gilligan, J., (1999). Variability of magmatic sulphide compositions Kabanga nickel prospect, Tanzania. Journal of African Earth Sciences, Vol. 29, No. 2, pp. 329–351.
Evans, D.M., Simmonds, J.R. and Hunt, J.P.P.M., (2016). An overview of nickel mineralisation in Africa with emphasis on the Mesoproterozoic East African Nickel Belt (EANB). International Union of Geological Sciences, Vol. 39, No. 2, pp. 319–333.
Fernandez-Alonso, M., Cutten, H., De Waele, B., Tack, L., Tahon, A., Baudet, D. and Barritt, S.D., (2012). The Mesoproterozoic Karagwe-Ankole Belt (formerly the NE Kibara Belt): The result of prolonged extensional intracratonic basin development punctuated by two short-lived far-field compressional events. Precambrian Research 216– 219 (2012) 63–86.
Glencore (2017). Announcement: Glencore 2016 Annual Report, 1 March 2017.
KNCL (2010), Technical Report on the Kabanga Nickel Project, 31 December 2010.
KNCL (2010), Unpublished Feasibility Study Report Main, MNB, North & Tembo Resource Update.
KNCL (2014a), Draft Feasibility Study, 15 January 2014.
KNCL (2014b), Unpublished Technical Report on the Kabanga Nickel Project, 31 December 2014.
Koegelenberg, C., (2016). Geology, structural evolution and controls of hydrothermal gold mineralization in the Eastern Karagwe-Ankole fold belt, North Western Tanzania. Dissertation presented for the degree of Doctor of Earth Sciences in the Faculty of Science at Stellenbosch University, March 2016.
Kokonyangi, J.W., Kampunzu, A.B., Armstrong, R., Arima, M., Yoshida, M. and Okudaira, T., (2007). U-Pb SHRIMP Dating of Detrital Zircons from the Nzilo Group (Kibaran Belt): Implications for the Source of Sediments and Mezoproterozoic Evolution of Central Africa. The Journal of Geology, 2007, Vol. 115, pp. 99-113.
LHL (2023), Kabanga 2023 Mineral Resource Technical Report Summary, 30 March 2023.
Maier, W.D. and Barnes, S-J., (2010). The Kabanga Ni sulfide deposit, Tanzania: I. Geology, petrography, silicate rock geochemistry, and sulfur and oxygen isotopes. Miner Deposita 45:419–441.
Maier, W.D., Peltonen, P., and Livesey, T., (2007). The Ages of the Kabanga North and Kapalagulu Intrusions, Western Tanzania: A Reconnaissance Study. The Society of Economic Geologists, Inc., Economic Geology, Vol. 102, pp. 147–154.
OreWin (2023), Kabanga 2023MRU Technical Report Summary, 30 November 2023.
OreWin (2024), Kabanga 2024MRU Technical Report Summary, 4 December 2023.
Tack, L., Liégeois, J.P., Deblond, A. and Duchesne, J.C., (1994). Kibaran A-type granitoids and mafic rocks generated by two mantle sources in a late orogenic setting (Burundi). Precambrian Research Vol. 68, pp. 323–356.
Tack, L., Wingate, M.T.D., D. De Waele, Meert, J., Belousova, E., Griffin, B., Tahon, A., Fernandez-Alonso, M., (2010). The 1375 Ma “Kibaran event” in Central Africa: Prominent emplacement of bimodal magmatism under extensional regime. Precambrian Research, Vol. 180, Issues 1-2, pp. 63-84.
Tanzania Invest, Tanzania Standard Gauge Railway, 2023: https://www.tanzaniainvest.com/sgr/Tanzania National Bureau of Statistics and President’s Office (2022) Finance and Planning, 2022 Population and Housing Census; Tanzania, December 2022.
Tanzania Invest, Tanzania Standard Gauge Railway, 2023: https://www.tanzaniainvest.com/sgr/Tanzania Ports Authority (2023), Mtwara and Other Southern Sea Ports, June 2023.
The United Republic of Tanzania (2013), National Environmental Management Act (NEMA) Act N. 20 of 2004.
United Nations Population Fund (2023), Tanzania Dashboard, June 2023.
Page
|
/ / Initial Assessment - Technical Report Summary |
|
Section 10: Mineral Processing and Metallurgical Testing
Kabanga Nickel Project Draft Feasibility Study, Lycopodium, December 2013.
KABA-000-EGU-001 Rev C Operating cost comparison – All Product Options, Muller B, May 2020.
KABA-000-EPE-001 Overview of hydrometallurgical process routes for nickel sulfide concentrate.
Nickel Sulfide Treatment Options, Newton T, Lawson B and Muller B, February 2020.
Section 13: Mining Methods
Golder and Associates Inc. (Golder, 2009) Technical Memorandum Kabanga – Additional Structural Modelling – July 2009, September 2009. [Internal Source].
MineGeoTech MGT (2024). Kabanga Geotechnical Assessment – Draft R1. Prepared for Kabanga Nickel Limited. Report No. J22104. Authors: Emma Jones, John Player.
WSP (SA) (WSP, 2024) 41104544-REP-00015_ Preliminary Water and Salt Balance Report, WSP, September 2024.
Section 14: Processing and Recovery Methods
East Africa Community Vehicle Load Control (Vehicle Dimensions and Axle Configurations) Regulations, 2018).
LZM-Investor-Presentation-July-2024-FINAL.
Section 15: Project Infrastructure and Logistics
ANCOLD. Guidelines on Tailings Dams: Planning, Construction and Closure Addendum, July 2019.
ANCOLD. Guidelines on Tailings Dams: Planning, Construction and Closure, May 2012.
DRA Projects (Pty) 2023 Ltd 2023-Reference- J6902-CIV-000002- Southern Access Road Desktop Study Report Rev C.05.
DRA Projects (Pty) 2024 Kahama Site Visit Report Number J6902-STU-REP-000013 Rev B.
Dteq 2023-Route Survey Report 01-D05 Dated 23 November 2023.
Global Tailings Review (2020), Global Industry Standard on Tailings Management, August 2020.
Golder 2011-Geotechnical Investigation Report Number 13182-11073-1.
Kahama Municipal Council (2023), Investment Information, Version 1, 2023.
Knight Piésold 2012 Geotechnical Report – PE301-00132/40-A bas M21013.
Lycopodium (Ltd) 2011-Ref 1733-STY-001 REV C-Kabanga Nickel Project-Draft Feasibility Study.
Reference-Kabanga Processing Plant Geotechnical Investigation Report Number: 41105136_REP-003_Kabanga Plant_Rev-0.
The United Republic of Tanzania (2013), Dam Safety Regulations Government Notice (GN 237) of 2013.
The United Republic of Tanzania (2013), GN 55 of 31.01.2020 - Amendment to Dam Safety Regulations.
University of Dar es Salaam Bureau for Industrial Cooperation (BICO) 2012 -TSF closure design – Na. BTWs-101/MJM/snz/020/01/BGM).
WSP (South Africa) 2024 - Storm & Sediment Management Plan Report (REF. NO. 41104544-REP-00012).
WSP (South Africa) 2024-Source terms for the WRD barrier designs No. 70102444.TM1.B0.
Page
|
/ / Initial Assessment - Technical Report Summary |
|
Section 17: ESG References
Environmental References
Behrooz, M. (2023) Kabanga spring water diversion MCA_Rev A [Microsoft Excel spreadsheet]
Edge Plan Development Corporation Limited (2023). Buzwagi SEZ Master Plan 2023 – 2043. Dar es Salaam, pp.1-142.
Golder Associates (2012), Environmental Impact Statement, Reference 09-1118-0024, Oct 2012.
LZM, (2024), Kabanga ESG Description, 2 December 2024
LZM, (2024), Kabanga Property Description, 29 November 2024
Minopex Technical Advisory (Pty) Ltd (2023). Proposal for the Development of Operational Readiness Requirements for the Kabanga Nickel Project. Sandton, pp.1–27.
MTL Consulting Company Limited (2023), (EIA) for Proposed Construction and Operation of the Tembo Nickel Multi-metal Processing Facility in Kahama District, Shinyanga Region, Volume 1: Environmental Impact Statement (EIS), June 2023.
Pangea Minerals Limited (2022). Mine Closure Plan: Buzwagi Gold Mine. Zambia, pp.1-325.
Tembo Nickel Corporation Limited (2023). Environmental Impact Statement (EIS) for the Proposed Construction and Operation of the Tembo Nickel Multi-Metal (Nickel, Cobalt, and Copper) Processing Facility in Mwendakulima Mtaa, Mwendakulima Ward, Kahama Municipal, Shinyanga Region. Dar es Salaam, pp.1–713.
Tembo Nickel Corporation Limited (2023). Kabanga Nickel Resettlement Project: Draft Entitlement Framework for Consultation.
Tembo Nickel Corporation Limited (2023). Kabanga Nickel Resettlement Project: Livelihood Restoration Plan.
The United Republic of Tanzania (2013), The Water Resources Management (Amendment) Act, 2022.
The United Republic of Tanzania (2013), Water Resources Management Act (WRM Act) No. 11 of 2009.
The United Republic of Tanzania (2023). Proposed 220kV Transmission Line for Power Supply to Kabanga Nickel Mine Project and Expansion of Buzwagi Substation.
TNCL (2023) EIA for the Proposed Construction and Operation of the TNCL MMPF in Kahama District, Shinyanga Region Volume 1: Environmental Impact Statement (EIS), June 2023
Other References
Behrooz, M. (2023). ESG Standard Databook 2023 [Microsoft Excel spreadsheet]
Behrooz, M. (n.d.). Ranking Matrix – Aspects Under Consideration (Rev A) [Microsoft Excel spreadsheet]
DRA Projects (Pty) Ltd (2023). Project Infrastructure Security and Access Control Philosophy. South Africa, pp.1–9.
Edge Plan Development Corporation Limited (2023). Buzwagi SEZ Master Plan 2023 – 2043. Dar es Salaam, pp.1-142.
Golder Associates (2009). Tailings Disposal Facility Design - Kabanga Nickel Project. Ontario, pp.1–499.
Joint Ore Reserves Committee. (2012). The JORC Code 2012 Edition.
Moosapoor, B. (2023) Kabanga Spring Water Diversion MCA_Rev A [Microsoft Excel spreadsheet]
MTL Consulting Company Limited (2023). The Environmental and Social Management Plan Update (ESMPU) for the Proposed Kabanga Nickel Project, Ngara District, Kagera Region. Dar es Salaam, pp.1–590, Vol. 1 and 2.
Pangea Minerals Limited (2022). Mine Closure Plan: Buzwagi Gold Mine. Zambia, pp.1-325.
Page
|
/ / Initial Assessment - Technical Report Summary |
|
Pullinger, L. (2023). Memorandum of findings to determine the presence of Indigenous People (IP) at the mining operations of Tembo Nickel. South Africa: Vivid Advisory, pp.1–5.
RSK Environment Ltd (RSK) (2023a). Kabanga Nickel Resettlement Project: Draft Entitlement Framework for Consultation. Dar es Salaam, pp.1–35.
RSK Environment Ltd (RSK) (2023b). Kabanga Nickel Resettlement Project: Livelihood Restoration Plan. Dar es Salaam, pp.1–6.
RSK Environment Ltd (RSK) (2024). Environmental Impact Assessment for the Proposed Developments within Seven Relocation Host Sites Located within Ngara District, Kagera Region, Tanzania. Dar es Salaam, pp.1–402.
Tembo Nickel Corporation Limited (2023). Environmental Impact Statement (EIS) for the Proposed Construction and Operation of the Tembo Nickel Multi-Metal (Nickel, Cobalt, and Copper) Processing Facility in Mwendakulima Mtaa, Mwendakulima Ward, Kahama Municipal, Shinyanga Region. Dar es Salaam, pp.1–713.
Tembo Nickel Corporation Limited. (2024). Community Relations Department - Stakeholders Engagement Plan.
Tembo Nickel Corporation Limited. (2024). Stakeholder Engagement Standard.
Tembo Nickel Corporation Limited. (2024). Stakeholder Payment Guideline.
The United Republic of Tanzania - National Environment Management Council (2024). Request for Guidance on Changes to Mining Infrastructure. [Letter].
The United Republic of Tanzania (2022). Administrative Units Population Distribution Report Vol. 1B.
The United Republic of Tanzania. (2024). Proposed 220kV Transmission Line for Power Supply to Kabanga Nickel Mine Project and Expansion of Buzwagi Substation.
Tsalamandris, P. (2024) Attachment 01 – Kahama Facilities Register REVC [Microsoft Excel spreadsheet]
Valmin. (2016). The Valmin Code 2015 Edition.
Vivid Advisory. (2024). Official Memorandum on Indigenous People at Kabanga Nickel.
WSP (2023a). Kabanga Nickel Project TSF DFS: Defining Closure Objectives and Completion Criteria. Midrand, pp.1–3.
WSP (2023b). Kabanga Nickel Project TSF DFS: Defining Closure Objectives and Completion Criteria to Inform the Basis of Design for the Proposed TSF Concept Design. Perth, pp.1–6. [Technical Memorandum].
WSP (2024a). Kabanga Nickel Tailings Disposal Facility Definitive Feasibility Study: Dam Break Analysis and Consequence Category Assessment. Midrand, pp.1–163.
WSP (2023), Climate Assessment Report, Reference 41104544-358521-1, June 2023
Relocation References
DFID. (2000). Sustainable livelihoods guidance sheets. United Kingdom. Available at https://www.ennonline.net/attachments/875/section4-2.pdf (last accessed 12 April 2022).
Ellis, F. (1998). Household Strategies and Rural Livelihood Diversification. Journal of Development Studies, 35(1):1-38. DOI: 10.1080/00220389808422553.
Equator Principles Financial Institutions (EPFIs) (2020), The Equator Principles July 2020, A financial industry benchmark for determining, assessing and managing environmental and social risk in projects.
Page
|
/ / Initial Assessment - Technical Report Summary |
|
International Finance Corporation (IFC) (2012). Performance Standards on Environmental and Social Sustainability. International Finance Corporation Word Bank Group.
MTL Consulting Company Limited (MTL) (2023). The Environmental and Social Management Plan Update (ESMPU) for the Proposed Kabanga Nickel Project, Ngara District, Kagera Region. Dar es Salaam, pp.1–590, Vol. 1 and 2.
National Land Use Planning Commission (NLUPC) (2020) Guidelines for Integrated and Participatory Village Land Use Management and Administration -- Third Edition -- National Land Use Planning Commission. Ministry of Lands, Housing and Human Settlements Development.
RePlan (2013) Kabanga Nickel Company Limited Kabanga Nickel Project Resettlement Action Plan. Tembo Nickel Corporation Limited.
RSK Environment Ltd (2022) Kabanga Nickel Resettlement Project Resettlement Stakeholder Engagement Plan (RSEP). Tembo Nickel Corporation Limited.
RSK Environment Ltd (RSK) (2023a) Kabanga Nickel Resettlement Project Socio-Economic Baseline HH survey report (SEBS). Tembo Nickel Corporation Limited.
RSK Environment Ltd (RSK) (2023b) Kabanga Nickel Resettlement Project Livelihood Restoration Plan (LRP). Tembo Nickel Corporation Limited.
RSK Environment Ltd (RSK) (2023c) Kabanga Nickel Resettlement Project Resettlement, Housing, Planning, and Infrastructure Planning Report. Tembo Nickel Corporation Limited.
RSK Environment Ltd (RSK) (2023d) Kabanga Nickel Resettlement Project, Level 1 Resettlement Action Plan. Tembo Nickel Corporation Limited. Specific data update, July 2024.
RSK Environment Ltd (RSK) (2024) Environmental Impact Assessment (EIA) for the proposed developments within seven Relocation Host Sites located within Ngara District, Kagera Region, Tanzania – Environmental Impact Statement. Tembo Nickel Corporation Limited.
TNCL (2023). Environmental Impact Statement (EIS) for the Proposed Construction and Operation of the Tembo Nickel Multi-Metal (Nickel, Cobalt, and Copper) Processing Facility in Mwendakulima Mtaa, Mwendakulima Ward, Kahama Municipal, Shinyanga Region. Dar es Salaam, pp.1–713.
TNCL (2023). Kabanga Nickel Resettlement Project: Draft Entitlement Framework for Consultation.
UNICEF Innocenti – Global Office of Research and Foresight, Ministry of Education, Science and Technology of Tanzania, the President’s Office Regional and Local Administration of Tanzania and UNICEF Tanzania, Data Must Speak: Unpacking Factors Influencing School Performance in Mainland Tanzania. UNICEF Innocenti, Florence, 2024.
United Nations Human Rights Office of the High Commissioner (UNHROHC) (2011). Guiding principles on business and human rights – Implementing the United Nations “Protect, Respect and Remedy” Framework. New York and Geneva: United Nations.
United Republic of Tanzania (URT) (2008). Cultural Heritage Policy. Ministry of Natural Resources and Tourism. Dar es Salaam, Antiquities Department.
United Republic of Tanzania (URT) (2016) ‘Basic Demographic ad Socio-Economic Profile, Kagera Region.’ 2012 Population and Housing Census.
United Republic of Tanzania (URT) (2018) ‘Kagera Region Socio-Economic Profile, 2015. Jointly prepared by National Bureau of Statistics, Ministry of Finance and Planning and Kagera Regional Secretariat. National Bureau of Statistics, Dar es Salaam.
United Republic of Tanzania (URT) (2024), Ministry of Finance, Tanzania National Bureau of Statistics and President’s Office - Finance and Planning, Office of the Chief Government Statistician, Zanzibar. The 2022 Population and Housing Census: Tanzania Basic Demographic and Socio-Economic Profile Report; Tanzania, April 2024 Masdar and TANESCO to develop renewable projects in Tanzania: https://www.power-technology.com/news/masdar-tanesco-tanzania/?cf-view
Page
|
/ / Initial Assessment - Technical Report Summary |
|
Sustainability References
Tanesco Solar Power Project and Grid Upgrade: https://www.afd.fr/en/carte-des-projets/tanesco-solar-power-project-and-grid-upgrade-tanzania
Tanzania Power Production and Demand - 2024 Update: https://www.tanzaniainvest.com/power
Lectures and Presentations
BHP. 2023. ESG Strategy Workshop Outcomes [PowerPoint Presentation]. Kabanga Project – Lifezone Metals, Tembo Nickel and BHP Workshop, 19 July.
BHP. 2023. Closure Vision and Objectives Workshop Outcomes [PowerPoint Presentation] Kabanga Project – Lifezone Metals, Tembo Nickel and BHP Workshop, 19 July.
Malaviya, P., & Ezra Teri, S. 2024. HRDD Overview & progress [PowerPoint Presentation] 2 May.
Tembo Nickel Corporation. 2023. Resettlement Risk Workshop. Kabanga Project Workshop, 16 May, Dar es Salaam.
WSP. 2023. Tailings Storage Facility [PowerPoint Presentation]. MCA Workshop, 24 April.
Standards and Guidelines
Australian National Committee on Large Dams (ANCOLD) Guidelines
Australasian Institute of Mining and Metallurgy (AusIMM) ESG and Social Responsibility Guidelines
BHP’s Environmental Approach
Global Industry Standard on Tailings Management, 2020
International Finance Corporation (IFC) Sustainability Framework and Performance Standards on Environmental and Social Sustainability
SANS 1200 Standard Specifications for Civil Engineering Construction
Legislation
Graves (Removal) Act, 1969
Education Act (General Notice No. 150 of 1977)
The Environmental Management Act No. 20 of 2004
The Forest Act No. 7 of 2002
The Land Act No. 4 of 1999
The Land Use Planning Act No. 6 of 2007
The Mining Act No. 6 of 2019
The Occupational Health and Safety Act No. 5 of 2003
The Public Health Act No. 1 of 2010
The Village Land Act No. 5 of 2019
The Water Resources Management Act No. 11 of 2009
Section 18: Capital and Operating Costs
AACE International Recommended Practice No. 18R-97: Cost Estimate Classification System In preparing this report, the Qualified Persons (QPs) have relied entirely on information provided by the Registrant in certain key areas that fall outside the QPs’ direct expertise.
S-K 1300
Page
|
/ / Initial Assessment - Technical Report Summary |
|
These include:
| ● | Assumptions related to macroeconomic conditions, including inflation, interest rates, and broader economic trends (Sections 18 and 19). |
| ● | Market outlook and commercial strategies that are under the Registrant’s control (Sections 16, 18, and 19) specifically providing the long-term commodity price forecast information included in this report (Section 16). |
| ● | Guidance from the Registrants and their tax advisors on applicable taxes, royalties, and other government levies or interests, applicable to revenue or income from the Project as presented in Section 3 and Section 19 and used in Section 11 for establishing reasonable prospects of economic extraction (“RPEE”), and Section 19 to support the sub-section on tax information and tax inputs to the economic model that provides an after-tax model. The rates comply with the tax regime at the Project location. |
| ● | Legal interpretations, statutory and regulatory frameworks that influence the mine plan but are beyond the QPs’ expertise (Section 3). |
| ● | Environmental matters that require specialist expertise |
| ‒ | Planned community accommodations and social commitments related to mine development (Section 17). |
| ‒ | Government policies, relationships, and other external factors outside the QPs’ control (Section 17). |
| ‒ | The status and maintenance of all permits, licenses, and regulatory approvals necessary for current and future operations, including mining, processing, and waste management (Section 3). |
| ‒ | The Registrant’s ability and commitment to managing stakeholder relationships in a way that supports ongoing operations (Section 17). |
Following a review of the information supplied, the opinion of the QP’s is that it is reasonable to rely on the information provided by the Registrant as outlined above because a significant amount of work has been conducted for the Project by the Registrant over an extended period, the Registrant and its related entities employ professionals with responsibility in the areas identified and these personnel have the best understanding in these areas.
Page
|
/ / Initial Assessment - Technical Report Summary |
|
EFFECTIVE DATE AND QP SIGNATURE PAGE
| Project Name: | Kabanga Nickel Project | |
| Title: | Initial Assessment - Technical Report Summary | |
| Effective Date of Mineral Resource Estimate: | December 4, 2024 | |
| Effective Date of Technical Report Summary: | June 2, 2025 |
/s/ Sharron Sylvester
Date of Signing: June 2, 2025
Sharron Sylvester, Technical Director – Geology
OreWin Pty Ltd, BSc (Geol), RPGeo AIG (10125)
| Project Name: | Kabanga Nickel Project |
| Title: | Initial Assessment - Technical Report Summary |
| Effective Date of Mineral Resource Estimate: | December 4, 2024 |
| Effective Date of Technical Report Summary: | June 2, 2025 |
/s/ Alistair Hodgkinson
Date of Signing: June 2, 2025
Alistair Hodgkinson, Chief Operating Officer
DRA Projects (Pty) Ltd
Page
|
/ / Initial Assessment - Technical Report Summary |
|
GLOSSARY
Defined Terms
| Term | Definition |
| Annum | A period of one calendar year. |
| Autoclave | A large, high-pressure vessel used for processing material through a chemical reaction, often involving elevated heat and pressure, to extract valuable metals |
| Barrick | Barrick Gold Corporation |
| Brownfield | Type of project constrained by existing works and operations. Project constructed within an existing operation. |
| Buzwagi Mine | Decommissioned Gold Mine previously operated by Barrick and currently the location of the Buzwagi Special Economic Zone (SEZ). |
| Buzwagi Special Economic Zone (SEZ) | A Special Economic Zone located near Kahama town, within which the Kahama Refinery will be located. Also defined as “SEZ”. |
| Capex | Capital Expenditure - funds spent on acquisition, construction, upgrading and periodic maintenance of physical assets. See also Capital Cost Estimate, Pre-production Capital and Sustaining Capital. |
| Community | A group of individuals broader than the household, who identify themselves as a common unit due to recognized social, religious, economic, or traditional government ties, or through a shared locality |
| Compensation | Payment in cash or in kind for an asset or a resource that is acquired or affected by a Project at the time the asset needs to be replaced. |
| Concentrate | The final product of the flotation process, which contains a higher concentration of valuable minerals |
| Contractors | Company or firm providing materials, labor and services to perform construction work on the Project sites. |
| Crystallization | A unit operation used for the purification and recovery of metals or compounds from their solutions. It involves separating solid salts or compounds from a liquid solution by inducing crystal formation. |
| Displacement | The physical, economic, social and / or cultural uprooting of a person, household, social group or community as a result of the Project. |
| DRA | DRA Projects (Pty) Ltd, a private company owned by DRA Global Ltd. |
| Deadweight tonnage (DWT) | Deadweight Tonnage (often abbreviated as DWT) is a measure of the maximum weight that a ship can carry without risking its safety. This includes the mass of everything on board — from cargo, fuel, passengers, crew, to provisions and freshwater. |
| Economic displacement | Loss of assets (including land), or loss of access to assets, leading to loss of income or means of livelihood as a result of Project related land acquisition or restriction of access to natural resources. People or enterprises that may be economically displaced with or without experiencing physical displacement. |
| Economically displaced household (EDH) | A household whose livelihoods are impacted by the Project. This includes both PDH as well as households living outside the Project area but who maintain livelihood activities (e.g., land, non-residential structures, businesses, or other usage rights) within the footprint. |
| Electrowinning | Electrochemical process used to extract metal ions from aqueous solutions |
| EPCM | Refers to the EPCM contractor, which will work together with the KNL Owners’ team, installation Contractors / Suppliers to design, construct and commission a project area and/or phase of the KNL Project |
| Flotation | A process for separating valuable minerals from the feed based on their differences in hydrophobic properties |
| Greenfield | A project initiated on undeveloped land, where no previous construction or infrastructure exists. |
| Household | A group of people who may or may not be related, but who share a home or living space, who aggregate and share their incomes, and evidenced by the fact that they regularly take meals together. |
Page
|
/ / Initial Assessment - Technical Report Summary |
|
| Term | Definition |
| Hydrogeology | Branch of geology that investigates the distribution, movement, and quality of groundwater within the Earth’s crust, examining how water interacts with geological formations, influences natural and human-made environments, and contributes to the hydrological cycle. |
| Hydrology | The comprehensive study of the movement, distribution, and quality of water across the Earth’s surface, including its interactions with the atmosphere, land, and living organisms, and how these processes influence and are influenced by the natural and human-altered environment over time. |
| IA TRS | Initial Assessment Technical Report Summary (this report, titled “Kabanga Nickel Project– Initial Assessment - Technical Report Summary” with the effective date June 2, 2025) |
| Kabanga Concentrate | Concentrate produced by the Kabanga Concentrator, after processing of the Kabanga feed. |
| Kabanga Concentrator | Concentrator facility developed as part of the Kabanga Site Project. Also defined as “Concentrator” |
| Kabanga Nickel Company Limited | Previous company developed by Sutton Resources between 1990 and 1999. |
| Kabanga Nickel Limited | Kabanga Nickel Limited, a private company owned by Lifezone Metals Limited and BHP Billiton (UK) DDS Ltd and incorporated in accordance with the company laws of the United Kingdom. |
| Kabanga Nickel Mine | The nickel mine located and operated within the boundaries described by Special Mining Licence (SML), No. SML 651/2021. |
| Kabanga Nickel Project | Minerals Project in Tanzania to deliver a 3.4 Mtpa RoM underground mine and concentrator with associated infrastructure on Kabanga Site, and refinery to beneficiate concentrate feed with associated infrastructure at Kahama; to deliver final Ni, Co, Cu Metals. Also defined as “the Project”. |
| Kabanga Resettlement | The resettlement of PDPs as part of the Project. Also defined as “resettlement”. |
| Kabanga Site | Location of Kabanga Nickel Project activities to develop the mine, concentrator and infrastructure at the Ngara region in terms of Special Mining Licence No. SML 651/2021. |
| Kahama Refinery | Hydrometallurgical refinery to be developed at the Buzwagi SEZ to treat Kabanga concentrate and produce Cu, Ni and Co final metal. Also defined as “the Refinery” |
| Kahama Site | Location of Kabanga Nickel Project activities to develop the Refinery and associated infrastructure at the Buzwagi Special Economic Zone (SEZ) in Kahama in terms of Refining Licence No. RFL 066/2024. |
| Land acquisition | Land acquisition includes both outright purchases of property and purchases of access rights, such as rights-of-way (easement). |
| Life of Mine (LoM) | The number of years that an operation is scheduled to mine and process feed and is based on the current mine plan. |
| Lifezone Metals Limited (LZM) | Lifezone Metals Limited, a public company listed on the New York Stock Exchange (NYSE) and incorporated in accordance with the company laws of the Isle of Man. |
| Livelihood | A livelihood comprises the capabilities, assets and activities required for a person to make a living such as: wages from employment; cash income earned through an enterprise or through sale of produce, goods, handicrafts or services; rental income from land or premises; income from a harvest or animal husbandry; share of a harvest (such as various sharecropping arrangements) or livestock production; self-produced goods or produce used for exchange or barter; self-consumed goods or produce, food, materials, fuel and goods for personal or household use or trade derived from natural or common resources; pensions; various types of government allowances (child allowances, special assistance for the very poor); and remittances from family or relatives. |
| Livelihood Restoration Plan (LRP) | A plan intended to set out how to replace or restore livelihoods lost or reduced as a result of a Project. The plan aims to restore, or if possible, improve the quality of life and standard of living of affected parties and ensure food security through the provision of economic opportunities and income-generating activities of affected property owners and their households. |
| Locked-Cycle Test (LCT) | A laboratory test that simulates the continuous flotation circuit to determine the overall metallurgical performance |
| Mine | The North, Tembo and Main Mine Operations located with the SML. |
Page
|
/ / Initial Assessment - Technical Report Summary |
|
| Term | Definition |
| MineCo | Tembo Nickel Corporation Ltd, also known as MineCo, a private company owned by Kabanga Nickel Limited and the Tanzanian Government., Holder of Special Mining Licence SML 651 / 2021. Also defined as “Tembo Nickel” or “TNCL.” |
| Mine Production Schedule | Also known as the mine plan, this refers to the Mine Production schedule developed for the IA. |
| Mini pilot plant (MPP) | A scaled-down pilot plant used to conduct metallurgical testwork on drill samples to optimize the process before full-scale production |
| Neutralization | A chemical process to adjust the pH of a solution, often used in hydrometallurgy to precipitate unwanted metals or impurities. |
| Operating Expenditure (Opex) | The costs incurred while operating a company. Opex includes costs related to the direct cost of production, marketing, maintenance, administration and overhead costs of the business on a day-to-day basis. Operating costs exclude non-operating expenses such as financing costs, forward cover or foreign currency translation, but would include the cost of labor, consumables, raw materials, utilities etc. required to operate an asset and provide a product or service to the market. |
| Physical displacement | Loss of permanently occupied house/apartment, dwelling or shelter as a result of Project-related land acquisition that requires the affected person(s) to move to another location. |
| Physically displaced household (PDH) | A household occupying a house in the Project area built on or before the Entitlement Cut-off Date as the primary or sole residence. |
| Pollution Control Dam | A dam designed to capture and contain pollutants from runoff or wastewater, preventing them from contaminating natural water sources and mitigating environmental damage. |
| Precipitation |
In the refinery context refers to the process of converting dissolved metal ions from a solution into a solid form, typically as a metal or a metal compound. This is achieved by adding a reagent that causes the metal to precipitate out of the solution, forming solid particles that can be separated from the liquid, OR
Form of water liquid or solid that falls from the atmosphere and reaches the ground, such as rain, snow, sleet, hail and drizzle.
|
| Precursor cathode active material | A material used in the manufacturing of battery cathodes, typically containing metals like nickel, cobalt, and manganese |
| Pregnant leach solution | Refers to a solution in hydrometallurgical processes that contains dissolved metals extracted from concentrate after a leaching process. This solution is termed “pregnant” because it is rich in the target metals, such as copper, nickel, or cobalt, that are ready to be recovered through subsequent processes. |
| Pressure Oxidation (POX) | POX, or Pressure Oxidation, is a metallurgical process used in the mining industry to extract metals like gold, copper, and nickel from refractory ores through an autoclave. |
| Priority Area | Designated areas on the Kabanga Site footprint that require resettlement to enable land access and commence project development activities |
| Project-affected household (PAH) | All members of a household, whether related or not, operating as a single economic unit, who are affected as a result of the land acquisition required for the Project. |
| Project-affected person (PAP) | Any individual who, as a result of the land acquisition required for the Project, loses the right to own, use, or otherwise benefit from a built structure, land (residential, agricultural, pasture or undeveloped/unused land), annual or perennial crops and trees, or any other fixed or moveable asset, either in full or in part, permanently or temporarily. |
| Raffinate | Refers to the residual solution left over after the extraction of desired metals or other compounds from an aqueous phase in a hydrometallurgical process, such as solvent extraction. |
| Ramp-up | The period from the commencement of operation to the attainment of steady state operations. |
| Refining Licence (RFL) | Refining Licence (RFL 006/2024) issued to Tembo Nickel Refining Company Ltd under the framework of the Mining Act, 2010 on March 19, 2024, granting TNRC the rights to refine Kabanga concentrate and develop nickel (Ni), cobalt (Co), and copper (Cu) final products. |
| Region | The highest administrative division of Tanzania. Tanzania is divided into thirty-one regions (2016), each of which is further subdivided into districts. |
| Rehabilitation | The process of restoring land disturbed by mining to support appropriate post-mining use. Governed by country-specific laws, it addresses key aspects such as water protection, topsoil management, slope gradients, waste handling, and revegetation to minimize environmental impact and ensure sustainable land use. |
Page
|
/ / Initial Assessment - Technical Report Summary |
|
| Term | Definition |
| Relocation Site | Refers to a designated area where physically displaced households are relocated due to the development of the Kabanga Nickel Project. These sites are developed to provide adequate housing and infrastructure ensuring the displaced populations have access to essential services such as water, sanitation, education, and healthcare. |
| Resettlement | The displacement or relocation of an affected population from one location to another within the national territory, and the restructuring or creation of comparable living conditions. |
| Resettlement Action Plan (RAP) | A plan that provides a comprehensive set of actions for addressing impacts related to physical and economic displacement. It describes the procedures and activities that will be taken to compensate for losses, mitigate adverse Project impacts, and provide development benefits to those who will be resettled or displaced as a result of a Project. |
| Rheology | The study of the flow and deformation of matter, particularly how materials respond to applied forces |
| Risk Register | Documented tool used to identify, assess, and manage qualitative risks throughout the Project. |
| Ruvubu River | Main river passing the Kabanga Site 14 km to the southwest and serves as primary water source to the Kabanga Site and forms the border between Tanzania and Burundi in the region. |
| Scoping Study | A preliminary evaluation of a mining project to determine its potential economic viability |
| Socio-economic Baseline | A baseline record of land use activities within the Project footprint, as well as the socioeconomic characteristics of individuals and communities dependent on the land prior to the commencement of the land acquisition process, as well as host communities that will potentially be impacted by the Project. |
| Solids Concentration | The percentage of solid material in a slurry. |
| Solvent Extraction | Liquid-liquid extraction process. Refers to the metallurgical process used to extract metals from solutions. It involves the transfer of metal ions to and from an aqueous solution onto an organic solvent. |
| Special Economic Zone (SEZ) | A geographically designated area with special economic regulations that differ from the rest of the country. |
| Special Mining Licence (SML) | Special Mining Licence in terms of the Mining Act, Revised Edition 2019, SML 651/2021 issued to Tembo Nickel Corporation Ltd (TNCL) on 25 October 2021, which confers to TNCL the exclusive right to search for, mine, dig, mill, process, transport, use, and/or market nickel, or other minerals found to occur in association with that mineral, in and vertically under the SML area, and execute such other work works as are necessary for that purpose. |
| Stakeholder | Individuals or groups of people who are directly or indirectly affected by a Project, as well as those who may have an interest in a Project. They may have the ability to influence the outcome of the Project, either positively or negatively. |
| Surface Infrastructure | The term refers collectively to the site roads, earthworks, drainage, water supply and storage dams, power supply and distribution, buildings, stores, workshops, services and other operational enabling infrastructure developed as part of the Project. |
| Tailings | The materials left over after the valuable minerals have been separated from the feed. Tailings are typically stored in a tailings storage facility (TSF) |
Page
|
/ / Initial Assessment - Technical Report Summary |
|
| Term | Definition |
| Tailings Storage Facility (TSF) | An engineered structure designed to store the waste materials, known as tailings, which remain after the extraction of valuable minerals from ore during mineral processing |
| TANROADS | Tanzania National Roads Agency. Government agency responsible for the development, maintenance, and management of the national road network in Tanzania. |
| Tanzanian Railways Corporation (TRC) | Tanzania Railways Corporation (TRC)., a State-owned company responsible for operating and managing the railway infrastructure and services in Tanzania. Previously known as Tanzania Railways Limited (TANRAIL). |
| Tembo Nickel Corporation Limited (TNCL) | Tembo Nickel Corporation Ltd, a private company owned by Kabanga Nickel Limited and the Tanzanian Government., Holder of Special Mining Licence SML 651 / 2021 (MineCo). Also defined as “Tembo Nickel” or “TNCL.” |
| RefineCo | Tembo Nickel Refining Company Limited, the company developing the Kahama Site holder of Refining Licence (RFL) No. RFL 006 / 2024. |
| Tenant | Tenants are recognized as having an interest in, but not ownership of land under The Valuation and Valuers (General) Regulations, 2018. A tenant is referred to as a person who is cultivating or occupying developments on communal land or land belonging to another individual. Tenants are ineligible for compensation for the land they occupy or cultivate, but are eligible for compensation for any improvements or developments that they have made on the land. No formal tenants with lease agreements were identified during the asset survey. All tenants are therefore considered to be informal for the purposes of this study. |
| Thickening | Thickening is a process used in mining and mineral processing to increase the solid content of a slurry by removing excess water. |
| Variability Testwork | Tests conducted to assess how variations in feed composition impact the performance of the processing plant. |
| Ward | A lower-level administrative subdivision of Tanzania. In urban areas, each ward generally comprises several villages. |
Page 284 of 284
Exhibit 99.1
 |
Lifezone Metals Files Initial Assessment for the Kabanga Nickel Project in Tanzania

Vertically Integrated Plan includes Hydrometallurgical Refinery at Kahama
$2.37 Billion After-Tax NPV (8%) and 22.9% After-Tax IRR at $8.49 per Pound Nickel Price
Initial Assessment Proposes a 22-Year Mine Plan at Average 2.39% Nickel Equivalent Grade
Webcast with Technical Leadership Team at 10 AM ET on Tuesday, June 3, 2025
June 2, 2025
New York (USA) – Lifezone Metals Limited’s (NYSE: LZM) Chief Executive Officer, Chris Showalter, and Chief Operating Officer, Gerick Mouton, announce today the results from the Initial Assessment for its flagship Kabanga Nickel Project in northwest Tanzania. The Initial Assessment evaluates a vertically integrated mining, processing and refining operation, commencing with a high-grade nickel sulfide underground mine and concentrator at the Kabanga site, followed five years later by a hydrometallurgical refinery at Kahama. The study covers the Main, MNB, Kima, North, and Tembo zones and is based on the December 2024 Mineral Resource Update (refer to Lifezone’s December 5, 2024 news release). The Initial Assessment Technical Report Summary has been filed on Form 6-K with the U.S. Securities and Exchange Commission and made available on EDGAR and the Company’s investor relations website.
| LZM KABANGA IA TRS FILING 2025 06 02 |
|
Lifezone expects to complete the Kabanga Feasibility Study Technical Report Summary in July 2025, which will focus on the initial development phase of the underground mine and concentrator.
Initial Assessment Technical Report Summary highlights:
This Initial Assessment is preliminary in nature and the economic analysis includes Inferred Mineral Resources that are considered too speculative geologically to have modifying factors applied to them that would enable them to be categorized as Mineral Reserves and there is no certainty that this economic assessment will be realized.
| ● | 22-year mine plan with a 3.4 million tonnes per annum underground mining operation with total production of 67.9 million tonnes grading 1.93% nickel, 0.26% copper and 0.14% cobalt. |
| ● | 3.4 million tonnes per annum concentrator, producing high-grade nickel, copper, and cobalt concentrate containing a total of 1.15 million tonnes of nickel, 171,000 tonnes of copper and 87,000 tonnes of cobalt. |
| ● | Hydrometallurgical refinery production design capacity of up to 50,000 tonnes per annum of nickel contained in battery-grade sulfate, up to 7,000 tonnes per annum of London Metal Exchange Grade A 99.99% copper cathode and up to 4,000 tonnes per annum of cobalt in sulfate. |
| ● | Pre-production capital cost of $991 million, which includes a contingency of 16.1%, with total mine plan revenue from sales estimated at approximately $23.68 billion and after-tax free cash flow of $8.03 billion. |
| ● | After-tax net present value of $2.37 billion using an 8.0% discount rate and after-tax internal rate of return of 22.9%, based on flat metal prices of $8.49 per pound nickel, $4.30 per pound copper, and $18.31 per pound cobalt. |
| ● | Low all-in sustaining costs for refined nickel products averaging $2.71 per pound, net of copper and cobalt by-product credits. |
Mr. Showalter commented: “The Kabanga Nickel Project represents a rare opportunity to develop a large-scale, high-grade nickel Mineral Resource with robust economics and a clear staged development path to production. The Initial Assessment highlights the project’s potential to deliver positive returns over a long life, supported by a low-cost operating profile, with approximately 80% of the project’s value attributed to the Kabanga mine and concentrator. Our partnership with the Government of Tanzania has been instrumental in advancing the project, and Lifezone remains aligned in our commitment to responsible development and long-term value creation. With the Feasibility Study on track for completion in July, we are very well-positioned to advance the project.”
| LZM KABANGA IA TRS FILING 2025 06 02 |
|
Mr. Mouton added: “Today marks a significant and historic milestone in the nearly five-decade journey of the Kabanga Nickel Project. For the first time, Lifezone has successfully completed and publicly disclosed a technical-economic Initial Assessment in accordance with U.S. SEC Regulation S-K 1300. This landmark disclosure confirms the reasonable prospects for economic extraction and affirms the project’s robust foundation. The Initial Assessment underscores the technical integrity and scalability of Kabanga. Through disciplined engineering and extensive analysis, the Lifezone team has systematically de-risked the development of the underground mine and concentrator. The adopted staged development approach provides a high level of confidence in our ability to deliver a project that is both economically resilient and operationally robust. We remain focused on maintaining this momentum and look forward to the planned completion and release of the Feasibility Study in July 2025.”
TUESDAY: Webcast with Lifezone’s technical leadership team at 10:00 AM ET
The company invites shareholders, investors, and members of the media to join a virtual presentation and discussion of the key highlights of the Initial Assessment.
| ● | Date: Tuesday, June 3, 2025. |
| ● | Time: 10:00 AM Eastern Time. |
| ● | Location: Virtual (please click the webcast registration link). |
The presentation slides will be available on Lifezone’s website, and the webcast will be archived and accessible for replay for a limited time after the event.
Figure 1: Kabanga Nickel Project location in Tanzania.
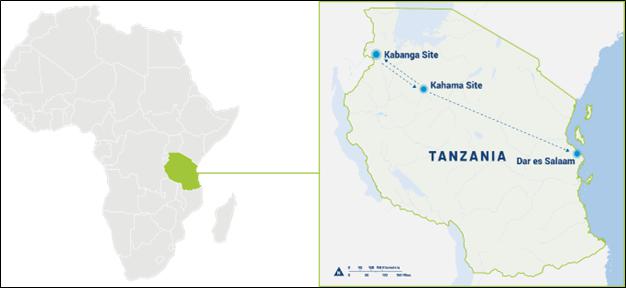
| LZM KABANGA IA TRS FILING 2025 06 02 |
|
Figure 2: Overview of the Kabanga site camp.
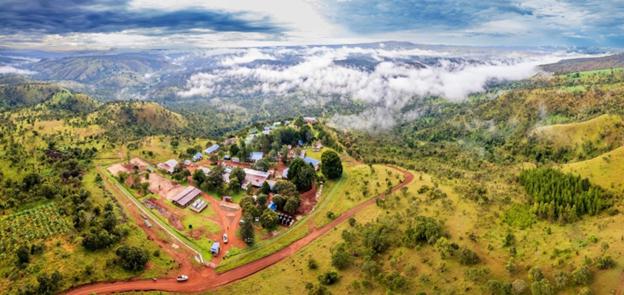
Kabanga Nickel Project Initial Assessment overview
The Initial Assessment outlines a vertically integrated development plan for the Kabanga Nickel Project, proposing a 3.4 million tonnes per annum underground mining operation processing a total of 67.9 million tonnes of mill feed. The average feed grade is 1.93% nickel, 0.26% copper and 0.14% cobalt, sourced from the Main, MNB, Kima, North and Tembo zones. This supports an estimated 22-year mine plan.
Nickel, copper and cobalt recoveries are expected to average 87.3%, 95.7% and 89.6%, respectively, through conventional froth flotation. The resulting 17.3% nickel-rich concentrate, containing low levels of deleterious elements, will be exported during the first five years of operation and prior to the commissioning of the Kahama hydrometallurgical refinery. The refinery has a designed production capacity of 50,000 tonnes per annum of nickel as battery-grade nickel sulfate, 7,000 tonnes per annum of London Metal Exchange Grade A 99.99% copper cathode and 4,000 tonnes per annum of cobalt as cobalt sulfate.
The Initial Assessment contemplates pre-production capital expenditures of $991 million, which includes a contingency of 16.1%, capitalized operating expenses of $152 million and $751 million in growth capital – primarily for the refinery. Sustaining capital, including closure costs, is estimated at $1.56 billion. A 2.5-year construction period is planned for the mine and concentrator.
The project economics made use of long-term consensus metal prices. With the metal price assumptions of $8.49 per pound of nickel, $4.30 per pound of copper and $18.31 per pound of cobalt, the Initial Assessment estimates an after-tax net present value (8%) of $2.4 billion and an after-tax internal rate of return of 22.9%.
| LZM KABANGA IA TRS FILING 2025 06 02 |
|
Table 1: Summary of the Initial Assessment Results.
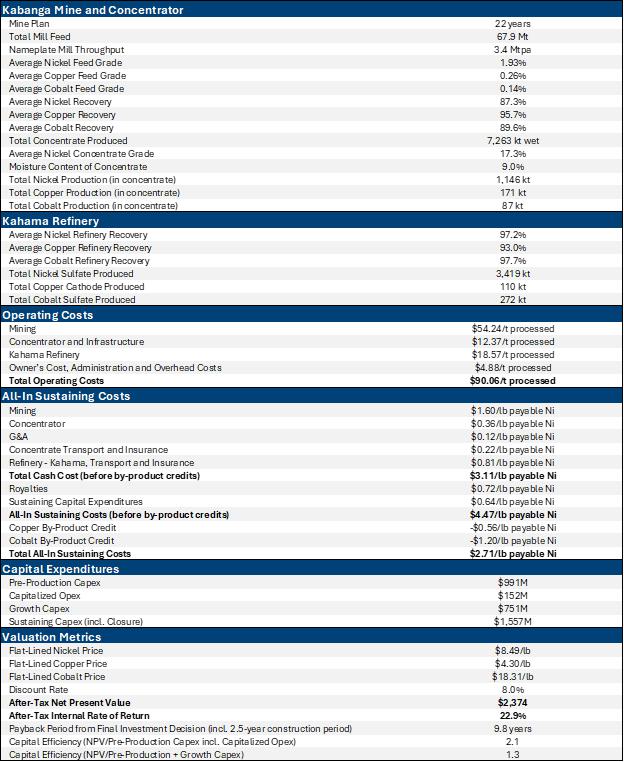
| LZM KABANGA IA TRS FILING 2025 06 02 |
|
Table 2: Kabanga Mineral Resource Estimates3 as at December 4, 2024.
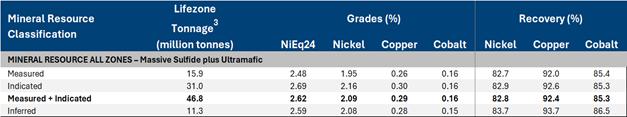
| 1. | This table reports the Mineral Resources for the combined massive sulfide and ultramafic mineralization types. |
| 2. | There are no Mineral Reserves to report as at date of this Initial Assessment Technical Report Summary. |
| 3. | Mineral Resources are reported showing only the Lifezone-attributable tonnage portion, which is 69.713% of the total. |
| 4. | Cut-off applies to NiEq24, which is derived using a nickel price of USD9.50/lb, copper price of USD4.50/lb, and cobalt price of USD23.00/lb with allowances for recoveries, payability, deductions, transport, and royalties. |
| 5. | NiEq24 formulae are: MSSX NiEq24 = Ni + (Cu x 0.454) + (Co x 2.497); UMAF NiEq24 = Ni + (Cu x 0.547) + (Co x 2.480). |
| 6. | The point of reference for Mineral Resources is the point of feed into a concentrator. |
| 7. | All Mineral Resources in the 2024 Mineral Resource Update were assessed for reasonable prospects for economic extraction by reporting only material above cut-off grades of: MSSX NiEq24>0.73% and UMAF NiEq24>0.77%. |
| 8. | Totals may vary due to rounding. |
The Initial Assessment is based on the December 2024 Mineral Resource Update, which includes 46.8 million tonnes of attributable Measured and Indicated Mineral Resources grading 2.09% nickel, 0.29% copper and 0.16% cobalt, and 11.3 million tonnes of attributable Inferred Mineral Resources grading 2.08% nickel, 0.28% copper and 0.15% cobalt. The Kabanga Nickel Project is 69.713% owned by Lifezone, and all Mineral Resources are shown on an attributable to Lifezone basis.
For a discussion of Lifezone’s Framework Agreement with the Government of Tanzania relating to the Kabanga Nickel Project, including equitable sharing of the economic benefits, see Item 10 C of the Lifezone’s Annual Report on Form 20-F for the year ended December 31, 2024 on the Company’s website or sec.gov.
The Initial Assessment is preliminary in nature and includes economic analyses that incorporate Inferred Mineral Resources, which are considered too speculative geologically to be classified as Mineral Reserves. There is no certainty that the results of the Initial Assessment will be realized.
For a scenario excluding Inferred Mineral Resources, the Initial Assessment estimates an after-tax net present value (8.0%) of $2.02 billion and an after-tax internal rate of return of 23.0%, reflecting a slightly higher average feed grade but lower total tonnage.
The capital cost, operating cost and sustaining capital cost estimates were prepared for the project as part of the Initial Assessment. The estimates are classified as being at an Association for the Advancement of Cost Engineering Class 5 level, with an accuracy range of ±50%, consistent with early-stage evaluation standards under Regulation S-K 1300. These estimates support the economic analysis undertaken for the Initial Assessment and demonstrate the reasonable prospects for economic extraction of the reported Mineral Resources.
| LZM KABANGA IA TRS FILING 2025 06 02 |
|
Figure 3: Production schedule with Measured, Indicated and Inferred Mineral Resources.
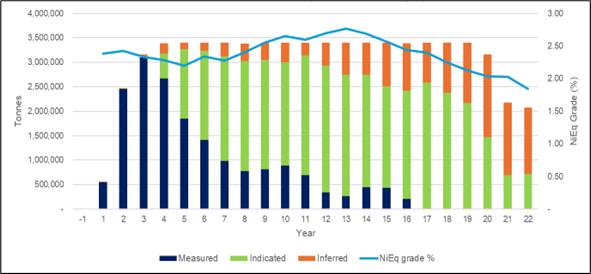
The Initial Assessment also outlines a sustainable tailings management strategy in line with Global Industry Standard on Tailings Management and Australian National Committee on Large Dams best practices. Approximately 52% of non-pyrrhotite tailings will be returned underground as paste aggregate fill, blended at 55% tailings and 45% waste rock with cement. The remaining pyrrhotite tailings will be stored in a fully lined downstream constructed tailings storage facility with a leakage collection system and subaqueous deposition to mitigate oxidation risks. The tailing storage facility is designed to accommodate up to 50 million tonnes and withstand a 1:10,000-year storm event. Closure plans include a water-shedding landform and multi-layer cover system. The design has been reviewed by an Independent Tailings Review Board, Government of Tanzania regulators and other industry experts.
Robust Initial Assessment economics for a globally significant source of nickel, copper and cobalt
A preliminary mine design, accessing Measured and Indicated Mineral Resources as well as Inferred Mineral Resources, outlines a 22-year mine plan for the project, with total underground production of 67.9 million tonnes grading 1.93% nickel, 0.26% copper and 0.14% cobalt. During the first five years of operation, the project will export a high-grade nickel-copper-cobalt concentrate while the hydrometallurgical refinery at Kahama is being developed. Once operational, the refinery will promote in-country beneficiation by producing battery-grade nickel and cobalt sulfate products and London Metal Exchange-grade copper cathode, in line with the Government of Tanzania’s expectations.
Total operating costs are projected to average approximately $90 per tonne processed, inclusive of mining, processing, refining, general and administrative, and logistics. AISC for refined nickel is estimated to average $2.71 per pound, net of copper and cobalt by-product credits.
Pre-production capital expenditures are estimated at $991 million, with a 16.1% contingency, covering underground mine development, concentrator construction, tailings storage facility, and supporting infrastructure. Capitalized operating costs are expected to total $152 million. Growth capital of $751 million is primarily allocated to the construction of the Kahama refinery. Sustaining capital over the mine plan is projected at $1.56 billion, including closure costs.
| LZM KABANGA IA TRS FILING 2025 06 02 |
|
Figure 4: Estimated project cash flows.

The project economics made use of long-term consensus metal prices. Metal price assumptions, of $8.49 per pound of nickel, $4.30 per pound of copper, and $18.31 per pound of cobalt, were used in the Initial Assessment to estimate total project revenue of $23.68 billion. The project is expected to generate $8.03 billion of after-tax undiscounted free cash flow, with an after-tax net present value (8.0%) of $2.37 billion and an after-tax internal rate of return of 22.9%.
The Initial Assessment also demonstrates strong downside resilience to nickel price fluctuation. Applying a sensitivity analysis at $7.00 per pound nickel price, the project maintains an after-tax net present value of $1.48 billion and an after-tax internal rate of return of 17.9%. This economic robustness is underpinned by the project’s high-grade Mineral Resource, valuable copper and cobalt by-products, low all-in sustaining costs and high capital efficiency.
| LZM KABANGA IA TRS FILING 2025 06 02 |
|
Figure 5: Sensitivity analysis of after-tax net present value (8%).
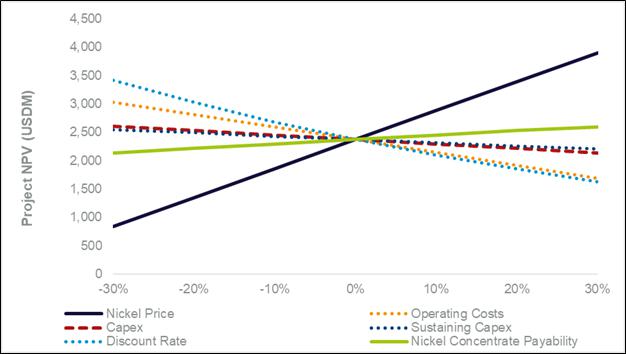
Phased underground mine development enhances capital efficiency and operational readiness
The Initial Assessment outlines a phased underground mine development strategy at Kabanga, designed to optimize capital efficiency and support an achievable production ramp-up. The mine will be accessed via declines from two boxcuts at the North and Tembo zones. Kima zone will share access from the North decline, while the Main and MNB zones are accessed via the North Mine. The underground operation will ramp up to a steady state rate of 3.4 million tonnes per annum which will feed the concentrator.
Figure 6: Proposed mine design.
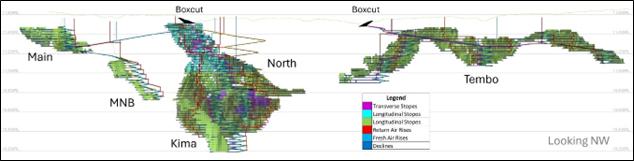
| LZM KABANGA IA TRS FILING 2025 06 02 |
|
Mining will be conducted using longhole stoping with paste backfill, with level spacing of 25 meters and stope strike lengths ranging from 20 to 30 meters. The mining sequence prioritizes the high-grade portions of the North zone. The North and Kima zones are expected to supply approximately 65% of the total mineralized material, followed by Tembo (25%) and Main and MNB (10%). The mine design incorporates detailed geotechnical modeling, ventilation planning, and a robust backfill system to ensure safe and efficient operations.
The development schedule includes a 2.5-year construction period followed by a 2.5-year ramp-up phase, during which critical infrastructure such as ventilation raises, pumping systems, and underground services will be established. The first five years of mining will be executed by a contract mining firm selected through a competitive tender process, ensuring experienced execution and cost control during the early stages of operation.
Figure 7: Proposed mine design sequence (in years).
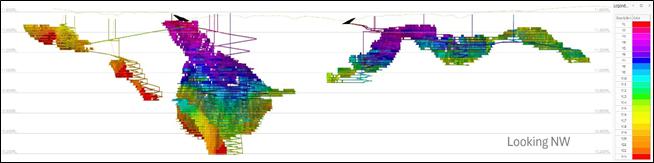
Further Exploration Targets offer significant upside potential
The Initial Assessment Technical Report Summary also discloses an overall Exploration Target of 17.5 to 23.5 million tonnes grading 1.9% to 2.1% nickel equivalent from four high-priority Exploration Targets within the Special Mining Licence, offering the potential to extend the mine plan and potentially enhance project value. These Exploration Targets, located at Safari Link, Safari Extension, Rubona Hill, and Block 1 South, are based on geophysical anomalies, historical drilling and geological continuity with known mineralized zones.
The ranges of potential tonnage and grade of the Exploration Targets are conceptual in nature. There has been insufficient exploration to estimate a Mineral Resource for these target areas. It is uncertain if further exploration will result in the estimation of a Mineral Resource.
| LZM KABANGA IA TRS FILING 2025 06 02 |
|
Table 3: Exploration Target summary.
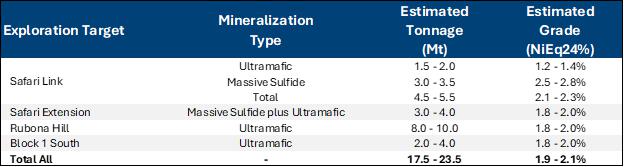
Lifezone has allocated a portion of the growth capital expenditures to support drilling and geophysical surveys across these targets, with the aim of delineating additional resources and supporting potential future expansions.
Figure 8: Location of Safari Link and Safari Extension exploration targets with airborne Versatile Time-Domain Electromagnetic background and interpreted major faults.
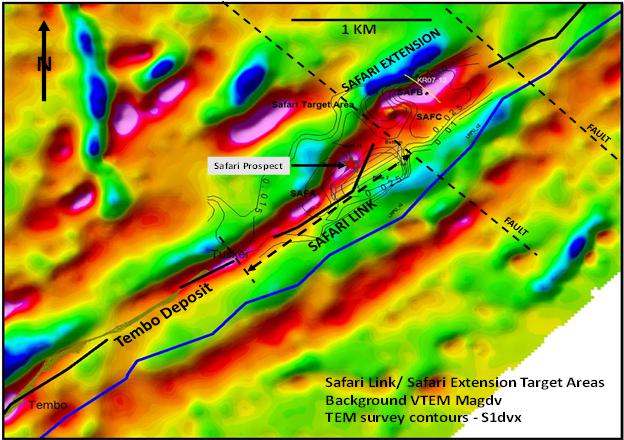
| LZM KABANGA IA TRS FILING 2025 06 02 |
|
Efficient sulfide concentrate production with high recoveries at the Kabanga concentrator
The Initial Assessment outlines a conventional concentrator facility at Kabanga, designed to process 3.4 million tonnes per annum and produce a high-grade nickel-copper-cobalt concentrate. The flowsheet, comprising crushing, wet grinding, flotation and dewatering, has been developed through extensive metallurgical testwork to suit the deposit’s mineralogy, including massive sulfide, semi-massive sulfide and ultramafic-hosted zones.
The concentrator is expected to achieve average metallurgical recoveries of 87.3% for nickel, 95.7% for copper and 89.7% for cobalt. The resulting concentrate, grading approximately 17.3% nickel, 2.6% copper and 1.3% cobalt, is low in deleterious elements and well-suited for downstream refining.
The high-grade, low-impurity nature of Kabanga’s concentrate has received strong interest from potential offtake partners for both nickel concentrate and refined battery-grade products. Indicative, non-binding terms have been obtained for 100% of the concentrate produced during the first five years of operations, prior to the commissioning of the Kahama refinery. Lifezone is also exploring strategic partnerships to support long-term marketing of nickel and cobalt sulfates into the electric vehicle markets.
High recoveries of battery-grade metals enabled by hydrometallurgical refining at Kahama
The Initial Assessment includes the Kahama refinery as a cornerstone of Lifezone’s vertically integrated strategy, employing a hydrometallurgical process to produce battery-grade nickel and cobalt sulfate products and London Metal Exchange Grade A 99.99% copper cathode. In the Initial Assessment, a refinery demonstration plant will be constructed and operated at the Kahama site once nickel concentrate is available from Kabanga, but prior to the full-scale refinery construction and operation. This will be undertaken to optimize and finalize the hydrometallurgical flowsheet and further de-risk the refinery.
Designed to process concentrate from the Kabanga mine, the refinery is expected to achieve average metal recoveries from concentrate of 97.2% for nickel, 93.0% for copper and 97.7% for cobalt. The flowsheet incorporates pressure oxidation, neutralization, solvent extraction, electrowinning and crystallization, enabling the designed production of approximately 50,000 tonnes per annum of nickel as nickel sulfate, 7,000 tonnes of copper cathode and 4,000 tonnes of cobalt as cobalt sulfate. All products are expected to meet stringent purity standards for use in electric vehicle batteries.
| LZM KABANGA IA TRS FILING 2025 06 02 |
|
Figure 9: Allocated refinery site at Kahama.
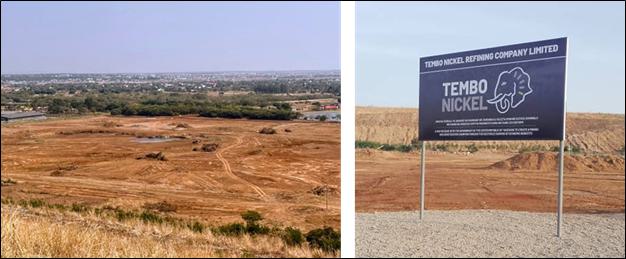
Strategically located within Tanzania’s Buzwagi Special Economic Zone, the Kahama refinery benefits from existing bulk infrastructure and supports the country’s industrialization goals. By refining metals in-country with hydrometallurgy, the project is expected to have a reduced carbon dioxide emissions footprint compared to traditional smelting and overseas processing and enhances supply chain transparency.
Integrated logistics network strengthened by national infrastructure upgrades
The Kabanga Nickel Project is supported by a logistics network that connects the Kabanga mine site to the Kahama refinery and international export markets. Nickel-copper-cobalt concentrate will be transported approximately 348 kilometers by road from Kabanga to the Isaka Dry Port (rail terminal), using third-party haulage and sealed Flexible Bulk Containers. From Isaka, the concentrate will be transferred onto the Standard Gauge Railway, which is expected to be operational in 2026, for shipment to the Kwala Dry Port and then via dedicated “Port Link” to the Port of Dar es Salaam, into bulk sea freight vessels.
Once the Kahama Refinery begins operations, concentrate will be trucked approximately 320 kilometers by road from Kabanga to the refinery. The refined products, nickel sulfate, copper cathode and cobalt sulfate, will then be transported approximately 30 kilometers by road to Isaka Dry Port, loaded onto the Standard Gauge Railway, and transported via the same route to the Port of Dar es Salaam for export.
Recent national infrastructure investments, including the Standard Gauge Railway, expanded port capacity at Dar es Salaam and the Julius Nyerere Hydropower Project, are expected to enhance the efficiency, reliability and sustainability of the project’s logistics operations.
| LZM KABANGA IA TRS FILING 2025 06 02 |
|
Figure 10: Standard Gauge Railway locomotives in operation.
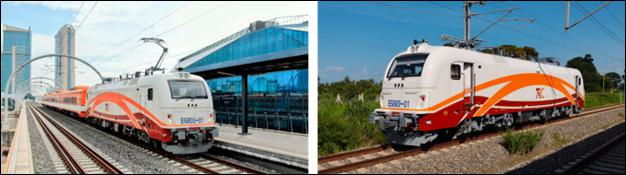
Strong ESG credentials aligned with global best practices
The Kabanga Nickel Project is committed to aligning with both Tanzanian regulatory requirements and internationally recognized ESG standards. The project operates within the legal framework of Tanzania, complying with national laws related to environmental protection, social impact management, land access, resettlement, and permitting.
The Project also seeks alignment with leading international ESG frameworks. These include the International Finance Corporation Performance Standards, Equator Principles, Global Industry Standard on Tailings Management and guidelines issued by the and Australian National Committee on Large Dams and International Council on Mining and Metals, ensuring the adoption of sustainable and responsible mining practices.
Comprehensive Environmental and Social Impact Assessments have been completed and approved by Tanzania’s National Environment Management Council for the mine, refinery and resettlement sites.
A Resettlement Action Plan, aligned with International Finance Corporation Performance Standard 5, ensures fair and sustainable relocation for affected communities, with 96% of the required cash compensation already paid, allowing access to the Project footprint as required.
Catalyzing economic growth and industrial development in Tanzania
The Kabanga Nickel Project is poised to deliver long-term economic benefits to Tanzania through job creation, infrastructure development, and domestic value addition. By integrating mining and refining operations within the country, the project directly supports the government’s vision for local beneficiation and industrialization.
| LZM KABANGA IA TRS FILING 2025 06 02 |
|
The Framework Agreement with the Government of Tanzania for development of the Kabanga Nickel Project ensures that the economic value generated by the project is equitably shared with the Government of Tanzania, contributing to national development goals and community upliftment. Construction and operations are expected to generate thousands of direct and indirect jobs, stimulate local supply chains, and build technical capacity in mining and metallurgy.
The Kahama Refinery, located in the Buzwagi Special Economic Zone, will position Tanzania as a regional hub for battery metals processing. This strategic investment is expected to attract further capital and reinforce Tanzania’s role in the global clean energy transition.
Next steps and strategic recommendations
As one of the world’s largest undeveloped high-grade nickel sulfide deposits, the Kabanga Nickel Project is uniquely positioned to support the global energy transition. With its integrated mine-to-refinery model and strong partnership with the Government of Tanzania, Kabanga offers a scalable, long-life supply of nickel, copper and cobalt.
With the Initial Assessment complete, the project will advance to the completion of a Feasibility Study for the underground mine and concentrator, supported by a Mineral Reserve Statement. The target for completion of the Feasibility Study is July 2025.
To support the Kabanga project development, Lifezone is pursuing a diversified funding strategy that includes a mix of equity, strategic partnerships, and project-level debt. Discussions are ongoing with development finance institutions, commercial lenders, and potential strategic investors. The project’s attractive economics, low operating costs and alignment with global critical minerals priorities position Kabanga as a compelling candidate for sustainable financing. Lifezone expects to finalize the funding package following completion of the Feasibility Study.
Qualified Persons
The “Initial Assessment – Technical Report Summary Kabanga Nickel Project” is dated June 2, 2025 and was prepared by DRA Projects (Pty) Ltd. and Sharron Sylvester in accordance with the United States Securities and Exchange Commission’s (Modernized Property Disclosure Requirements under Subpart 229.1300 of Regulation S-K and Item 601(b)(96).
Sharron Sylvester, BSc (Geol), RPGeo AIG (10125), is employed as Technical Director – Geology, OreWin Pty Ltd, and was responsible for the preparation of the sections relating to geology and Mineral Resources as the QP (individual), excluding cut-off grade and reasonable prospects assessments.
DRA is a third-party firm comprising mining experts in their respective fields in accordance with 17 CFR § 229.1302(b)(1). Lifezone has determined that the appointed consultants meet the qualifications specified under the definition of QP in 17 CFR § 229.1300.
| LZM KABANGA IA TRS FILING 2025 06 02 |
|
The Initial Assessment Technical Report Summary includes relevant information regarding the assumptions, parameters and methods of the Initial Assessment on the Kabanga Nickel Project, along with the previously-reported Mineral Resource estimates as well as information regarding data verification, exploration procedures and other matters relevant to the scientific and technical disclosure contained in this news release.
Contact
| Investor Relations – North America | Investor Relations – Europe |
| Evan Young | Ingo Hofmaier |
| SVP: Investor Relations & Capital Markets | Chief Financial Officer |
| evan.young@lifezonemetals.com | ingo.hofmaier@lifezonemetals.com |
If you would like to sign up for Lifezone Metals news alerts, please register here.
Social Media
LinkedIn | X | YouTube
About Lifezone Metals
Lifezone Metals (NYSE: LZM) is committed to delivering cleaner and more responsible metals production and recycling. Through the application of our Hydromet Technology, we offer the potential for lower energy consumption, lower emissions and lower cost metals production compared to traditional smelting.
Our Kabanga Nickel Project in Tanzania is believed to be one of the world’s largest and highest-grade undeveloped nickel sulfide deposits. By pairing it with our Hydromet Technology, we are working to unlock a new source of nickel, copper and cobalt for the global battery metals markets and to empower Tanzania to achieve full in-country value creation.
Through our US-based recycling partnership, we are working to demonstrate that our Hydromet Technology can process and recover platinum, palladium and rhodium from responsibly sourced spent automotive catalytic converters. Our process is expected to be cleaner and more efficient than conventional smelting and refining methods, enabling the circular economy for precious metals.
www.lifezonemetals.com
Forward-Looking Statements
Certain statements made herein are not historical facts but may be considered “forward-looking statements” within the meaning of the Securities Act of 1933, as amended, the Securities Exchange Act of 1934, as amended, and the “safe harbor” provisions under the Private Securities Litigation Reform Act of 1995 regarding, amongst other things, the plans, strategies, intentions and prospects, both business and financial, of Lifezone Metals Limited and its subsidiaries.
Generally, statements that are not historical facts, including statements concerning possible or assumed future actions, business strategies, events or results of operations, and any statements that refer to projections, forecasts or other characterizations of future events or circumstances, including any underlying assumptions, are forward-looking statements. Forward-looking statements may be accompanied by words such as “believes,” “estimates,” “expects,” “predicts,” “projects,” “forecasts,” “may,” “might,” “will,” “could,” “should,” “would,” “seeks,” “plans,” “scheduled,” “possible,” “continue,” “potential,” “anticipates” or “intends” “or the negatives of these terms or variations of them or similar terminology or expressions that predict or indicate future events or trends or that are not statements of historical matters; provided that the absence of these does not mean that a statement is not forward-looking. These forward-looking statements include, but are not limited to, statements regarding future events, the estimated or anticipated future results of Lifezone Metals, future opportunities for Lifezone Metals, including the efficacy of Lifezone Metals’ hydrometallurgical technology (Hydromet Technology) and the development of, and processing of mineral resources at, the Kabanga Nickel Project, and other statements that are not historical facts.
| LZM KABANGA IA TRS FILING 2025 06 02 |
|
These statements are based on the current expectations of Lifezone Metals’ management and are not predictions of actual performance. These forward-looking statements are provided for illustrative purposes only and are not intended to serve as, and must not be relied on, by any investor as a guarantee, an assurance, a prediction or a definitive statement of fact or probability. Actual events and circumstances are difficult or impossible to predict and will differ from assumptions. Many actual events and circumstances are beyond the control of Lifezone Metals and its subsidiaries. These statements are subject to a number of risks and uncertainties regarding Lifezone Metals’ business, and actual results may differ materially. These risks and uncertainties include, but are not limited to: general economic, political and business conditions, including but not limited to economic and operational disruptions; global inflation and cost increases for materials and services; reliability of sampling; success of any pilot work; capital and operating costs varying significantly from estimates; delays in obtaining or failures to obtain required governmental, environmental or other project approvals; changes in government regulations, legislation and rates of taxation; inflation; changes in exchange rates and the availability of foreign exchange; fluctuations in commodity prices; delays in the development of projects and other factors; the outcome of any legal proceedings that may be instituted against Lifezone Metals; our ability to obtain additional capital, including use of the debt market, future capital requirements and sources and uses of cash; the risks related to the rollout of Lifezone Metals’ business, the efficacy of the Hydromet Technology, and the timing of expected business milestones; the acquisition of, maintenance of and protection of intellectual property; Lifezone’s ability to achieve projections and anticipate uncertainties (including economic or geopolitical uncertainties) relating to our business, operations and financial performance, including: expectations with respect to financial and business performance, future operating results, financial projections and business metrics and any underlying assumptions; expectations regarding product and technology development and pipeline and market size; expectations regarding product and technology development and pipeline; future acquisitions, partnerships, or other relationships with third parties; maintaining key strategic relationships with partners and customers; the timing and significance of contractual relationships; the effects of competition on Lifezone Metals’ business; the ability of Lifezone Metals to execute its growth strategy, the development and processing of the mineral resources at the Kabanga Nickel Project; obtaining additional capital, including use the debt market, future capital requirements, and sources and uses of cash; manage growth profitably and retain its key employees; the ability of Lifezone Metals to reach and maintain profitability; enhancing future operating and financial results; complying with laws and regulations applicable to Lifezone Metals’ business; Lifezone Metals’ ability to continue to comply with applicable listing standards of the NYSE; the ability of Lifezone Metals to maintain the listing of its securities on a U.S. national securities exchange; our ability to comply with applicable laws and regulations; stay abreast of accounting standards, or modified or new laws and regulations applying to our business, including privacy regulation; and other risks that will be detailed from time to time in filings with the U.S. Securities and Exchange Commission (SEC) meeting future liquidity requirements and complying with restrictive covenants related to long-term indebtedness; and dealing effectively with litigation, complaints, and/or adverse publicity..
The foregoing list of risk factors is not exhaustive. There may be additional risks that Lifezone Metals presently does not know or that Lifezone Metals currently believes are immaterial that could also cause actual results to differ from those contained in forward-looking statements. In addition, forward-looking statements provide Lifezone Metals’ expectations, plans or forecasts of future events and views as of the date of this communication. Lifezone Metals anticipates that subsequent events and developments will cause Lifezone Metals’ assessments to change.
These forward-looking statements should not be relied upon as representing Lifezone Metals’ assessments as of any date subsequent to the date of this communication. You should not place undue reliance on forward-looking statements in this communication, which are based upon information available to us as of the date they are made and are qualified in their entirety by reference to the cautionary statements herein. In all cases where historical performance is presented, please note that past performance is not a credible indicator of future results.
Except as otherwise required by applicable law, we disclaim any obligation to publicly update or revise any forward-looking statement to reflect changes in underlying assumptions or factors, new information, data, or methods, future events, or other changes after the date of this communication.
| LZM KABANGA IA TRS FILING 2025 06 02 | 17 |