UNITED STATES
SECURITIES AND EXCHANGE COMMISSION
WASHINGTON, D.C. 20549
FORM 8-K
CURRENT REPORT
Pursuant to Section 13 or 15(d) of
the Securities Exchange Act of 1934
Date of Report (Date of Earliest Event Reported): November 7, 2025

VIASAT, INC.
(Exact Name of Registrant as Specified in its Charter)
| Delaware
|
000-21767
|
33-0174996
|
||
| (State or Other Jurisdiction of Incorporation) |
(Commission File No.) | (I.R.S. Employer Identification No.) |
6155 El Camino Real
Carlsbad, California 92009
(Address of Principal Executive Offices, Including Zip Code)
(760) 476-2200
(Registrant’s Telephone Number, Including Area Code)
Check the appropriate box below if the Form 8-K filing is intended to simultaneously satisfy the filing obligation of the registrant under any of the following provisions:
☐ Written communications pursuant to Rule 425 under the Securities Act (17 CFR 230.425)
☐ Soliciting material pursuant to Rule 14a-12 under the Exchange Act (17 CFR 240.14a-12)
☐ Pre-commencement communications pursuant to Rule 14d-2(b) under the Exchange Act (17 CFR 240.14d-2(b))
☐ Pre-commencement communications pursuant to Rule 13e-4(c) under the Exchange Act (17 CFR 240.13e-4(c))
| (Title of Each Class) |
(Trading Symbol) |
(Name of Each Exchange on which Registered) |
||
| Common Stock, par value $0.0001 per share | VSAT | The Nasdaq Stock Market LLC |
Indicate by check mark whether the registrant is an emerging growth company as defined in Rule 405 of the Securities Act of 1933 (§230.405 of this chapter) or Rule 12b-2 of the Securities Exchange Act of 1934 (§240.12b-2 of this chapter).
Emerging growth company ☐
If an emerging growth company, indicate by check mark if the registrant has elected not to use the extended transition period for complying with any new or revised financial accounting standards provided pursuant to Section 13(a) of the Exchange Act. ☐
| Item 2.02 | Results of Operations and Financial Condition. |
On November 7, 2025, Viasat, Inc. released its financial results for the second quarter of fiscal year 2026 in a letter to shareholders that is available on the investor relations section of its website. A copy of the press release announcing the release of financial results is furnished herewith as Exhibit 99.1 and a copy of the letter to shareholders is furnished herewith as Exhibit 99.2.
The information contained herein and in the accompanying exhibits shall not be incorporated by reference into any filing of the registrant, whether made before or after the date hereof, regardless of any general incorporation language in such filing, unless expressly incorporated by specific reference to such filing. The information in this report, including the exhibit hereto, shall not be deemed to be “filed” for purposes of Section 18 of the Securities Exchange Act of 1934, as amended, or otherwise subject to the liabilities of that section or Sections 11 and 12(a)(2) of the Securities Act of 1933, as amended.
| Item 9.01 | Financial Statements and Exhibits. |
| (d) | Exhibits |
| Exhibit Number |
Description of Exhibit | |
| 99.1 | ||
| 99.2 | Viasat, Inc. second quarter of fiscal year 2026 letter to shareholders dated November 7, 2025 |
|
| 104 | Cover Page Interactive Data File (embedded within the Inline XBRL document) |
1
SIGNATURES
Pursuant to the requirements of the Securities Exchange Act of 1934, the registrant has duly caused this report to be signed on its behalf by the undersigned hereunto duly authorized.
| Date: November 7, 2025 | Viasat, Inc. | |||
| By: | /s/ Brett Church |
|||
| Brett Church | ||||
| Associate General Counsel | ||||
2
Exhibit 99.1
Viasat Releases Second Quarter Fiscal Year 2026 Financial Results
CARLSBAD, Calif., November 7, 2025 — Viasat, Inc. (NASDAQ: VSAT), a global leader in satellite communications, today published its second quarter fiscal year 2026 financial results in a letter to shareholders, which, along with webcast slides, is now posted to the Investor Relations section of Viasat’s website.
As previously announced, Viasat will host a conference call today, Friday, November 7, 2025 at 2:30 p.m. Pacific Time /5:30 p.m. Eastern Time. To participate on the live conference call, please dial (800) 715-9871 toll-free in the U.S. or Internationally, or (646) 307-1963 in the U.S., and reference the conference ID 2291081.
Participants can also listen to the live webcast from the Investor Relations section of the Viasat website. The call will be archived and available on the site for approximately one month immediately following the conference call.
# # #
About Viasat
Viasat is a global communications company that believes everyone and everything in the world can be connected. With offices in 24 countries around the world, our mission shapes how consumers, businesses, governments and militaries around the world communicate and connect. Viasat is developing the ultimate global communications network to power high-quality, reliable, secure, affordable, fast connections to positively impact people’s lives anywhere they are—on the ground, in the air or at sea, while building a sustainable future in space. In May 2023, Viasat completed its acquisition of Inmarsat, combining the teams, technologies and resources of the two companies to create a new global communications partner. Learn more at www.viasat.com, the Viasat News Room or follow us on LinkedIn, X, Instagram, Facebook, Bluesky, Threads, and YouTube.
Copyright © 2025 Viasat, Inc. All rights reserved. Viasat, the Viasat logo and the Viasat Signal are registered trademarks in the U.S. and in other countries of Viasat, Inc. All other product or company names mentioned are used for identification purposes only and may be trademarks of their respective owners.
Viasat, Inc. Contacts
Scott Goryl/Daniel Bleier, Corporate Communications, PR@viasat.com
Lisa Curran/Peter Lopez, Investor Relations, IR@viasat.com
Exhibit 99.2

Viasat Q2 FY26 Shareholder Letter
Fellow Shareholders, Our Q2 Fiscal Year 2026 performance and impending launch of ViaSat-3 (VS-3) F2 reflect the meaningful progress we are making against our highest priorities and commitment to building value for our employees, customers, and shareholders. We are especially pleased with our awards growth and cash performance while we balance investing for future growth while reducing capital intensity. For Q2 FY2026, we reported a net loss1 of $61 million improved from a net loss1 of $138 million in Q2 FY2025. This improvement was primarily due to favorable service mix, lower depreciation and amortization, and reduced selling, general, and administrative expenses. Revenue grew 2% year-over-year (YoY) driven primarily by 3% growth in the Defense and Advanced Technologies segment and a 1% YoY increase in the Communication Services segment. Adjusted EBITDA2 increased by 3% YoY as better than expected Adjusted EBITDA growth in the Communication Services segment was partially offset by an expected YoY Adjusted EBITDA decline in Defense and Advanced Technologies. The impending launch of VS-3 F2 will be a very meaningful milestone for the company. An incredible amount of dedication went into preparing the satellite for launch and I really appreciate all of the efforts of our entire team to get it done. We remain focused on getting both VS-3 F2 and VS-3 F3 into service as reflected in the accompanying satellite roadmap. As a reminder, each of the new VS-3 satellites is designed to enable more bandwidth capacity than our entire existing fleet – creating opportunities to grow in each of our franchise businesses – and to accelerate growth and drive meaningful free cash flow3 contributions in the Communication Services segment. Our Defense and Advanced Technologies segment outlook is promising as backlog increased to a record $1.2 billion, up 31% YoY and 14% sequentially. Our projected long-term growth trajectory is supported by several attractive secular growth drivers including: • Increased reliance on space-based assets, both domestically and internationally, for national security purposes which creates a growing set of global opportunities for the commercial space industry, especially for dual-use capable systems • Increased demand for highly resilient communications, including both terrestrial and satellite in multi-domain operations requiring seamless interoperability • Growing demand for digitization of military infrastructure to enable highly computationally intense autonomous, cloud-centric, and AI-driven decisions while simultaneously defending against increasingly sophisticated cyber threats • The growing global recognition of the value of sovereign control over space systems • Increased integration of commercial and defense technologies together with the rise of Non-Terrestrial Network (NTN) connectivity including Direct-to-Device (D2D)Not surprisingly, we are seeing a significant uptick in interest for commercial mobile space networks that enable D2D NTN connectivity. Given some of the recent market transactions we are seeing in this space and our own coordination agreement with AST/Ligado, it seems there is a greater appreciation of the value that we can create with our mobile satellite spectrum. The announcement we made in September regarding our intention to form Equatys with Space42, and potentially other operators, is an example of how we believe we can continue to build on the value of our large, coordinated and highly strategic global position in Mobile Satellite Services (MSS) while managing and reducing capital intensity. As I mentioned last quarter, we are continuing to opportunistically strengthen our capital structure via cash flow improvements, addressing debt maturities, and conducting ongoing portfolio reviews. The Strategic Review Committee of our Board continues to evaluate our capital allocation and portfolio priorities, including the merits of separating our government and commercial businesses within a competitive environment of government-commercial dual use and vertical integration opportunities. We are focused on building shareholder value and reinforcing our competitive positions, and we see accelerating deleveraging and collapsing the Viasat and Inmarsat debt silos into one as important components to that. We believe the strong start to the first half of fiscal year 2026 is an important proof point as we compete not only for business success and outcomes, but also for investor confidence and capital. Once again, we recognize there will be challenges but we are playing to win. Sincerely, Mark Dankberg
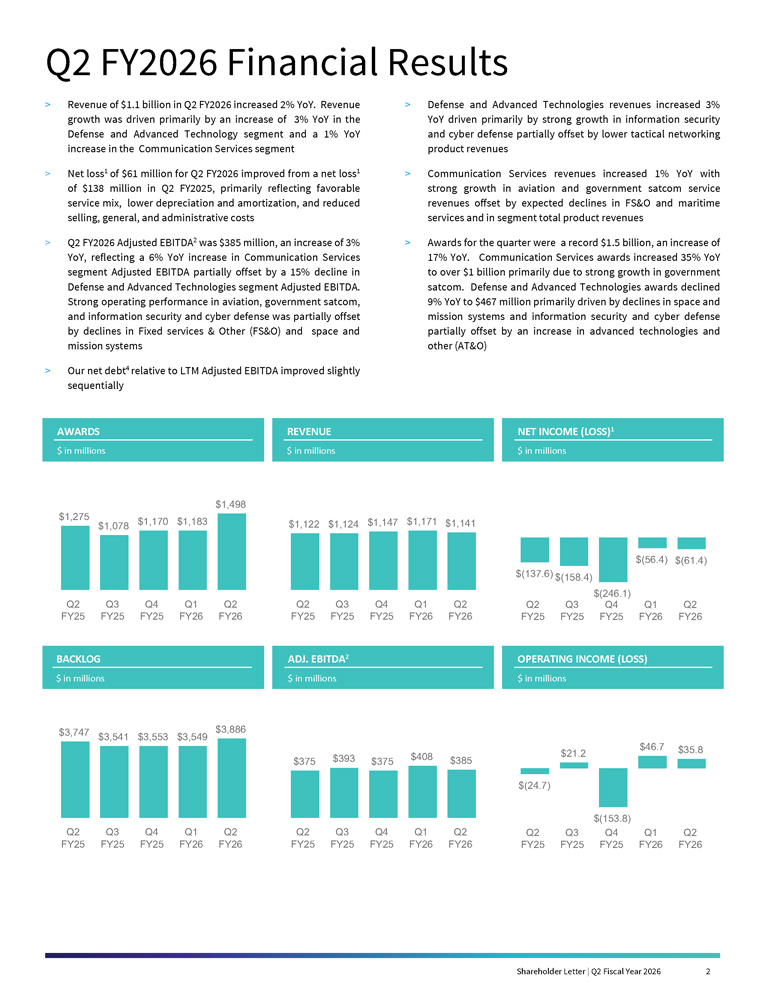
Q2 FY2026 Financial Results>Revenue of $1.1 billion in Q2 FY2026 increased 2% YoY. Revenue growth was driven primarily by an increase of 3% YoY in the Defense and Advanced Technology segment and a 1% YoY increase in the Communication Services segment>Net loss1 of $61 million for Q2 FY2026 improved from a net loss1 of $138 million in Q2 FY2025, primarily reflecting favorable service mix, lower depreciation and amortization, and reduced selling, general, and administrative costs>Q2 FY2026 Adjusted EBITDA2 was $385 million, an increase of 3% YoY, reflecting a 6% YoY increase in Communication Services segment Adjusted EBITDA partially offset by a 15% decline in Defense and Advanced Technologies segment Adjusted EBITDA. Strong operating performance in aviation, government satcom, and information security and cyber defense was partially offset by declines in Fixed services & Other (FS&O) and space and mission systems>Our net debt4 relative to LTM Adjusted EBITDA improved slightly sequentially>Defense and Advanced Technologies revenues increased 3% YoY driven primarily by strong growth in information security and cyber defense partially offset by lower tactical networking product revenues >Communication Services revenues increased 1% YoY with strong growth in aviation and government satcom service revenues offset by expected declines in FS&O and maritime services and in segment total product revenues>Awards for the quarter were a record $1.5 billion, an increase of 17% YoY. Communication Services awards increased 35% YoY to over $1 billion primarily due to strong growth in government satcom. Defense and Advanced Technologies awards declined 9% YoY to $467 million primarily driven by declines in space and mission systems and information security and cyber defense partially offset by an increase in advanced technologies and other (AT&O) AWARDS $ in millions REVENUE $ in millions NET INCOME (LOSS)1 $ in millions $1,275 $1,078 $1,170 $1,183 $1,498 Q2 FY25 Q3 FY25 Q4 FY25 Q1 FY26 Q2 FY26 $1,122 $1,124 $1,147 $1,171 $1,141 $(137.6) $(158.4) $(246.1) $(56.4) $(61.4) BACKLOG $ in millions ADJ. EBITDA2 $ in millions OPERATING INCOME (LOSS) $ in millions $3,747 $3,541 $3,553 $3,549 $3,886 $375 $393 $375 $408 $385 $(24.7) $21.2 $(153.8) $46.7 $35.8 Shareholder Letter | Q2 Fiscal Year 2026 2
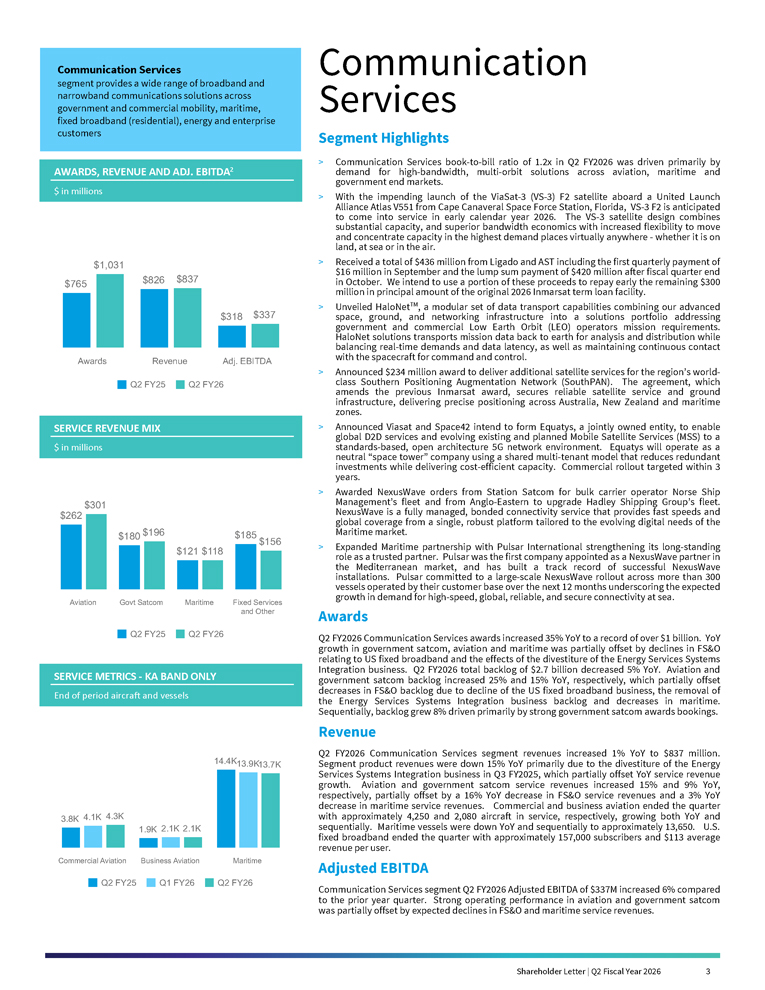
Communication Services Segment Highlights > Communication Services book-to-bill ratio of 1.2x in Q2 FY2026 was driven primarily by demand for high-bandwidth, multi-orbit solutions across aviation, maritime and government end markets. > With the impending launch of the ViaSat-3 (VS-3) F2 satellite aboard a United Launch Alliance Atlas V551 from Cape Canaveral Space Force Station, Florida, VS-3 F2 is anticipated to come into service in early calendar year 2026. The VS-3 satellite design combines substantial capacity, and superior bandwidth economics with increased flexibility to move and concentrate capacity in the highest demand places virtually anywhere - whether it is on land, at sea or in the air. > Received a total of $436 million from Ligado and AST including the first quarterly payment of $16 million in September and the lump sum payment of $420 million after fiscal quarter end in October. We intend to use a portion of these proceeds to repay early the remaining $300 million in principal amount of the original 2026 Inmarsat term loan facility. > Unveiled HaloNetTM, a modular set of data transport capabilities combining our advanced space, ground, and networking infrastructure into a solutions portfolio addressing government and commercial Low Earth Orbit (LEO) operators mission requirements. HaloNet solutions transports mission data back to earth for analysis and distribution while balancing real-time demands and data latency, as well as maintaining continuous contact with the spacecraft for command and control. > Announced $234 million award to deliver additional satellite services for the region’s world-class Southern Positioning Augmentation Network (SouthPAN). The agreement, which amends the previous Inmarsat award, secures reliable satellite service and ground infrastructure, delivering precise positioning across Australia, New Zealand and maritime zones. >Announced Viasat and Space42 intend to form Equatys, a jointly owned entity, to enable global D2D services and evolving existing and planned Mobile Satellite Services (MSS) to a standards-based, open architecture 5G network environment. Equatys will operate as a neutral “space tower” company using a shared multi-tenant model that reduces redundant investments while delivering cost-efficient capacity. Commercial rollout targeted within 3 years.>Awarded NexusWave orders from Station Satcom for bulk carrier operator Norse Ship Management’s fleet and from Anglo-Eastern to upgrade Hadley Shipping Group’s fleet. NexusWave is a fully managed, bonded connectivity service that provides fast speeds and global coverage from a single, robust platform tailored to the evolving digital needs of the Maritime market. >Expanded Maritime partnership with Pulsar International strengthening its long-standing role as a trusted partner. Pulsar was the first company appointed as a NexusWave partner in the Mediterranean market, and has built a track record of successful NexusWave installations. Pulsar committed to a large-scale NexusWave rollout across more than 300 vessels operated by their customer base over the next 12 months underscoring the expected growth in demand for high-speed, global, reliable, and secure connectivity at sea. AwardsQ2 FY2026 Communication Services awards increased 35% YoY to a record of over $1 billion. YoY growth in government satcom, aviation and maritime was partially offset by declines in FS&O relating to US fixed broadband and the effects of the divestiture of the Energy Services Systems Integration business. Q2 FY2026 total backlog of $2.7 billion decreased 5% YoY. Aviation and government satcom backlog increased 25% and 15% YoY, respectively, which partially offset decreases in FS&O backlog due to decline of the US fixed broadband business, the removal of the Energy Services Systems Integration business backlog and decreases in maritime. Sequentially, backlog grew 8% driven primarily by strong government satcom awards bookings. Revenue Q2 FY2026 Communication Services segment revenues increased 1% YoY to $837 million. Segment product revenues were down 15% YoY primarily due to the divestiture of the Energy Services Systems Integration business in Q3 FY2025, which partially offset YoY service revenue growth. Aviation and government satcom service revenues increased 15% and 9% YoY, respectively, partially offset by a 16% YoY decrease in FS&O service revenues and a 3% YoY decrease in maritime service revenues. Commercial and business aviation ended the quarter with approximately 4,250 and 2,080 aircraft in service, respectively, growing both YoY and sequentially. Maritime vessels were down YoY and sequentially to approximately 13,650. U.S. fixed broadband ended the quarter with approximately 157,000 subscribers and $113 average revenue per user. Adjusted EBITDA Communication Services segment Q2 FY2026 Adjusted EBITDA of $337M increased 6% compared to the prior year quarter. Strong operating performance in aviation and government satcom was partially offset by expected declines in FS&O and maritime service revenues. Communication Services segment provides a wide range of broadband and narrowband communications solutions across government and commercial mobility, maritime, fixed broadband (residential), energy and enterprise customers AWARDS, REVENUE AND ADJ. EBITDA2 $ in millions $1,031 $765 $826 $837 $318 $337 Awards Revenue Adj. EBITDA Q2 FY25 Q2 FY26 SERVICE REVENUE MIX $ in millions $262 $301 $180 $121 $185 $196 $118 $156 Aviation Govt Satcom Maritime Fixed Services and Other Q2 FY25 Q2 FY26 SERVICE METRICS - KA BAND ONLY End of period aircraft and vessels 3.8K 1.9K 4.1K 2.1K 4.3K 2.1K 14.4K 13.9K 13.7K Commercial Aviation Business Aviation Maritime Q2 FY25 Q1 FY26 Q2 FY26 Shareholder Letter | Q2 Fiscal Year 2026 3
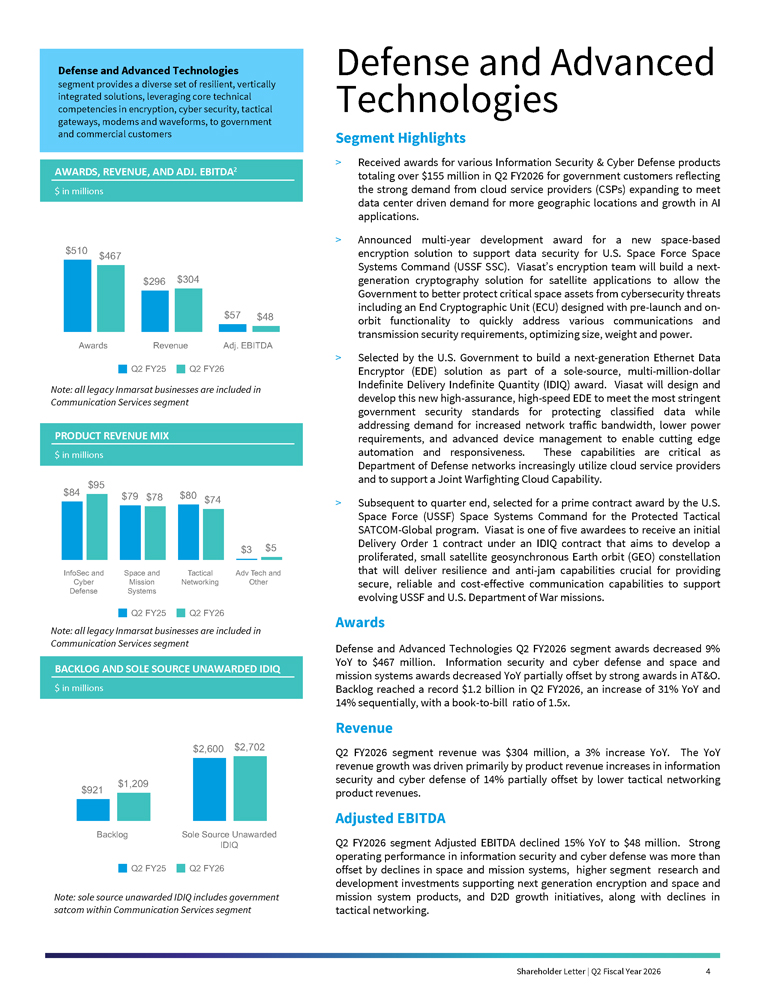
Defense and Advanced Technologies Segment Highlights>Received awards for various Information Security & Cyber Defense products totaling over $155 million in Q2 FY2026 for government customers reflecting the strong demand from cloud service providers (CSPs) expanding to meet data center driven demand for more geographic locations and growth in AI applications.>Announced multi-year development award for a new space-based encryption solution to support data security for U.S. Space Force Space Systems Command (USSF SSC). Viasat’s encryption team will build a next-generation cryptography solution for satellite applications to allow the Government to better protect critical space assets from cybersecurity threats including an End Cryptographic Unit (ECU) designed with pre-launch and on-orbit functionality to quickly address various communications and transmission security requirements, optimizing size, weight and power.>Selected by the U.S. Government to build a next-generation Ethernet Data Encryptor (EDE) solution as part of a sole-source, multi-million-dollar Indefinite Delivery Indefinite Quantity (IDIQ) award. Viasat will design and develop this new high-assurance, high-speed EDE to meet the most stringent government security standards for protecting classified data while addressing demand for increased network traffic bandwidth, lower power requirements, and advanced device management to enable cutting edge automation and responsiveness. These capabilities are critical as Department of Defense networks increasingly utilize cloud service providers and to support a Joint Warfighting Cloud Capability.>Subsequent to quarter end, selected for a prime contract award by the U.S. Space Force (USSF) Space Systems Command for the Protected Tactical SATCOM-Global program. Viasat is one of five awardees to receive an initial Delivery Order 1 contract under an IDIQ contract that aims to develop a proliferated, small satellite geosynchronous Earth orbit (GEO) constellation that will deliver resilience and anti-jam capabilities crucial for providing secure, reliable and cost-effective communication capabilities to support evolving USSF and U.S. Department of War missions. Awards Defense and Advanced Technologies Q2 FY2026 segment awards decreased 9% YoY to $467 million. Information security and cyber defense and space and mission systems awards decreased YoY partially offset by strong awards in AT&O. Backlog reached a record $1.2 billion in Q2 FY2026, an increase of 31% YoY and 14% sequentially, with a book-to-bill ratio of 1.5x.RevenueQ2 FY2026 segment revenue was $304 million, a 3% increase YoY. The YoY revenue growth was driven primarily by product revenue increases in information security and cyber defense of 14% partially offset by lower tactical networking product revenues. Adjusted EBITDAQ2 FY2026 segment Adjusted EBITDA declined 15% YoY to $48 million. Strong operating performance in information security and cyber defense was more than offset by declines in space and mission systems, higher segment research and development investments supporting next generation encryption and space and mission system products, and D2D growth initiatives, along with declines in tactical networking. Defense and Advanced Technologies segment provides a diverse set of resilient, vertically integrated solutions, leveraging core technical competencies in encryption, cyber security, tactical gateways, modems and waveforms, to government and commercial customers AWARDS, REVENUE, AND ADJ. EBITDA2 $ in millions $510 $467 $296 $304 $57 $48 Awards Revenue Adj. EBITDA Q2 FY25 Q2 FY26 Note: all legacy Inmarsat businesses are included in Communication Services segment PRODUCT.REVENUE.MIX. $ in millions $84 $95 $79 $78 $80 $74 $3 $5 InfoSec and Cyber Defense Space and Mission Systems Tactical Networking Adv Tech and Other Q2 FY25 Q2 FY26 Note: all legacy Inmarsat businesses are included in Communication Services segment BACKLOG AND SOLE SOURCE UNAWARDED IDIQ $ in millions $2,600 $2,702 $921 $1,209 Backlog Sole Source Unawarded IDIQ Q2 FY25 Q2 FY26 Note: sole source unawarded IDIQ includes government satcom within Communication Services segment Shareholder Letter | Q2 Fiscal Year 2026 4
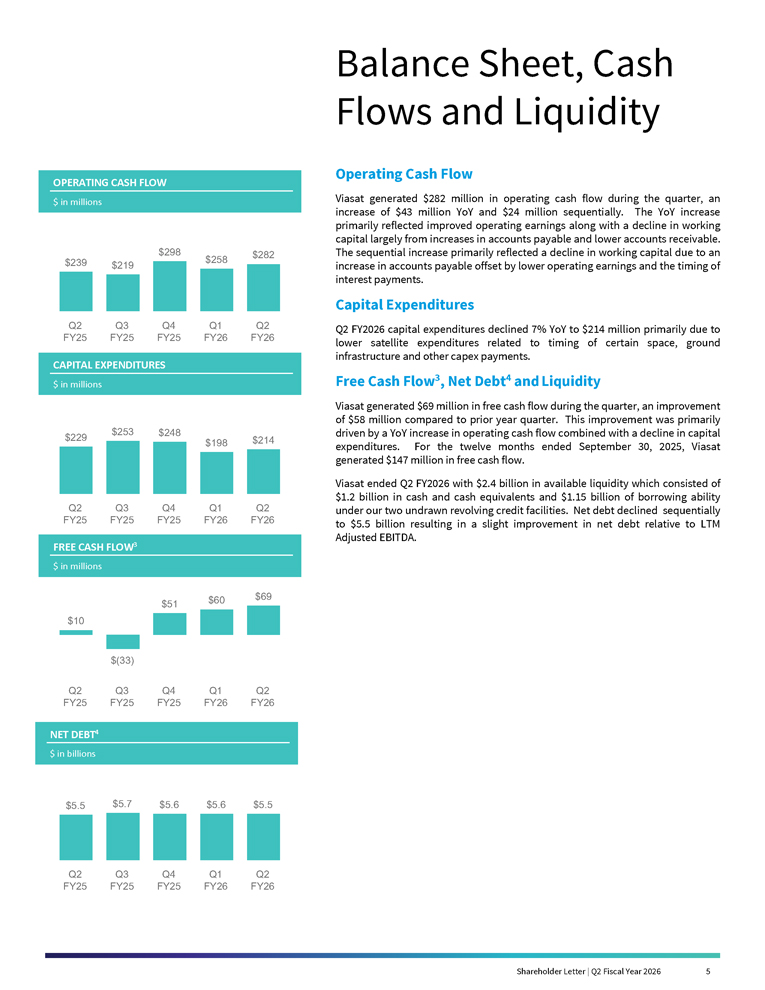
Balance Sheet, Cash Flows and Liquidity Operating Cash Flow Viasat generated $282 million in operating cash flow during the quarter, an increase of $43 million YoY and $24 million sequentially. The YoY increase primarily reflected improved operating earnings along with a decline in working capital largely from increases in accounts payable and lower accounts receivable. The sequential increase primarily reflected a decline in working capital due to an increase in accounts payable offset by lower operating earnings and the timing of interest payments. Capital ExpendituresQ2 FY2026 capital expenditures declined 7% YoY to $214 million primarily due to lower satellite expenditures related to timing of certain space, ground infrastructure and other capex payments. Free Cash Flow3, Net Debt4 and Liquidity Viasat generated $69 million in free cash flow during the quarter, an improvement of $58 million compared to prior year quarter. This improvement was primarily driven by a YoY increase in operating cash flow combined with a decline in capital expenditures. For the twelve months ended September 30, 2025, Viasat generated $147 million in free cash flow. Viasat ended Q2 FY2026 with $2.4 billion in available liquidity which consisted of $1.2 billion in cash and cash equivalents and $1.15 billion of borrowing ability under our two undrawn revolving credit facilities. Net debt declined sequentially to $5.5 billion resulting in a slight improvement in net debt relative to LTM Adjusted EBITDA. OPERATING CASH FLOW $ in millions $239 $219 $298 $258 $282 Q2 FY 25 Q3 FY 25 Q4 FY 25 Q1 FY 26 Q2 FY 26 CAPITAL EXPENDITURES $ in millions $229 $253 $248 $198 $214 FREE CASH FLOW3 $ in millions $10 $51 $60 $69 $(33) NET DEBT4 $ in billions $5.5 $5.7 $5.6 $5.6 $5.5 Shareholder Letter | Q2 Fiscal Year 2026 5

Outlook Our second quarter FY2026 financial performance reflects continued execution and progress towards positioning Viasat for accelerated growth, strong cash generation and lower capital intensity. With the impending launch of VS-3 F2 soon followed by the expected launch of VS-3 F3, we expect to benefit from a substantial increase in our global capacity as the satellites enter service and are incorporated into our multi-orbit strategy, which is anticipated to fuel a long runway of high-growth opportunities in attractive markets we choose to serve. •For FY2026, we continue to expect low single digit YoY revenue growth and flattish YoY Adjusted EBITDA. O We continue to expect Communication Services segment FY2026 revenue performance to be flat compared to FY2025, driven by low double-digit growth in aviation services, offset by a lower rate of declines in FS&O. o We continue to expect Defense and Advanced Technologies segment FY2026 YoY revenue growth in the mid-teens, driven primarily by strong double-digit growth in both information security and cyber defense and space and mission systems. • We now expect net debt relative to LTM Adjusted EBITDA to decrease modestly by the end of FY2026.. • In FY2026, we continue to expect capital expenditures of approximately $1.2 billion, consistent with our prior guidance (which includes approximately $400 million for Inmarsat related capital expenditures). • We continue to expect another year of double-digit operating cash flow growth with the timing of satellite-related capital expenditures concentrated in the second half of the fiscal year. Once beyond those payments, we expect to return to free cash flow generation and expect positive free cash flow for FY2027. Our guidance does not include the impact of the Ligado lump sum payments, including the $420 million payment received this October after fiscal quarter end. We remain committed to building a solid foundation for accelerated and sustained growth, capital efficiency, and cash generation. Our future growth outlook is underpinned by large installed bases and strong secular drivers across our unique and diversified portfolio. We operate across one of the largest blocks of MSS spectrum in the world and have been a responsible user of that L-band spectrum since Inmarsat’s inception over 45 years ago. And, we remain dedicated to providing and evolving the vital services our commercial and government customers require around the world. We believe this drives meaningful upside value to our spectrum rights and have a comprehensive plan to reinforce our competitive positions and drive returns and enhanced shareholder value. Shareholder Letter | Q2 Fiscal Year 2026 6
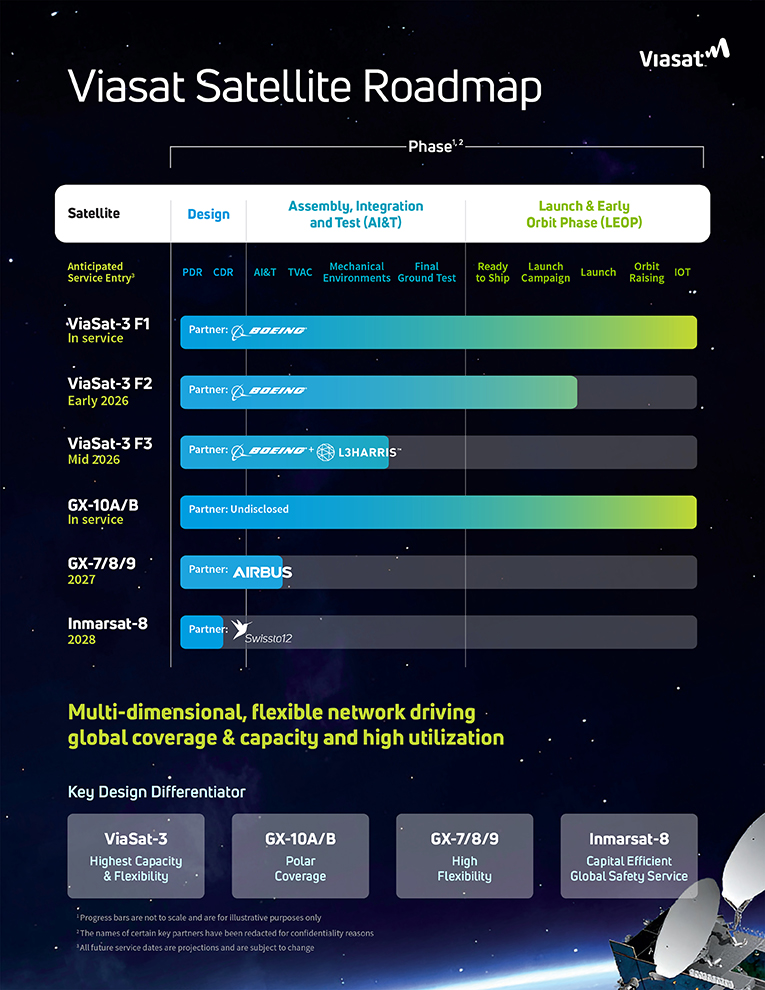
Viasat Satellite Roadmap Phase1, 2 Satellite Design Assembly, Integration and Test (AI&T) Launch & Early Orbit Phase (LEOP) PDR CDR AI&T TVAC Mechanical Environments Final Ground Test Ready to Ship Launch Campaign Launch Orbit Raising IOT ViaSat-3 F1 In service ViaSat-3 F2 Early 2026 ViaSat-3 F3 Mid 2026 GX-10A/B In service GX-7/8/9 2027 Inmarsat-8 2028 Partner: Undisclosed Multi-dimensional, flexible network driving global coverage & capacity and high utilization Key Design Differentiator ViaSat-3 Highest Capacity & Flexibility GX-10A/B Polar Coverage GX-7/8/9 High Flexibility Inmarsat-8 Capital Efficient Global Safety Service 1 Progress bars are not to scale and are for illustrative purposes only 2 The names of certain key partners have been redacted for confidentiality reasons 3 All future service dates are projections and are subject to change
Endnotes 1. Net income (loss) as used herein is defined as net income (loss) attributable to Viasat, Inc. common stockholders. 2. Adjusted EBITDA is defined as earnings before interest, income taxes, depreciation and amortization, as further adjusted to exclude certain non-cash items and non-recurring expenses such as stock-based compensation expense, acquisition and transaction related expenses, gain/(loss) on disposition of certain assets and/or related businesses, product lines or other similar investments, loss or gain on debt extinguishment, and nonrecurring impairment of satellites and networking assets. A reconciliation of Adjusted EBITDA to its closest GAAP equivalent is provided at the end of this letter under “Non- GAAP Financial Reconciliation.” See “Use of Non-GAAP Financial Information” for additional information. 3. Free cash flow is defined as net cash provided by (used in) operating activities less capital expenditures (purchase of property, equipment and satellites, and other assets). A reconciliation of free cash flow to its closest GAAP equivalent is provided at the end of this letter under “Non-GAAP Financial Reconciliation.” See “Use of Non-GAAP Financial Information” for additional financial information. 4. Net debt is defined as total debt less cash and cash equivalents and short-term investments. A reconciliation of net debt to its closest GAAP equivalent is provided at the end of this letter under “Non-GAAP Financial Reconciliation.”
Forward-Looking Statements This shareholder letter contains forward-looking statements regarding future events and our future results that are subject to the safe harbors created under the Securities Act of 1933 and the Securities Exchange Act of 1934. Forward-looking statements include, among others, statements regarding projections of earnings, revenue, Adjusted EBITDA, net leverage, free cash flow, capital expenditures, investments, costs, expected cost savings and synergies, return on capital or other financial items, including financial guidance and outlook and expectations for performance and results of operations in FY2026 and beyond; proposed initiatives to strengthen capital structure, create shareholder value, repay debt, collapse debt silos and reduce capital and operating costs; anticipated trends in our business or key markets; growth opportunities and the acceleration and durability of growth in our businesses; ability to successfully compete in our target markets, and durability or strengthening of competitive advantages; the construction, completion, testing, launch, commencement of service, expected performance and benefits of satellites and satellite payloads (including satellites planned or under construction) and the timing thereof; the expected capacity, coverage, service speeds and other features of our satellites, and the cost, economics and other benefits associated therewith; anticipated subscriber growth; introduction and integration of multi-orbit capabilities; the ability to capitalize on backlog and awards received and unawarded IDIQ contract vehicles; future economic conditions; the development, demand, customer acceptance and anticipated performance of technologies, products or services; our ability to meet the performance and coverage levels required by our customers; our plans, objectives and strategies for future operations; expected revenue streams from the Ligado settlement; statements regarding existing and prospective orders from current and new IFC customers; and other characterizations of future events or circumstances, are forward-looking statements. Readers are cautioned that these forward-looking statements are only predictions and are subject to risks, uncertainties and assumptions that are difficult to predict. Factors that could cause actual results to differ materially include: our ability to realize the anticipated benefits of any existing or future satellite; unexpected expenses related to our satellite projects; risks associated with the construction, launch and operation of satellites, including the effect of any anomaly, launch, operational or deployment failure or degradation in satellite performance; capacity constraints in our business in the lead-up to the commencement of service on new satellites; increasing levels of competition in our target markets; our ability to successfully implement our business plan on our anticipated timeline or at all; our ability to successfully develop, introduce and sell new technologies, products and services; audits by the U.S. Government; changes in the global business environment and economic conditions (including a continued shutdown of the U.S. Government); delays in approving U.S. Government budgets and cuts in government defense expenditures; our reliance on U.S. Government contracts, and on a small number of contracts which account for a significant percentage of our revenues; reduced demand for products and services as a result of continued constraints on capital spending by customers; changes in relationships with, or the financial condition of, key customers or suppliers; our reliance on a limited number of third parties to manufacture and supply our products; introduction of new technologies and other factors affecting the communications and defense industries generally; the effect of adverse regulatory changes (including changes affecting spectrum availability or permitted uses) on our ability to sell or deploy our products and services; changes in the way others use spectrum; our inability to access additional spectrum, use spectrum for additional purposes, and/or operate satellites at additional orbital locations; competing uses of the same spectrum or orbital locations that we utilize or seek to utilize; the effect of changes to global tax laws; our level of indebtedness and ability to comply with applicable debt covenants; our involvement in litigation, including intellectual property claims and litigation to protect our proprietary technology; compliance by Ligado with the terms of the Ligado settlement; and our dependence on a limited number of key employees. In addition, please refer to the risk factors contained in our SEC filings available at www.sec.gov, including our most recent Annual Report on Form 10-K and Quarterly Reports on Form 10-Q. Readers are cautioned not to place undue reliance on any forward-looking statements,
Use of Non-GAAP Financial Information To supplement Viasat’s consolidated financial statements presented in accordance with generally accepted accounting principles (GAAP), Viasat uses non-GAAP net income (loss) attributable to Viasat, Inc., Adjusted EBITDA, net debt and free cash flow, measures Viasat believes are appropriate to enhance an overall understanding of Viasat’s past financial performance and prospects for the future. We believe non-GAAP net income (loss) attributable to Viasat, Inc. and Adjusted EBITDA provide useful information to both management and investors by excluding specific expenses that we believe are not indicative of our core operating results. We believe net debt provides useful information to both management and investors in order to monitor our leverage (including our ability to service our debt and make capital expenditures) and evaluate our consolidated balance sheet. A limitation associated with using net debt is that it subtracts cash and therefore may imply there is less debt than the most comparable GAAP measure. We believe free cash flow is an important liquidity metric because it measures, during a given period, the amount of cash generated that is available to repay debt obligations, make investments, fund acquisitions and for certain other activities. Free cash flow can vary significantly from period to period depending upon, among other things, operating asset and liability balances, service and product revenues, operating efficiencies, increases or decreases in purchases of property and equipment, subscriber additions (losses), subscriber churn, and other factors. In addition, since we have historically reported non-GAAP results to the investment community, we believe the inclusion of non-GAAP numbers provides consistency in our financial reporting and facilitates comparisons to Viasat’s historical operating results. Further, these non-GAAP results are among the primary indicators that management uses as a basis for evaluating the operating performance of our segments, allocating resources to such segments, planning and forecasting in future periods. The presentation of this additional information is not meant to be considered in isolation or as a substitute for measures of financial performance prepared in accordance with GAAP. A reconciliation of specific adjustments to GAAP results is provided in the tables below under “Non-GAAP Financial Reconciliation.” Copyright © 2025 Viasat, Inc. All rights reserved. Viasat, the Viasat logo and the Viasat signal are registered trademarks of Viasat, Inc. All other product or company names mentioned are used for identification purposes only and may be trademarks of their respective owners.
Second Quarter Fiscal Year 2026 Results
Financial Results
| (In millions, except per share data) |
Q2FY26 | Q2FY25 | Year-over-Year Change |
First 6 Months FY26 |
First 6 Months FY25 |
Year-Over-Year Change |
||||||||||||||||||
| Revenues |
$1,140.9 | $1,122.3 | 2% | $2,311.9 | $2,248.7 | 3% | ||||||||||||||||||
| Net income (loss) (1) |
($61.4) | ($137.6) | (55)% | ($117.9) | ($170.5) | (31)% | ||||||||||||||||||
| Non-GAAP net income (loss) (1) |
$12.6 | ($29.4) | * | $35.7 | $9.5 | 275% | ||||||||||||||||||
| Adjusted EBITDA |
$384.7 | $375.0 | 3% | $793.2 | $778.9 | 2% | ||||||||||||||||||
| Diluted per share net income (loss) (1) |
($0.45) | ($1.07) | (58)% | ($0.88) | ($1.34) | (34)% | ||||||||||||||||||
| Non-GAAP diluted per share net income |
$0.09 | ($0.23) | * | $0.26 | $0.07 | 271% | ||||||||||||||||||
| Fully diluted weighted average shares (2) |
135.1 | 128.4 | 5% | 133.4 | 127.5 | 5% | ||||||||||||||||||
| New contract awards (3) |
$1,497.7 | $1,275.2 | 17% | $2,680.5 | $2,436.8 | 10% | ||||||||||||||||||
| Backlog (4) |
$3,886.4 | $3,746.9 | 4% | $3,886.4 | $3,746.9 | 4% | ||||||||||||||||||
|
Segment Results |
|
|||||||||||||||||||||||
| (In millions) |
Q2FY26 | Q2FY25 | |
Year-over-Year Change |
|
|
First 6 Months FY26 |
|
|
First 6 Months FY25 |
|
|
Year-Over-Year Change |
|
||||||||||
| Communication Services |
||||||||||||||||||||||||
| New contract awards (3) |
$1,031.0 | $765.0 | 35% | $1,785.4 | $1,575.8 | 13% | ||||||||||||||||||
| Revenues |
$836.7 | $826.4 | 1% | $1,664.0 | $1,653.2 | 1% | ||||||||||||||||||
| Operating profit (loss) (5) |
$71.4 | ($0.5) | * | $112.3 | $41.5 | 171% | ||||||||||||||||||
| Adjusted EBITDA |
$336.5 | $318.2 | 6% | $658.0 | $625.8 | 5% | ||||||||||||||||||
| Defense and Advanced Technologies |
||||||||||||||||||||||||
| New contract awards (3) |
$466.8 | $510.3 | (9)% | $895.0 | $861.0 | 4% | ||||||||||||||||||
| Revenues |
$304.2 | $295.9 | 3% | $647.9 | $595.6 | 9% | ||||||||||||||||||
| Operating profit (loss) (5) |
$29.5 | $41.8 | (30)% | $101.0 | $125.8 | (20)% | ||||||||||||||||||
|
Adjusted EBITDA |
$48.2 | $56.8 | (15)% | $135.2 | $153.1 | (12)% | ||||||||||||||||||
| (1) | Attributable to Viasat, Inc. common stockholders. |
| (2) | As the three and six months ended September 30, 2025 and September 30, 2024 financial information resulted in a net loss, the weighted average number of shares used to calculate basic and diluted net loss per share is the same, as diluted shares would be anti-dilutive. However, as the non-GAAP financial information for the three and six months ended September 30, 2025 and six months ended September 30, 2024 resulted in non-GAAP net income, 137.5 million, 136.5 million and 128.9 million, respectively, diluted weighted average number of shares were used instead to calculate non-GAAP diluted net income per share. |
| (3) | Awards exclude future revenue under recurring consumer commitment arrangements. |
| (4) | Amounts include certain backlog adjustments due to contract changes and amendments. Our backlog includes contracts with subscribers for fixed broadband services in our Communication Services segment. Backlog does not include anticipated purchase orders and requests for the installation of in-flight connectivity systems or future recurring in-flight internet service revenues under our commercial in-flight internet agreements in our Communication Services segment. |
| (5) | Before corporate and amortization of acquired intangible assets. |
| * | Percentage not meaningful. |
Note: Some totals may not foot due to rounding.

Shareholder Letter | Q2 Fiscal Year 2026 11
Second Quarter Fiscal Year 2026 Results (cont.)
Condensed Consolidated Statements of Operations
(Unaudited)
(In thousands, except per share data)
| Three months ended | Six months ended | |||||||||||||||
| September 30, 2025 | September 30, 2024 | September 30, 2025 | September 30, 2024 | |||||||||||||
| Revenues: |
||||||||||||||||
| Service revenues |
$ | 821,510 | $ | 798,314 | $ | 1,647,880 | $ | 1,619,035 | ||||||||
| Product revenues |
319,383 | 323,948 | 664,067 | 629,687 | ||||||||||||
|
|
|
|
|
|
|
|
|
|||||||||
| Total revenues |
1,140,893 | 1,122,262 | 2,311,947 | 2,248,722 | ||||||||||||
| Operating expenses: |
||||||||||||||||
| Cost of service revenues |
514,893 | 531,593 | 1,043,127 | 1,048,260 | ||||||||||||
| Cost of product revenues |
241,108 | 243,485 | 474,490 | 437,643 | ||||||||||||
| Selling, general and administrative |
241,785 | 272,448 | 504,617 | 523,570 | ||||||||||||
| Independent research and development |
42,263 | 33,390 | 76,456 | 71,953 | ||||||||||||
| Amortization of acquired intangible assets |
65,069 | 66,024 | 130,810 | 132,239 | ||||||||||||
|
|
|
|
|
|
|
|
|
|||||||||
| Income (loss) from operations |
35,775 | (24,678 | ) | 82,447 | 35,057 | |||||||||||
| Interest (expense) income, net |
(80,962 | ) | (91,444 | ) | (167,029 | ) | (174,428 | ) | ||||||||
| (Loss) gain on extinguishment of debt, net |
— | (3,200 | ) | (288 | ) | (3,200 | ) | |||||||||
| Other income (expense), net |
— | — | (5,164 | ) | — | |||||||||||
|
|
|
|
|
|
|
|
|
|||||||||
| Income (loss) before income taxes |
(45,187 | ) | (119,322 | ) | (90,034 | ) | (142,571 | ) | ||||||||
| (Provision for) benefit from income taxes |
(10,862 | ) | (5,915 | ) | (17,472 | ) | (7,099 | ) | ||||||||
| Equity in income (loss) of unconsolidated affiliates, net |
4,222 | 3,441 | 7,955 | 6,187 | ||||||||||||
|
|
|
|
|
|
|
|
|
|||||||||
| Net income (loss) |
(51,827 | ) | (121,796 | ) | (99,551 | ) | (143,483 | ) | ||||||||
| Less: net income (loss) attributable to noncontrolling interest, net of tax |
9,617 | 15,788 | 18,327 | 27,013 | ||||||||||||
|
|
|
|
|
|
|
|
|
|||||||||
| Net income (loss) attributable to Viasat, Inc. |
$ | (61,444) | $ | (137,584 | ) | $ | (117,878 | ) | $ | (170,496 | ) | |||||
|
|
|
|
|
|
|
|
|
|||||||||
| Diluted net income (loss) per share attributable to Viasat, Inc. common stockholders |
$ | (0.45) | $ | (1.07) | $ | (0.88) | $ | (1.34) | ||||||||
|
|
|
|
|
|
|
|
|
|||||||||
| Diluted common equivalent shares (1) |
135,119 | 128,376 | 133,356 | 127,490 | ||||||||||||
|
AN ITEMIZED RECONCILIATION BETWEEN NET INCOME (LOSS) ATTRIBUTABLE TO VIASAT, INC. ON A GAAP BASIS AND NON-GAAP BASIS IS AS FOLLOWS: |
||||||||||||||||
| (In thousands, except per share data) | Three months ended | Six months ended | ||||||||||||||
| September 30, 2025 | September 30, 2024 | September 30, 2025 | September 30, 2024 | |||||||||||||
| GAAP net income (loss) attributable to Viasat, Inc. |
$ | (61,444 | ) | $ | (137,584 | ) | $ | (117,878 | ) | $ | (170,496 | ) | ||||
| Amortization of acquired intangible assets |
65,069 | 66,024 | 130,810 | 132,239 | ||||||||||||
| Stock-based compensation expense |
20,122 | 22,783 | 34,829 | 41,965 | ||||||||||||
| Acquisition and transaction related expenses (2) |
5,080 | 34,550 | 14,805 | 36,851 | ||||||||||||
| Loss (gain) on extinguishment of debt, net |
— | 3,200 | 288 | 3,200 | ||||||||||||
| Other (income) expense, net |
— | — | 5,164 | — | ||||||||||||
| Income tax effect (3) |
(16,196 | ) | (18,412 | ) | (32,293 | ) | (34,233 | ) | ||||||||
|
|
|
|
|
|
|
|
|
|||||||||
| Non-GAAP net income (loss) attributable to Viasat, Inc. |
$ | 12,631 | $ | (29,439 | ) | $ | 35,725 | $ | 9,526 | |||||||
|
|
|
|
|
|
|
|
|
|||||||||
| Non-GAAP diluted net income (loss) per share attributable to Viasat, Inc. common stockholders |
$ | 0.09 | $ | (0.23 | ) | $ | 0.26 | $ | 0.07 | |||||||
|
|
|
|
|
|
|
|
|
|||||||||
| Diluted common equivalent shares (1) |
137,528 | 128,376 | 136,465 | 128,907 | ||||||||||||
|
AN ITEMIZED RECONCILIATION BETWEEN NET INCOME (LOSS) ATTRIBUTABLE TO VIASAT, INC. AND ADJUSTED EBITDA IS AS FOLLOWS: |
||||||||||||||||
| (In thousands) | Three months ended | Six months ended | ||||||||||||||
| September 30, 2025 | September 30, 2024 | September 30, 2025 | September 30, 2024 | |||||||||||||
| GAAP net income (loss) attributable to Viasat, Inc. |
$ | (61,444 | ) | $ | (137,584 | ) | $ | (117,878 | ) | $ | (170,496 | ) | ||||
| Provision for (benefit from) income taxes |
10,862 | 5,915 | 17,472 | 7,099 | ||||||||||||
| Interest expense (income), net |
80,962 | 91,444 | 167,029 | 174,428 | ||||||||||||
| Depreciation and amortization (4) |
329,128 | 354,666 | 671,472 | 685,870 | ||||||||||||
| Stock-based compensation expense |
20,122 | 22,783 | 34,829 | 41,965 | ||||||||||||
| Acquisition and transaction related expenses (2) |
5,080 | 34,550 | 14,805 | 36,851 | ||||||||||||
| Loss (gain) on extinguishment of debt, net |
— | 3,200 | 288 | 3,200 | ||||||||||||
| Other (income) expense, net |
— | — | 5,164 | — | ||||||||||||
|
|
|
|
|
|
|
|
|
|||||||||
| Adjusted EBITDA |
$ | 384,710 | $ | 374,974 | $ | 793,181 | $ | 778,917 | ||||||||
|
|
|
|
|
|
|
|
|
|||||||||
| (1) | As the three and six months ended September 30, 2025 and September 30, 2024 financial information resulted in a net loss, the weighted average number of shares used to calculate basic and diluted net loss per share is the same, as diluted shares would be anti-dilutive. However, as the non-GAAP financial information for the three and six months ended September 30, 2025 and for six months ended September 30, 2024 resulted in non-GAAP net income, diluted weighted average number of shares were used instead to calculate non-GAAP diluted net income per share. |
| (2) | Costs typically consist of acquisition, integration, and disposition related costs. |
| (3) | The income tax effect is calculated using the tax rate applicable for the non-GAAP adjustments. |
| (4) | Including amortization of capitalized cloud computing implementation costs. |
Shareholder Letter | Q2 Fiscal Year 2026 12
Second Quarter Fiscal Year 2026 Results (cont.)
AN ITEMIZED RECONCILIATION BETWEEN SEGMENT OPERATING PROFIT (LOSS) BEFORE CORPORATE
AND AMORTIZATION OF ACQUIRED INTANGIBLE ASSETS AND ADJUSTED EBITDA IS AS FOLLOWS:
(In thousands)
| Three months ended September 30, 2025 | Three months ended September 30, 2024 | |||||||||||||||||||||||
| Communication Services Segment |
Defense and Advanced Technologies Segment |
Total | Communication Services Segment |
Defense and Advanced Technologies Segment |
Total | |||||||||||||||||||
| Segment operating profit (loss) before corporate and amortization of acquired intangible assets |
$ | 71,385 | $ | 29,459 | $ | 100,844 | $ | (467 | ) | $ | 41,813 | $ | 41,346 | |||||||||||
| Depreciation (5) |
240,219 | 12,451 | 252,670 | 261,070 | 11,731 | 272,801 | ||||||||||||||||||
| Stock-based compensation expense |
12,490 | 7,632 | 20,122 | 13,483 | 9,300 | 22,783 | ||||||||||||||||||
| Other than acquired intangible assets amortization (4) |
4,739 | 6,650 | 11,389 | 10,969 | 4,872 | 15,841 | ||||||||||||||||||
| Acquisition and transaction related expenses (2) |
3,480 | 1,600 | 5,080 | 29,685 | 4,865 | 34,550 | ||||||||||||||||||
| Equity in income (loss) of unconsolidated affiliates, net |
4,222 | — | 4,222 | 3,441 | — | 3,441 | ||||||||||||||||||
| Noncontrolling interest |
(30 | ) | (9,587 | ) | (9,617 | ) | (30 | ) | (15,758 | ) | (15,788 | ) | ||||||||||||
|
|
|
|
|
|
|
|
|
|
|
|
|
|
|
|
|
|
|
|||||||
| Adjusted EBITDA |
$ | 336,505 | $ | 48,205 | $ | 384,710 | $ | 318,151 | $ | 56,823 | $ | 374,974 | ||||||||||||
|
|
|
|
|
|
|
|
|
|
|
|
|
|
|
|
|
|
|
|||||||
| Six months ended September 30, 2025 | Six months ended September 30, 2024 | |||||||||||||||||||||||
| Communication Services Segment |
Defense and Advanced Technologies Segment |
Total | Communication Services Segment |
Defense and Advanced Technologies Segment |
Total | |||||||||||||||||||
| Segment operating profit (loss) before corporate and amortization of acquired intangible assets |
$ | 112,261 | $ | 100,996 | $ | 213,257 | $ | 41,472 | $ | 125,824 | $ | 167,296 | ||||||||||||
| Depreciation (5) |
486,968 | 23,403 | 510,371 | 499,463 | 23,138 | 522,601 | ||||||||||||||||||
| Stock-based compensation expense |
20,802 | 14,027 | 34,829 | 25,578 | 16,387 | 41,965 | ||||||||||||||||||
| Other than acquired intangible assets amortization (4) |
18,748 | 11,543 | 30,291 | 21,709 | 9,321 | 31,030 | ||||||||||||||||||
| Acquisition and transaction related expenses (2) |
11,354 | 3,451 | 14,805 | 31,471 | 5,380 | 36,851 | ||||||||||||||||||
| Equity in income (loss) of unconsolidated affiliates, net |
7,955 | — | 7,955 | 6,187 | — | 6,187 | ||||||||||||||||||
| Noncontrolling interest |
(60 | ) | (18,267 | ) | (18,327 | ) | (60 | ) | (26,953 | ) | (27,013 | ) | ||||||||||||
|
|
|
|
|
|
|
|
|
|
|
|
|
|
|
|
|
|
|
|||||||
| Adjusted EBITDA |
$ | 658,028 | $ | 135,153 | $ | 793,181 | $ | 625,820 | $ | 153,097 | $ | 778,917 | ||||||||||||
|
|
|
|
|
|
|
|
|
|
|
|
|
|
|
|
|
|
|
|||||||
| (5) | Depreciation expenses not specifically recorded in a particular segment have been allocated based on other indirect allocable costs, which management believes is a reasonable method. |
Shareholder Letter | Q2 Fiscal Year 2026 13
Second Quarter Fiscal Year 2026 Results (cont.)
Condensed Consolidated Balance Sheets
(Unaudited)
(In thousands)
| As of | As of | |||||||
| Assets | September 30, 2025 | March 31, 2025 | ||||||
| Current assets: |
||||||||
| Cash and cash equivalents |
$ | 1,230,074 | $ | 1,612,105 | ||||
| Accounts receivable, net |
682,820 | 699,552 | ||||||
| Inventories |
278,658 | 293,943 | ||||||
| Prepaid expenses and other current assets |
243,823 | 282,343 | ||||||
|
|
|
|
|
|
|
|||
| Total current assets |
2,435,375 | 2,887,943 | ||||||
| Property, equipment and satellites, net |
7,285,257 | 7,405,664 | ||||||
| Operating lease right-of-use assets |
424,811 | 416,490 | ||||||
| Acquired intangible assets, net |
2,126,896 | 2,270,777 | ||||||
| Goodwill |
1,626,078 | 1,622,132 | ||||||
| Other assets |
857,571 | 845,778 | ||||||
|
|
|
|
|
|
|
|||
| Total assets |
$ | 14,755,988 | $ | 15,448,784 | ||||
|
|
|
|
|
|
|
|||
| As of | As of | |||||||
| Liabilities and Equity | September 30, 2025 | March 31, 2025 | ||||||
| Current liabilities: |
||||||||
| Accounts payable |
$ | 308,714 | $ | 264,300 | ||||
| Accrued and other liabilities |
814,100 | 908,529 | ||||||
| Current portion of long-term debt |
49,503 | 503,825 | ||||||
|
|
|
|
|
|
|
|||
| Total current liabilities | 1,172,317 | 1,676,654 | ||||||
| Senior notes |
3,658,865 | 3,652,882 | ||||||
| Other long-term debt |
2,875,867 | 2,879,402 | ||||||
| Non-current operating lease liabilities |
426,514 | 414,133 | ||||||
| Other liabilities |
2,049,390 | 2,181,153 | ||||||
|
|
|
|
|
|
|
|||
| Total liabilities | 10,182,953 | 10,804,224 | ||||||
|
|
|
|
|
|
|
|||
| Total Viasat Inc. stockholders’ equity |
4,523,760 | 4,553,831 | ||||||
| Noncontrolling interest in subsidiary |
49,275 | 90,729 | ||||||
|
|
|
|
|
|
|
|||
| Total equity | 4,573,035 | 4,644,560 | ||||||
|
|
|
|
|
|
|
|||
| Total liabilities and equity | $ | 14,755,988 | $ | 15,448,784 | ||||
|
|
|
|
|
|
|
|||
Shareholder Letter | Q2 Fiscal Year 2026 14
Non-GAAP Financial Reconciliation
AN ITEMIZED RECONCILIATION BETWEEN NET INCOME (LOSS) ATTRIBUTABLE TO VIASAT, INC.
AND ADJUSTED EBITDA IS AS FOLLOWS:
(In thousands)
| Three months ended | ||||||||||||||||||||
| September 30, 2025 | June 30, 2025 | March 31, 2025 | December 31, 2024 | September 30, 2024 | ||||||||||||||||
| GAAP net income (loss) attributable to Viasat, Inc. |
$ | (61,444 | ) | $ | (56,434 | ) | $ | (246,053 | ) | $ | (158,413 | ) | $ | (137,584 | ) | |||||
| Provision for (benefit from) income taxes |
10,862 | 6,610 | 3,758 | (11,798 | ) | 5,915 | ||||||||||||||
| Interest expense (income), net |
80,962 | 86,067 | 86,828 | 76,768 | 91,444 | |||||||||||||||
| Depreciation and amortization (4) |
329,128 | 342,344 | 337,182 | 337,755 | 354,666 | |||||||||||||||
| Stock-based compensation expense |
20,122 | 14,707 | 16,917 | 21,503 | 22,783 | |||||||||||||||
| Acquisition and transaction related expenses (2) |
5,080 | 9,725 | 6,761 | 20,855 | 34,550 | |||||||||||||||
| Ground network impairment and related charges |
— | — | 169,400 | — | — | |||||||||||||||
| Loss (gain) on extinguishment of debt, net |
— | 288 | — | 96,614 | 3,200 | |||||||||||||||
| Other (income) expense, net |
— | 5,164 | — | 9,976 | — | |||||||||||||||
|
|
|
|
|
|
|
|
|
|
|
|
|
|
|
|
||||||
| Adjusted EBITDA |
$ | 384,710 | $ | 408,471 | $ | 374,793 | $ | 393,260 | $ | 374,974 | ||||||||||
|
|
|
|
|
|
|
|
|
|
|
|
|
|
|
|
||||||
| NET DEBT | As of | |||||||||||||||||||
| (In thousands) | September 30, 2025 | June 30, 2025 | March 31, 2025 | December 31, 2024 | September 30, 2024 | |||||||||||||||
| Total debt |
$ | 6,731,043 | $ | 6,741,529 | $ | 7,204,275 | $ | 7,218,294 | $ | 9,064,558 | ||||||||||
| Less: cash and cash equivalents |
1,230,074 | 1,177,492 | 1,612,105 | 1,556,489 | 3,529,770 | |||||||||||||||
|
|
|
|
|
|
|
|
|
|
|
|
|
|
|
|
||||||
| Net debt |
$ | 5,500,969 | $ | 5,564,037 | $ | 5,592,170 | $ | 5,661,805 | $ | 5,534,788 | ||||||||||
|
|
|
|
|
|
|
|
|
|
|
|
|
|
|
|
||||||
FREE CASH FLOW
(In thousands)
| The following table reconciles free cash flow to Net cash provided by (used in) operating activities. |
|
|||||||||||||||||||
| Three months ended | ||||||||||||||||||||
| September 30, 2025 | June 30, 2025 | March 31, 2025 | December 31, 2024 | September 30, 2024 | ||||||||||||||||
| Net cash provided by (used in) operating activities |
$ | 282,242 | $ | 258,460 | $ | 298,443 | $ | 219,459 | $ | 239,189 | ||||||||||
| Purchase of property, equipment and satellites, and other assets (capital expenditures) |
(213,699 | ) | (198,013 | ) | (247,723 | ) | (252,632 | ) | (228,808 | ) | ||||||||||
|
|
|
|
|
|
|
|
|
|
|
|||||||||||
| Free cash flow |
$ | 68,543 | $ | 60,447 | $ | 50,720 | $ | (33,173 | ) | $ | 10,381 | |||||||||
|
|
|
|
|
|
|
|
|
|
|
|||||||||||
Shareholder Letter | Q2 Fiscal Year 2026 15
Selected Segment Financial Information
(Unaudited)
(In thousands)
| Three Months Ended | Six Months Ended | |||||||||||||||
| September 30, 2025 | September 30, 2024 | September 30, 2025 | September 30, 2024 | |||||||||||||
| Revenues: |
||||||||||||||||
| Communication services |
||||||||||||||||
| Aviation services |
$ | 300,732 | $ | 261,987 | $ | 593,624 | $ | 519,142 | ||||||||
| Government satcom services |
195,800 | 179,875 | 387,568 | 363,748 | ||||||||||||
| Maritime services |
117,594 | 121,179 | 235,395 | 245,126 | ||||||||||||
| Fixed services and other services |
155,691 | 184,853 | 330,428 | 386,489 | ||||||||||||
|
|
|
|
|
|
|
|
|
|||||||||
| Total services |
769,817 | 747,894 | 1,547,015 | 1,514,505 | ||||||||||||
| Total products |
66,838 | 78,491 | 117,011 | 138,667 | ||||||||||||
|
|
|
|
|
|
|
|
|
|||||||||
| Total communication services revenues |
836,655 | 826,385 | 1,664,026 | 1,653,172 | ||||||||||||
| Defense and advanced technologies |
||||||||||||||||
| Total services |
51,693 | 50,420 | 100,865 | 104,530 | ||||||||||||
| Information security and cyber defense products |
94,928 | 83,548 | 197,076 | 139,055 | ||||||||||||
| Space and mission systems products |
78,231 | 78,782 | 166,204 | 152,088 | ||||||||||||
| Tactical networking products |
74,193 | 80,034 | 142,472 | 151,444 | ||||||||||||
| Advanced technologies and other products |
5,193 | 3,093 | 41,304 | 48,433 | ||||||||||||
|
|
|
|
|
|
|
|
|
|||||||||
| Total products |
252,545 | 245,457 | 547,056 | 491,020 | ||||||||||||
|
|
|
|
|
|
|
|
|
|||||||||
| Total defense and advanced technologies revenues |
304,238 | 295,877 | 647,921 | 595,550 | ||||||||||||
| Elimination of intersegment revenues |
— | — | — | — | ||||||||||||
|
|
|
|
|
|
|
|
|
|||||||||
| Total revenues |
$ | 1,140,893 | $ | 1,122,262 | $ | 2,311,947 | $ | 2,248,722 | ||||||||
|
|
|
|
|
|
|
|
|
|||||||||
Shareholder Letter | Q2 Fiscal Year 2026 16