UNITED STATES
SECURITIES AND EXCHANGE COMMISSION
Washington, D.C. 20549
FORM 8-K
CURRENT REPORT
Pursuant to Section 13 or 15(d) of the Securities Exchange Act of 1934
Date of Report (Date of earliest event reported) July 17, 2025
SIMMONS FIRST NATIONAL CORPORATION
(Exact name of registrant as specified in its charter)
| Arkansas | 0-6253 | 71-0407808 | ||
| (State or other jurisdiction of incorporation) |
(Commission File Number) | (I.R.S. Employer Identification No.) | ||
| 501 Main Street, Pine Bluff, Arkansas | 71601 | |||
| (Address of principal executive offices) | (Zip Code) | |||
(870) 541-1000
(Registrant’s telephone number, including area code)
Not Applicable
(Former name or former address, if changed since last report.)
Check the appropriate box below if the Form 8-K filing is intended to simultaneously satisfy the filing obligation of the registrant under any of the following provisions (see General Instruction A.2. below):
[ ] Written communications pursuant to Rule 425 under the Securities Act (17 CFR 230.425)
[ ] Soliciting material pursuant to Rule 14a-12 under the Exchange Act (17 CFR 240.14a-12)
[ ] Pre-commencement communications pursuant to Rule 14d-2(b) under the Exchange Act (17 CFR 240.14d-2(b))
[ ] Pre-commencement communications pursuant to Rule 13e-4(c) under the Exchange Act (17 CFR 240.13e-4(c))
Securities registered pursuant to Section 12(b) of the Act:
| Title of each class | Trading Symbol(s) | Name of each exchange on which registered | ||
| Common stock, par value $0.01 per share | SFNC | The Nasdaq Global Select Market |
Indicate by check mark whether the registrant is an emerging growth company as defined in Rule 405 of the Securities Act of 1933 (17 CFR §230.405) or Rule 12b-2 of the Securities Exchange Act of 1934 (17 CFR §240.12b-2). Emerging growth company [ ]
If an emerging growth company, indicate by check mark if the registrant has elected not to use the extended transition period for complying with any new or revised financial accounting standards provided pursuant to Section 13(a) of the Exchange Act. [ ]
| Item 2.02 | Results of Operations and Financial Condition. |
On July 17, 2025, the Registrant issued a press release, a copy of which is attached hereto as Exhibit 99.1 and is incorporated herein by reference.
The information provided pursuant to this Item 2.02, including Exhibit 99.1, is being furnished and shall not be deemed “filed” for purposes of Section 18 of the Securities Exchange Act of 1934 (“Exchange Act”) or otherwise subject to the liabilities under that Section and shall not be deemed to be incorporated by reference into any filing of the Registrant under the Securities Act of 1933 (“Securities Act”) or the Exchange Act, except as shall be expressly set forth by specific reference in such filing.
| Item 7.01 | Regulation FD Disclosure. |
On July 17, 2025, the Registrant issued an investor presentation, a copy of which is attached hereto as Exhibit 99.2 and is incorporated herein by reference.
The information provided pursuant to this Item 7.01, including Exhibit 99.2, is being furnished and shall not be deemed “filed” for purposes of Section 18 of the Exchange Act or otherwise subject to the liabilities under that Section and shall not be deemed to be incorporated by reference into any filing of the Registrant under the Securities Act or the Exchange Act, except as shall be expressly set forth by specific reference in such filing.
| Item 9.01 | Financial Statements and Exhibits. |
| Exhibit 99.1 | Press Release dated July 17, 2025 | |||
| Exhibit 99.2 | Investor Presentation issued on July 17, 2025 | |||
| Exhibit 104 | Cover Page Interactive Data File (embedded within the Inline XBRL Document) |
SIGNATURE
Pursuant to the requirements of the Securities Exchange Act of 1934, the registrant has duly caused this report to be signed on its behalf by the undersigned hereunto duly authorized.
| SIMMONS FIRST NATIONAL CORPORATION | ||||||
| /s/ C. Daniel Hobbs | ||||||
| Date: July 17, 2025 | C. Daniel Hobbs, Executive Vice President and Chief Financial Officer |
|||||
Exhibit 99.1

July 17, 2025
Simmons First National Corporation Reports Second Quarter 2025 Results
George Makris, Jr., Simmons’ Chairman and CEO, commented on second quarter 2025 results:
We were pleased with our second quarter results which reflected strong revenue growth, disciplined expense management and positive underlying balance sheet growth that led to further improvement in profitability measures.
Our net interest margin increased for the fifth consecutive quarter and surpassed the 3 percent mark ahead of expectations. Loan yields were up and deposit costs declined for the third consecutive quarter. While overall balance sheet growth was muted, our loan pipeline remains strong and our focus on profitability as well as loan and deposit remixing resulted in C&I growth coupled with a $233.1 million increase in low-cost customer deposits. At the same time, asset quality metrics were stable.
While certain administration policies have become clearer, tariff volatility looms large and is a key to future interest rate moves and economic conditions. Against this backdrop, we continue our focus on organic growth in our very attractive footprint and are encouraged by our positive momentum heading into the last half of 2025.
| FINANCIAL HIGHLIGHTS |
2Q25 | 1Q25 | 2Q24 | 2Q25 Highlights |
||||||||||
| BALANCE SHEET (in millions) |
Comparisons reflect 2Q25 vs 1Q25 unless otherwise noted
• Net income of $54.8 million and diluted EPS of 0.43
• Adjusted net income1 of $56.1 million and adjusted diluted EPS1 of $0.44
• Total revenue of $214.2 million and PPNR1 of $75.6 million
• Adjusted total revenue1 of $214.2 million and adjusted PPNR1 of $77.3 million
• Net interest income up $8.4 million, or 5 percent
• Net interest margin up 11 basis points to 3.06 percent; the 5th consecutive quarterly increase in net interest margin
• Pricing discipline led to 6 basis point increase in loan yields
• Cost of deposits down 8 bps; low-cost customer deposits up $233.1 million
• Noninterest expense of $138.6 million; adjusted noninterest expense1 of $136.8 million, down 5 percent
• NCO ratio of 25 bps in 2Q24; provision expense exceeds net charge-offs |
|||||||||||||
| Total loans |
$ | 17,111 | $ | 17,094 | $ | 17,192 | ||||||||
| Total investment securities |
5,997 | 6,107 | 6,571 | |||||||||||
| Total deposits |
21,825 | 21,685 | 21,841 | |||||||||||
| Total assets |
26,694 | 26,793 | 27,369 | |||||||||||
| Total shareholders’ equity |
3,549 | 3,531 | 3,459 | |||||||||||
|
|
|
|
|
|
|
|||||||||
| PERFORMANCE MEASURES (in millions) |
||||||||||||||
| Total revenue |
$ | 214.2 | $ | 209.6 | $ | 197.2 | ||||||||
| Adjusted total revenue1 |
214.2 | 209.6 | 197.2 | |||||||||||
| Pre-provision net revenue1 (PPNR) |
75.6 | 65.0 | 57.9 | |||||||||||
| Adjusted pre-provision net revenue1 |
77.3 | 66.0 | 59.4 | |||||||||||
| Provision for credit losses on loans |
11.9 | 26.8 | 11.1 | |||||||||||
|
|
|
|
|
|
|
|||||||||
| PER SHARE DATA |
||||||||||||||
| Diluted earnings |
$ | 0.43 | $ | 0.26 | $ | 0.32 | ||||||||
| Adjusted diluted earnings1 |
0.44 | 0.26 | 0.33 | |||||||||||
| Book value |
28.17 | 28.04 | 27.56 | |||||||||||
| Tangible book value1 |
16.97 | 16.81 | 16.20 | |||||||||||
|
|
|
|
|
|
|
|||||||||
| ASSET QUALITY |
||||||||||||||
| Net charge-off ratio (NCO ratio) |
0.25 | % | 0.23 | % | 0.19 | % | ||||||||
| Nonperforming loan ratio |
0.92 | 0.89 | 0.60 | |||||||||||
| Nonperforming assets to total assets |
0.62 | 0.61 | 0.39 | |||||||||||
| Allowance for credit losses to loans (ACL) |
1.48 | 1.48 | 1.34 | |||||||||||
| Nonperforming loan coverage ratio |
161 | 165 | 223 | |||||||||||
|
|
|
|
|
|
|
|||||||||
| CAPITAL RATIOS |
||||||||||||||
| Equity to assets (EA ratio) |
13.30 | % | 13.18 | % | 12.64 | % | ||||||||
| Tangible common equity (TCE) ratio1 |
8.46 | 8.34 | 7.84 | |||||||||||
| Common equity tier 1 (CET1) ratio |
12.36 | 12.21 | 12.00 | |||||||||||
| Total risk-based capital ratio |
14.42 | 14.59 | 14.17 | |||||||||||
|
|
|
|
|
|
|
|||||||||
| OTHER DATA |
||||||||||||||
| Net interest margin (FTE) |
3.06 | % | 2.95 | % | 2.69 | % | ||||||||
| Loan yield (FTE) |
6.26 | 6.20 | 6.39 | |||||||||||
| Cost of deposits |
2.36 | 2.44 | 2.79 | |||||||||||
| Loan to deposit ratio |
78.40 | 78.83 | 78.72 | |||||||||||
| Borrowed funds to total liabilities |
4.46 | 5.59 | 7.38 | |||||||||||
|
|
|
|
|
|
|
|||||||||
Simmons First National Corporation (NASDAQ: SFNC) (Simmons or Company) today reported net income of $54.8 million for the second quarter of 2025, compared to $32.4 million in the first quarter of 2025 and $40.8 million in the second quarter of 2024. Diluted earnings per share were $0.43 for the second quarter of 2025, compared to $0.26 in the first quarter of 2025 and $0.32 for the second quarter of 2024. Adjusted earnings1 for the second quarter of 2025 were $56.1 million, compared to $33.1 million in the first quarter of 2025 and $41.9 million in the second quarter of 2024. Adjusted diluted earnings per share1 for the second quarter of 2025 were $0.44, compared to $0.26 in the first quarter of 2025 and $0.33 in the second quarter of 2024.
The table below summarizes the impact of certain items, consisting primarily of branch right sizing, early retirement program, FDIC special assessments and termination of vendor and software services. They are also described in further detail in the “Reconciliation of Non-GAAP Financial Measures” tables contained in this press release.
Impact of Certain Items on Earnings and Diluted Earnings Per Share (EPS)
| $ in millions, except per share data |
2Q25 | 1Q25 | 2Q24 | |||||||||
| Net income |
$ | 54.8 | $ | 32.4 | $ | 40.8 | ||||||
| Branch right sizing, net |
0.2 | 1.0 | 0.5 | |||||||||
| Early retirement program |
1.6 | — | 0.1 | |||||||||
| FDIC special assessment |
— | — | 0.3 | |||||||||
| Termination of vendor and software services |
— | — | 0.6 | |||||||||
|
|
|
|
|
|
|
|||||||
| Total pre-tax impact |
1.8 | 1.0 | 1.5 | |||||||||
| Tax effect2 |
(0.5 | ) | (0.3 | ) | (0.4 | ) | ||||||
|
|
|
|
|
|
|
|||||||
| Total impact on earnings |
1.3 | 0.7 | 1.1 | |||||||||
|
|
|
|
|
|
|
|||||||
| Adjusted earnings1,3 |
$ | 56.1 | $ | 33.1 | $ | 41.9 | ||||||
|
|
|
|
|
|
|
|||||||
| Diluted EPS |
$ | 0.43 | $ | 0.26 | $ | 0.32 | ||||||
| Branch right sizing, net |
— | — | — | |||||||||
| Early retirement program |
0.01 | — | — | |||||||||
| FDIC special assessment |
— | — | — | |||||||||
| Termination of vendor and software services |
— | — | 0.01 | |||||||||
|
|
|
|
|
|
|
|||||||
| Total pre-tax impact |
0.01 | — | 0.01 | |||||||||
| Tax effect2 |
— | — | — | |||||||||
|
|
|
|
|
|
|
|||||||
| Total impact on earnings |
0.01 | — | 0.01 | |||||||||
|
|
|
|
|
|
|
|||||||
| Adjusted Diluted EPS1 |
$ | 0.44 | $ | 0.26 | $ | 0.33 | ||||||
|
|
|
|
|
|
|
|||||||
Net Interest Income
Net interest income for the second quarter of 2025 totaled $171.8 million, up $8.4 million, or 5 percent, compared to $163.4 million in the first quarter of 2025 and up $17.9 million, or 12 percent, from $153.9 million in the second quarter of 2024. Interest income totaled $315.0 million for the second quarter of 2025, compared to $307.8 million in the first quarter of 2025 and $329.1 million in the second quarter of 2024. The increase in interest income on a linked quarter basis was primarily due to an increase in earning asset yields, principally loan yields, driven by disciplined pricing of new originations as well as positive fixed-rate loan repricing. Interest expense totaled $143.2 million for the second quarter of 2025, compared to $144.4 million in the first quarter of 2025 and $175.2 million in the second quarter of 2024. The decrease in interest expense on a linked quarter basis reflected management’s efforts to proactively manage deposit costs given maturing deposit repricing and remixing opportunities. Included in net interest income is accretion recognized on acquisition related loans, which totaled $1.3 million in the second quarter of 2025, $1.1 million in the first quarter of 2025 and $1.6 million in the second quarter of 2024.
The yield on loans on a fully taxable equivalent (FTE) basis for the second quarter of 2025 was 6.26 percent, up 6 basis points from the 6.20 percent for the first quarter of 2025 and down 13 basis points from 6.39 percent in the second quarter of 2024. Cost of deposits for the second quarter of 2025 was 2.36 percent, down 8 basis points from 2.44 percent in the first quarter of 2025 and down 43 basis points from 2.79 percent in the second quarter of 2024. The net interest margin on an FTE basis for the second quarter of 2025 was 3.06 percent, up 11 basis points from 2.95 percent in the first quarter of 2025, and up 37 basis points from 2.69 percent in the second quarter of 2024. This marked the fifth consecutive quarter of net interest margin expansion. The increase in net interest margin on a linked quarter basis was primarily due to fixed-rate asset repricing coupled with decreased deposit costs from lower rates on time deposits and favorable funding mix shift.
Select Yield/Rates
| 2Q25 | 1Q25 | 4Q24 | 3Q24 | 2Q24 | ||||||||||||||||
| Loan yield (FTE)2 |
6.26 | % | 6.20 | % | 6.32 | % | 6.44 | % | 6.39 | % | ||||||||||
| Investment securities yield (FTE)2 |
3.48 | 3.48 | 3.54 | 3.63 | 3.68 | |||||||||||||||
| Cost of interest bearing deposits |
2.97 | 3.05 | 3.28 | 3.52 | 3.53 | |||||||||||||||
| Cost of deposits |
2.36 | 2.44 | 2.60 | 2.79 | 2.79 | |||||||||||||||
| Cost of borrowed funds |
4.97 | 5.09 | 5.32 | 5.79 | 5.84 | |||||||||||||||
| Net interest spread (FTE)2 |
2.41 | 2.30 | 2.15 | 1.95 | 1.92 | |||||||||||||||
| Net interest margin (FTE)2 |
3.06 | 2.95 | 2.87 | 2.74 | 2.69 | |||||||||||||||
Noninterest Income
Noninterest income for the second quarter of 2025 was $42.4 million, compared to $46.2 million in the first quarter of 2025 and $43.3 million in the second quarter of 2024. The decrease in noninterest income on a linked quarter basis reflected strong performance during the first quarter of 2025, coupled with lower swap fee income due to a large swap transaction and associated fees recorded in the first quarter of 2025, and a Small Business Investment Company (SBIC) valuation adjustment, which are included in other income in the table below.
Noninterest Income
| $ in millions |
2Q25 | 1Q25 | 4Q24 | 3Q24 | 2Q24 | |||||||||||||||
| Service charges on deposit accounts |
$ | 12.6 | $ | 12.6 | $ | 13.0 | $ | 12.7 | $ | 12.3 | ||||||||||
| Wealth management fees |
9.5 | 9.6 | 9.7 | 9.1 | 9.2 | |||||||||||||||
| Debit and credit card fees |
8.6 | 8.4 | 8.3 | 8.1 | 8.2 | |||||||||||||||
| Mortgage lending income |
1.7 | 2.0 | 1.8 | 2.0 | 2.0 | |||||||||||||||
| Other service charges and fees |
1.3 | 1.3 | 1.4 | 1.5 | 1.4 | |||||||||||||||
| Bank owned life insurance |
3.9 | 4.1 | 3.8 | 3.8 | 3.9 | |||||||||||||||
| Gain (loss) on sale of securities |
— | — | — | (28.4 | ) | — | ||||||||||||||
| Other income |
4.8 | 8.0 | 5.6 | 8.3 | 6.4 | |||||||||||||||
|
|
|
|
|
|
|
|
|
|
|
|||||||||||
| Total noninterest income |
$ | 42.4 | $ | 46.2 | $ | 43.6 | $ | 17.1 | $ | 43.3 | ||||||||||
|
|
|
|
|
|
|
|
|
|
|
|||||||||||
| Adjusted noninterest income1 |
$ | 42.4 | $ | 46.2 | $ | 43.6 | $ | 45.5 | $ | 43.3 | ||||||||||
Noninterest Expense
Noninterest expense for the second quarter of 2025 was $138.6 million, compared to $144.6 million in the first quarter of 2025 and $139.4 million in the second quarter of 2024. Included in noninterest expense are certain items consisting of branch right sizing, early retirement program, termination of vendor and software services and an FDIC special assessment. Collectively, these items totaled $1.8 million in the second quarter of 2025, $1.0 million in the first quarter of 2025 and $1.5 million in the second quarter of 2024. Excluding these items (which are described in the “Reconciliation of Non-GAAP Financial Measures” tables below), adjusted noninterest expense1 was $136.8 million for the second quarter of 2025, $143.6 million in the first quarter of 2025 and $137.8 million in the second quarter of 2024. The decrease in adjusted noninterest expense1 on a linked quarter basis reflected lower salaries and benefit expenses primarily due to a seasonal decline in payroll taxes and equity compensation expense, and a decline in other operating expenses resulting from a $4.3 million charge related to a customer deposit fraud event in the first quarter of 2025.
Noninterest Expense
| $ in millions |
2Q25 | 1Q25 | 4Q24 | 3Q24 | 2Q24 | |||||||||||||||
| Salaries and employee benefits |
$ | 73.9 | $ | 74.8 | $ | 71.6 | $ | 69.2 | $ | 70.7 | ||||||||||
| Occupancy expense, net |
11.8 | 12.7 | 11.9 | 12.2 | 11.9 | |||||||||||||||
| Furniture and equipment |
5.5 | 5.5 | 5.7 | 5.6 | 5.6 | |||||||||||||||
| Deposit insurance |
4.9 | 5.4 | 5.6 | 5.6 | 5.4 | |||||||||||||||
| Other real estate and foreclosure expense |
0.2 | 0.2 | 0.3 | 0.1 | 0.1 | |||||||||||||||
| FDIC special assessment |
— | — | — | — | 0.3 | |||||||||||||||
| Other operating expenses |
42.3 | 46.1 | 46.1 | 44.5 | 45.4 | |||||||||||||||
|
|
|
|
|
|
|
|
|
|
|
|||||||||||
| Total noninterest expense |
$ | 138.6 | $ | 144.6 | $ | 141.1 | $ | 137.2 | $ | 139.4 | ||||||||||
|
|
|
|
|
|
|
|
|
|
|
|||||||||||
| Adjusted salaries and employee benefits1 |
$ | 72.3 | $ | 74.8 | $ | 71.4 | $ | 69.2 | $ | 70.6 | ||||||||||
| Adjusted other operating expenses1 |
42.5 | 45.9 | 44.7 | 44.4 | 44.3 | |||||||||||||||
| Adjusted noninterest expense1 |
136.8 | 143.6 | 139.3 | 136.8 | 137.8 | |||||||||||||||
| Efficiency ratio |
62.82 | % | 66.94 | % | 65.66 | % | 75.70 | % | 68.38 | % | ||||||||||
| Adjusted efficiency ratio1 |
60.52 | 64.75 | 62.89 | 63.38 | 65.68 | |||||||||||||||
| Full-time equivalent employees |
2,947 | 2,949 | 2,946 | 2,972 | 2,961 | |||||||||||||||
| Number of financial centers |
223 | 222 | 222 | 234 | 234 |
Loans and Unfunded Loan Commitments
Total loans at the end of the second quarter of 2025 were $17.1 billion, up slightly from first quarter 2025 levels. The increase in total loans on a linked quarter basis was broadly-based, driven primarily by growth in the commercial, agricultural, consumer & other portfolios, offset in part by declines in the real estate – commercial and mortgage warehouse portfolios. Unfunded loan commitments at the end of the second quarter of 2025 were $3.9 billion, up $59 million, or 2 percent, from first quarter 2025 levels. The commercial loan pipeline totaled $1.6 billion at the end of the second quarter of 2025, and ready to close commercial loans totaled $564 million with a weighted average rate of 7.35 percent.
Loans and Unfunded Loan Commitments
| $ in millions |
2Q25 | 1Q25 | 4Q24 | 3Q24 | 2Q24 | |||||||||||||||
| Total loans |
$ | 17,111 | $ | 17,094 | $ | 17,006 | $ | 17,336 | $ | 17,192 | ||||||||||
| Unfunded loan commitments |
3,947 | 3,888 | 3,739 | 3,681 | 3,746 | |||||||||||||||
Deposits and Other Borrowings
Total deposits at the end of the second quarter of 2025 were $21.8 billion, compared to $21.7 billion at the end of the first quarter of 2025 and $21.8 billion at the end of the second quarter of 2024. The increase in total deposits on a linked quarter basis reflected a $233 million increase in low-cost customer deposits (noninterest bearing and interest bearing transaction accounts) and a $324 million increase in brokered deposits, offset in part by a decrease in public fund deposits due to seasonal factors. Other borrowings totaled $1.0 billion at the end of the second quarter of 2025, compared to $1.3 billion at the end of the first quarter of 2025 and $1.8 billion at the end of the second quarter of 2024. The decrease in other borrowings on a linked quarter basis and year-over-year basis was primarily due to a decrease in FHLB advances.
Deposits
| $ in millions |
2Q25 | 1Q25 | 4Q24 | 3Q24 | 2Q24 | |||||||||||||||
| Noninterest bearing deposits |
$ | 4,468 | $ | 4,455 | $ | 4,461 | $ | 4,522 | $ | 4,624 | ||||||||||
| Interest bearing transaction accounts |
10,532 | 10,621 | 10,331 | 10,038 | 10,092 | |||||||||||||||
| Time deposits |
3,588 | 3,695 | 3,796 | 4,014 | 4,185 | |||||||||||||||
| Brokered deposits |
3,237 | 2,914 | 3,298 | 3,361 | 2,940 | |||||||||||||||
|
|
|
|
|
|
|
|
|
|
|
|||||||||||
| Total deposits |
$ | 21,825 | $ | 21,684 | $ | 21,886 | $ | 21,935 | $ | 21,841 | ||||||||||
|
|
|
|
|
|
|
|
|
|
|
|||||||||||
| Noninterest bearing deposits to total deposits |
20 | % | 21 | % | 20 | % | 21 | % | 21 | % | ||||||||||
| Total loans to total deposits |
78 | 79 | 78 | 79 | 79 | |||||||||||||||
Asset Quality
Net charge-offs as a percentage of average loans for the second quarter of 2025 were 25 basis points, compared to 23 basis points in the first quarter of 2025 and 19 basis points in the second quarter of 2024. Net charge-offs in the second quarter of 2025 included $1.1 million of charge-offs associated with the run-off portfolio consisting of small ticket equipment finance and acquired asset-based lending portfolios (run-off portfolio). Net charge-offs from the run-off portfolio accounted for 3 basis points of total net charge-offs in the second quarter of 2025, 4 basis points of total net charge-offs in the first quarter of 2025 and 16 basis points of total net charge-offs in the second quarter of 2024.
Total nonperforming loans at the end of the second quarter of 2025 totaled $157.2 million, compared to $152.4 million at the end of the first quarter of 2025 and $103.4 million at the end of the second quarter of 2024. The increase in nonperforming loans on a year-over-year basis was primarily due to two specific credit relationships that were placed on nonaccrual at the end of first quarter of 2025. The nonperforming loan coverage ratio ended the second quarter of 2025 at 161 percent, compared to 165 percent at the end of the first quarter of 2025 and 223 percent at the end of the second quarter of 2024. Total nonperforming assets as a percentage of total assets were 62 basis points at the end of the second quarter of 2025, compared to 61 basis points at the end of the first quarter of 2025 and 39 basis points at the end of the second quarter of 2024.
Provision for credit losses on loans totaled $11.9 million for the second quarter of 2025, compared to $26.8 million in the first quarter of 2025 and $11.1 million in the second quarter of 2024. The decrease in provision for credit losses on loans on a linked quarter basis was primarily due to $15.6 million of incremental provision related to the aforementioned two specific credit relationships that was recorded in the first quarter of 2025. The allowance for credit losses on loans at the end of the second quarter of 2025 was $253.5 million, compared to $252.2 million at the end of the first quarter of 2025 and $230.4 million at the end of the second quarter of 2024. The allowance for credit losses on loans as a percentage of total loans was 1.48 percent at the end of the second quarter of 2025, unchanged from the first quarter of 2025 and up from 1.34 percent at the end of the second quarter of 2024.
Asset Quality
| $ in millions |
2Q25 | 1Q25 | 4Q24 | 3Q24 | 2Q24 | |||||||||||||||
| Allowance for credit losses on loans to total loans |
1.48 | % | 1.48 | % | 1.38 | % | 1.35 | % | 1.34 | % | ||||||||||
| Allowance for credit losses on loans to nonperforming loans |
161 | 165 | 212 | 229 | 223 | |||||||||||||||
| Nonperforming loans to total loans |
0.92 | 0.89 | 0.65 | 0.59 | 0.60 | |||||||||||||||
| Net charge-off ratio (annualized) |
0.25 | 0.23 | 0.27 | 0.22 | 0.19 | |||||||||||||||
| Net charge-off ratio YTD (annualized) |
0.24 | 0.23 | 0.22 | 0.20 | 0.19 | |||||||||||||||
| Total nonperforming loans |
$ | 157.2 | $ | 152.3 | $ | 110.7 | $ | 101.7 | $ | 103.4 | ||||||||||
| Total other nonperforming assets |
9.5 | 10.0 | 10.5 | 2.6 | 3.4 | |||||||||||||||
|
|
|
|
|
|
|
|
|
|
|
|||||||||||
| Total nonperforming assets |
$ | 166.7 | $ | 162.3 | $ | 121.2 | $ | 104.3 | $ | 106.8 | ||||||||||
|
|
|
|
|
|
|
|
|
|
|
|||||||||||
| Reserve for unfunded commitments |
$ | 25.6 | $ | 25.6 | $ | 25.6 | $ | 25.6 | $ | 25.6 | ||||||||||
Capital
Total stockholders’ equity at the end of the second quarter of 2025 was $3.5 billion, up $17.7 million from the end of the first quarter of 2025 and up $90.3 million from the end of the second quarter of 2024. The increase on a year-over-year basis was primarily due to an increase of $53.9 million in retained earnings, coupled with a $24.6 million recapture of accumulated other comprehensive income principally associated with the mark-to-market adjustment on available for sale investment securities. Book value per share at the end of the second quarter of 2025 was $28.17 compared to $28.04 at the end of the first quarter of 2025 and $27.56 at the end of the second quarter of 2024. Tangible book value per share1 at the end of the second quarter of 2025 was $16.97, compared to $16.81 at the end of the first quarter of 2025 and $16.20 at the end of the second quarter of 2024.
Total stockholders’ equity as a percentage of total assets at the end of the second quarter of 2025 was 13.3 percent, compared to 13.2 percent at the end of the first quarter of 2025 and 12.6 percent at the end of the second quarter of 2024. Tangible common equity as a percentage of tangible assets1 at the end of the second quarter of 2025 was 8.5 percent, compared to 8.3 percent at the end of the first quarter of 2025 and 7.8 percent at the end of the second quarter of 2024. Each of the applicable regulatory capital ratios for Simmons and its principal subsidiary, Simmons Bank, continue to significantly exceed “well-capitalized” regulatory guidelines.
Select Capital Ratios
| 2Q25 | 1Q25 | 4Q24 | 3Q24 | 2Q24 | ||||||||||||||||
| Stockholders’ equity to total assets |
13.3 | % | 13.2 | % | 13.1 | % | 12.9 | % | 12.6 | % | ||||||||||
| Tangible common equity to tangible assets1 |
8.5 | 8.3 | 8.3 | 8.2 | 7.8 | |||||||||||||||
| Common equity tier 1 (CET1) ratio |
12.4 | 12.2 | 12.4 | 12.1 | 12.0 | |||||||||||||||
| Tier 1 leverage ratio |
10.0 | 9.8 | 9.7 | 9.6 | 9.5 | |||||||||||||||
| Tier 1 risk-based capital ratio |
12.4 | 12.2 | 12.4 | 12.1 | 12.0 | |||||||||||||||
| Total risk-based capital ratio |
14.4 | 14.6 | 14.6 | 14.3 | 14.2 | |||||||||||||||
Share Repurchase Program
During the second quarter of 2025, Simmons did not repurchase shares under its stock repurchase program that was authorized in January 2024 (2024 Program), which replaced its former repurchase program that was authorized in January 2022. Remaining authorization under the 2024 Program as of June 30, 2025, was approximately $175 million. The timing, pricing and amount of any repurchases under the 2024 Program will be determined by Simmons’ management at its discretion based on a variety of factors including, but not limited to, market conditions, trading volume and market price of Simmons’ common stock, Simmons’ capital needs, Simmons’ working capital and investment requirements, other corporate considerations, economic conditions, and legal requirements. The 2024 Program does not obligate Simmons to repurchase any common stock and may be modified, discontinued or suspended at any time without prior notice.
| (1) | Non-GAAP measurement. See “Non-GAAP Financial Measures” and “Reconciliation of Non-GAAP Financial Measures” below |
| (2) | FTE – fully taxable equivalent basis using an effective tax rate of 26.135% |
| (3) | In this press release, “Adjusted Earnings” may also be referred to as “Adjusted Net Income” |
Conference Call
Management will conduct a live conference call to review this information beginning at 7:30 a.m. Central Time on Friday, July 18, 2025. Interested persons can listen to this call by dialing toll-free 1-844-481-2779 (North America only) and asking for the Simmons First National Corporation conference call, conference ID 10200827. In addition, the call will be available live or in recorded version on Simmons’ website at simmonsbank.com for at least 60 days following the date of the call.
Simmons First National Corporation
Simmons First National Corporation (NASDAQ: SFNC) is a Mid-South based financial holding company that has paid cash dividends to its shareholders for 116 consecutive years. Its principal subsidiary, Simmons Bank, operates more than 220 branches in Arkansas, Kansas, Missouri, Oklahoma, Tennessee and Texas. Founded in 1903, Simmons Bank offers comprehensive financial solutions delivered with a client-centric approach. In 2024, Simmons Bank was recognized by Newsweek as one of America’s Best Regional Banks 2025, by U.S. News & World Report as one of the 2024-2025 Best Companies to Work For in the South and by Forbes as one of America’s Best-In-State Banks 2024 in Tennessee and America’s Best-In-State Employers 2024 in Missouri. Additional information about Simmons Bank can be found on our website at simmonsbank.com, by following @Simmons_Bank on X (formerly Twitter) or by visiting our newsroom.
Non-GAAP Financial Measures
This press release contains financial information determined by methods other than in accordance with U.S. generally accepted accounting principles (GAAP). The Company’s management uses these non-GAAP financial measures in their analysis of the Company’s performance. These measures adjust GAAP performance measures to, among other things, include the tax benefit associated with revenue items that are tax-exempt, as well as exclude from net income (including on a per share diluted basis), pre-tax, pre-provision earnings, net charge-offs, income available to common shareholders, noninterest income, and noninterest expense certain income and expense items attributable to, for example, merger activity (primarily including merger-related expenses), gains and/or losses on sale of branches, net branch right-sizing initiatives, early retirement program, termination of vendor and software services, FDIC special assessment charges and expenses related to the fraud event reported in the first quarter of 2025.
In addition, the Company also presents certain figures based on tangible common stockholders’ equity, tangible assets and tangible book value, which exclude goodwill and other intangible assets. The Company further presents certain figures that are exclusive of the impact of deposits and/or loans acquired through acquisitions, mortgage warehouse loans, and/or energy loans, or gains and/or losses on the sale of securities, or the aforementioned two specific credit relationships. The Company’s management believes that these non-GAAP financial measures are useful to investors because they, among other things, present the results of the Company’s ongoing operations without the effect of mergers or other items not central to the Company’s ongoing business, as well as normalize for tax effects and certain other effects. Management, therefore, believes presentations of these non-GAAP financial measures provide useful supplemental information that is essential to a proper understanding of the operating results of the Company’s ongoing businesses, and management uses these non-GAAP financial measures to assess the performance of the Company’s ongoing businesses as related to prior financial periods. These non-GAAP disclosures should not be viewed as a substitute for operating results determined in accordance with GAAP, nor are they necessarily comparable to non-GAAP performance measures that may be presented by other companies. Where non-GAAP financial measures are used, the comparable GAAP financial measure, as well as the reconciliation to the comparable GAAP financial measure, can be found in the tables of this release.
Forward-Looking Statements
Certain statements in this press release may not be based on historical facts and should be considered “forward-looking statements” within the meaning of the Private Securities Litigation Reform Act of 1995. These forward-looking statements, including, without limitation, statements made in Mr. Makris’s quote, may be identified by reference to future periods or by the use of forward-looking terminology, such as “believe,” “budget,” “expect,” “foresee,” “anticipate,” “intend,” “indicate,” “target,” “estimate,” “plan,” “project,” “continue,” “contemplate,” “positions,” “prospects,” “predict,” or “potential,” by future conditional verbs such as “will,” “would,” “should,”
“could,” “might” or “may,” or by variations of such words or by similar expressions. These forward-looking statements include, without limitation, statements relating to Simmons’ future growth, business strategies, lending capacity and lending activity, loan demand, revenue, assets, asset quality, profitability, dividends, net interest margin, non-interest revenue, share repurchase program, acquisition strategy, digital banking initiatives, the Company’s ability to recruit and retain key employees, the adequacy of the allowance for credit losses, future economic conditions and interest rates, and the adequacy of reserve levels for loans. Any forward-looking statement speaks only as of the date of this press release, and Simmons undertakes no obligation to update these forward-looking statements to reflect events or circumstances that occur after the date of this press release. By nature, forward-looking statements are based on various assumptions and involve inherent risk and uncertainties. Various factors, including, but not limited to, changes in economic conditions, changes in credit quality, changes in interest rates and related governmental policies, changes in loan demand, changes in deposit flows, changes in real estate values, changes in the assumptions used in making the forward-looking statements, changes in the securities markets generally or the price of Simmons’ common stock specifically, changes in information technology affecting the financial industry, and changes in customer behaviors, including consumer spending, borrowing, and saving habits; changes in tariff policies; general economic and market conditions; changes in governmental administrations; market disruptions including pandemics or significant health hazards, severe weather conditions, natural disasters, terrorist activities, financial crises, political crises, war and other military conflicts (including the ongoing military conflicts between Russia and Ukraine and between Israel and Iran) or other major events, or the prospect of these events; the soundness of other financial institutions and any indirect exposure related to the closings of other financial institutions and their impact on the broader market through other customers, suppliers and partners, or that the conditions which resulted in the liquidity concerns experienced by closed financial institutions may also adversely impact, directly or indirectly, other financial institutions and market participants with which the Company has commercial or deposit relationships; increased inflation; the loss of key employees; increased competition in the markets in which the Company operates and from non-bank financial institutions; increased unemployment; labor shortages; claims, damages, and fines related to litigation or government actions; changes in accounting principles relating to loan loss recognition (current expected credit losses); fraud that results in material losses or that we have not discovered yet that may result in material losses; the Company’s ability to manage and successfully integrate its mergers and acquisitions and to fully realize cost savings and other benefits associated with acquisitions; increased delinquency and foreclosure rates on commercial real estate loans; significant increases in nonaccrual loan balances; cyber or other information technology threats, attacks or events; reliance on third parties for key services; government legislation; and other factors, many of which are beyond the control of the Company, could cause actual results to differ materially from those projected in or contemplated by the forward-looking statements. In addition, there can be no guarantee that the board of directors (Board) of Simmons will approve a quarterly dividend in future quarters, and the timing, payment, and amount of future dividends (if any) is subject to, among other things, the discretion of the Board and may differ significantly from past dividends. Additional information on factors that might affect the Company’s financial results is included in the Company’s Form 10-K for the year ended December 31, 2024, and other reports that the Company has filed with or furnished to the U.S. Securities and Exchange Commission (the SEC), all of which are available from the SEC on its website, www.sec.gov.
FOR MORE INFORMATION CONTACT:
Ed Bilek, EVP, Director of Investor and Media Relations
ed.bilek@simmonsbank.com or 205.612.3378 (cell)
| Simmons First National Corporation | SFNC | |
| Consolidated End of Period Balance Sheets | ||
| For the Quarters Ended | ||
| (Unaudited) |
| Jun 30 | Mar 31 | Dec 31 | Sep 30 | Jun 30 | ||||||||||||||||
| 2025 | 2025 | 2024 | 2024 | 2024 | ||||||||||||||||
| ($ in thousands) | ||||||||||||||||||||
| ASSETS |
||||||||||||||||||||
| Cash and noninterest bearing balances due from banks |
$ | 398,081 | $ | 423,171 | $ | 429,705 | $ | 398,321 | $ | 320,021 | ||||||||||
| Interest bearing balances due from banks and federal funds sold |
246,381 | 211,115 | 257,672 | 205,081 | 254,312 | |||||||||||||||
|
|
|
|
|
|
|
|
|
|
|
|||||||||||
| Cash and cash equivalents |
644,462 | 634,286 | 687,377 | 603,402 | 574,333 | |||||||||||||||
| Interest bearing balances due from banks - time |
100 | 100 | 100 | 100 | 100 | |||||||||||||||
| Investment securities - held-to-maturity |
3,591,531 | 3,615,556 | 3,636,636 | 3,658,700 | 3,685,450 | |||||||||||||||
| Investment securities - available-for-sale |
2,405,320 | 2,491,849 | 2,529,426 | 2,691,094 | 2,885,904 | |||||||||||||||
| Mortgage loans held for sale |
16,972 | 8,351 | 11,417 | 8,270 | 13,053 | |||||||||||||||
| Loans: |
||||||||||||||||||||
| Loans |
17,111,096 | 17,094,078 | 17,005,937 | 17,336,040 | 17,192,437 | |||||||||||||||
| Allowance for credit losses on loans |
(253,537 | ) | (252,168 | ) | (235,019 | ) | (233,223 | ) | (230,389 | ) | ||||||||||
|
|
|
|
|
|
|
|
|
|
|
|||||||||||
| Net loans |
16,857,559 | 16,841,910 | 16,770,918 | 17,102,817 | 16,962,048 | |||||||||||||||
| Premises and equipment |
573,160 | 573,616 | 585,431 | 584,366 | 581,893 | |||||||||||||||
| Foreclosed assets and other real estate owned |
8,794 | 8,976 | 9,270 | 1,299 | 2,209 | |||||||||||||||
| Interest receivable |
120,443 | 117,398 | 123,243 | 125,700 | 126,625 | |||||||||||||||
| Bank owned life insurance |
535,481 | 535,324 | 531,805 | 508,781 | 505,023 | |||||||||||||||
| Goodwill |
1,320,799 | 1,320,799 | 1,320,799 | 1,320,799 | 1,320,799 | |||||||||||||||
| Other intangible assets |
90,617 | 93,714 | 97,242 | 101,093 | 104,943 | |||||||||||||||
| Other assets |
528,382 | 551,112 | 572,385 | 562,983 | 606,692 | |||||||||||||||
|
|
|
|
|
|
|
|
|
|
|
|||||||||||
| Total assets |
$ | 26,693,620 | $ | 26,792,991 | $ | 26,876,049 | $ | 27,269,404 | $ | 27,369,072 | ||||||||||
|
|
|
|
|
|
|
|
|
|
|
|||||||||||
| LIABILITIES AND STOCKHOLDERS’ EQUITY |
||||||||||||||||||||
| Deposits: |
||||||||||||||||||||
| Noninterest bearing transaction accounts |
$ | 4,468,237 | $ | 4,455,255 | $ | 4,460,517 | $ | 4,521,715 | $ | 4,624,186 | ||||||||||
| Interest bearing transaction accounts and savings deposits |
11,176,791 | 11,265,554 | 10,982,022 | 10,863,945 | 10,925,179 | |||||||||||||||
| Time deposits |
6,179,962 | 5,963,811 | 6,443,211 | 6,549,774 | 6,291,518 | |||||||||||||||
|
|
|
|
|
|
|
|
|
|
|
|||||||||||
| Total deposits |
21,824,990 | 21,684,620 | 21,885,750 | 21,935,434 | 21,840,883 | |||||||||||||||
| Federal funds purchased and securities sold under agreements to repurchase |
31,306 | 50,133 | 37,109 | 51,071 | 52,705 | |||||||||||||||
| Other borrowings |
634,349 | 884,863 | 745,372 | 1,045,878 | 1,346,378 | |||||||||||||||
| Subordinated notes and debentures |
366,369 | 366,331 | 366,293 | 366,255 | 366,217 | |||||||||||||||
| Accrued interest and other liabilities |
287,396 | 275,559 | 312,653 | 341,933 | 304,020 | |||||||||||||||
|
|
|
|
|
|
|
|
|
|
|
|||||||||||
| Total liabilities |
23,144,410 | 23,261,506 | 23,347,177 | 23,740,571 | 23,910,203 | |||||||||||||||
|
|
|
|
|
|
|
|
|
|
|
|||||||||||
| Stockholders’ equity: |
||||||||||||||||||||
| Common stock |
1,260 | 1,259 | 1,257 | 1,256 | 1,255 | |||||||||||||||
| Surplus |
2,518,286 | 2,515,372 | 2,511,590 | 2,508,438 | 2,506,469 | |||||||||||||||
| Undivided profits |
1,410,564 | 1,382,564 | 1,376,935 | 1,355,000 | 1,356,626 | |||||||||||||||
| Accumulated other comprehensive (loss) income |
(380,900 | ) | (367,710 | ) | (360,910 | ) | (335,861 | ) | (405,481 | ) | ||||||||||
|
|
|
|
|
|
|
|
|
|
|
|||||||||||
| Total stockholders’ equity |
3,549,210 | 3,531,485 | 3,528,872 | 3,528,833 | 3,458,869 | |||||||||||||||
|
|
|
|
|
|
|
|
|
|
|
|||||||||||
| Total liabilities and stockholders’ equity |
$ | 26,693,620 | $ | 26,792,991 | $ | 26,876,049 | $ | 27,269,404 | $ | 27,369,072 | ||||||||||
|
|
|
|
|
|
|
|
|
|
|
|||||||||||
Page 1
| Simmons First National Corporation | SFNC | |
| Consolidated Statements of Income - Quarter-to-Date |
||
| For the Quarters Ended |
||
| (Unaudited) |
| Jun 30 | Mar 31 | Dec 31 | Sep 30 | Jun 30 | ||||||||||||||||
| 2025 | 2025 | 2024 | 2024 | 2024 | ||||||||||||||||
| ($ in thousands, except per share data) | ||||||||||||||||||||
| INTEREST INCOME |
||||||||||||||||||||
| Loans (including fees) |
$ | 265,373 | $ | 257,755 | $ | 272,727 | $ | 277,939 | $ | 270,937 | ||||||||||
| Interest bearing balances due from banks and federal funds sold |
2,531 | 2,703 | 2,913 | 2,921 | 2,964 | |||||||||||||||
| Investment securities |
46,898 | 47,257 | 50,162 | 53,220 | 55,050 | |||||||||||||||
| Mortgage loans held for sale |
221 | 122 | 180 | 209 | 194 | |||||||||||||||
|
|
|
|
|
|
|
|
|
|
|
|||||||||||
| TOTAL INTEREST INCOME |
315,023 | 307,837 | 325,982 | 334,289 | 329,145 | |||||||||||||||
|
|
|
|
|
|
|
|
|
|
|
|||||||||||
| INTEREST EXPENSE |
||||||||||||||||||||
| Time deposits |
57,231 | 62,559 | 70,661 | 73,937 | 73,946 | |||||||||||||||
| Other deposits |
69,108 | 67,895 | 72,369 | 78,307 | 79,087 | |||||||||||||||
| Federal funds purchased and securities sold under agreements to repurchase |
59 | 113 | 119 | 138 | 156 | |||||||||||||||
| Other borrowings |
10,613 | 7,714 | 11,386 | 17,067 | 15,025 | |||||||||||||||
| Subordinated notes and debentures |
6,188 | 6,134 | 6,505 | 7,128 | 7,026 | |||||||||||||||
|
|
|
|
|
|
|
|
|
|
|
|||||||||||
| TOTAL INTEREST EXPENSE |
143,199 | 144,415 | 161,040 | 176,577 | 175,240 | |||||||||||||||
|
|
|
|
|
|
|
|
|
|
|
|||||||||||
| NET INTEREST INCOME |
171,824 | 163,422 | 164,942 | 157,712 | 153,905 | |||||||||||||||
|
|
|
|
|
|
|
|
|
|
|
|||||||||||
| PROVISION FOR CREDIT LOSSES |
||||||||||||||||||||
| Provision for credit losses on loans |
11,945 | 26,797 | 13,332 | 12,148 | 11,099 | |||||||||||||||
|
|
|
|
|
|
|
|
|
|
|
|||||||||||
| TOTAL PROVISION FOR CREDIT LOSSES |
11,945 | 26,797 | 13,332 | 12,148 | 11,099 | |||||||||||||||
|
|
|
|
|
|
|
|
|
|
|
|||||||||||
| NET INTEREST INCOME AFTER PROVISION FOR CREDIT LOSSES |
159,879 | 136,625 | 151,610 | 145,564 | 142,806 | |||||||||||||||
|
|
|
|
|
|
|
|
|
|
|
|||||||||||
| NONINTEREST INCOME |
||||||||||||||||||||
| Service charges on deposit accounts |
12,588 | 12,635 | 12,978 | 12,713 | 12,252 | |||||||||||||||
| Debit and credit card fees |
8,567 | 8,446 | 8,323 | 8,144 | 8,162 | |||||||||||||||
| Wealth management fees |
9,464 | 9,629 | 9,658 | 9,098 | 9,187 | |||||||||||||||
| Mortgage lending income |
1,687 | 2,013 | 1,828 | 1,956 | 1,973 | |||||||||||||||
| Bank owned life insurance income |
3,890 | 4,092 | 3,780 | 3,757 | 3,876 | |||||||||||||||
| Other service charges and fees (includes insurance income) |
1,321 | 1,333 | 1,426 | 1,509 | 1,439 | |||||||||||||||
| Gain (loss) on sale of securities |
— | — | — | (28,393 | ) | — | ||||||||||||||
| Other income |
4,837 | 8,007 | 5,565 | 8,346 | 6,410 | |||||||||||||||
|
|
|
|
|
|
|
|
|
|
|
|||||||||||
| TOTAL NONINTEREST INCOME |
42,354 | 46,155 | 43,558 | 17,130 | 43,299 | |||||||||||||||
|
|
|
|
|
|
|
|
|
|
|
|||||||||||
| NONINTEREST EXPENSE |
||||||||||||||||||||
| Salaries and employee benefits |
73,862 | 74,824 | 71,588 | 69,167 | 70,716 | |||||||||||||||
| Occupancy expense, net |
11,844 | 12,651 | 11,876 | 12,216 | 11,864 | |||||||||||||||
| Furniture and equipment expense |
5,474 | 5,465 | 5,671 | 5,612 | 5,623 | |||||||||||||||
| Other real estate and foreclosure expense |
216 | 198 | 317 | 87 | 117 | |||||||||||||||
| Deposit insurance |
4,917 | 5,391 | 5,550 | 5,571 | 5,682 | |||||||||||||||
| Other operating expenses |
42,276 | 46,051 | 46,115 | 44,540 | 45,352 | |||||||||||||||
|
|
|
|
|
|
|
|
|
|
|
|||||||||||
| TOTAL NONINTEREST EXPENSE |
138,589 | 144,580 | 141,117 | 137,193 | 139,354 | |||||||||||||||
|
|
|
|
|
|
|
|
|
|
|
|||||||||||
| NET INCOME BEFORE INCOME TAXES |
63,644 | 38,200 | 54,051 | 25,501 | 46,751 | |||||||||||||||
| Provision for income taxes |
8,871 | 5,812 | 5,732 | 761 | 5,988 | |||||||||||||||
|
|
|
|
|
|
|
|
|
|
|
|||||||||||
| NET INCOME |
$ | 54,773 | $ | 32,388 | $ | 48,319 | $ | 24,740 | $ | 40,763 | ||||||||||
|
|
|
|
|
|
|
|
|
|
|
|||||||||||
| BASIC EARNINGS PER SHARE |
$ | 0.43 | $ | 0.26 | $ | 0.38 | $ | 0.20 | $ | 0.32 | ||||||||||
|
|
|
|
|
|
|
|
|
|
|
|||||||||||
| DILUTED EARNINGS PER SHARE |
$ | 0.43 | $ | 0.26 | $ | 0.38 | $ | 0.20 | $ | 0.32 | ||||||||||
|
|
|
|
|
|
|
|
|
|
|
|||||||||||
Page 2
| Simmons First National Corporation | SFNC | |
| Consolidated Risk-Based Capital |
||
| For the Quarters Ended | ||
| (Unaudited) |
| Jun 30 | Mar 31 | Dec 31 | Sep 30 | Jun 30 | ||||||||||||||||
| 2025 | 2025 | 2024 | 2024 | 2024 | ||||||||||||||||
| ($ in thousands) | ||||||||||||||||||||
| Tier 1 capital |
||||||||||||||||||||
| Stockholders’ equity |
$ | 3,549,210 | $ | 3,531,485 | $ | 3,528,872 | $ | 3,528,833 | $ | 3,458,869 | ||||||||||
| CECL transition provision (1) |
— | — | 30,873 | 30,873 | 30,873 | |||||||||||||||
| Disallowed intangible assets, net of deferred tax |
(1,379,104 | ) | (1,381,953 | ) | (1,385,128 | ) | (1,388,549 | ) | (1,391,969 | ) | ||||||||||
| Unrealized loss (gain) on AFS securities |
380,900 | 367,710 | 360,910 | 335,861 | 405,481 | |||||||||||||||
|
|
|
|
|
|
|
|
|
|
|
|||||||||||
| Total Tier 1 capital |
2,551,006 | 2,517,242 | 2,535,527 | 2,507,018 | 2,503,254 | |||||||||||||||
|
|
|
|
|
|
|
|
|
|
|
|||||||||||
| Tier 2 capital |
||||||||||||||||||||
| Subordinated notes and debentures |
366,369 | 366,331 | 366,293 | 366,255 | 366,217 | |||||||||||||||
| Subordinated debt phase out |
(198,000 | ) | (132,000 | ) | (132,000 | ) | (132,000 | ) | (132,000 | ) | ||||||||||
| Qualifying allowance for loan losses and reserve for unfunded commitments |
258,079 | 257,769 | 222,313 | 220,517 | 217,684 | |||||||||||||||
|
|
|
|
|
|
|
|
|
|
|
|||||||||||
| Total Tier 2 capital |
426,448 | 492,100 | 456,606 | 454,772 | 451,901 | |||||||||||||||
|
|
|
|
|
|
|
|
|
|
|
|||||||||||
| Total risk-based capital |
$ | 2,977,454 | $ | 3,009,342 | $ | 2,992,133 | $ | 2,961,790 | $ | 2,955,155 | ||||||||||
|
|
|
|
|
|
|
|
|
|
|
|||||||||||
| Risk weighted assets |
$ | 20,646,324 | $ | 20,621,540 | $ | 20,473,960 | $ | 20,790,941 | $ | 20,856,194 | ||||||||||
|
|
|
|
|
|
|
|
|
|
|
|||||||||||
| Adjusted average assets for leverage ratio |
$ | 25,606,135 | $ | 25,619,424 | $ | 26,037,459 | $ | 26,198,178 | $ | 26,371,545 | ||||||||||
|
|
|
|
|
|
|
|
|
|
|
|||||||||||
| Ratios at end of quarter |
||||||||||||||||||||
| Equity to assets |
13.30 | % | 13.18 | % | 13.13 | % | 12.94 | % | 12.64 | % | ||||||||||
| Tangible common equity to tangible assets (2) |
8.46 | % | 8.34 | % | 8.29 | % | 8.15 | % | 7.84 | % | ||||||||||
| Common equity Tier 1 ratio (CET1) |
12.36 | % | 12.21 | % | 12.38 | % | 12.06 | % | 12.00 | % | ||||||||||
| Tier 1 leverage ratio |
9.96 | % | 9.83 | % | 9.74 | % | 9.57 | % | 9.49 | % | ||||||||||
| Tier 1 risk-based capital ratio |
12.36 | % | 12.21 | % | 12.38 | % | 12.06 | % | 12.00 | % | ||||||||||
| Total risk-based capital ratio |
14.42 | % | 14.59 | % | 14.61 | % | 14.25 | % | 14.17 | % | ||||||||||
| (1) | The Company has elected to use the CECL transition provision allowed for in the year of adopting ASC 326. |
| (2) | Calculations of tangible common equity to tangible assets and the reconciliations to GAAP are included in the schedules accompanying this release. |
Page 3
| Simmons First National Corporation | SFNC | |
| Consolidated Investment Securities | ||
| For the Quarters Ended | ||
| (Unaudited) |
| Jun 30 2025 |
Mar 31 2025 |
Dec 31 2024 |
Sep 30 2024 |
Jun 30 2024 |
||||||||||||||||
| ($ in thousands) | ||||||||||||||||||||
| Investment Securities - End of Period |
||||||||||||||||||||
|
Held-to-Maturity |
||||||||||||||||||||
| U.S. Government agencies |
$ | 457,228 | $ | 456,545 | $ | 455,869 | $ | 455,179 | $ | 454,488 | ||||||||||
| Mortgage-backed securities |
1,024,313 | 1,048,170 | 1,070,032 | 1,093,070 | 1,119,741 | |||||||||||||||
| State and political subdivisions |
1,855,614 | 1,856,905 | 1,857,177 | 1,857,283 | 1,857,409 | |||||||||||||||
| Other securities |
254,376 | 253,936 | 253,558 | 253,168 | 253,812 | |||||||||||||||
|
|
|
|
|
|
|
|
|
|
|
|||||||||||
| Total held-to-maturity (net of credit losses) |
3,591,531 | 3,615,556 | 3,636,636 | 3,658,700 | 3,685,450 | |||||||||||||||
|
|
|
|
|
|
|
|
|
|
|
|||||||||||
|
Available-for-Sale |
||||||||||||||||||||
| U.S. Treasury |
$ | 400 | $ | 699 | $ | 996 | $ | 1,290 | $ | 1,275 | ||||||||||
| U.S. Government agencies |
49,498 | 52,318 | 54,547 | 58,397 | 66,563 | |||||||||||||||
| Mortgage-backed securities |
1,349,991 | 1,380,913 | 1,392,759 | 1,510,402 | 1,730,842 | |||||||||||||||
| State and political subdivisions |
807,842 | 832,898 | 858,182 | 898,178 | 864,190 | |||||||||||||||
| Other securities |
197,589 | 225,021 | 222,942 | 222,827 | 223,034 | |||||||||||||||
|
|
|
|
|
|
|
|
|
|
|
|||||||||||
| Total available-for-sale (net of credit losses) |
2,405,320 | 2,491,849 | 2,529,426 | 2,691,094 | 2,885,904 | |||||||||||||||
|
|
|
|
|
|
|
|
|
|
|
|||||||||||
| Total investment securities (net of credit losses) |
$ | 5,996,851 | $ | 6,107,405 | $ | 6,166,062 | $ | 6,349,794 | $ | 6,571,354 | ||||||||||
|
|
|
|
|
|
|
|
|
|
|
|||||||||||
| Fair value - HTM investment securities |
$ | 2,891,974 | $ | 2,929,625 | $ | 2,949,951 | $ | 3,109,610 | $ | 3,005,524 | ||||||||||
|
|
|
|
|
|
|
|
|
|
|
|||||||||||
Page 4
| Simmons First National Corporation | SFNC | |
| Consolidated Loans | ||
| For the Quarters Ended | ||
| (Unaudited) |
| Jun 30 2025 |
Mar 31 2025 |
Dec 31 2024 |
Sep 30 2024 |
Jun 30 2024 |
||||||||||||||||
| ($ in thousands) | ||||||||||||||||||||
| Loan Portfolio - End of Period |
||||||||||||||||||||
| Consumer: |
||||||||||||||||||||
| Credit cards |
$ | 176,166 | $ | 179,680 | $ | 181,675 | $ | 177,696 | $ | 178,354 | ||||||||||
| Other consumer |
123,831 | 97,198 | 127,319 | 113,896 | 130,278 | |||||||||||||||
|
|
|
|
|
|
|
|
|
|
|
|||||||||||
| Total consumer |
299,997 | 276,878 | 308,994 | 291,592 | 308,632 | |||||||||||||||
| Real Estate: |
||||||||||||||||||||
| Construction |
2,784,578 | 2,778,245 | 2,789,249 | 2,796,378 | 3,056,703 | |||||||||||||||
| Single-family residential |
2,625,717 | 2,647,451 | 2,689,946 | 2,724,648 | 2,666,201 | |||||||||||||||
| Other commercial real estate |
7,961,412 | 8,051,304 | 7,912,336 | 7,992,437 | 7,760,266 | |||||||||||||||
|
|
|
|
|
|
|
|
|
|
|
|||||||||||
| Total real estate |
13,371,707 | 13,477,000 | 13,391,531 | 13,513,463 | 13,483,170 | |||||||||||||||
| Commercial: |
||||||||||||||||||||
| Commercial |
2,440,507 | 2,372,681 | 2,434,175 | 2,467,384 | 2,484,474 | |||||||||||||||
| Agricultural |
333,078 | 264,469 | 261,154 | 314,340 | 285,181 | |||||||||||||||
|
|
|
|
|
|
|
|
|
|
|
|||||||||||
| Total commercial |
2,773,585 | 2,637,150 | 2,695,329 | 2,781,724 | 2,769,655 | |||||||||||||||
| Other |
665,807 | 703,050 | 610,083 | 749,261 | 630,980 | |||||||||||||||
|
|
|
|
|
|
|
|
|
|
|
|||||||||||
| Total loans |
$ | 17,111,096 | $ | 17,094,078 | $ | 17,005,937 | $ | 17,336,040 | $ | 17,192,437 | ||||||||||
|
|
|
|
|
|
|
|
|
|
|
|||||||||||
Page 5
| Simmons First National Corporation | SFNC | |
| Consolidated Allowance and Asset Quality | ||
| For the Quarters Ended | ||
| (Unaudited) |
| Jun 30 2025 |
Mar 31 2025 |
Dec 31 2024 |
Sep 30 2024 |
Jun 30 2024 |
||||||||||||||||
| ($ in thousands) | ||||||||||||||||||||
| Allowance for Credit Losses on Loans |
||||||||||||||||||||
| Beginning balance |
$ | 252,168 | $ | 235,019 | $ | 233,223 | $ | 230,389 | $ | 227,367 | ||||||||||
| Loans charged off: |
||||||||||||||||||||
| Credit cards |
1,702 | 1,460 | 1,629 | 1,744 | 1,418 | |||||||||||||||
| Other consumer |
351 | 1,133 | 505 | 524 | 550 | |||||||||||||||
| Real estate |
1,450 | 4,425 | 3,810 | 159 | 123 | |||||||||||||||
| Commercial |
8,257 | 4,243 | 6,796 | 8,235 | 7,243 | |||||||||||||||
|
|
|
|
|
|
|
|
|
|
|
|||||||||||
| Total loans charged off |
11,760 | 11,261 | 12,740 | 10,662 | 9,334 | |||||||||||||||
| Recoveries of loans previously charged off: |
||||||||||||||||||||
| Credit cards |
334 | 211 | 391 | 231 | 221 | |||||||||||||||
| Other consumer |
294 | 306 | 279 | 275 | 509 | |||||||||||||||
| Real estate |
87 | 99 | 275 | 403 | 72 | |||||||||||||||
| Commercial |
469 | 997 | 259 | 439 | 455 | |||||||||||||||
|
|
|
|
|
|
|
|
|
|
|
|||||||||||
| Total recoveries |
1,184 | 1,613 | 1,204 | 1,348 | 1,257 | |||||||||||||||
|
|
|
|
|
|
|
|
|
|
|
|||||||||||
| Net loans charged off |
10,576 | 9,648 | 11,536 | 9,314 | 8,077 | |||||||||||||||
| Provision for credit losses on loans |
11,945 | 26,797 | 13,332 | 12,148 | 11,099 | |||||||||||||||
|
|
|
|
|
|
|
|
|
|
|
|||||||||||
| Balance, end of quarter |
$ | 253,537 | $ | 252,168 | $ | 235,019 | $ | 233,223 | $ | 230,389 | ||||||||||
|
|
|
|
|
|
|
|
|
|
|
|||||||||||
| Nonperforming assets |
||||||||||||||||||||
| Nonperforming loans: |
||||||||||||||||||||
| Nonaccrual loans |
$ | 156,453 | $ | 151,897 | $ | 110,154 | $ | 100,865 | $ | 102,891 | ||||||||||
| Loans past due 90 days or more |
709 | 494 | 603 | 830 | 558 | |||||||||||||||
|
|
|
|
|
|
|
|
|
|
|
|||||||||||
| Total nonperforming loans |
157,162 | 152,391 | 110,757 | 101,695 | 103,449 | |||||||||||||||
|
|
|
|
|
|
|
|
|
|
|
|||||||||||
| Other nonperforming assets: |
||||||||||||||||||||
| Foreclosed assets and other real estate owned |
8,794 | 8,976 | 9,270 | 1,299 | 2,209 | |||||||||||||||
| Other nonperforming assets |
759 | 978 | 1,202 | 1,311 | 1,167 | |||||||||||||||
|
|
|
|
|
|
|
|
|
|
|
|||||||||||
| Total other nonperforming assets |
9,553 | 9,954 | 10,472 | 2,610 | 3,376 | |||||||||||||||
|
|
|
|
|
|
|
|
|
|
|
|||||||||||
| Total nonperforming assets |
$ | 166,715 | $ | 162,345 | $ | 121,229 | $ | 104,305 | $ | 106,825 | ||||||||||
|
|
|
|
|
|
|
|
|
|
|
|||||||||||
| Ratios |
||||||||||||||||||||
| Allowance for credit losses on loans to total loans |
1.48 | % | 1.48 | % | 1.38 | % | 1.35 | % | 1.34 | % | ||||||||||
| Allowance for credit losses to nonperforming loans |
161 | % | 165 | % | 212 | % | 229 | % | 223 | % | ||||||||||
| Nonperforming loans to total loans |
0.92 | % | 0.89 | % | 0.65 | % | 0.59 | % | 0.60 | % | ||||||||||
| Nonperforming assets to total assets |
0.62 | % | 0.61 | % | 0.45 | % | 0.38 | % | 0.39 | % | ||||||||||
| Annualized net charge offs to average loans (QTD) |
0.25 | % | 0.23 | % | 0.27 | % | 0.22 | % | 0.19 | % | ||||||||||
| Annualized net charge offs to average loans (YTD) |
0.24 | % | 0.23 | % | 0.22 | % | 0.20 | % | 0.19 | % | ||||||||||
| Annualized net credit card charge offs to average credit card loans (QTD) |
2.99 | % | 2.72 | % | 2.63 | % | 3.23 | % | 2.50 | % | ||||||||||
Page 6
| Simmons First National Corporation | SFNC | |
| Consolidated - Average Balance Sheet and Net Interest Income Analysis | ||
| For the Quarters Ended | ||
| (Unaudited) |
| Three Months Ended Jun 2025 |
Three Months Ended Mar 2025 |
Three Months Ended Jun 2024 |
||||||||||||||||||||||||||||||||||
| ($ in thousands) | Average Balance |
Income/ Expense |
Yield/ Rate |
Average Balance |
Income/ Expense |
Yield/ Rate |
Average Balance |
Income/ Expense |
Yield/ Rate |
|||||||||||||||||||||||||||
| ASSETS |
||||||||||||||||||||||||||||||||||||
| Earning assets: |
||||||||||||||||||||||||||||||||||||
| Interest bearing balances due from banks and federal funds sold |
$ | 219,928 | $ | 2,531 | 4.62 | % | $ | 241,021 | $ | 2,703 | 4.55 | % | $ | 214,777 | $ | 2,964 | 5.55 | % | ||||||||||||||||||
| Investment securities - taxable |
3,483,805 | 31,233 | 3.60 | % | 3,540,559 | 31,584 | 3.62 | % | 4,035,508 | 39,283 | 3.92 | % | ||||||||||||||||||||||||
| Investment securities - non - taxable (FTE) |
2,564,037 | 21,210 | 3.32 | % | 2,608,070 | 21,217 | 3.30 | % | 2,597,005 | 21,429 | 3.32 | % | ||||||||||||||||||||||||
| Mortgage loans held for sale |
13,063 | 221 | 6.79 | % | 8,142 | 122 | 6.08 | % | 10,328 | 194 | 7.55 | % | ||||||||||||||||||||||||
| Loans - including fees (FTE) |
17,046,802 | 266,250 | 6.26 | % | 16,920,050 | 258,625 | 6.20 | % | 17,101,799 | 271,851 | 6.39 | % | ||||||||||||||||||||||||
|
|
|
|
|
|
|
|
|
|
|
|
|
|
|
|
|
|
|
|||||||||||||||||||
| Total interest earning assets (FTE) |
23,327,635 | 321,445 | 5.53 | % | 23,317,842 | 314,251 | 5.47 | % | 23,959,417 | 335,721 | 5.64 | % | ||||||||||||||||||||||||
| Non-earning assets |
3,317,496 | 3,360,786 | 3,345,860 | |||||||||||||||||||||||||||||||||
|
|
|
|
|
|
|
|||||||||||||||||||||||||||||||
| Total assets |
$ | 26,645,131 | $ | 26,678,628 | $ | 27,305,277 | ||||||||||||||||||||||||||||||
|
|
|
|
|
|
|
|||||||||||||||||||||||||||||||
| LIABILITIES AND STOCKHOLDERS’ EQUITY |
||||||||||||||||||||||||||||||||||||
| Interest bearing liabilities: |
||||||||||||||||||||||||||||||||||||
| Interest bearing transaction and savings accounts |
$ | 11,220,060 | $ | 69,108 | 2.47 | % | $ | 11,177,550 | $ | 67,895 | 2.46 | % | $ | 10,973,462 | $ | 79,087 | 2.90 | % | ||||||||||||||||||
| Time deposits |
5,820,499 | 57,231 | 3.94 | % | 6,160,429 | 62,559 | 4.12 | % | 6,447,259 | 73,946 | 4.61 | % | ||||||||||||||||||||||||
|
|
|
|
|
|
|
|
|
|
|
|
|
|
|
|
|
|
|
|||||||||||||||||||
| Total interest bearing deposits |
17,040,559 | 126,339 | 2.97 | % | 17,337,979 | 130,454 | 3.05 | % | 17,420,721 | 153,033 | 3.53 | % | ||||||||||||||||||||||||
| Federal funds purchased and securities sold under agreement to repurchase |
32,565 | 59 | 0.73 | % | 39,797 | 113 | 1.15 | % | 50,558 | 156 | 1.24 | % | ||||||||||||||||||||||||
| Other borrowings |
960,817 | 10,613 | 4.43 | % | 706,402 | 7,714 | 4.43 | % | 1,111,734 | 15,025 | 5.44 | % | ||||||||||||||||||||||||
| Subordinated notes and debentures |
366,350 | 6,188 | 6.77 | % | 366,312 | 6,134 | 6.79 | % | 366,198 | 7,026 | 7.72 | % | ||||||||||||||||||||||||
|
|
|
|
|
|
|
|
|
|
|
|
|
|
|
|
|
|
|
|||||||||||||||||||
| Total interest bearing liabilities |
18,400,291 | 143,199 | 3.12 | % | 18,450,490 | 144,415 | 3.17 | % | 18,949,211 | 175,240 | 3.72 | % | ||||||||||||||||||||||||
|
|
|
|
|
|
|
|
|
|
|
|
|
|||||||||||||||||||||||||
| Noninterest bearing liabilities: |
||||||||||||||||||||||||||||||||||||
| Noninterest bearing deposits |
4,390,454 | 4,342,948 | 4,624,819 | |||||||||||||||||||||||||||||||||
| Other liabilities |
308,223 | 320,721 | 280,092 | |||||||||||||||||||||||||||||||||
|
|
|
|
|
|
|
|||||||||||||||||||||||||||||||
| Total liabilities |
23,098,968 | 23,114,159 | 23,854,122 | |||||||||||||||||||||||||||||||||
| Stockholders’ equity |
3,546,163 | 3,564,469 | 3,451,155 | |||||||||||||||||||||||||||||||||
|
|
|
|
|
|
|
|||||||||||||||||||||||||||||||
| Total liabilities and stockholders’ equity |
$ | 26,645,131 | $ | 26,678,628 | $ | 27,305,277 | ||||||||||||||||||||||||||||||
|
|
|
|
|
|
|
|||||||||||||||||||||||||||||||
| Net interest income (FTE) |
$ | 178,246 | $ | 169,836 | $ | 160,481 | ||||||||||||||||||||||||||||||
|
|
|
|
|
|
|
|||||||||||||||||||||||||||||||
| Net interest spread (FTE) |
2.41 | % | 2.30 | % | 1.92 | % | ||||||||||||||||||||||||||||||
|
|
|
|
|
|
|
|||||||||||||||||||||||||||||||
| Net interest margin (FTE) |
3.06 | % | 2.95 | % | 2.69 | % | ||||||||||||||||||||||||||||||
|
|
|
|
|
|
|
|||||||||||||||||||||||||||||||
Page 7
| Simmons First National Corporation | SFNC | |
| Consolidated - Selected Financial Data | ||
| For the Quarters Ended | ||
| (Unaudited) |
| Jun 30 2025 |
Mar 31 2025 |
Dec 31 2024 |
Sep 30 2024 |
Jun 30 2024 |
||||||||||||||||
| ($ in thousands, except share data) | ||||||||||||||||||||
|
QUARTER-TO-DATE |
||||||||||||||||||||
| Financial Highlights - As Reported |
||||||||||||||||||||
| Net Income |
$ | 54,773 | $ | 32,388 | $ | 48,319 | $ | 24,740 | $ | 40,763 | ||||||||||
| Diluted earnings per share |
0.43 | 0.26 | 0.38 | 0.20 | 0.32 | |||||||||||||||
| Return on average assets |
0.82 | % | 0.49 | % | 0.71 | % | 0.36 | % | 0.60 | % | ||||||||||
| Return on average common equity |
6.20 | % | 3.69 | % | 5.43 | % | 2.81 | % | 4.75 | % | ||||||||||
| Return on tangible common equity (non-GAAP) (1) |
10.73 | % | 6.61 | % | 9.59 | % | 5.27 | % | 8.67 | % | ||||||||||
| Net interest margin (FTE) |
3.06 | % | 2.95 | % | 2.87 | % | 2.74 | % | 2.69 | % | ||||||||||
| Efficiency ratio (2) |
62.82 | % | 66.94 | % | 65.66 | % | 75.70 | % | 68.38 | % | ||||||||||
| FTE adjustment |
6,422 | 6,414 | 6,424 | 6,398 | 6,576 | |||||||||||||||
| Average diluted shares outstanding |
126,406,879 | 126,336,557 | 126,232,084 | 125,999,269 | 125,758,166 | |||||||||||||||
| Cash dividends declared per common share |
0.213 | 0.213 | 0.210 | 0.210 | 0.210 | |||||||||||||||
| Accretable yield on acquired loans |
1,263 | 1,084 | 1,863 | 1,496 | 1,569 | |||||||||||||||
| Financial Highlights - Adjusted (non-GAAP) (1) |
||||||||||||||||||||
| Adjusted earnings |
$ | 56,071 | $ | 33,122 | $ | 49,634 | $ | 46,005 | $ | 41,897 | ||||||||||
| Adjusted diluted earnings per share |
0.44 | 0.26 | 0.39 | 0.37 | 0.33 | |||||||||||||||
| Adjusted return on average assets |
0.84 | % | 0.50 | % | 0.73 | % | 0.67 | % | 0.62 | % | ||||||||||
| Adjusted return on average common equity |
6.34 | % | 3.77 | % | 5.57 | % | 5.22 | % | 4.88 | % | ||||||||||
| Adjusted return on tangible common equity |
10.97 | % | 6.75 | % | 9.83 | % | 9.34 | % | 8.89 | % | ||||||||||
| Adjusted efficiency ratio (2) |
60.52 | % | 64.75 | % | 62.89 | % | 63.38 | % | 65.68 | % | ||||||||||
|
YEAR-TO-DATE |
||||||||||||||||||||
| Financial Highlights - GAAP |
||||||||||||||||||||
| Net Income |
$ | 87,161 | $ | 32,388 | $ | 152,693 | $ | 104,374 | $ | 79,634 | ||||||||||
| Diluted earnings per share |
0.69 | 0.26 | 1.21 | 0.83 | 0.63 | |||||||||||||||
| Return on average assets |
0.66 | % | 0.49 | % | 0.56 | % | 0.51 | % | 0.59 | % | ||||||||||
| Return on average common equity |
4.94 | % | 3.69 | % | 4.38 | % | 4.02 | % | 4.64 | % | ||||||||||
| Return on tangible common equity (non-GAAP) (1) |
8.67 | % | 6.61 | % | 7.96 | % | 7.39 | % | 8.50 | % | ||||||||||
| Net interest margin (FTE) |
3.01 | % | 2.95 | % | 2.74 | % | 2.70 | % | 2.68 | % | ||||||||||
| Efficiency ratio (2) |
64.86 | % | 66.94 | % | 69.57 | % | 71.00 | % | 68.90 | % | ||||||||||
| FTE adjustment |
12,836 | 6,414 | 25,820 | 19,396 | 12,998 | |||||||||||||||
| Average diluted shares outstanding |
126,325,650 | 126,336,557 | 126,115,606 | 125,910,260 | 125,693,536 | |||||||||||||||
| Cash dividends declared per common share |
0.425 | 0.213 | 0.840 | 0.630 | 0.420 | |||||||||||||||
| Financial Highlights - Adjusted (non-GAAP) (1) |
||||||||||||||||||||
| Adjusted earnings |
$ | 89,193 | $ | 33,122 | $ | 177,887 | $ | 128,253 | $ | 82,248 | ||||||||||
| Adjusted diluted earnings per share |
0.71 | 0.26 | 1.41 | 1.02 | 0.65 | |||||||||||||||
| Adjusted return on average assets |
0.67 | % | 0.50 | % | 0.65 | % | 0.63 | % | 0.61 | % | ||||||||||
| Adjusted return on average common equity |
5.06 | % | 3.77 | % | 5.10 | % | 4.94 | % | 4.80 | % | ||||||||||
| Adjusted return on tangible common equity |
8.86 | % | 6.75 | % | 9.18 | % | 8.96 | % | 8.76 | % | ||||||||||
| Adjusted efficiency ratio (2) |
62.62 | % | 64.75 | % | 64.56 | % | 65.14 | % | 66.05 | % | ||||||||||
| END OF PERIOD |
||||||||||||||||||||
| Book value per share |
$ | 28.17 | $ | 28.04 | $ | 28.08 | $ | 28.11 | $ | 27.56 | ||||||||||
| Tangible book value per share |
16.97 | 16.81 | 16.80 | 16.78 | 16.20 | |||||||||||||||
| Shares outstanding |
125,996,248 | 125,926,822 | 125,651,540 | 125,554,598 | 125,487,520 | |||||||||||||||
| Full-time equivalent employees |
2,947 | 2,949 | 2,946 | 2,972 | 2,961 | |||||||||||||||
| Total number of financial centers |
223 | 222 | 222 | 234 | 234 | |||||||||||||||
| (1) | Non-GAAP measurement that management believes aids in the understanding and discussion of results. Reconciliations to GAAP are included in the schedules accompanying this release. |
| (2) | Efficiency ratio is noninterest expense as a percent of net interest income (fully taxable equivalent) and noninterest revenues. Adjusted efficiency ratio is noninterest expense before foreclosed property expense, amortization of intangibles and certain adjusting items as a percent of net interest income (fully taxable equivalent) and noninterest revenues, excluding gains and losses from securities transactions and certain adjusting items, and is a non-GAAP measurement. |
Page 8
| Simmons First National Corporation | SFNC | |
| Reconciliation Of Non-GAAP Financial Measures - Adjusted Earnings - Quarter-to-Date | ||
| For the Quarters Ended | ||
| (Unaudited) |
| Jun 30 2025 |
Mar 31 2025 |
Dec 31 2024 |
Sep 30 2024 |
Jun 30 2024 |
||||||||||||||||
| (in thousands, except per share data) | ||||||||||||||||||||
|
QUARTER-TO-DATE |
||||||||||||||||||||
| Net income |
$ | 54,773 | $ | 32,388 | $ | 48,319 | $ | 24,740 | $ | 40,763 | ||||||||||
| Certain items (non-GAAP) |
||||||||||||||||||||
| FDIC Deposit Insurance special assessment |
— | — | — | — | 283 | |||||||||||||||
| Early retirement program |
1,594 | — | 200 | (1 | ) | 118 | ||||||||||||||
| Termination of vendor and software services |
— | — | — | (13 | ) | 615 | ||||||||||||||
| Loss (gain) on sale of securities |
— | — | — | 28,393 | — | |||||||||||||||
| Branch right sizing (net) |
163 | 994 | 1,581 | 410 | 519 | |||||||||||||||
| Tax effect of certain items (1) |
(459 | ) | (260 | ) | (466 | ) | (7,524 | ) | (401 | ) | ||||||||||
|
|
|
|
|
|
|
|
|
|
|
|||||||||||
| Certain items, net of tax |
1,298 | 734 | 1,315 | 21,265 | 1,134 | |||||||||||||||
|
|
|
|
|
|
|
|
|
|
|
|||||||||||
| Adjusted earnings (non-GAAP) (2) |
$ | 56,071 | $ | 33,122 | $ | 49,634 | $ | 46,005 | $ | 41,897 | ||||||||||
|
|
|
|
|
|
|
|
|
|
|
|||||||||||
| Diluted earnings per share |
$ | 0.43 | $ | 0.26 | $ | 0.38 | $ | 0.20 | $ | 0.32 | ||||||||||
| Certain items (non-GAAP) |
||||||||||||||||||||
| FDIC Deposit Insurance special assessment |
— | — | — | — | — | |||||||||||||||
| Early retirement program |
0.01 | — | — | — | — | |||||||||||||||
| Termination of vendor and software services |
— | — | — | — | 0.01 | |||||||||||||||
| Loss (gain) on sale of securities |
— | — | — | 0.23 | — | |||||||||||||||
| Branch right sizing (net) |
— | — | 0.01 | — | — | |||||||||||||||
| Tax effect of certain items (1) |
— | — | — | (0.06 | ) | — | ||||||||||||||
|
|
|
|
|
|
|
|
|
|
|
|||||||||||
| Certain items, net of tax |
0.01 | — | 0.01 | 0.17 | 0.01 | |||||||||||||||
|
|
|
|
|
|
|
|
|
|
|
|||||||||||
| Adjusted diluted earnings per share (non-GAAP) |
$ | 0.44 | $ | 0.26 | $ | 0.39 | $ | 0.37 | $ | 0.33 | ||||||||||
|
|
|
|
|
|
|
|
|
|
|
|||||||||||
| (1) Effective tax rate of 26.135%. |
||||||||||||||||||||
| (2) In this press release, “Adjusted Earnings” may also be referred to as “Adjusted Net Income.” |
|
|||||||||||||||||||
| Reconciliation of Certain Noninterest Income and Expense Items (non-GAAP) |
|
|||||||||||||||||||
|
QUARTER-TO-DATE |
||||||||||||||||||||
| Noninterest income |
$ | 42,354 | $ | 46,155 | $ | 43,558 | $ | 17,130 | $ | 43,299 | ||||||||||
| Certain noninterest income items |
||||||||||||||||||||
| Loss (gain) on sale of securities |
— | — | — | 28,393 | — | |||||||||||||||
|
|
|
|
|
|
|
|
|
|
|
|||||||||||
| Adjusted noninterest income (non-GAAP) |
$ | 42,354 | $ | 46,155 | $ | 43,558 | $ | 45,523 | $ | 43,299 | ||||||||||
|
|
|
|
|
|
|
|
|
|
|
|||||||||||
| Noninterest expense |
$ | 138,589 | $ | 144,580 | $ | 141,117 | $ | 137,193 | $ | 139,354 | ||||||||||
| Certain noninterest expense items |
||||||||||||||||||||
| Early retirement program |
(1,594 | ) | — | (200 | ) | 1 | (118 | ) | ||||||||||||
| FDIC Deposit Insurance special assessment |
— | — | — | — | (283 | ) | ||||||||||||||
| Termination of vendor and software services |
— | — | — | 13 | (615 | ) | ||||||||||||||
| Branch right sizing expense |
(163 | ) | (994 | ) | (1,581 | ) | (410 | ) | (519 | ) | ||||||||||
|
|
|
|
|
|
|
|
|
|
|
|||||||||||
| Adjusted noninterest expense (non-GAAP) |
136,832 | 143,586 | 139,336 | 136,797 | 137,819 | |||||||||||||||
| Less: Fraud event |
— | (4,300 | ) | — | — | — | ||||||||||||||
|
|
|
|
|
|
|
|
|
|
|
|||||||||||
| Adjusted noninterest expense, excluding fraud event (non-GAAP) |
$ | 136,832 | $ | 139,286 | $ | 139,336 | $ | 136,797 | $ | 137,819 | ||||||||||
|
|
|
|
|
|
|
|
|
|
|
|||||||||||
| Salaries and employee benefits |
$ | 73,862 | $ | 74,824 | $ | 71,588 | $ | 69,167 | $ | 70,716 | ||||||||||
| Certain salaries and employee benefits items |
||||||||||||||||||||
| Early retirement program |
(1,594 | ) | — | (200 | ) | 1 | (118 | ) | ||||||||||||
| Other |
1 | — | — | (1 | ) | 1 | ||||||||||||||
|
|
|
|
|
|
|
|
|
|
|
|||||||||||
| Adjusted salaries and employee benefits (non-GAAP) |
$ | 72,269 | $ | 74,824 | $ | 71,388 | $ | 69,167 | $ | 70,599 | ||||||||||
|
|
|
|
|
|
|
|
|
|
|
|||||||||||
| Other operating expenses |
$ | 42,276 | $ | 46,051 | $ | 46,115 | $ | 44,540 | $ | 45,352 | ||||||||||
| Certain other operating expenses items |
||||||||||||||||||||
| Termination of vendor and software services |
— | — | — | 13 | (615 | ) | ||||||||||||||
| Branch right sizing expense |
255 | (161 | ) | (1,457 | ) | (184 | ) | (392 | ) | |||||||||||
|
|
|
|
|
|
|
|
|
|
|
|||||||||||
| Adjusted other operating expenses (non-GAAP) |
$ | 42,531 | $ | 45,890 | $ | 44,658 | $ | 44,369 | $ | 44,345 | ||||||||||
|
|
|
|
|
|
|
|
|
|
|
|||||||||||
Page 9
| Simmons First National Corporation | SFNC | |
| Reconciliation Of Non-GAAP Financial Measures - Adjusted Earnings - Year-to-Date | ||
| For the Quarters Ended | ||
| (Unaudited) |
| Jun 30 2025 |
Mar 31 2025 |
Dec 31 2024 |
Sep 30 2024 |
Jun 30 2024 |
||||||||||||||||
| (in thousands, except per share data) | ||||||||||||||||||||
|
YEAR-TO-DATE |
||||||||||||||||||||
| Net income |
$ | 87,161 | $ | 32,388 | $ | 152,693 | $ | 104,374 | $ | 79,634 | ||||||||||
| Certain items (non-GAAP) |
||||||||||||||||||||
| FDIC Deposit Insurance special assessment |
— | — | 1,832 | 1,832 | 1,832 | |||||||||||||||
| Early retirement program |
1,594 | — | 536 | 336 | 337 | |||||||||||||||
| Termination of vendor and software services |
— | — | 602 | 602 | 615 | |||||||||||||||
| Loss (gain) on sale of securities |
— | — | 28,393 | 28,393 | — | |||||||||||||||
| Branch right sizing (net) |
1,157 | 994 | 2,746 | 1,165 | 755 | |||||||||||||||
| Tax effect of certain items (1) |
(719 | ) | (260 | ) | (8,915 | ) | (8,449 | ) | (925 | ) | ||||||||||
|
|
|
|
|
|
|
|
|
|
|
|||||||||||
| Certain items, net of tax |
2,032 | 734 | 25,194 | 23,879 | 2,614 | |||||||||||||||
|
|
|
|
|
|
|
|
|
|
|
|||||||||||
| Adjusted earnings (non-GAAP) (2) |
$ | 89,193 | $ | 33,122 | $ | 177,887 | $ | 128,253 | $ | 82,248 | ||||||||||
|
|
|
|
|
|
|
|
|
|
|
|||||||||||
| Diluted earnings per share |
$ | 0.69 | $ | 0.26 | $ | 1.21 | $ | 0.83 | $ | 0.63 | ||||||||||
| Certain items (non-GAAP) |
||||||||||||||||||||
| FDIC Deposit Insurance special assessment |
— | — | 0.02 | 0.02 | 0.02 | |||||||||||||||
| Early retirement program |
0.01 | — | — | — | — | |||||||||||||||
| Termination of vendor and software services |
— | — | — | — | — | |||||||||||||||
| Loss (gain) on sale of securities |
— | — | 0.23 | 0.23 | — | |||||||||||||||
| Branch right sizing (net) |
0.01 | — | 0.02 | 0.01 | 0.01 | |||||||||||||||
| Tax effect of certain items (1) |
— | — | (0.07 | ) | (0.07 | ) | (0.01 | ) | ||||||||||||
|
|
|
|
|
|
|
|
|
|
|
|||||||||||
| Certain items, net of tax |
0.02 | — | 0.20 | 0.19 | 0.02 | |||||||||||||||
|
|
|
|
|
|
|
|
|
|
|
|||||||||||
| Adjusted diluted earnings per share (non-GAAP) |
$ | 0.71 | $ | 0.26 | $ | 1.41 | $ | 1.02 | $ | 0.65 | ||||||||||
|
|
|
|
|
|
|
|
|
|
|
|||||||||||
| (1) Effective tax rate of 26.135%. |
||||||||||||||||||||
| (2) In this press release, “Adjusted Earnings” may also be referred to as “Adjusted Net Income.” |
|
|||||||||||||||||||
| Reconciliation of Certain Noninterest Income and Expense Items (non-GAAP) |
|
|||||||||||||||||||
|
YEAR-TO-DATE |
||||||||||||||||||||
| Noninterest income |
$ | 88,509 | $ | 46,155 | $ | 147,171 | $ | 103,613 | $ | 86,483 | ||||||||||
| Certain noninterest income items |
||||||||||||||||||||
| Loss (gain) on sale of securities |
— | — | 28,393 | 28,393 | — | |||||||||||||||
|
|
|
|
|
|
|
|
|
|
|
|||||||||||
| Adjusted noninterest income (non-GAAP) |
$ | 88,509 | $ | 46,155 | $ | 175,564 | $ | 132,006 | $ | 86,483 | ||||||||||
|
|
|
|
|
|
|
|
|
|
|
|||||||||||
| Noninterest expense |
$ | 283,169 | $ | 144,580 | $ | 557,543 | $ | 416,426 | $ | 279,233 | ||||||||||
| Certain noninterest expense items |
||||||||||||||||||||
| Early retirement program |
(1,594 | ) | — | (536 | ) | (336 | ) | (337 | ) | |||||||||||
| FDIC Deposit Insurance special assessment |
— | — | (1,832 | ) | (1,832 | ) | (1,832 | ) | ||||||||||||
| Termination of vendor and software services |
— | — | (602 | ) | (602 | ) | (615 | ) | ||||||||||||
| Branch right sizing expense |
(1,157 | ) | (994 | ) | (2,746 | ) | (1,165 | ) | (755 | ) | ||||||||||
|
|
|
|
|
|
|
|
|
|
|
|||||||||||
| Adjusted noninterest expense (non-GAAP) |
280,418 | 143,586 | 551,827 | 412,491 | 275,694 | |||||||||||||||
| Less: Fraud event |
(4,300 | ) | (4,300 | ) | — | — | — | |||||||||||||
|
|
|
|
|
|
|
|
|
|
|
|||||||||||
| Adjusted noninterest expense, excluding fraud event (non-GAAP) |
$ | 276,118 | $ | 139,286 | $ | 551,827 | $ | 412,491 | $ | 275,694 | ||||||||||
|
|
|
|
|
|
|
|
|
|
|
|||||||||||
| Salaries and employee benefits |
$ | 148,686 | $ | 74,824 | $ | 284,124 | $ | 212,536 | $ | 143,369 | ||||||||||
| Certain salaries and employee benefits items |
||||||||||||||||||||
| Early retirement program |
(1,594 | ) | — | (536 | ) | (336 | ) | (337 | ) | |||||||||||
| Other |
1 | — | — | — | 1 | |||||||||||||||
|
|
|
|
|
|
|
|
|
|
|
|||||||||||
| Adjusted salaries and employee benefits (non-GAAP) |
$ | 147,093 | $ | 74,824 | $ | 283,588 | $ | 212,200 | $ | 143,033 | ||||||||||
|
|
|
|
|
|
|
|
|
|
|
|||||||||||
| Other operating expenses |
$ | 88,327 | $ | 46,051 | $ | 178,520 | $ | 132,405 | $ | 87,865 | ||||||||||
| Certain other operating expenses items |
||||||||||||||||||||
| Termination of vendor and software services |
— | — | (602 | ) | (602 | ) | (615 | ) | ||||||||||||
| Branch right sizing expense |
94 | (161 | ) | (2,116 | ) | (659 | ) | (475 | ) | |||||||||||
|
|
|
|
|
|
|
|
|
|
|
|||||||||||
| Adjusted other operating expenses (non-GAAP) |
$ | 88,421 | $ | 45,890 | $ | 175,802 | $ | 131,144 | $ | 86,775 | ||||||||||
|
|
|
|
|
|
|
|
|
|
|
|||||||||||
Page 10
| Simmons First National Corporation | SFNC | |
| Reconciliation Of Non-GAAP Financial Measures - End of Period | ||
| For the Quarters Ended | ||
| (Unaudited) |
| Jun 30 2025 |
Mar 31 2025 |
Dec 31 2024 |
Sep 30 2024 |
Jun 30 2024 |
||||||||||||||||
| ($ in thousands, except per share data) | ||||||||||||||||||||
| Calculation of Tangible Common Equity and the Ratio of Tangible Common Equity to Tangible Assets |
|
|||||||||||||||||||
| Total common stockholders’ equity |
$ | 3,549,210 | $ | 3,531,485 | $ | 3,528,872 | $ | 3,528,833 | $ | 3,458,869 | ||||||||||
| Intangible assets: |
||||||||||||||||||||
| Goodwill |
(1,320,799 | ) | (1,320,799 | ) | (1,320,799 | ) | (1,320,799 | ) | (1,320,799 | ) | ||||||||||
| Other intangible assets |
(90,617 | ) | (93,714 | ) | (97,242 | ) | (101,093 | ) | (104,943 | ) | ||||||||||
|
|
|
|
|
|
|
|
|
|
|
|||||||||||
| Total intangibles |
(1,411,416 | ) | (1,414,513 | ) | (1,418,041 | ) | (1,421,892 | ) | (1,425,742 | ) | ||||||||||
|
|
|
|
|
|
|
|
|
|
|
|||||||||||
| Tangible common stockholders’ equity |
$ | 2,137,794 | $ | 2,116,972 | $ | 2,110,831 | $ | 2,106,941 | $ | 2,033,127 | ||||||||||
|
|
|
|
|
|
|
|
|
|
|
|||||||||||
| Total assets |
$ | 26,693,620 | $ | 26,792,991 | $ | 26,876,049 | $ | 27,269,404 | $ | 27,369,072 | ||||||||||
| Intangible assets: |
||||||||||||||||||||
| Goodwill |
(1,320,799 | ) | (1,320,799 | ) | (1,320,799 | ) | (1,320,799 | ) | (1,320,799 | ) | ||||||||||
| Other intangible assets |
(90,617 | ) | (93,714 | ) | (97,242 | ) | (101,093 | ) | (104,943 | ) | ||||||||||
|
|
|
|
|
|
|
|
|
|
|
|||||||||||
| Total intangibles |
(1,411,416 | ) | (1,414,513 | ) | (1,418,041 | ) | (1,421,892 | ) | (1,425,742 | ) | ||||||||||
|
|
|
|
|
|
|
|
|
|
|
|||||||||||
| Tangible assets |
$ | 25,282,204 | $ | 25,378,478 | $ | 25,458,008 | $ | 25,847,512 | $ | 25,943,330 | ||||||||||
|
|
|
|
|
|
|
|
|
|
|
|||||||||||
| Ratio of common equity to assets |
13.30 | % | 13.18 | % | 13.13 | % | 12.94 | % | 12.64 | % | ||||||||||
|
|
|
|
|
|
|
|
|
|
|
|||||||||||
| Ratio of tangible common equity to tangible assets |
8.46 | % | 8.34 | % | 8.29 | % | 8.15 | % | 7.84 | % | ||||||||||
|
|
|
|
|
|
|
|
|
|
|
|||||||||||
| Calculation of Tangible Book Value per Share |
||||||||||||||||||||
| Total common stockholders’ equity |
$ | 3,549,210 | $ | 3,531,485 | $ | 3,528,872 | $ | 3,528,833 | $ | 3,458,869 | ||||||||||
| Intangible assets: |
||||||||||||||||||||
| Goodwill |
(1,320,799 | ) | (1,320,799 | ) | (1,320,799 | ) | (1,320,799 | ) | (1,320,799 | ) | ||||||||||
| Other intangible assets |
(90,617 | ) | (93,714 | ) | (97,242 | ) | (101,093 | ) | (104,943 | ) | ||||||||||
|
|
|
|
|
|
|
|
|
|
|
|||||||||||
| Total intangibles |
(1,411,416 | ) | (1,414,513 | ) | (1,418,041 | ) | (1,421,892 | ) | (1,425,742 | ) | ||||||||||
|
|
|
|
|
|
|
|
|
|
|
|||||||||||
| Tangible common stockholders’ equity |
$ | 2,137,794 | $ | 2,116,972 | $ | 2,110,831 | $ | 2,106,941 | $ | 2,033,127 | ||||||||||
|
|
|
|
|
|
|
|
|
|
|
|||||||||||
| Shares of common stock outstanding |
125,926,248 | 125,926,822 | 125,651,540 | 125,554,598 | 125,487,520 | |||||||||||||||
|
|
|
|
|
|
|
|
|
|
|
|||||||||||
| Book value per common share |
$ | 28.18 | $ | 28.04 | $ | 28.08 | $ | 28.11 | $ | 27.56 | ||||||||||
|
|
|
|
|
|
|
|
|
|
|
|||||||||||
| Tangible book value per common share |
$ | 16.98 | $ | 16.81 | $ | 16.80 | $ | 16.78 | $ | 16.20 | ||||||||||
|
|
|
|
|
|
|
|
|
|
|
|||||||||||
| Calculation of Coverage Ratio of Uninsured, Non-Collateralized Deposits |
|
|||||||||||||||||||
| Uninsured deposits at Simmons Bank |
$ | 8,407,847 | $ | 8,614,833 | $ | 8,467,291 | $ | 8,355,496 | $ | 8,186,903 | ||||||||||
| Less: Collateralized deposits (excluding portion that is FDIC insured) |
2,691,215 | 3,005,328 | 2,790,339 | 2,710,167 | 2,835,424 | |||||||||||||||
| Less: Intercompany eliminations |
1,121,932 | 1,073,500 | 1,045,734 | 986,626 | 943,979 | |||||||||||||||
|
|
|
|
|
|
|
|
|
|
|
|||||||||||
| Total uninsured, non-collateralized deposits |
$ | 4,594,700 | $ | 4,536,005 | $ | 4,631,218 | $ | 4,658,703 | $ | 4,407,500 | ||||||||||
|
|
|
|
|
|
|
|
|
|
|
|||||||||||
| FHLB borrowing availability |
$ | 5,133,000 | $ | 4,432,000 | $ | 4,716,000 | $ | 4,955,000 | $ | 4,910,000 | ||||||||||
| Unpledged securities |
3,697,000 | 4,197,000 | 4,103,000 | 4,110,000 | 4,145,000 | |||||||||||||||
| Fed funds lines, Fed discount window and |
||||||||||||||||||||
| Bank Term Funding Program (1) |
1,894,000 | 1,780,000 | 2,081,000 | 2,109,000 | 2,065,000 | |||||||||||||||
|
|
|
|
|
|
|
|
|
|
|
|||||||||||
| Additional liquidity sources |
$ | 10,724,000 | $ | 10,409,000 | $ | 10,900,000 | $ | 11,174,000 | $ | 11,120,000 | ||||||||||
|
|
|
|
|
|
|
|
|
|
|
|||||||||||
| Uninsured, non-collateralized deposit coverage ratio |
2.3 | 2.3 | 2.4 | 2.4 | 2.5 | |||||||||||||||
|
|
|
|
|
|
|
|
|
|
|
|||||||||||
| (1) The Bank Term Funding Program closed for new loans on March 11, 2024. At no time did Simmons borrow funds under this program. |
|
|||||||||||||||||||
| Calculation of Net Charge Off Ratio |
||||||||||||||||||||
| Net charge offs |
$ | 10,576 | $ | 9,648 | $ | 11,536 | $ | 9,314 | $ | 8,077 | ||||||||||
| Less: Net charge offs from run-off portfolio (1) |
1,100 | 1,900 | 2,500 | 3,500 | 6,700 | |||||||||||||||
|
|
|
|
|
|
|
|
|
|
|
|||||||||||
| Net charge offs excluding run-off portfolio |
$ | 9,476 | $ | 7,748 | $ | 9,036 | $ | 5,814 | $ | 1,377 | ||||||||||
|
|
|
|
|
|
|
|
|
|
|
|||||||||||
| Average total loans |
$ | 17,046,802 | $ | 16,920,050 | $ | 17,212,034 | $ | 17,208,162 | $ | 17,101,799 | ||||||||||
|
|
|
|
|
|
|
|
|
|
|
|||||||||||
| Annualized net charge offs to average loans (NCO ratio) |
0.25 | % | 0.23 | % | 0.27 | % | 0.22 | % | 0.19 | % | ||||||||||
|
|
|
|
|
|
|
|
|
|
|
|||||||||||
| NCO ratio, excluding net charge offs associated with run-off portfolio (annualized) |
0.22 | % | 0.19 | % | 0.21 | % | 0.13 | % | 0.03 | % | ||||||||||
|
|
|
|
|
|
|
|
|
|
|
|||||||||||
| (1) | Run-off portfolio consists of asset based lending and small equipment finance portfolios obtained in acquisitions. |
Page 11
| Simmons First National Corporation | SFNC | |
| Reconciliation Of Non-GAAP Financial Measures - Quarter-to-Date |
||
| For the Quarters Ended | ||
| (Unaudited) | ||
| Jun 30 2025 |
Mar 31 2025 |
Dec 31 2024 |
Sep 30 2024 |
Jun 30 2024 |
||||||||||||||||
| ($ in thousands) | ||||||||||||||||||||
| Calculation of Adjusted Return on Average Assets |
||||||||||||||||||||
| Net income |
$ | 54,773 | $ | 32,388 | $ | 48,319 | $ | 24,740 | $ | 40,763 | ||||||||||
| Certain items (non-GAAP) |
||||||||||||||||||||
| FDIC Deposit Insurance special assessment |
— | — | — | — | 283 | |||||||||||||||
| Early retirement program |
1,594 | — | 200 | (1 | ) | 118 | ||||||||||||||
| Termination of vendor and software services |
— | — | — | (13 | ) | 615 | ||||||||||||||
| Loss (gain) on sale of securities |
— | — | — | 28,393 | — | |||||||||||||||
| Branch right sizing (net) |
163 | 994 | 1,581 | 410 | 519 | |||||||||||||||
| Tax effect of certain items (2) |
(459 | ) | (260 | ) | (466 | ) | (7,524 | ) | (401 | ) | ||||||||||
|
|
|
|
|
|
|
|
|
|
|
|||||||||||
| Adjusted earnings (non-GAAP) |
$ | 56,071 | $ | 33,122 | $ | 49,634 | $ | 46,005 | $ | 41,897 | ||||||||||
|
|
|
|
|
|
|
|
|
|
|
|||||||||||
| Average total assets |
$ | 26,645,131 | $ | 26,678,628 | $ | 27,078,943 | $ | 27,216,440 | $ | 27,305,277 | ||||||||||
|
|
|
|
|
|
|
|
|
|
|
|||||||||||
| Return on average assets |
0.82 | % | 0.49 | % | 0.71 | % | 0.36 | % | 0.60 | % | ||||||||||
|
|
|
|
|
|
|
|
|
|
|
|||||||||||
| Adjusted return on average assets (non-GAAP) |
0.84 | % | 0.50 | % | 0.73 | % | 0.67 | % | 0.62 | % | ||||||||||
|
|
|
|
|
|
|
|
|
|
|
|||||||||||
| Calculation of Return on Tangible Common Equity |
||||||||||||||||||||
| Net income available to common stockholders |
$ | 54,773 | $ | 32,388 | $ | 48,319 | $ | 24,740 | $ | 40,763 | ||||||||||
| Amortization of intangibles, net of taxes |
2,289 | 2,605 | 2,843 | 2,845 | 2,845 | |||||||||||||||
|
|
|
|
|
|
|
|
|
|
|
|||||||||||
| Total income available to common stockholders |
$ | 57,062 | $ | 34,993 | $ | 51,162 | $ | 27,585 | $ | 43,608 | ||||||||||
|
|
|
|
|
|
|
|
|
|
|
|||||||||||
| Certain items (non-GAAP) |
||||||||||||||||||||
| FDIC Deposit Insurance special assessment |
$ | — | $ | — | $ | — | $ | — | $ | 283 | ||||||||||
| Early retirement program |
1,594 | — | 200 | (1 | ) | 118 | ||||||||||||||
| Termination of vendor and software services |
— | — | — | (13 | ) | 615 | ||||||||||||||
| Loss (gain) on sale of securities |
— | — | — | 28,393 | — | |||||||||||||||
| Branch right sizing (net) |
163 | 994 | 1,581 | 410 | 519 | |||||||||||||||
| Tax effect of certain items (2) |
(459 | ) | (260 | ) | (466 | ) | (7,524 | ) | (401 | ) | ||||||||||
|
|
|
|
|
|
|
|
|
|
|
|||||||||||
| Adjusted earnings (non-GAAP) |
56,071 | 33,122 | 49,634 | 46,005 | 41,897 | |||||||||||||||
| Amortization of intangibles, net of taxes |
2,289 | 2,605 | 2,843 | 2,845 | 2,845 | |||||||||||||||
|
|
|
|
|
|
|
|
|
|
|
|||||||||||
| Total adjusted earnings available to common stockholders (non-GAAP) |
$ | 58,360 | $ | 35,727 | $ | 52,477 | $ | 48,850 | $ | 44,742 | ||||||||||
|
|
|
|
|
|
|
|
|
|
|
|||||||||||
| Average common stockholders’ equity |
$ | 3,546,163 | $ | 3,564,469 | $ | 3,543,146 | $ | 3,505,141 | $ | 3,451,155 | ||||||||||
| Average intangible assets: |
||||||||||||||||||||
| Goodwill |
(1,320,799 | ) | (1,320,799 | ) | (1,320,799 | ) | (1,320,799 | ) | (1,320,799 | ) | ||||||||||
| Other intangibles |
(92,432 | ) | (95,787 | ) | (99,405 | ) | (103,438 | ) | (107,173 | ) | ||||||||||
|
|
|
|
|
|
|
|
|
|
|
|||||||||||
| Total average intangibles |
(1,413,231 | ) | (1,416,586 | ) | (1,420,204 | ) | (1,424,237 | ) | (1,427,972 | ) | ||||||||||
|
|
|
|
|
|
|
|
|
|
|
|||||||||||
| Average tangible common stockholders’ equity (non-GAAP) |
$ | 2,132,932 | $ | 2,147,883 | $ | 2,122,942 | $ | 2,080,904 | $ | 2,023,183 | ||||||||||
|
|
|
|
|
|
|
|
|
|
|
|||||||||||
| Return on average common equity |
6.20 | % | 3.69 | % | 5.43 | % | 2.81 | % | 4.75 | % | ||||||||||
|
|
|
|
|
|
|
|
|
|
|
|||||||||||
| Return on tangible common equity |
10.73 | % | 6.61 | % | 9.59 | % | 5.27 | % | 8.67 | % | ||||||||||
|
|
|
|
|
|
|
|
|
|
|
|||||||||||
| Adjusted return on average common equity (non-GAAP) |
6.34 | % | 3.77 | % | 5.57 | % | 5.22 | % | 4.88 | % | ||||||||||
|
|
|
|
|
|
|
|
|
|
|
|||||||||||
| Adjusted return on tangible common equity (non-GAAP) |
10.97 | % | 6.75 | % | 9.83 | % | 9.34 | % | 8.89 | % | ||||||||||
|
|
|
|
|
|
|
|
|
|
|
|||||||||||
| Calculation of Efficiency Ratio and Adjusted Efficiency Ratio (1) |
|
|||||||||||||||||||
| Noninterest expense (efficiency ratio numerator) |
$ | 138,589 | $ | 144,580 | $ | 141,117 | $ | 137,193 | $ | 139,354 | ||||||||||
| Certain noninterest expense items (non-GAAP) |
||||||||||||||||||||
| Early retirement program |
(1,594 | ) | — | (200 | ) | 1 | (118 | ) | ||||||||||||
| FDIC Deposit Insurance special assessment |
— | — | — | — | (283 | ) | ||||||||||||||
| Termination of vendor and software services |
— | — | — | 13 | (615 | ) | ||||||||||||||
| Branch right sizing expense |
(163 | ) | (994 | ) | (1,581 | ) | (410 | ) | (519 | ) | ||||||||||
| Other real estate and foreclosure expense adjustment |
(216 | ) | (198 | ) | (317 | ) | (87 | ) | (117 | ) | ||||||||||
| Amortization of intangibles adjustment |
(3,098 | ) | (3,527 | ) | (3,850 | ) | (3,851 | ) | (3,852 | ) | ||||||||||
|
|
|
|
|
|
|
|
|
|
|
|||||||||||
| Adjusted efficiency ratio numerator |
$ | 133,518 | $ | 139,861 | $ | 135,169 | $ | 132,859 | $ | 133,850 | ||||||||||
|
|
|
|
|
|
|
|
|
|
|
|||||||||||
| Net interest income |
$ | 171,824 | $ | 163,422 | $ | 164,942 | $ | 157,712 | $ | 153,905 | ||||||||||
| Noninterest income |
42,354 | 46,155 | 43,558 | 17,130 | 43,299 | |||||||||||||||
| Fully tax-equivalent adjustment (effective tax rate of 26.135%) |
6,422 | 6,414 | 6,424 | 6,398 | 6,576 | |||||||||||||||
|
|
|
|
|
|
|
|
|
|
|
|||||||||||
| Efficiency ratio denominator |
220,600 | 215,991 | 214,924 | 181,240 | 203,780 | |||||||||||||||
| Certain noninterest income items (non-GAAP) |
||||||||||||||||||||
| (Gain) loss on sale of securities |
— | — | — | 28,393 | — | |||||||||||||||
|
|
|
|
|
|
|
|
|
|
|
|||||||||||
| Adjusted efficiency ratio denominator |
$ | 220,600 | $ | 215,991 | $ | 214,924 | $ | 209,633 | $ | 203,780 | ||||||||||
|
|
|
|
|
|
|
|
|
|
|
|||||||||||
| Efficiency ratio (1) |
62.82 | % | 66.94 | % | 65.66 | % | 75.70 | % | 68.38 | % | ||||||||||
|
|
|
|
|
|
|
|
|
|
|
|||||||||||
| Adjusted efficiency ratio (non-GAAP) (1) |
60.52 | % | 64.75 | % | 62.89 | % | 63.38 | % | 65.68 | % | ||||||||||
|
|
|
|
|
|
|
|
|
|
|
|||||||||||
| (1) | Efficiency ratio is noninterest expense as a percent of net interest income (fully taxable equivalent) and noninterest revenues. Adjusted efficiency ratio is noninterest expense before foreclosed property expense, amortization of intangibles and certain adjusting items as a percent of net interest income (fully taxable equivalent) and noninterest revenues, excluding gains and losses from securities transactions and certain adjusting items, and is a non-GAAP measurement. |
| (2) | Effective tax rate of 26.135%. |
Page 12
| Simmons First National Corporation | SFNC | |
| Reconciliation Of Non-GAAP Financial Measures - Quarter-to-Date (continued) |
||
| For the Quarters Ended | ||
| (Unaudited) |
| Jun 30 2025 |
Mar 31 2025 |
Dec 31 2024 |
Sep 30 2024 |
Jun 30 2024 |
||||||||||||||||
| ($ in thousands) | ||||||||||||||||||||
| Calculation of Total Revenue and Adjusted Total Revenue |
||||||||||||||||||||
| Net interest income |
$ | 171,824 | $ | 163,422 | $ | 164,942 | $ | 157,712 | $ | 153,905 | ||||||||||
| Noninterest income |
42,354 | 46,155 | 43,558 | 17,130 | 43,299 | |||||||||||||||
|
|
|
|
|
|
|
|
|
|
|
|||||||||||
| Total revenue |
214,178 | 209,577 | 208,500 | 174,842 | 197,204 | |||||||||||||||
| Certain items, pre-tax (non-GAAP) |
||||||||||||||||||||
| Less: Gain (loss) on sale of securities |
— | — | — | (28,393 | ) | — | ||||||||||||||
|
|
|
|
|
|
|
|
|
|
|
|||||||||||
| Adjusted total revenue |
$ | 214,178 | $ | 209,577 | $ | 208,500 | $ | 203,235 | $ | 197,204 | ||||||||||
|
|
|
|
|
|
|
|
|
|
|
|||||||||||
| Calculation of Pre-Provision Net Revenue (PPNR) |
||||||||||||||||||||
| Net interest income |
$ | 171,824 | $ | 163,422 | $ | 164,942 | $ | 157,712 | $ | 153,905 | ||||||||||
| Noninterest income |
42,354 | 46,155 | 43,558 | 17,130 | 43,299 | |||||||||||||||
|
|
|
|
|
|
|
|
|
|
|
|||||||||||
| Total revenue |
214,178 | 209,577 | 208,500 | 174,842 | 197,204 | |||||||||||||||
| Less: Noninterest expense |
138,589 | 144,580 | 141,117 | 137,193 | 139,354 | |||||||||||||||
|
|
|
|
|
|
|
|
|
|
|
|||||||||||
| Pre-Provision Net Revenue (PPNR) |
$ | 75,589 | $ | 64,997 | $ | 67,383 | $ | 37,649 | $ | 57,850 | ||||||||||
|
|
|
|
|
|
|
|
|
|
|
|||||||||||
| Calculation of Adjusted Pre-Provision Net Revenue |
||||||||||||||||||||
| Pre-Provision Net Revenue (PPNR) |
$ | 75,589 | $ | 64,997 | $ | 67,383 | $ | 37,649 | $ | 57,850 | ||||||||||
| Certain items, pre-tax (non-GAAP) |
||||||||||||||||||||
| Plus: Loss (gain) on sale of securities |
— | — | — | 28,393 | — | |||||||||||||||
| Plus: FDIC Deposit Insurance special assessment |
— | — | — | — | 283 | |||||||||||||||
| Plus: Early retirement program costs |
1,594 | — | 200 | (1 | ) | 118 | ||||||||||||||
| Plus: Termination of vendor and software services |
— | — | — | (13 | ) | 615 | ||||||||||||||
| Plus: Branch right sizing costs (net) |
163 | 994 | 1,581 | 410 | 519 | |||||||||||||||
|
|
|
|
|
|
|
|
|
|
|
|||||||||||
| Adjusted Pre-Provision Net Revenue |
$ | 77,346 | $ | 65,991 | $ | 69,164 | $ | 66,438 | $ | 59,385 | ||||||||||
|
|
|
|
|
|
|
|
|
|
|
|||||||||||
Page 13
| Simmons First National Corporation | SFNC | |
| Reconciliation Of Non-GAAP Financial Measures - Year-to-Date |
||
| For the Quarters Ended | ||
| (Unaudited) |
| Jun 30 2025 |
Mar 31 2025 |
Dec 31 2024 |
Sep 30 2024 |
Jun 30 2024 |
||||||||||||||||
| ($ in thousands) | ||||||||||||||||||||
| Calculation of Adjusted Return on Average Assets |
||||||||||||||||||||
| Net income |
$ | 87,161 | $ | 32,388 | $ | 152,693 | $ | 104,374 | $ | 79,634 | ||||||||||
| Certain items (non-GAAP) |
||||||||||||||||||||
| FDIC Deposit Insurance special assessment |
— | — | 1,832 | 1,832 | 1,832 | |||||||||||||||
| Early retirement program |
1,594 | — | 536 | 336 | 337 | |||||||||||||||
| Termination of vendor and software services |
— | — | 602 | 602 | 615 | |||||||||||||||
| Loss (gain) on sale of securities |
— | — | 28,393 | 28,393 | — | |||||||||||||||
| Branch right sizing (net) |
1,157 | 994 | 2,746 | 1,165 | 755 | |||||||||||||||
| Tax effect of certain items (2) |
(719 | ) | (260 | ) | (8,915 | ) | (8,449 | ) | (925 | ) | ||||||||||
|
|
|
|
|
|
|
|
|
|
|
|||||||||||
| Adjusted earnings (non-GAAP) |
$ | 89,193 | $ | 33,122 | $ | 177,887 | $ | 128,253 | $ | 82,248 | ||||||||||
|
|
|
|
|
|
|
|
|
|
|
|||||||||||
| Average total assets |
$ | 26,661,787 | $ | 26,678,628 | $ | 27,214,647 | $ | 27,260,212 | $ | 27,282,338 | ||||||||||
|
|
|
|
|
|
|
|
|
|
|
|||||||||||
| Return on average assets |
0.66 | % | 0.49 | % | 0.56 | % | 0.51 | % | 0.59 | % | ||||||||||
|
|
|
|
|
|
|
|
|
|
|
|||||||||||
| Adjusted return on average assets (non-GAAP) |
0.67 | % | 0.50 | % | 0.65 | % | 0.63 | % | 0.61 | % | ||||||||||
|
|
|
|
|
|
|
|
|
|
|
|||||||||||
| Calculation of Return on Tangible Common Equity |
||||||||||||||||||||
| Net income available to common stockholders |
$ | 87,161 | $ | 32,388 | $ | 152,693 | $ | 104,374 | $ | 79,634 | ||||||||||
| Amortization of intangibles, net of taxes |
4,894 | 2,605 | 11,377 | 8,534 | 5,689 | |||||||||||||||
|
|
|
|
|
|
|
|
|
|
|
|||||||||||
| Total income available to common stockholders |
$ | 92,055 | $ | 34,993 | $ | 164,070 | $ | 112,908 | $ | 85,323 | ||||||||||
|
|
|
|
|
|
|
|
|
|
|
|||||||||||
| Certain items (non-GAAP) |
||||||||||||||||||||
| FDIC Deposit Insurance special assessment |
$ | — | $ | — | $ | 1,832 | $ | 1,832 | $ | 1,832 | ||||||||||
| Early retirement program |
1,594 | — | 536 | 336 | 337 | |||||||||||||||
| Termination of vendor and software services |
— | — | 602 | 602 | 615 | |||||||||||||||
| Loss (gain) on sale of securities |
— | — | 28,393 | 28,393 | — | |||||||||||||||
| Branch right sizing (net) |
1,157 | 994 | 2,746 | 1,165 | 755 | |||||||||||||||
| Tax effect of certain items (2) |
(719 | ) | (260 | ) | (8,915 | ) | (8,449 | ) | (925 | ) | ||||||||||
|
|
|
|
|
|
|
|
|
|
|
|||||||||||
| Adjusted earnings (non-GAAP) |
89,193 | 33,122 | 177,887 | 128,253 | 82,248 | |||||||||||||||
| Amortization of intangibles, net of taxes |
4,894 | 2,605 | 11,377 | 8,534 | 5,689 | |||||||||||||||
|
|
|
|
|
|
|
|
|
|
|
|||||||||||
| Total adjusted earnings available to common stockholders (non-GAAP) |
$ | 94,087 | $ | 35,727 | $ | 189,264 | $ | 136,787 | $ | 87,937 | ||||||||||
|
|
|
|
|
|
|
|
|
|
|
|||||||||||
| Average common stockholders’ equity |
$ | 3,555,265 | $ | 3,564,469 | $ | 3,486,822 | $ | 3,467,908 | $ | 3,449,089 | ||||||||||
| Average intangible assets: |
||||||||||||||||||||
| Goodwill |
(1,320,799 | ) | (1,320,799 | ) | (1,320,799 | ) | (1,320,799 | ) | (1,320,799 | ) | ||||||||||
| Other intangibles |
(94,100 | ) | (95,787 | ) | (105,239 | ) | (107,197 | ) | (109,098 | ) | ||||||||||
|
|
|
|
|
|
|
|
|
|
|
|||||||||||
| Total average intangibles |
(1,414,899 | ) | (1,416,586 | ) | (1,426,038 | ) | (1,427,996 | ) | (1,429,897 | ) | ||||||||||
|
|
|
|
|
|
|
|
|
|
|
|||||||||||
| Average tangible common stockholders’ equity (non-GAAP) |
$ | 2,140,366 | $ | 2,147,883 | $ | 2,060,784 | $ | 2,039,912 | $ | 2,019,192 | ||||||||||
|
|
|
|
|
|
|
|
|
|
|
|||||||||||
| Return on average common equity |
4.94 | % | 3.69 | % | 4.38 | % | 4.02 | % | 4.64 | % | ||||||||||
|
|
|
|
|
|
|
|
|
|
|
|||||||||||
| Return on tangible common equity |
8.67 | % | 6.61 | % | 7.96 | % | 7.39 | % | 8.50 | % | ||||||||||
|
|
|
|
|
|
|
|
|
|
|
|||||||||||
| Adjusted return on average common equity (non-GAAP) |
5.06 | % | 3.77 | % | 5.10 | % | 4.94 | % | 4.80 | % | ||||||||||
|
|
|
|
|
|
|
|
|
|
|
|||||||||||
| Adjusted return on tangible common equity (non-GAAP) |
8.86 | % | 6.75 | % | 9.18 | % | 8.96 | % | 8.76 | % | ||||||||||
|
|
|
|
|
|
|
|
|
|
|
|||||||||||
| Calculation of Efficiency Ratio and Adjusted Efficiency Ratio (1) |
||||||||||||||||||||
| Noninterest expense (efficiency ratio numerator) |
$ | 283,169 | $ | 144,580 | $ | 557,543 | $ | 416,426 | $ | 279,233 | ||||||||||
| Certain noninterest expense items (non-GAAP) |
||||||||||||||||||||
| Early retirement program |
(1,594 | ) | — | (536 | ) | (336 | ) | (337 | ) | |||||||||||
| FDIC Deposit Insurance special assessment |
— | — | (1,832 | ) | (1,832 | ) | (1,832 | ) | ||||||||||||
| Termination of vendor and software services |
— | — | (602 | ) | (602 | ) | (615 | ) | ||||||||||||
| Branch right sizing expense |
(1,157 | ) | (994 | ) | (2,746 | ) | (1,165 | ) | (755 | ) | ||||||||||
| Other real estate and foreclosure expense adjustment |
(414 | ) | (198 | ) | (700 | ) | (383 | ) | (296 | ) | ||||||||||
| Amortization of intangibles adjustment |
(6,625 | ) | (3,527 | ) | (15,403 | ) | (11,553 | ) | (7,702 | ) | ||||||||||
|
|
|
|
|
|
|
|
|
|
|
|||||||||||
| Adjusted efficiency ratio numerator |
$ | 273,379 | $ | 139,861 | $ | 535,724 | $ | 400,555 | $ | 267,696 | ||||||||||
|
|
|
|
|
|
|
|
|
|
|
|||||||||||
| Net interest income |
$ | 335,246 | $ | 163,422 | $ | 628,465 | $ | 463,523 | $ | 305,811 | ||||||||||
| Noninterest income |
88,509 | 46,155 | 147,171 | 103,613 | 86,483 | |||||||||||||||
| Fully tax-equivalent adjustment (effective tax rate of 26.135%) |
12,836 | 6,414 | 25,820 | 19,396 | 12,998 | |||||||||||||||
|
|
|
|
|
|
|
|
|
|
|
|||||||||||
| Efficiency ratio denominator |
436,591 | 215,991 | 801,456 | 586,532 | 405,292 | |||||||||||||||
| Certain noninterest income items (non-GAAP) |
||||||||||||||||||||
| (Gain) loss on sale of securities |
— | — | 28,393 | 28,393 | — | |||||||||||||||
|
|
|
|
|
|
|
|
|
|
|
|||||||||||
| Adjusted efficiency ratio denominator |
$ | 436,591 | $ | 215,991 | $ | 829,849 | $ | 614,925 | $ | 405,292 | ||||||||||
|
|
|
|
|
|
|
|
|
|
|
|||||||||||
| Efficiency ratio (1) |
64.86 | % | 66.94 | % | 69.57 | % | 71.00 | % | 68.90 | % | ||||||||||
|
|
|
|
|
|
|
|
|
|
|
|||||||||||
| Adjusted efficiency ratio (non-GAAP) (1) |
62.62 | % | 64.75 | % | 64.56 | % | 65.14 | % | 66.05 | % | ||||||||||
|
|
|
|
|
|
|
|
|
|
|
|||||||||||
| (1) | Efficiency ratio is noninterest expense as a percent of net interest income (fully taxable equivalent) and noninterest revenues. Adjusted efficiency ratio is noninterest expense before foreclosed property expense, amortization of intangibles and certain adjusting items as a percent of net interest income (fully taxable equivalent) and noninterest revenues, excluding gains and losses from securities transactions and certain adjusting items, and is a non-GAAP measurement. |
| (2) | Effective tax rate of 26.135%. |
Page 14

Nasdaq SFNC Exhibit 99.2 nd 2 Quarter 2025 Earnings Presentation July 17, 2025
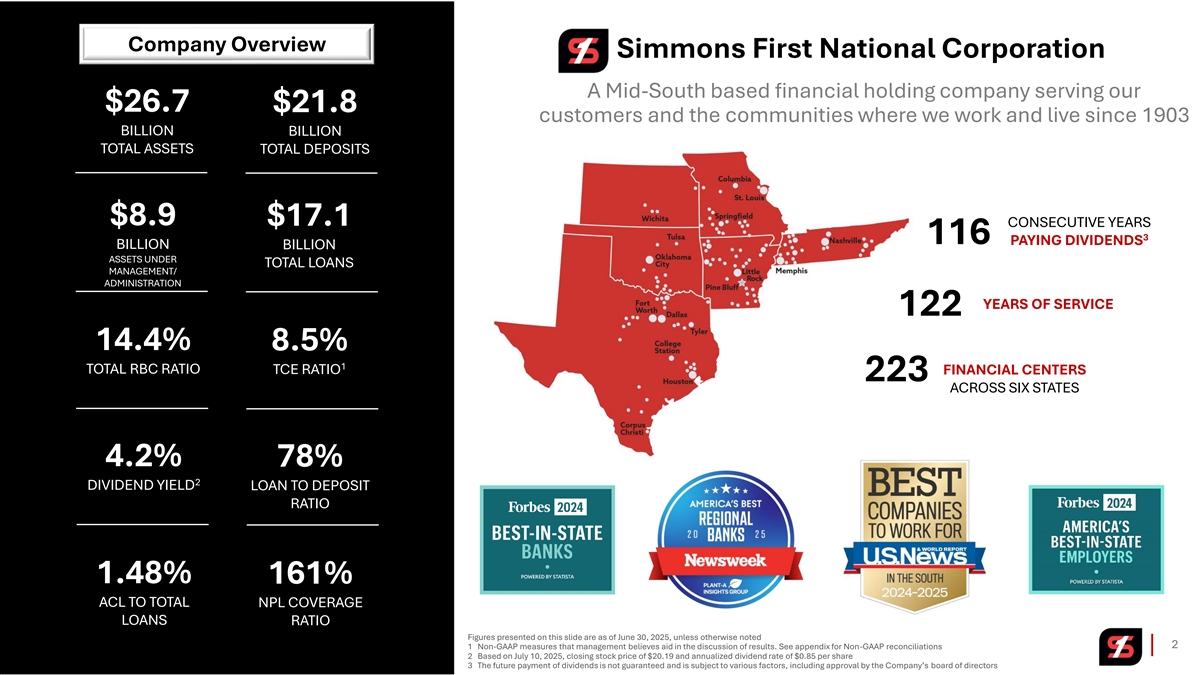
Company Overview Simmons First National Corporation A Mid-South based financial holding company serving our $26.7 $21.8 customers and the communities where we work and live since 1903 BILLION BILLION TOTAL ASSETS TOTAL DEPOSITS $8.9 $17.1 CONSECUTIVE YEARS 3 116 PAYING DIVIDENDS BILLION BILLION ASSETS UNDER TOTAL LOANS MANAGEMENT/ ADMINISTRATION YEARS OF SERVICE 122 14.4% 8.5% 1 TOTAL RBC RATIO TCE RATIO FINANCIAL CENTERS 223 ACROSS SIX STATES 4.2% 78% 2 DIVIDEND YIELD LOAN TO DEPOSIT RATIO 1.48% 161% ACL TO TOTAL NPL COVERAGE LOANS RATIO Figures presented on this slide are as of June 30, 2025, unless otherwise noted 2 1 Non-GAAP measures that management believes aid in the discussion of results. See appendix for Non-GAAP reconciliations 2 Based on July 10, 2025, closing stock price of $20.19 and annualized dividend rate of $0.85 per share 3 The future payment of dividends is not guaranteed and is subject to various factors, including approval by the Company’s board of directors

2Q25 Financial Highlights 3
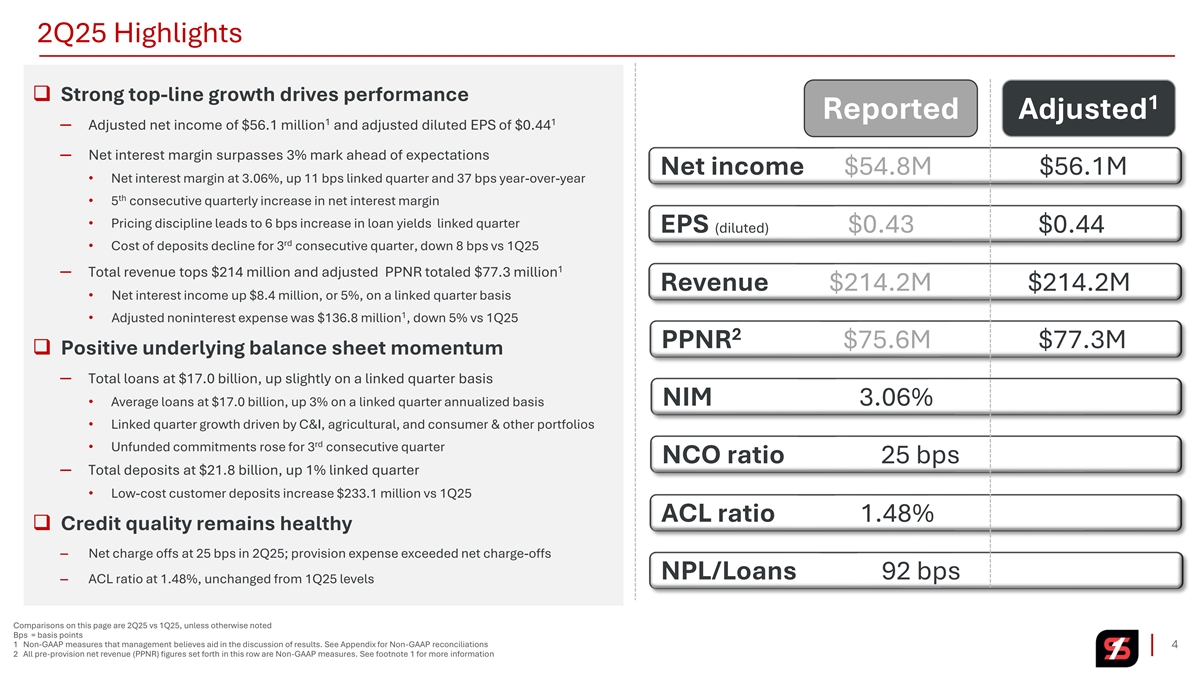
2Q25 Highlights ❑ Strong top-line growth drives performance 1 Reported Adjusted 1 1 ─ Adjusted net income of $56.1 million and adjusted diluted EPS of $0.44 ─ Net interest margin surpasses 3% mark ahead of expectations Net income $54.8M $56.1M • Net interest margin at 3.06%, up 11 bps linked quarter and 37 bps year-over-year th • 5 consecutive quarterly increase in net interest margin • Pricing discipline leads to 6 bps increase in loan yields linked quarter EPS (diluted) $0.43 $0.44 rd • Cost of deposits decline for 3 consecutive quarter, down 8 bps vs 1Q25 1 ─ Total revenue tops $214 million and adjusted PPNR totaled $77.3 million Revenue $214.2M $214.2M • Net interest income up $8.4 million, or 5%, on a linked quarter basis 1 • Adjusted noninterest expense was $136.8 million , down 5% vs 1Q25 2 PPNR $75.6M $77.3M ❑ Positive underlying balance sheet momentum ─ Total loans at $17.0 billion, up slightly on a linked quarter basis • Average loans at $17.0 billion, up 3% on a linked quarter annualized basis NIM 3.06% • Linked quarter growth driven by C&I, agricultural, and consumer & other portfolios rd • Unfunded commitments rose for 3 consecutive quarter NCO ratio 25 bps ─ Total deposits at $21.8 billion, up 1% linked quarter • Low-cost customer deposits increase $233.1 million vs 1Q25 ACL ratio 1.48% ❑ Credit quality remains healthy ‒ Net charge offs at 25 bps in 2Q25; provision expense exceeded net charge-offs NPL/Loans 92 bps ‒ ACL ratio at 1.48%, unchanged from 1Q25 levels Comparisons on this page are 2Q25 vs 1Q25, unless otherwise noted Bps = basis points 1 Non-GAAP measures that management believes aid in the discussion of results. See Appendix for Non-GAAP reconciliations 4 2 All pre-provision net revenue (PPNR) figures set forth in this row are Non-GAAP measures. See footnote 1 for more information
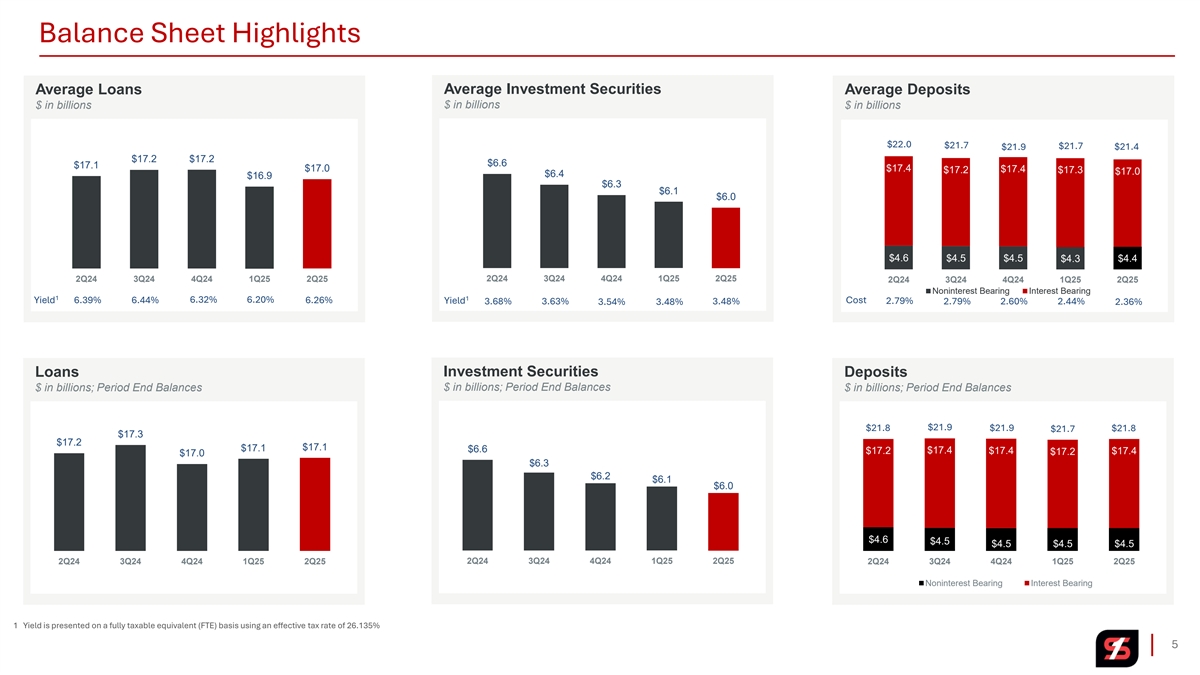
Balance Sheet Highlights Average Investment Securities Average Loans Average Deposits $ in billions $ in billions $ in billions $22.0 $21.7 $21.7 $21.9 $21.4 $17.2 $17.2 $6.6 $17.1 $17.0 $17.4 $17.4 $17.2 $17.3 $17.0 $6.4 $16.9 $6.3 $6.1 $6.0 $4.6 $4.5 $4.5 $4.3 $4.4 2Q24 3Q24 4Q24 1Q25 2Q25 2Q24 3Q24 4Q24 1Q25 2Q25 2Q24 3Q24 4Q24 1Q25 2Q25 Noninterest Bearing Interest Bearing 1 1 6.32% 6.20% Yield 6.39% 6.44% 6.26% Yield Cost 2.79% 3.68% 3.63% 3.54% 3.48% 3.48% 2.79% 2.60% 2.44% 2.36% Investment Securities Loans Deposits $ in billions; Period End Balances $ in billions; Period End Balances $ in billions; Period End Balances $21.9 $21.8 $21.9 $21.8 $21.7 $17.3 $17.2 $17.1 $17.1 $6.6 $17.2 $17.4 $17.4 $17.2 $17.4 $17.0 $6.3 $6.2 $6.1 $6.0 $4.6 $4.5 $4.5 $4.5 $4.5 2Q24 3Q24 4Q24 1Q25 2Q25 2Q24 3Q24 4Q24 1Q25 2Q25 2Q24 3Q24 4Q24 1Q25 2Q25 Noninterest Bearing Interest Bearing 1 Yield is presented on a fully taxable equivalent (FTE) basis using an effective tax rate of 26.135% 5
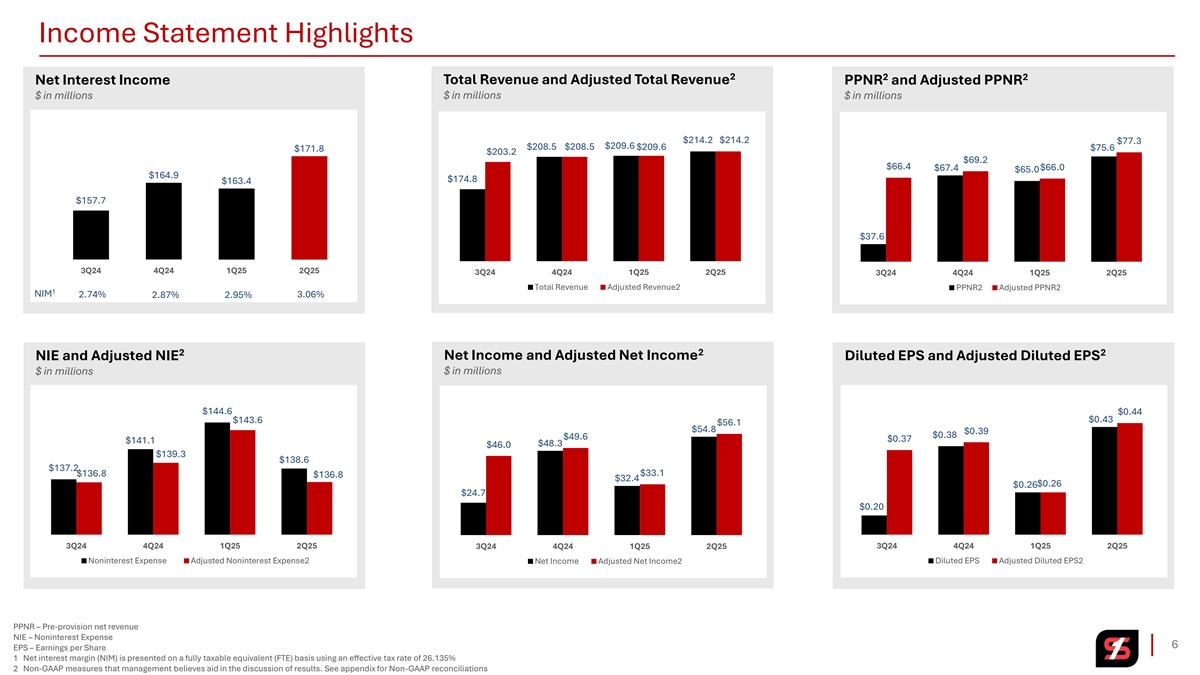
Income Statement Highlights 2 2 2 Net Interest Income Total Revenue and Adjusted Total Revenue PPNR and Adjusted PPNR $ in millions $ in millions $ in millions $214.2 $214.2 $77.3 $209.6 $208.5 $208.5 $209.6 $75.6 $171.8 $203.2 $69.2 $66.4 $66.0 $67.4 $65.0 $164.9 $174.8 $163.4 $157.7 $37.6 3Q24 4Q24 1Q25 2Q25 3Q24 4Q24 1Q25 2Q25 3Q24 4Q24 1Q25 2Q25 Total Revenue Adjusted Revenue2 PPNR2 Adjusted PPNR2 1 NIM 2.74% 3.06% 2.87% 2.95% 2 2 2 NIE and Adjusted NIE Net Income and Adjusted Net Income Diluted EPS and Adjusted Diluted EPS $ in millions $ in millions $144.6 $0.44 $0.43 $143.6 $56.1 $54.8 $0.39 $0.38 $49.6 $0.37 $141.1 $48.3 $46.0 $139.3 $138.6 $137.2 $136.8 $33.1 $136.8 $32.4 $0.26 $0.26 $24.7 $0.20 3Q24 4Q24 1Q25 2Q25 3Q24 4Q24 1Q25 2Q25 3Q24 4Q24 1Q25 2Q25 Noninterest Expense Adjusted Noninterest Expense2 Net Income Adjusted Net Income2 Diluted EPS Adjusted Diluted EPS2 PPNR – Pre-provision net revenue NIE – Noninterest Expense 6 EPS – Earnings per Share 1 Net interest margin (NIM) is presented on a fully taxable equivalent (FTE) basis using an effective tax rate of 26.135% 2 Non-GAAP measures that management believes aid in the discussion of results. See appendix for Non-GAAP reconciliations
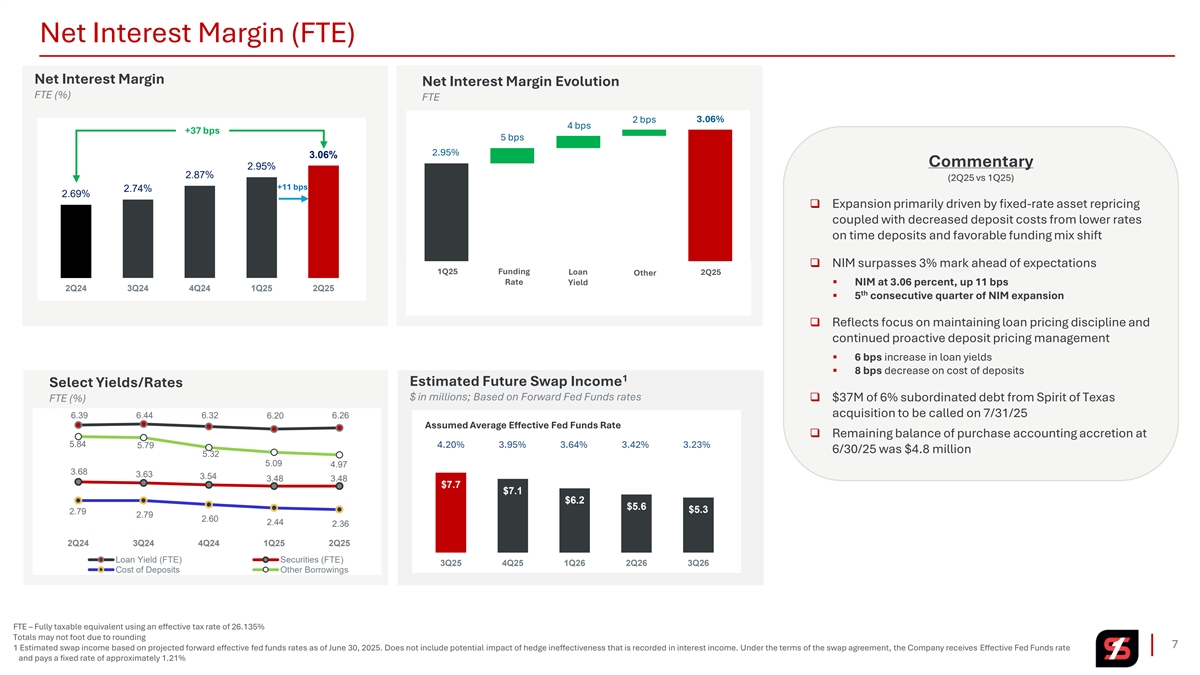
Net Interest Margin (FTE) Net Interest Margin Net Interest Margin Evolution FTE (%) FTE 2 bps 3.06% 4 bps +37 bps 5 bps 2.95% 3.06% Commentary 2.95% 2.87% (2Q25 vs 1Q25) +11 bps 2.74% 2.69% ❑ Expansion primarily driven by fixed-rate asset repricing coupled with decreased deposit costs from lower rates on time deposits and favorable funding mix shift ❑ NIM surpasses 3% mark ahead of expectations 1Q25 Funding Loan 2Q25 Other Rate Yield ▪ NIM at 3.06 percent, up 11 bps 2Q24 3Q24 4Q24 1Q25 2Q25 th ▪ 5 consecutive quarter of NIM expansion ❑ Reflects focus on maintaining loan pricing discipline and continued proactive deposit pricing management ▪ 6 bps increase in loan yields ▪ 8 bps decrease on cost of deposits 1 Estimated Future Swap Income Select Yields/Rates $ in millions; Based on Forward Fed Funds rates ❑ $37M of 6% subordinated debt from Spirit of Texas FTE (%) acquisition to be called on 7/31/25 6.39 6.44 6.32 6.20 6.26 Assumed Average Effective Fed Funds Rate ❑ Remaining balance of purchase accounting accretion at 5.84 4.20% 3.95% 3.64% 3.42% 3.23% 5.79 6/30/25 was $4.8 million 5.32 5.09 4.97 3.68 3.63 3.54 3.48 3.48 $7.7 $7.1 $6.2 $5.6 $5.3 2.79 2.79 2.60 2.44 2.36 2Q24 3Q24 4Q24 1Q25 2Q25 Loan Yield (FTE) Securities (FTE) 3Q25 4Q25 1Q26 2Q26 3Q26 Cost of Deposits Other Borrowings FTE – Fully taxable equivalent using an effective tax rate of 26.135% Totals may not foot due to rounding 7 1 Estimated swap income based on projected forward effective fed funds rates as of June 30, 2025. Does not include potential impact of hedge ineffectiveness that is recorded in interest income. Under the terms of the swap agreement, the Company receives Effective Fed Funds rate and pays a fixed rate of approximately 1.21%
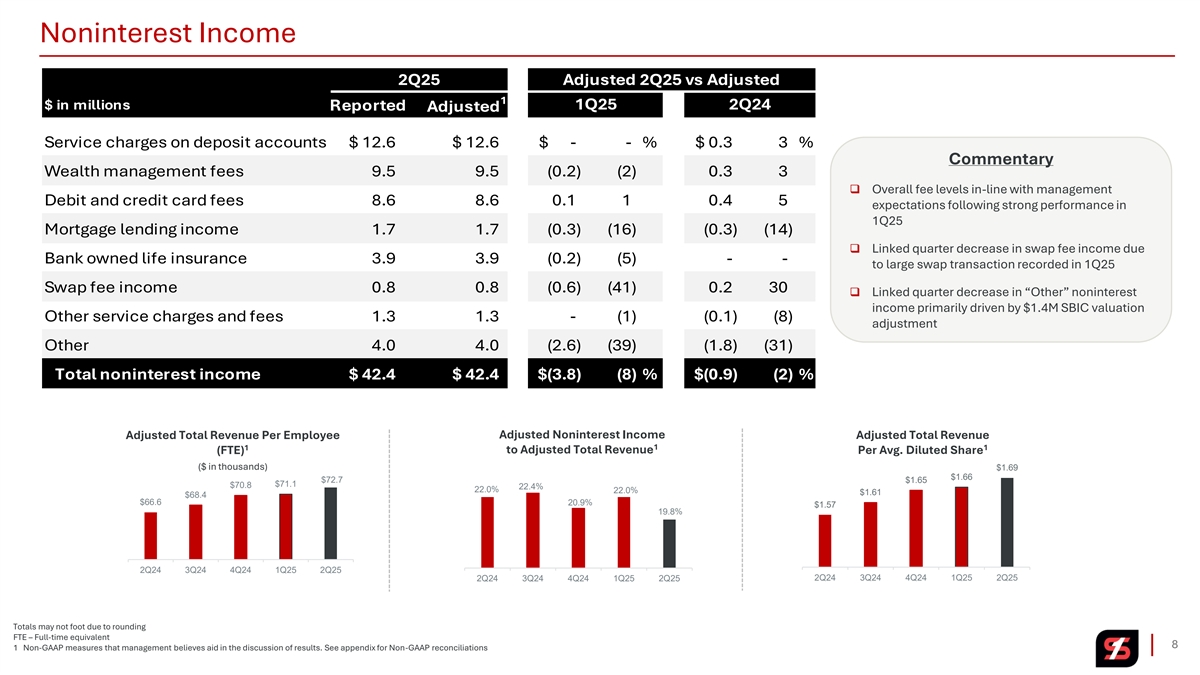
Noninterest Income 2Q25 Adjusted 2Q25 vs Adjusted 1 $ in millions 1Q25 2Q24 Reported Adjusted Service charges on deposit accounts $ 12.6 $ 12.6 $ - - % $ 0.3 3 % Commentary Wealth management fees 9 .5 9.5 ( 0.2) (2) 0.3 3 ❑ Overall fee levels in-line with management Debit and credit card fees 8.6 8.6 0 .1 1 0.4 5 expectations following strong performance in 1Q25 Mortgage lending income 1 .7 1.7 ( 0.3) (16) ( 0.3) (14) ❑ Linked quarter decrease in swap fee income due Bank owned life insurance 3 .9 3.9 ( 0.2) ( 5) - - to large swap transaction recorded in 1Q25 Swap fee income 0.8 0.8 ( 0.6) (41) 0.2 30 ❑ Linked quarter decrease in “Other” noninterest income primarily driven by $1.4M SBIC valuation Other service charges and fees 1 .3 1.3 - (1) (0.1) (8) adjustment Other 4 .0 4.0 (2.6) (39) (1.8) (31) Total noninterest income $ 42.4 $ 42.4 $(3.8) ( 8) % $(0.9) (2) % Adjusted Total Revenue Per Employee Adjusted Noninterest Income Adjusted Total Revenue 1 1 1 (FTE) to Adjusted Total Revenue Per Avg. Diluted Share ($ in thousands) $1.69 $1.66 $72.7 $1.65 $71.1 $70.8 22.4% 22.0% 22.0% $1.61 $68.4 $66.6 20.9% $1.57 19.8% 2Q24 3Q24 4Q24 1Q25 2Q25 2Q24 3Q24 4Q24 1Q25 2Q25 2Q24 3Q24 4Q24 1Q25 2Q25 Totals may not foot due to rounding FTE – Full-time equivalent 8 1 Non-GAAP measures that management believes aid in the discussion of results. See appendix for Non-GAAP reconciliations
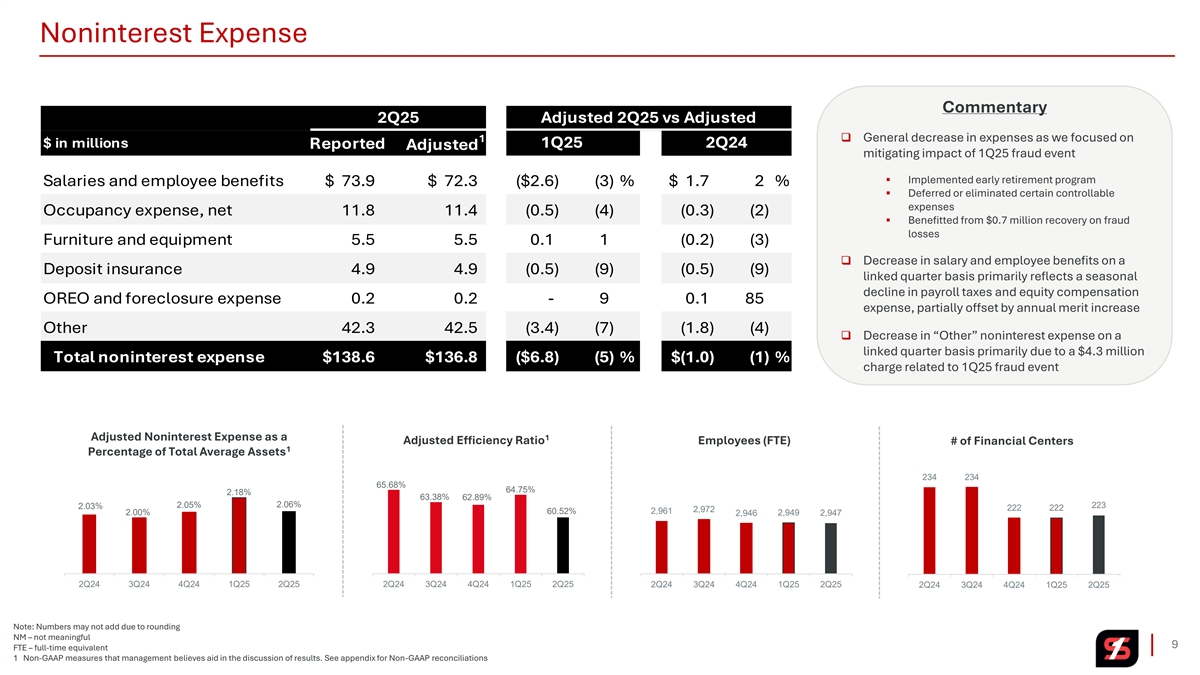
Noninterest Expense Commentary 2Q25 Adjusted 2Q25 vs Adjusted ❑ General decrease in expenses as we focused on 1 $ in millions 1Q25 2Q24 Reported Adjusted mitigating impact of 1Q25 fraud event ▪ Implemented early retirement program Salaries and employee benefits $ 73.9 $ 72.3 ($2.6) (3) % $ 1.7 2 % ▪ Deferred or eliminated certain controllable expenses Occupancy expense, net 11.8 1 1.4 ( 0.5) ( 4) ( 0.3) (2) ▪ Benefitted from $0.7 million recovery on fraud losses Furniture and equipment 5.5 5.5 0.1 1 ( 0.2) (3) ❑ Decrease in salary and employee benefits on a Deposit insurance 4 .9 4.9 ( 0.5) ( 9) ( 0.5) (9) linked quarter basis primarily reflects a seasonal decline in payroll taxes and equity compensation OREO and foreclosure expense 0 .2 0.2 - 9 0.1 85 expense, partially offset by annual merit increase Other 42.3 4 2.5 (3.4) ( 7) ( 1.8) (4) ❑ Decrease in “Other” noninterest expense on a linked quarter basis primarily due to a $4.3 million Total noninterest expense $138.6 $136.8 ($6.8) ( 5) % $(1.0) (1) % charge related to 1Q25 fraud event Adjusted Noninterest Expense as a 1 Adjusted Efficiency Ratio Employees (FTE) # of Financial Centers 1 Percentage of Total Average Assets 234 234 65.68% 64.75% 2.18% 63.38% 62.89% 2.05% 2.06% 2.03% 223 222 222 2,972 60.52% 2,961 2.00% 2,946 2,949 2,947 2Q24 3Q24 4Q24 1Q25 2Q25 2Q24 3Q24 4Q24 1Q25 2Q25 2Q24 3Q24 4Q24 1Q25 2Q25 2Q24 3Q24 4Q24 1Q25 2Q25 Note: Numbers may not add due to rounding NM – not meaningful 9 FTE – full-time equivalent 1 Non-GAAP measures that management believes aid in the discussion of results. See appendix for Non-GAAP reconciliations

Deposits, Securities, Liquidity, Interest Rate Sensitivity and Capital 10
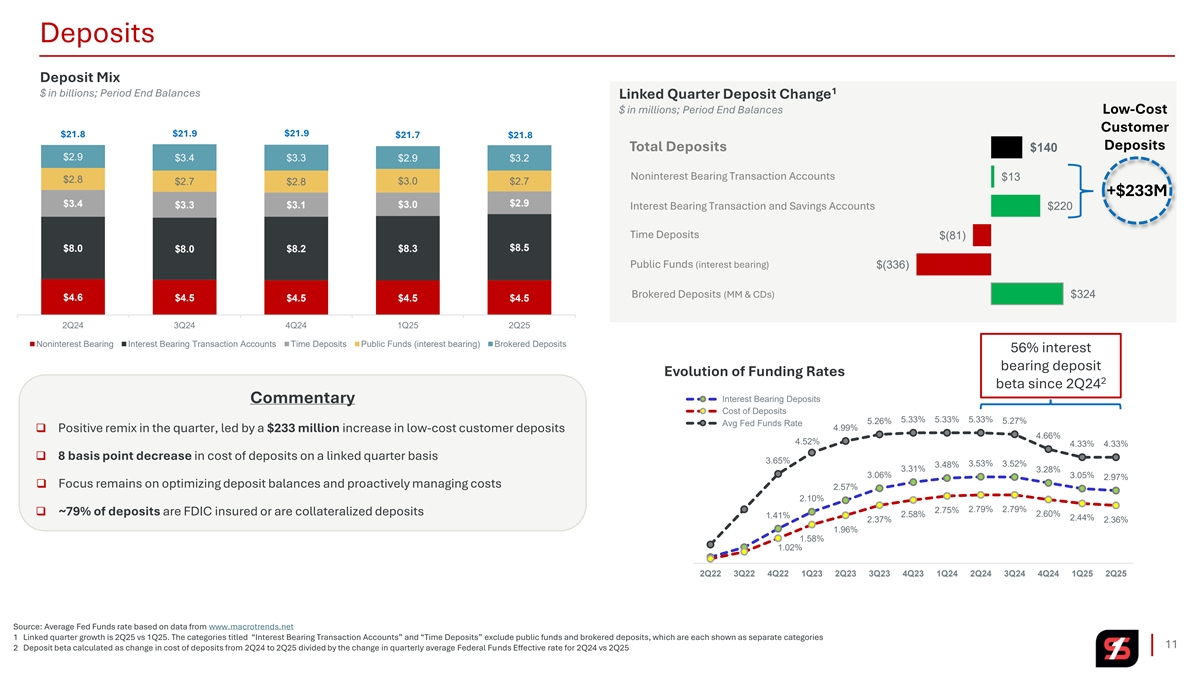
Deposits Deposit Mix 1 $ in billions; Period End Balances Linked Quarter Deposit Change $ in millions; Period End Balances Low-Cost Customer $21.9 $21.9 $21.8 $21.7 $21.8 Deposits Total Deposits $140 $2.9 $3.4 $3.3 $2.9 $3.2 Noninterest Bearing Transaction Accounts $13 $2.8 $2.7 $2.8 $3.0 $2.7 +$233M $2.9 $3.4 $3.3 $3.1 $3.0 Interest Bearing Transaction and Savings Accounts $220 Time Deposits $(81) $8.0 $8.5 $8.0 $8.2 $8.3 Public Funds (interest bearing) $(336) Brokered Deposits (MM & CDs) $324 $4.6 $4.5 $4.5 $4.5 $4.5 2Q24 3Q24 4Q24 1Q25 2Q25 Noninterest Bearing Interest Bearing Transaction Accounts Time Deposits Public Funds (interest bearing) Brokered Deposits 56% interest bearing deposit Evolution of Funding Rates 2 beta since 2Q24 Interest Bearing Deposits Commentary Cost of Deposits 5.33% 5.33% 5.33% 5.26% 5.27% Avg Fed Funds Rate 4.99% ❑ Positive remix in the quarter, led by a $233 million increase in low-cost customer deposits 4.66% 4.52% 4.33% 4.33% ❑ 8 basis point decrease in cost of deposits on a linked quarter basis 3.65% 3.53% 3.52% 3.48% 3.31% 3.28% 3.06% 3.05% 2.97% ❑ Focus remains on optimizing deposit balances and proactively managing costs 2.57% 2.10% 2.79% 2.79% 2.75% ❑ ~79% of deposits are FDIC insured or are collateralized deposits 2.58% 2.60% 1.41% 2.44% 2.37% 2.36% 1.96% 1.58% 1.02% 2Q22 3Q22 4Q22 1Q23 2Q23 3Q23 4Q23 1Q24 2Q24 3Q24 4Q24 1Q25 2Q25 Source: Average Fed Funds rate based on data from www.macrotrends.net 1 Linked quarter growth is 2Q25 vs 1Q25. The categories titled “Interest Bearing Transaction Accounts” and “Time Deposits” exclude public funds and brokered deposits, which are each shown as separate categories 11 2 Deposit beta calculated as change in cost of deposits from 2Q24 to 2Q25 divided by the change in quarterly average Federal Funds Effective rate for 2Q24 vs 2Q25
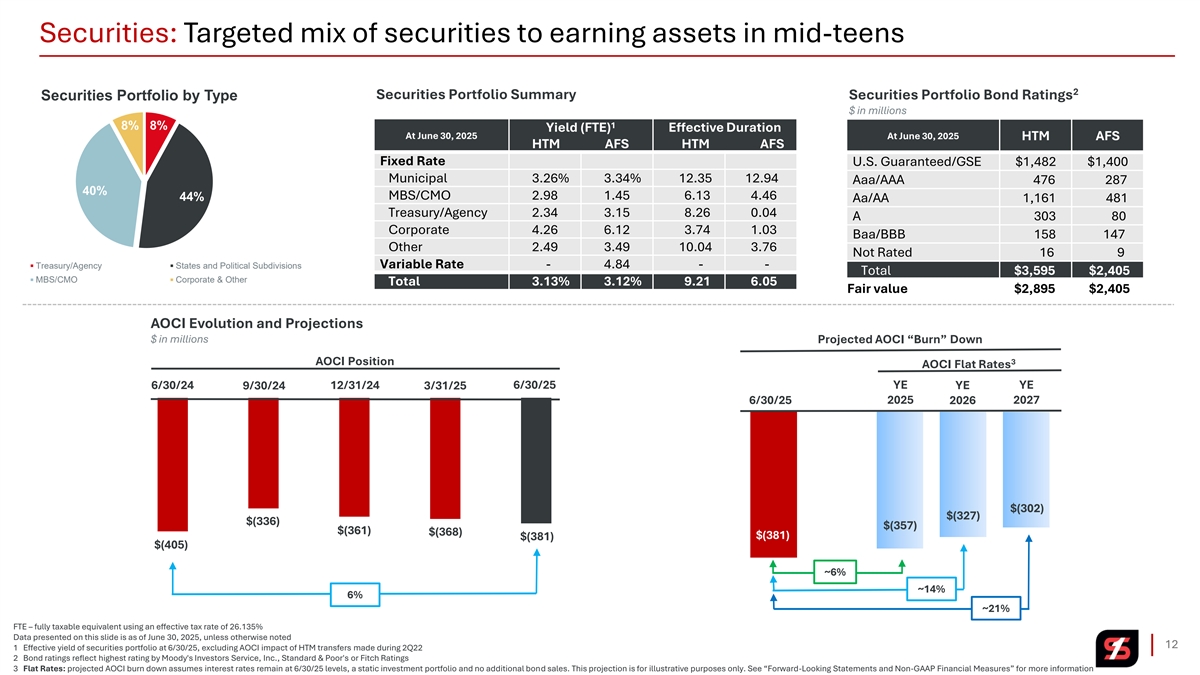
Securities: Targeted mix of securities to earning assets in mid-teens 2 Securities Portfolio Summary Securities Portfolio Bond Ratings Securities Portfolio by Type $ in millions 1 8% 8% Yield (FTE) Effective Duration At June 30, 2025 At June 30, 2025 HTM AFS HTM AFS HTM AFS Fixed Rate U.S. Guaranteed/GSE $1,482 $1,400 Municipal 3.26% 3.34% 12.35 12.94 Aaa/AAA 476 287 40% MBS/CMO 2.98 1.45 6.13 4.46 44% Aa/AA 1,161 481 Treasury/Agency 2.34 3.15 8.26 0.04 A 303 80 Corporate 4.26 6.12 3.74 1.03 Baa/BBB 158 147 Other 2.49 3.49 10.04 3.76 Not Rated 16 9 Treasury/Agency States and Political Subdivisions Variable Rate - 4.84 - - Total $3,595 $2,405 MBS/CMO Corporate & Other Total 3.13% 3.12% 9.21 6.05 Fair value $2,895 $2,405 AOCI Evolution and Projections $ in millions Projected AOCI “Burn” Down AOCI Position 3 AOCI Flat Rates 6/30/24 12/31/24 6/30/25 YE YE 9/30/24 3/31/25 YE 6/30/25 2025 2027 2026 $(302) $(327) $(336) $(357) $(361) $(368) $(381) $(381) $(405) ~6% ~14% 6% ~21% FTE – fully taxable equivalent using an effective tax rate of 26.135% Data presented on this slide is as of June 30, 2025, unless otherwise noted 12 1 Effective yield of securities portfolio at 6/30/25, excluding AOCI impact of HTM transfers made during 2Q22 2 Bond ratings reflect highest rating by Moody's Investors Service, Inc., Standard & Poor's or Fitch Ratings 3 Flat Rates: projected AOCI burn down assumes interest rates remain at 6/30/25 levels, a static investment portfolio and no additional bond sales. This projection is for illustrative purposes only. See “Forward-Looking Statements and Non-GAAP Financial Measures” for more information
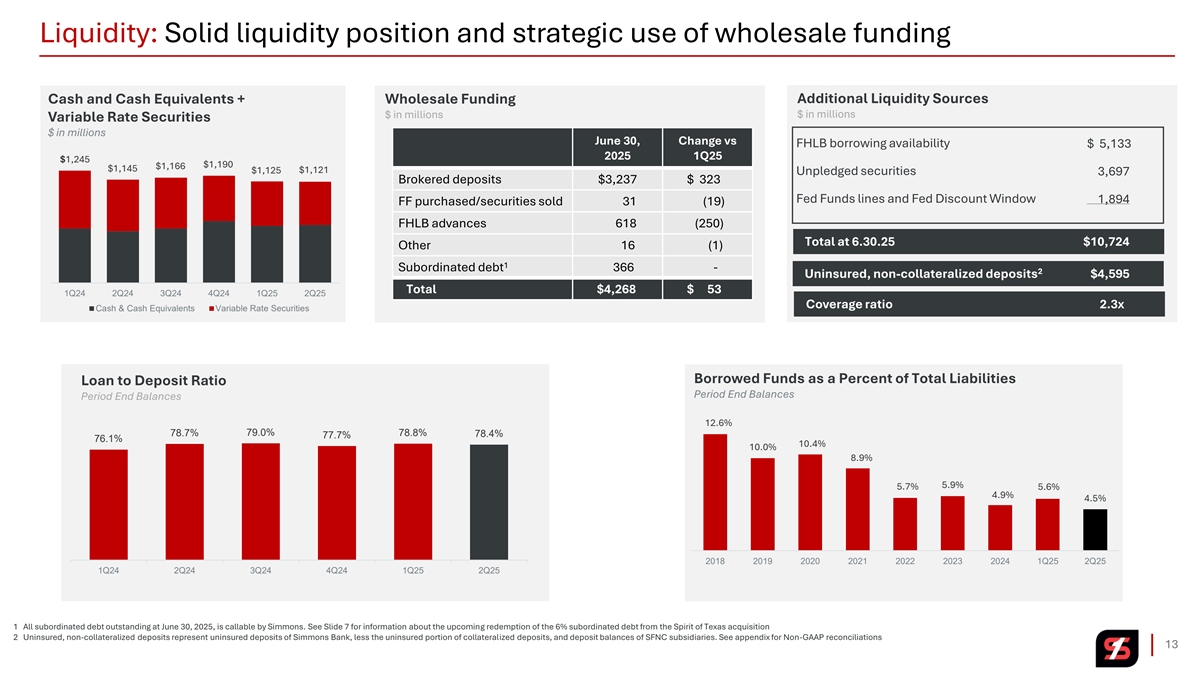
Liquidity: Solid liquidity position and strategic use of wholesale funding Cash and Cash Equivalents + Wholesale Funding Additional Liquidity Sources $ in millions $ in millions Variable Rate Securities $ in millions June 30, Change vs FHLB borrowing availability $ 5,133 2025 1Q25 $1,245 $1,190 $1,166 $1,145 $1,125 $1,121 Unpledged securities 3,697 Brokered deposits $3,237 $ 323 Fed Funds lines and Fed Discount Window 1,894 FF purchased/securities sold 31 (19) FHLB advances 618 (250) Total at 6.30.25 $10,724 Other 16 (1) 1 Subordinated debt 366 - 2 Uninsured, non-collateralized deposits $4,595 Total $4,268 $ 53 1Q24 2Q24 3Q24 4Q24 1Q25 2Q25 Coverage ratio 2.3x Cash & Cash Equivalents Variable Rate Securities Borrowed Funds as a Percent of Total Liabilities Loan to Deposit Ratio Period End Balances Period End Balances 12.6% 78.7% 79.0% 78.8% 78.4% 77.7% 76.1% 10.4% 10.0% 8.9% 5.9% 5.7% 5.6% 4.9% 4.5% 2018 2019 2020 2021 2022 2023 2024 1Q25 2Q25 1Q24 2Q24 3Q24 4Q24 1Q25 2Q25 1 All subordinated debt outstanding at June 30, 2025, is callable by Simmons. See Slide 7 for information about the upcoming redemption of the 6% subordinated debt from the Spirit of Texas acquisition 2 Uninsured, non-collateralized deposits represent uninsured deposits of Simmons Bank, less the uninsured portion of collateralized deposits, and deposit balances of SFNC subsidiaries. See appendix for Non-GAAP reconciliations 13
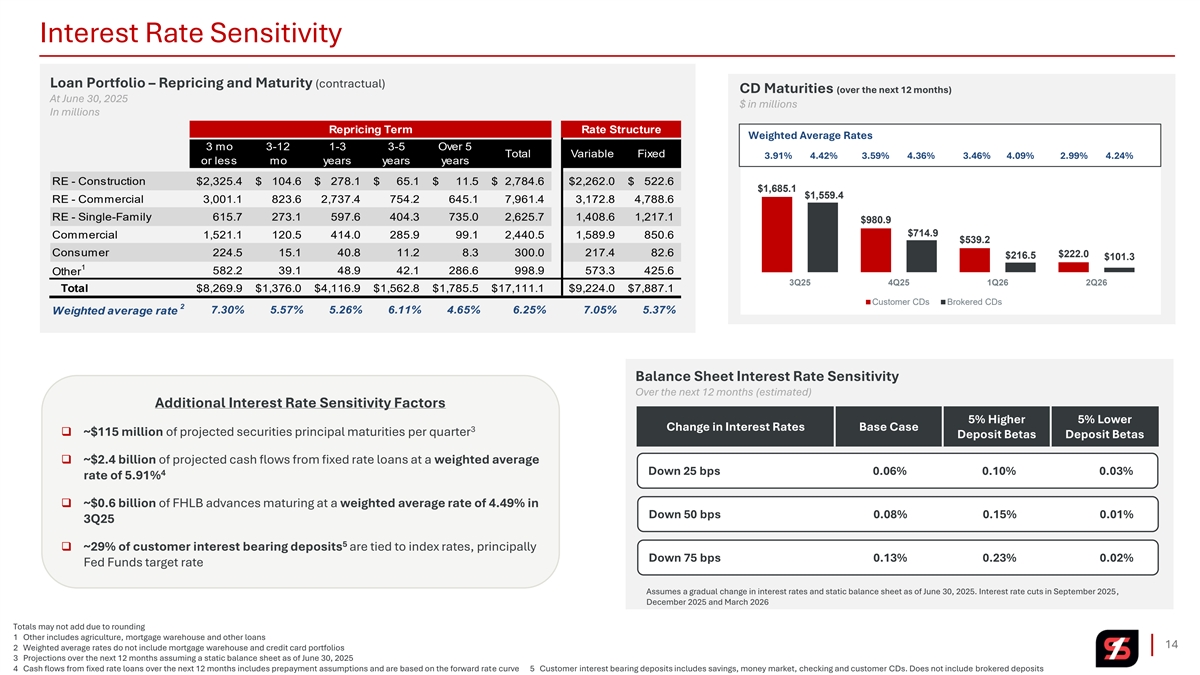
Interest Rate Sensitivity Loan Portfolio – Repricing and Maturity (contractual) CD Maturities (over the next 12 months) At June 30, 2025 $ in millions In millions Repricing Term Rate Structure Weighted Average Rates 3 mo 3-12 1-3 3-5 Over 5 Total Variable Fixed 3.91% 4.42% 3.59% 4.36% 3.46% 4.09% 2.99% 4.24% or less mo years years years RE - Construction $2 ,325.4 $ 104.6 $ 278.1 $ 65.1 $ 11.5 $ 2,784.6 $ 2,262.0 $ 522.6 $1,685.1 $1,559.4 RE - Commercial 3,001.1 823.6 2,737.4 754.2 645.1 7,961.4 3,172.8 4,788.6 RE - Single-Family 615.7 273.1 597.6 404.3 735.0 2,625.7 1,408.6 1,217.1 $980.9 $714.9 Commercial 1,521.1 120.5 414.0 285.9 99.1 2,440.5 1,589.9 850.6 $539.2 Consumer 224.5 1 5.1 40.8 1 1.2 8.3 300.0 217.4 8 2.6 $222.0 $216.5 $101.3 1 Other 582.2 39.1 48.9 42.1 286.6 9 98.9 573.3 425.6 3Q25 4Q25 1Q26 2Q26 Total $ 8,269.9 $1 ,376.0 $ 4,116.9 $ 1,562.8 $1 ,785.5 $ 17,111.1 $ 9,224.0 $7 ,887.1 Customer CDs Brokered CDs 2 7.30% 5.57% 5.26% 6.11% 4.65% 6.25% 7.05% 5.37% Weighted average rate Balance Sheet Interest Rate Sensitivity Over the next 12 months (estimated) Additional Interest Rate Sensitivity Factors 5% Higher 5% Lower Change in Interest Rates Base Case 3 ❑ ~$115 million of projected securities principal maturities per quarter Deposit Betas Deposit Betas ❑ ~$2.4 billion of projected cash flows from fixed rate loans at a weighted average Down 25 bps 0.06% 0.10% 0.03% 4 rate of 5.91% ❑ ~$0.6 billion of FHLB advances maturing at a weighted average rate of 4.49% in Down 50 bps 0.08% 0.15% 0.01% 3Q25 5 ❑ ~29% of customer interest bearing deposits are tied to index rates, principally Down 75 bps 0.13% 0.23% 0.02% Fed Funds target rate Assumes a gradual change in interest rates and static balance sheet as of June 30, 2025. Interest rate cuts in September 2025, December 2025 and March 2026 Totals may not add due to rounding 1 Other includes agriculture, mortgage warehouse and other loans 14 2 Weighted average rates do not include mortgage warehouse and credit card portfolios 3 Projections over the next 12 months assuming a static balance sheet as of June 30, 2025 4 Cash flows from fixed rate loans over the next 12 months includes prepayment assumptions and are based on the forward rate curve 5 Customer interest bearing deposits includes savings, money market, checking and customer CDs. Does not include brokered deposits
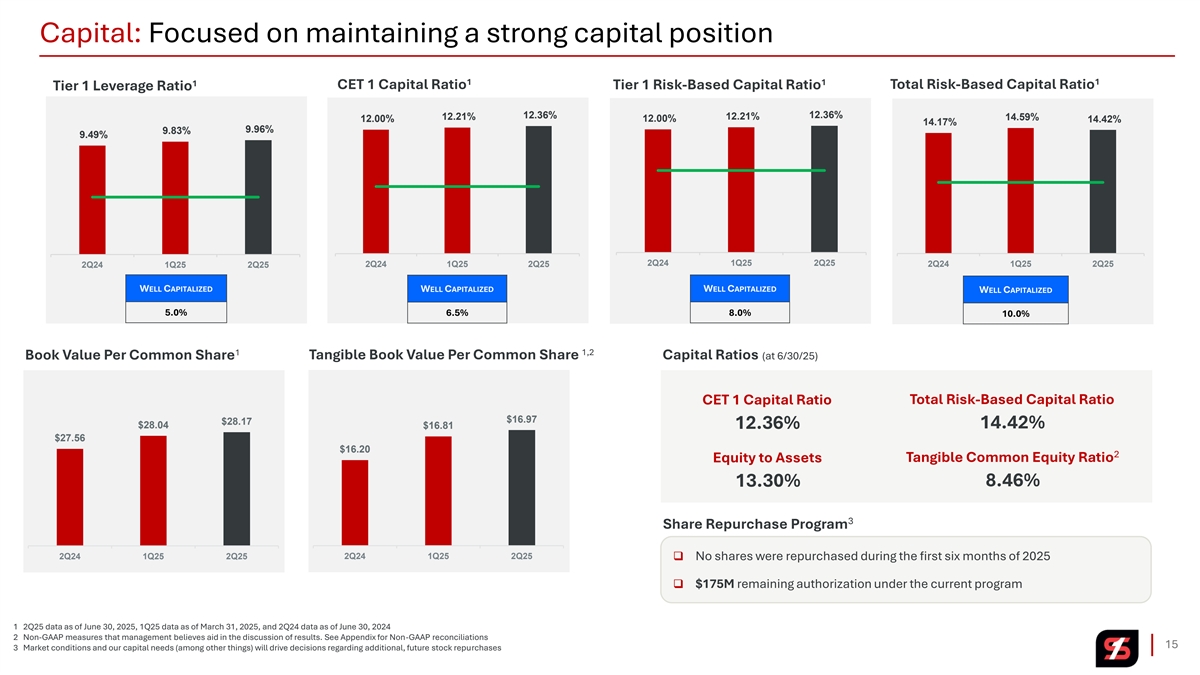
Capital: Focused on maintaining a strong capital position 1 1 1 1 CET 1 Capital Ratio Total Risk-Based Capital Ratio Tier 1 Risk-Based Capital Ratio Tier 1 Leverage Ratio 12.36% 12.36% 12.21% 12.21% 14.59% 12.00% 12.00% 14.42% 14.17% 9.96% 9.83% 9.49% 2Q24 1Q25 2Q25 2Q24 1Q25 2Q25 2Q24 1Q25 2Q25 2Q24 1Q25 2Q25 WELL CAPITALIZED WELL CAPITALIZED WELL CAPITALIZED WELL CAPITALIZED 5.0% 6.5% 8.0% 10.0% 1 1,2 Book Value Per Common Share Tangible Book Value Per Common Share Capital Ratios (at 6/30/25) Total Risk-Based Capital Ratio CET 1 Capital Ratio $16.97 $28.17 $28.04 $16.81 12.36% 14.42% $27.56 $16.20 2 Equity to Assets Tangible Common Equity Ratio 8.46% 13.30% 3 Share Repurchase Program 2Q24 1Q25 2Q25 2Q24 1Q25 2Q25❑ No shares were repurchased during the first six months of 2025 ❑ $175M remaining authorization under the current program 1 2Q25 data as of June 30, 2025, 1Q25 data as of March 31, 2025, and 2Q24 data as of June 30, 2024 2 Non-GAAP measures that management believes aid in the discussion of results. See Appendix for Non-GAAP reconciliations 15 3 Market conditions and our capital needs (among other things) will drive decisions regarding additional, future stock repurchases

Loan Portfolio 16

Loans: Well-diversified, granular portfolio and conservative credit culture Loan Portfolio Waterfall Linked Quarter Change by Loan Type $ in millions $ in millions Total Loans $17 $2,225 RE – Commercial $(90) $17,094 $40 $17,111 RE – Construction $(2,248) $7 1 Funded loans Paydowns/ Other 2 Commercial $77 /advances payoffs RE – Single Family $(21) Consumer & Other $33 Agricultural $68 Mortgage Warehouse $(47) Total loans Total loans 3 Run-Off Portfolio $(10) at 3/31/25 at 6/30/25 Unfunded Commitments $ in millions Commentary RE - Construction Commercial RE - Single Family RE - Commercial Agriculture Consumer/Other ❑ Well-diversified, granular portfolio with no significant industry or geographic concentrations $3,888 $3,947 $3,746 $3,739 $3,681 ❑ Average loans at $17.0 billion, up 3% on a linked quarter annualized basis 94% variable rate ❑ Commercial loan pipeline remains strong and unfunded commitments rose for • 62% tied to Prime 3rd consecutive quarter • 38% tied to SOFR ❑ Minimal exposure to Shared National Credits (SNC) ▪ SNC totaled ~1% of total loans 2Q24 3Q24 4Q24 1Q25 2Q25 ▪ Additional banking relationships with all borrowers 1 “Other” includes linked quarter change associated with loan portfolios impacted by seasonality (agricultural, mortgage warehouse and credit cards) and change in run-off portfolio 2 Commercial loan change excludes the impact of loans included in the run-off portfolio 17 3 “Run-off portfolio” consists of small ticket equipment finance and acquired asset based lending portfolios
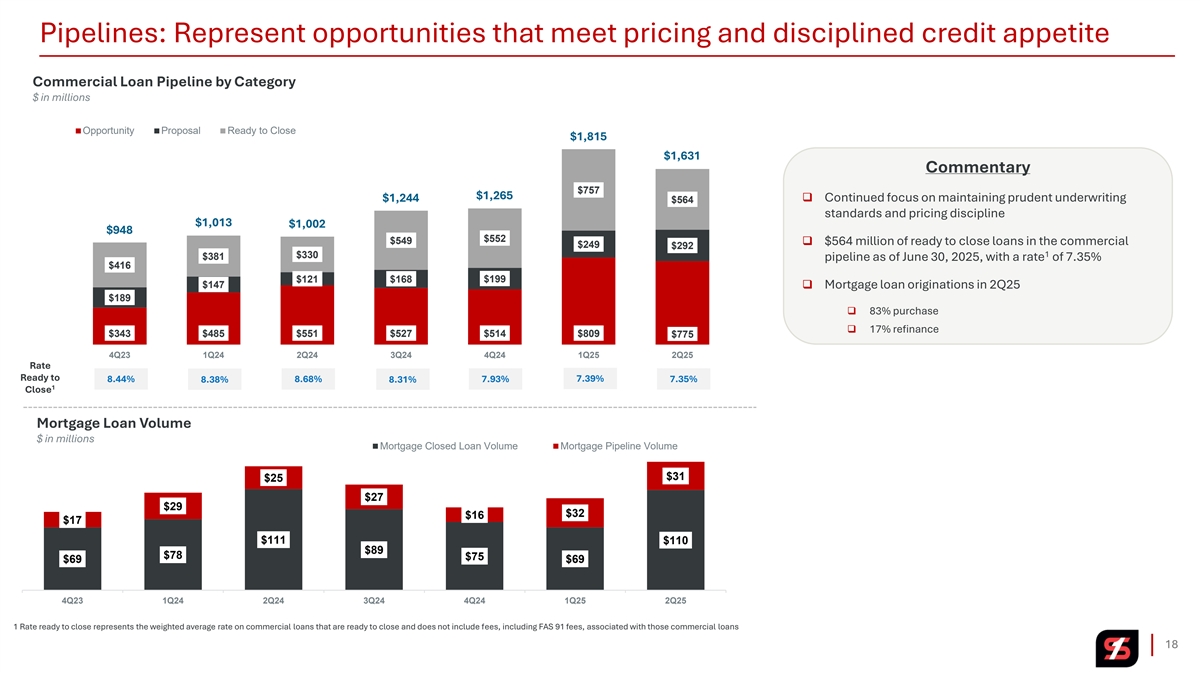
Pipelines: Represent opportunities that meet pricing and disciplined credit appetite Commercial Loan Pipeline by Category $ in millions Opportunity Proposal Ready to Close $1,815 $1,631 Commentary $757 $1,265 ❑ Continued focus on maintaining prudent underwriting $1,244 $564 standards and pricing discipline $1,013 $1,002 $948 $552 $549 ❑ $564 million of ready to close loans in the commercial $249 $292 1 $330 $381 pipeline as of June 30, 2025, with a rate of 7.35% $416 $121 $168 $199 $147 ❑ Mortgage loan originations in 2Q25 $189 ❑ 83% purchase ❑ 17% refinance $343 $485 $551 $527 $514 $809 $775 4Q23 1Q24 2Q24 3Q24 4Q24 1Q25 2Q25 Rate Ready to 8.44% 8.38% 8.68% 8.31% 7.93% 7.39% 7.35% 1 Close Mortgage Loan Volume $ in millions Mortgage Closed Loan Volume Mortgage Pipeline Volume $31 $25 $27 $29 $32 $16 $17 $111 $110 $89 $78 $75 $69 $69 4Q23 1Q24 2Q24 3Q24 4Q24 1Q25 2Q25 1 Rate ready to close represents the weighted average rate on commercial loans that are ready to close and does not include fees, including FAS 91 fees, associated with those commercial loans 18

Loans: Conservative LTVs underpin prudent underwriting standards in key sectors Office (non-owner occupied permanent) Key Statistics At 6/30/25 Loan Portfolio – Geographic diversification By State By State NPL Ratio 0.00% 16% Past Due 30+ Days 0.00% 2% 19% 2% Average Loan Size $2.2M 33% 47% 8% Median Loan Size $0.5M $0.7B 2% Number of Loans <$1M 63% 4% 13% 1 Average LTV 47.3% $16.6B 12% 9% Weighted Average LTV 53.4% Texas Arkansas Tennessee Missouri Oklahoma Kansas Other Multifamily (permanent) Key Statistics At 6/30/25 19% 14% By State 6% NPL Ratio 1.29% 14% Texas Arkansas Tennessee Missouri 37% Past Due 30+ Days 0.24% Oklahoma Kansas Other 5% Average Loan Size $3.0M $0.9B 6% Median Loan Size $0.6M % of Total % of Total Top 10 MSAs Number of Loans <$1M 65% 1 1 Loans Commitments 15% 17% Average LTV 51.4% Dallas-Plano-Irving 9.5% 9.2% Texas Arkansas Tennessee Missouri Oklahoma Kansas Other Weighted Average LTV 62.3% Houston-Sugarland-Baytown 8.9% 8.3% Little Rock-North Little Rock-Conway 5.8% 6.0% Retail (non-owner occupied permanent) Key Statistics At 6/30/25 Nashville-Davidson-Murfreesboro 5.0% 5.9% By State NPL Ratio 0.47% 14% Memphis 5.0% 4.8% 1% Past Due 30+ Days 0.02% Fort Worth-Arlington 4.1% 4.0% 5% 47% Average Loan Size $1.8M Fayetteville-Springdale-Rogers 3.2% 3.1% 8% $0.9B Median Loan Size $0.9M St. Louis 2.7% 2.6% Number of Loans <$1M 51% 11% Kansas City 2.1% 2.4% Average LTV 48.1% Jonesboro 2.1% 2.1% 14% Weighted Average LTV 56.0% Texas Arkansas Tennessee Missouri Oklahoma Kansas Other Data shown above as of June 30, 2025 1 Total loans or commitments excluding credit card portfolio and mortgage warehouse 19
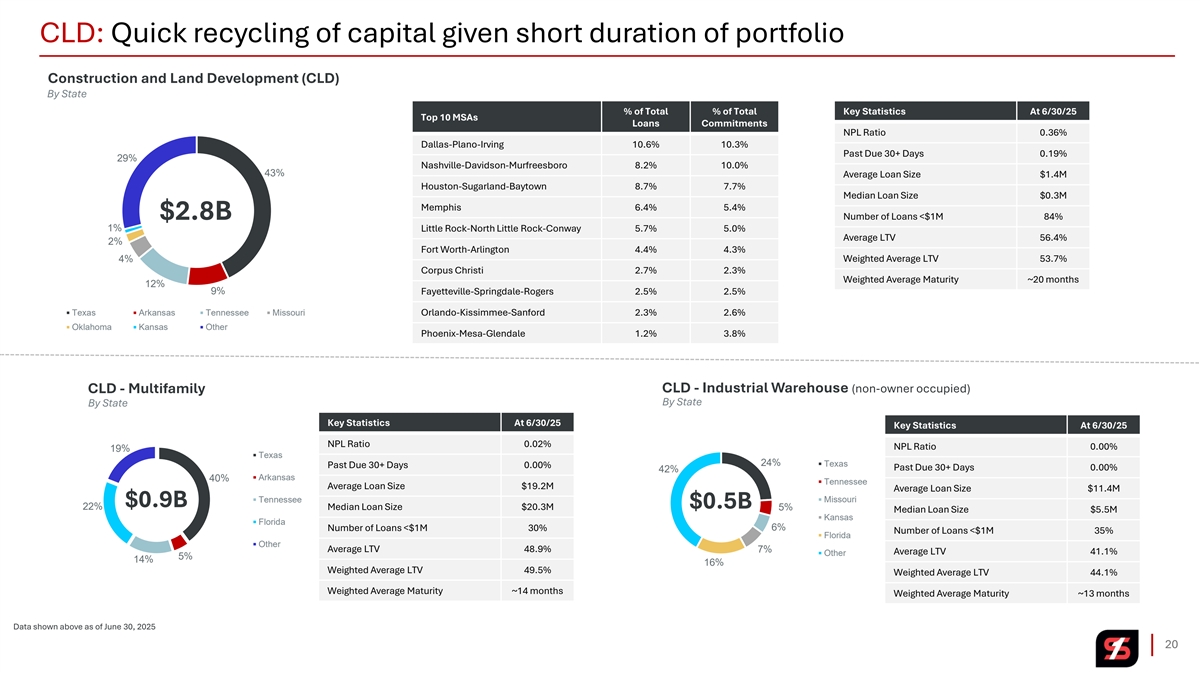
CLD: Quick recycling of capital given short duration of portfolio Construction and Land Development (CLD) By State % of Total % of Total Key Statistics At 6/30/25 Top 10 MSAs Loans Commitments NPL Ratio 0.36% Dallas-Plano-Irving 10.6% 10.3% Past Due 30+ Days 0.19% 29% Nashville-Davidson-Murfreesboro 8.2% 10.0% 43% Average Loan Size $1.4M Houston-Sugarland-Baytown 8.7% 7.7% Median Loan Size $0.3M Memphis 6.4% 5.4% $2.8B Number of Loans <$1M 84% 1% Little Rock-North Little Rock-Conway 5.7% 5.0% Average LTV 56.4% 2% Fort Worth-Arlington 4.4% 4.3% 4% Weighted Average LTV 53.7% Corpus Christi 2.7% 2.3% Weighted Average Maturity ~20 months 12% 9% Fayetteville-Springdale-Rogers 2.5% 2.5% Texas Arkansas Tennessee Missouri Orlando-Kissimmee-Sanford 2.3% 2.6% Oklahoma Kansas Other Phoenix-Mesa-Glendale 1.2% 3.8% CLD - Industrial Warehouse (non-owner occupied) CLD - Multifamily By State By State Key Statistics At 6/30/25 Key Statistics At 6/30/25 NPL Ratio 0.02% NPL Ratio 0.00% 19% Texas 24% Texas Past Due 30+ Days 0.00% Past Due 30+ Days 0.00% 42% Arkansas 40% Tennessee Average Loan Size $19.2M Average Loan Size $11.4M Tennessee Missouri $0.9B $0.5B 22% Median Loan Size $20.3M 5% Median Loan Size $5.5M Kansas Florida Number of Loans <$1M 30% 6% Number of Loans <$1M 35% Florida Other Average LTV 48.9% 7% Average LTV 41.1% Other 5% 14% 16% Weighted Average LTV 49.5% Weighted Average LTV 44.1% Weighted Average Maturity ~14 months Weighted Average Maturity ~13 months Data shown above as of June 30, 2025 20
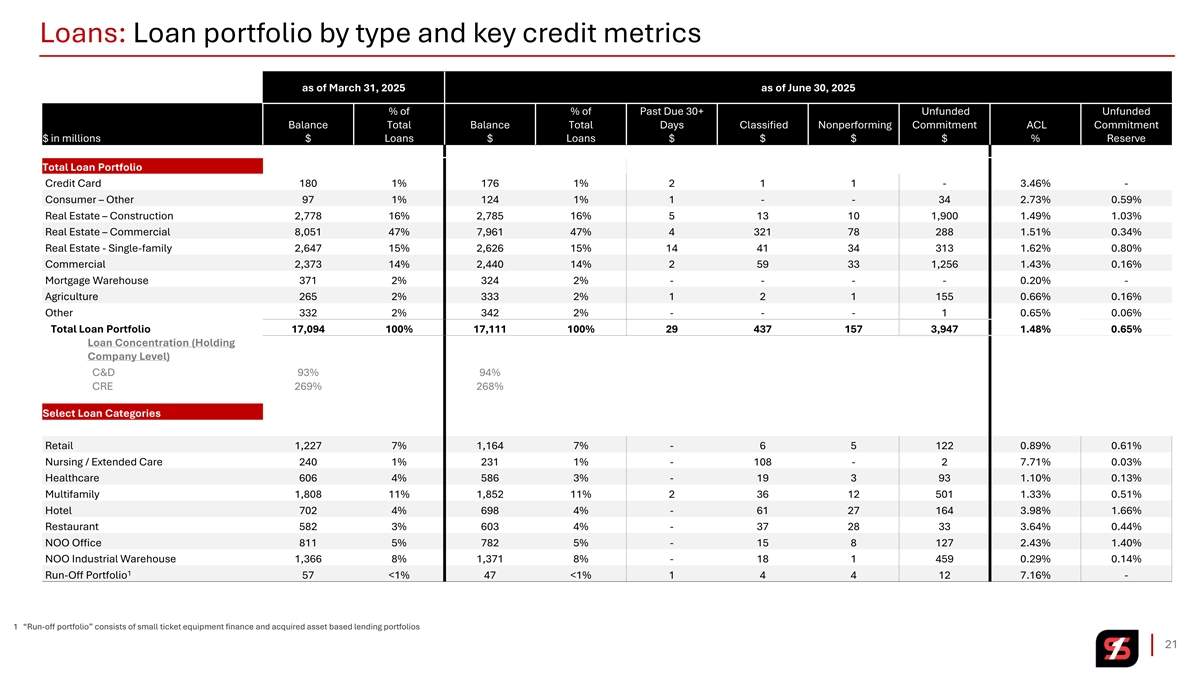
Loans: Loan portfolio by type and key credit metrics as of March 31, 2025 as of June 30, 2025 % of % of Past Due 30+ Unfunded Unfunded Balance Total Balance Total Days Classified Nonperforming Commitment ACL Commitment $ in millions $ Loans $ Loans $ $ $ $ % Reserve Total Loan Portfolio Credit Card 180 1% 176 1% 2 1 1 - 3.46% - Consumer – Other 97 1% 124 1% 1 - - 34 2.73% 0.59% Real Estate – Construction 2,778 16% 2,785 16% 5 13 10 1,900 1.49% 1.03% Real Estate – Commercial 8,051 47% 7,961 47% 4 321 78 288 1.51% 0.34% Real Estate - Single-family 2,647 15% 2,626 15% 14 41 34 313 1.62% 0.80% Commercial 2,373 14% 2,440 14% 2 59 33 1,256 1.43% 0.16% Mortgage Warehouse 371 2% 324 2% - - - - 0.20% - Agriculture 265 2% 333 2% 1 2 1 155 0.66% 0.16% Other 332 2% 342 2% - - - 1 0.65% 0.06% Total Loan Portfolio 17,094 100% 17,111 100% 29 437 157 3,947 1.48% 0.65% Loan Concentration (Holding Company Level) C&D 93% 94% CRE 269% 268% Select Loan Categories Retail 1,227 7% 1,164 7% - 6 5 122 0.89% 0.61% Nursing / Extended Care 240 1% 231 1% - 108 - 2 7.71% 0.03% Healthcare 606 4% 586 3% - 19 3 93 1.10% 0.13% Multifamily 1,808 11% 1,852 11% 2 36 12 501 1.33% 0.51% Hotel 702 4% 698 4% - 61 27 164 3.98% 1.66% Restaurant 582 3% 603 4% - 37 28 33 3.64% 0.44% NOO Office 811 5% 782 5% - 15 8 127 2.43% 1.40% NOO Industrial Warehouse 1,366 8% 1,371 8% - 18 1 459 0.29% 0.14% 1 Run-Off Portfolio 57 <1% 47 <1% 1 4 4 12 7.16% - 1 “Run-off portfolio” consists of small ticket equipment finance and acquired asset based lending portfolios 21

Credit Quality 22
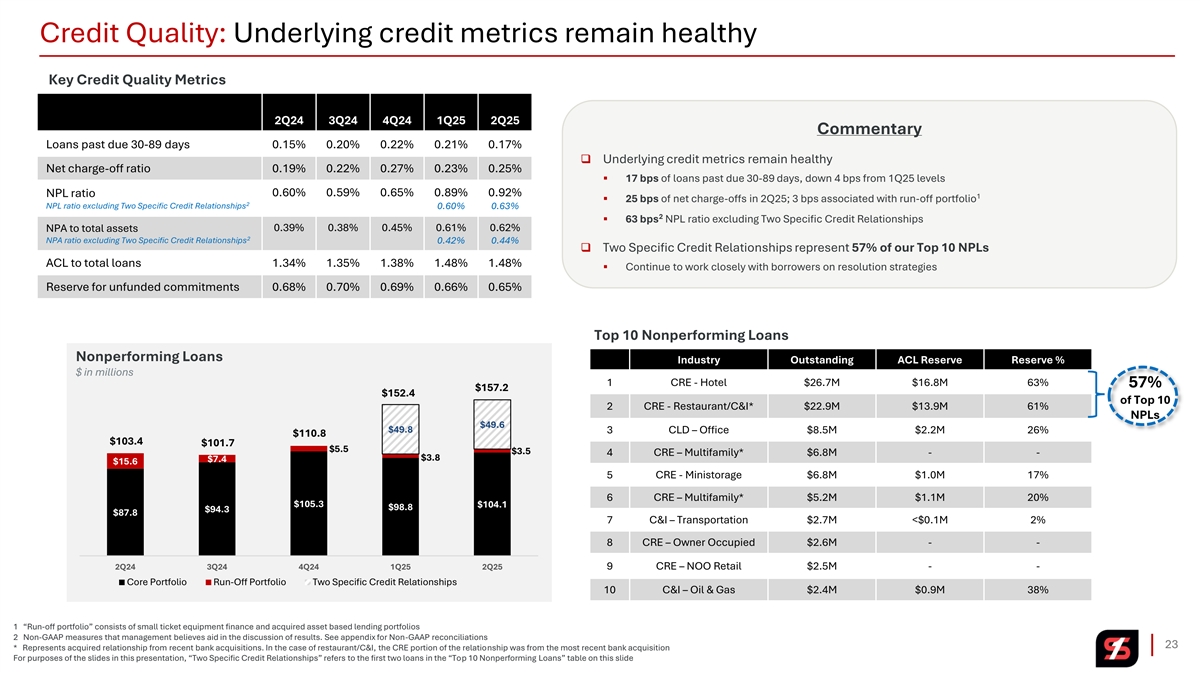
Credit Quality: Underlying credit metrics remain healthy Key Credit Quality Metrics 2Q24 3Q24 4Q24 1Q25 2Q25 Commentary Loans past due 30-89 days 0.15% 0.20% 0.22% 0.21% 0.17% ❑ Underlying credit metrics remain healthy Net charge-off ratio 0.19% 0.22% 0.27% 0.23% 0.25% ▪ 17 bps of loans past due 30-89 days, down 4 bps from 1Q25 levels 0.60% 0.59% 0.65% 0.89% 0.92% NPL ratio 1 ▪ 25 bps of net charge-offs in 2Q25; 3 bps associated with run-off portfolio 2 NPL ratio excluding Two Specific Credit Relationships 0.60% 0.63% 2 ▪ 63 bps NPL ratio excluding Two Specific Credit Relationships 0.39% 0.38% 0.45% 0.61% 0.62% NPA to total assets 2 NPA ratio excluding Two Specific Credit Relationships 0.42% 0.44% ❑ Two Specific Credit Relationships represent 57% of our Top 10 NPLs ACL to total loans 1.34% 1.35% 1.38% 1.48% 1.48% ▪ Continue to work closely with borrowers on resolution strategies Reserve for unfunded commitments 0.68% 0.70% 0.69% 0.66% 0.65% Top 10 Nonperforming Loans Nonperforming Loans Industry Outstanding ACL Reserve Reserve % $ in millions 1 CRE - Hotel $26.7M $16.8M 63% 57% $157.2 $152.4 of Top 10 2 CRE - Restaurant/C&I* $22.9M $13.9M 61% NPLs $49.6 $49.8 3 CLD – Office $8.5M $2.2M 26% $110.8 $103.4 $101.7 $5.5 $3.5 4 CRE – Multifamily* $6.8M - - $3.8 $7.4 $15.6 5 CRE - Ministorage $6.8M $1.0M 17% 6 CRE – Multifamily* $5.2M $1.1M 20% $105.3 $104.1 $98.8 $94.3 $87.8 7 C&I – Transportation $2.7M <$0.1M 2% 8 CRE – Owner Occupied $2.6M - - 2Q24 3Q24 4Q24 1Q25 2Q25 9 CRE – NOO Retail $2.5M - - Core Portfolio Run-Off Portfolio Two Specific Credit Relationships 10 C&I – Oil & Gas $2.4M $0.9M 38% 1 “Run-off portfolio” consists of small ticket equipment finance and acquired asset based lending portfolios 2 Non-GAAP measures that management believes aid in the discussion of results. See appendix for Non-GAAP reconciliations 23 * Represents acquired relationship from recent bank acquisitions. In the case of restaurant/C&I, the CRE portion of the relationship was from the most recent bank acquisition For purposes of the slides in this presentation, “Two Specific Credit Relationships” refers to the first two loans in the “Top 10 Nonperforming Loans” table on this slide
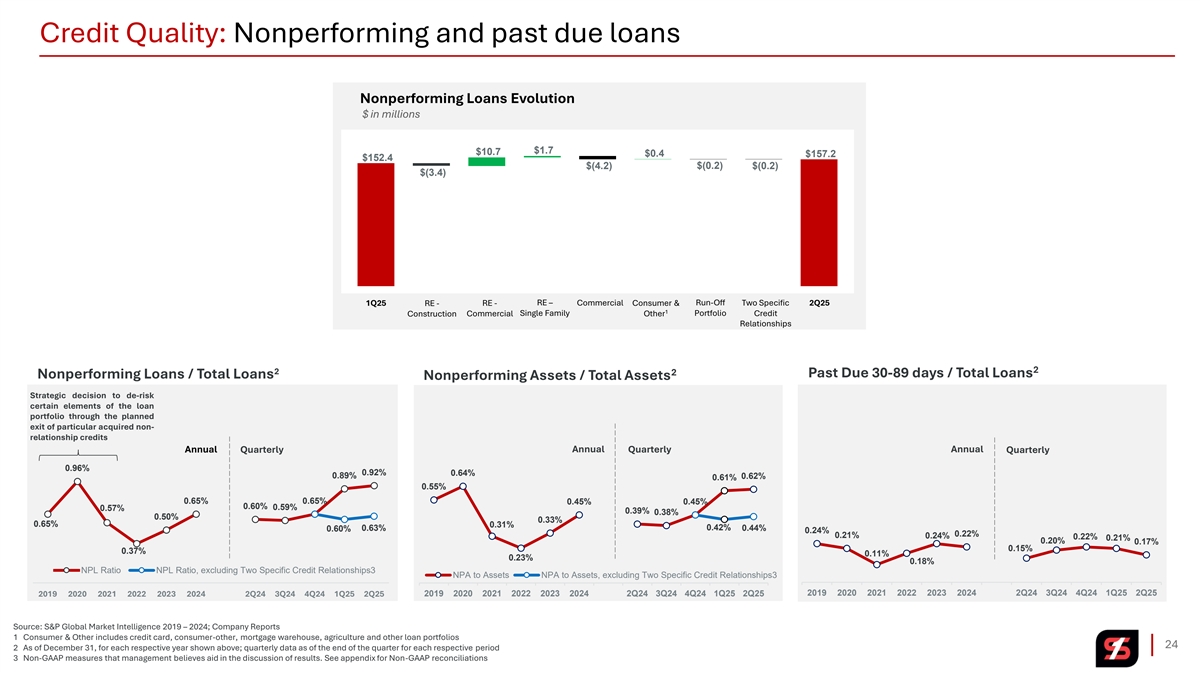
Credit Quality: Nonperforming and past due loans Nonperforming Loans Evolution $ in millions $1.7 $10.7 $0.4 $157.2 $152.4 $(0.2) $(4.2) $(0.2) $(3.4) Run-Off 1Q25 RE - RE - RE – Commercial Consumer & Two Specific 2Q25 1 Construction Commercial Single Family Other Portfolio Credit Relationships 2 2 2 Past Due 30-89 days / Total Loans Nonperforming Loans / Total Loans Nonperforming Assets / Total Assets Strategic decision to de-risk certain elements of the loan portfolio through the planned exit of particular acquired non- relationship credits Annual Quarterly Annual Quarterly Annual Quarterly 0.96% 0.92% 0.64% 0.89% 0.62% 0.61% 0.55% 0.65% 0.65% 0.45% 0.45% 0.60% 0.59% 0.57% 0.39% 0.38% 0.50% 0.33% 0.65% 0.31% 0.42% 0.60% 0.63% 0.44% 0.24% 0.22% 0.21% 0.24% 0.22% 0.21% 0.20% 0.17% 0.15% 0.37% 0.11% 0.23% 0.18% NPL Ratio NPL Ratio, excluding Two Specific Credit Relationships3 NPA to Assets NPA to Assets, excluding Two Specific Credit Relationships3 2019 2020 2021 2022 2023 2024 2Q24 3Q24 4Q24 1Q25 2Q25 2019 2020 2021 2022 2023 2024 2Q24 3Q24 4Q24 1Q25 2Q25 2019 2020 2021 2022 2023 2024 2Q24 3Q24 4Q24 1Q25 2Q25 Source: S&P Global Market Intelligence 2019 – 2024; Company Reports 1 Consumer & Other includes credit card, consumer-other, mortgage warehouse, agriculture and other loan portfolios 24 2 As of December 31, for each respective year shown above; quarterly data as of the end of the quarter for each respective period 3 Non-GAAP measures that management believes aid in the discussion of results. See appendix for Non-GAAP reconciliations
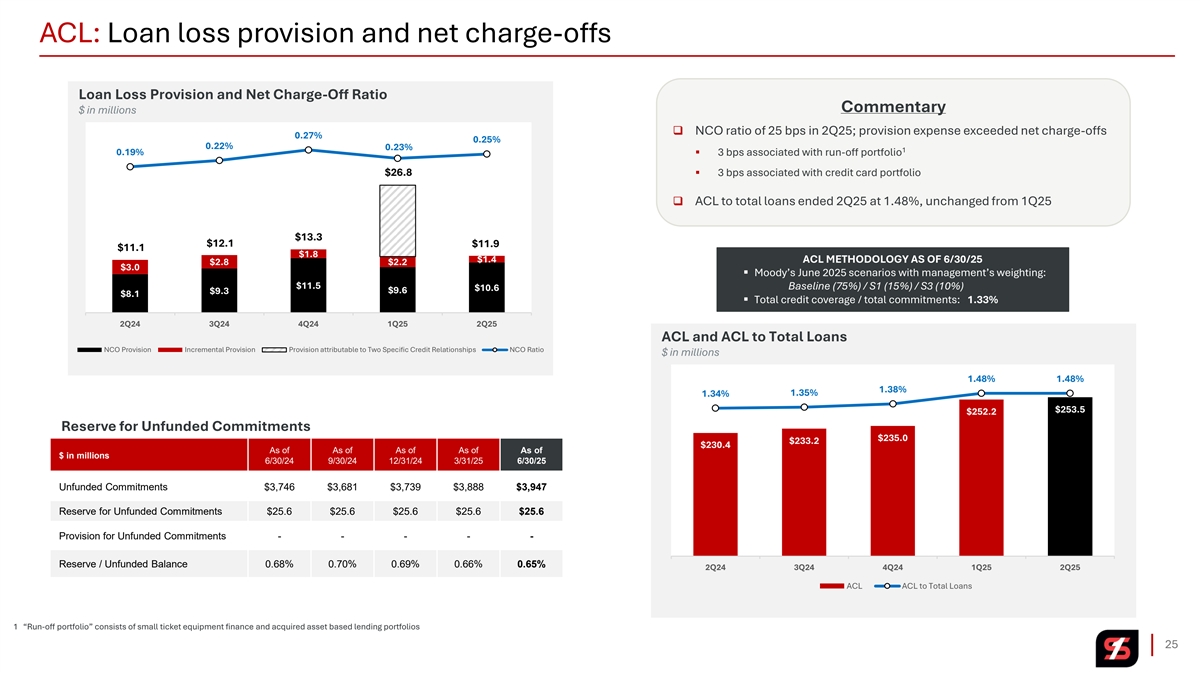
ACL: Loan loss provision and net charge-offs Loan Loss Provision and Net Charge-Off Ratio Commentary $ in millions $40.0 0.40% ❑ NCO ratio of 25 bps in 2Q25; provision expense exceeded net charge-offs 0.27% 0.25% 0.30% $35.0 0.22% 0.23% 1 0.19% ▪ 3 bps associated with run-off portfolio 0.20% $30.0 $26.8▪ 3 bps associated with credit card portfolio 0.10% $25.0 ❑ ACL to total loans ended 2Q25 at 1.48%, unchanged from 1Q25 0.00% $20.0 -0.10% $13.3 $15.0 $12.1 $11.9 $11.1 -0.20% $1.8 $1.4 ACL METHODOLOGY AS OF 6/30/25 $2.8 $2.2 $10.0 $3.0 -0.30% ▪ Moody’s June 2025 scenarios with management’s weighting: $11.5 $5.0 Baseline (75%) / S1 (15%) / S3 (10%) $10.6 $9.3 $9.6 -0.40% $8.1 ▪ Total credit coverage / total commitments: 1.33% $0.0 -0.50% 2Q24 3Q24 4Q24 1Q25 2Q25 ACL and ACL to Total Loans NCO Provision Incremental Provision Provision attributable to Two Specific Credit Relationships NCO Ratio $ in millions $275.0 1.75% 1.48% 1.48% 1.55% 1.38% 1.35% 1.34% $250.0 1.35% $253.5 $252.2 1.15% Reserve for Unfunded Commitments $235.0 $225.0 $233.2 $230.4 0.95% As of As of As of As of As of $ in millions 6/30/24 9/30/24 12/31/24 3/31/25 6/30/25 0.75% $200.0 Unfunded Commitments $3,746 $3,681 $3,739 $3,888 $3,947 0.55% Reserve for Unfunded Commitments $25.6 $25.6 $25.6 $25.6 $25.6 0.35% $175.0 0.15% Provision for Unfunded Commitments - - - - - $150.0 -0.05% Reserve / Unfunded Balance 0.68% 0.70% 0.69% 0.66% 0.65% 2Q24 3Q24 4Q24 1Q25 2Q25 ACL ACL to Total Loans 1 “Run-off portfolio” consists of small ticket equipment finance and acquired asset based lending portfolios 25
Forward-Looking Statements and Non-GAAP Financial Measures Forward-Looking Statements. Certain statements by Simmons First National Corporation (the “Company”, which where appropriate includes the Company’s wholly-owned banking subsidiary, Simmons Bank) contained in this presentation may not be based on historical facts and should be considered forward-looking statements within the meaning of the Private Securities Litigation Reform Act of 1995. These forward-looking statements may be identified by reference to a future period(s) or by the use of forward-looking terminology, such as anticipate, “believe,” “continue,” estimate, expect, foresee,“ “indicate,” “plan,” “potential,” “project,” “target,” may, might, will, would, could,“ “should,” “likely” or intend, future or conditional verb tenses, and variations or negatives of such terms or by similar expressions. These forward-looking statements include, without limitation, statements relating to the Company’s future growth; business strategies; product development; revenue; expenses (including interest expense and non-interest expenses); assets; loan demand (including loan growth, loan capacity, and other lending activity); deposit levels; dividends; asset quality; profitability; earnings; critical accounting policies; accretion; net interest margin; noninterest income; the Company's common stock repurchase program; adequacy of the allowance for credit losses; income tax deductions; credit quality; level of credit losses from lending commitments; net interest revenue; interest rate sensitivity (including, among other things, the potential impact of rising rates); loan loss experience; liquidity; capital resources; future economic conditions and market risk; interest rates; the Company’s securities portfolio, including cash flows and unrealized losses thereon; legal and regulatory limitations and compliance and competition; anticipated loan principal reductions; plans for investments in and cash flows from securities; the estimated annual impact of securities sales; projections regarding loan repricing, securities investments and maturities thereof; the estimates of future swap income set forth on slide 7; the interest rate sensitivity estimates and projections set forth on slide 14; and the AOCI burn down projections set forth on slide 12. Readers are cautioned not to place undue reliance on the forward-looking statements contained in this presentation in that actual results could differ materially from those indicated in or implied by such forward-looking statements due to a variety of factors. These factors include, but are not limited to, changes in the Company's operating or expansion strategy; the availability of and costs associated with obtaining adequate and timely sources of liquidity; changes in credit quality; changes in general market and economic conditions; increased unemployment; labor shortages; possible adverse rulings, judgments, fines, settlements and other outcomes of pending or future litigation; the ability of the Company to collect amounts due under loan agreements; significant increases in nonaccrual loan balances; changes in consumer preferences and loan demand; the effectiveness of the Company's interest rate risk management strategies; laws and regulations affecting financial institutions in general or relating to taxes; the effect of pending or future legislation; changes in governmental administrations; the ability of the Company to repurchase its common stock on favorable terms; the ability of the Company to successfully manage and implement its acquisition strategy and integrate acquired institutions; changes in tariff policies; difficulties and delays in integrating an acquired business or fully realizing cost savings and other benefits of mergers and acquisitions; changes in interest rates, deposit flows, real estate values, and capital markets; increased inflation; customer acceptance of the Company's products and services and changes in customer behaviors; changes or disruptions in technology and IT systems (including cyber or other information technology threats, attacks and events); changes in accounting principles relating to loan loss recognition (current expected credit losses, or CECL); fraud that results in material losses or that we have not discovered yet that may result in material losses; the benefits associated with the Company’s early retirement program; pandemics or significant health hazards, severe weather conditions, natural disasters, terrorist activities, political crises, war, and other military conflicts (including the ongoing military conflicts between Russia and Ukraine and between Israel and Iran) or other major events, or the prospect of these events; increased competition in the markets in which the Company operates and from non-bank financial institutions; changes in governmental policies; loss of key employees; reliance on third parties for key services; the soundness of other financial institutions and any indirect exposure related to the closings of other financial institutions and their impact on the broader market through other customers, suppliers and partners, or that the conditions which resulted in the liquidity concerns experienced by closed financial institutions may also adversely impact, directly or indirectly, other financial institutions and market participants with which the Company has commercial or deposit relationships; increased delinquency and foreclosure rates on commercial real estate and other loans; and other risk factors. Other relevant risk factors are detailed in the Company’s Form 10-K for the year ended December 31, 2024, and other reports that the Company has filed with or furnished to the U.S. Securities and Exchange Commission (the SEC), all of which are available from the SEC on its website, www.sec.gov. In addition, there can be no guarantee that the board of directors (“Board”) of the Company will approve a quarterly dividend in future quarters, and the timing, payment, and amount of future dividends (if any) is subject to, among other things, the discretion of the Board and may differ significantly from past dividends. Any forward-looking statement speaks only as of the date of this presentation, and the Company undertakes no obligation to update these forward-looking statements to reflect events or circumstances that occur after the date of this presentation. Annualized, pro forma, projected and estimated numbers are used for illustrative purpose only, are based on hypothetical assumptions that may not accurately reflect future incomes, are not forecasts and are not guaranteed and may differ significantly from actual results. Non-GAAP Financial Measures. This presentation contains financial information determined by methods other than in accordance with U.S. generally accepted accounting principles (“GAAP”). The Company’s management uses these non-GAAP financial measures in their analysis of the Company’s performance and capital adequacy. These measures adjust GAAP performance measures to, among other things, include the tax benefit associated with revenue items that are tax-exempt, as well as exclude from net income (including on a per share diluted basis), pre-tax, pre-provision earnings, net charge-offs, income available to common shareholders, non-interest income, and non-interest expense certain income and expense items attributable to, for example, merger activity (primarily including merger-related expenses), gains and/or losses on sale of branches, net branch right-sizing initiatives, early retirement program, termination of vendor and software services, FDIC special assessment charges and expenses related to the fraud event reported in the first quarter of 2025. In addition, the Company also presents certain figures based on tangible common stockholders’ equity, tangible assets and tangible book value, which exclude goodwill and other intangible assets, and presents certain other figures to include the effect that accumulated other comprehensive income could have on the Company’s capital levels. The Company further presents certain figures that are exclusive of the impact of deposits and/or loans acquired through acquisitions, mortgage warehouse loans, and/or energy loans, gains and/or losses on the sale of securities, or the Two Specific Credit Relationships. The Company’s management believes that these non-GAAP financial measures are useful to investors because they, among other things, present the results of the Company’s ongoing operations without the effect of mergers or other items not central to the Company’s ongoing business, present the Company’s capital inclusive of the potential impact of AOCI (primarily comprised of unrealized losses on securities), as well as normalize for tax effects and certain other effects. Management, therefore, believes presentations of these non-GAAP financial measures provide useful supplemental information that is essential to a proper understanding of the operating results of the Company’s ongoing businesses, and management uses these non-GAAP financial measures to assess the performance of the Company’s ongoing businesses as related to prior financial periods. These non-GAAP disclosures should not be viewed as a substitute for operating results determined in accordance with GAAP, nor are they necessarily comparable to non-GAAP performance measures that may be presented by other companies. Where non-GAAP financial measures are used, the comparable GAAP financial measure, as well as the reconciliation to the comparable GAAP financial measure, can be found in the appendix to this presentation. 26
Appendix 27
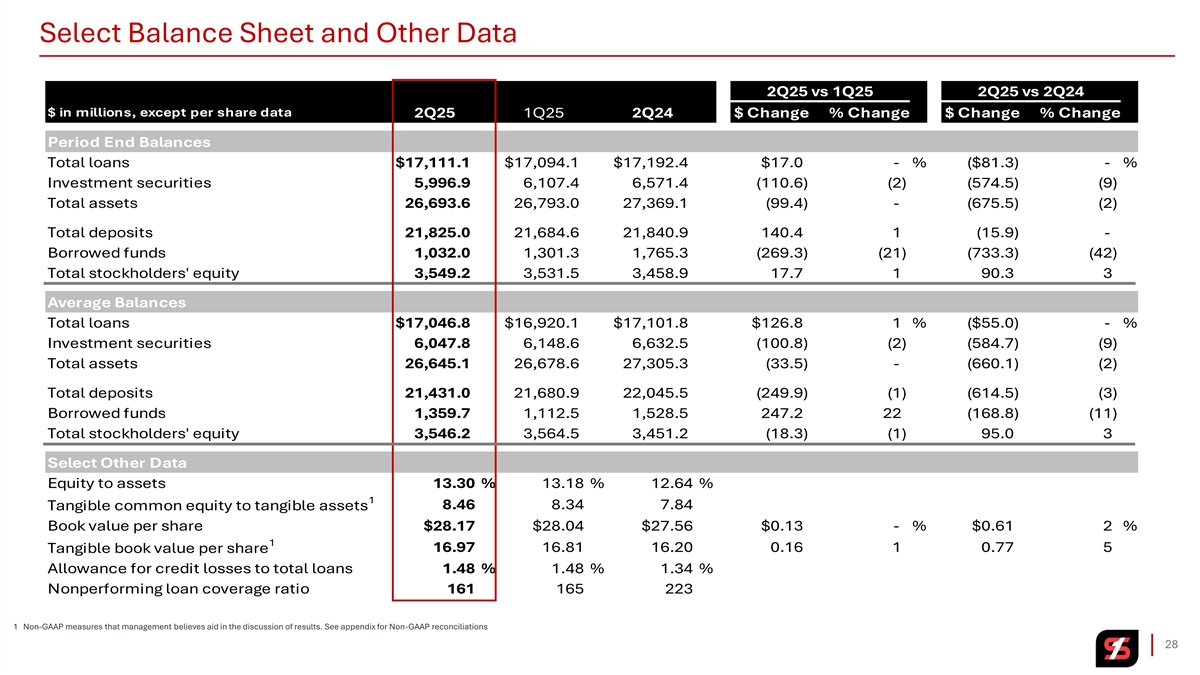
Select Balance Sheet and Other Data 2Q25 vs 1Q25 2Q25 vs 2Q24 $ in millions, except per share data 2Q25 1Q25 2Q24 $ Change % Change $ Change % Change Period End Balances Total loans $17,111.1 $17,094.1 $17,192.4 $17.0 - % ($81.3) - % Investment securities 5,996.9 6,107.4 6,571.4 ( 110.6) (2) (574.5) (9) Total assets 26 ,693.6 26 ,793.0 27 ,369.1 ( 99.4) - (675.5) (2) Total deposits 21 ,825.0 21 ,684.6 21 ,840.9 14 0.4 1 (15.9) - Borrowed funds 1,032.0 1,301.3 1,765.3 (269.3) (21) (733.3) (42) Total stockholders' equity 3,549.2 3,531.5 3,458.9 17.7 1 90.3 3 Average Balances Total loans $17,046.8 $16,920.1 $17,101.8 $126.8 1 % ($55.0) - % Investment securities 6,047.8 6,148.6 6,632.5 (100.8) (2) (584.7) (9) Total assets 26 ,645.1 26 ,678.6 27,305.3 ( 33.5) - (660.1) (2) Total deposits 21 ,431.0 21,680.9 22 ,045.5 ( 249.9) (1) ( 614.5) (3) Borrowed funds 1,359.7 1,112.5 1,528.5 24 7.2 22 (168.8) (11) Total stockholders' equity 3,546.2 3,564.5 3,451.2 (18.3) (1) 95 .0 3 Select Other Data Equity to assets 13.30 % 13.18 % 12.64 % 1 Tangible common equity to tangible assets 8.46 8.34 7.84 Book value per share $28.17 $28.04 $27.56 $0.13 - % $0.61 2 % 1 16.97 16.81 16.20 0. 16 1 0. 77 5 Tangible book value per share Allowance for credit losses to total loans 1.48 % 1.48 % 1.34 % Nonperforming loan coverage ratio 161 165 223 1 Non-GAAP measures that management believes aid in the discussion of results. See appendix for Non-GAAP reconciliations 28
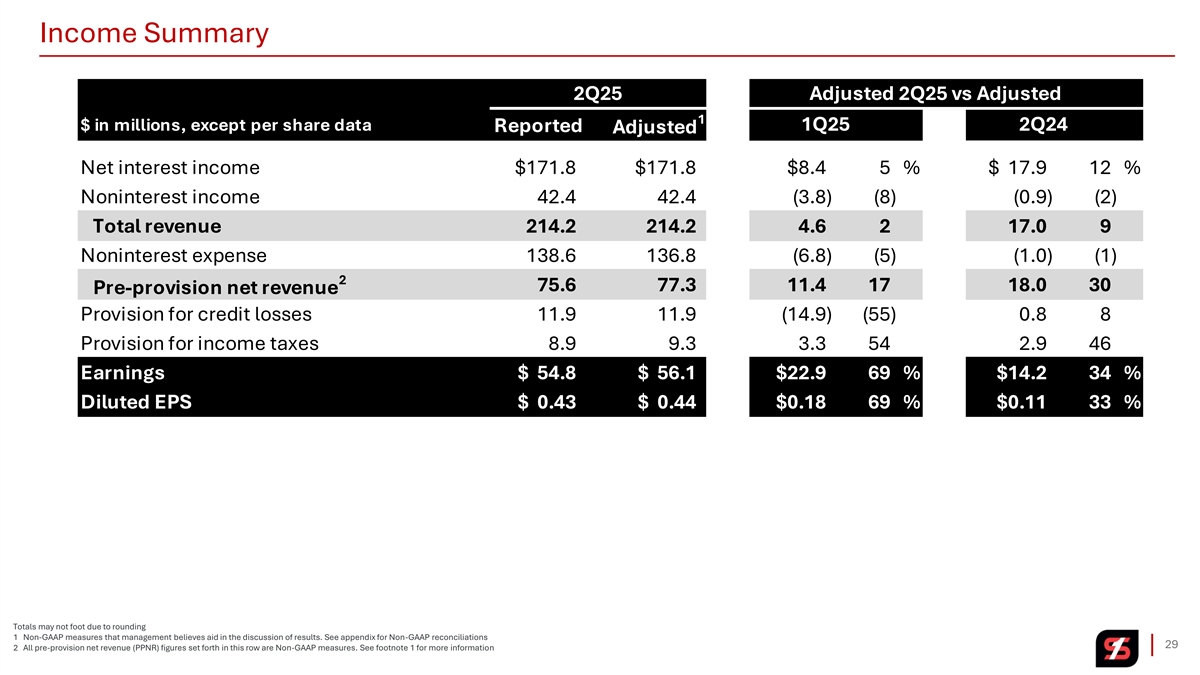
Income Summary 2Q25 Adjusted 2Q25 vs Adjusted 1 $ in millions, except per share data 1Q25 2Q24 Reported Adjusted Net interest income $171.8 $171.8 $8.4 5 % $ 17.9 12 % Noninterest income 4 2.4 4 2.4 (3.8) (8) (0.9) (2) Total revenue 214.2 214.2 4.6 2 17.0 9 Noninterest expense 138.6 136.8 (6.8) (5) (1.0) (1) 2 7 5.6 7 7.3 11.4 17 18.0 30 Pre-provision net revenue Provision for credit losses 1 1.9 11.9 (14.9) (55) 0.8 8 Provision for income taxes 8.9 9.3 3.3 54 2.9 46 Earnings $ 54.8 $ 56.1 $22.9 69 % $14.2 34 % Diluted EPS $ 0.43 $ 0.44 $0.18 69 % $0.11 33 % Totals may not foot due to rounding 1 Non-GAAP measures that management believes aid in the discussion of results. See appendix for Non-GAAP reconciliations 29 2 All pre-provision net revenue (PPNR) figures set forth in this row are Non-GAAP measures. See footnote 1 for more information
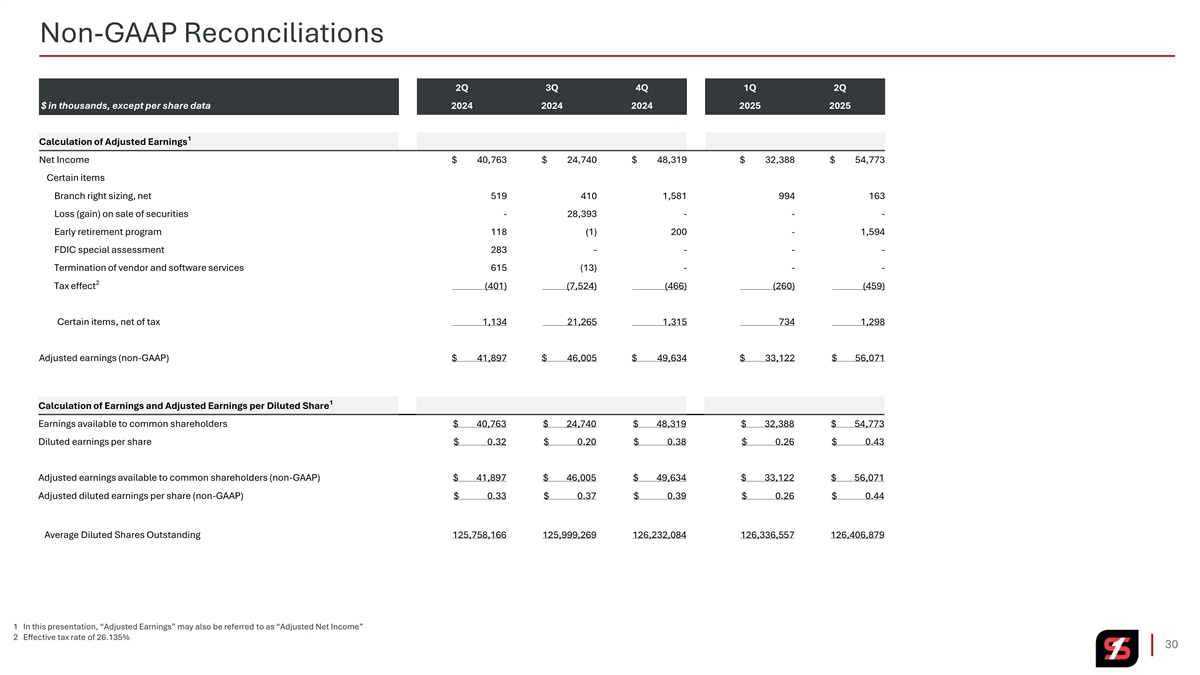
Non-GAAP Reconciliations 2Q 3Q 4Q 1Q 2Q $ in thousands, except per share data 2024 2024 2024 2025 2025 1 Calculation of Adjusted Earnings Net Income $ 40,763 $ 24,740 $ 48,319 $ 32,388 $ 54,773 Certain items Branch right sizing, net 519 410 1,581 994 163 Loss (gain) on sale of securities - 28,393 - - - Early retirement program 118 (1) 200 - 1,594 FDIC special assessment 283 - - - - Termination of vendor and software services 615 (13) - - - 2 Tax effect (401) (7,524) (466) (260) (459) Certain items, net of tax 1,134 21,265 1,315 734 1,298 Adjusted earnings (non-GAAP) $ 41,897 $ 46,005 $ 49,634 $ 33,122 $ 56,071 1 Calculation of Earnings and Adjusted Earnings per Diluted Share Earnings available to common shareholders $ 40,763 $ 24,740 $ 48,319 $ 32,388 $ 54,773 Diluted earnings per share $ 0.32 $ 0.20 $ 0.38 $ 0.26 $ 0.43 Adjusted earnings available to common shareholders (non-GAAP) $ 41,897 $ 46,005 $ 49,634 $ 33,122 $ 56,071 Adjusted diluted earnings per share (non-GAAP) $ 0.33 $ 0.37 $ 0.39 $ 0.26 $ 0.44 Average Diluted Shares Outstanding 125,758,166 125,999,269 126,232,084 126,336,557 126,406,879 1 In this presentation, “Adjusted Earnings” may also be referred to as “Adjusted Net Income” 2 Effective tax rate of 26.135% 30
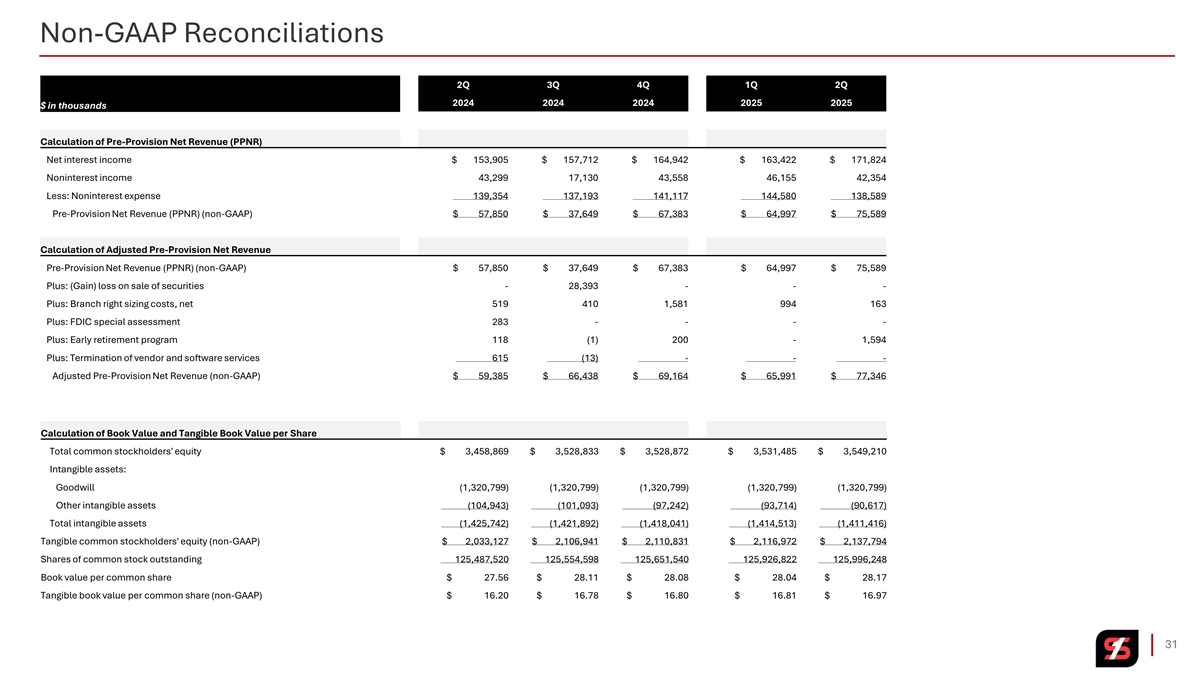
Non-GAAP Reconciliations 2Q 3Q 4Q 1Q 2Q 2024 2024 2024 2025 2025 $ in thousands Calculation of Pre-Provision Net Revenue (PPNR) Net interest income $ 153,905 $ 157,712 $ 164,942 $ 163,422 $ 171,824 Noninterest income 43,299 17,130 43,558 46,155 42,354 Less: Noninterest expense 139,354 137,193 141,117 144,580 138,589 Pre-Provision Net Revenue (PPNR) (non-GAAP) $ 57,850 $ 37,649 $ 67,383 $ 64,997 $ 75,589 Calculation of Adjusted Pre-Provision Net Revenue Pre-Provision Net Revenue (PPNR) (non-GAAP) $ 57,850 $ 37,649 $ 67,383 $ 64,997 $ 75,589 Plus: (Gain) loss on sale of securities - 28,393 - - - Plus: Branch right sizing costs, net 519 410 1,581 994 163 Plus: FDIC special assessment 283 - - - - Plus: Early retirement program 118 (1) 200 - 1,594 Plus: Termination of vendor and software services 615 (13) - - - Adjusted Pre-Provision Net Revenue (non-GAAP) $ 59,385 $ 66,438 $ 69,164 $ 65,991 $ 77,346 Calculation of Book Value and Tangible Book Value per Share Total common stockholders' equity $ 3,458,869 $ 3,528,833 $ 3,528,872 $ 3,531,485 $ 3,549,210 Intangible assets: Goodwill (1,320,799) (1,320,799) (1,320,799) (1,320,799) (1,320,799) Other intangible assets (104,943) (101,093) (97,242) (93,714) (90,617) Total intangible assets (1,425,742) (1,421,892) (1,418,041) (1,414,513) (1,411,416) Tangible common stockholders' equity (non-GAAP) $ 2,033,127 $ 2,106,941 $ 2,110,831 $ 2,116,972 $ 2,137,794 Shares of common stock outstanding 125,487,520 125,554,598 125,651,540 125,926,822 125,996,248 Book value per common share $ 27.56 $ 28.11 $ 28.08 $ 28.04 $ 28.17 Tangible book value per common share (non-GAAP) $ 16.20 $ 16.78 $ 16.80 $ 16.81 $ 16.97 31
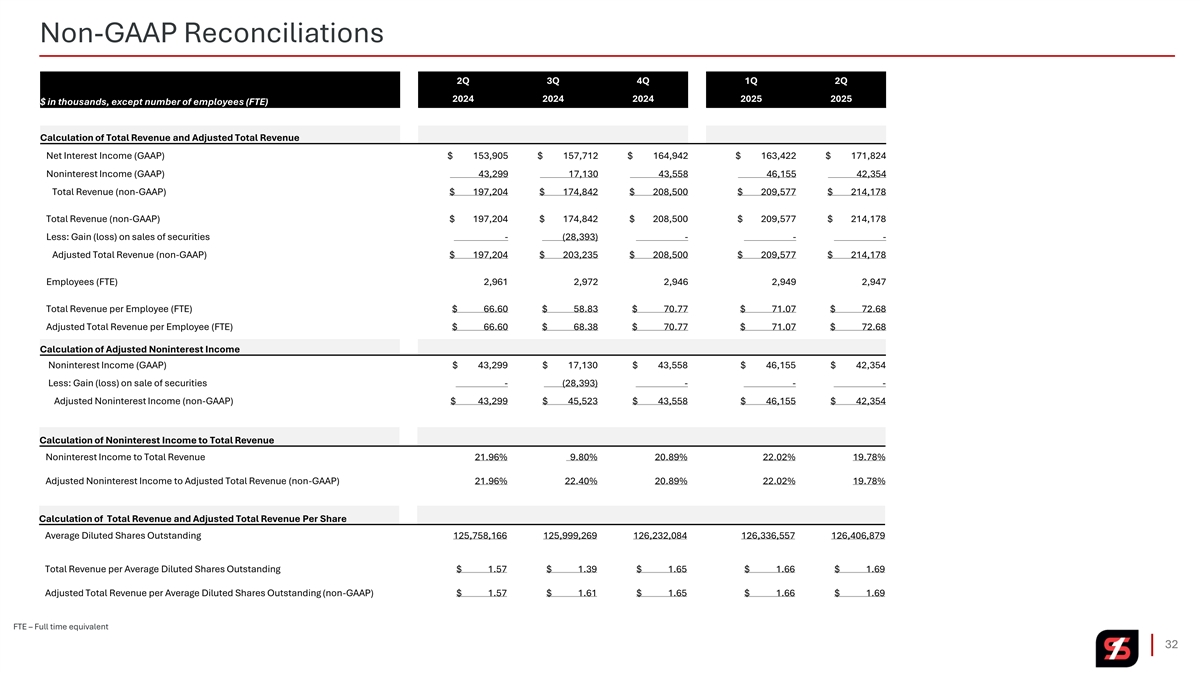
Non-GAAP Reconciliations 2Q 3Q 4Q 1Q 2Q 2024 2024 2024 2025 2025 $ in thousands, except number of employees (FTE) Calculation of Total Revenue and Adjusted Total Revenue Net Interest Income (GAAP) $ 153,905 $ 157,712 $ 164,942 $ 163,422 $ 171,824 Noninterest Income (GAAP) 43,299 17,130 43,558 46,155 42,354 Total Revenue (non-GAAP) $ 197,204 $ 174,842 $ 208,500 $ 209,577 $ 214,178 Total Revenue (non-GAAP) $ 197,204 $ 174,842 $ 208,500 $ 209,577 $ 214,178 Less: Gain (loss) on sales of securities - (28,393) - - - Adjusted Total Revenue (non-GAAP) $ 197,204 $ 203,235 $ 208,500 $ 209,577 $ 214,178 Employees (FTE) 2,961 2,972 2,946 2,949 2,947 Total Revenue per Employee (FTE) $ 66.60 $ 58.83 $ 70.77 $ 71.07 $ 72.68 Adjusted Total Revenue per Employee (FTE) $ 66.60 $ 68.38 $ 70.77 $ 71.07 $ 72.68 Calculation of Adjusted Noninterest Income Noninterest Income (GAAP) $ 43,299 $ 17,130 $ 43,558 $ 46,155 $ 42,354 Less: Gain (loss) on sale of securities - (28,393) - - - Adjusted Noninterest Income (non-GAAP) $ 43,299 $ 45,523 $ 43,558 $ 46,155 $ 42,354 Calculation of Noninterest Income to Total Revenue Noninterest Income to Total Revenue 21.96% 9.80% 20.89% 22.02% 19.78% Adjusted Noninterest Income to Adjusted Total Revenue (non-GAAP) 21.96% 22.40% 20.89% 22.02% 19.78% Calculation of Total Revenue and Adjusted Total Revenue Per Share Average Diluted Shares Outstanding 125,758,166 125,999,269 126,232,084 126,336,557 126,406,879 Total Revenue per Average Diluted Shares Outstanding $ 1.57 $ 1.39 $ 1.65 $ 1.66 $ 1.69 Adjusted Total Revenue per Average Diluted Shares Outstanding (non-GAAP) $ 1.57 $ 1.61 $ 1.65 $ 1.66 $ 1.69 FTE – Full time equivalent 32
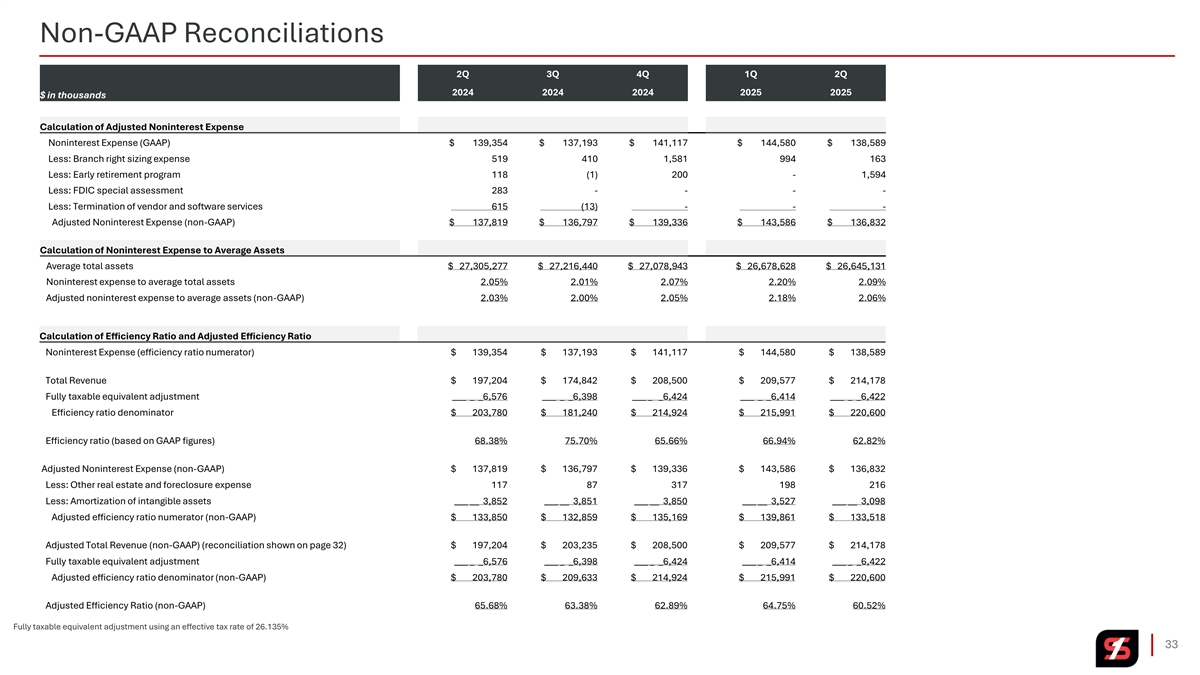
Non-GAAP Reconciliations 2Q 3Q 4Q 1Q 2Q 2024 2024 2024 2025 2025 $ in thousands Calculation of Adjusted Noninterest Expense Noninterest Expense (GAAP) $ 139,354 $ 137,193 $ 141,117 $ 144,580 $ 138,589 Less: Branch right sizing expense 519 410 1,581 994 163 Less: Early retirement program 118 (1) 200 - 1,594 Less: FDIC special assessment 283 - - - - Less: Termination of vendor and software services 615 (13) - - - Adjusted Noninterest Expense (non-GAAP) $ 137,819 $ 136,797 $ 139,336 $ 143,586 $ 136,832 Calculation of Noninterest Expense to Average Assets Average total assets $ 27,305,277 $ 27,216,440 $ 27,078,943 $ 26,678,628 $ 26,645,131 Noninterest expense to average total assets 2.05% 2.01% 2.07% 2.20% 2.09% Adjusted noninterest expense to average assets (non-GAAP) 2.03% 2.00% 2.05% 2.18% 2.06% Calculation of Efficiency Ratio and Adjusted Efficiency Ratio Noninterest Expense (efficiency ratio numerator) $ 139,354 $ 137,193 $ 141,117 $ 144,580 $ 138,589 Total Revenue $ 197,204 $ 174,842 $ 208,500 $ 209,577 $ 214,178 Fully taxable equivalent adjustment ___ _ _6,576 ___ _ _6,398 ___ _ _6,424 ___ _ _6,414 ___ _ _6,422 Efficiency ratio denominator $ 203,780 $ 181,240 $ 214,924 $ 215,991 $ 220,600 Efficiency ratio (based on GAAP figures) 68.38% 75.70% 65.66% 66.94% 62.82% Adjusted Noninterest Expense (non-GAAP) $ 137,819 $ 136,797 $ 139,336 $ 143,586 $ 136,832 Less: Other real estate and foreclosure expense 117 87 317 198 216 Less: Amortization of intangible assets ___ __ 3,852 ___ __ 3,851 ___ __ 3,850 ___ __ 3,527 ___ __ 3,098 Adjusted efficiency ratio numerator (non-GAAP) $ 133,850 $ 132,859 $ 135,169 $ 139,861 $ 133,518 Adjusted Total Revenue (non-GAAP) (reconciliation shown on page 32) $ 197,204 $ 203,235 $ 208,500 $ 209,577 $ 214,178 Fully taxable equivalent adjustment ___ _ _6,576 ___ _ _6,398 ___ _ _6,424 ___ _ _6,414 ___ _ _6,422 Adjusted efficiency ratio denominator (non-GAAP) $ 203,780 $ 209,633 $ 214,924 $ 215,991 $ 220,600 Adjusted Efficiency Ratio (non-GAAP) 65.68% 63.38% 62.89% 64.75% 60.52% Fully taxable equivalent adjustment using an effective tax rate of 26.135% 33
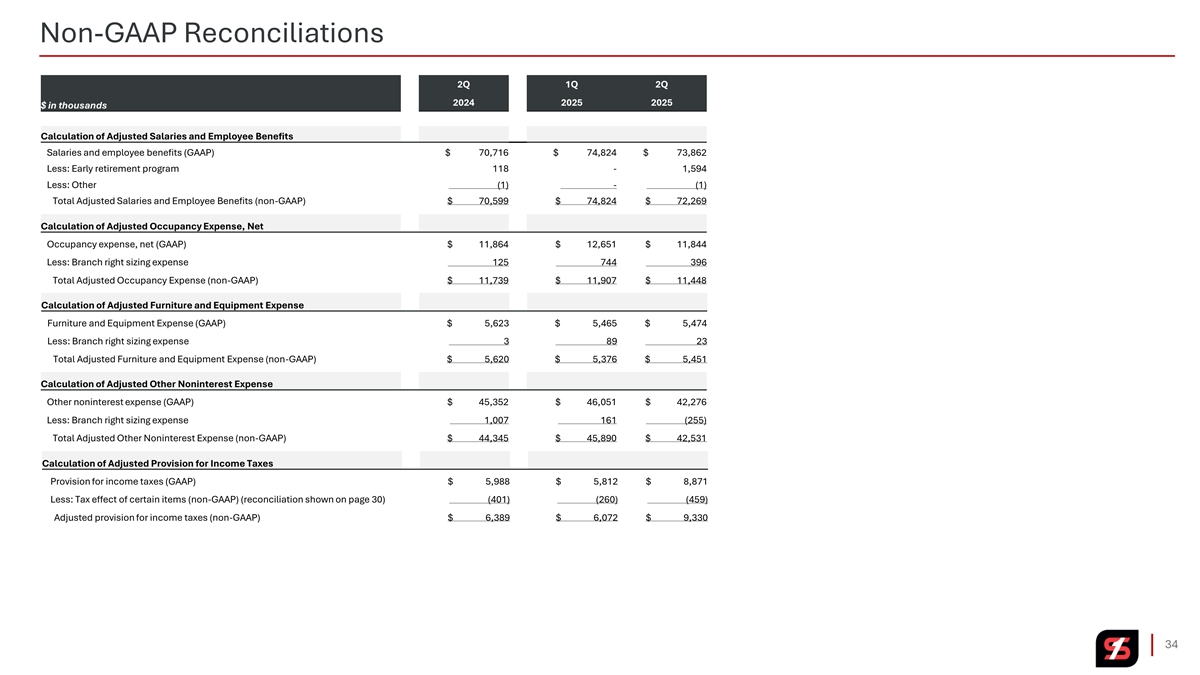
Non-GAAP Reconciliations 2Q 1Q 2Q 2024 2025 2025 $ in thousands Calculation of Adjusted Salaries and Employee Benefits Salaries and employee benefits (GAAP) $ 70,716 $ 74,824 $ 73,862 Less: Early retirement program 118 - 1,594 Less: Other (1) - (1) Total Adjusted Salaries and Employee Benefits (non-GAAP) $ 70,599 $ 74,824 $ 72,269 Calculation of Adjusted Occupancy Expense, Net Occupancy expense, net (GAAP) $ 11,864 $ 12,651 $ 11,844 Less: Branch right sizing expense 125 744 396 Total Adjusted Occupancy Expense (non-GAAP) $ 11,739 $ 11,907 $ 11,448 Calculation of Adjusted Furniture and Equipment Expense Furniture and Equipment Expense (GAAP) $ 5,623 $ 5,465 $ 5,474 Less: Branch right sizing expense 3 89 23 Total Adjusted Furniture and Equipment Expense (non-GAAP) $ 5,620 $ 5,376 $ 5,451 Calculation of Adjusted Other Noninterest Expense Other noninterest expense (GAAP) $ 45,352 $ 46,051 $ 42,276 Less: Branch right sizing expense 1,007 161 (255) Total Adjusted Other Noninterest Expense (non-GAAP) $ 44,345 $ 45,890 $ 42,531 Calculation of Adjusted Provision for Income Taxes Provision for income taxes (GAAP) $ 5,988 $ 5,812 $ 8,871 Less: Tax effect of certain items (non-GAAP) (reconciliation shown on page 30) (401) (260) (459) Adjusted provision for income taxes (non-GAAP) $ 6,389 $ 6,072 $ 9,330 34
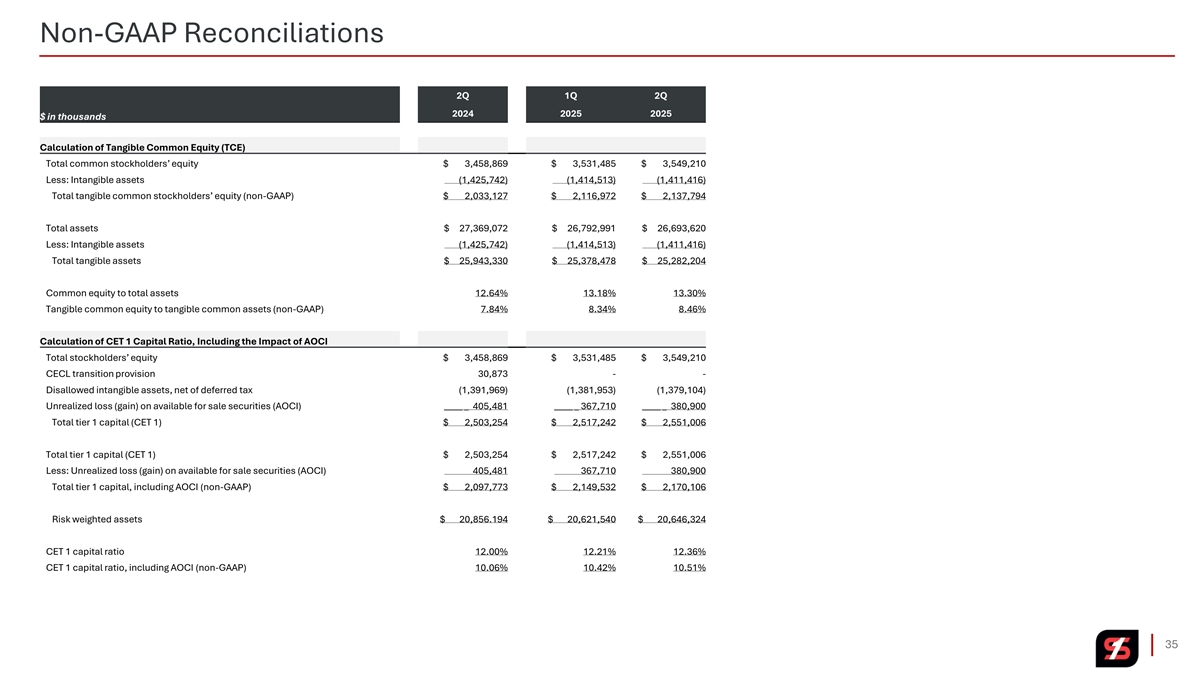
Non-GAAP Reconciliations 2Q 1Q 2Q 2024 2025 2025 $ in thousands Calculation of Tangible Common Equity (TCE) Total common stockholders’ equity $ 3,458,869 $ 3,531,485 $ 3,549,210 Less: Intangible assets (1,425,742) (1,414,513) (1,411,416) Total tangible common stockholders’ equity (non-GAAP) $ 2,033,127 $ 2,116,972 $ 2,137,794 Total assets $ 27,369,072 $ 26,792,991 $ 26,693,620 Less: Intangible assets (1,425,742) (1,414,513) (1,411,416) Total tangible assets $ 25,943,330 $ 25,378,478 $ 25,282,204 Common equity to total assets 12.64% 13.18% 13.30% Tangible common equity to tangible common assets (non-GAAP) 7.84% 8.34% 8.46% Calculation of CET 1 Capital Ratio, Including the Impact of AOCI Total stockholders’ equity $ 3,458,869 $ 3,531,485 $ 3,549,210 CECL transition provision 30,873 - - Disallowed intangible assets, net of deferred tax (1,391,969) (1,381,953) (1,379,104) Unrealized loss (gain) on available for sale securities (AOCI) ____ _ 405,481 ____ _ 367,710 ____ _ 380,900 Total tier 1 capital (CET 1) $ 2,503,254 $ 2,517,242 $ 2,551,006 Total tier 1 capital (CET 1) $ 2,503,254 $ 2,517,242 $ 2,551,006 Less: Unrealized loss (gain) on available for sale securities (AOCI) 405,481 367,710 380,900 Total tier 1 capital, including AOCI (non-GAAP) $ 2,097,773 $ 2,149,532 $ 2,170,106 Risk weighted assets $ 20,856.194 $ 20,621,540 $ 20,646,324 CET 1 capital ratio 12.00% 12.21% 12.36% CET 1 capital ratio, including AOCI (non-GAAP) 10.06% 10.42% 10.51% 35
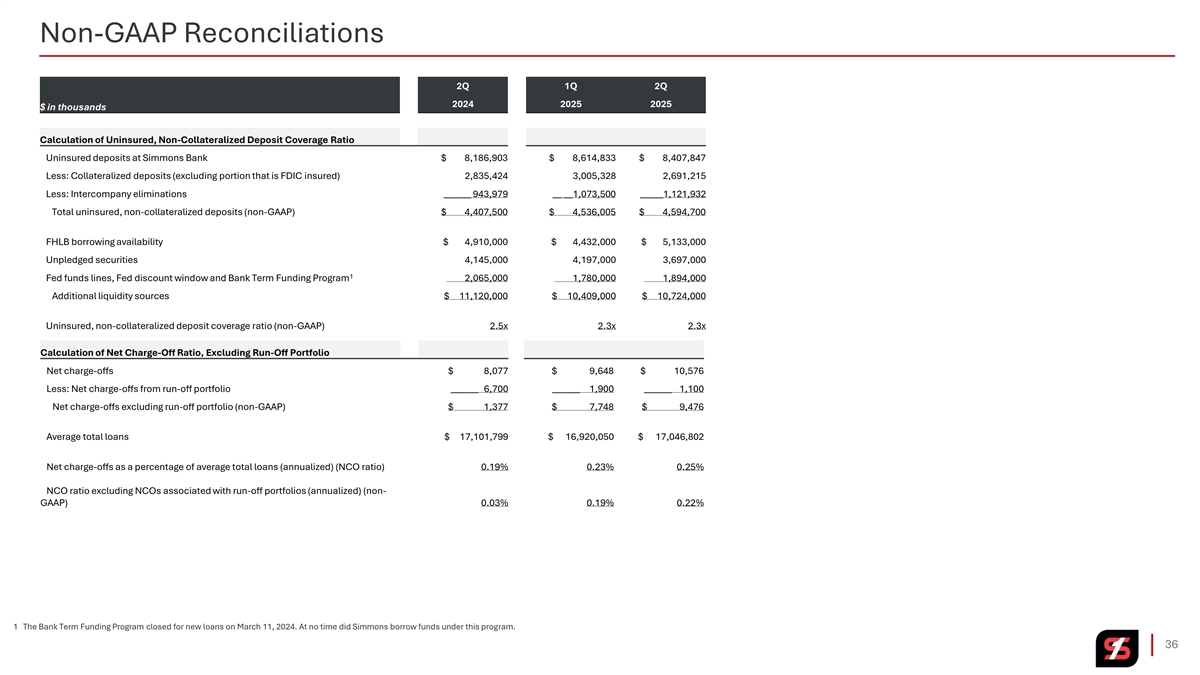
Non-GAAP Reconciliations 2Q 1Q 2Q 2024 2025 2025 $ in thousands Calculation of Uninsured, Non-Collateralized Deposit Coverage Ratio Uninsured deposits at Simmons Bank $ 8,186,903 $ 8,614,833 $ 8,407,847 Less: Collateralized deposits (excluding portion that is FDIC insured) 2,835,424 3,005,328 2,691,215 Less: Intercompany eliminations ______ 943,979 __ __1,073,500 _____1,121,932 Total uninsured, non-collateralized deposits (non-GAAP) $ 4,407,500 $ 4,536,005 $ 4,594,700 FHLB borrowing availability $ 4,910,000 $ 4,432,000 $ 5,133,000 Unpledged securities 4,145,000 4,197,000 3,697,000 1 Fed funds lines, Fed discount window and Bank Term Funding Program 2,065,000 1,780,000 1,894,000 Additional liquidity sources $ 11,120,000 $ 10,409,000 $ 10,724,000 Uninsured, non-collateralized deposit coverage ratio (non-GAAP) 2.5x 2.3x 2.3x Calculation of Net Charge-Off Ratio, Excluding Run-Off Portfolio Net charge-offs $ 8,077 $ 9,648 $ 10,576 Less: Net charge-offs from run-off portfolio ______ 6,700 ______ 1,900 ______ 1,100 Net charge-offs excluding run-off portfolio (non-GAAP) $ 1,377 $ 7,748 $ 9,476 Average total loans $ 17,101,799 $ 16,920,050 $ 17,046,802 Net charge-offs as a percentage of average total loans (annualized) (NCO ratio) 0.19% 0.23% 0.25% NCO ratio excluding NCOs associated with run-off portfolios (annualized) (non- GAAP) 0.03% 0.19% 0.22% 1 The Bank Term Funding Program closed for new loans on March 11, 2024. At no time did Simmons borrow funds under this program. 36
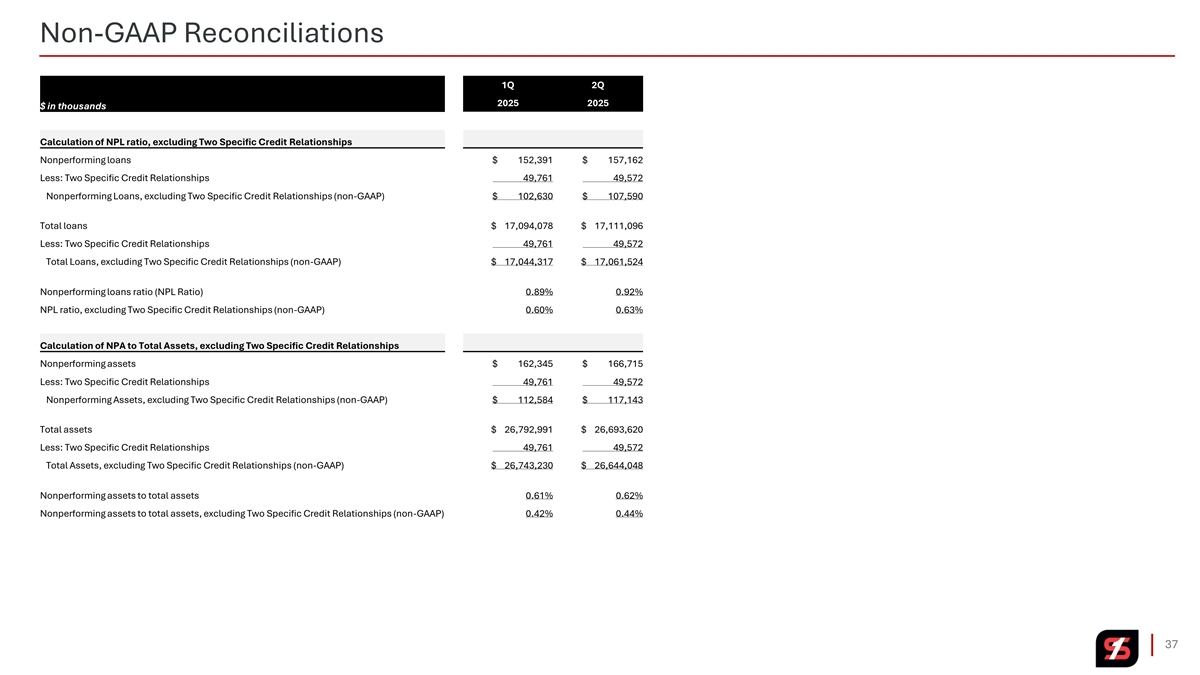
Non-GAAP Reconciliations 1Q 2Q 2025 2025 $ in thousands Calculation of NPL ratio, excluding Two Specific Credit Relationships Nonperforming loans $ 152,391 $ 157,162 Less: Two Specific Credit Relationships 49,761 49,572 Nonperforming Loans, excluding Two Specific Credit Relationships (non-GAAP) $ 102,630 $ 107,590 Total loans $ 17,094,078 $ 17,111,096 Less: Two Specific Credit Relationships 49,761 49,572 Total Loans, excluding Two Specific Credit Relationships (non-GAAP) $ 17,044,317 $ 17,061,524 Nonperforming loans ratio (NPL Ratio) 0.89% 0.92% NPL ratio, excluding Two Specific Credit Relationships (non-GAAP) 0.60% 0.63% Calculation of NPA to Total Assets, excluding Two Specific Credit Relationships Nonperforming assets $ 162,345 $ 166,715 Less: Two Specific Credit Relationships 49,761 49,572 Nonperforming Assets, excluding Two Specific Credit Relationships (non-GAAP) $ 112,584 $ 117,143 Total assets $ 26,792,991 $ 26,693,620 Less: Two Specific Credit Relationships 49,761 49,572 Total Assets, excluding Two Specific Credit Relationships (non-GAAP) $ 26,743,230 $ 26,644,048 Nonperforming assets to total assets 0.61% 0.62% Nonperforming assets to total assets, excluding Two Specific Credit Relationships (non-GAAP) 0.42% 0.44% 37

Nasdaq SFNC nd 2 Quarter 2025 Earnings Presentation July 17, 2025