|
New Jersey
|
001-08359
|
22-2376465
|
|
(State or Other Jurisdiction of Incorporation)
|
(Commission File Number)
|
(IRS Employer Identification No.)
|
|
1415 Wyckoff Road
|
|
|
| Wall, New Jersey | 07719 |
|
|
(Address of Principal Executive Offices)
|
(Zip Code)
|
| ☐ |
Written communications pursuant to Rule 425 under the Securities Act (17 CFR 230.425)
|
| ☐ |
Soliciting material pursuant to Rule 14a-12 under the Exchange Act (17 CFR 240.14a-12)
|
| ☐ |
Pre-commencement communications pursuant to Rule 14d-2(b) under the Exchange Act (17 CFR 240.14d-2(b))
|
| ☐ |
Pre-commencement communications pursuant to Rule 13e-4(c) under the Exchange Act (17 CFR 240.13e-4(c))
|
|
Title of each class
|
Trading Symbol(s)
|
Name of each exchange on
which registered
|
|
Common Stock - $2.50 par value
|
NJR
|
New York Stock Exchange
|
| Item 2.02 |
Results of Operations and Financial Condition.
|
| Item 7.01 |
Regulation FD Disclosure.
|
| Item 9.01. |
Financial Statements and Exhibits
|
|
(d)
|
Exhibits.
|
|
Exhibit Number
|
Exhibit
|
|
Earnings Release dated November 19, 2025 (furnished, not filed)
|
|
|
Presentation dated November 19, 2025 (furnished, not filed)
|
|
|
104
|
Cover page in Inline XBRL format
|
|
NEW JERSEY RESOURCES CORPORATION
|
||
|
Date: November 19, 2025
|
By:
|
/s/ Roberto F. Bel
|
|
Roberto F. Bel
|
||
|
Senior Vice President and Chief Financial Officer
|
||

| • |
Fiscal 2025 net income totaled $335.6 million, or $3.35 per share, compared with $289.8 million, or $2.94 per share, in fiscal 2024
|
| • |
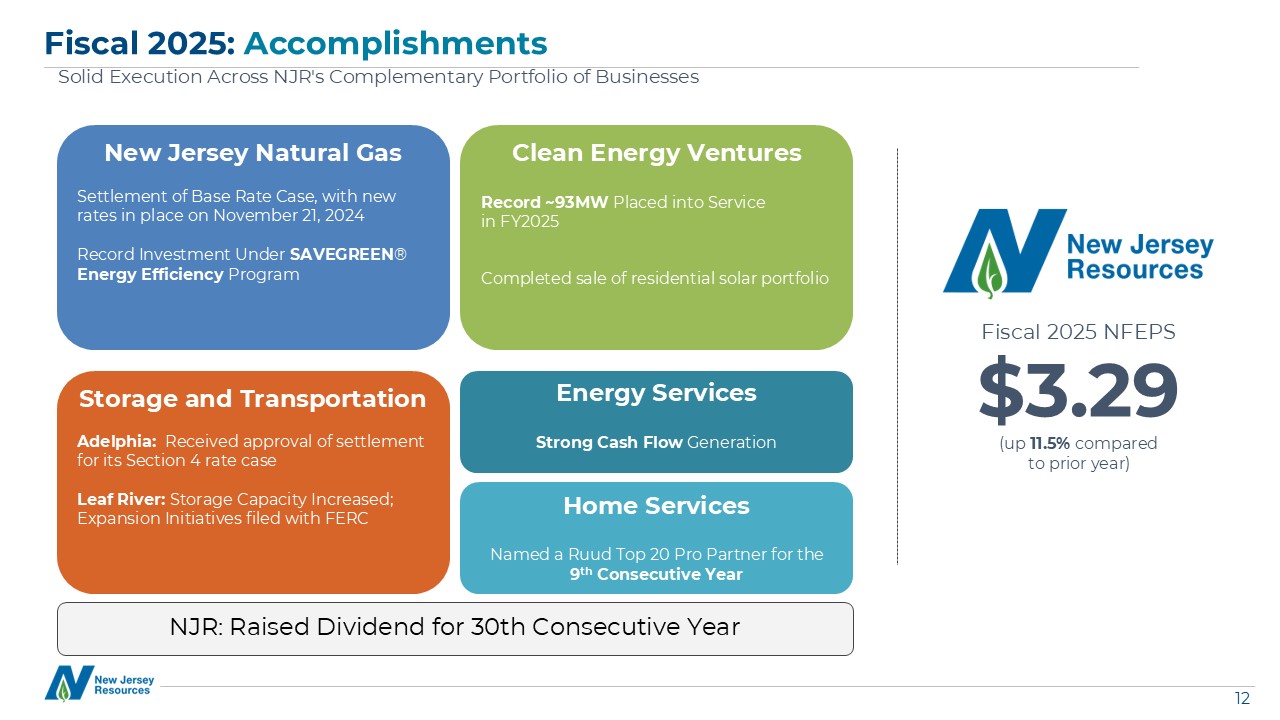
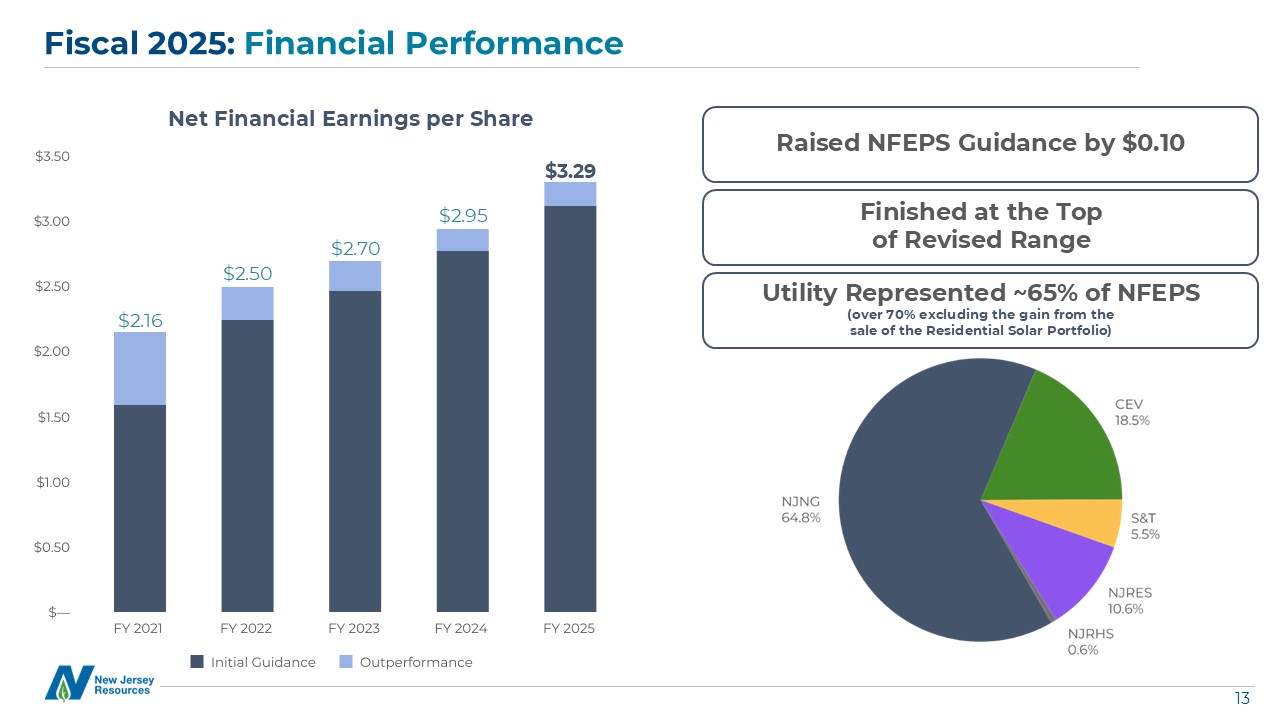
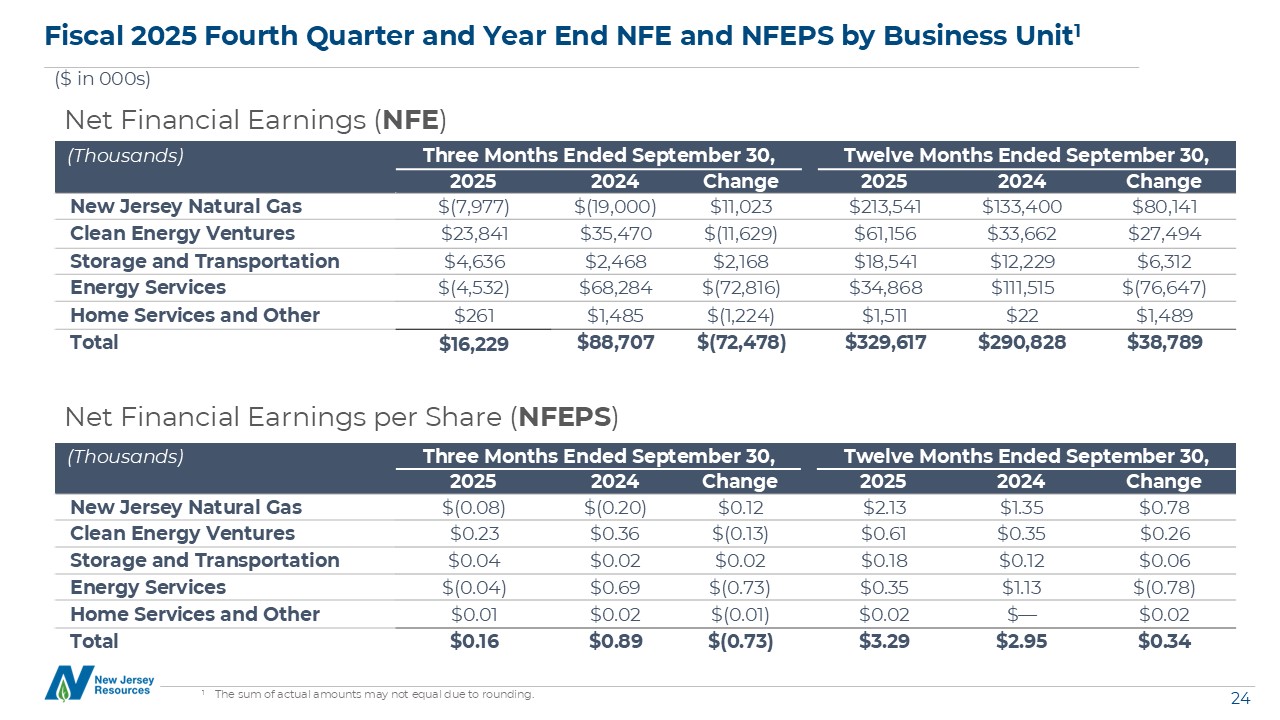
Fiscal 2025 consolidated net financial earnings (NFE), a
non-GAAP financial measure, totaled $329.6 million, or $3.29 per share, compared with $290.8 million, or $2.95 per share, in fiscal 2024
|
| • |
Achieved high end of fiscal 2025 net financial earnings per share (NFEPS) guidance range of $3.20 to $3.30, which was increased in the second quarter of fiscal 2025
|
| • |
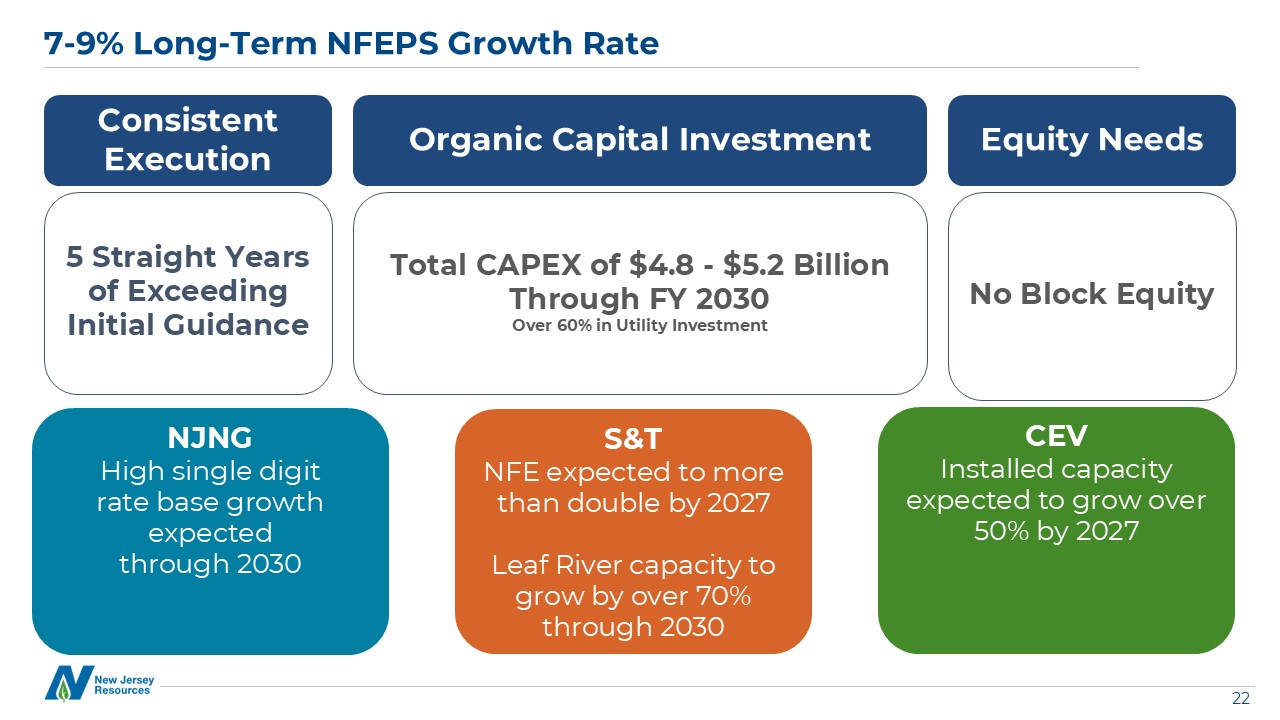
Fiscal 2025 marks the fifth consecutive year that NJR has
outperformed its initial annual NFEPS guidance
|
| • |
Fiscal 2025 fourth-quarter consolidated net income of $15.1 million, or $0.15
per share, compared with $91.1 million, or $0.92 per share, in the fourth quarter of fiscal 2024
|
| • |
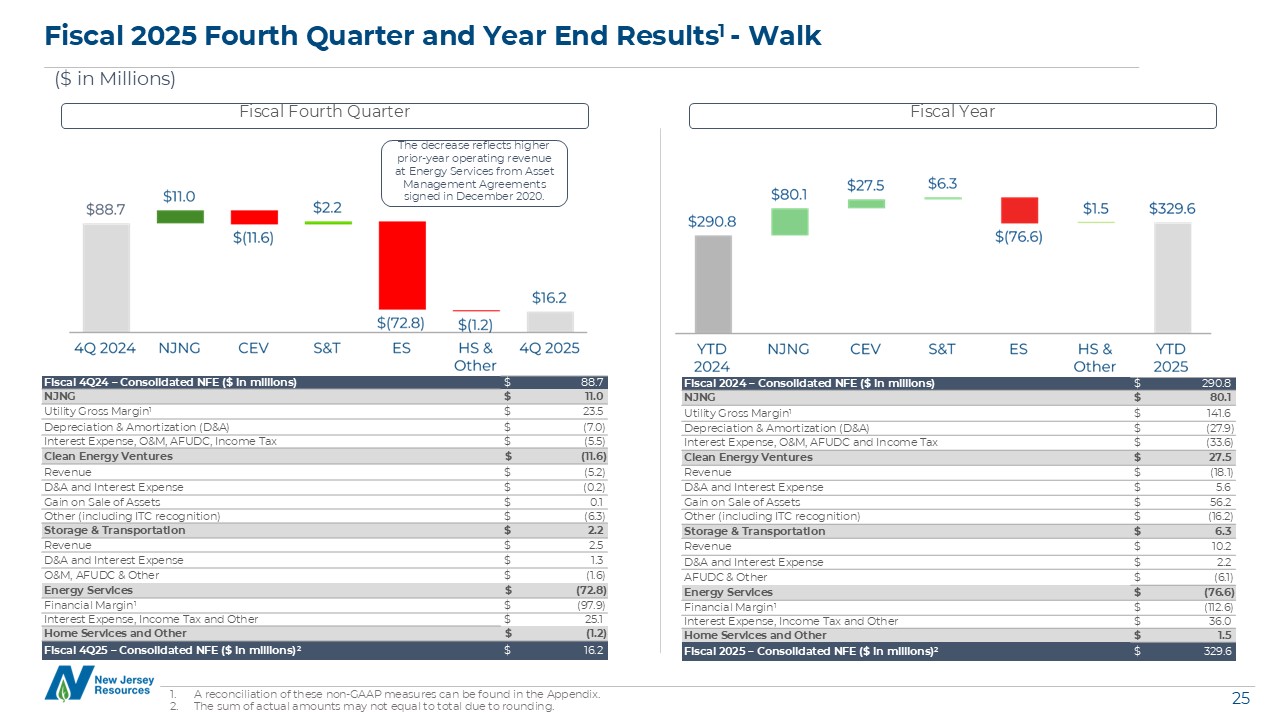
Fiscal 2025 fourth-quarter consolidated NFE of $16.2 million, or $0.16 per
share, compared with $88.7 million, or $0.89 per share, in the fourth quarter of fiscal 2024. The decrease reflects higher operating revenue in the prior
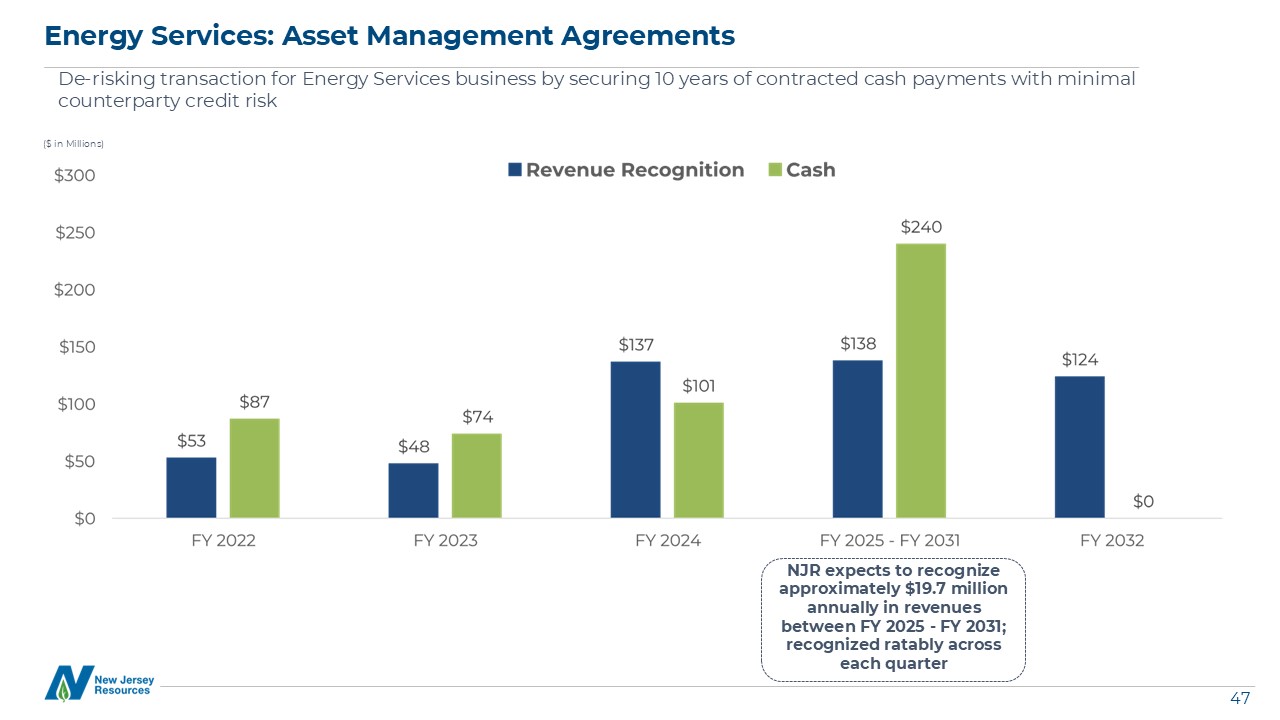
year period at Energy Services from the Asset Management Agreements (AMAs) signed in December 2020.
|
| • |
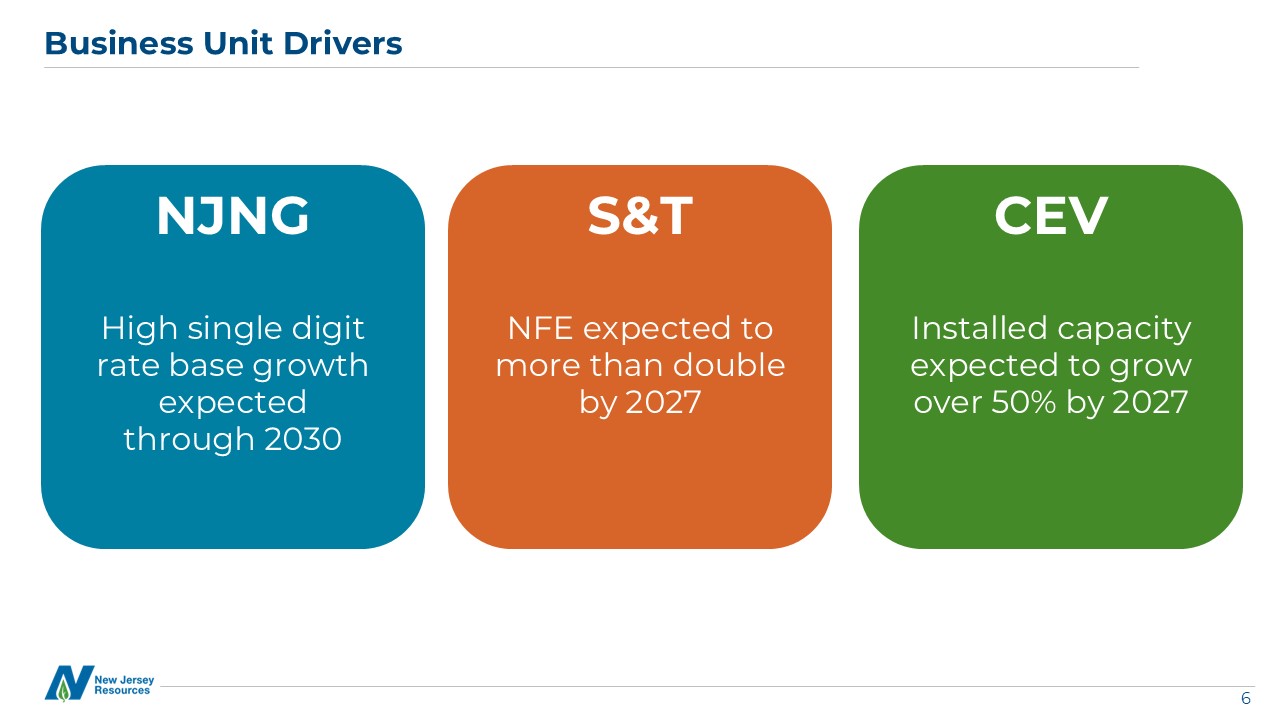
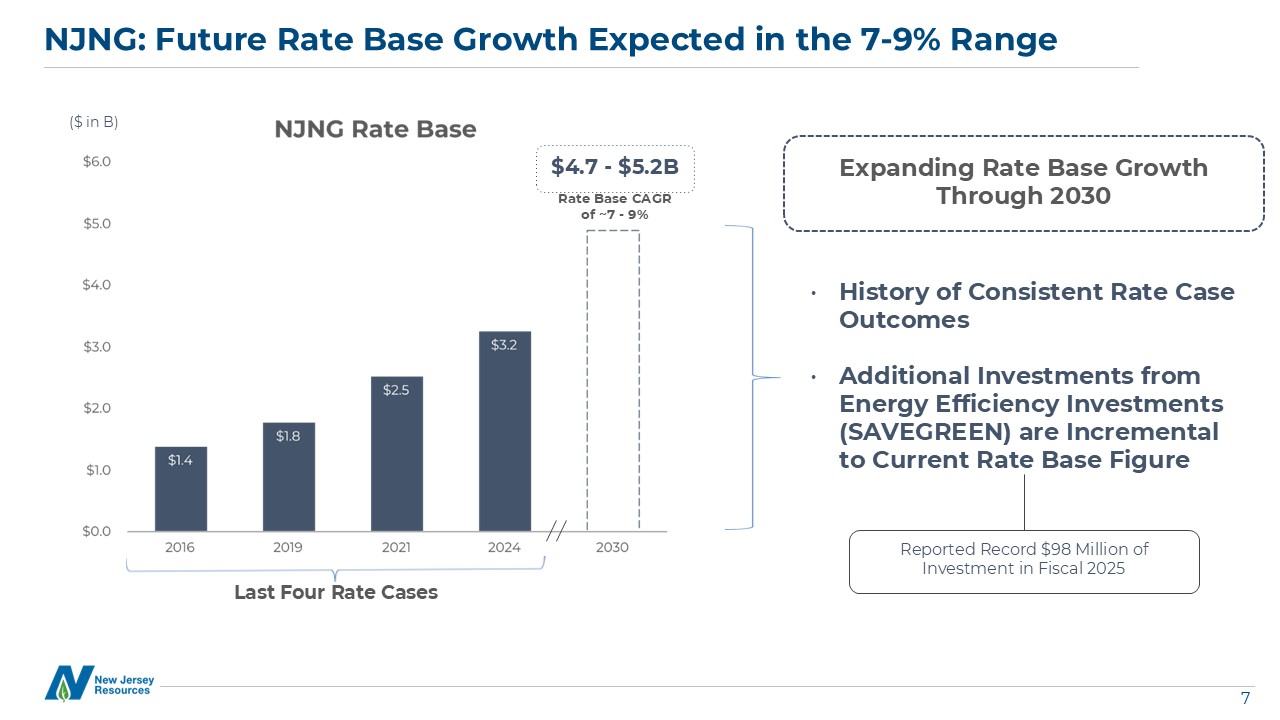
New Jersey Natural Gas (NJNG): Record investment under SAVEGREEN® energy efficiency program of $98 million
|
| • |
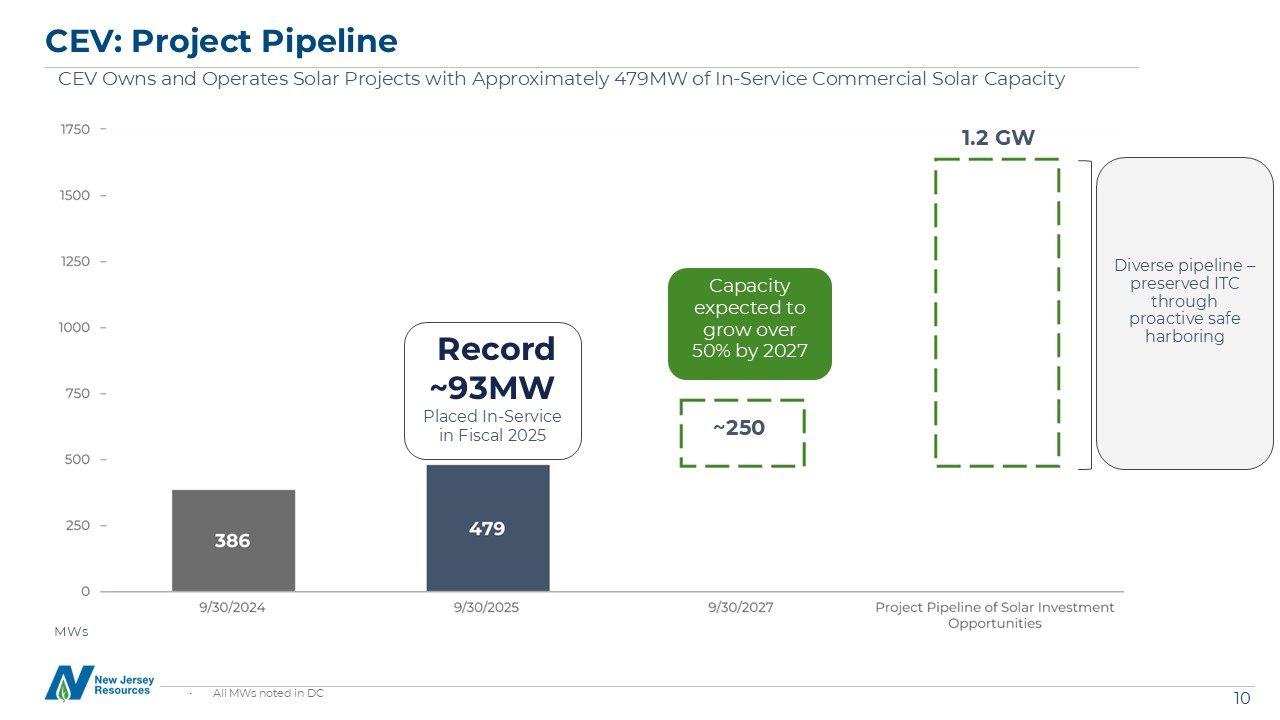
Clean Energy Ventures (CEV): Placed a record 93 megawatts (MW*) of in-service capacity in fiscal 2025, the highest annual installed capacity in its history
|
| • |
Storage and Transportation (S&T):
|
|
|
– |
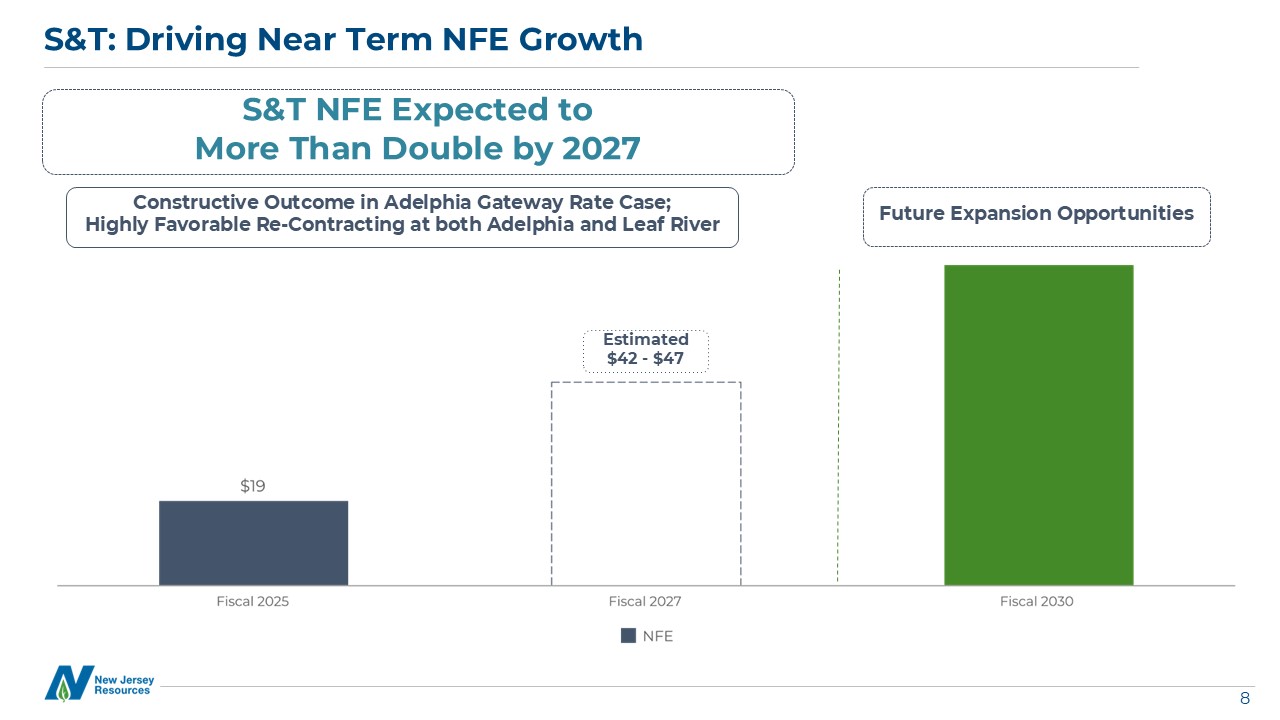
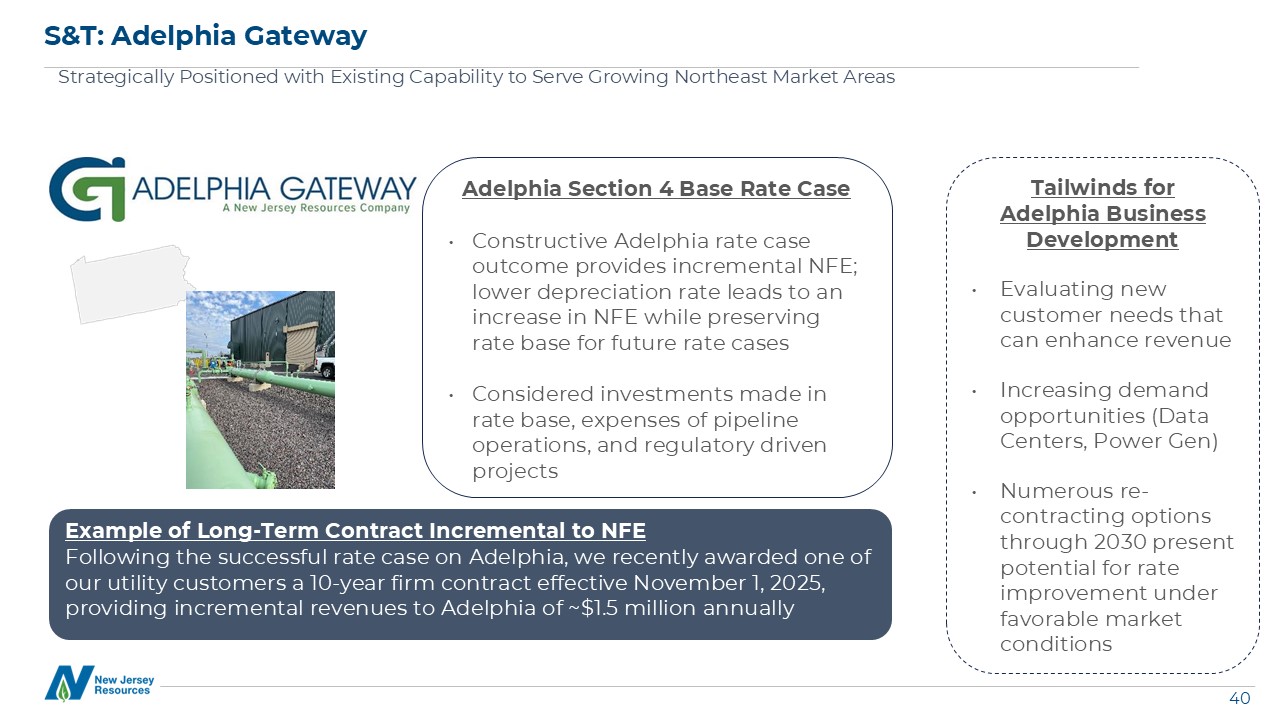
Adelphia Gateway (Adelphia): Filed an offer of settlement with the Federal Energy Regulatory Commission (FERC) during the fourth quarter of fiscal 2025, and received the order approving settlement
on November 4, 2025.
|
|
|
– |
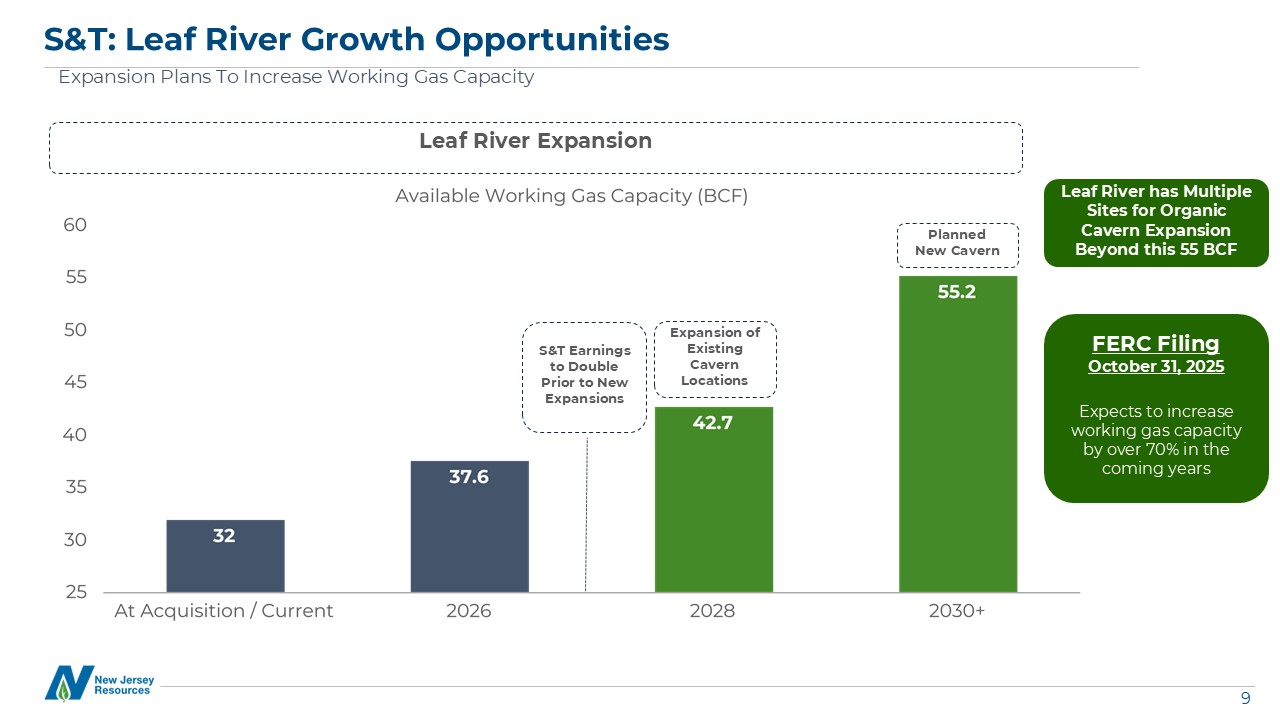
Leaf River Energy Center (Leaf River): Submitted an application to FERC on October 31, 2025 to increase its certificated natural gas storage capacity by 17.6 BCF
|
| • |
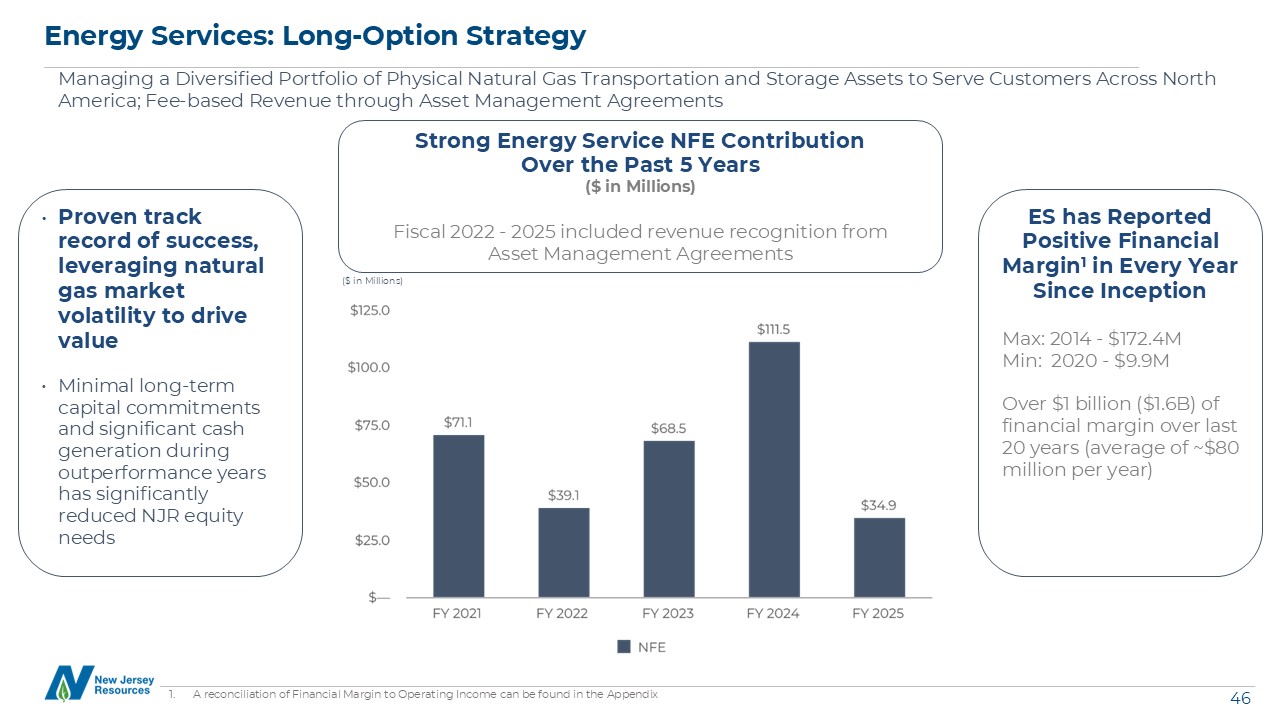
Energy Services (ES): Benefitted from natural gas volatility during the 2025 winter period, contributing to NFEPS guidance increase
|
| • |
Home Services: Reported higher revenues in fiscal 2025 and was named a Ruud Top Twenty Pro Partner Contractor for the 9th
consecutive year
|
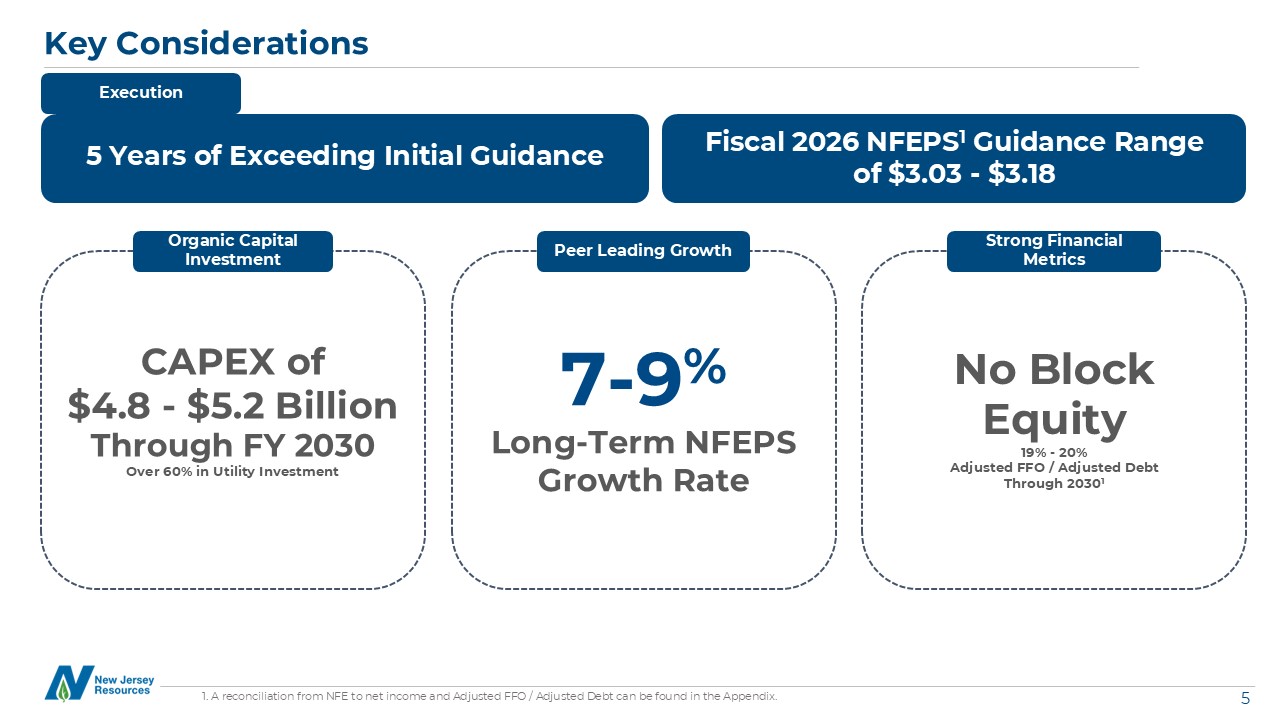
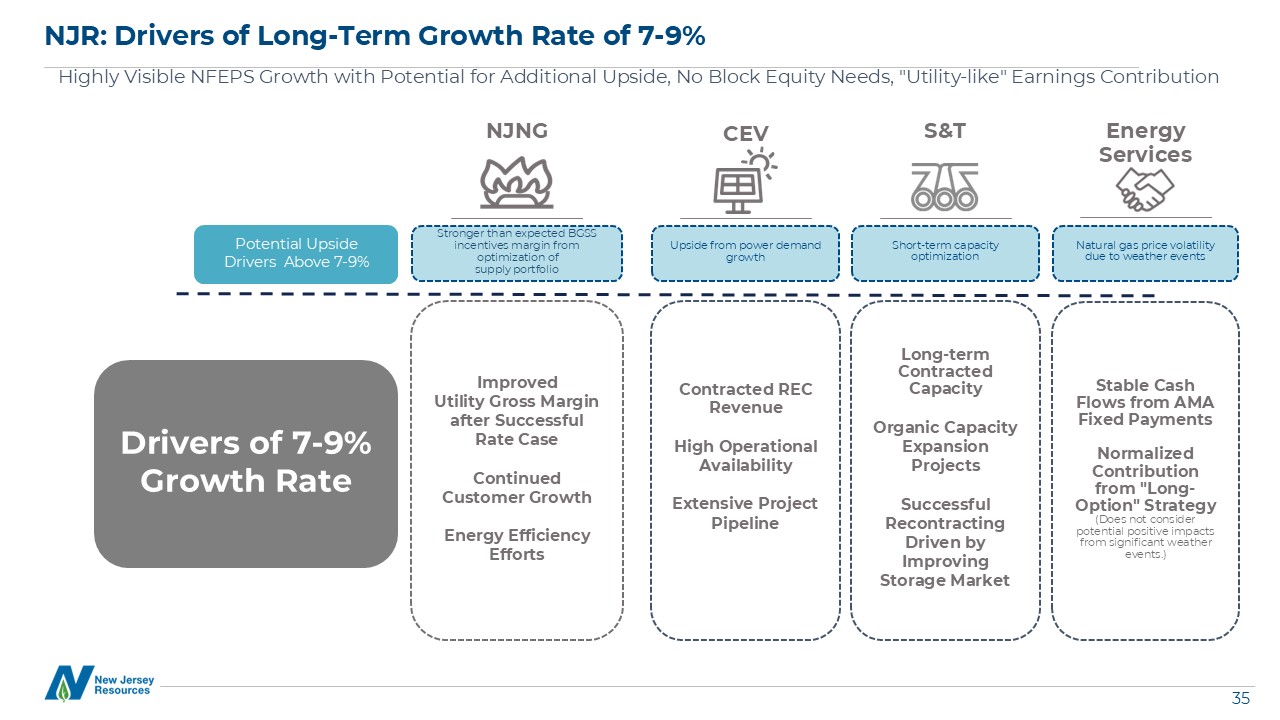
| • |
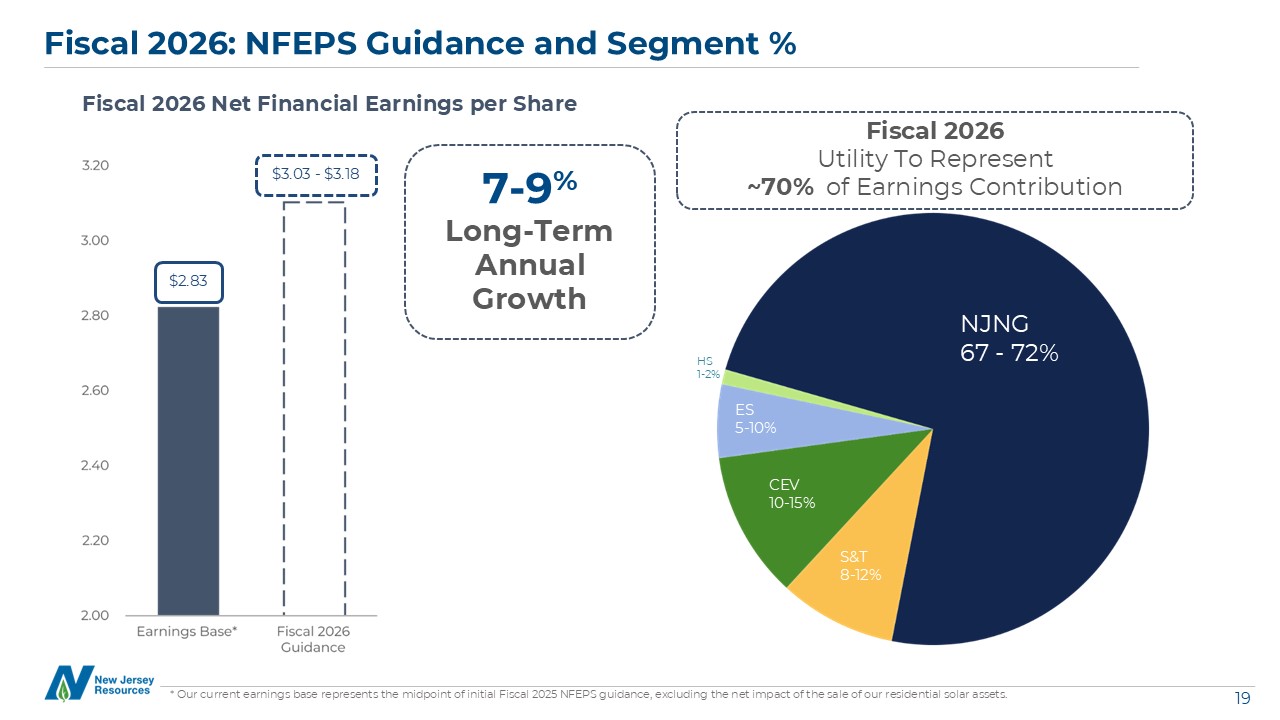
Maintains 7 to 9 percent long-term NFEPS growth
target, starting from a fiscal 2025 base of $2.83
per share**
|
| • |
Introduces fiscal 2026 NFEPS guidance range of $3.03 to $3.18
|
|
NJR Reports Fiscal 2025 Fourth Quarter and
Year-End Results
|
|
Page 2 of 12
|
|
Segment
|
Expected fiscal 2026
net financial earnings
contribution
|
|
|
New Jersey Natural Gas
|
67 to 72 percent
|
|
|
Clean Energy Ventures
|
10 to 15 percent
|
|
|
Storage and Transportation
|
8 to 12 percent
|
|
|
Energy Services
|
5 to 10 percent
|
|
|
Home Services and Other
|
1 to 2 percent
|
|
Three Months Ended
|
Twelve Months Ended
|
|||||||||||||||
|
September 30,
|
September 30,
|
|||||||||||||||
|
($ in Thousands, except per share data)
|
2025
|
2024
|
2025
|
2024
|
||||||||||||
|
Net income
|
$
|
15,072
|
$
|
91,126
|
$
|
335,627
|
$
|
289,775
|
||||||||
|
Basic EPS
|
$
|
0.15
|
$
|
0.92
|
$
|
3.35
|
$
|
2.94
|
||||||||
|
Net financial earnings*
|
$
|
16,229
|
$
|
88,707
|
$
|
329,617
|
$
|
290,828
|
||||||||
|
Basic net financial earnings per share*
|
$
|
0.16
|
$
|
0.89
|
$
|
3.29
|
$
|
2.95
|
||||||||
|
NJR Reports Fiscal 2025 Fourth Quarter and
Year-End Results
|
|
Page 3 of 12
|
|
Three Months Ended
|
Twelve Months Ended
|
|||||||||||||||
|
September 30,
|
September 30,
|
|||||||||||||||
|
(Thousands)
|
2025
|
2024
|
2025
|
2024
|
||||||||||||
|
New Jersey Natural Gas
|
$
|
(7,977
|
)
|
$
|
(19,000
|
)
|
$
|
213,541
|
$
|
133,400
|
||||||
|
Clean Energy Ventures
|
23,841
|
35,470
|
61,156
|
33,662
|
||||||||||||
|
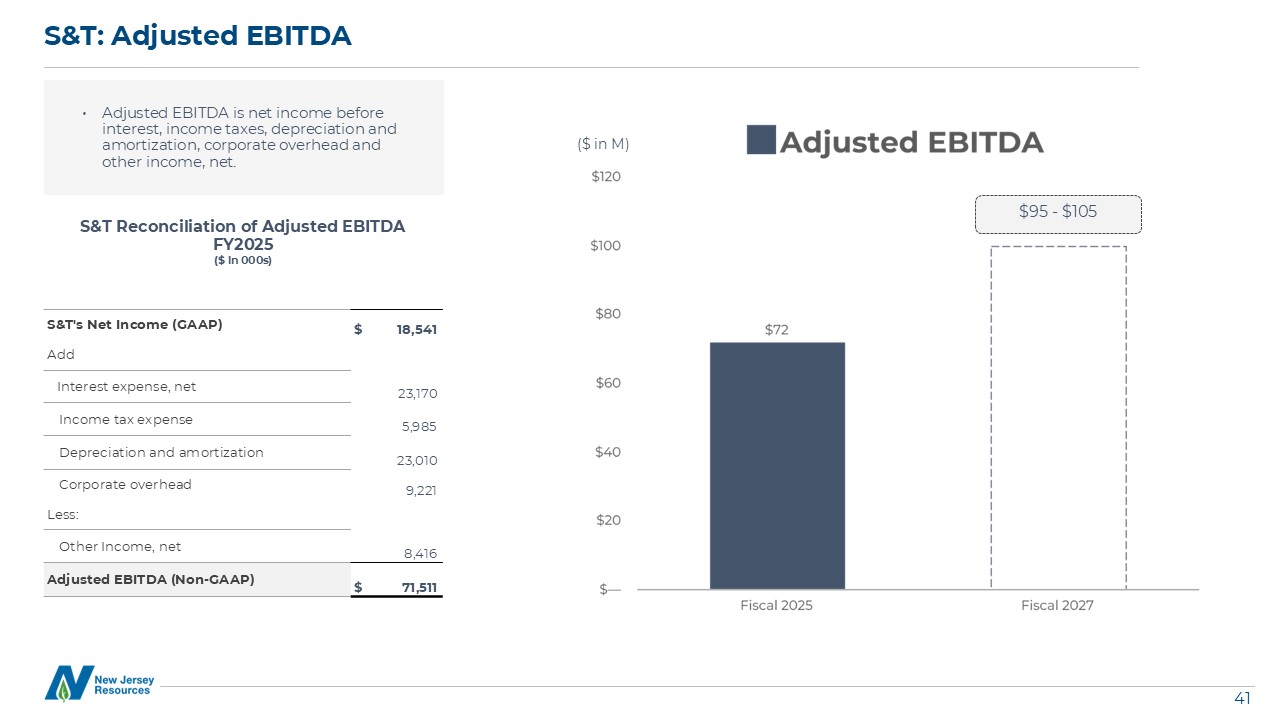
Storage and Transportation
|
4,636
|
2,468
|
18,541
|
12,229
|
||||||||||||
|
Energy Services
|
(4,532
|
)
|
68,284
|
34,868
|
111,515
|
|||||||||||
|
Home Services and Other
|
(825
|
)
|
(639
|
)
|
(407
|
)
|
26
|
|||||||||
|
Subtotal
|
15,143
|
86,583
|
327,699
|
290,832
|
||||||||||||
|
Eliminations
|
1,086
|
2,124
|
1,918
|
(4
|
)
|
|||||||||||
|
Total
|
$
|
16,229
|
$
|
88,707
|
$
|
329,617
|
$
|
290,828
|
||||||||
| • |
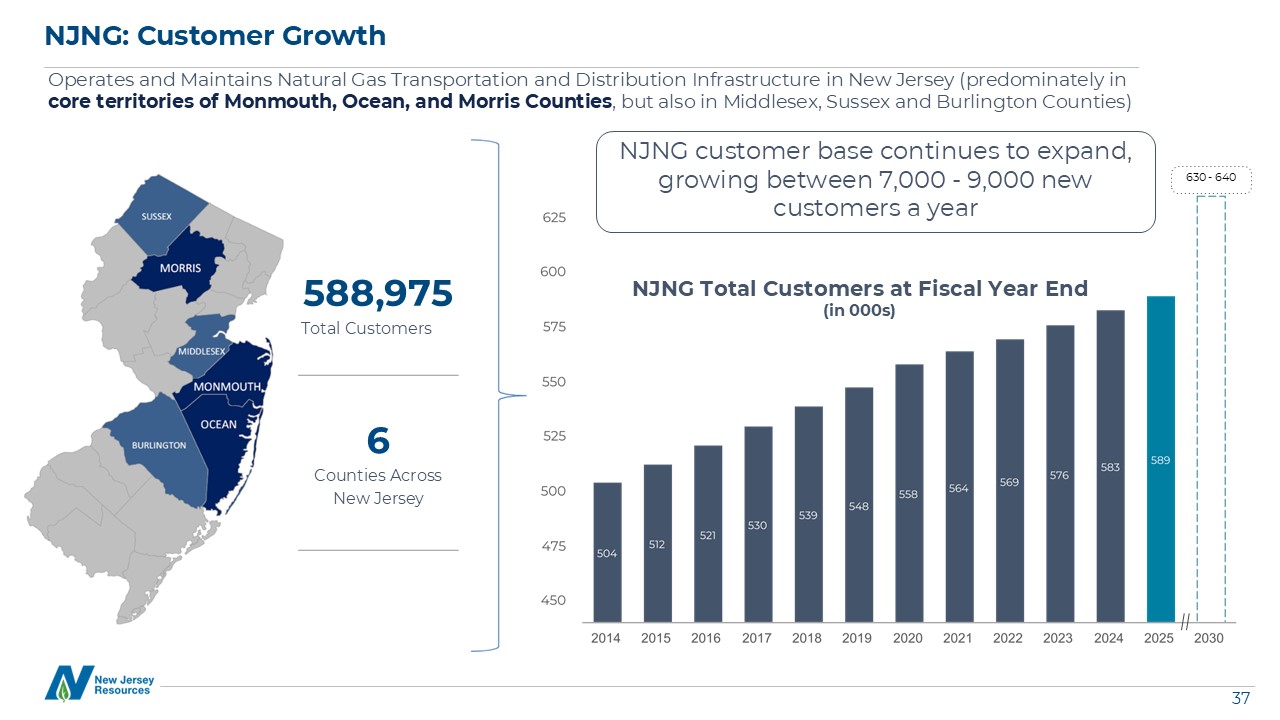
At September 30, 2025, NJNG serviced approximately 589,000
customers in New Jersey’s Monmouth, Ocean, Morris, Middlesex, Sussex and Burlington counties, compared to approximately 583,000 customers at September 30, 2024.
|
| • |
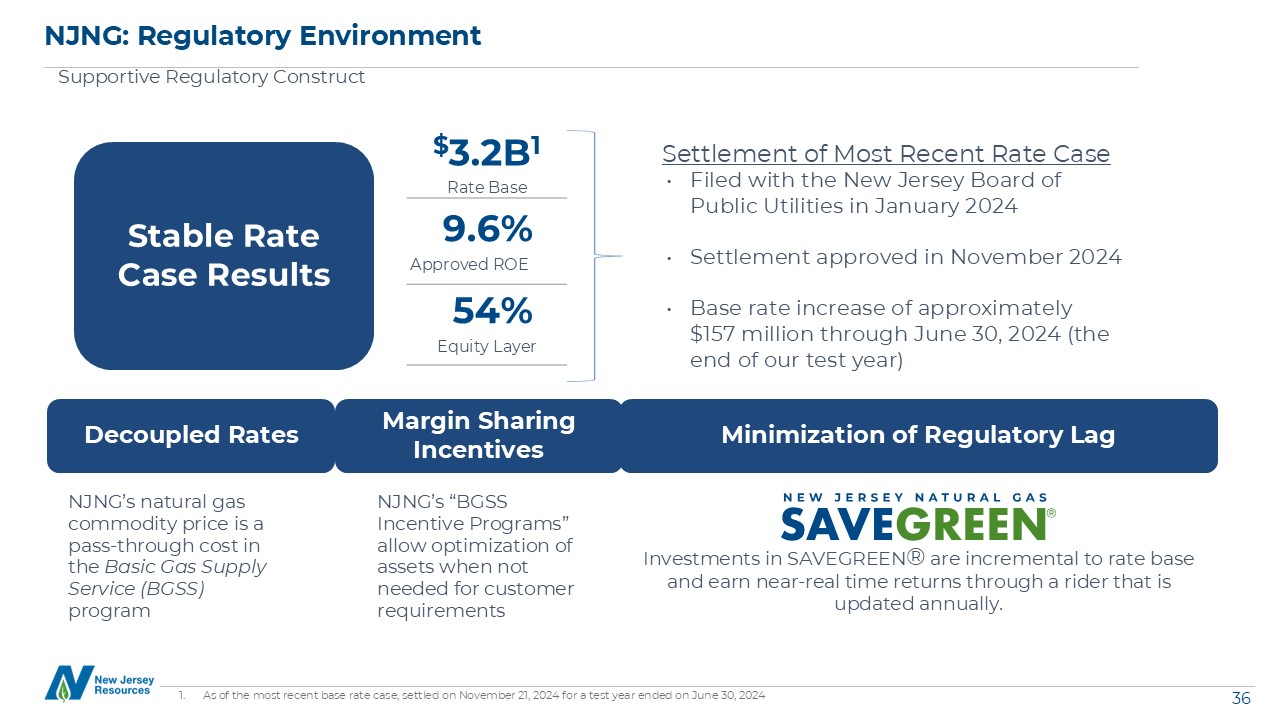
NJNG's Infrastructure Investment Program (IIP) is a five-year, $150 million accelerated recovery
program that began in fiscal 2021. IIP consists of a series of infrastructure projects designed to enhance the safety and reliability of NJNG's natural gas distribution system. During fiscal 2025, NJNG invested $40.0 million under the program on various distribution system
reinforcement projects.
|
| • |
BGSS incentive programs contributed $18.4 million to utility gross margin during fiscal 2025, compared with $17.9 million in fiscal 2024.
This increase was primarily driven by higher margins from storage incentives.
|
| • |
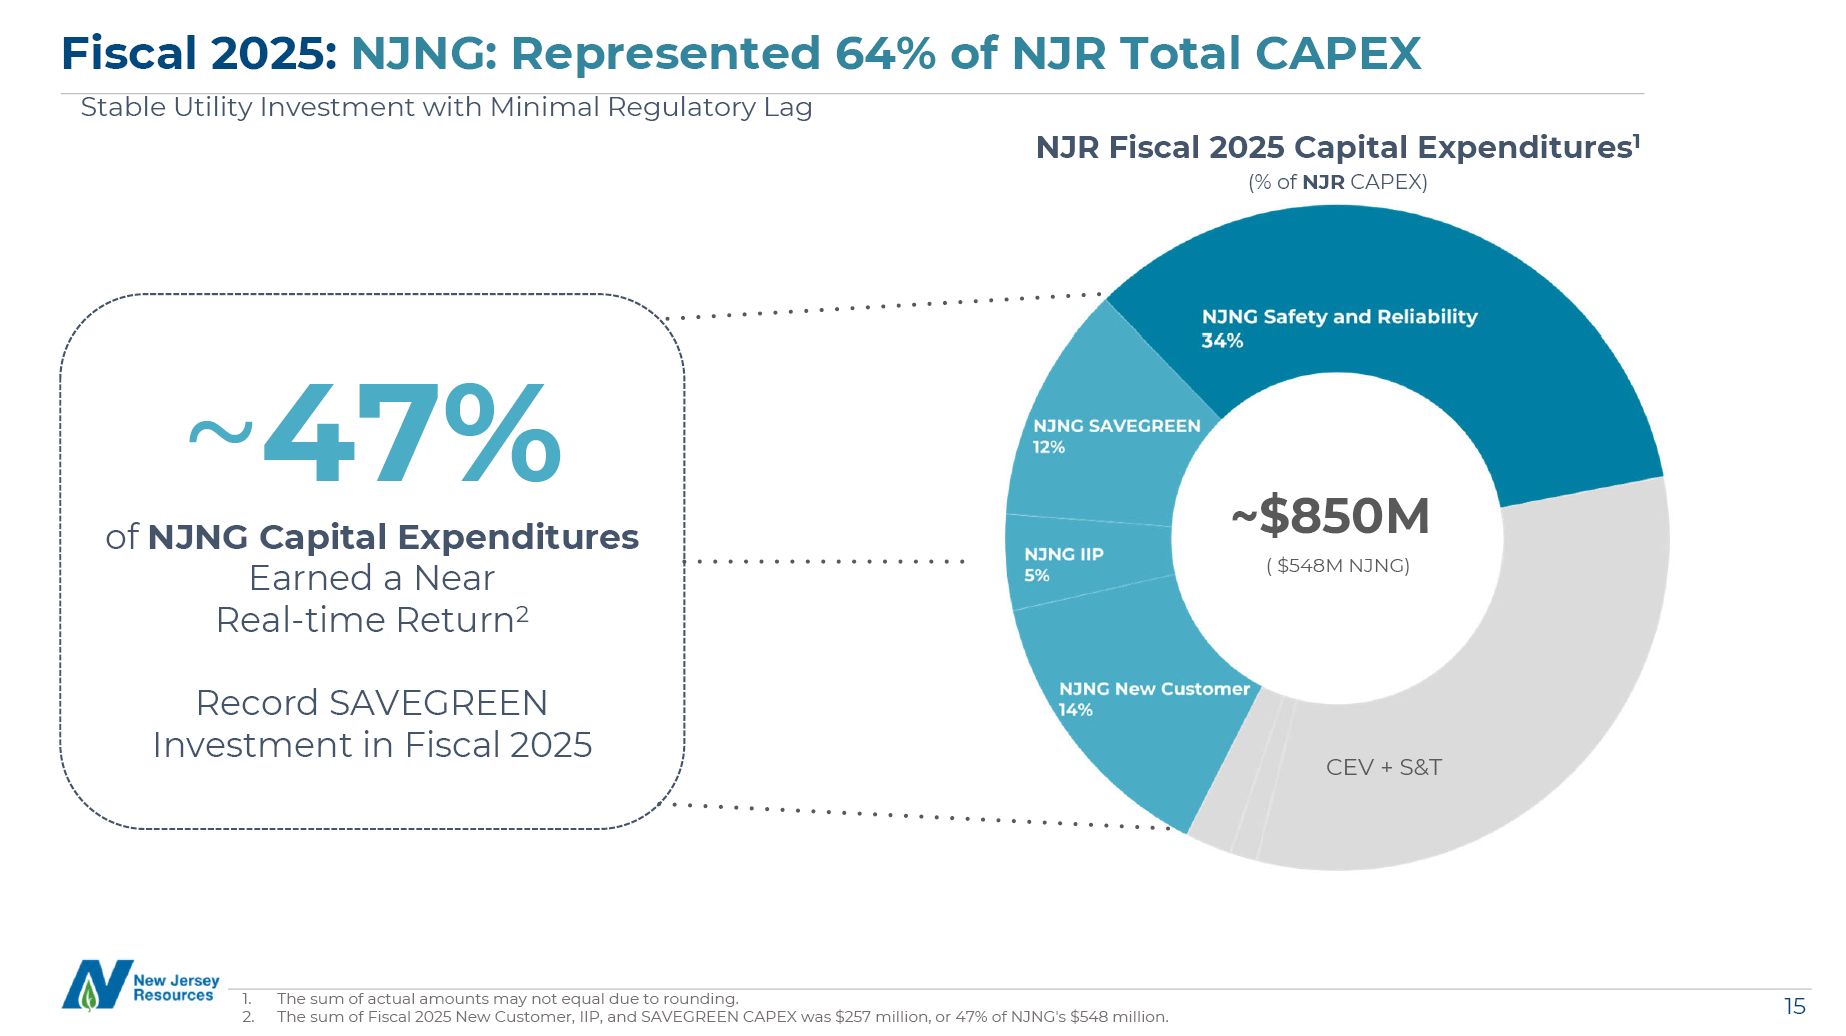
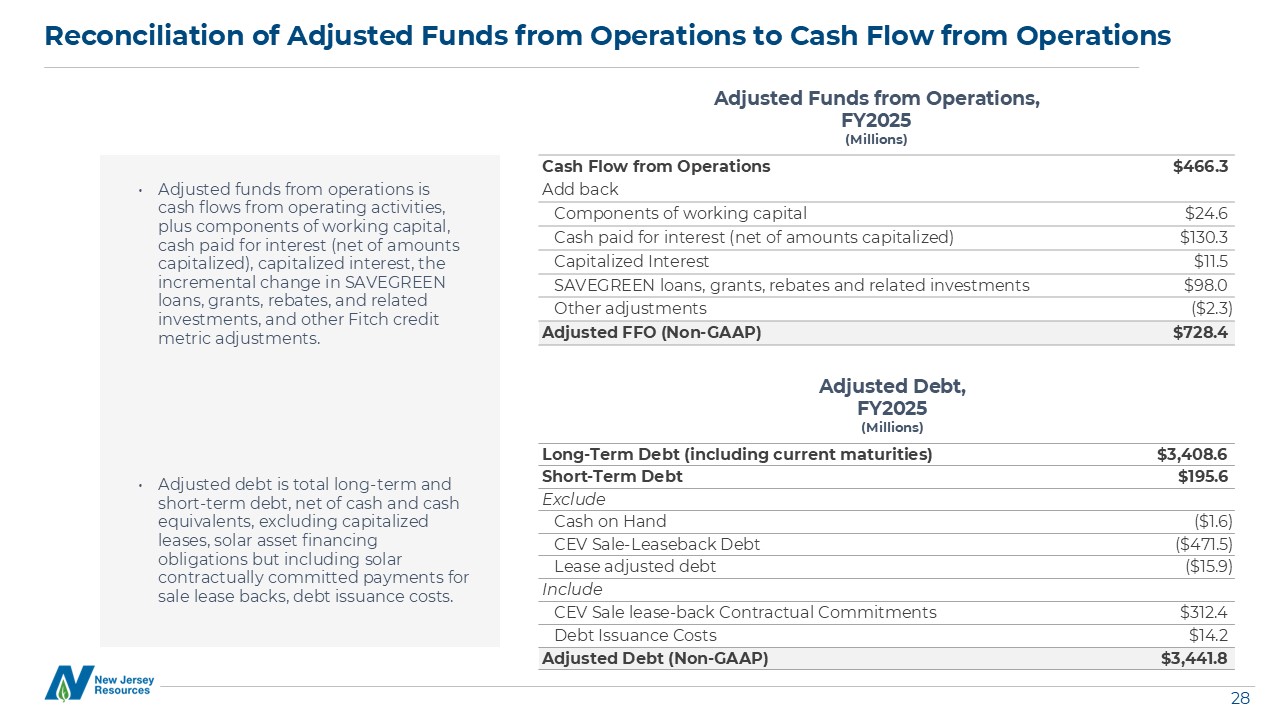
SAVEGREEN® invested a record $98.0 million in
fiscal 2025 in energy-efficiency upgrades for customers' homes and businesses. During fiscal 2025, NJNG recovered $15.7 million of its outstanding investments (program expenses, eligible for recovery) through its energy-efficiency rate. Investments in SAVEGREEN® are incremental to rate base and earn
near-real time returns through a rider that is updated annually.
|
|
NJR Reports Fiscal 2025 Fourth Quarter and
Year-End Results
|
|
Page 4 of 12
|
|
|
• |
In fiscal 2025, CEV placed eleven commercial
projects into service, adding 93.6 MW to installed capacity.
|
|
|
• |
As of September 30, 2025, CEV had approximately 479
MW of commercial solar capacity in service across New Jersey, New York, Connecticut, Pennsylvania, Rhode Island, Indiana, and Michigan.
|
| • |
Adelphia: On September 30, 2024, Adelphia filed a Section 4 rate case with the FERC seeking approval to revise its transportation cost-of-service rates to reflect investments made in its pipeline
system. On June 26, 2025, Adelphia reached a settlement in principle with customers participating in the rate case. Adelphia filed an offer of settlement with the FERC during the fourth quarter of fiscal 2025, and received the order
approving settlement on November 4, 2025.
|
| • |
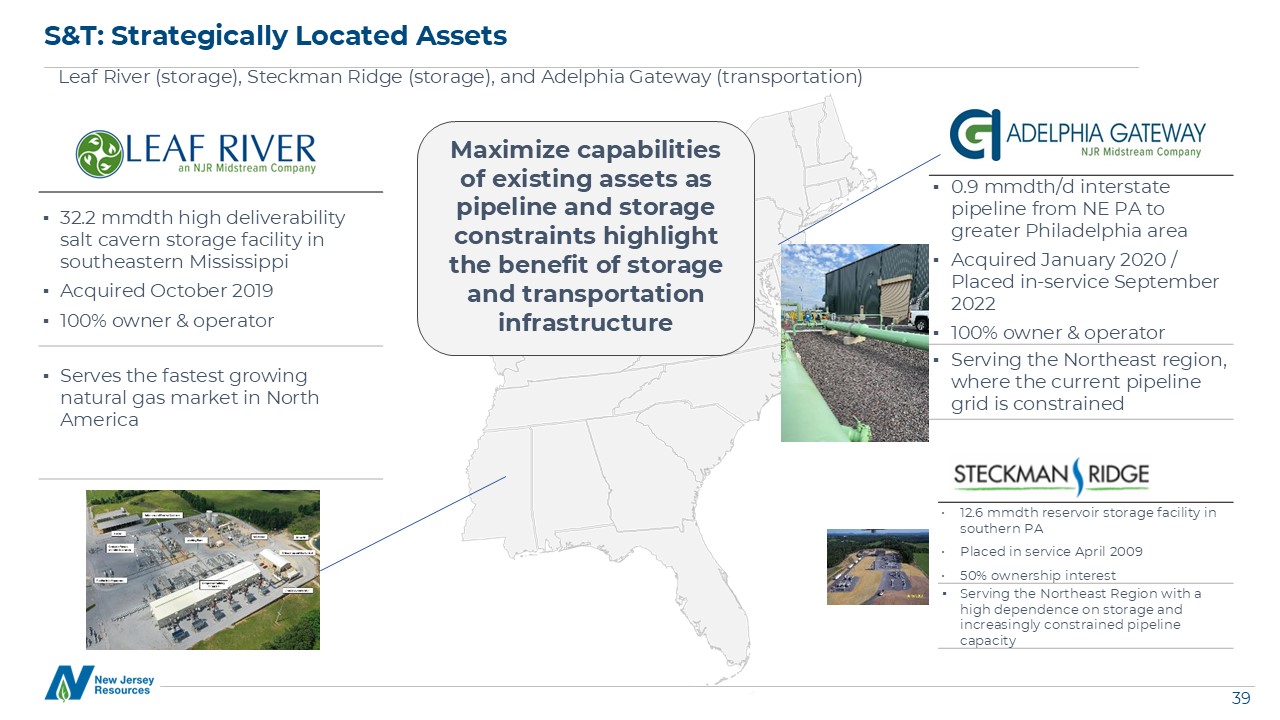
Leaf River: On October 31, 2025 Leaf River submitted an application to FERC to increase its certificated natural gas storage capacity by 17.6 BCF.
|
| • |
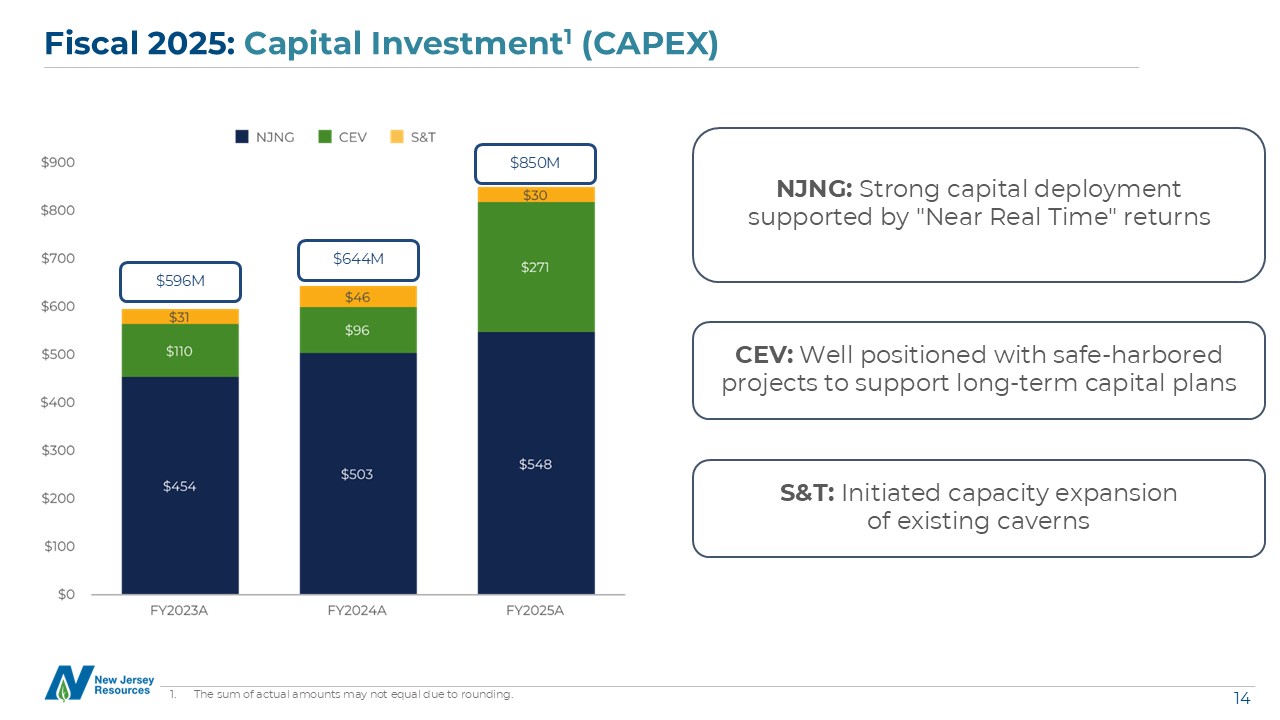
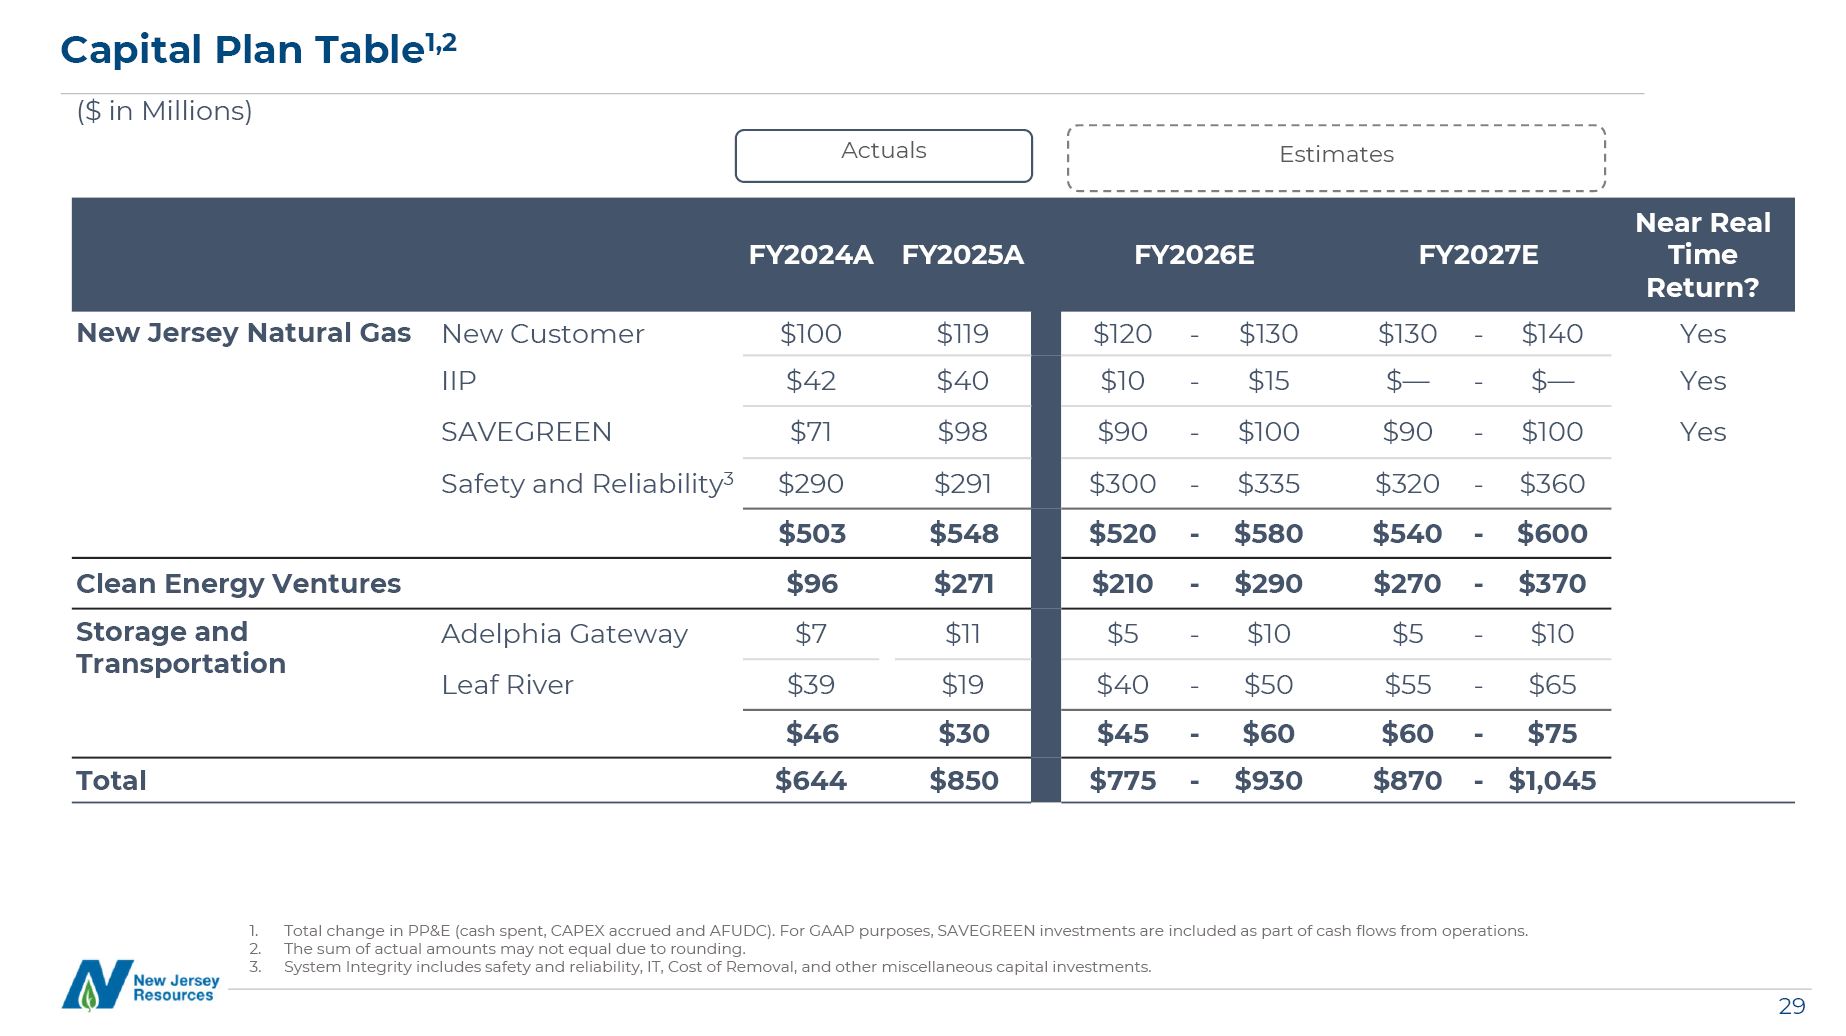
During fiscal 2025, capital expenditures were $752.5
million, including accruals, compared with $575.1 million in fiscal 2024. The
increase in capital expenditures was primarily due to higher expenditures at NJNG and CEV.
|
| • |
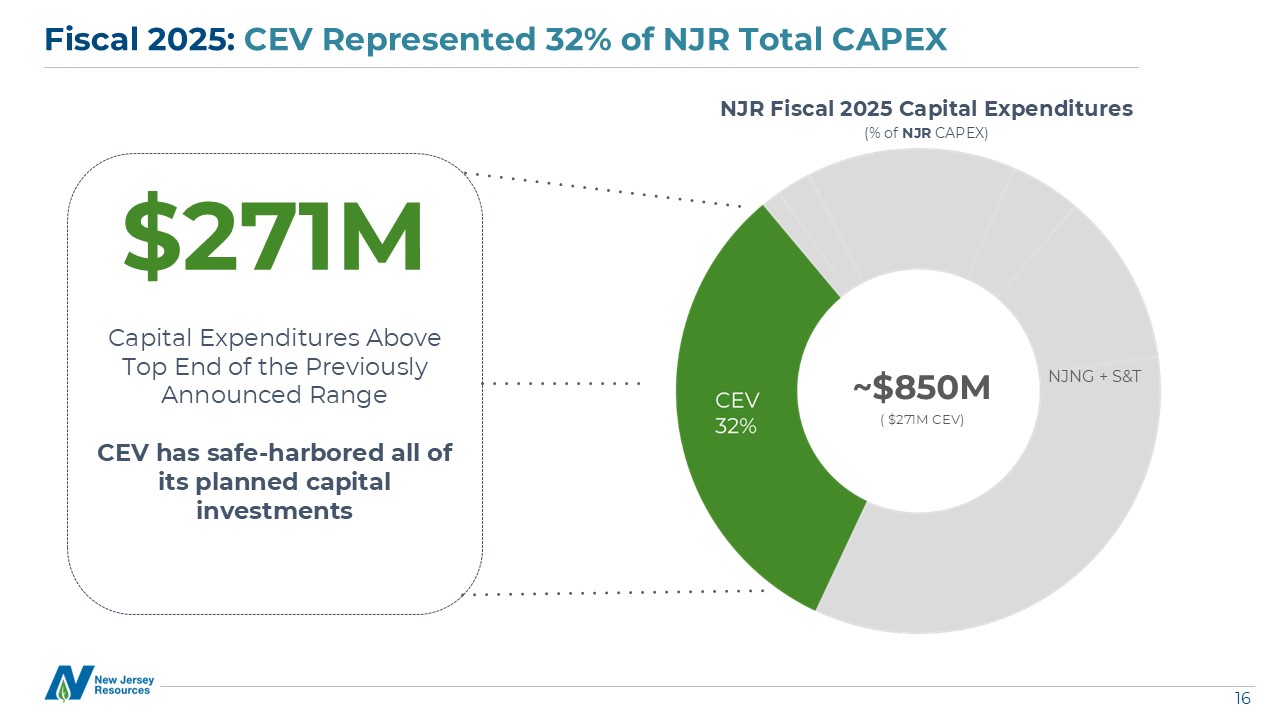
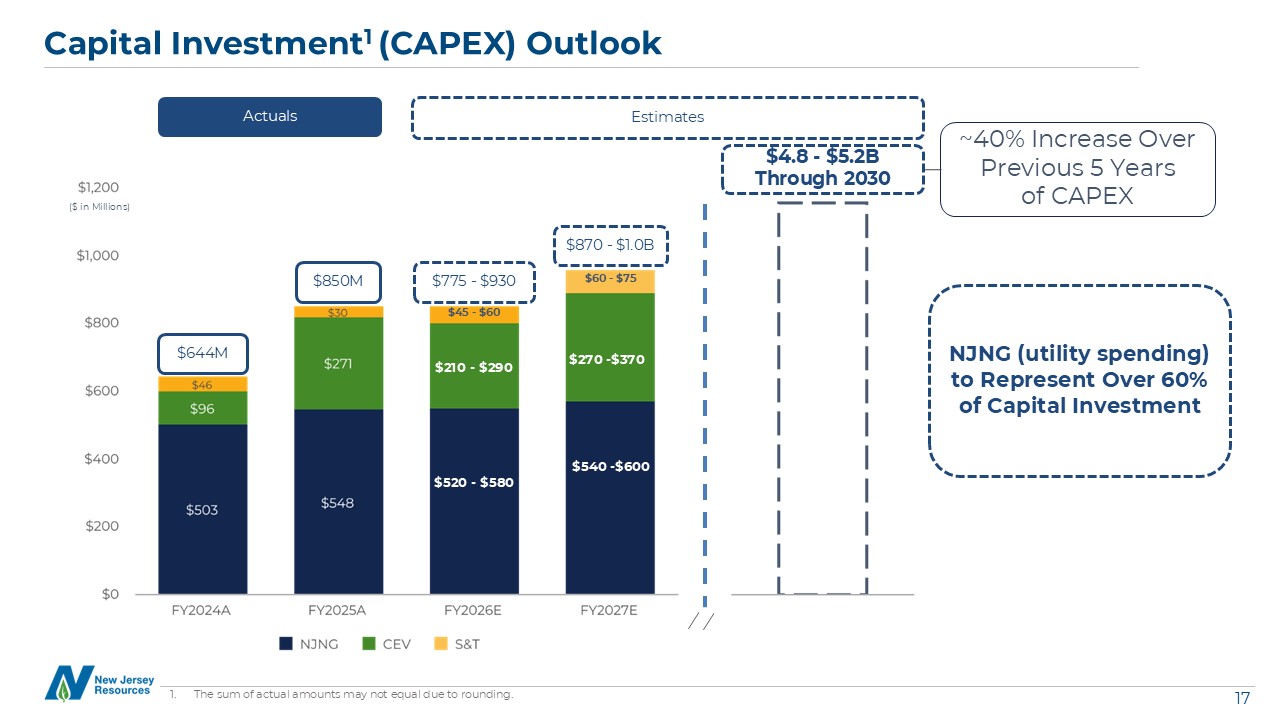
NJR expects to deploy between $4.8 billion and $5.2
billion in capital expenditures through 2030, with utility spending at NJNG representing over 60% of the investment, all planned CEV capital expenditures
safe-harbored to preserve tax credit eligibility, and strategic growth opportunities at S&T supporting long-term value creation.
|
| • |
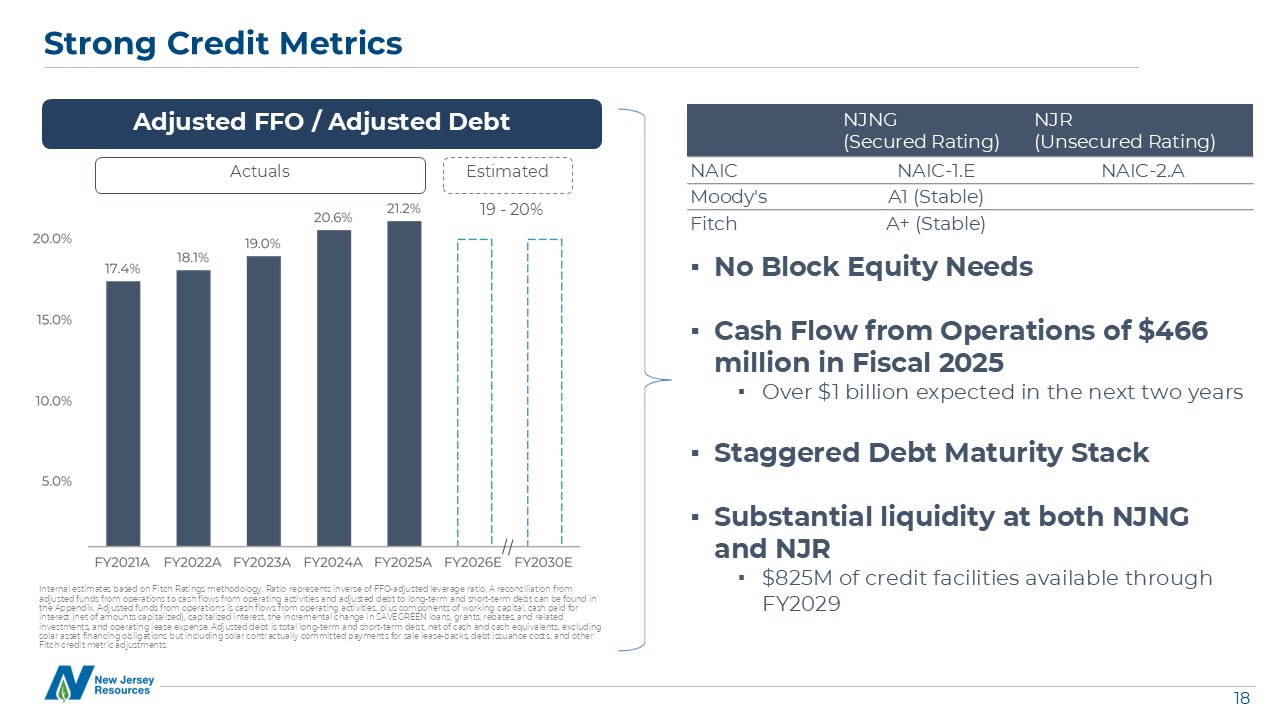
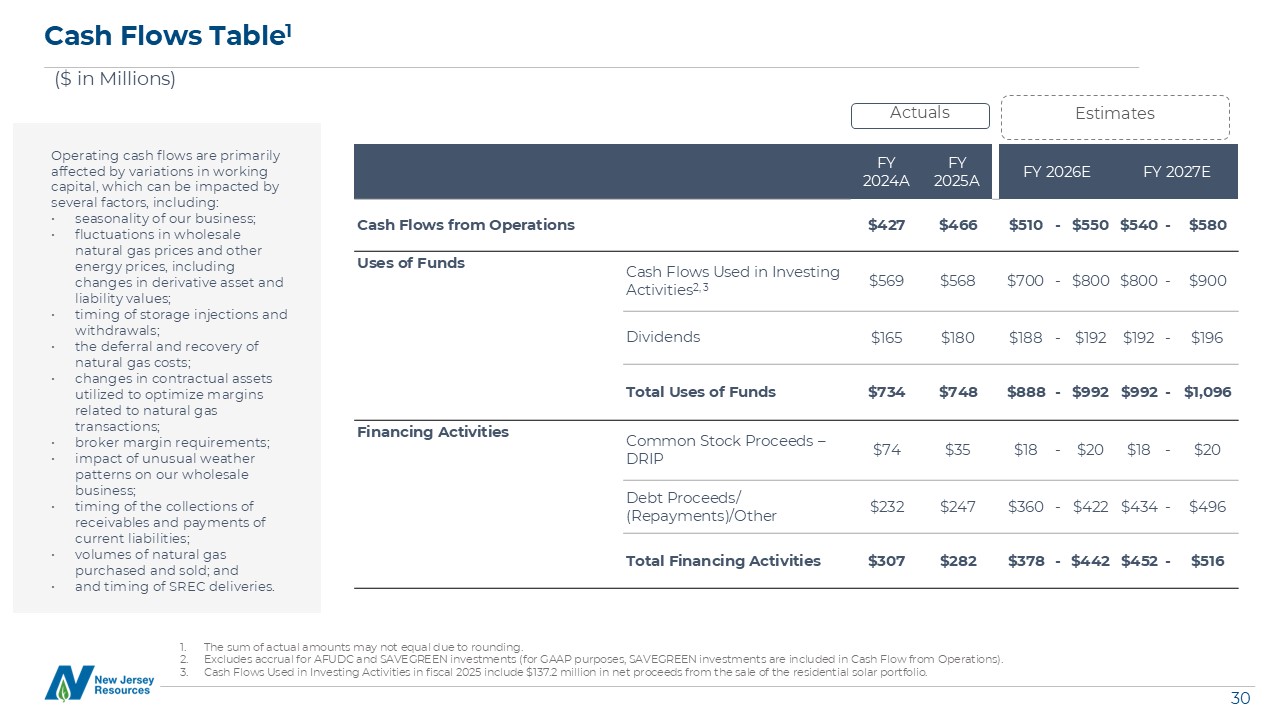
During fiscal 2025, cash flows from operations increased to $466.3 million, compared to cash flows from operations of $427.4 million in
fiscal 2024, due primarily to an increase in base rates at NJNG.
|
|
NJR Reports Fiscal 2025 Fourth Quarter and
Year-End Results
|
|
Page 5 of 12
|
|
NJR Reports Fiscal 2025 Fourth Quarter and
Year-End Results
|
|
Page 6 of 12
|
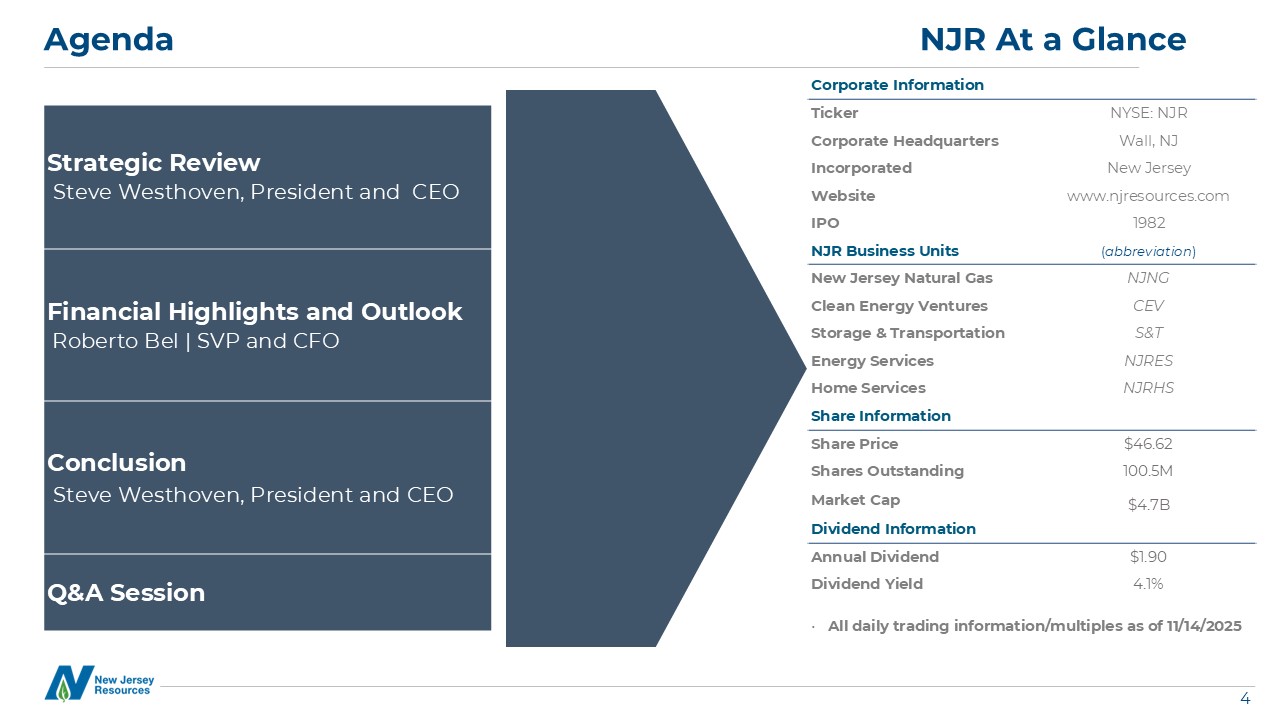
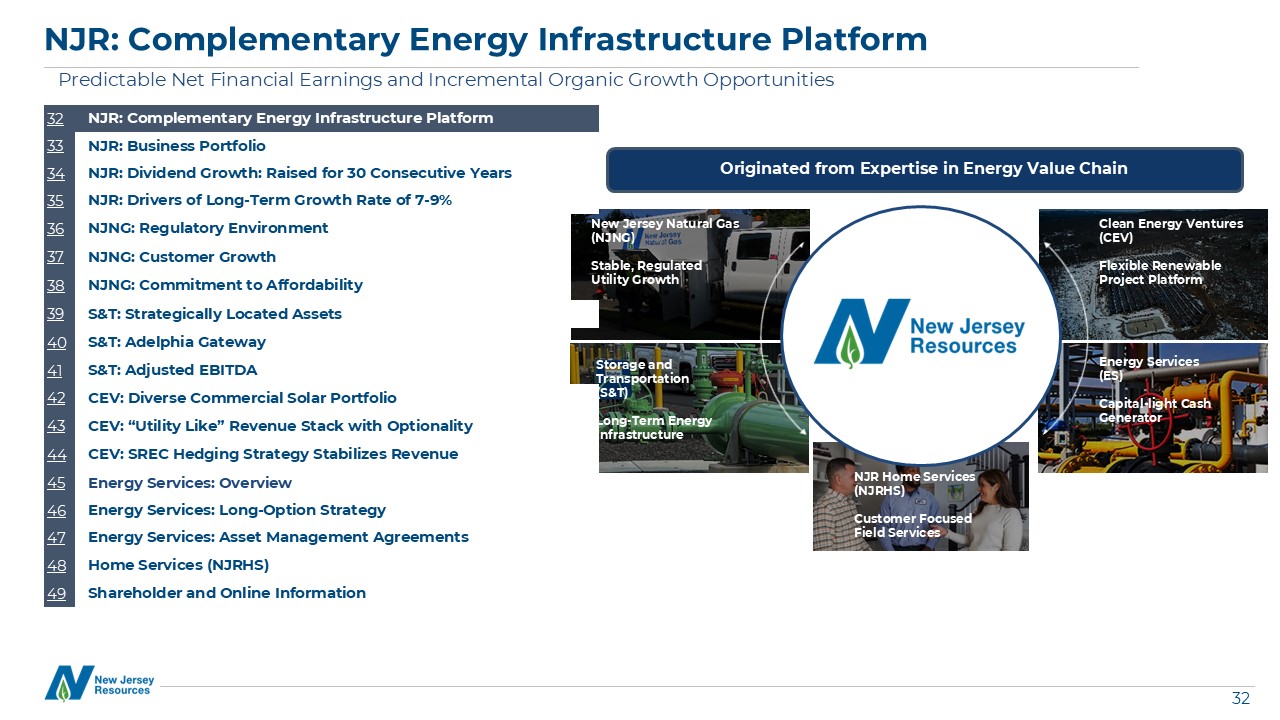
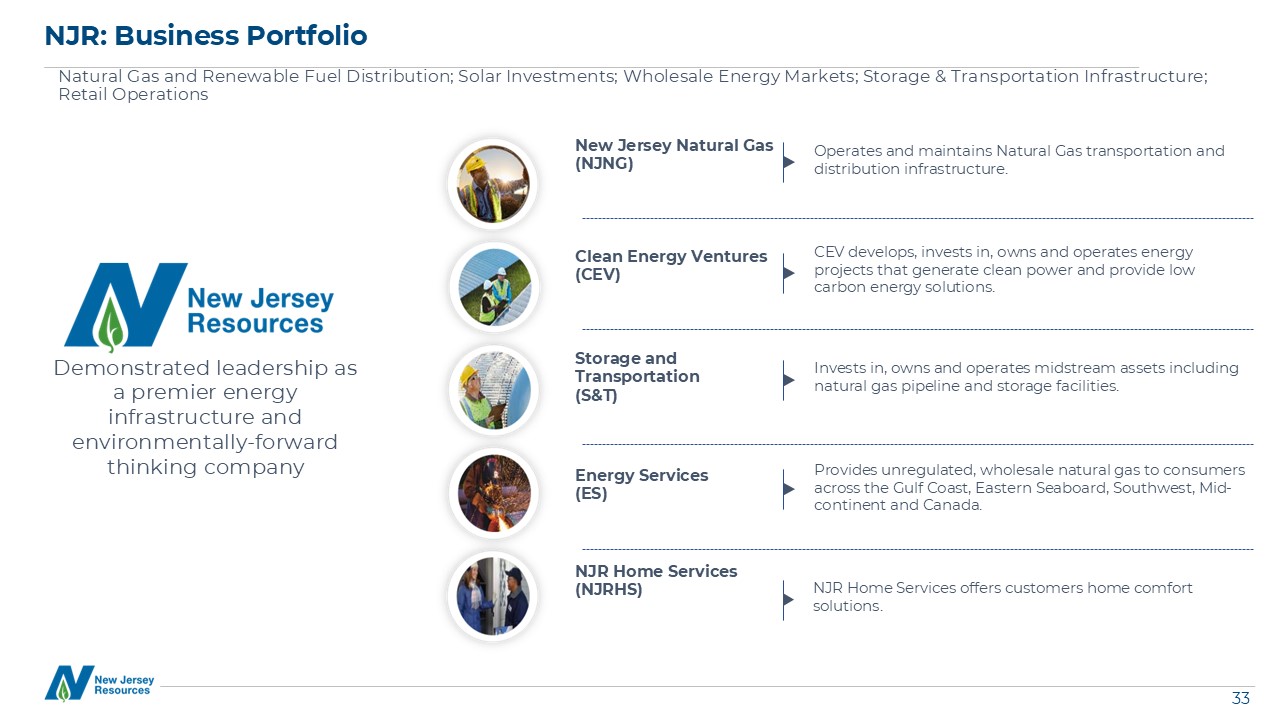
| • |
New Jersey Natural Gas, NJR’s principal subsidiary, operates and maintains natural gas transportation and distribution infrastructure to serve customers in New Jersey’s Monmouth, Ocean, Morris, Middlesex, Sussex and
Burlington counties.
|
| • |
Clean Energy Ventures invests in, owns and operates solar
projects, providing customers with low-carbon solutions.
|
| • |
Energy Services manages a diversified portfolio of natural
gas transportation and storage assets and provides physical natural gas services and customized energy solutions to its customers across North America.
|
| • |
Storage and Transportation serves customers from local
distributors and producers to electric generators and wholesale marketers through its ownership of Leaf River and the Adelphia Gateway pipeline, as well as our 50%
equity ownership in the Steckman Ridge natural gas storage facility.
|
| • |
Home Services provides service contracts as well as heating,
central air conditioning, water heaters, standby generators and other indoor and outdoor comfort products to residential homes throughout New Jersey.
|
|
NJR Reports Fiscal 2025 Fourth Quarter and
Year-End Results
|
|
Page 7 of 12
|
|
Three Months Ended
|
Twelve Months Ended
|
|||||||||||||||
|
September 30,
|
September 30,
|
|||||||||||||||
|
(Thousands, except per share data)
|
2025
|
2024
|
2025
|
2024
|
||||||||||||
|
OPERATING REVENUES
|
||||||||||||||||
|
Utility
|
$
|
144,938
|
$
|
104,753
|
$
|
1,301,496
|
$
|
1,018,482
|
||||||||
|
Nonutility
|
191,140
|
291,027
|
734,916
|
778,057
|
||||||||||||
|
Total operating revenues
|
336,078
|
395,780
|
2,036,412
|
1,796,539
|
||||||||||||
|
OPERATING EXPENSES
|
||||||||||||||||
|
Gas purchases
|
||||||||||||||||
|
Utility
|
47,128
|
31,493
|
521,103
|
405,332
|
||||||||||||
|
Nonutility
|
84,934
|
78,960
|
372,211
|
304,426
|
||||||||||||
|
Related parties
|
1,300
|
1,740
|
5,952
|
7,147
|
||||||||||||
|
Operation and maintenance
|
110,700
|
88,596
|
410,506
|
394,636
|
||||||||||||
|
Regulatory rider expenses
|
5,243
|
3,566
|
87,199
|
60,327
|
||||||||||||
|
Depreciation and amortization
|
48,478
|
45,298
|
188,774
|
166,567
|
||||||||||||
|
Gain on sale of assets
|
(2,108
|
)
|
—
|
(58,200
|
)
|
—
|
||||||||||
|
Total operating expenses
|
295,675
|
249,653
|
1,527,545
|
1,338,435
|
||||||||||||
|
OPERATING INCOME
|
40,403
|
146,127
|
508,867
|
458,104
|
||||||||||||
|
Other income, net
|
6,581
|
10,237
|
46,244
|
41,553
|
||||||||||||
|
Interest expense, net of capitalized interest
|
30,483
|
36,012
|
128,595
|
130,275
|
||||||||||||
|
INCOME BEFORE INCOME TAXES AND EQUITY IN EARNINGS OF AFFILIATES
|
16,501
|
120,352
|
426,516
|
369,382
|
||||||||||||
|
Income tax provision
|
3,121
|
30,787
|
96,956
|
84,906
|
||||||||||||
|
Equity in earnings of affiliates
|
1,692
|
1,561
|
6,067
|
5,299
|
||||||||||||
|
NET INCOME
|
$
|
15,072
|
$
|
91,126
|
$
|
335,627
|
$
|
289,775
|
||||||||
|
EARNINGS PER COMMON SHARE
|
||||||||||||||||
|
Basic
|
$
|
0.15
|
$
|
0.92
|
$
|
3.35
|
$
|
2.94
|
||||||||
|
Diluted
|
$
|
0.15
|
$
|
0.91
|
$
|
3.33
|
$
|
2.92
|
||||||||
|
WEIGHTED AVERAGE SHARES OUTSTANDING
|
||||||||||||||||
|
Basic
|
100,458
|
99,308
|
100,244
|
98,634
|
||||||||||||
|
Diluted
|
101,024
|
99,964
|
100,788
|
99,289
|
||||||||||||
|
NJR Reports Fiscal 2025 Fourth Quarter and
Year-End Results
|
|
Page 8 of 12
|
|
Three Months Ended
|
Twelve Months Ended
|
|||||||||||||||
|
September 30,
|
September 30,
|
|||||||||||||||
|
(Thousands)
|
2025
|
2024
|
2025
|
2024
|
||||||||||||
|
NEW JERSEY RESOURCES
|
||||||||||||||||
|
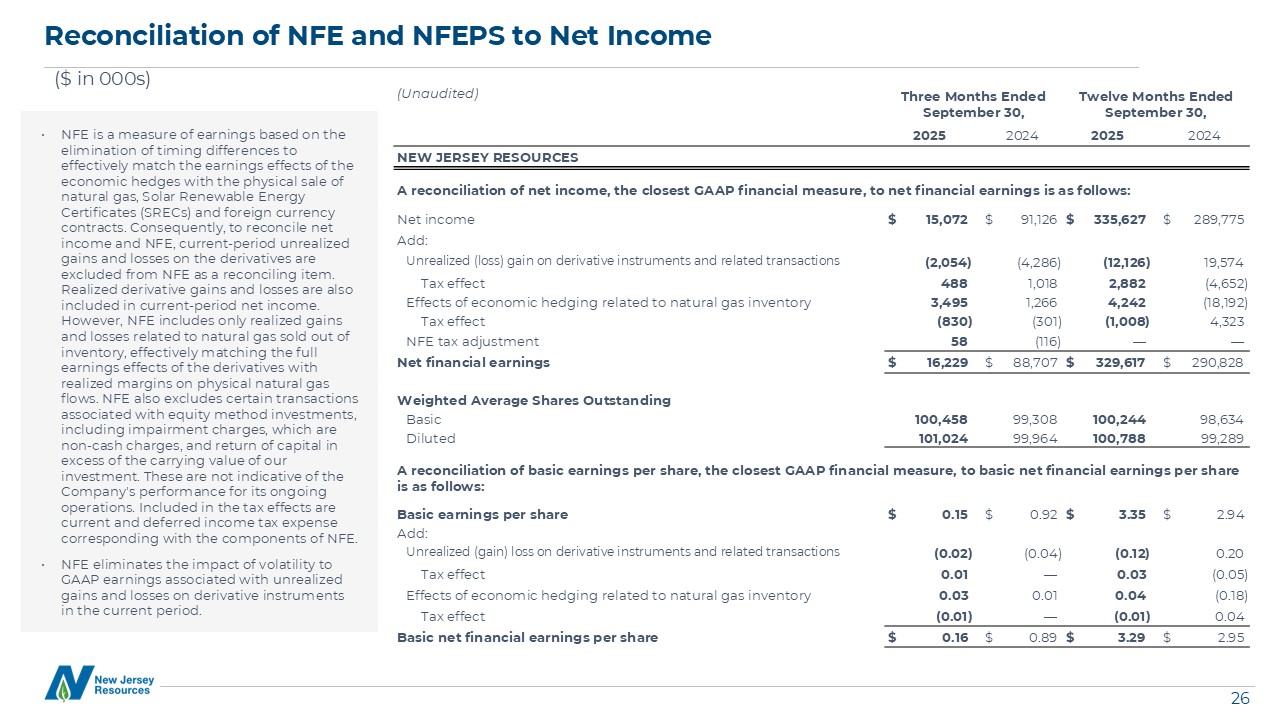
A reconciliation of net income, the closest GAAP financial measure, to net financial earnings is as follows:
|
||||||||||||||||
|
Net income
|
$
|
15,072
|
$
|
91,126
|
$
|
335,627
|
$
|
289,775
|
||||||||
|
Add:
|
||||||||||||||||
|
Unrealized (gain) loss on derivative instruments and related transactions
|
(2,054
|
)
|
(4,286
|
)
|
(12,126
|
)
|
19,574
|
|||||||||
|
Tax effect
|
488
|
1,018
|
2,882
|
(4,652
|
)
|
|||||||||||
|
Effects of economic hedging related to natural gas inventory
|
3,495
|
1,266
|
4,242
|
(18,192
|
)
|
|||||||||||
|
Tax effect
|
(830
|
)
|
(301
|
)
|
(1,008
|
)
|
4,323
|
|||||||||
|
NFE tax adjustment
|
58
|
(116
|
)
|
—
|
—
|
|||||||||||
|
Net financial earnings
|
$
|
16,229
|
$
|
88,707
|
$
|
329,617
|
$
|
290,828
|
||||||||
|
Weighted Average Shares Outstanding
|
||||||||||||||||
|
Basic
|
100,458
|
99,308
|
100,244
|
98,634
|
||||||||||||
|
Diluted
|
101,024
|
99,964
|
100,788
|
99,289
|
||||||||||||
|
A reconciliation of basic earnings per share, the closest GAAP financial measure, to basic net financial earnings per share is as follows:
|
||||||||||||||||
|
Basic earnings per share
|
$
|
0.15
|
$
|
0.92
|
$
|
3.35
|
$
|
2.94
|
||||||||
|
Add:
|
||||||||||||||||
|
Unrealized (gain) loss on derivative instruments and related transactions
|
$
|
(0.02
|
)
|
$
|
(0.04
|
)
|
$
|
(0.12
|
)
|
$
|
0.20
|
|||||
|
Tax effect
|
$
|
0.01
|
$
|
—
|
$
|
0.03
|
$
|
(0.05
|
)
|
|||||||
|
Effects of economic hedging related to natural gas inventory
|
$
|
0.03
|
$
|
0.01
|
$
|
0.04
|
$
|
(0.18
|
)
|
|||||||
|
Tax effect
|
$
|
(0.01
|
)
|
$
|
—
|
$
|
(0.01
|
)
|
$
|
0.04
|
||||||
|
Basic net financial earnings per share
|
$
|
0.16
|
$
|
0.89
|
$
|
3.29
|
$
|
2.95
|
||||||||
|
NJR Reports Fiscal 2025 Fourth Quarter and
Year-End Results
|
|
Page 9 of 12
|
|
Three Months Ended
|
Twelve Months Ended
|
|||||||||||||||
|
September 30,
|
September 30,
|
|||||||||||||||
|
(Thousands)
|
2025
|
2024
|
2025
|
2024
|
||||||||||||
|
NATURAL GAS DISTRIBUTION
|
||||||||||||||||
|
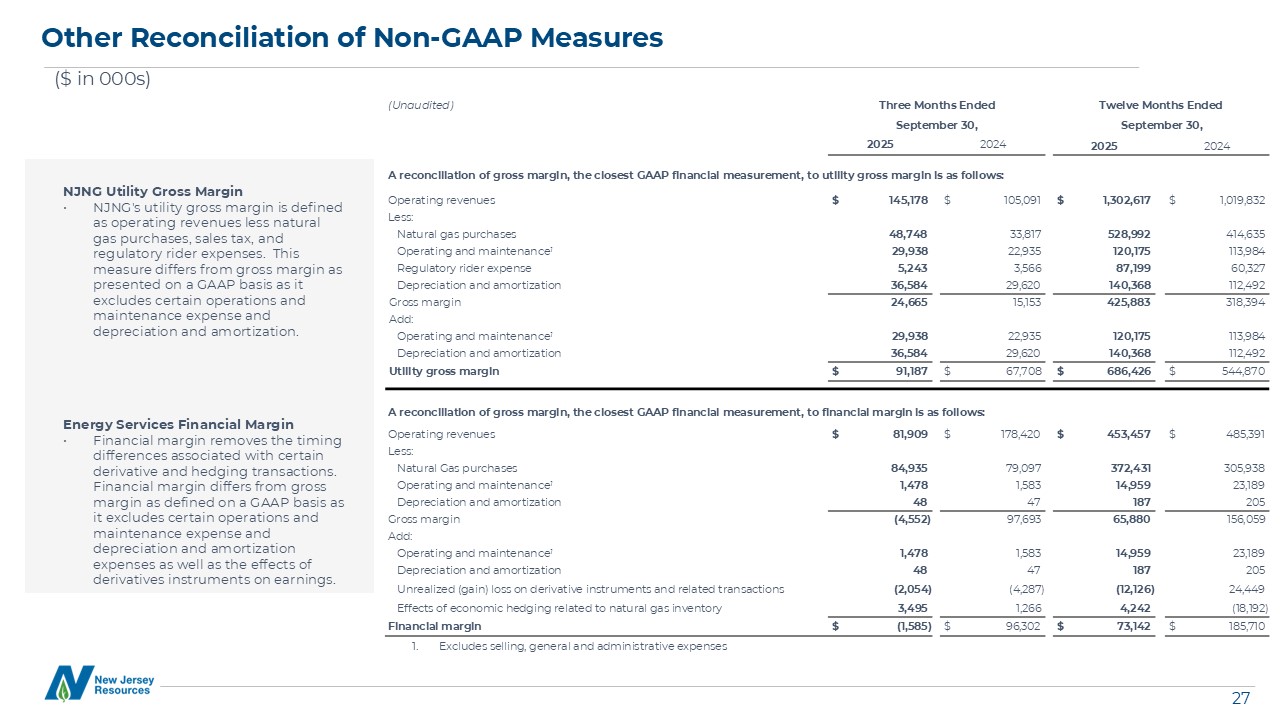
A reconciliation of gross margin, the closest GAAP financial measure, to utility gross margin is as follows:
|
||||||||||||||||
|
Operating revenues
|
$
|
145,178
|
$
|
105,091
|
$
|
1,302,617
|
$
|
1,019,832
|
||||||||
|
Less:
|
||||||||||||||||
|
Natural gas purchases
|
48,748
|
33,817
|
528,992
|
414,635
|
||||||||||||
|
Operating and maintenance (1)
|
29,938
|
22,935
|
120,175
|
113,984
|
||||||||||||
|
Regulatory rider expense
|
5,243
|
3,566
|
87,199
|
60,327
|
||||||||||||
|
Depreciation and amortization
|
36,584
|
29,620
|
140,368
|
112,492
|
||||||||||||
|
Gross margin
|
24,665
|
15,153
|
425,883
|
318,394
|
||||||||||||
|
Add:
|
||||||||||||||||
|
Operating and maintenance (1)
|
29,938
|
22,935
|
120,175
|
113,984
|
||||||||||||
|
Depreciation and amortization
|
36,584
|
29,620
|
140,368
|
112,492
|
||||||||||||
|
Utility gross margin
|
$
|
91,187
|
$
|
67,708
|
$
|
686,426
|
$
|
544,870
|
||||||||
|
(1) Excludes selling, general and
administrative expenses of $25.7 million and $23.6 million for the three months ended September 30, 2025 and 2024, respectively, and $110.7 million and $111.3 million for the fiscal years ended
September 30, 2025 and 2024, respectively.
|
||||||||||||||||
|
ENERGY SERVICES
|
||||||||||||||||
|
A reconciliation of gross margin, the closest GAAP financial measure, to Energy Services' financial margin is as follows:
|
||||||||||||||||
|
Operating revenues
|
$
|
81,909
|
$
|
178,420
|
$
|
453,457
|
$
|
485,391
|
||||||||
|
Less:
|
||||||||||||||||
|
Natural Gas purchases
|
84,935
|
79,097
|
372,431
|
305,938
|
||||||||||||
|
Operation and maintenance (1)
|
1,478
|
1,583
|
14,959
|
23,189
|
||||||||||||
|
Depreciation and amortization
|
48
|
47
|
187
|
205
|
||||||||||||
|
Gross margin
|
(4,552
|
)
|
97,693
|
65,880
|
156,059
|
|||||||||||
|
Add:
|
||||||||||||||||
|
Operation and maintenance (1)
|
1,478
|
1,583
|
14,959
|
23,189
|
||||||||||||
|
Depreciation and amortization
|
48
|
47
|
187
|
205
|
||||||||||||
|
Unrealized (gain) loss on derivative instruments and related transactions
|
(2,054
|
)
|
(4,287
|
)
|
(12,126
|
)
|
24,449
|
|||||||||
|
Effects of economic hedging related to natural gas inventory
|
3,495
|
1,266
|
4,242
|
(18,192
|
)
|
|||||||||||
|
Financial margin
|
$
|
(1,585
|
)
|
$
|
96,302
|
$
|
73,142
|
$
|
185,710
|
|||||||
|
(1) Excludes selling, general and
administrative expenses of $0.3 million and $0.5 million for the three months ended September 30, 2025 and 2024, respectively, and $1.1 million and $1.8 million for the fiscal years ended
September 30, 2025 and 2024, respectively.
|
||||||||||||||||
|
A reconciliation of net income, the closest GAAP financial measure, to net financial earnings is as follows:
|
||||||||||||||||
|
Net (loss) income
|
$
|
(5,689
|
)
|
$
|
70,703
|
$
|
40,878
|
$
|
106,745
|
|||||||
|
Add:
|
||||||||||||||||
|
Unrealized (gain) loss on derivative instruments and related transactions
|
(2,054
|
)
|
(4,287
|
)
|
(12,126
|
)
|
24,449
|
|||||||||
|
Tax effect
|
488
|
1,019
|
2,882
|
(5,810
|
)
|
|||||||||||
|
Effects of economic hedging related to natural gas
|
3,495
|
1,266
|
4,242
|
(18,192
|
)
|
|||||||||||
|
Tax effect
|
(830
|
)
|
(301
|
)
|
(1,008
|
)
|
4,323
|
|||||||||
|
NFE tax adjustment
|
58
|
(116
|
)
|
—
|
—
|
|||||||||||
|
Net financial (loss) earnings
|
$
|
(4,532
|
)
|
$
|
68,284
|
$
|
34,868
|
$
|
111,515
|
|||||||
|
NJR Reports Fiscal 2025 Fourth Quarter and
Year-End Results
|
|
Page 10 of 12
|
|
Three Months Ended
|
Twelve Months Ended
|
|||||||||||||||
|
September 30,
|
September 30,
|
|||||||||||||||
|
(Thousands, except per share data)
|
2025
|
2024
|
2025
|
2024
|
||||||||||||
|
NEW JERSEY RESOURCES
|
||||||||||||||||
|
Operating Revenues
|
||||||||||||||||
|
Natural Gas Distribution
|
$
|
145,178
|
$
|
105,091
|
$
|
1,302,617
|
$
|
1,019,832
|
||||||||
|
Clean Energy Ventures
|
66,098
|
71,295
|
112,501
|
130,563
|
||||||||||||
|
Energy Services
|
81,909
|
178,420
|
453,457
|
485,391
|
||||||||||||
|
Storage and Transportation
|
27,349
|
24,830
|
106,413
|
96,209
|
||||||||||||
|
Home Services and Other
|
15,799
|
16,540
|
62,888
|
62,635
|
||||||||||||
|
Sub-total
|
336,333
|
396,176
|
2,037,876
|
1,794,630
|
||||||||||||
|
Eliminations
|
(255
|
)
|
(396
|
)
|
(1,464
|
)
|
1,909
|
|||||||||
|
Total
|
$
|
336,078
|
$
|
395,780
|
$
|
2,036,412
|
$
|
1,796,539
|
||||||||
|
Operating (Loss) Income
|
||||||||||||||||
|
Natural Gas Distribution
|
$
|
(1,073
|
)
|
$
|
(8,399
|
)
|
$
|
315,182
|
$
|
207,118
|
||||||
|
Clean Energy Ventures
|
36,048
|
51,637
|
88,416
|
58,652
|
||||||||||||
|
Energy Services
|
(4,811
|
)
|
97,241
|
64,750
|
154,279
|
|||||||||||
|
Storage and Transportation
|
9,354
|
6,027
|
35,467
|
27,198
|
||||||||||||
|
Home Services and Other
|
(1,748
|
)
|
684
|
(81
|
)
|
2,642
|
||||||||||
|
Sub-total
|
37,770
|
147,190
|
503,734
|
449,889
|
||||||||||||
|
Eliminations
|
2,633
|
(1,063
|
)
|
5,133
|
8,215
|
|||||||||||
|
Total
|
$
|
40,403
|
$
|
146,127
|
$
|
508,867
|
$
|
458,104
|
||||||||
|
Equity in Earnings of Affiliates
|
||||||||||||||||
|
Storage and Transportation
|
$
|
783
|
$
|
956
|
$
|
3,813
|
$
|
2,816
|
||||||||
|
Eliminations
|
909
|
605
|
2,254
|
2,483
|
||||||||||||
|
Total
|
$
|
1,692
|
$
|
1,561
|
$
|
6,067
|
$
|
5,299
|
||||||||
|
Net (Loss) Income
|
||||||||||||||||
|
Natural Gas Distribution
|
$
|
(7,977
|
)
|
$
|
(19,000
|
)
|
$
|
213,541
|
$
|
133,400
|
||||||
|
Clean Energy Ventures
|
23,841
|
35,470
|
61,156
|
33,662
|
||||||||||||
|
Energy Services
|
(5,689
|
)
|
70,703
|
40,878
|
106,745
|
|||||||||||
|
Storage and Transportation
|
4,636
|
2,468
|
18,541
|
12,229
|
||||||||||||
|
Home Services and Other
|
(825
|
)
|
(639
|
)
|
(407
|
)
|
26
|
|||||||||
|
Sub-total
|
13,986
|
89,002
|
333,709
|
286,062
|
||||||||||||
|
Eliminations
|
1,086
|
2,124
|
1,918
|
3,713
|
||||||||||||
|
Total
|
$
|
15,072
|
$
|
91,126
|
$
|
335,627
|
$
|
289,775
|
||||||||
|
Net Financial (Loss) Earnings
|
||||||||||||||||
|
Natural Gas Distribution
|
$
|
(7,977
|
)
|
$
|
(19,000
|
)
|
$
|
213,541
|
$
|
133,400
|
||||||
|
Clean Energy Ventures
|
23,841
|
35,470
|
61,156
|
33,662
|
||||||||||||
|
Energy Services
|
(4,532
|
)
|
68,284
|
34,868
|
111,515
|
|||||||||||
|
Storage and Transportation
|
4,636
|
2,468
|
18,541
|
12,229
|
||||||||||||
|
Home Services and Other
|
(825
|
)
|
(639
|
)
|
(407
|
)
|
26
|
|||||||||
|
Sub-total
|
15,143
|
86,583
|
327,699
|
290,832
|
||||||||||||
|
Eliminations
|
1,086
|
2,124
|
1,918
|
(4
|
)
|
|||||||||||
|
Total
|
$
|
16,229
|
$
|
88,707
|
$
|
329,617
|
$
|
290,828
|
||||||||
|
Throughput (Bcf)
|
||||||||||||||||
|
NJNG, Core Customers
|
17.5
|
15.1
|
99.6
|
90.5
|
||||||||||||
|
NJNG, Off System/Capacity Management
|
14.8
|
8.4
|
66.4
|
85.0
|
||||||||||||
|
Energy Services Fuel Mgmt. and Wholesale Sales
|
26.5
|
33.3
|
108.6
|
125.3
|
||||||||||||
|
Total
|
58.8
|
56.8
|
274.6
|
300.8
|
||||||||||||
|
Common Stock Data
|
||||||||||||||||
|
Yield at September 30,
|
4.0
|
%
|
3.8
|
%
|
4.0
|
%
|
3.8
|
%
|
||||||||
|
Market Price at September 30,
|
$
|
48.15
|
$
|
47.20
|
$
|
48.15
|
$
|
47.20
|
||||||||
|
Shares Out. at September 30,
|
100,479
|
99,461
|
100,479
|
99,461
|
||||||||||||
|
Market Cap. at September 30,
|
$
|
4,838,044
|
$
|
4,694,580
|
$
|
4,838,044
|
$
|
4,694,580
|
||||||||
|
NJR Reports Fiscal 2025 Fourth Quarter and
Year-End Results
|
|
Page 11 of 12
|
|
Three Months Ended
|
Twelve Months Ended
|
|||||||||||||||
|
(Unaudited)
|
September 30,
|
September 30,
|
||||||||||||||
|
(Thousands, except customer and weather data)
|
2025
|
2024
|
2025
|
2024
|
||||||||||||
|
NATURAL GAS DISTRIBUTION
|
||||||||||||||||
|
Utility Gross Margin
|
||||||||||||||||
|
Operating revenues
|
$
|
145,178
|
$
|
105,091
|
$
|
1,302,617
|
$
|
1,019,832
|
||||||||
|
Less:
|
||||||||||||||||
|
Natural gas purchases
|
48,748
|
33,817
|
528,992
|
414,635
|
||||||||||||
|
Operating and maintenance (1)
|
29,938
|
22,935
|
120,175
|
113,984
|
||||||||||||
|
Regulatory rider expense
|
5,243
|
3,566
|
87,199
|
60,327
|
||||||||||||
|
Depreciation and amortization
|
36,584
|
29,620
|
140,368
|
112,492
|
||||||||||||
|
Gross margin
|
24,665
|
15,153
|
425,883
|
318,394
|
||||||||||||
|
Add:
|
||||||||||||||||
|
Operating and maintenance (1)
|
29,938
|
22,935
|
120,175
|
113,984
|
||||||||||||
|
Depreciation and amortization
|
36,584
|
29,620
|
140,368
|
112,492
|
||||||||||||
|
Total Utility Gross Margin
|
$
|
91,187
|
$
|
67,708
|
$
|
686,426
|
$
|
544,870
|
||||||||
|
(1) Excludes selling, general and
administrative expenses of $25.7 million and $23.6 million for the three months ended September 30, 2025 and 2024, respectively, and $110.7 million and $111.3 million for the fiscal years ended
September 30, 2025 and 2024, respectively.
|
||||||||||||||||
|
Utility Gross Margin, Operating Income and Net Income
|
||||||||||||||||
|
Residential
|
$
|
51,916
|
$
|
38,954
|
$
|
471,733
|
$
|
369,522
|
||||||||
|
Commercial, Industrial & Other
|
17,079
|
13,058
|
97,980
|
78,033
|
||||||||||||
|
Firm Transportation
|
16,793
|
12,888
|
93,543
|
75,641
|
||||||||||||
|
Total Firm Margin
|
85,788
|
64,900
|
663,256
|
523,196
|
||||||||||||
|
Interruptible
|
1,507
|
1,118
|
4,743
|
3,798
|
||||||||||||
|
Total System Margin
|
87,295
|
66,018
|
667,999
|
526,994
|
||||||||||||
|
Basic Gas Supply Service Incentive
|
3,892
|
1,690
|
18,427
|
17,876
|
||||||||||||
|
Total Utility Gross Margin
|
91,187
|
67,708
|
686,426
|
544,870
|
||||||||||||
|
Operation and maintenance expense
|
55,676
|
46,487
|
230,876
|
225,260
|
||||||||||||
|
Depreciation and amortization
|
36,584
|
29,620
|
140,368
|
112,492
|
||||||||||||
|
Operating (Loss) Income
|
$
|
(1,073
|
)
|
$
|
(8,399
|
)
|
$
|
315,182
|
$
|
207,118
|
||||||
|
Net (Loss) Income
|
$
|
(7,977
|
)
|
$
|
(19,000
|
)
|
$
|
213,541
|
$
|
133,400
|
||||||
|
Net Financial (Loss) Earnings
|
$
|
(7,977
|
)
|
$
|
(19,000
|
)
|
$
|
213,541
|
$
|
133,400
|
||||||
|
Throughput (Bcf)
|
||||||||||||||||
|
Residential
|
3.5
|
3.4
|
47.8
|
44.5
|
||||||||||||
|
Commercial, Industrial & Other
|
0.8
|
0.8
|
9.1
|
8.5
|
||||||||||||
|
Firm Transportation
|
1.4
|
1.4
|
11.7
|
11.7
|
||||||||||||
|
Total Firm Throughput
|
5.7
|
5.6
|
68.6
|
64.7
|
||||||||||||
|
Interruptible
|
11.8
|
9.5
|
31.0
|
25.8
|
||||||||||||
|
Total System Throughput
|
17.5
|
15.1
|
99.6
|
90.5
|
||||||||||||
|
Off System/Capacity Management
|
14.8
|
8.4
|
66.4
|
85.0
|
||||||||||||
|
Total Throughput
|
32.3
|
23.5
|
166.0
|
175.5
|
||||||||||||
|
Customers
|
||||||||||||||||
|
Residential
|
535,852
|
528,502
|
535,852
|
528,502
|
||||||||||||
|
Commercial, Industrial & Other
|
32,051
|
31,927
|
32,051
|
31,927
|
||||||||||||
|
Firm Transportation
|
20,967
|
22,442
|
20,967
|
22,442
|
||||||||||||
|
Total Firm Customers
|
588,870
|
582,871
|
588,870
|
582,871
|
||||||||||||
|
Interruptible
|
85
|
31
|
85
|
31
|
||||||||||||
|
Total System Customers
|
588,955
|
582,902
|
588,955
|
582,902
|
||||||||||||
|
Off System/Capacity Management*
|
20
|
14
|
20
|
14
|
||||||||||||
|
Total Customers
|
588,975
|
582,916
|
588,975
|
582,916
|
||||||||||||
|
*The number of customers represents those active during the last month of the period.
|
||||||||||||||||
|
Degree Days
|
||||||||||||||||
|
Actual
|
5
|
8
|
4,152
|
3,960
|
||||||||||||
|
Normal
|
25
|
25
|
4,395
|
4,463
|
||||||||||||
|
Percent of Normal
|
20.0
|
%
|
32.0
|
%
|
94.5
|
%
|
88.7
|
%
|
||||||||
|
NJR Reports Fiscal 2025 Fourth Quarter and
Year-End Results
|
|
Page 12 of 12
|
|
Three Months Ended
|
Twelve Months Ended
|
|||||||||||||||
|
(Unaudited)
|
September 30,
|
September 30,
|
||||||||||||||
|
(Thousands, except customer, RECs and megawatt)
|
2025
|
2024
|
2025
|
2024
|
||||||||||||
|
CLEAN ENERGY VENTURES
|
||||||||||||||||
|
Operating Revenues
|
||||||||||||||||
|
SREC sales
|
$
|
49,689
|
$
|
56,307
|
$
|
67,686
|
$
|
82,539
|
||||||||
|
TREC sales
|
6,095
|
4,296
|
15,676
|
13,396
|
||||||||||||
|
SREC II sales
|
754
|
621
|
1,899
|
1,715
|
||||||||||||
|
Merchant Power
|
5,080
|
3,548
|
12,789
|
9,024
|
||||||||||||
|
PPA / Other
|
4,480
|
3,464
|
12,581
|
11,910
|
||||||||||||
|
Residential solar portfolio
|
—
|
3,059
|
1,870
|
11,979
|
||||||||||||
|
Total Operating Revenues
|
$
|
66,098
|
$
|
71,295
|
$
|
112,501
|
$
|
130,563
|
||||||||
|
Depreciation and Amortization
|
$
|
6,404
|
$
|
7,035
|
$
|
24,105
|
$
|
27,869
|
||||||||
|
Operating Income
|
$
|
36,048
|
$
|
51,637
|
$
|
88,416
|
$
|
58,652
|
||||||||
|
Income Tax Provision
|
$
|
7,220
|
$
|
11,877
|
$
|
18,214
|
$
|
11,406
|
||||||||
|
Net Income
|
$
|
23,841
|
$
|
35,470
|
$
|
61,156
|
$
|
33,662
|
||||||||
|
Net Financial Earnings
|
$
|
23,841
|
$
|
35,470
|
$
|
61,156
|
$
|
33,662
|
||||||||
|
Solar Renewable Energy Certificates Generated
|
125,100
|
134,901
|
356,977
|
402,056
|
||||||||||||
|
Solar Renewable Energy Certificates Sold
|
241,119
|
294,943
|
328,776
|
419,266
|
||||||||||||
|
Transition Renewable Energy Certificates Generated
|
41,077
|
30,114
|
106,334
|
93,913
|
||||||||||||
|
Solar Renewable Energy Certificates II Generated
|
8,264
|
6,828
|
20,783
|
19,087
|
||||||||||||
|
ENERGY SERVICES
|
||||||||||||||||
|
Operating Income
|
||||||||||||||||
|
Operating revenues
|
$
|
81,909
|
$
|
178,420
|
$
|
453,457
|
$
|
485,391
|
||||||||
|
Less:
|
||||||||||||||||
|
Gas purchases
|
84,935
|
79,097
|
372,431
|
305,938
|
||||||||||||
|
Operation and maintenance expense
|
1,737
|
2,035
|
16,089
|
24,969
|
||||||||||||
|
Depreciation and amortization
|
48
|
47
|
187
|
205
|
||||||||||||
|
Operating (Loss) Income
|
$
|
(4,811
|
)
|
$
|
97,241
|
$
|
64,750
|
$
|
154,279
|
|||||||
|
Net (Loss) Income
|
$
|
(5,689
|
)
|
$
|
70,703
|
$
|
40,878
|
$
|
106,745
|
|||||||
|
Financial Margin
|
$
|
(1,585
|
)
|
$
|
96,302
|
$
|
73,142
|
$
|
185,710
|
|||||||
|
Net Financial (Loss) Earnings
|
$
|
(4,532
|
)
|
$
|
68,284
|
$
|
34,868
|
$
|
111,515
|
|||||||
|
Gas Sold and Managed (Bcf)
|
26.5
|
33.3
|
108.6
|
125.3
|
||||||||||||
|
STORAGE AND TRANSPORTATION
|
||||||||||||||||
|
Operating Revenues
|
$
|
27,349
|
$
|
24,830
|
$
|
106,413
|
$
|
96,209
|
||||||||
|
Equity in Earnings of Affiliates
|
$
|
783
|
$
|
956
|
$
|
3,813
|
$
|
2,816
|
||||||||
|
Operation and Maintenance Expense
|
$
|
12,527
|
$
|
12,341
|
$
|
46,930
|
$
|
43,083
|
||||||||
|
Other Income, Net
|
$
|
2,032
|
$
|
2,907
|
$
|
8,416
|
$
|
10,207
|
||||||||
|
Interest Expense
|
$
|
5,643
|
$
|
5,867
|
$
|
23,170
|
$
|
23,441
|
||||||||
|
Income Tax Provision
|
$
|
1,890
|
$
|
1,555
|
$
|
5,985
|
$
|
4,551
|
||||||||
|
Net Income
|
$
|
4,636
|
$
|
2,468
|
$
|
18,541
|
$
|
12,229
|
||||||||
|
Net Financial Earnings
|
$
|
4,636
|
$
|
2,468
|
$
|
18,541
|
$
|
12,229
|
||||||||
|
HOME SERVICES AND OTHER
|
||||||||||||||||
|
Operating Revenues
|
$
|
15,799
|
$
|
16,540
|
$
|
62,888
|
$
|
62,635
|
||||||||
|
Operating (Loss) Income
|
$
|
(1,748
|
)
|
$
|
684
|
$
|
(81
|
)
|
$
|
2,642
|
||||||
|
Net (Loss) Income
|
$
|
(825
|
)
|
$
|
(639
|
)
|
$
|
(407
|
)
|
$
|
26
|
|||||
|
Net Financial (Loss) Earnings
|
$
|
(825
|
)
|
$
|
(639
|
)
|
$
|
(407
|
)
|
$
|
26
|
|||||
|
Total Service Contract Customers at September 30
|
98,120
|
99,753
|
98,120
|
99,753
|
||||||||||||