|
Oklahoma
|
001-38656
|
20-0763496
|
|
(State or other jurisdiction of incorporation)
|
(Commission File Number)
|
(IRS Employer Identification No.)
|
| ☐ |
Written communications pursuant to Rule 425 under the Securities Act (17 CFR 230.425)
|
| ☐ |
Soliciting material pursuant to Rule 14a-12 under the Exchange Act (17 CFR 240.14a-12)
|
| ☐ |
Pre-commencement communications pursuant to Rule 14d-2(b) under the Exchange Act (17 CFR 240.14d-2(b))
|
| ☐ |
Pre-commencement communications pursuant to Rule 13e-4(c) under the Exchange Act (17 CFR 240.13e-4(c))
|
|
Title of each class
|
Trading Symbol(s)
|
Name of each exchange on which registered
|
|
| Common Stock, $0.01 par value |
BSVN |
The NASDAQ Global Select Market
|
| Item 2.02. |
Results of Operations and Financial Condition
|
| Item 7.01 |
Regulation FD Disclosure
|
| Item 9.01 |
Financial Statements and Exhibits
|
|
(d)
|
Exhibits.
|
|
Item
|
Description
|
||
|
Press Release dated October 15, 2025
|
|||
|
Third Quarter 2025 Investor Presentation
|
|
BANK7 CORP.
|
||
|
Date: October 15, 2025
|
By:
|
/s/ Kelly J. Harris
|
|
Kelly J. Harris
|
||
|
Executive Vice President and Chief Financial Officer
|
||
|
-
|
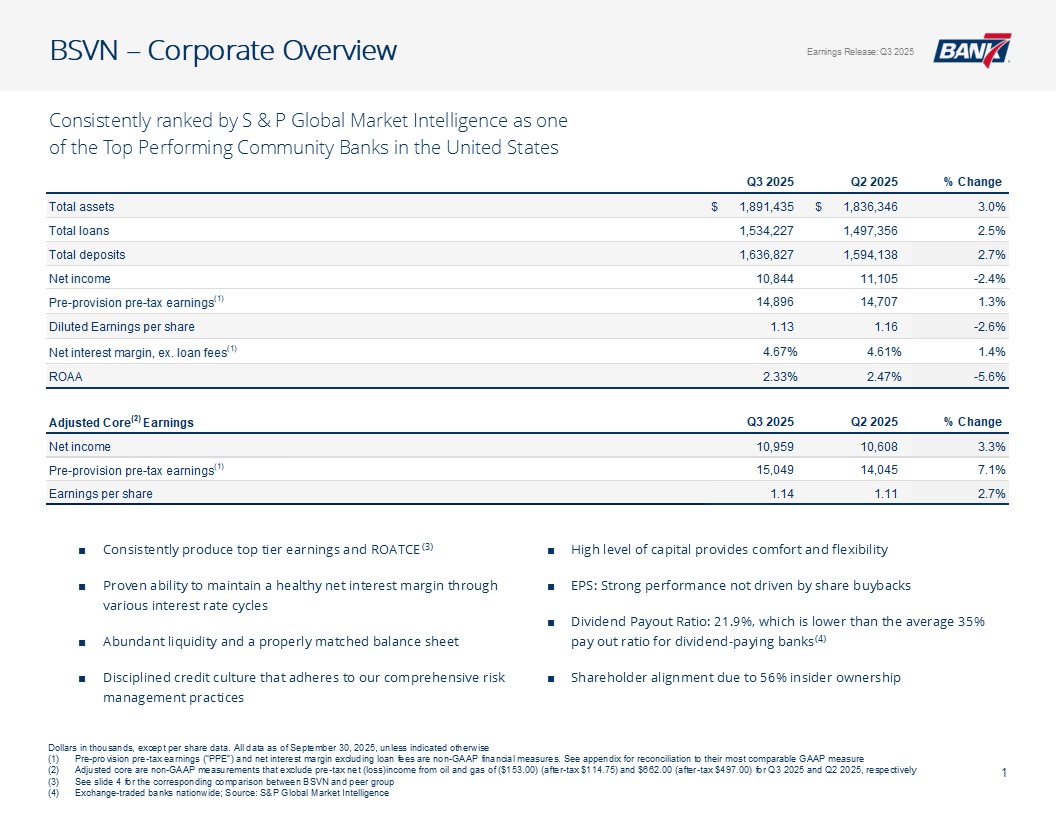
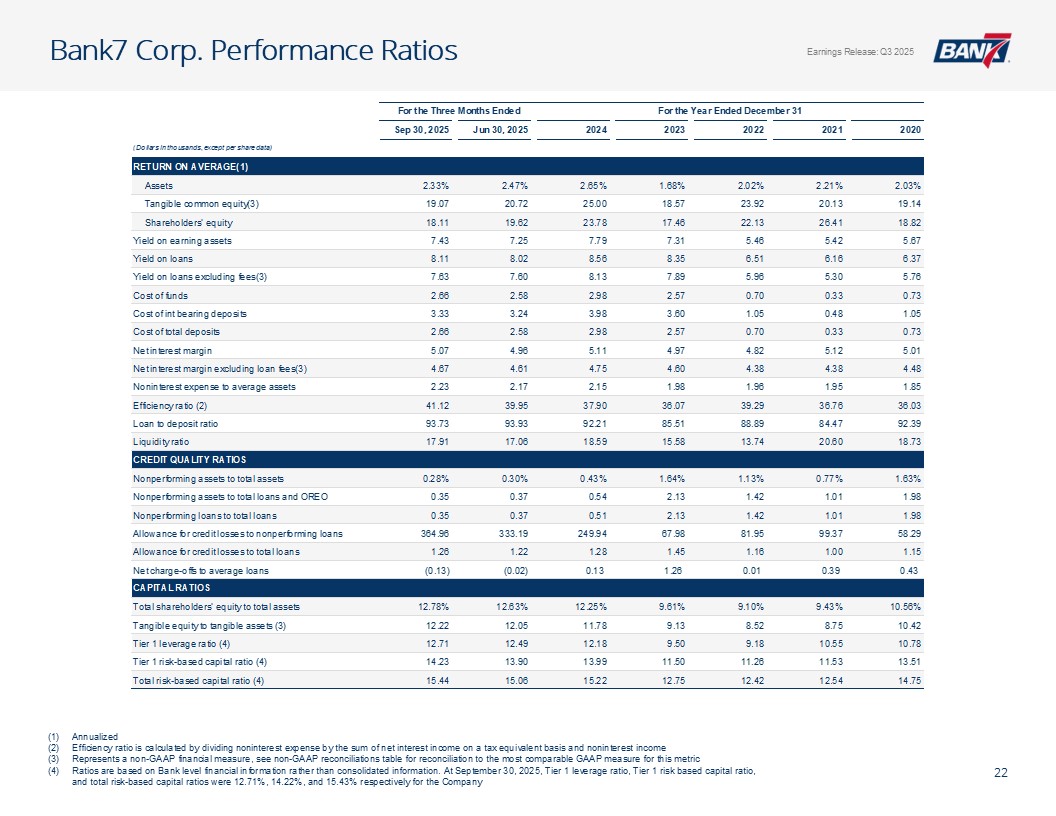
Net income of $10.8 million compared to $11.1 million, a decrease of 2.35%
|
|
-
|
Earnings per share of $1.13 compared to $1.16, a decrease of 2.59%
|
|
-
|
Total assets of $1.9 billion compared to $1.8 billion, an increase of 3.00%
|
|
-
|
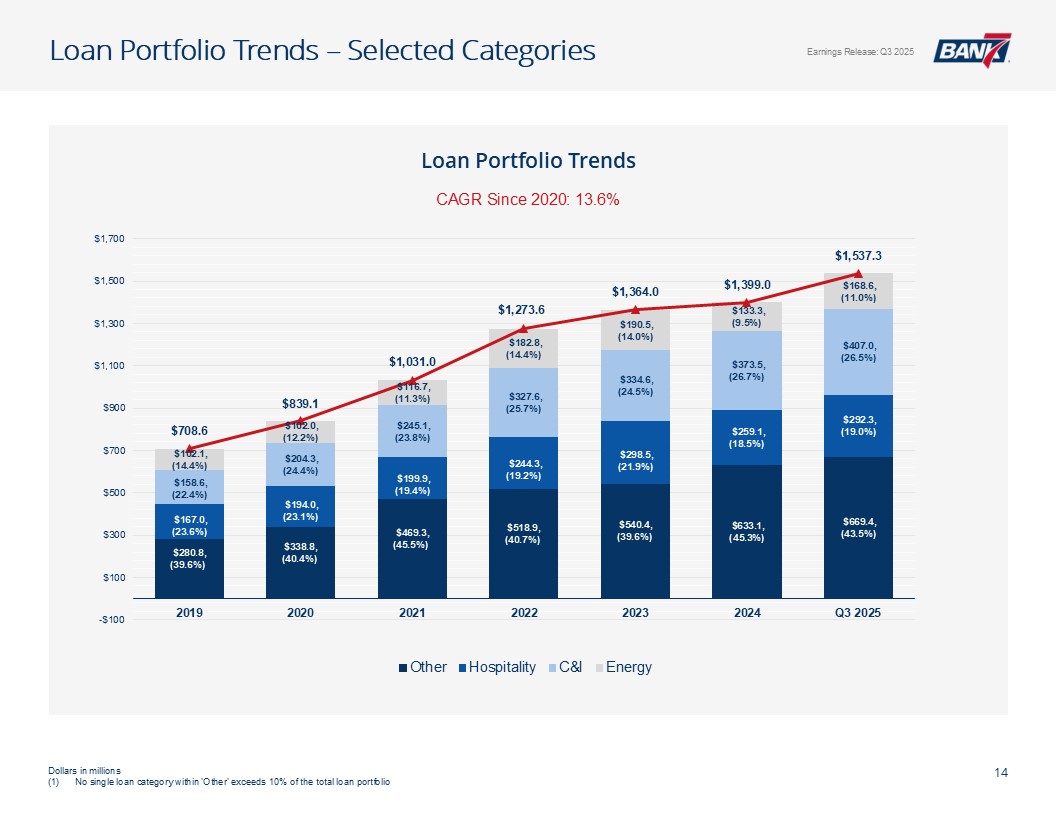
Total loans of $1.5 billion compared to $1.5 billion, an increase of 2.46%
|
|
-
|
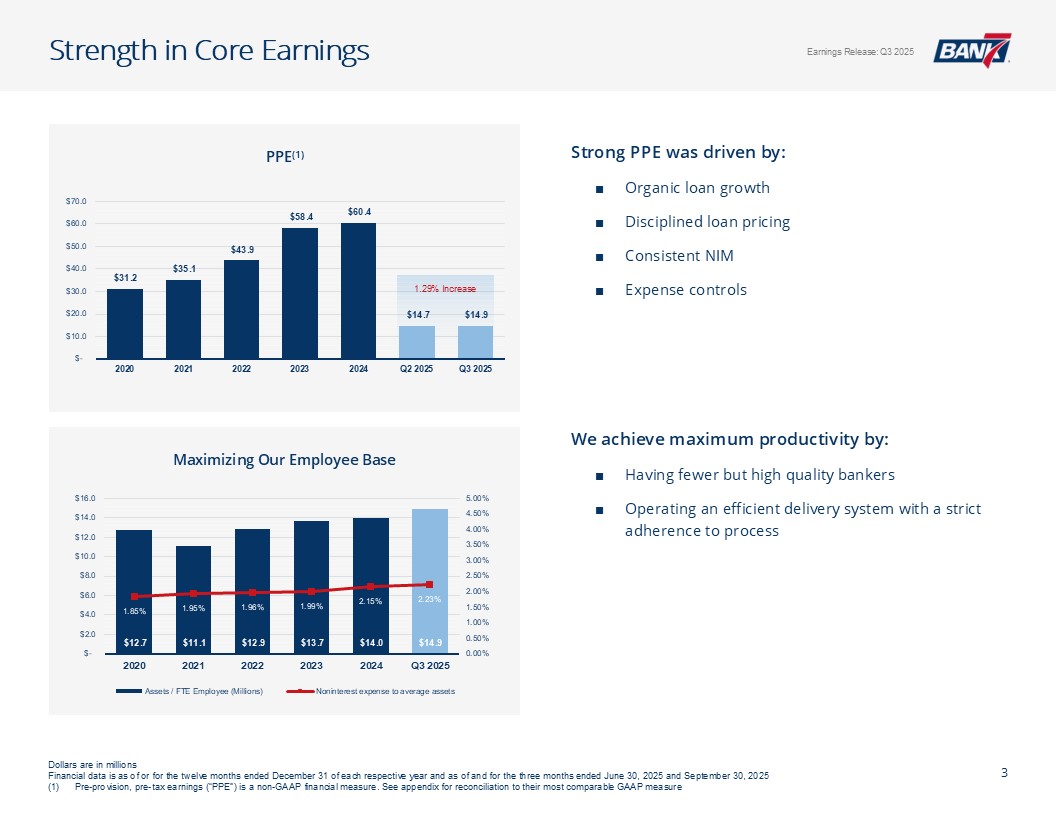
Pre-provision pre-tax earnings (“PPE”) of $14.9 million compared to $14.7 million, an increase of 1.29%
|
|
-
|
Total interest income of $33.7 million compared to $31.8 million, an increase of 6.09%
|
|
For the Three Months Ended
|
||||||||
|
September 30,
2025
|
June 30,
2025
|
|||||||
|
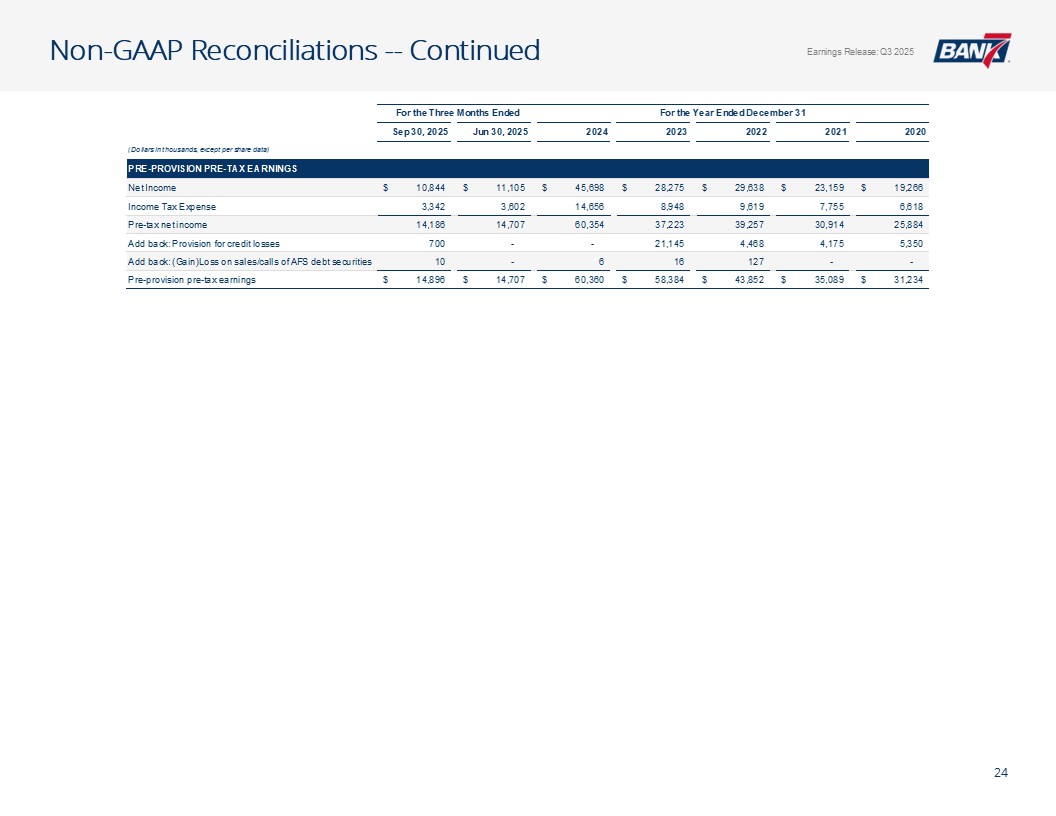
Calculation of Pre-Provision Pre-Tax Earnings (“PPE”)
|
(Dollars in thousands)
|
|||||||
|
Net Income
|
$
|
10,844
|
$
|
11,105
|
||||
|
Income Tax Expense
|
3,342
|
3,602
|
||||||
|
Pre-tax net income
|
14,186
|
14,707
|
||||||
|
Add back: Provision for credit losses
|
700
|
-
|
||||||
|
Add back: (Gain)Loss on sales/calls of AFS debt securities
|
10
|
-
|
||||||
|
Pre-provision pre-tax earnings
|
$
|
14,896
|
$
|
14,707
|
||||
|
Assets
|
September 30, 2025
(unaudited) |
December 31, 2024
|
||||||
|
|
(Dollars in thousands)
|
|||||||
|
Cash and due from banks
|
$
|
241,768
|
$
|
234,196
|
||||
|
Interest-bearing time deposits in other banks
|
14,935
|
6,719
|
||||||
|
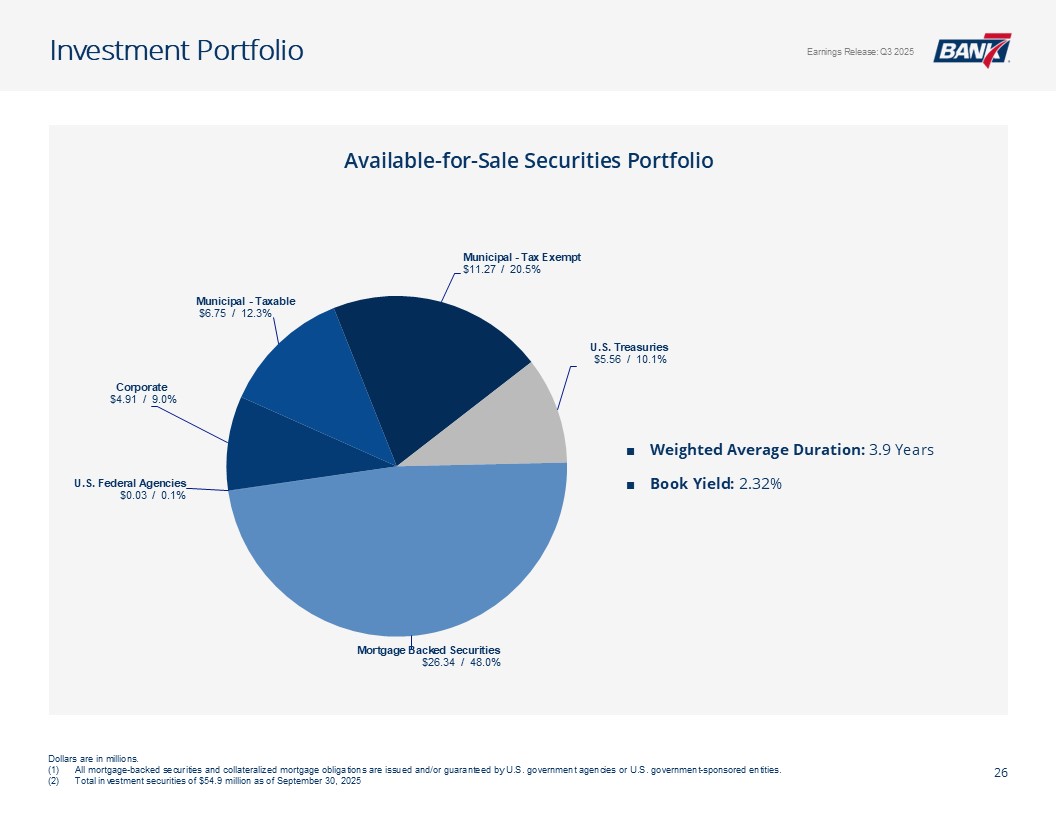
Available-for-sale debt securities (amortized cost of $58,771 and
$66,445 at September 30, 2025 and December 31, 2024)
|
54,858
|
59,941
|
||||||
|
Loans, net of allowance for credit losses of $19,405 and $17,918 at September 30,
2025 and December 31, 2024, respectively
|
1,514,822
|
1,379,465
|
||||||
|
Loans held for sale
|
1,883
|
-
|
||||||
|
Premises and equipment, net
|
21,057
|
18,137
|
||||||
|
Nonmarketable equity securities
|
1,169
|
1,283
|
||||||
|
Core deposit intangibles
|
784
|
878
|
||||||
|
Goodwill
|
11,208
|
8,458
|
||||||
|
Interest receivable and other assets
|
28,951
|
30,731
|
||||||
|
|
||||||||
|
Total assets
|
$
|
1,891,435
|
$
|
1,739,808
|
||||
|
|
||||||||
|
Liabilities and Shareholders’ Equity
|
||||||||
|
|
||||||||
|
Deposits
|
||||||||
|
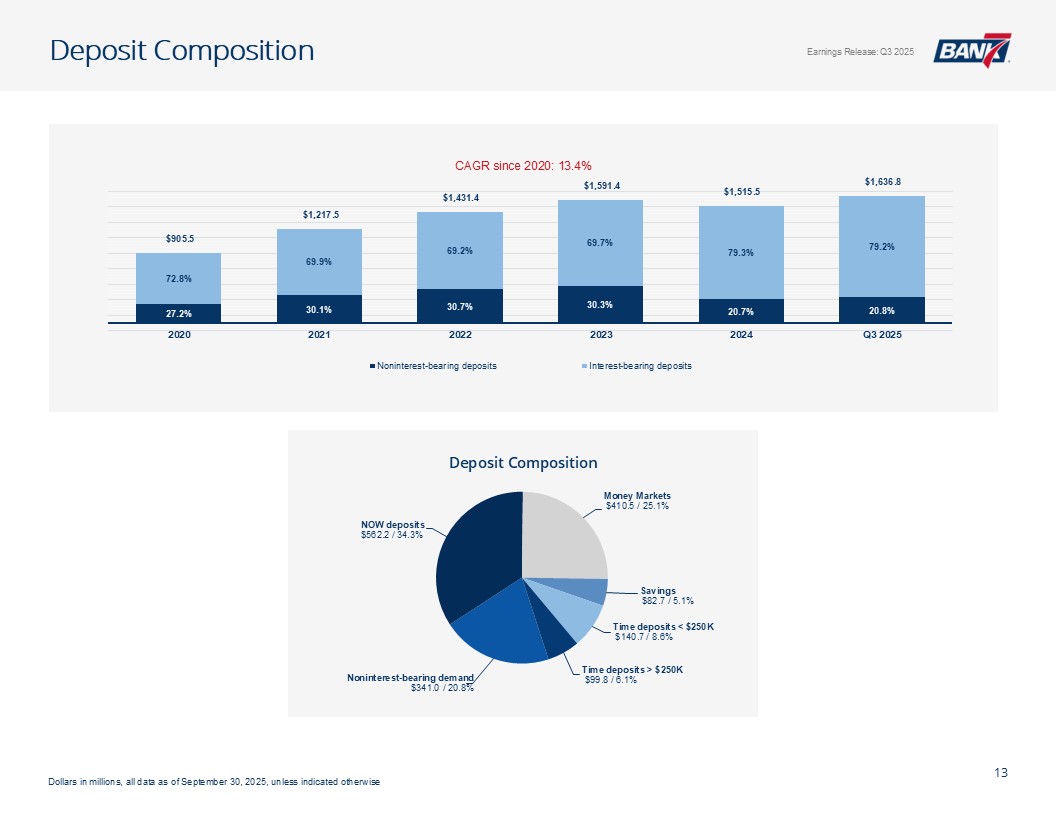
Noninterest-bearing
|
$
|
340,985
|
$
|
313,258
|
||||
|
Interest-bearing
|
1,295,842
|
1,202,213
|
||||||
|
|
||||||||
|
Total deposits
|
1,636,827
|
1,515,471
|
||||||
|
|
||||||||
|
Income taxes payable
|
146
|
77
|
||||||
|
Interest payable and other liabilities
|
12,726
|
11,047
|
||||||
|
|
||||||||
|
Total liabilities
|
1,649,699
|
1,526,595
|
||||||
|
|
||||||||
|
Shareholders’ equity
|
||||||||
|
Common stock, $0.01 par value; 50,000,000 shares authorized; shares issued and outstanding: 9,451,979 and
9,390,211 at September 30, 2025and December 31, 2024, respectively
|
95
|
94
|
||||||
|
Additional paid-in capital
|
103,184
|
101,809
|
||||||
|
Retained earnings
|
141,478
|
116,281
|
||||||
|
Accumulated other comprehensive loss
|
(3,021
|
)
|
(4,971
|
)
|
||||
|
|
||||||||
|
Total shareholders’ equity
|
241,736
|
213,213
|
||||||
|
|
||||||||
|
Total liabilities and shareholders’ equity
|
$
|
1,891,435
|
$
|
1,739,808
|
||||
|
|
Three Months Ended
|
Nine Months Ended
|
||||||||||||||
|
|
September 30,
|
September 30,
|
||||||||||||||
|
|
2025
(unaudited) |
2024
(unaudited) |
2025
(unaudited) |
2024
(unaudited) |
||||||||||||
|
Interest Income
|
(Dollars in thousands)
|
|||||||||||||||
|
Loans, including fees
|
$
|
30,914
|
$
|
30,791
|
$
|
87,207
|
$
|
89,834
|
||||||||
|
Interest-bearing time deposits in other banks
|
160
|
177
|
406
|
675
|
||||||||||||
|
Debt securities, taxable
|
266
|
303
|
827
|
2,266
|
||||||||||||
|
Debt securities, tax-exempt
|
60
|
69
|
187
|
214
|
||||||||||||
|
Other interest and dividend income
|
2,317
|
2,148
|
7,315
|
6,221
|
||||||||||||
|
|
||||||||||||||||
|
Total interest income
|
33,717
|
33,488
|
95,942
|
99,210
|
||||||||||||
|
|
||||||||||||||||
|
Interest Expense
|
||||||||||||||||
|
Deposits
|
10,691
|
12,271
|
30,334
|
34,752
|
||||||||||||
|
|
||||||||||||||||
|
Total interest expense
|
10,691
|
12,271
|
30,334
|
34,752
|
||||||||||||
|
|
||||||||||||||||
|
Net Interest Income
|
23,026
|
21,217
|
65,608
|
64,458
|
||||||||||||
|
|
||||||||||||||||
|
Provision for Credit Losses
|
700
|
-
|
700
|
-
|
||||||||||||
|
|
||||||||||||||||
|
Net Interest Income After Provision for Credit Losses
|
22,326
|
21,217
|
64,908
|
64,458
|
||||||||||||
|
|
||||||||||||||||
|
Noninterest Income
|
||||||||||||||||
|
Mortgage lending income
|
391
|
103
|
1,000
|
233
|
||||||||||||
|
Loss on sales, prepayments, and calls of available-for-sale debt securities
|
(10
|
)
|
(4
|
)
|
(10
|
)
|
(4
|
)
|
||||||||
|
Service charges on deposit accounts
|
248
|
233
|
697
|
742
|
||||||||||||
|
Other
|
1,581
|
3,345
|
4,976
|
7,881
|
||||||||||||
|
|
||||||||||||||||
|
Total noninterest income
|
2,210
|
3,677
|
6,663
|
8,852
|
||||||||||||
|
|
||||||||||||||||
|
Noninterest Expense
|
||||||||||||||||
|
Salaries and employee benefits
|
5,829
|
5,333
|
16,829
|
15,740
|
||||||||||||
|
Furniture and equipment
|
342
|
258
|
954
|
813
|
||||||||||||
|
Occupancy
|
668
|
711
|
1,890
|
1,985
|
||||||||||||
|
Data and item processing
|
515
|
498
|
1,615
|
1,437
|
||||||||||||
|
Accounting, marketing and legal fees
|
221
|
218
|
484
|
582
|
||||||||||||
|
Regulatory assessments
|
248
|
261
|
545
|
984
|
||||||||||||
|
Advertsing and public relations
|
212
|
129
|
629
|
358
|
||||||||||||
|
Travel, lodging and entertainment
|
112
|
87
|
289
|
270
|
||||||||||||
|
Other
|
2,203
|
1,903
|
5,729
|
5,507
|
||||||||||||
|
|
||||||||||||||||
|
Total noninterest expense
|
10,350
|
9,398
|
28,964
|
27,676
|
||||||||||||
|
|
||||||||||||||||
|
Income Before Taxes
|
14,186
|
15,496
|
42,607
|
45,634
|
||||||||||||
|
Income tax expense
|
3,342
|
3,719
|
10,322
|
11,045
|
||||||||||||
|
Net Income
|
$
|
10,844
|
$
|
11,777
|
$
|
32,285
|
$
|
34,589
|
||||||||
|
|
||||||||||||||||
|
Earnings per common share - basic
|
$
|
1.15
|
$
|
1.26
|
$
|
3.42
|
$
|
3.73
|
||||||||
|
Earnings per common share - diluted
|
1.13
|
1.24
|
3.38
|
3.68
|
||||||||||||
|
Weighted average common shares outstanding - basic
|
9,450,984
|
9,323,622
|
9,440,655
|
9,264,616
|
||||||||||||
|
Weighted average common shares outstanding - diluted
|
9,597,914
|
9,498,318
|
9,565,726
|
9,402,214
|
||||||||||||
|
|
||||||||||||||||
|
Other Comprehensive Income
|
||||||||||||||||
|
Unrealized gains on securities, net of tax expense of $223 and $515 for the three months ended September 30, 2025 and 2024,
respectively; net of tax expense of $406 and $638 for the nine months ended September 30, 2025 and 2024, respectively
|
$
|
713
|
$
|
1,628
|
$
|
1,942
|
$
|
2,025
|
||||||||
|
Reclassification adjustment for realized losses included in net income net of tax of $2 and $1 for the three months ended September 30, 2025, and 2024, respectively; $2 and $1 for the nine
months ended September 30, 2025 and 2024, respectively
|
8
|
3
|
8
|
3
|
||||||||||||
|
Other comprehensive income
|
$
|
721
|
$
|
1,631
|
$
|
1,950
|
$
|
2,028
|
||||||||
|
Comprehensive Income
|
$
|
11,565
|
$
|
13,408
|
$
|
34,235
|
$
|
36,617
|
||||||||
|
|
Net Interest Margin
|
|||||||||||||||||||||||
|
|
For the Three Months Ended September 30,
|
|||||||||||||||||||||||
|
|
2025
(unaudited) |
2024
(unaudited) |
||||||||||||||||||||||
|
|
Average
Balance |
Interest
Income/ Expense |
Average
Yield/ Rate |
Average
Balance |
Interest
Income/ Expense |
Average
Yield/ Rate |
||||||||||||||||||
|
|
(Dollars in thousands)
|
|||||||||||||||||||||||
|
Interest-Earning Assets:
|
||||||||||||||||||||||||
|
Short-term investments
|
$
|
228,755
|
$
|
2,477
|
4.30
|
%
|
$
|
191,583
|
$
|
2,325
|
4.81
|
%
|
||||||||||||
|
Debt securities, taxable-equivalent
|
45,853
|
266
|
2.30
|
51,172
|
303
|
2.35
|
||||||||||||||||||
|
Debt securities, tax exempt
|
11,972
|
60
|
1.99
|
16,889
|
69
|
1.62
|
||||||||||||||||||
|
Loans held for sale
|
1,780
|
-
|
-
|
250
|
-
|
-
|
||||||||||||||||||
|
Total loans(1)
|
1,512,147
|
30,914
|
8.11
|
1,418,512
|
30,791
|
8.61
|
||||||||||||||||||
|
Total interest-earning assets
|
1,800,507
|
33,717
|
7.43
|
1,678,406
|
33,488
|
7.92
|
||||||||||||||||||
|
Noninterest-earning assets
|
42,578
|
40,002
|
||||||||||||||||||||||
|
Total assets
|
$
|
1,843,085
|
$
|
1,718,408
|
||||||||||||||||||||
|
|
||||||||||||||||||||||||
|
Funding sources:
|
||||||||||||||||||||||||
|
Interest-bearing liabilities:
|
||||||||||||||||||||||||
|
Deposits:
|
||||||||||||||||||||||||
|
Transaction accounts
|
$
|
1,040,322
|
$
|
8,388
|
3.20
|
%
|
$
|
922,117
|
$
|
9,237
|
3.97
|
%
|
||||||||||||
|
Time deposits
|
233,433
|
2,303
|
3.91
|
253,640
|
3,034
|
4.75
|
||||||||||||||||||
|
Total interest-bearing deposits
|
1,273,755
|
10,691
|
3.33
|
1,175,757
|
12,271
|
4.14
|
||||||||||||||||||
|
Total interest-bearing liabilities
|
$
|
1,273,755
|
10,691
|
3.33
|
$
|
1,175,757
|
12,271
|
4.14
|
||||||||||||||||
|
|
||||||||||||||||||||||||
|
Noninterest-bearing liabilities:
|
||||||||||||||||||||||||
|
Noninterest-bearing deposits
|
$
|
320,238
|
$
|
332,487
|
||||||||||||||||||||
|
Other noninterest-bearing liabilities
|
11,501
|
12,221
|
||||||||||||||||||||||
|
Total noninterest-bearing liabilities
|
331,739
|
344,708
|
||||||||||||||||||||||
|
Shareholders’ equity
|
237,591
|
197,943
|
||||||||||||||||||||||
|
Total liabilities and shareholders’ equity
|
$
|
1,843,085
|
$
|
1,718,408
|
||||||||||||||||||||
|
|
||||||||||||||||||||||||
|
Net interest income
|
$
|
23,026
|
$
|
21,217
|
||||||||||||||||||||
|
Net interest spread
|
4.10
|
%
|
3.78
|
%
|
||||||||||||||||||||
|
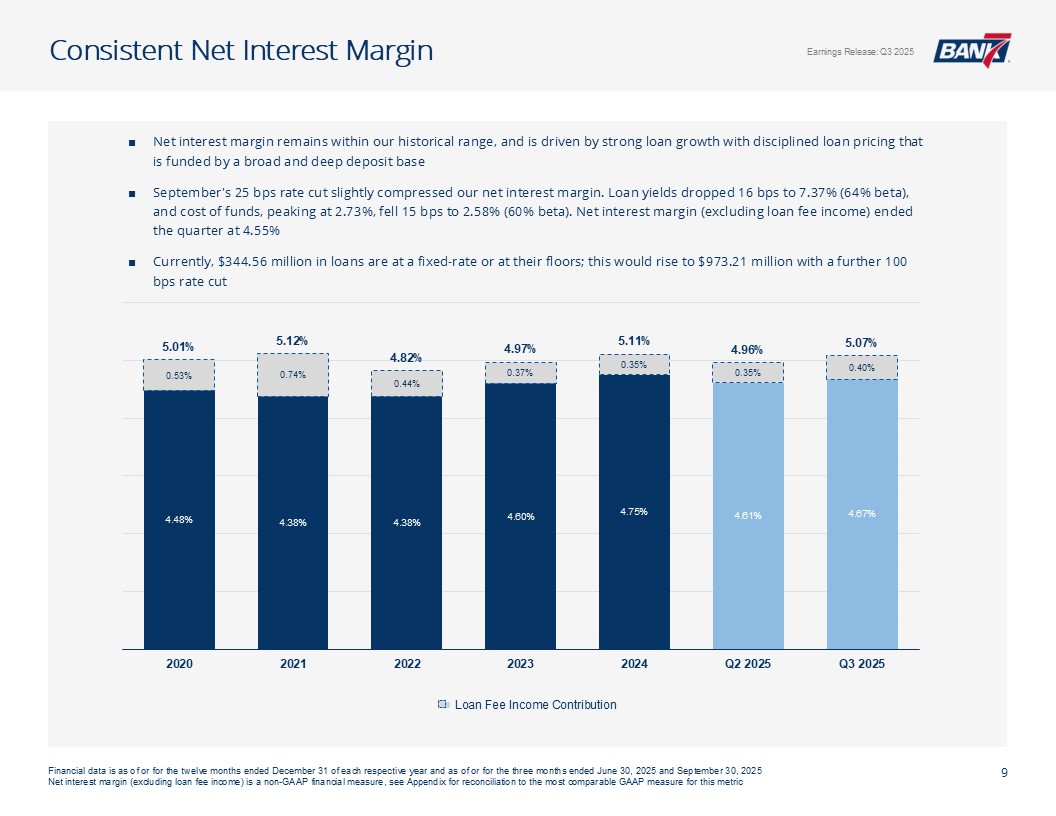
Net interest margin
|
5.07
|
%
|
5.02
|
%
|
||||||||||||||||||||
|
(1)
|
Nonaccrual loans are included in total loans
|
|
|
Net Interest Margin
|
|||||||||||||||||||||||
|
|
For the Nine Months Ended September 30,
|
|||||||||||||||||||||||
|
|
2025
(unaudited) |
2024
(unaudited) |
||||||||||||||||||||||
|
|
Average
Balance |
Interest
Income/ Expense |
Average
Yield/ Rate |
Average
Balance |
Interest
Income/ Expense |
Average
Yield/ Rate |
||||||||||||||||||
|
|
(Dollars in thousands)
|
|||||||||||||||||||||||
|
Interest-Earning Assets:
|
||||||||||||||||||||||||
|
Short-term investments
|
$
|
238,118
|
$
|
7,721
|
4.34
|
%
|
$
|
180,426
|
$
|
6,896
|
5.09
|
%
|
||||||||||||
|
Debt securities, taxable-equivalent
|
47,248
|
827
|
2.34
|
103,507
|
2,266
|
2.92
|
||||||||||||||||||
|
Debt securities, tax exempt
|
12,327
|
187
|
2.03
|
17,468
|
214
|
1.63
|
||||||||||||||||||
|
Loans held for sale
|
1,453
|
-
|
-
|
281
|
-
|
-
|
||||||||||||||||||
|
Total loans(1)
|
1,453,557
|
87,207
|
8.02
|
1,381,200
|
89,834
|
8.66
|
||||||||||||||||||
|
Total interest-earning assets
|
1,752,703
|
95,942
|
7.32
|
1,682,882
|
99,210
|
7.85
|
||||||||||||||||||
|
Noninterest-earning assets
|
41,871
|
39,499
|
||||||||||||||||||||||
|
Total assets
|
$
|
1,794,574
|
$
|
1,722,381
|
||||||||||||||||||||
|
|
||||||||||||||||||||||||
|
Funding sources:
|
||||||||||||||||||||||||
|
Interest-bearing liabilities:
|
||||||||||||||||||||||||
|
Deposits:
|
||||||||||||||||||||||||
|
Transaction accounts
|
$
|
1,001,583
|
$
|
23,182
|
3.09
|
%
|
$
|
872,635
|
$
|
25,726
|
3.93
|
%
|
||||||||||||
|
Time deposits
|
235,278
|
7,152
|
4.06
|
255,348
|
9,026
|
4.71
|
||||||||||||||||||
|
Total interest-bearing deposits
|
1,236,861
|
30,334
|
3.28
|
1,127,983
|
34,752
|
4.10
|
||||||||||||||||||
|
Total interest-bearing liabilities
|
$
|
1,236,861
|
$
|
30,334
|
3.28
|
$
|
1,127,983
|
$
|
34,752
|
4.10
|
||||||||||||||
|
|
||||||||||||||||||||||||
|
Noninterest-bearing liabilities:
|
||||||||||||||||||||||||
|
Noninterest-bearing deposits
|
$
|
319,346
|
$
|
395,822
|
||||||||||||||||||||
|
Other noninterest-bearing liabilities
|
10,657
|
12,219
|
||||||||||||||||||||||
|
Total noninterest-bearing liabilities
|
330,003
|
408,041
|
||||||||||||||||||||||
|
Shareholders’ equity
|
227,710
|
186,357
|
||||||||||||||||||||||
|
Total liabilities and shareholders’ equity
|
$
|
1,794,574
|
$
|
1,722,381
|
||||||||||||||||||||
|
|
||||||||||||||||||||||||
|
Net interest income
|
$
|
65,608
|
$
|
64,458
|
||||||||||||||||||||
|
Net interest spread
|
4.04
|
%
|
3.75
|
%
|
||||||||||||||||||||
|
Net interest margin
|
5.00
|
%
|
5.10
|
%
|
||||||||||||||||||||
|
(1)
|
Nonaccrual loans are included in total loans
|