|
Oklahoma
|
001-38656
|
20-0764349
|
|
(State or other jurisdiction of incorporation)
|
(Commission File Number)
|
(IRS Employer Identification No.)
|
| ☐ |
Written communications pursuant to Rule 425 under the Securities Act (17 CFR 230.425)
|
| ☐ |
Soliciting material pursuant to Rule 14a-12 under the Exchange Act (17 CFR 240.14a-12)
|
| ☐ |
Pre-commencement communications pursuant to Rule 14d-2(b) under the Exchange Act (17 CFR 240.14d-2(b))
|
| ☐ |
Pre-commencement communications pursuant to Rule 13e-4(c) under the Exchange Act (17 CFR 240.13e-4(c))
|
|
Title of each class
|
Trading
Symbol(s)
|
Name of each exchange on which
registered
|
| Common Stock, $0.01 par value |
BSVN
|
The NASDAQ Global Select Market
|
|
|
Emerging growth company ☐ |
| Item 2.02. |
Results of Operations and Financial Condition
|
| Item 7.01 |
Regulation FD Disclosure
|
| Item 9.01 |
Financial Statements and Exhibits
|
|
(d)
|
Exhibits.
|
|
|
Item
|
|
Description
|
|
|
|
|
|
|
|
|
Press Release dated July 17, 2025
|
|
|
|
|
Second Quarter 2025 Investor Presentation
|
|
|
BANK7 CORP.
|
|
|
|
|
|
|
Date: July 17, 2025
|
By:
|
/s/ Kelly J. Harris
|
|
|
|
Kelly J. Harris
|
|
|
Executive Vice President and Chief Financial Officer
|
|
|
|
- |
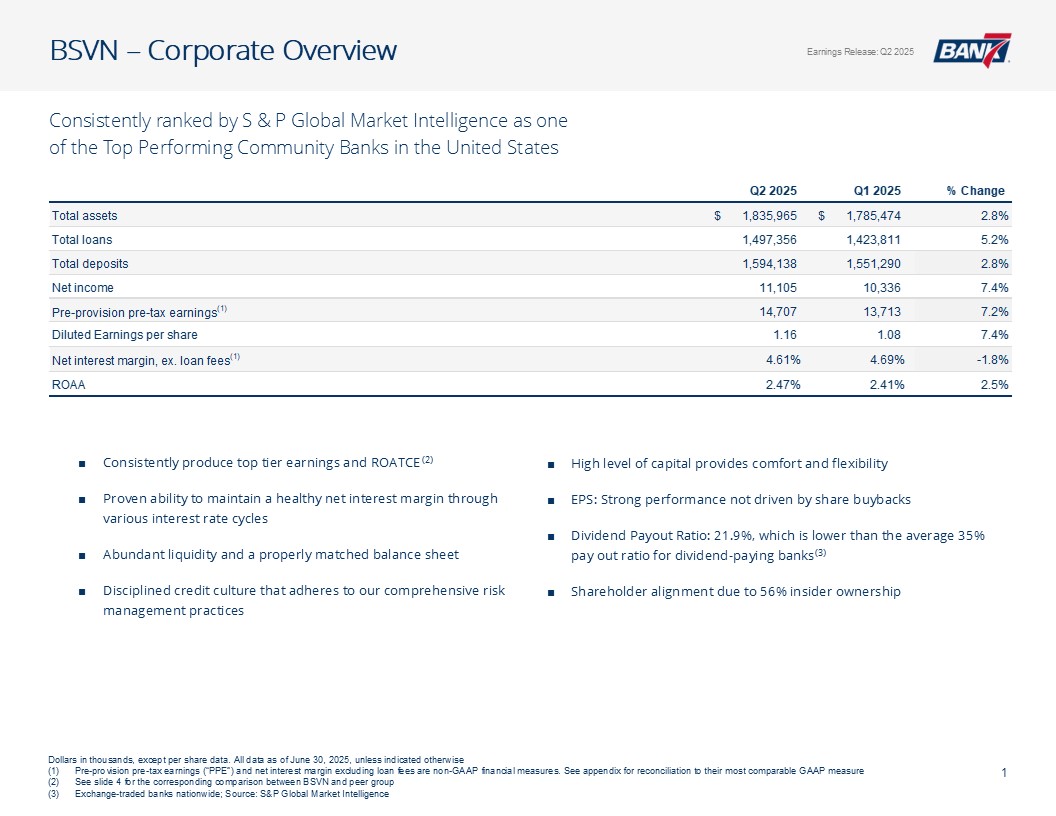
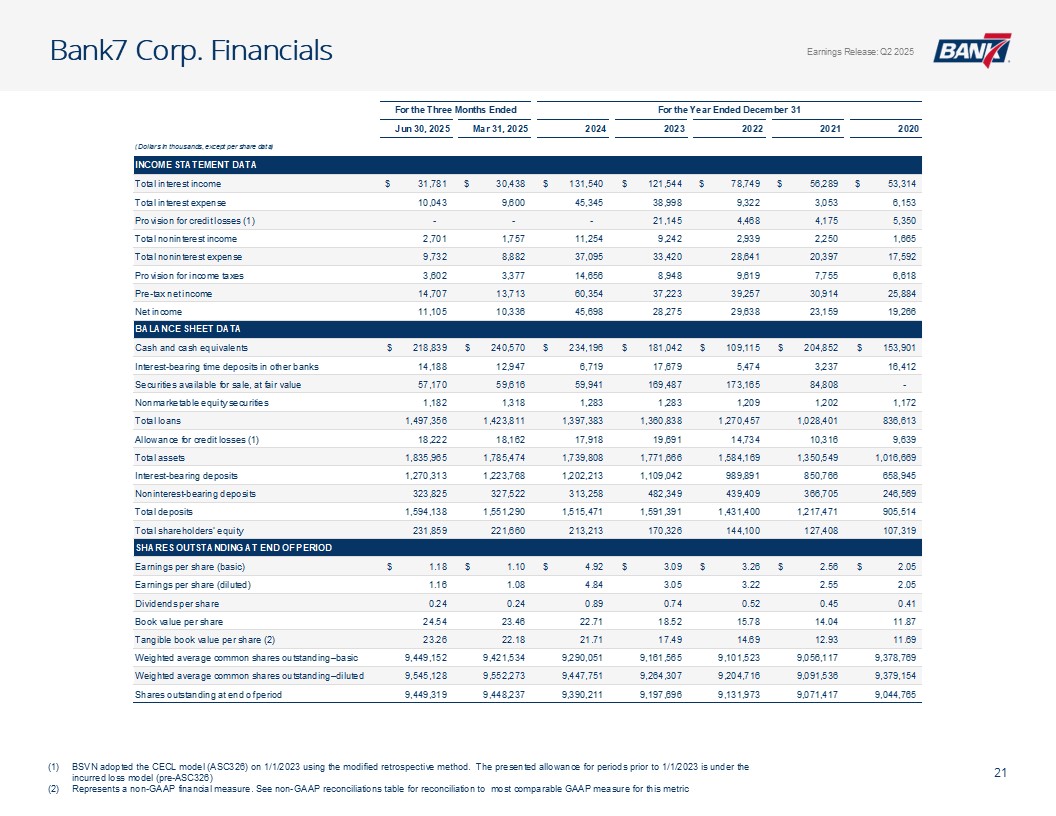
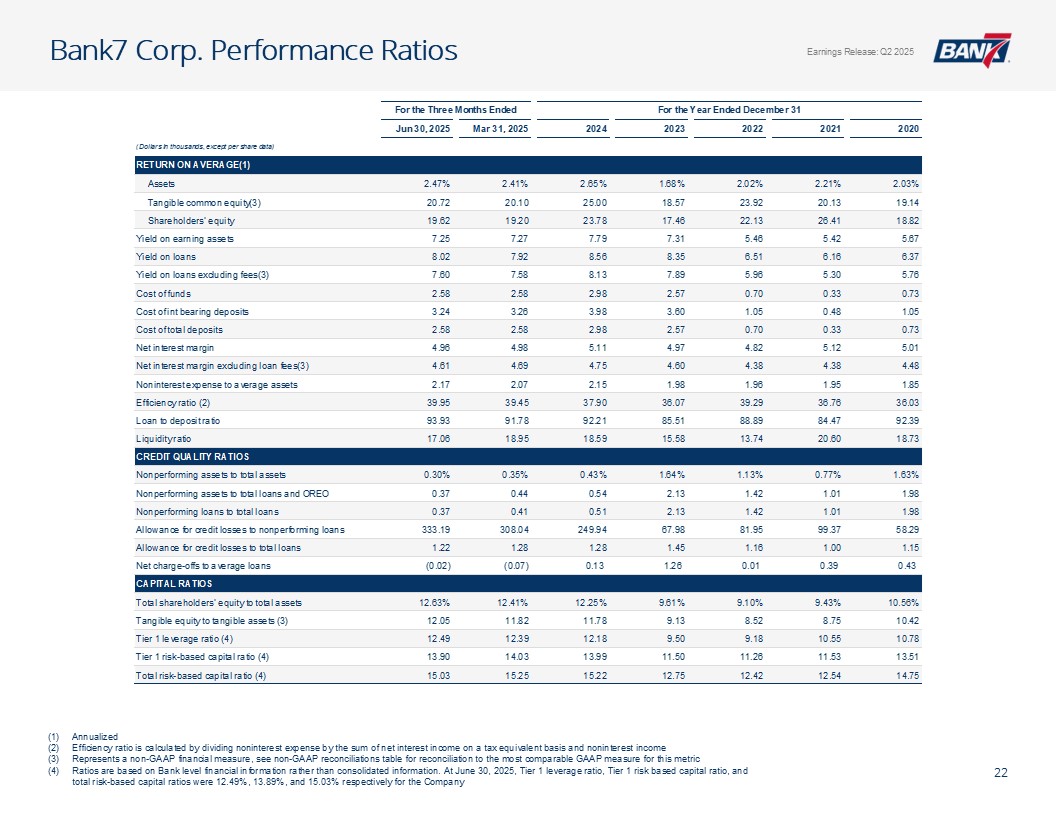
Net income of $11.1 million compared to $10.3 million, an increase of 7.44%
|
|
|
- |
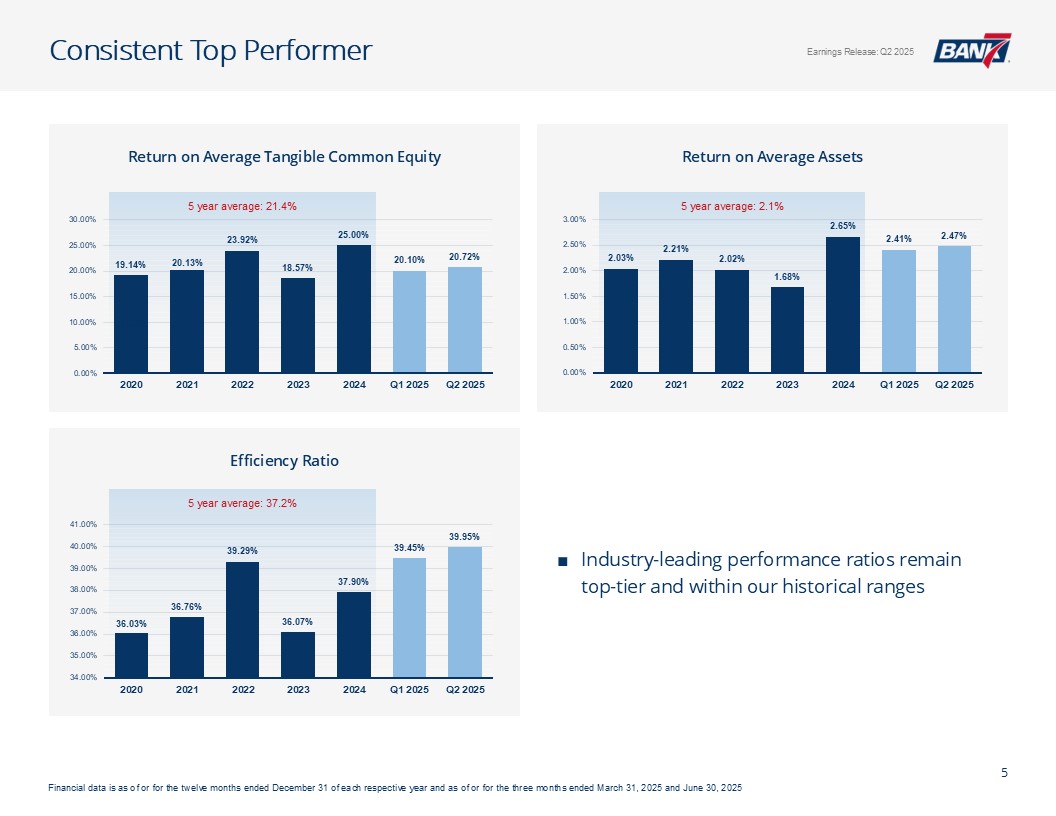
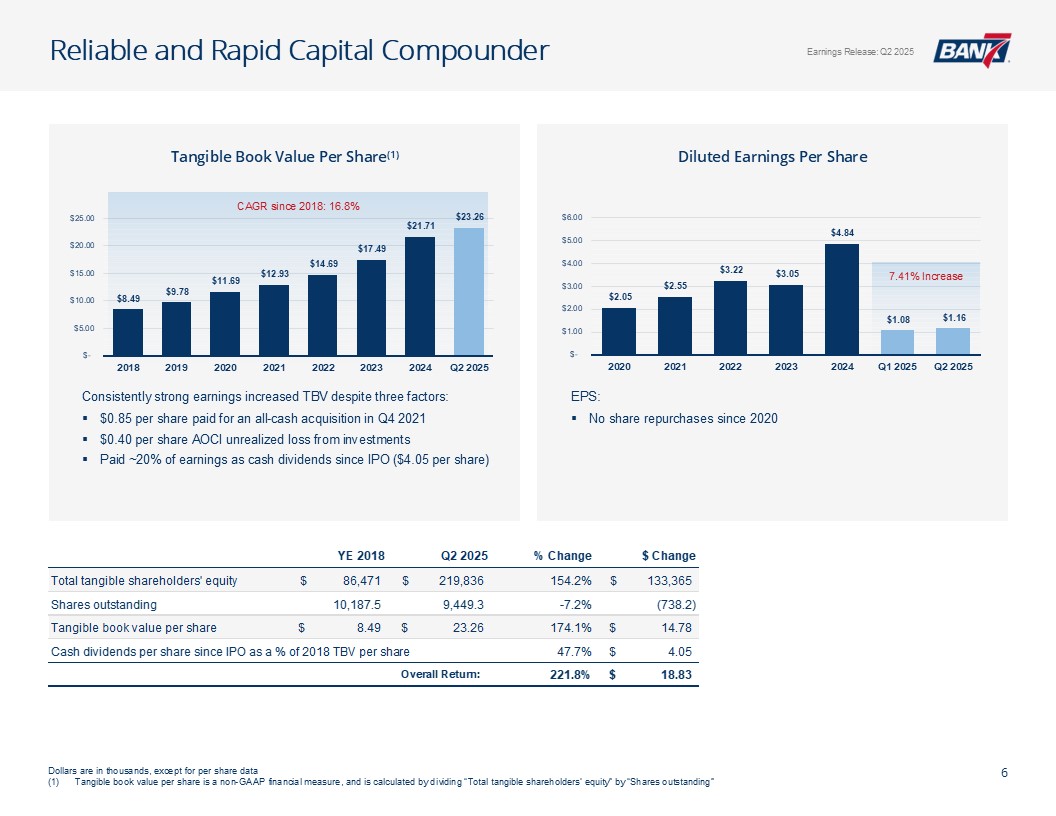
Earnings per share of $1.16 compared to $1.08, an increase of 7.41%
|
|
|
- |
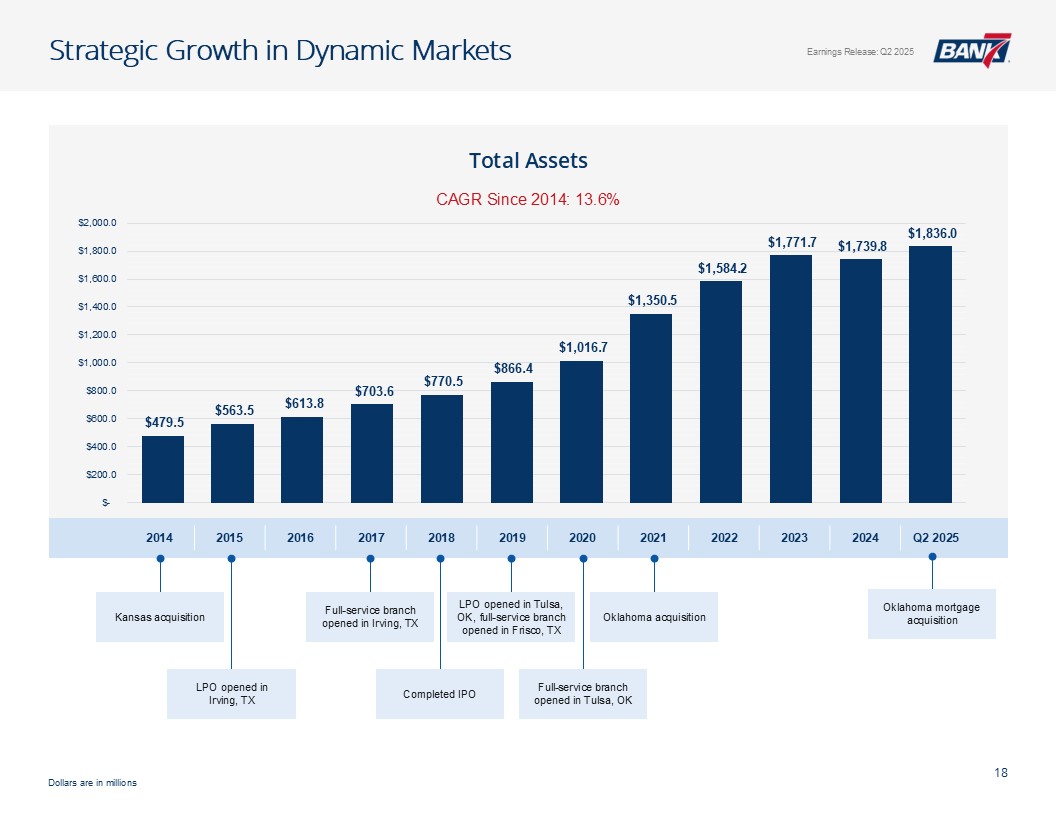
Total assets of $1.8 billion compared to $1.8 billion, an increase of 2.83%
|
|
|
- |
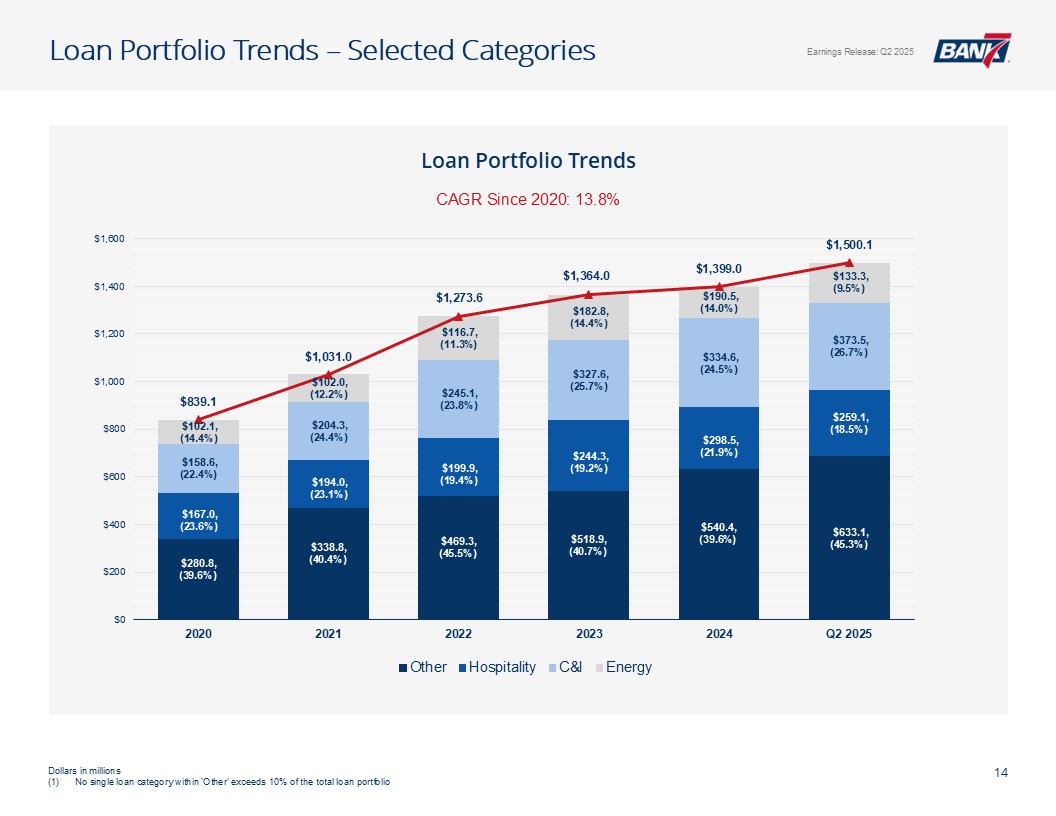
Total loans of $1.5 billion compared to $1.4 billion, an increase of 5.17%
|
|
|
- |
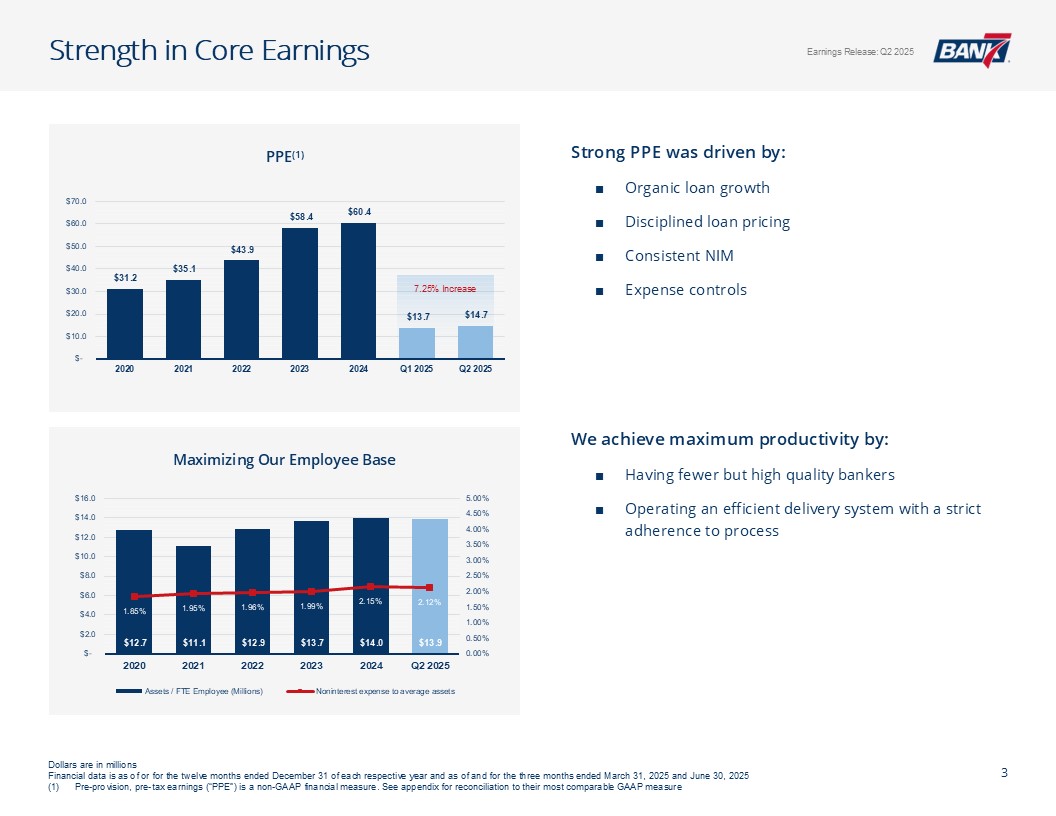
PPE of $14.7 million compared to $13.7 million, an increase of 7.25%
|
|
|
- |
Total interest income of $31.8 million compared to $30.4 million, an increase of 4.41%
|
|
|
For the Three Months Ended
|
|||||||
|
|
June 30,
2025 |
March 31,
2025 |
||||||
|
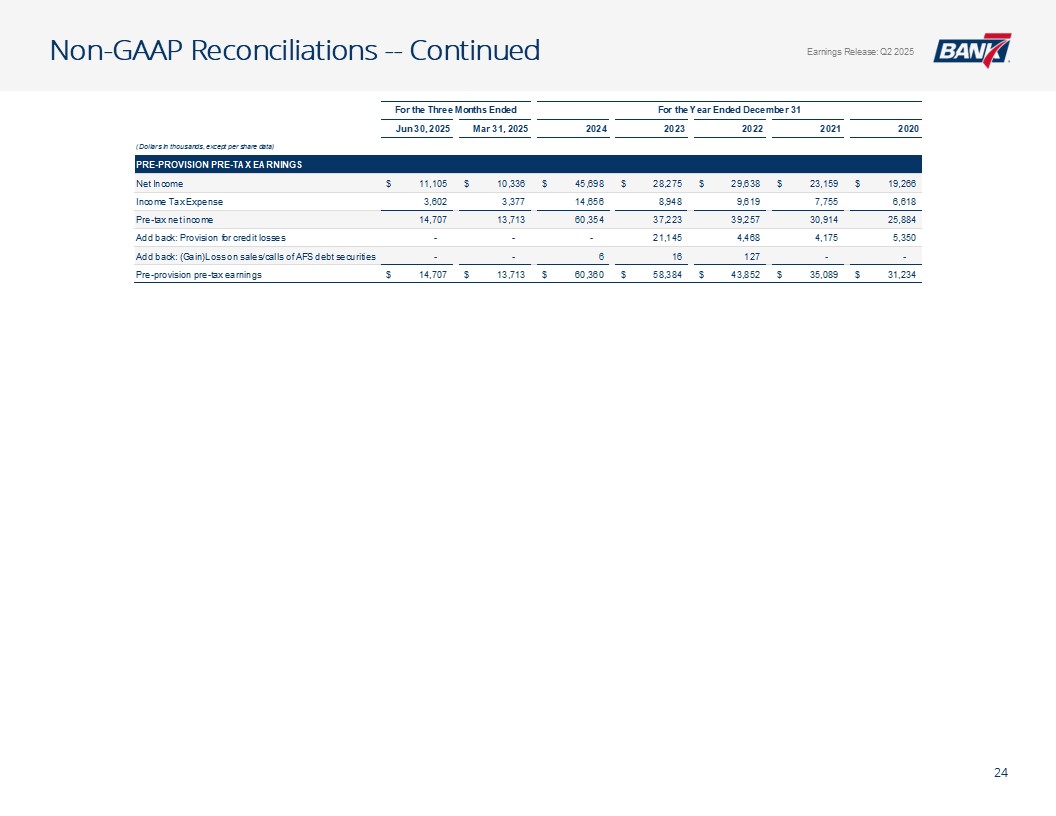
Calculation of Pre-Provision Pre-Tax Earnings ("PPE")
|
(Dollars in thousands)
|
|||||||
|
Net Income
|
$
|
11,105
|
$
|
10,336
|
||||
|
Income Tax Expense
|
3,602
|
3,377
|
||||||
|
Pre-tax net income
|
14,707
|
13,713
|
||||||
|
Add back: Provision for credit losses
|
-
|
-
|
||||||
|
Add back: (Gain)Loss on sales/calls of AFS debt securities
|
-
|
-
|
||||||
|
Pre-provision pre-tax earnings
|
14,707
|
13,713
|
||||||
|
Assets
|
June 30, 2025
(unaudited) |
December 31, 2024
|
||||||
|
|
||||||||
|
Cash and due from banks
|
$
|
218,839
|
$
|
234,196
|
||||
|
Interest-bearing time deposits in other banks
|
14,188
|
6,719
|
||||||
|
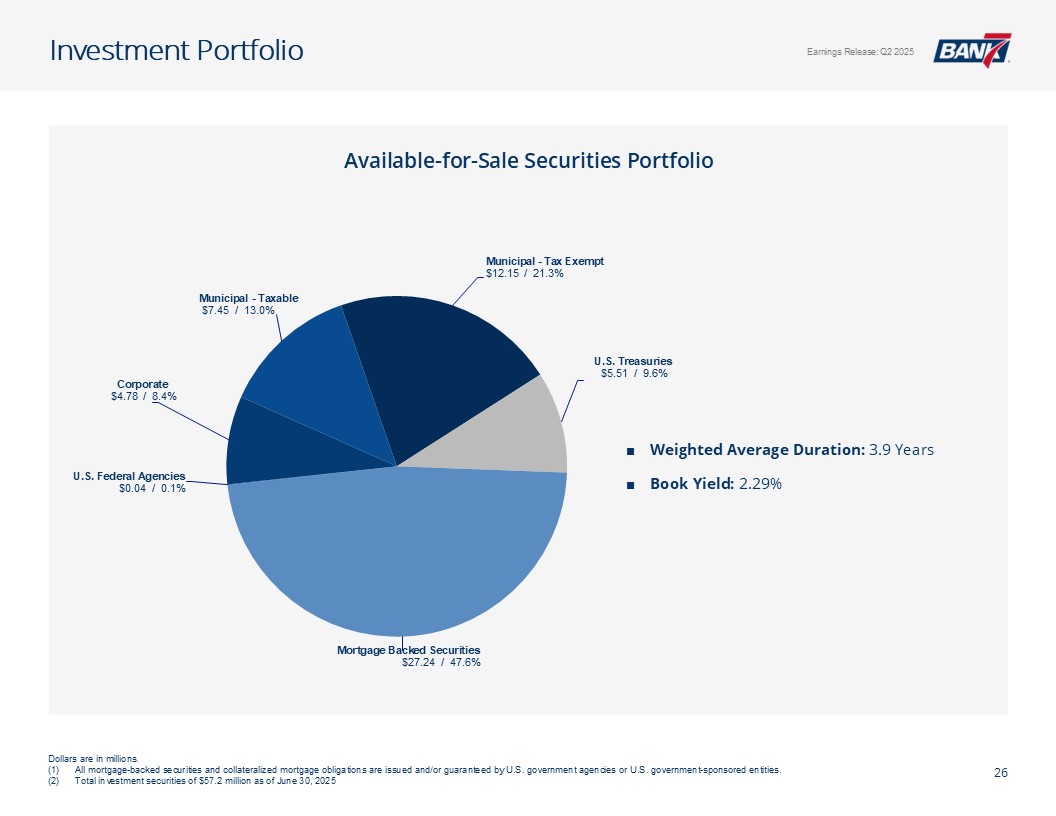
Available-for-sale debt securities
|
57,170
|
59,941
|
||||||
|
Loans, net of allowance for credit losses of $18,222 and
$17,918 at June 30, 2025 and December 31, 2024, respectively
|
1,479,134
|
1,379,465
|
||||||
|
Loans held for sale, at fair value
|
2,541
|
-
|
||||||
|
Premises and equipment, net
|
21,102
|
18,137
|
||||||
|
Nonmarketable equity securities
|
1,182
|
1,283
|
||||||
|
Core deposit intangibles
|
815
|
878
|
||||||
|
Goodwill
|
11,208
|
8,458
|
||||||
|
Income taxes receivable
|
381
|
-
|
||||||
|
Interest receivable and other assets
|
29,786
|
30,731
|
||||||
|
|
||||||||
|
Total assets
|
$
|
1,836,346
|
$
|
1,739,808
|
||||
|
|
||||||||
|
Liabilities and Shareholders’ Equity
|
||||||||
|
|
||||||||
|
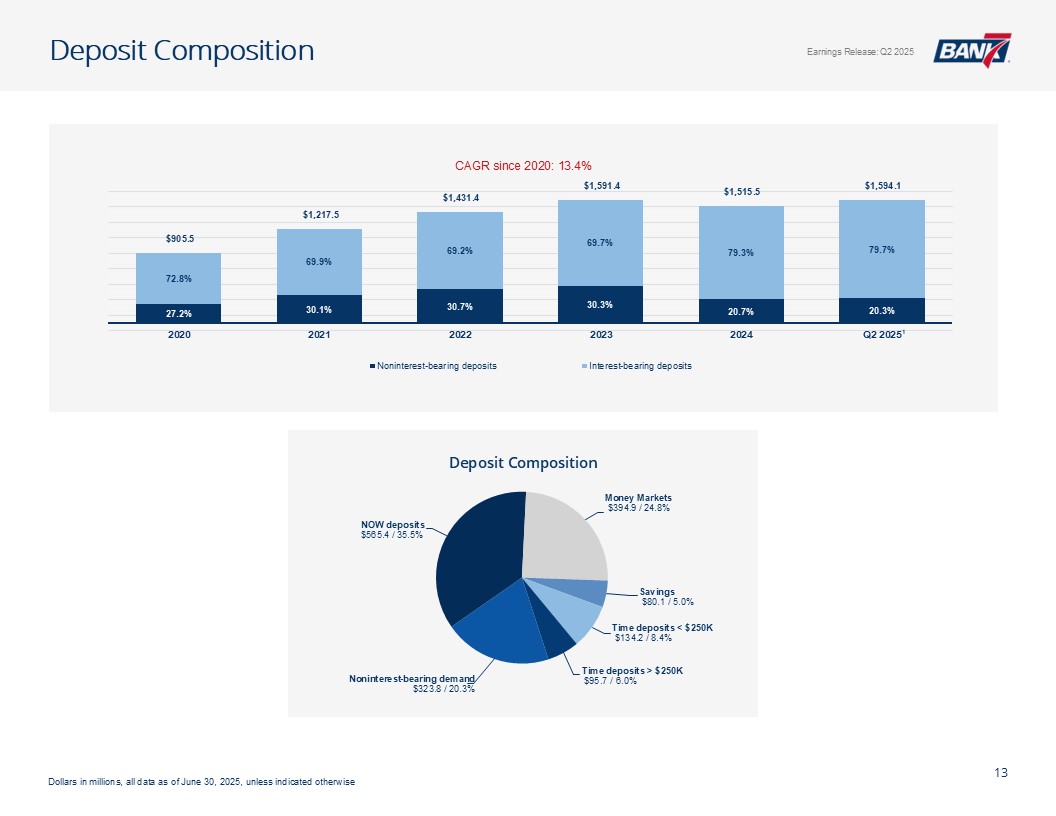
Deposits
|
||||||||
|
Noninterest-bearing
|
$
|
323,825
|
$
|
313,258
|
||||
|
Interest-bearing
|
1,270,313
|
1,202,213
|
||||||
|
|
||||||||
|
Total deposits
|
1,594,138
|
1,515,471
|
||||||
|
|
||||||||
|
Income taxes payable
|
-
|
77
|
||||||
|
Interest payable and other liabilities
|
10,349
|
11,047
|
||||||
|
|
||||||||
|
Total liabilities
|
1,604,487
|
1,526,595
|
||||||
|
|
||||||||
|
Shareholders’ equity
|
||||||||
|
Common stock, $0.01 par value; 50,000,000 shares authorized; shares issued and outstanding: 9,449,319 and 9,390,211 at June 30, 2025 and
December 31, 2024, respectively
|
94
|
94
|
||||||
|
Additional paid-in capital
|
102,321
|
101,809
|
||||||
|
Retained earnings
|
133,186
|
116,281
|
||||||
|
Accumulated other comprehensive loss
|
(3,742
|
)
|
(4,971
|
)
|
||||
|
|
||||||||
|
Total shareholders’ equity
|
231,859
|
213,213
|
||||||
|
|
||||||||
|
Total liabilities and shareholders’ equity
|
$
|
1,836,346
|
$
|
1,739,808
|
||||
|
|
Three Months Ended
|
Six Months Ended
|
||||||||||||||
|
|
June 30,
|
June 30,
|
||||||||||||||
|
|
2025
(unaudited) |
2024
(unaudited) |
2025
(unaudited) |
2024
(unaudited) |
||||||||||||
|
Interest Income
|
|
|
|
|
||||||||||||
|
Loans, including fees
|
$
|
28,965
|
$
|
28,926
|
$
|
56,293
|
$
|
59,043
|
||||||||
|
Interest-bearing time deposits in other banks
|
145
|
246
|
246
|
499
|
||||||||||||
|
Debt securities, taxable
|
278
|
951
|
561
|
1,963
|
||||||||||||
|
Debt securities, tax-exempt
|
63
|
71
|
126
|
144
|
||||||||||||
|
Other interest and dividend income
|
2,330
|
2,242
|
4,997
|
4,074
|
||||||||||||
|
|
||||||||||||||||
|
Total interest income
|
31,781
|
32,436
|
62,223
|
65,723
|
||||||||||||
|
|
||||||||||||||||
|
Interest Expense
|
||||||||||||||||
|
Deposits
|
10,043
|
11,204
|
19,643
|
22,481
|
||||||||||||
|
|
||||||||||||||||
|
Total interest expense
|
10,043
|
11,204
|
19,643
|
22,481
|
||||||||||||
|
|
||||||||||||||||
|
Net Interest Income
|
21,738
|
21,232
|
42,580
|
43,242
|
||||||||||||
|
|
||||||||||||||||
|
Provision for Credit Losses
|
-
|
-
|
-
|
-
|
||||||||||||
|
|
||||||||||||||||
|
Net Interest Income After Provision for Credit Losses
|
21,738
|
21,232
|
42,580
|
43,242
|
||||||||||||
|
|
||||||||||||||||
|
Noninterest Income
|
||||||||||||||||
|
Mortgage lending income
|
520
|
78
|
610
|
129
|
||||||||||||
|
Service charges on deposit accounts
|
232
|
260
|
450
|
509
|
||||||||||||
|
Other
|
1,949
|
2,827
|
3,396
|
4,536
|
||||||||||||
|
|
||||||||||||||||
|
Total noninterest income
|
2,701
|
3,165
|
4,456
|
5,174
|
||||||||||||
|
|
||||||||||||||||
|
Noninterest Expense
|
||||||||||||||||
|
Salaries and employee benefits
|
5,721
|
5,118
|
11,000
|
10,407
|
||||||||||||
|
Furniture and equipment
|
361
|
324
|
612
|
554
|
||||||||||||
|
Occupancy
|
630
|
613
|
1,222
|
1,273
|
||||||||||||
|
Data and item processing
|
590
|
481
|
1,100
|
939
|
||||||||||||
|
Accounting, marketing and legal fees
|
158
|
264
|
263
|
364
|
||||||||||||
|
Regulatory assessments
|
213
|
336
|
297
|
723
|
||||||||||||
|
Advertsing and public relations
|
223
|
83
|
417
|
229
|
||||||||||||
|
Travel, lodging and entertainment
|
121
|
131
|
177
|
183
|
||||||||||||
|
Other
|
1,715
|
1,792
|
3,528
|
3,606
|
||||||||||||
|
|
||||||||||||||||
|
Total noninterest expense
|
9,732
|
9,142
|
18,616
|
18,278
|
||||||||||||
|
|
||||||||||||||||
|
Income Before Taxes
|
14,707
|
15,255
|
28,420
|
30,138
|
||||||||||||
|
Income tax expense
|
3,602
|
3,731
|
6,979
|
7,326
|
||||||||||||
|
Net Income
|
$
|
11,105
|
$
|
11,524
|
$
|
21,441
|
$
|
22,812
|
||||||||
|
|
||||||||||||||||
|
Earnings per common share - basic
|
$
|
1.18
|
$
|
1.25
|
$
|
2.27
|
$
|
2.47
|
||||||||
|
Earnings per common share - diluted
|
1.16
|
1.23
|
2.25
|
2.44
|
||||||||||||
|
Weighted average common shares outstanding - basic
|
9,449,152
|
9,250,332
|
9,435,414
|
9,235,176
|
||||||||||||
|
Weighted average common shares outstanding - diluted
|
9,545,128
|
9,367,247
|
9,548,583
|
9,343,047
|
||||||||||||
|
|
||||||||||||||||
|
Other Comprehensive Income (Loss)
|
||||||||||||||||
|
Unrealized gains (losses) on securities, net of tax expense of $189 and $123 for the three months ended June 30, 2025 and 2024, respectively; net of tax expense of $425 and $123 for the six
months ended June 30, 2025 and 2024, respectively
|
$
|
587
|
$
|
(59
|
)
|
$
|
1,229
|
$
|
397
|
|||||||
|
Other comprehensive income (loss)
|
$
|
587
|
$
|
(59
|
)
|
$
|
1,229
|
$
|
397
|
|||||||
|
Comprehensive Income
|
$
|
11,692
|
$
|
11,465
|
$
|
22,670
|
$
|
23,209
|
||||||||
|
|
Net Interest Margin
|
|||||||||||||||||||||||
|
|
For the Three Months Ended June 30,
|
|||||||||||||||||||||||
|
|
2025
(unaudited) |
2024
(unaudited) |
||||||||||||||||||||||
|
|
Average
Balance |
Interest
Income/ Expense |
Average
Yield/ Rate |
Average
Balance |
Interest
Income/ Expense |
Average
Yield/ Rate |
||||||||||||||||||
|
|
(Dollars in thousands)
|
|||||||||||||||||||||||
|
Interest-Earning Assets:
|
||||||||||||||||||||||||
|
Short-term investments
|
$
|
247,652
|
$
|
2,475
|
4.01
|
%
|
$
|
173,502
|
$
|
2,488
|
5.75
|
%
|
||||||||||||
|
Debt securities, taxable-equivalent
|
47,285
|
278
|
2.36
|
106,457
|
951
|
3.58
|
||||||||||||||||||
|
Debt securities, tax exempt
|
12,502
|
63
|
2.02
|
17,252
|
71
|
1.65
|
||||||||||||||||||
|
Loans held for sale
|
1,987
|
-
|
-
|
355
|
-
|
-
|
||||||||||||||||||
|
Total loans(1)
|
1,448,924
|
28,965
|
8.02
|
1,354,985
|
28,926
|
8.56
|
||||||||||||||||||
|
Total interest-earning assets
|
1,758,350
|
31,781
|
7.25
|
1,652,551
|
32,436
|
7.87
|
||||||||||||||||||
|
Noninterest-earning assets
|
43,048
|
38,722
|
||||||||||||||||||||||
|
Total assets
|
$
|
1,801,398
|
$
|
1,691,273
|
||||||||||||||||||||
|
|
||||||||||||||||||||||||
|
Funding sources:
|
||||||||||||||||||||||||
|
Interest-bearing liabilities:
|
||||||||||||||||||||||||
|
Deposits:
|
||||||||||||||||||||||||
|
Transaction accounts
|
$
|
1,006,484
|
$
|
7,676
|
3.06
|
%
|
$
|
851,751
|
$
|
8,293
|
3.91
|
%
|
||||||||||||
|
Time deposits
|
236,108
|
2,367
|
4.02
|
247,452
|
2,911
|
4.72
|
||||||||||||||||||
|
Total interest-bearing deposits
|
1,242,592
|
10,043
|
3.24
|
1,099,203
|
11,204
|
4.09
|
||||||||||||||||||
|
Total interest-bearing liabilities
|
$
|
1,242,592
|
10,043
|
3.24
|
$
|
1,099,203
|
11,204
|
4.09
|
||||||||||||||||
|
|
||||||||||||||||||||||||
|
Noninterest-bearing liabilities:
|
||||||||||||||||||||||||
|
Noninterest-bearing deposits
|
$
|
321,351
|
$
|
394,010
|
||||||||||||||||||||
|
Other noninterest-bearing liabilities
|
10,471
|
12,778
|
||||||||||||||||||||||
|
Total noninterest-bearing liabilities
|
331,822
|
406,788
|
||||||||||||||||||||||
|
Shareholders' equity
|
226,984
|
185,282
|
||||||||||||||||||||||
|
Total liabilities and shareholders' equity
|
$
|
1,801,398
|
$
|
1,691,273
|
||||||||||||||||||||
|
|
||||||||||||||||||||||||
|
Net interest income
|
$
|
21,738
|
$
|
21,232
|
||||||||||||||||||||
|
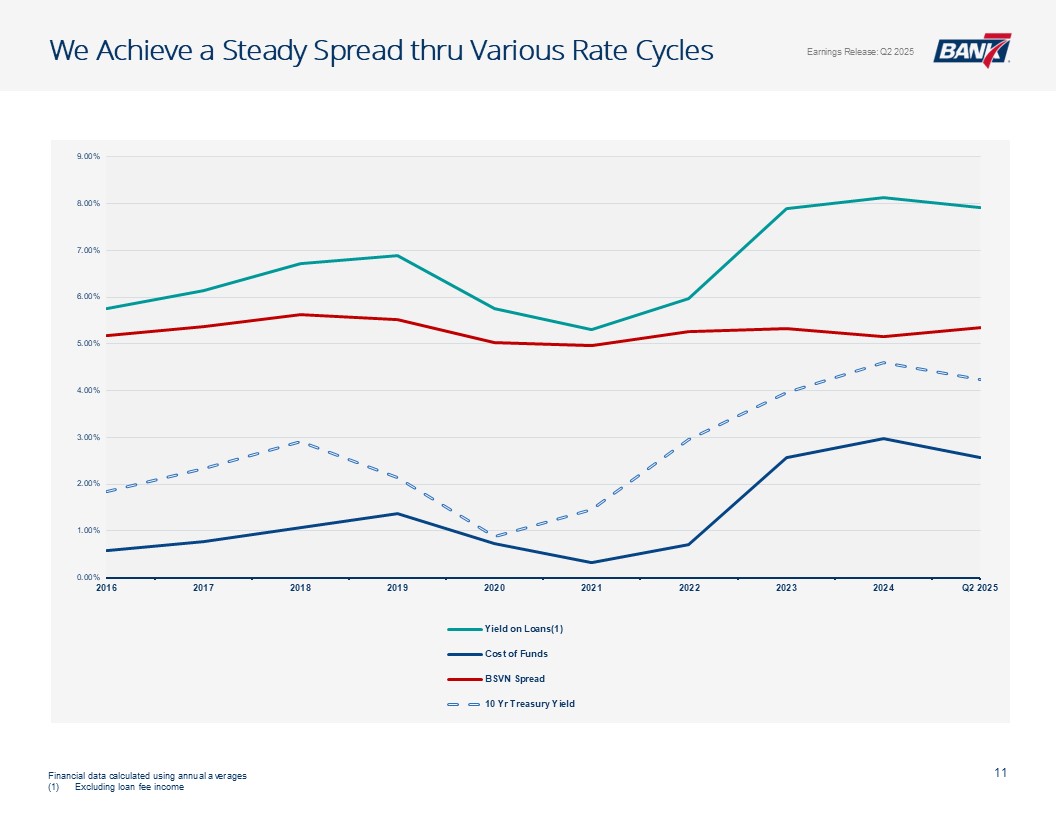
Net interest spread
|
4.01
|
%
|
3.78
|
%
|
||||||||||||||||||||
|
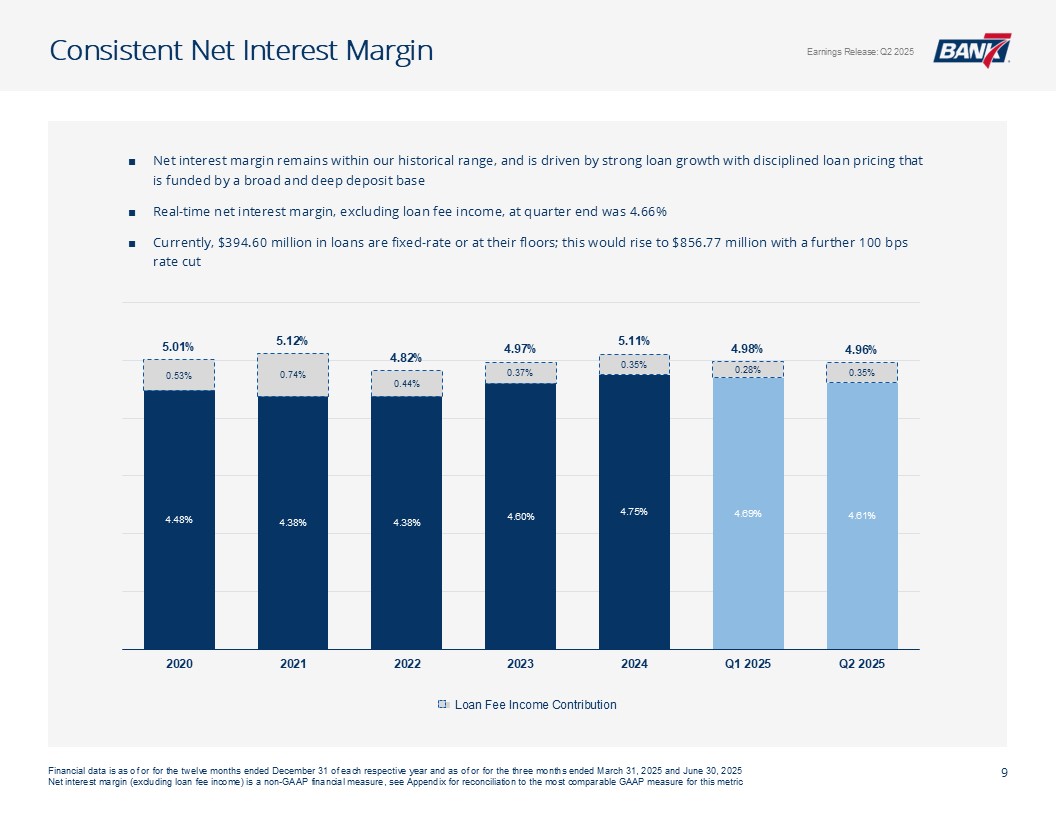
Net interest margin
|
4.96
|
%
|
5.15
|
%
|
||||||||||||||||||||
|
(1)
|
Nonaccrual loans are included in total loans
|
|
|
Net Interest Margin
|
|||||||||||||||||||||||
|
|
For the Six Months Ended June, 30
|
|||||||||||||||||||||||
|
|
2025
(unaudited) |
2024
(unaudited) |
||||||||||||||||||||||
|
|
Average
Balance |
Interest
Income/ Expense |
Average
Yield/ Rate |
Average
Balance |
Interest
Income/ Expense |
Average
Yield/ Rate |
||||||||||||||||||
|
|
(Dollars in thousands)
|
|||||||||||||||||||||||
|
Interest-Earning Assets:
|
||||||||||||||||||||||||
|
Short-term investments
|
$
|
242,876
|
$
|
5,243
|
4.35
|
%
|
$
|
174,787
|
$
|
4,573
|
5.25
|
%
|
||||||||||||
|
Debt securities, taxable-equivalent
|
47,957
|
561
|
2.36
|
129,963
|
1,963
|
3.03
|
||||||||||||||||||
|
Debt securities, tax exempt
|
12,508
|
126
|
2.03
|
17,761
|
144
|
1.63
|
||||||||||||||||||
|
Loans held for sale
|
1,287
|
-
|
-
|
297
|
-
|
-
|
||||||||||||||||||
|
Total loans(1)
|
1,423,776
|
56,293
|
7.97
|
1,362,339
|
59,043
|
8.69
|
||||||||||||||||||
|
Total interest-earning assets
|
1,728,404
|
62,223
|
7.26
|
1,685,147
|
65,723
|
7.82
|
||||||||||||||||||
|
Noninterest-earning assets
|
41,511
|
39,246
|
||||||||||||||||||||||
|
Total assets
|
$
|
1,769,915
|
$
|
1,724,393
|
||||||||||||||||||||
|
|
||||||||||||||||||||||||
|
Funding sources:
|
||||||||||||||||||||||||
|
Interest-bearing liabilities:
|
||||||||||||||||||||||||
|
Deposits:
|
||||||||||||||||||||||||
|
Transaction accounts
|
$
|
981,833
|
$
|
14,794
|
3.04
|
%
|
$
|
848,764
|
$
|
16,489
|
3.90
|
%
|
||||||||||||
|
Time deposits
|
236,216
|
4,849
|
4.14
|
256,212
|
5,992
|
4.69
|
||||||||||||||||||
|
Total interest-bearing deposits
|
1,218,049
|
19,643
|
3.25
|
1,104,976
|
22,481
|
4.08
|
||||||||||||||||||
|
Total interest-bearing liabilities
|
1,218,049
|
19,643
|
3.25
|
1,104,976
|
22,481
|
4.08
|
||||||||||||||||||
|
|
||||||||||||||||||||||||
|
Noninterest-bearing liabilities:
|
||||||||||||||||||||||||
|
Noninterest-bearing deposits
|
318,952
|
426,696
|
||||||||||||||||||||||
|
Other noninterest-bearing liabilities
|
10,228
|
12,218
|
||||||||||||||||||||||
|
Total noninterest-bearing liabilities
|
329,180
|
438,914
|
||||||||||||||||||||||
|
Shareholders' equity
|
222,686
|
180,503
|
||||||||||||||||||||||
|
Total liabilities and shareholders' equity
|
$
|
1,769,915
|
$
|
1,724,393
|
||||||||||||||||||||
|
|
||||||||||||||||||||||||
|
Net interest income
|
$
|
42,580
|
$
|
43,242
|
||||||||||||||||||||
|
Net interest spread
|
4.01
|
%
|
3.74
|
%
|
||||||||||||||||||||
|
Net interest margin
|
4.97
|
%
|
5.15
|
%
|
||||||||||||||||||||