|
CREDICORP LTD.
(Registrant)
|
|||
|
By:
|
/s/ Milagros Cigüeñas
|
||
|
Milagros Cigüeñas
|
|||
|
Authorized Representative
|
|||

 |
| |
Earnings Release 4Q / 2024
|
Analysis of 4Q24 Consolidated Results
|
 |
Operating and Financial Highlights | 03 |
|
|
||
|
Senior Management Quotes
|
04 |
|
|
||
|
First Quarter 2025 Earnings Conference Call
|
05 |
|
|
||
|
Summary of Financial Performance and Outlook
|
06 |
|
|
Financial Overview | 12 |
|
|
Credicorp’s Strategy Update | 13 |
|
|
Analysis of 1Q25 Consolidated Results |
|
01
|
Loan Portfolio
|
17
|
|
|
02
|
Deposits
|
20
|
|
|
03
|
Interest Earning Assets and Funding
|
23
|
|
|
04
|
Net Interest Income (NII)
|
25
|
|
|
05
|
Portfolio Quality and Provisions
|
28
|
|
|
06
|
Other Income
|
32
|
|
|
07
|
Insurance Underwriting Results and the Medical Services
|
36
|
|
|
08
|
Operating Expenses
|
39
|
|
|
09
|
Operating Efficiency
|
41
|
|
|
10
|
Regulatory Capital
|
42
|
|
|
11
|
Economic Outlook
|
44
|
|
|
12
|
Appendix
|
49
|
|
|
|||
|
| |
Earnings Release 1Q / 2025
|
Analysis of 1Q25 Consolidated Results
|
|
|
| • |
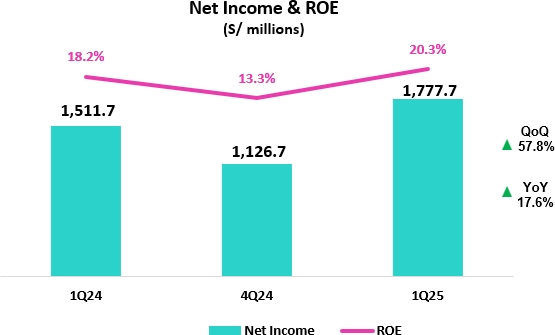
Net Income attributed to Credicorp increased 57.8% QoQ and 17.6% YoY to S/1,777.7 million, delivering an ROE of 20.3%. Excluding the extraordinary gain related to the
previously disclosed acquisition of the remaining 50% stake in the JV with Empresas Banmedica, Net Income attributed to Credicorp increases 43.0% QoQ and 6.6% YoY, with an ROE at 18.4%.
|
| • |
In March 2025, Credicorp revalued Bolivia´s balance sheet using a market-reflective FX rate, resulting in an accounting contraction of 2.0% in Credicorp Total Assets. The loan and deposit figures cited below
exclude this adjustment.
|
| • |
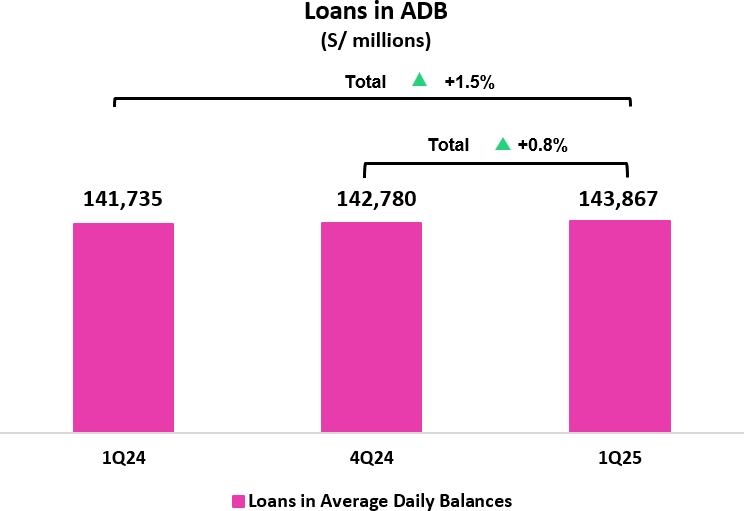
Total Loans measured in average daily balances (ADB) expanded by 1.5% YoY, mainly driven by short-term loans in Wholesale Banking and Mortgages. QoQ, Total Loans rose 0.8%
led by growth in Wholesale Banking, Consumer (supported by Yape and BCP Stand-alone), and Mortgages.
|
| • |
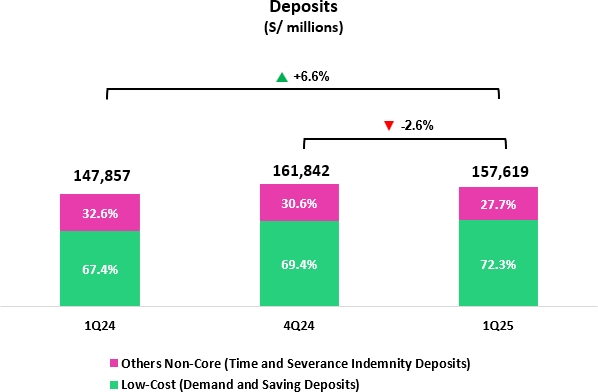
Total Deposits increased by 9.7% YoY fueled by Low-cost deposits, amid higher system liquidity, and 0.3% QoQ. Low-cost deposits accounted for 71.8% of total deposits and
represent 59.0% of the total funding base.
|
| • |
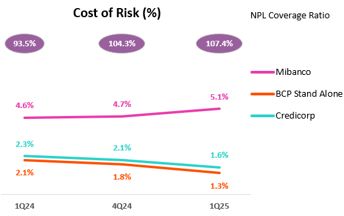
Portfolio quality indicators and the Cost of Risk have improved notably as a result of the cumulative impact of a more dynamic
portfolio management, enhancements in underwriting and risk management and a more favorable macroeconomic environment.
|
| • |
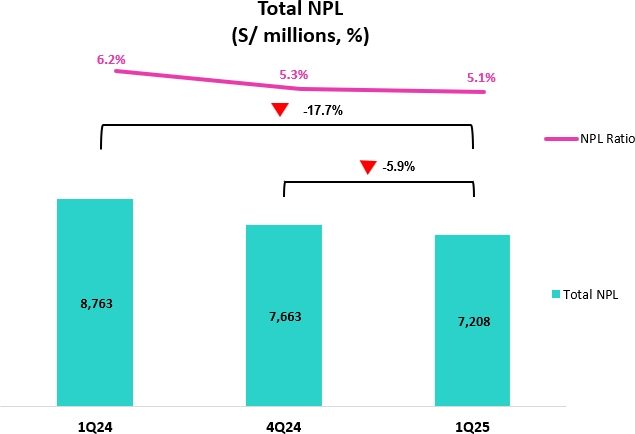
NPL Ratio improved 16 bps QoQ to stand at 5.1%, driven by debt repayments at BCP Stand-alone and by a drop in internal overdue loans at both BCP Stand-alone and Mibanco.
YoY, the NPL Ratio improved 112 bps.
|
| • |
Provisions, excluding provision reversals in 1Q24, declined 45.5% YoY, while CoR stood at 1.6%, reflecting an improvement in payment performance and in the economic
backdrop; successful risk management measures at both BCP and Mibanco; and some one-time events outlined in the Portfolio Quality chapter. QoQ, provisions declined 21.7%.
|
| • |
Core Income increased 7.0% YoY, underpinned by diversified revenue streams, which drove a 15.1% YoY increase in other core income. Achieved record-high Risk-Adjusted NIM of 5.24%.
|
| • |
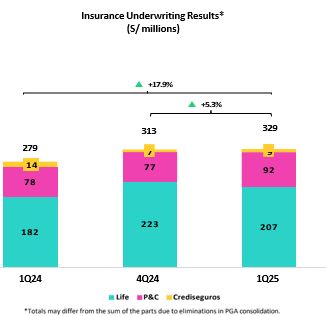
Insurance Underwriting Results rose 17.9% YoY, largely due to stronger reinsurance results in the P&C business, and was up 5.3% QoQ.
|
| • |
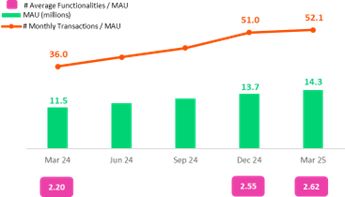
Yape reached 14.3 million Monthly Active Users (MAU), with average monthly transactions per user rising to 52. The platform sustained its growth trajectory and captured
4.8% of Credicorp’s total risk-adjusted revenue share.
|
| • |
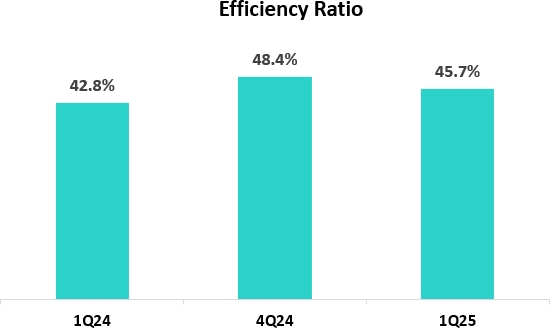
Efficiency Ratio reached 45.7%, aligned with our full-year guidance. Operating expenses increased 15.6% YoY, mainly due to the core business at BCP Stand-alone and
investments in disruptive initiatives.
|
| • |
Capital base moving closer to target, with the IFRS CET 1 Ratio falling 24 bps YoY at BCP Stand-alone and 18 bps YoY at Mibanco, standing at 11.6% and 15.9%, respectively.
|
| • |
After quarter-end, on April 14, 2025, Credicorp declared an ordinary cash dividend of S/40 per share based on 2024 results, to be paid out in June 13, 2025, as capital
levels advance closer to target across subsidiaries.
|
|
|
|||
|
| |
Earnings Release 1Q / 2025
|
Analysis of 1Q25 Consolidated Results
|
|
|

|
|
|||
|
| |
Earnings Release 1Q / 2025
|
Analysis of 1Q25 Consolidated Results
|
|
First Quarter 2025 Earnings Conference Call
|
|||
|
|
|||
|
| |
Earnings Release 1Q / 2025
|
Analysis of 1Q25 Consolidated Results
|
|
|
|
|
|||
|
| |
Earnings Release 1Q / 2025
|
Analysis of 1Q25 Consolidated Results
|

|
|
|
|
|||
|
| |
Earnings Release 1Q / 2025
|
Analysis of 1Q25 Consolidated Results
|
|
|
|
|
|
1
|
Beginning in 1Q25, reclassifications have been incorporated, affecting the presentation of Fee Income, Net Gain on Foreign Exchange Transactions, and Net Gain on Derivatives Held for
Trading. Figures for prior periods have been restated to ensure comparability and may differ from those previously reported.
|
|
|
|||
|
| |
Earnings Release 1Q / 2025
|
Analysis of 1Q25 Consolidated Results
|
|
|
|
|
|||
|
| |
Earnings Release 1Q / 2025
|
Analysis of 1Q25 Consolidated Results
|
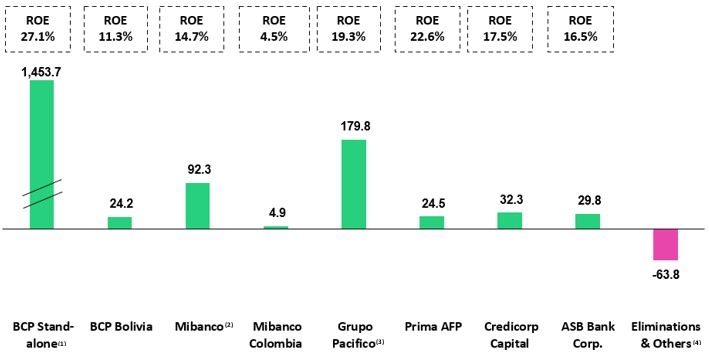
| (1) |
In BCP Stand-alone, the figure is lower than the net profit since the contribution eliminates investment gains in other subsidiaries of Credicorp (Mibanco)
|
| (2) |
In Mibanco, the figure is less than the net profit because Credicorp owns (directly and indirectly) 99.921% of Mibanco.
|
| (3) |
The contribution for Grupo Pacifico presented here is greater than the profit of Pacifico Seguros since 100% of Crediseguros is being included (including 48% under Grupo Crédito).
|
| (4) |
Includes the extraordinary gain of approximately S/ 166 million (net of taxes) related to the acquisition of Empresas Banmedica.
|
|
|
|||
|
| |
Earnings Release 1Q / 2025
|
Analysis of 1Q25 Consolidated Results
|
|
Universal Banking
|
|
|
|
BCP Stand-alone reported good results, which were driven mainly by an improvement in risk management indicators and diversified sources of income, which continued to represent a core
strength. NIM stood at 5.8%, supported in large part by an improvement in the cost of funding. YoY, other core income rose 15.1% on the back of Yape’s consolidation as a key source of income and alongside a strong transactions level.
These dynamics were partially offset by growth in operating expenses.
|
|
|
|
Insurance and Pensions1
|
|
Profitability at Grupo Pacífico dropped AaA due to a reduction in the Net gain on Securities, on the back of deterioration in the investment portfolio. This dynamic was partially offset
by an uptick in the Insurance Underwriting Result via Life and P & C and supported by solid commercial dynamics in both businesses.
|
|
Microfinance
|
|
Mibanco’s profitability rose YoY, fueled mainly by a resilient NIM and fortified risk management. NIM stood at 13.9%, driven by active price management and a decrease in the funding
cost.
Mibanco Colombia’s profitability improved thanks to its focus on efficiency; improvements in processes and controls; and disciplined risk management, which helped
attenuate the impact of a challenging business environment.
|
|
|
|
Investment Management and Advisory
|
|
Operating dynamics for Investment Banking and Advisory were solid in 1Q25, which reaffirms that our strategic focus is on-target and puts us in good stead for 2025. Net earnings rose
10% YoY, driven primarily by a reduction in operating expenses. Our Asset Management and Capital Markets businesses also contributed to results through an uptick in AUMs and growth in transactions, respectively.
|
|
|
|
Outlook
|
|
Although ROE in 1Q25 situates us in an advantageous position going forward, uncertainty at the global level has led us to maintain our guidance for ROE for the year 2025 at
around 17.5%. These results will be supported by: (i) acceleration in the pace of growth of our loan portfolio, in the retail segment in particular, (ii) the resilience of our NIM, and (iii) a controlled cost of risk.
|
|
1
|
In March 2025. Credicorp concluded the acquisition of the remaining 50% of the stake Empresas Banmedica under the joint venture with Pacifico Seguros. This consolidation did not materially
impact Grupo Pacifico’s results in 1Q25.
|
|
|
|||
|
| |
Earnings Release 1Q / 2025
|
Analysis of 1Q25 Consolidated Results
|
|
Financial Overview
|
|
Credicorp Ltd.
|
|
Quarter |
% change
|
||
|
S/000
|
1Q24
|
4Q24
|
1Q25
|
QoQ
|
YoY
|
|
Net interest, similar income and expenses
|
3,426,123
|
3,629,794
|
3,572,012
|
-1.6%
|
4.3%
|
|
Provision for credit losses on loan portfolio, net of recoveries
|
(814,699)
|
(743,296)
|
(581,893)
|
-21.7%
|
-28.6%
|
|
Net interest, similar income and expenses, after provision for credit losses on loan portfolio
|
2,611,424
|
2,886,498
|
2,990,119
|
3.6%
|
14.5%
|
|
Other income
|
1,392,559
|
1,582,732
|
1,690,216
|
6.8%
|
21.4%
|
|
Insurance underwriting result
|
279,062
|
312,683
|
329,134
|
5.3%
|
17.9%
|
|
Medical services result
|
-
|
-
|
42,689
|
n.a.
|
n.a.
|
|
Total expenses
|
(2,212,482)
|
(3,026,227)
|
(2,532,874)
|
-16.3%
|
14.5%
|
|
Profit before income tax
|
2,070,563
|
1,755,686
|
2,519,284
|
43.5%
|
21.7%
|
|
Income tax
|
(528,466)
|
(598,348)
|
(704,469)
|
17.7%
|
33.3%
|
|
Net profit
|
1,542,097
|
1,157,338
|
1,814,815
|
56.8%
|
17.7%
|
|
Non-controlling interest
|
30,440
|
30,625
|
37,118
|
21.2%
|
21.9%
|
|
Net profit attributable to Credicorp
|
1,511,657
|
1,126,713
|
1,777,697
|
57.8%
|
17.6%
|
|
Dividends paid to third parties
|
-
|
-
|
-
|
n.a.
|
n.a.
|
|
Net income / share (S/)
|
19.0
|
14.1
|
22.3
|
57.8%
|
17.6%
|
|
Dividends per Share (S/)
|
-
|
-
|
-
|
n.a.
|
n.a.
|
|
Loans
|
140,798,083
|
145,732,273
|
141,196,646
|
-3.1%
|
0.3%
|
|
Deposits and obligations
|
147,857,127
|
161,842,066
|
157,619,082
|
-2.6%
|
6.6%
|
|
Net equity
|
33,853,460
|
34,346,451
|
35,843,202
|
4.4%
|
5.9%
|
|
Profitability
|
|||||
|
Net interest margin(1)
|
6.30%
|
6.34%
|
6.22%
|
-12 bps
|
-8 bps
|
|
Risk-adjusted Net interest margin
|
4.85%
|
5.08%
|
5.24%
|
16 bps
|
39 bps
|
|
Funding cost(2)
|
2.98%
|
2.56%
|
2.42%
|
-14 bps
|
-56 bps
|
|
ROAE
|
18.2%
|
13.3%
|
20.3%
|
697 bps
|
203 bps
|
|
ROAA
|
2.5%
|
1.8%
|
2.8%
|
100 bps
|
30 bps
|
|
Loan portfolio quality
|
|||||
|
Internal overdue ratio(3)
|
4.4%
|
3.7%
|
3.7%
|
-3 bps
|
-72 bps
|
|
Internal overdue ratio over 90 days
|
3.3%
|
3.0%
|
3.0%
|
-1 bps
|
-34 bps
|
|
NPL ratio(4)
|
6.2%
|
5.3%
|
5.1%
|
-16 bps
|
-112 bps
|
|
Cost of risk(5)
|
2.3%
|
2.1%
|
1.6%
|
-44 bps
|
-66 bps
|
|
Coverage ratio of IOLs
|
132.0%
|
147.4%
|
148.7%
|
130 bps
|
1672 bps
|
|
Coverage ratio of NPLs
|
93.5%
|
104.3%
|
107.4%
|
308 bps
|
1395 bps
|
|
Operating efficiency
|
|||||
|
Operating income(6)
|
4,933,778
|
5,396,202
|
5,340,199
|
-1.0%
|
8.2%
|
|
Operating expenses(7)
|
2,112,810
|
2,612,878
|
2,442,089
|
-6.5%
|
15.6%
|
|
Efficiency ratio(8)
|
42.8%
|
48.4%
|
45.7%
|
-270 bps
|
291 bps
|
|
Operating expenses / Total average assets
|
3.5%
|
4.1%
|
3.8%
|
-30 bps
|
31 bps
|
|
Capital adequacy - BCP Stand-alone
|
|||||
|
Global Capital Ratio(9)
|
16.12%
|
18.71%
|
16.87%
|
-184 bps
|
75 bps
|
|
Ratio Tier 1(10)
|
11.72%
|
13.08%
|
11.34%
|
-174 bps
|
-38 bps
|
|
Ratio common equity tier 1(11) (13)
|
11.86%
|
13.32%
|
11.62%
|
-170 bps
|
-24 bps
|
|
Capital adequacy - Mibanco
|
|||||
|
Global Capital Ratio(9)
|
18.03%
|
19.42%
|
18.53%
|
-89 bps
|
50 bps
|
|
Ratio Tier 1(10)
|
15.69%
|
17.07%
|
15.48%
|
-159 bps
|
-21 bps
|
|
Ratio common equity tier 1(11) (13)
|
16.06%
|
17.53%
|
15.89%
|
-164 bps
|
-17 bps
|
|
Employees(14)
|
36,912
|
38,695
|
46,621
|
20.5%
|
26.3%
|
|
Share Information
|
|||||
|
Issued Shares
|
94,382
|
94,382
|
94,382
|
0.0%
|
0.0%
|
|
Treasury Shares(12)
|
14,908
|
14,948
|
15,016
|
0.5%
|
0.7%
|
|
Outstanding Shares
|
79,474
|
79,434
|
79,366
|
-0.1%
|
-0.1%
|
| (1) |
Net Interest Margin = Net Interest Income (Excluding Net Insurance Financial Expenses)/ Average Interest Earning Assets
|
| (2) |
Funding Cost = Interest Expense (Does not include Net Insurance Financial Expenses) / Average Funding
|
| (3) |
Internal Overdue Loans: include overdue loans and loans under legal collection, according to our internal policy for overdue loans. Internal Overdue Ratio: Internal overdue loans/ Total loans
|
| (4) |
Non-performing loans (NPL): Internal overdue loans + Refinanced loans. NPL ratio: NPL / Total loans.
|
| (5) |
Cost of risk = Annualized provision for loan losses, net of recoveries/ Total loans.
|
|
(6)
|
Operating Income = Net interest, similar income and expenses + Fee Income+ Net gain on foreign exchange transactions + Net Gain From associates + Net gain on derivatives held for
trading + Result on exchange differences + Insurance Underwriting Result + Results for Medical Services
|
| (7) |
Operating Expenses = Salaries and employee benefits + Administrative expenses + Depreciation and amortization + Association in participation + Acquisition cost.
|
|
(8)
|
Efficiency Ratio = (Salaries and employee benefits + Administrative expenses + Depreciation and amortization + Association in participation) / (Net
interest, similar income and expenses + Fee Income+ Net gain on foreign exchange transactions + Net Gain From associates + Net gain on derivatives held for trading + Result on exchange differences + Insurance Underwriting Result)
|
| (9) |
Regulatory Capital/ Risk-weighted assets (legal minimum = 10% since July 2011).
|
|
(10)
|
Tier 1 = Capital + Legal and other capital reserves + Accumulated earnings with capitalization agreement + (0.5 x Unrealized profit and net income in
subsidiaries) - Goodwill - (0.5 x Investment in subsidiaries) + Perpetual subordinated debt (the maximum amount that can be included is 17.65% of Capital + Reserves + Accumulated earnings with capitalization agreement + Unrealized
profit and net income in subsidiaries - Goodwill).
|
| (11) |
Common Equity TierI = Capital + Reserves – 100% of applicable deductions (investment in subsidiaries, goodwill, intangibles, and net deferred taxes that rely on future profitability) +
retained earnings + unrealized gains.
|
| (12) |
Consider shares held by Atlantic Security Holding Corporation (ASHC) and stock awards.
|
| (13) |
Common Equity Tier I calculated based on IFRS Accounting
|
| (14) |
Internal management figures. Since 1Q25, includes corporate health and medical services employees.
|
|
|
|||
|
| |
Earnings Release 1Q / 2025
|
Analysis of 1Q25 Consolidated Results
|
|
Credicorp’s Strategy Update
|
|||
|
Core Businesses Transformation (1)
|
1Q24
|
4Q24
|
1Q25
|
|
Credicorp
|
|||
|
Innovation Portfolio Risk-Adjusted Revenue Share (2)
|
3.1%
|
5.6%
|
5.4%
|
|
BCP
Stand-alone
|
|||
|
Digital clients (3)
|
70%
|
76%
|
78%
|
|
Digital monetary transactions (4)
|
83%
|
88%
|
89%
|
|
Cashless transactions (5)
|
62%
|
69%
|
69%
|
|
Mibanco
|
|||
|
Disbursements through leads (6)
|
69%
|
65%
|
70%
|
|
Disbursements through alternative channels (7)
|
22%
|
24%
|
26%
|
|
Relationship managers productivity (8)
|
25.0
|
24.5
|
28.2
|
| (1) |
Management figures. Figures for March 2024, December 2024, and March 2025.
|
| (2) |
As a percentage of Credicorpʼs total Risk-Adjusted Revenue.
|
| (3) |
Retail clients that made 70%, or more, of their transactions through digital channels in the last 6 months (including Yape).
|
| (4) |
Monetary Transactions conducted through Mobile Banking, Internet Banking, Yape and Telecredito/Total Monetary Transactions in Retail Banking.
|
| (5) |
Amount transacted through Mobile Banking, Internet Banking, Yape y POS/Total amount transacted through Retail Banking.
|
| (6) |
Disbursements generated through leads/Total disbursements.
|
| (7) |
Disbursements conducted through alternative channels/Total disbursements. Figures differ from previously reported due to a methodological change.
|
| (8) |
Number of loans disbursed/Total relationship managers.
|
|
|
|||
|
| |
Earnings Release 1Q / 2025
|
Analysis of 1Q25 Consolidated Results
|
|
Credicorp’s Strategy Update
|
|||
|
Management KPI’s (1)
|
Quarter
|
Change %
|
|||
|
1Q24
|
4Q24
|
1Q25
|
QoQ
|
YoY
|
|
|
Users
|
|||||
|
Users (millions)
|
15.1
|
17.3
|
18.0
|
3.9%
|
18.9%
|
|
Monthly Active Users (MAU) (millions) (2)
|
11.5
|
13.7
|
14.3
|
4.4%
|
24.3%
|
|
Fee Income Generating MAU (millions)
|
8.6
|
11.4
|
12.0
|
5.2%
|
38.7%
|
|
Engagement
|
|||||
|
# Transactions (millions)
|
1,127.7
|
1,953.1
|
2,025.4
|
3.7%
|
79.6%
|
|
# Transactions / MAU
|
36.0
|
51.0
|
52.1
|
2.1%
|
44.5%
|
|
# Average Functionalities / MAU
|
2.2
|
2.6
|
2.6
|
2.7%
|
18.0%
|
|
Experience
|
|||||
|
NPS (3)
|
78
|
79
|
77
|
-200.0%
|
-140.0%
|
|
Unit Economics
|
|||||
|
Monthly Indicators (4)
|
|||||
|
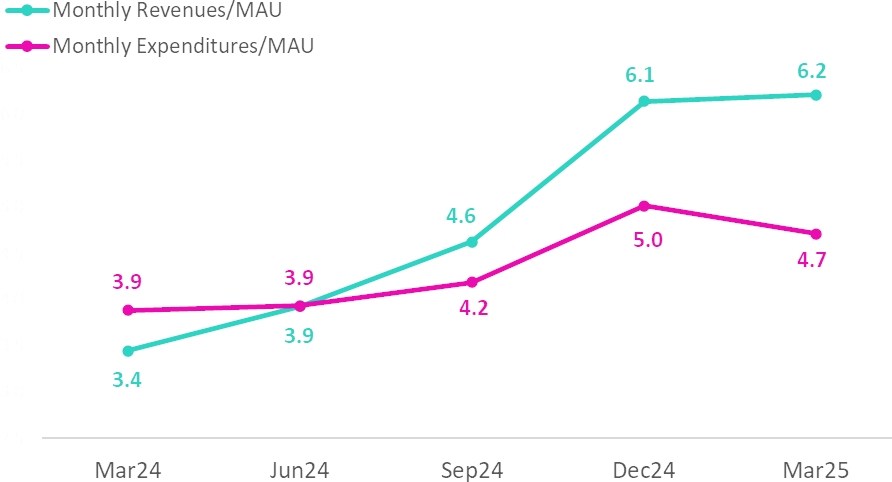
Revenues / MAU (S/) (5)
|
3.4
|
6.1
|
6.2
|
1.1%
|
80.4%
|
|
Expenses / MAU (S/) (5)
|
-3.9
|
-5.0
|
-4.7
|
-6.1%
|
21.2%
|
|
Quarterly Indicators (6)
|
|||||
|
Revenues / MAU (S/)
|
9.8
|
16.0
|
16.6
|
4.0%
|
69.0%
|
|
Expenses / MAU (S/)
|
-11.5
|
-13.4
|
-12.7
|
-5.4%
|
10.5%
|
|
Drivers Monetization
|
|||||
|
Total TPV (S/, billions) (7)
|
50.5
|
90.3
|
91.6
|
1.4%
|
81.4%
|
|
Payments
|
|||||
|
# Bill Payments transactions (millions)
|
23.4
|
40.5
|
45.0
|
11.3%
|
92.0%
|
|
Financials
|
|||||
|
# Loans Disbursements (thousands)
|
472.4
|
2,143.1
|
3,097.1
|
44.5%
|
555.7%
|
|
E-Commerce
|
|||||
|
GMV (S/, millions) (8)
|
59.1
|
120.4
|
119.2
|
-1.0%
|
101.7%
|
| (1) |
Management Figures.
|
| (2) |
Yape users that have made at least one outgoing transaction in the measurement month.
|
| (3) |
Net Promoter Score.
|
| (4) |
Monthly indicators consider the results of the last month of the quarter for the numerator and denominator.
|
|
(5)
|
Beginning in 1Q25, Credicorp incorporated reclassifications between Operating Expenses and Fee Income, along with new accounting allocations—primarily
related to interest expenses associated with the Deposit Insurance Fund. Figures for prior periods have been restated for comparability and may differ from those previously reported.
|
| (6) |
Quarterly indicators are calculated using the sum of the three months in the period for numerator accounts, and the average of the denominator—based on the last month’s data from both the
current and previous quarters.
|
| (7) |
Total Payment Volume.
|
| (8) |
Gross Merchant Volume, includes the following functionalities: Yape Promos, Yape Store, Ticketing, Gaming, Delivery, Buses, Insurance, Gas, Brand Solutions and
Insurance.
|
|
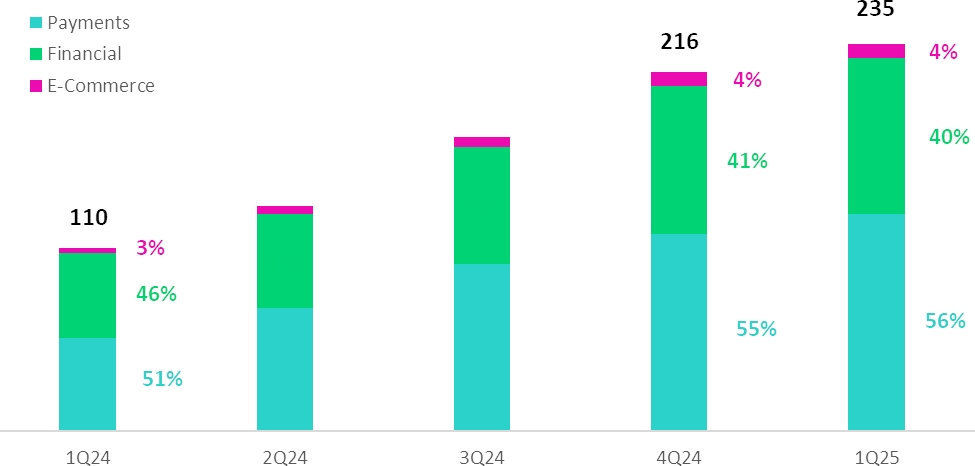
Financial results (1)
S/ millions
|
Quarter
|
Change %
|
|||
|
1Q24
|
4Q24
|
1Q25
|
QoQ
|
YoY
|
|
|
Net Interest Income after Provisions (2)
|
50.7
|
88.3
|
93.0
|
5.3%
|
83.6%
|
|
Other Income (3)
|
59.7
|
127.7
|
141.6
|
10.9%
|
137.1%
|
|
Total Income
|
110.4
|
216.0
|
234.6
|
8.6%
|
112.5%
|
|
Total Operating Expenses
|
-128.8
|
-181.3
|
-179.1
|
-1.2%
|
39.1%
|
|
(1)
|
Management figures. Beginning in 1Q25, reclassifications between Operating Expenses and Fee Income have been incorporated, along with new accounting
allocations — primarily related to interest expenses associated with the Deposit Insurance Fund. Figures for prior periods have been restated for comparability and may differ from those previously reported.
|
| (2) |
Includes interest income, interest expense and net provisions.
|
| (3) |
Includes Other Income recorded in BCP and in Yape Market.
|
|
|
|||
|
| |
Earnings Release 1Q / 2025
|
Analysis of 1Q25 Consolidated Results
|
|
Credicorp’s Strategy Update
|
|||
|
|
|
|
|||
|
| |
Earnings Release 1Q / 2025
|
Analysis of 1Q25 Consolidated Results
|
|
Credicorp’s Strategy Update
|
|||
| o |
Inclusion: Includes the financial inclusion and financial education fronts, as well as access to quality healthcare.
|
| o |
Finance for the Future: involves the fronts of support to micro, small and medium enterprises (MSMEs), resilience of businesses and people, and sustainable financing and
investments.
|
| o |
Trust: Encompasses promoting trust in Credicorp and its subsidiaries, as well as in the private sector in general.
|
| o |
Country Vision: Seeks to promote development in the countries in which we operate by leveraging the three pillars mentioned above.
|
| o |
BCP and Yape financially included 200 thousand people this quarter, accumulating a total of 6.0 million since 2020. More than 1.6 million clients received loan disbursements through Yape in the first quarter.
|
| o |
BCP reached 81 thousand clients in 1Q25 through financial education initiatives that focus on promoting changes in behavior to safeguard and improve their financial health (avoid over-indebtedness, late payments,
overdraws on credit cards, among others).
|
| o |
Pacifico closed the 1Q25 with +2.7 million clients included through inclusive insurance products1 placed through the BCP, Mibanco and Yape channels.
|
| o |
Mibanco reported a YTD increase of 16 thousand SME clients in its loan portfolio. Additionally, the bank reached more than 108 thousand clients through its financial education programs.
|
| o |
Mibanco disbursed 231 million soles in the 1Q25 through its Crediagua product, which equips households with drinking water and sewage connections.
|
| o |
BCP, in the framework of the program “Contigo Emprendedor,” rolled out the program “Despegue Empresarial,” which benefitted more than 70 thousand clients by helping them improve their credit score.
|
| o |
BCP disbursed more than US$ 430 million in sustainable financing in the 1Q25, led by loans for working capital for sustainable fishing and agriculture.
|
| o |
Pacifico certified more than 11 thousand people (including clients, non-clients and businesses’ employees) in risk prevention through its “ABC de Pacifico”, “Comunidad Segura” and “Protege365” programs, which
bolster resilience.
|
|
Indicator
|
Company
|
Unit
|
2024
|
1Q24
|
1Q25
|
|
Inclusion
|
|||||
|
People included financially through BCP and Yape – cumulative since 20202
|
BCP Peru and Yape
|
Million
|
5.7
|
4.2
|
6.0
|
|
Clients included in inclusive insurance services
|
Pacifico
|
Million
|
2.67
|
N.D.
|
2.77
|
|
Finance for the Future
|
|||||
|
Total loan balance for micro and small businesses
|
Mibanco Peru
|
S/ Million
|
11,356
|
11,618
|
11,629
|
|
Disbursements of sustainable financings
|
BCP Peru
|
$ Million
|
1,600
|
147
|
430
|
| 1 |
Simple and affordable optional insurance products with single or monthly payments of S/40 or less.
|
|
2
|
Stock of financially included clients through BCP since 2020: (i) New clients with savings accounts or affiliated to Yape. (ii) New clients without debt in the financial system
or BCP products in the last twelve months. (iii) Clients with 3 monthly average transactions in the last three months.
|
|
|
|||
|
| |
Earnings Release 1Q / 2025
|
Analysis of 1Q25 Consolidated Results
|
| 01 |
Loan Portfolio
|
|
After reaching a turning point last quarter, total loans in average daily balances (ADB) rose 0.8% (+1.4% FX Neutral). QoQ, this
evolution was primarily driven by i) an increase in disbursements of short-term loans in Wholesale Banking, and ii) growth in loan disbursements through Yape and BCP in Consumer, and iii) an upturn in disbursements at Mibanco. This growth
was partially offset by a drop in loans in Small Businesses.
YoY, total loans in average daily balances rose 1.5% (+2.3% FX Neutral). This evolution was mainly driven by i) an uptick in
disbursements of short-term loans in Corporate Banking, ii) an upturn in disbursements in Mortgage and by iii) growth in disbursements in SME-Business. YoY growth was partially attenuated by the application of stricter loan guidelines at
Mibanco and by a drop in disbursements for long-term loans in SME-Pyme.
|
||||
| 1.1. |
Loans
|
|
Total Loans (1) (2) (3)
|
|
As of
|
Volume change
|
% change
|
% Part. In total
|
loans | ||||
|
(S/ millions)
|
Mar 24
|
Dec 24
|
Mar 25
|
QoQ
|
YoY
|
QoQ
|
YoY
|
Mar 24
|
Dec 24
|
Mar 25
|
|
BCP Stand-alone
|
115,412
|
117,601
|
118,771
|
1,169
|
3,359
|
1.0%
|
2.9%
|
81.4%
|
82.4%
|
82.6%
|
|
Wholesale Banking
|
51,835
|
53,068
|
54,548
|
1,480
|
2,713
|
2.8%
|
5.2%
|
36.6%
|
37.2%
|
37.9%
|
|
Corporate
|
30,063
|
32,318
|
32,977
|
659
|
2,914
|
2.0%
|
9.7%
|
21.2%
|
22.6%
|
22.9%
|
|
Middle - Market
|
21,772
|
20,750
|
21,571
|
821
|
-201
|
4.0%
|
-0.9%
|
15.4%
|
14.5%
|
15.0%
|
|
Retail Banking
|
63,577
|
64,533
|
64,223
|
-311
|
646
|
-0.5%
|
1.0%
|
44.9%
|
45.2%
|
44.6%
|
|
SME - Business
|
7,294
|
7,956
|
7,590
|
-367
|
295
|
-4.6%
|
4.0%
|
5.1%
|
5.6%
|
5.3%
|
|
SME - Pyme
|
16,499
|
16,251
|
15,940
|
-311
|
-559
|
-1.9%
|
-3.4%
|
11.6%
|
11.4%
|
11.1%
|
|
Mortgage
|
21,050
|
21,709
|
21,870
|
161
|
821
|
0.7%
|
3.9%
|
14.9%
|
15.2%
|
15.2%
|
|
Consumer
|
12,723
|
12,755
|
12,961
|
206
|
237
|
1.6%
|
1.9%
|
9.0%
|
8.9%
|
9.0%
|
|
Credit Card
|
6,010
|
5,862
|
5,862
|
1
|
-148
|
0.0%
|
-2.5%
|
4.2%
|
4.1%
|
4.1%
|
|
Mibanco
|
13,244
|
12,057
|
12,147
|
90
|
-1,097
|
0.7%
|
-8.3%
|
9.3%
|
8.4%
|
8.4%
|
|
Mibanco Colombia
|
1,730
|
1,715
|
1,832
|
118
|
103
|
6.9%
|
5.9%
|
1.2%
|
1.2%
|
1.3%
|
|
Bolivia
|
9,362
|
9,628
|
9,469
|
-159
|
107
|
-1.7%
|
1.1%
|
6.6%
|
6.7%
|
6.6%
|
|
ASB
|
1,989
|
1,779
|
1,648
|
-131
|
-340
|
-7.4%
|
-17.1%
|
1.4%
|
1.2%
|
1.1%
|
|
BAP’s total loans
|
141,735
|
142,780
|
143,867
|
1,087
|
2,132
|
0.8%
|
1.5%
|
100.0%
|
100.0%
|
100.0%
|
|
For consolidation purposes. Loans generated in Foreign Currency (FC) are converted into Local Currency (LC).
|

|
| (1) |
Includes Special Accounts and other banking. For Quarter-end balance figures, please refer to “12. Annexes – 12.3 Loan Portfolio Quality”.
|
|
(2)
|
Internal Management Figures, non-audited.
|
| (3) |
Segmentation criteria have been updated and historical information restated to ensure comparability and better alignment with managerial reporting standards.
|
|
|
|||
|
| |
Earnings Release 1Q / 2025
|
Analysis of 1Q25 Consolidated Results
|
|
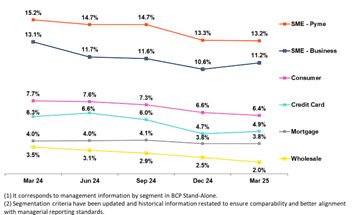
01. Loan Portfolio
|
|
|
• |
Wholesale Banking, due to an uptick in financing for working capital. In Middle Market Banking, growth was concentrated mainly
in the fishing sector, spurred by the fishing campaign that began at the end of 2024. In Corporate Banking, expansion was driven primarily by the construction and mining sectors.
|
|
|
• |
Consumer, mainly through an uptick in disbursements through Yape and BCP.
|
|
|
• |
Mibanco, due to an upturn in disbursements, particularly in the month of March, which reflects the improvements incorporated in our models to better assess risk
profiles and subsequently expand loan offerings.
|
|
|
• |
SME-Business, due to a seasonal effect given that clients that took on debt for working capital in 4Q24 amortized loans in 1Q25.
|
| • |
SME-Pyme, attributable to a drop in disbursements for long-term loans.
|
|
|
• |
Corporate Banking, due to the same dynamics seen QoQ.
|
|
|
• |
Mortgage, attributable to an uptick in the demand for loans due to favorable interest rates and economic reactivation.
|
|
|
• |
SME-Business, due to growth in loan disbursements through Government Programs (Impulso MyPerú), which were rolled out in 2Q24, and to an increase in
disbursements of negotiable invoices.
|
|
|
• |
Mibanco, after stricter lending guidelines were into effect at the end of 2Q24.
|
|
|
• |
Pyme, due to the same drivers in play QoQ.
|
|
|
|
Total Loans
|
Local Currency (LC) - S/ millions
|
% change
|
Foreign Currency (FC) - US$ millions
|
% change
|
% part. by currency
|
|||||||
|
Total
|
Total
|
Mar 25
|
||||||||||
|
Mar 24
|
Dec 24
|
Mar 25
|
QoQ
|
YoY
|
Mar 24
|
Dec 24
|
Mar 25
|
QoQ
|
YoY
|
LC
|
FC
|
|
|
BCP Stand-alone
|
78,329
|
79,978
|
79,947
|
0.0%
|
2.1%
|
9,842
|
10,011
|
10,526
|
5.1%
|
6.9%
|
67.3%
|
32.7%
|
|
Wholesale Banking
|
22,594
|
23,501
|
23,512
|
0.0%
|
4.1%
|
7,760
|
7,868
|
8,415
|
7.0%
|
8.4%
|
43.1%
|
56.9%
|
|
Corporate
|
13,126
|
14,540
|
14,110
|
-3.0%
|
7.5%
|
4,495
|
4,731
|
5,116
|
8.1%
|
13.8%
|
42.8%
|
57.2%
|
|
Middle-Market
|
9,468
|
8,961
|
9,401
|
4.9%
|
-0.7%
|
3,265
|
3,137
|
3,299
|
5.2%
|
1.0%
|
43.6%
|
56.4%
|
|
Retail Banking
|
55,735
|
56,478
|
56,436
|
-0.1%
|
1.3%
|
2,082
|
2,144
|
2,111
|
-1.5%
|
1.4%
|
87.9%
|
12.1%
|
|
SME - Business
|
4,141
|
4,738
|
4,529
|
-4.4%
|
9.4%
|
837
|
856
|
830
|
-3.1%
|
-0.9%
|
59.7%
|
40.3%
|
|
SME - Pyme
|
16,349
|
16,121
|
15,808
|
-1.9%
|
-3.3%
|
40
|
35
|
36
|
3.2%
|
-10.1%
|
99.2%
|
0.8%
|
|
Mortgage
|
19,100
|
19,794
|
20,049
|
1.3%
|
5.0%
|
518
|
510
|
494
|
-3.1%
|
-4.6%
|
91.7%
|
8.3%
|
|
Consumer
|
11,108
|
11,030
|
11,199
|
1.5%
|
0.8%
|
429
|
459
|
478
|
4.1%
|
11.4%
|
86.4%
|
13.6%
|
|
Credit Card
|
5,036
|
4,794
|
4,850
|
1.2%
|
-3.7%
|
259
|
284
|
274
|
-3.4%
|
6.1%
|
82.7%
|
17.3%
|
|
Mibanco
|
12,922
|
12,045
|
12,136
|
0.8%
|
-6.1%
|
85
|
3
|
3
|
-8.2%
|
-96.5%
|
99.9%
|
0.1%
|
|
Mibanco Colombia
|
-
|
-
|
-
|
-
|
-
|
459
|
456
|
497
|
8.9%
|
8.2%
|
-
|
100.0%
|
|
Bolivia
|
-
|
-
|
-
|
-
|
-
|
2,485
|
2,562
|
2,567
|
0.2%
|
3.3%
|
-
|
100.0%
|
|
ASB Bank Corp.
|
-
|
-
|
-
|
-
|
-
|
528
|
473
|
447
|
-5.6%
|
-15.3%
|
-
|
100.0%
|
|
Total loans
|
91,251
|
92,023
|
92,083
|
0.1%
|
0.9%
|
13,399
|
13,506
|
14,039
|
3.9%
|
4.8%
|
64.0%
|
36.0%
|
|
For consolidation purposes. Loans generated in Foreign Currency (FC) are converted into Local Currency (LC).
|
|
| (1) |
Includes Workout unit and other banking. For Quarter-end balance figures, please refer to “12. Annexes – 12.3 Loan Portfolio Quality”.
|
|
(2)
|
Internal Management Figures, non-audited.
|
| (3) |
Segmentation criteria have been updated and historical information restated to ensure comparability and better alignment with managerial reporting standards.
|
|
|
|||
|
| |
Earnings Release 1Q / 2025
|
Analysis of 1Q25 Consolidated Results
|
|
01. Loan Portfolio
|
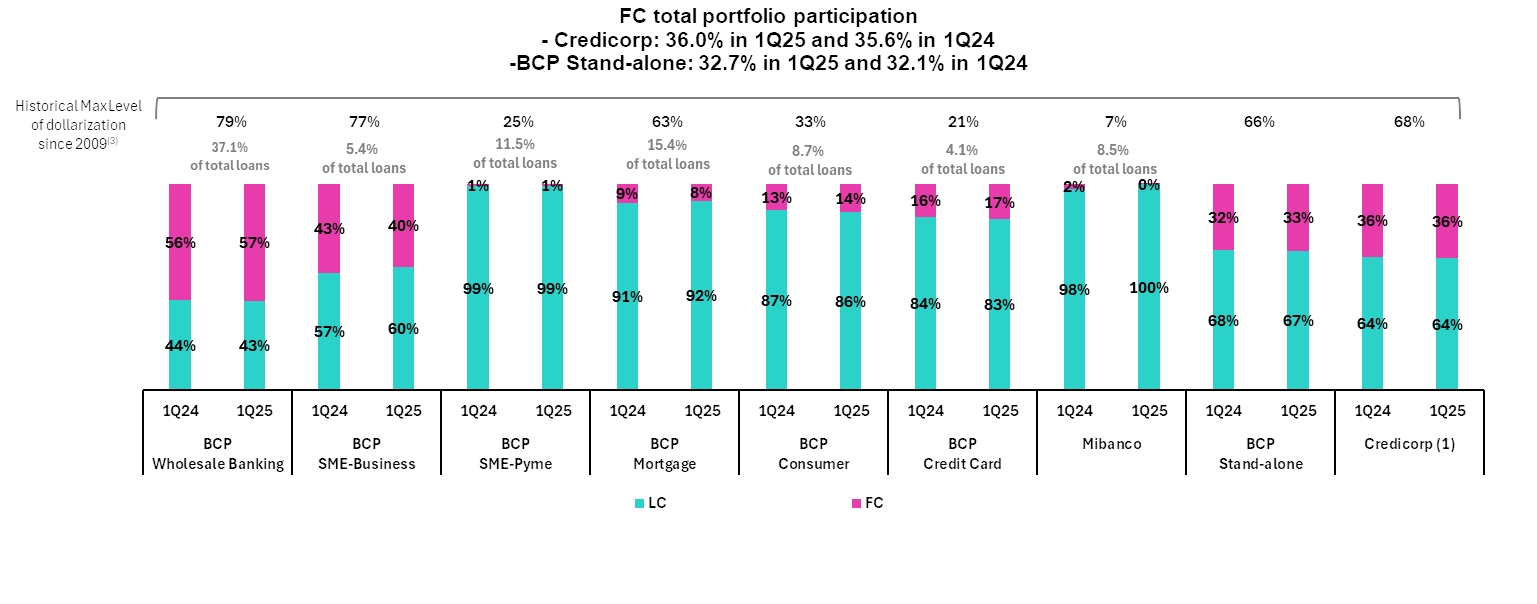
| (1) |
The FC share of Credicorp’s loan portfolio is calculated including BCP Bolivia and ASB Bank Corp., however the chart shows only the loan books of BCP Stand-alone and Mibanco.
|
| (2) |
The year with the historical maximum level of dollarization for Wholesale Banking was 2012, for Mibanco was 2016, for Credit Card was in 2021 and for the rest of segments was 2009.
|
|
|
|||
|
| |
Earnings Release 1Q / 2025
|
Analysis of 1Q25 Consolidated Results
|
| 02 |
Deposits
|
|
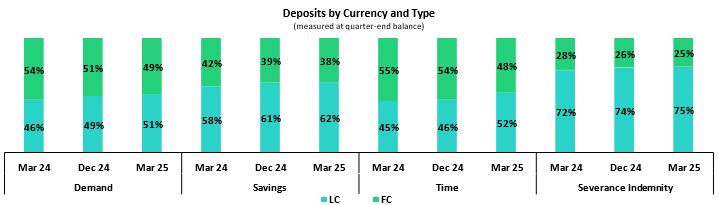
Excluding the effect of the accounting adjustment related to the balance sheet of BCP Bolivia, the evolution of Deposists presented the
following dynamics.
Total Deposits rose slightly QoQ, driven primarily by a 5.2% increase in Demand Deposits, which was fueled by mainly by
growth in institutional activity and, to a lesser extent, by a 1.9% increase in Savings Deposits, which rose due to an uptick in Individuals through fund inflows from payments of employee profit sharing. YoY, the balance of deposits grew
due to a rise the low-cost deposit balance (+16.9%), where Savings Deposits rose 16.6% due to our ability to continue capturing funds and Demand Deposits were up 17.1%, driven by the same dynamics as those seen QoQ.
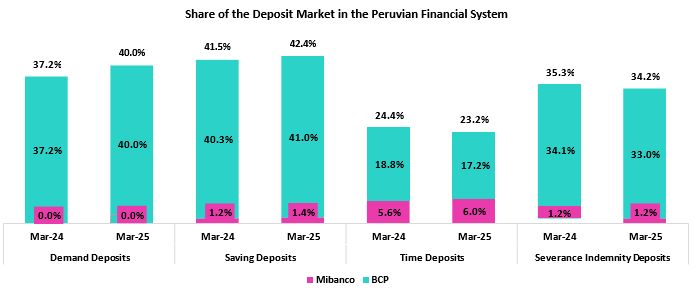
At the end of 1Q25, 71.8% of total deposits were low-cost deposits (Demand + Savings). Credicorp continues to lead the market for
low-cost deposits with a market share of 41.3% at the end of March.
|
|
Deposits
|
|
As of
|
|
Change %
|
Currency
|
||
|
S/ 000
|
Mar 24
|
Dec 24
|
Mar 25
|
QoQ
|
YoY
|
LC
|
FC
|
|
Demand deposits
|
47,384,819
|
52,590,952
|
53,992,480
|
2.7%
|
13.9%
|
50.9%
|
49.1%
|
|
Saving deposits
|
52,238,357
|
59,757,825
|
59,969,559
|
0.4%
|
14.8%
|
61.6%
|
38.4%
|
|
Time deposits
|
43,775,526
|
45,217,785
|
39,779,546
|
-12.0%
|
-9.1%
|
52.4%
|
47.6%
|
|
Severance indemnity deposits
|
3,086,767
|
2,996,020
|
2,921,196
|
-2.5%
|
-5.4%
|
75.1%
|
24.9%
|
|
Interest payable
|
1,371,658
|
1,279,484
|
956,301
|
-25.3%
|
-30.3%
|
29.4%
|
70.6%
|
|
Low-cost deposits (1)
|
99,623,176
|
112,348,777
|
113,962,039
|
1.4%
|
14.4%
|
56.5%
|
43.5%
|
|
Total Deposits
|
147,857,127
|
161,842,066
|
157,619,082
|
-2.6%
|
6.6%
|
55.6%
|
44.4%
|
|
(1)
|
Includes Demand Deposits and Saving Deposits
|
|
|
• |
5.2% growth in the balance of Demand Deposits, which was fueled primarily by an uptick in LC volumes at BCP Stand-alone. This expansion was driven mainly by Middle Market
Banking, principally via an increase in institutional activity and to a lesser degree through fund migration to Time Deposits following maturity.
|
|
|
• |
1.9% growth in Savings Deposits, which was driven mainly by an increase in LC volumes at BCP Stand-alone via clients in Individuals in the private sector, who received
profit-sharing payments in March.
|
|
|
• |
An 8.6% reduction in the Time Deposit balance. This decline was fueled by a drop in FC deposits at BCP Stand-alone after some wholesale deposits reached maturity and were
not renewed, in line with strategic decisions to optimize our funding structure.
|
|
|
• |
A 16.6% increase in the Savings Deposit balance, which was driven by growth in LC deposits at BCP Stand-alone. The primary driver of the uptick was our on-going efforts
to capture funds in a high-liquidity context; growth was also driven, albeit to a lesser extent, by the dynamics in play QoQ.
|
|
|
• |
17.1% growth in the balance of Demand Deposits, which was fueled by growth in the LC balance at BCP Stand-alone. The increase in LC was mainly attributable to the
evolution of the balance for Wholesale Banking, which rose due same dynamics seen QoQ, and secondarily to SMEs, where the balance increased through fund inflows from government loan disbursements.
|
|
| |
Earnings Release 1Q / 2025
|
Analysis of 1Q25 Consolidated Results
|
|
02. Deposits
|
|
•
|
A 4.9% contraction in the Time Deposit balance, which was mainly fueled by a drop in the FC balance at BCP Stand-alone. This decrease was
due to the same dynamics seen QoQ, but was partially offset by growth in the LC balance in Individuals, which rose on the back of fund inflows from profit-sharing payments.
|

|
|
|
|
|
| |
Earnings Release 1Q / 2025
|
Analysis of 1Q25 Consolidated Results
|
|
02. Deposits
|
|
|
|
| |
Earnings Release 1Q / 2025
|
Analysis of 1Q25 Consolidated Results
|
| 03 |
Interest-Earning Assets (IEA) and Funding |
|
Excluding the effect of the accounting adjustment associated with the balance sheet of BCP Bolivia, the evolution of
the IEA and funding presented the following dynamics:
QoQ, IEA dropped 0.1% primarily due to a contraction in Cash and due from banks and secondarily to a decrease in the
Loan balance. These dynamics were partially offset by an increase in the investment balance in a context of a gradual acceleration in loan growth. Funding dropped 0.5%, mainly on the back of a bond maturity at BCP.
YoY, IEA rose 6.4% due to growth in Cash and due from banks, which reflects a high-liquidity environment.
Balances for Loans and Total Investments also contributed to growth in IEA, albeit to a lesser extent. Funding rose 6.7% due to expansion in deposits, which was concentrated in low-cost deposits, reflecting BCP’s solid
transactional offering.
|
||||
|
3.1.
|
IEA
|
|
Interest earning assets
|
As of
|
% change
|
|||
|
S/000
|
Mar 24
|
Dec 24
|
Mar 25
|
QoQ
|
YoY
|
|
Cash and due from banks
|
31,134,572
|
40,119,937
|
37,521,839
|
-6.5%
|
20.5%
|
|
Total investments
|
52,555,386
|
53,825,858
|
55,604,610
|
3.3%
|
5.8%
|
|
Cash collateral, reverse repurchase agreements and securities borrowing
|
1,526,232
|
1,033,177
|
1,835,893
|
77.7%
|
20.3%
|
|
Loans
|
140,798,083
|
145,732,273
|
141,196,646
|
-3.1%
|
0.3%
|
|
Total interest earning assets
|
226,014,273
|
240,711,245
|
236,158,988
|
-1.9%
|
4.5%
|
| 3.2. |
Funding
|
|
Funding
|
As of
|
% change
|
|||
|
S/000
|
Mar 24
|
Dec 24
|
Mar 25
|
QoQ
|
YoY
|
|
Deposits and obligations
|
147,857,127
|
161,842,066
|
157,619,082
|
-2.6%
|
6.6%
|
|
Due to banks and correspondents
|
10,684,673
|
10,754,385
|
10,899,579
|
1.4%
|
2.0%
|
|
BCRP instruments
|
6,854,368
|
6,646,830
|
7,064,476
|
6.3%
|
3.1%
|
|
Repurchase agreements with clients and third parties
|
2,636,908
|
2,413,880
|
3,094,138
|
28.2%
|
17.3%
|
|
Bonds and notes issued
|
17,541,121
|
17,268,443
|
14,391,733
|
-16.7%
|
-18.0%
|
|
Total Funding
|
185,574,197
|
198,925,604
|
193,069,008
|
-2.9%
|
4.0%
|
|
| |
Earnings Release 1Q / 2025
|
Analysis of 1Q25 Consolidated Results
|
|
03. Interest-earning Assets (IEA) and Funding
|
|
| |
Earnings Release 1Q / 2025
|
Analysis of 1Q25 Consolidated Results
|
|
|
04
|
Net Interest Income (NII)
|
|
|
In 1Q25, Net Interest Income (NII) fell 1.6% QoQ due to a drop in Interest and similar income, which registered a reduction in income on loans due to lower interest rates and an
uptick in Wholesale Loans’ share of total loans. Interest and similar expenses partially offset the reduction in income, given lower interest rates and a reduction in the funding volume.
YoY, NII rose 4.3%, driven by a reduction in Interest and similar expenses. This decline was attributable to a drop in interest on deposits, which reflected lower interest rates,
and an uptick in low-cost deposits’ share of the funding structure. Interest and similar income had a negative impact on NII, due primarily to a drop in interest on investments in a context of lower rates and
secondarily to a decline in interest on loans, given the same factors mentioned in the QoQ analysis.
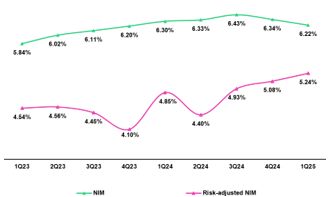
NIM fell 12 bps QoQ to stand at 6.22%, spurred by a drop the yield on IEAs, which was partially offset by a reduction in the cost of funding. It is important to
note that Risk-adjusted NIM continued to trend upward and stood at a record high1 of 5.24%.
|
|
Net interest income
|
Quarter
|
% change
|
|||
|
S/000
|
1Q24
|
4Q24
|
1Q25
|
QoQ
|
YoY
|
|
Interest and Similar Income
|
4,925,926
|
5,012,121
|
4,894,790
|
-2.3%
|
-0.6%
|
|
Interest and Similar Expenses
|
(1,499,803)
|
(1,382,327)
|
(1,322,778)
|
-4.3%
|
-11.8%
|
|
Interest Expense (excluding Net Insurance Financial Expenses)
|
(1,377,799)
|
(1,250,239)
|
(1,187,156)
|
-5.0%
|
-13.8%
|
|
Net Insurance Financial Expenses
|
(122,004)
|
(132,088)
|
(135,622)
|
2.7%
|
11.2%
|
|
Net Interest, similar income and expenses
|
3,426,123
|
3,629,794
|
3,572,012
|
-1.6%
|
4.3%
|
|
|
|
|
|
|
|
|
Balances
|
|
|
|
||
|
Average Interest Earning Assets (IEA)
|
225,297,538
|
237,518,087
|
238,435,117
|
0.4%
|
5.8%
|
|
Average Funding
|
185,160,542
|
195,200,202
|
195,997,306
|
0.4%
|
5.9%
|
|
|
|
|
|||
|
Yields
|
|
|
|
||
|
Yield on IEAs
|
8.75%
|
8.44%
|
8.21%
|
-23 bps
|
-54 bps
|
|
Cost of Funds(1)
|
2.98%
|
2.56%
|
2.42%
|
-14 bps
|
-56 bps
|
|
Net Interest Margin (NIM)(1)
|
6.30%
|
6.34%
|
6.22%
|
-12 bps
|
-8 bps
|
|
Risk-Adjusted Net Interest Margin(1)
|
4.85%
|
5.08%
|
5.24%
|
16 bps
|
39 bps
|
|
Peru’s Reference Rate
|
6.25%
|
5.00%
|
4.75%
|
-25 bps
|
-150 bps
|
|
FED funds rate
|
5.50%
|
4.50%
|
4.50%
|
0 bps
|
-100 bps
|
|
(1)
|
For further details on the NIM and Cost of Funds calculation, please refer to Annex 12.7.
|
|
1
|
Since the implementation of IFRS 9 in 2018.
|
|
|
|||
|
| |
Earnings Release 1Q / 2025
|
Analysis of 1Q25 Consolidated Results
|
|
04. Net Interest Income (NII)
|
|
|
|
Interest Income / IEA
|
|
1Q24 |
|
4Q24
|
|
1Q25 | |||
|
S/ millions
|
Average
|
|
Average
|
Average
|
|||||
|
|
Balance
|
Income
|
Yields
|
Balance
|
Income
|
Yields
|
Balance
|
Income
|
Yields
|
|
Cash and equivalents
|
28,556
|
334
|
4.7%
|
38,564
|
386
|
4.0%
|
38,821
|
345
|
3.6%
|
|
Other IEA
|
1,469
|
28
|
7.6%
|
1,227
|
18
|
5.9%
|
1,434
|
19
|
5.3%
|
|
Investments
|
52,385
|
694
|
5.3%
|
53,578
|
667
|
5.0%
|
54,715
|
683
|
5.0%
|
|
Loans
|
142,887
|
3,869
|
10.8%
|
144,150
|
3,940
|
10.9%
|
143,464
|
3,848
|
10.7%
|
|
Total IEA
|
225,297
|
4,925
|
8.7%
|
237,519
|
5,011
|
8.4%
|
238,434
|
4,895
|
8.2%
|
|
IEA (LC)
|
58.0%
|
69.9%
|
10.5%
|
54.7%
|
68.8%
|
10.6%
|
55.6%
|
70.5%
|
10.4%
|
|
IEA (FC)
|
42.0%
|
30.1%
|
6.3%
|
45.3%
|
31.2%
|
5.8%
|
44.4%
|
29.5%
|
5.5%
|
|
Interest Expense / Funding
|
|
1Q24 |
|
4Q24 |
|
1Q25
|
|||
|
S/ millions
|
Average
|
Average
|
Average
|
||||||
|
|
Balance
|
Expense
|
Yields
|
Balance
|
Expense
|
Yields
|
Balance
|
Expense
|
Yields
|
|
Deposits
|
147,782
|
780
|
2.1%
|
158,139
|
655
|
1.7%
|
159,731
|
620
|
1.6%
|
|
BCRP + Due to Banks
|
18,640
|
265
|
5.7%
|
17,447
|
287
|
6.6%
|
17,683
|
266
|
6.0%
|
|
Bonds and Notes
|
16,068
|
197
|
4.9%
|
17,110
|
201
|
4.7%
|
15,830
|
168
|
4.2%
|
|
Others
|
2,672
|
259
|
38.8%
|
2,504
|
239
|
38.2%
|
2,754
|
269
|
39.1%
|
|
Total Funding
|
185,162
|
1,501
|
3.2%
|
195,200
|
1,382
|
2.8%
|
195,998
|
1,323
|
2.7%
|
|
Funding (LC)
|
49.5%
|
51.9%
|
3.4%
|
49.6%
|
49.8%
|
2.8%
|
51.7%
|
53.4%
|
2.8%
|
|
Funding (FC)
|
50.5%
|
48.1%
|
3.1%
|
50.4%
|
50.2%
|
2.8%
|
48.3%
|
46.6%
|
2.6%
|
|
NIM(1)
|
225,297
|
3,424
|
6.1%
|
237,519
|
3,629
|
6.1%
|
238,434
|
3,572
|
6.0%
|
|
NIM (LC)
|
58.0%
|
77.8%
|
8.2%
|
54.7%
|
76.1%
|
8.5%
|
55.6%
|
76.8%
|
8.3%
|
|
NIM (FC)
|
42.0%
|
22.2%
|
3.2%
|
45.3%
|
23.9%
|
3.2%
|
44.4%
|
23.2%
|
3.1%
|
|
(1)
|
Unlike the NIM figure calculated according to the formula in Appendix 12.7, the NIM presented in this table includes “Financial Expense associated
with the insurance and reinsurance activity, net”.
|
|
|
|||
|
| |
Earnings Release 1Q / 2025
|
Analysis of 1Q25 Consolidated Results
|
|
04. Net Interest Income (NII)
|
|
|
|||
|
| |
Earnings Release 1Q / 2025
|
Analysis of 1Q25 Consolidated Results
|
| 05 |
Portfolio Quality and Provisions
|
|
|
This quarter, the NPL ratio and Cost of Risk clearly reflect a noteworthy improvement and
continue to contract across segments, as a result of the cumulative impact of fortified underwriting and risk management, a relatively strong Peru economy, and some one-time events.
QoQ, the decline in NPLs at BCP Stand-alone was driven mainly by debt repayments in Wholesale and to a lesser extent,
by a drop in internal overdue loans in SME-Pyme. At Mibanco, the decrease in NPL volumes was fueled mainly by a reduction in internal overdue loans. In this context, the NPL ratio fell 16 bps and 112 bps QoQ and
YoY to stand at 5.1% at quarter-end.
QoQ, the decline in provisions was mainly attributable to BCP Stand-alone, where provisions
dropped primarily due to (i) a base effect base via calibrations in our risk models and an improvement in payment performance in Credit Cards and Consumer, and (ii) due to an uptick in reversals in Wholesale
Banking. This evolution was partially offset by an increase in provisions at Mibanco, due to a base effect given that write-offs were low last quarter. In this context, the cost of risk fell 44 bps and 66 bps QoQ
and YoY respectively to stand at 1.6% at quarter-end.
|
|
5.1
|
Portfolio Quality
|
|
Loan Portfolio quality and Delinquency ratios
|
|
As of
|
% change
|
||
|
S/000
|
Mar 24
|
Dec 24
|
Mar 25
|
QoQ
|
YoY
|
|
Total loans (Quarter-end balance)
|
140,798,083
|
145,732,273
|
141,196,646
|
-3.1%
|
0.3%
|
|
Write-offs
|
950,433
|
896,714
|
716,585
|
-20.1%
|
-24.6%
|
|
Internal overdue loans (IOLs)
|
6,205,024
|
5,423,212
|
5,206,395
|
-4.0%
|
-16.1%
|
|
Internal overdue loans over 90-days
|
4,702,733
|
4,383,795
|
4,232,843
|
-3.4%
|
-10.0%
|
|
Refinanced loans
|
2,557,749
|
2,239,445
|
2,001,282
|
-10.6%
|
-21.8%
|
|
Non-performing loans (NPLs)
|
8,762,773
|
7,662,657
|
7,207,677
|
-5.9%
|
-17.7%
|
|
IOL ratio
|
4.4%
|
3.7%
|
3.7%
|
-3 bps
|
-72 bps
|
|
IOL over 90-days ratio
|
3.3%
|
3.0%
|
3.0%
|
-1 bps
|
-34 bps
|
|
NPL ratio
|
6.2%
|
5.3%
|
5.1%
|
-16 bps
|
-112 bps
|
|
|
|||
|
| |
Earnings Release 1Q / 2025
|
Analysis of 1Q25 Consolidated Results
|
|
05. Portfolio Quality and Provisions
|
|
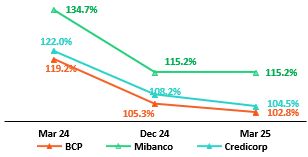
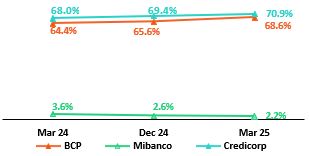
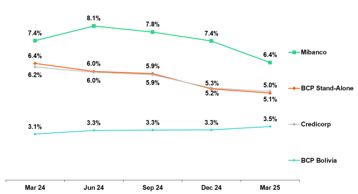
NPL Ratio for Total Loans
|
|
|
|
|
•
|
Mibanco, where the NPL Ratio dropped 99 bps, driven mainly by a decrease in NPL volumes and secondarily by slight growth in total loans.
|
|
NPL Ratio for Total Loans at BCP (1)(2)
|
|
|
|
|
|
•
|
Mibanco, where the NPL Ratio fell 101 bps, due to a decrease in NPL Volumes, which was partially offset by a contraction in total loans.
|
|
|
|||
|
| |
Earnings Release 1Q / 2025
|
Analysis of 1Q25 Consolidated Results
|
|
05. Portfolio Quality and Provisions
|
|
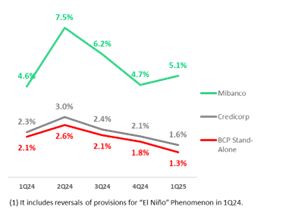
5.2
|
Provisions and Cost of Risk of the Total Portfolio
|
|
Loan Portfolio Provisions
|
|
Quarter |
% change
|
||
|
S/000
|
1Q24
|
4Q24
|
1Q25
|
QoQ
|
YoY
|
|
Gross provision for credit losses on loan portfolio
|
(910,189)
|
(857,694)
|
(695,733)
|
-18.9%
|
-23.6%
|
|
Recoveries of written-off loans
|
95,490
|
114,398
|
113,840
|
-0.5%
|
19.2%
|
|
Provision for credit losses on loan portfolio, net of recoveries
|
(814,699)
|
(743,296)
|
(581,893)
|
-21.7%
|
-28.6%
|
|
Cost of risk (1)
|
2.3%
|
2.1%
|
1.6%
|
-44 bps
|
-66 bps
|
|
|
|
Cost of Risk by Subsidiary (1)
|
|
|
YoY, provisions fell 45.5%, driven by BCP Stand-alone
and Mibanco, which reported an improvement in payment performance in a context of economic recovery. At BCP Stand-alone, the drop in
provisions was primarily attributable to i) Consumer and Credit Cards, due to the same dynamics seen QoQ; and ii) SME-Pyme, due primarily to growth in the share of lower- risk vintages in the loan mix. This evolution was partially offset by an uptick in
provisions in Wholesale, which was associated with a base effect given that reversals were higher in 1Q24. At Mibanco, the drop was spurred by an improvement in underlying
risk as lower-risk vintages gained traction in the portfolio mix. In this context, the Cost of Risk at Credicorp fell 137 bps YoY to
stand at 1.6%.
|
|
 |
|
|
QoQ Cost of Risk Evolution
|
|
YoY Underlying Cost of Risk Evolution*
|
|
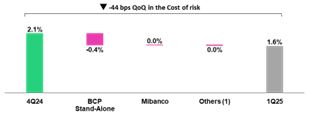 (1) Others include BCP Bolivia, Mibanco Colombia, ASB and eliminations.
|
|
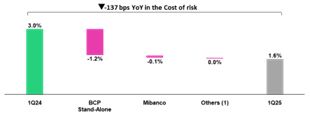
(*) It excludes reversals of provisions for “El Niño” Phenomenon in 1Q24.
(1) Others include BCP Bolivia, Mibanco Colombia, ASB and eliminations.
|
|
|
|
|||
|
| |
Earnings Release 1Q / 2025
|
Analysis of 1Q25 Consolidated Results
|
|
05. Portfolio Quality and Provisions
|
|
Loan Portfolio Quality and Delinquency Ratios
|
|
As of
|
% change
|
||
|
S/000
|
Mar 24
|
Dec 24
|
Mar 25
|
QoQ
|
YoY
|
|
Total loans (Quarter-end balance)
|
140,798,083
|
145,732,273
|
141,196,646
|
-3.1%
|
0.3%
|
|
Allowance for loan losses
|
8,190,343
|
7,994,977
|
7,742,792
|
-3.2%
|
-5.5%
|
|
Non-performing loans (NPLs)
|
8,762,773
|
7,662,657
|
7,207,677
|
-5.9%
|
-17.7%
|
|
Allowance for loan losses over Total loans
|
5.8%
|
5.5%
|
5.5%
|
-1 bps
|
-34 bps
|
|
Coverage ratio of NPLs
|
93.5%
|
104.3%
|
107.4%
|
308 bps
|
1395 bps
|
|
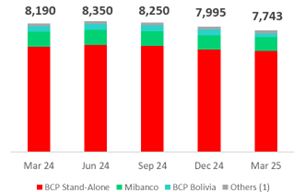
Allowance for loan losses
(in S/ millions)
|
|
|
|
 |
|
QoQ, Allowances for Loan Losses fell 3.2%, driven primarily by BCP Bolivia and Mibanco.
YoY, Allowances for Loan Losses dropped 5.5%, driven primarily by Small Businesses and
Consumer at BCP Individual and secondarily by BCP Bolivia.
|
|
|
|
|
|
|
|
(1) Others include Mibanco Colombia, ASB and eliminations.
|
|
|
|
|
|
|
|
|
|
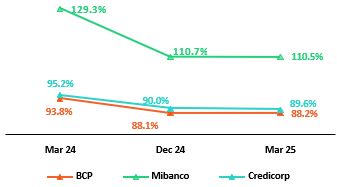
NPL Coverage Ratio
|
|
|
|
 |
|
The NPL Coverage Ratio at Credicorp stood at 107.4% at the end of 1Q25. If we exclude NPL volumes from Government Loans (PG),
the ratio stands at 110.6%.
QoQ
the NPL Coverage Ratio at Credicorp rose 308 bps, driven by the evolution at BCP Stand-alone and Mibanco. Next, our analysis of this evolution will isolate the effect of NPL volumes of Government loans, which have broad guarantees and
are being honored satisfactorily.
QoQ, the NPL Coverage Ratio at BCP
Stand-alone, excluding Government Loans (GP), increased 431 bps to stand at 111.3%. This evolution was primarily driven by a decrease in NPL loans in Wholesale Banking and
Consumer. The NPL Coverage Ratio at Mibanco, excluding Government Loans (GP), rose 562 bps to stand at 108.5%, fueled by a
drop in NPLs, which was originated by the same factors seen QoQ.
|
|
|
|
|||
|
|
|||
|
| |
Earnings Release 1Q / 2025
|
Analysis of 1Q25 Consolidated Results
|
| 06 |
Other Income
|
|
|
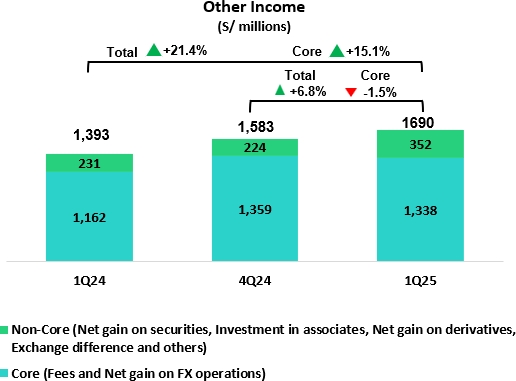
This quarter, Other Income grew by 6.8% QoQ and 21.4% YoY. This evolution includes an
extraordinary gain of approximately S/236 million, resulting from the acquisition of the remaining 50% of Empresas Banmedica in the joint venture with Pacifico Seguros. Excluding this extraordinary gain, Other
Income showed the following dynamics:
QoQ, Other Income decreased by 8.1%. Other Core Income dropped 1.5% due to a decrease in Net Gain
on FX Transactions. Although Fee Income grew by 2.1%, reflecting solid recurring transactional dynamics, this evolution was offset by lower FX results, due to a loss in the USD position at BCP Bolivia. Other
Non-Core Income decreased by 47.9%, due to a base effect from the sale of real estate in BCP Stand-alone, as well as lower derivative income in ASB.
YoY, Other Income increased by 4.5%. Other Core Income rose 15.1%, driven by BCP
Stand-alone, which registered an uptick in fee income from Yape and gains on a rise in the volume of FX transactions by Retail clients.
|
|
6.
|
Other Income
|
|
Other Income (1)
|
|
Quarter
|
% Change
|
||
|
(S/ 000)
|
1Q24
|
4Q24
|
1Q25
|
QoQ
|
YoY
|
|
Other Core Income
|
1,161,935
|
1,358,568
|
1,337,838
|
-1.5%
|
15.1%
|
|
Other Non-Core Income
|
230,624
|
224,164
|
352,378
|
57.2%
|
52.8%
|
|
Total Other Income
|
1,392,559
|
1,582,732
|
1,690,216
|
6.8%
|
21.4%
|
|
(1)
|
Beginning in 1Q25, accounting reclassifications have been incorporated affecting Fee Income, Net Gain on Foreign Exchange
Transactions, and Net Gain on Derivatives Held for Trading. Prior periods have been restated for comparability and may differ from previously reported figures.
|
|
6.1.
|
Other Core Income
|
|
Other Core Income (1)
|
|
Quarter |
% Change
|
||
|
(S/ 000)
|
1Q24
|
4Q24
|
1Q25
|
QoQ
|
YoY
|
|
Fee Income
|
856,565
|
973,338
|
994,024
|
2.1%
|
16.0%
|
|
Net Gain on Foreign Exchange Transactions
|
305,370
|
385,230
|
343,814
|
-10.8%
|
12.6%
|
|
Total Other Core Income
|
1,161,935
|
1,358,568
|
1,337,838
|
-1.5%
|
15.1%
|
|
•
|
QoQ, Other Core Income recorded solid results, maintaining levels above S/1.3 billion for the third consecutive quarter. The recurring
business generated through Fee Income grew by 2.1% QoQ, underpinned by the solid business dynamics described in the next section. However, this evolution was offset by a decline in Net Gain on Foreign Exchange
Transactions (-10.8%), which reflects a strategic decision to increase our balance position in USD at BCP Bolivia, which generated losses. As a result, Other Core Income fell 1.5% QoQ.
|
|
•
|
YoY, the growth of 15.1% was mainly driven by an increase in Fee Income, whose dynamics will be described in the next
section. To a lesser extent, the growth is due to the Net Gain on Foreign Exchange Transactions (+12.6%) at BCP Stand-alone, due to higher transaction volumes in Retail Banking amid exchange rate volatility.
|
|
|
|||
|
| |
Earnings Release 1Q / 2025
|
Analysis of 1Q25 Consolidated Results
|
|
06. Other Income
|
|
Fee Income by Subsidiary
|
|
Quarter |
% Change
|
||
|
(S/000)
|
1Q24
|
4Q24
|
1Q25
|
QoQ
|
YoY
|
|
BCP Stand-Alone (1)
|
704,628
|
809,060
|
831,427
|
2.8%
|
18.0%
|
|
BCP Bolivia (2)
|
14,868
|
14,197
|
12,844
|
-9.5%
|
-13.6%
|
|
Mibanco
|
24,173
|
24,108
|
28,339
|
17.6%
|
17.2%
|
|
Mibanco Colombia
|
11,250
|
11,356
|
9,126
|
-19.6%
|
-18.9%
|
|
Pacífico
|
-3,199
|
-3,115
|
-3,757
|
20.6%
|
17.4%
|
|
Prima
|
94,528
|
88,102
|
94,072
|
6.8%
|
-0.5%
|
|
ASB
|
17,062
|
15,170
|
13,826
|
-8.9%
|
-19.0%
|
|
Credicorp Capital
|
128,148
|
131,199
|
136,264
|
3.9%
|
6.3%
|
|
Eliminations and Other (3)
|
-134,893
|
-116,738
|
-128,117
|
9.7%
|
-5.0%
|
|
Total Net Fee Income
|
856,565
|
973,339
|
994,024
|
2.1%
|
16.0%
|
|
(1)
|
Beginning in 1Q25, accounting reclassifications related to credit card loyalty program expenses and Yape’s transactional fee expenses have been
incorporated. These reclassifications affected Administrative and General Expenses as well as Fee Income. Prior periods have been restated for comparability and may differ from previously reported figures.
|
|
(2)
|
Beginning in 1Q25, reclassifications related to FX operations at BCP Bolivia have been incorporated. These reclassifications affected Fee Income and
Net Gain on Derivatives Held for Trading, which are now consolidated into Net Gain on Foreign Exchange Transactions. Prior periods have been restated for comparability and may differ from previously reported
figures.
|
|
(3)
|
Correspond mainly to the eliminations of bancassurance between Pacifico, BCP, and Mibanco.
|
|
BCP Stand-alone Fees
|
|
Quarter
|
% Change
|
||
|
(S/ 000,000)
|
1Q24
|
4Q24
|
1Q25
|
QoQ
|
YoY
|
|
Payments and transactional services (1)
|
272
|
281
|
278
|
-1.3%
|
2.1%
|
|
Yape (2)
|
54
|
114
|
120
|
5.6%
|
123.1%
|
|
Liability and Transactional Accounts (3)
|
179
|
192
|
200
|
4.1%
|
11.6%
|
|
Loan Disbursement (4)
|
90
|
98
|
98
|
-0.1%
|
9.0%
|
|
Off-balance sheet
|
57
|
55
|
56
|
2.1%
|
-1.9%
|
|
Insurances
|
34
|
35
|
48
|
37.3%
|
43.0%
|
|
Wealth Management and Corporate Finance
|
9
|
19
|
15
|
-22.9%
|
57.6%
|
|
Others (5)
|
9
|
14
|
16
|
16.0%
|
73.5%
|
|
Total
|
705
|
809
|
831
|
2.8%
|
18.0%
|
|
(1)
|
Includes fees from credit and debit card activity, payments, and collections. Beginning in 1Q25, accounting reclassifications related to expenses associated with
the credit card loyalty program have been incorporated. These reclassifications affected Administrative and General Expenses and Fee Income. Figures for prior periods have been restated for comparability and may
differ from those previously reported.
|
|
(2)
|
Beginning in 1Q25, accounting reclassifications associated with Yape’s transactional fee expenses have been incorporated. These reclassifications affected
Administrative and General Expenses and Fee Income. Figures for prior periods have been restated for comparability and may differ from those previously reported.
|
|
(3)
|
Corresponds to fees from Account maintenance, interbank transfers, national transfers, and international transfers.
|
|
(4)
|
Corresponds to fees from retail and wholesale loan disbursements.
|
|
(5)
|
Use of third-party networks, other services to third parties, and Commissions in foreign branches.
|
|
•
|
Yape, mainly through Service Payments, POS (QR) Payments and Checkout.
|
|
•
|
Liability and transactional accounts, after income increased through (i) Wires and Transfers, which rose primarily due to a base effect that included expenses for
clearing services with the Cámara de Compensación Electrónica, and (ii) Current Accounts, which experienced growth in the client base after new accounts were opened to
receive funds from AFP releases.
|
|
•
|
Insurance, due to an extraordinary income between related parties in the credit life insurance, and to a lesser extent, higher fees in the optional insurance brokerage
service. Excluding this extraordinary income, the evolution of Insurance would remain stable
|
|
|
|||
|
| |
Earnings Release 1Q / 2025
|
Analysis of 1Q25 Consolidated Results
|
|
06. Other Income
|
|
•
|
Yape, which represented 52% of the growth in total fees and rose on the back of the same factors seen QoQ and via Yape
Businesses and Top-Ups.
|
|
•
|
Liability and transactional accounts, which represented 16% of growth in total fees, where growth was fueled by (i) Wires and
Transfers (+10.4%), which reflected an increase in the volume of inter-bank transfers, foreign transfers and remittances, and (ii) Current Accounts (+17.3%), driven by the same factors seen in the QoQ analysis.
|
|
•
|
Insurance, which represents 11% of growth in total fees, rose on the back of the same drivers seen QoQ. Excluding this
extraordinary income, the evolution of Insurance would remain stable.
|
|
6.2
|
Other Non-Core Income
|
|
Other Non-Core Income (1)
|
|
Quarter |
% Change
|
||
|
S/000
|
1Q24
|
4Q24
|
1Q25
|
QoQ
|
YoY
|
|
Net Gain on Securities
|
61,745
|
-47,377
|
-28,149
|
-40.6%
|
-145.6%
|
|
Net Gain from Associates (2)
|
32,295
|
38,560
|
24,068
|
-37.6%
|
-25.5%
|
|
Net Gain of Derivatives Held for Trading (3)
|
39,984
|
77,962
|
18,499
|
-76.3%
|
-53.7%
|
|
Net Gain from Exchange Differences
|
-5,621
|
-21,365
|
15,959
|
-174.7%
|
-383.9%
|
|
Other Non-operative Income
|
102,221
|
176,384
|
322,001
|
82.6%
|
215.0%
|
|
Total Other Non-Core Income
|
230,624
|
224,164
|
352,378
|
57.2%
|
52.8%
|
|
(1)
|
Since March 2025, revenues from the EPS and Medical Services businesses are no longer reported under Net Gain from Associates. Instead, they are fully consolidated
into the Underwriting Insurance Result and the newly created Medical Services Result, respectively.
|
|
(2)
|
Includes gains on other investments, which are mainly attributable to the Banmedica result.
|
|
(3)
|
Beginning in 1Q25, accounting reclassifications related to FX operations at BCP Bolivia have been incorporated. These reclassifications affected Fee Income and Net
Gain on Derivatives Held for Trading, which are now consolidated into Net Gain on Foreign Exchange Transactions. Figures for prior periods have been restated for comparability and may differ from those previously
reported.
|
|
Other Non-Core Income
QoQ evolution
(millions of soles)
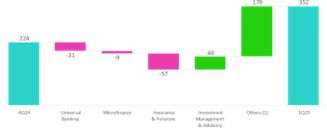
|
|
Other Non-Core Income
YoY evolution
(millions of soles)
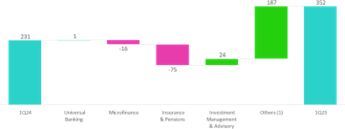 |
|
(1)
|
Others: include Grupo Credito, Credicorp Stand-alone, eliminations and others.
|
|
•
|
Other Non-Operative Income: at BCP Stand-alone due to a base effect from the sale of real estate.
|
|
•
|
Net Gain on Derivatives Held for Trading: at ASB, due to local currency exposures.
|
|
|
|||
|
| |
Earnings Release 1Q / 2025
|
Analysis of 1Q25 Consolidated Results
|
|
06. Other Income
|
|
•
|
Net Gain (Loss) on securities: through (i) Pacifico, attributable to the
deterioration of an investment, and (ii) Others, due to the same factors in play QoQ. These results were partially attenuated by BCP Stand-alone, which registered a base
effect given that in 1Q24, the bank reported devaluation in its trading portfolio.
|
|
•
|
Net Gain (Loss) on Derivatives Held for Trading: at ASB, driven by the same factors seen QoQ.
|
|
|
|||
|
| |
Earnings Release 1Q / 2025
|
Analysis of 1Q25 Consolidated Results
|
| 07 |
Insurance Underwriting Result and the Medical Services
|
|
|
QoQ, the Underwriting Result for Insurance rose 5.3%, due primarily to (i) a drop in
Insurance Service Expenses in Life and P & C businesses, which was driven by D & S and Personal lines via a reduction in claims, and (ii) an improvement in the Reinsurance Result in P &C. This
was partially attenuated by a reduction in Insurance Service Income, primarily through Life and led by AFP. YoY, the Insurance Underwriting Result increased 17.9%, due to (i) an improvement in the
Reinsurance Result, primarily in P & C, and (ii) growth in Insurance Service Income, mainly through EPS and P & C. This was partially attenuated by an increase in Insurance Service Expenses in EPS
and P & C.
|
|
Insurance Underwriting Results
|
|
Quarter
|
% change
|
|||
|
S/millions
|
1Q24
|
4Q24
|
1Q25
|
QoQ
|
YoY
|
|
|
|
Insurance Service Income
|
937.9
|
982.5
|
978.0
|
-0.5%
|
4.3%
|
| Total |
Insurance Service Expenses
|
(476.2)
|
(570.0)
|
(557.9)
|
-2.1%
|
17.2%
|
|
Reinsurance Results
|
(182.6)
|
(99.9)
|
(90.9)
|
-9.0%
|
-50.2%
|
|
|
Insurance Undewrwriting Result
|
279.1
|
312.7
|
329.1
|
5.3%
|
17.9%
|
|
|
|
Insurance Service Income
|
468.4
|
492.0
|
490.0
|
-0.4%
|
4.6%
|
|
P&C
|
Insurance Service Expenses
|
(237.9)
|
(331.5)
|
(325.3)
|
-1.9%
|
36.7%
|
|
Reinsurance Results
|
(150.0)
|
(78.4)
|
(72.4)
|
-7.6%
|
-51.7%
|
|
|
Insurance Undewrwriting Result
|
80.5
|
82.1
|
92.3
|
12.5%
|
14.8%
|
|
|
|
Insurance Service Income
|
438.1
|
471.5
|
332.9
|
-29.4%
|
-24.0%
|
|
Life
|
Insurance Service Expenses
|
(232.0)
|
(238.1)
|
(112.3)
|
-52.8%
|
-51.6%
|
|
Reinsurance Results
|
(27.0)
|
(15.6)
|
(13.3)
|
-14.6%
|
-50.7%
|
|
|
Insurance Undewrwriting Result
|
179.2
|
217.7
|
207.2
|
-4.8%
|
15.7%
|
|
|
|
Insurance Service Income
|
31.7
|
25.3
|
22.9
|
-9.6%
|
-27.9%
|
|
Crediseguros
|
Insurance Service Expenses
|
(11.5)
|
(5.6)
|
(5.8)
|
3.8%
|
-49.5%
|
|
Reinsurance Results
|
(5.8)
|
(12.3)
|
(8.3)
|
-32.5%
|
44.0%
|
|
|
Insurance Undewrwriting Result
|
14.4
|
7.3
|
8.7
|
18.4%
|
-39.4%
|
|
|
|
Insurance Service Income
|
0.0
|
0.0
|
137.0
|
n.a
|
n.a
|
|
EPS
|
Insurance Service Expenses
|
0.0
|
0.0
|
(122.9)
|
n.a
|
n.a
|
|
Reinsurance Results
|
0.0
|
0.0
|
(0.4)
|
n.a
|
n.a
|
|
|
Insurance Undewrwriting Result
|
0.0
|
0.0
|
13.7
|
n.a
|
n.a
|
|
|
|
|||
|
| |
Earnings Release 1Q / 2025
|
Analysis of 1Q25 Consolidated Results
|
|
07. Insurance Underwriting Results and the Medical Services
|
| Insurance Service Income |
|
Insurance Service Expense |
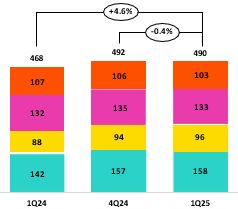 |
 |
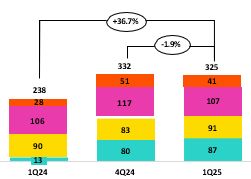 |
|
(1)
|
As of 1Q25, the business previously known as “P & C” has been reclassified into two separate categories: Personal Lines and Commercial Lines to better
reflect the nature of insured risks. Historical figures have been adjusted for comparability purposes.
|
|
•
|
Insurance Service Income dropped slightly by 0.4%, driven by the evolution of Personal Lines and Medical Assistance, both of which were impacted by an increase
in Reserves for Current Risks due to an uptick in premium turnover.
|
|
•
|
Insurance Service Expenses dropped 1.9%, due to Personal Lines and Medical Assistance, which registered a drop in claims. The aforementioned was partially
attenuated by (i) Cars, due to an increase in onerous contracts and (ii) Commercial Trees, which reported an uptick in claims for its Fire and Third-Party Liability products.
|
|
•
|
The Reinsurance Result improved, mainly due to a drop in ceded claims in the Personal Lines and Medical Assistance.
|
|
•
|
Insurance Service Income increased 4.6%, fueled mainly by (i) Commercial Lines, which reported growth in allotted premiums for new sales and growth in renewals
and (ii) Cars, which reflected growth in sales through Yape.
|
|
•
|
Insurance Service Income rose 36.7% due primarily to Commercial and Service Lines, which reported an uptick in claims through its Fire, Third-Party Liability and
Technical Lines.
|
|
•
|
The Reinsurance Result improved, primarily through (i) Commercial Lines, which reported an uptick in claims recovered from the reinsurer, in line with growth in
claims as described above, and (ii) Personal Line, which reflected a drop in ceded premiums.
|
| Insurance Service Income |
|
Insurance Service Expense |
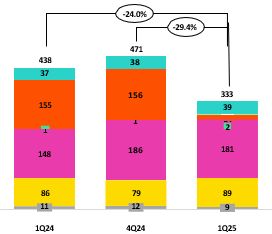 |
 |
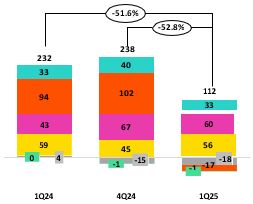 |
|
|
|||
|
| |
Earnings Release 1Q / 2025
|
Analysis of 1Q25 Consolidated Results
|
|
07. Insurance Underwriting Results and the Medical Services
|
|
•
|
Insurance Service Income dropped 29.4%, driven primarily by (i) D & S, given that Pacifico was not awarded a tranche of SISCO VIII for 2025 (having won a tranche
under SISCO VII last year), and (ii) Credit Life, due to a decrease in premium turnover in the Bancassurance channel.
|
|
•
|
Insurance Service Expenses fell 52.8%, fueled mainly by (i) D & S, which reported a drop in expenses for claims, which reflects the fact that Pacifico was not
awarded a tranche of the SISCO VIII contract (having won a tranche under SISCO VII last year), and (ii) Credit Life, which reported a decrease in attributable expenses.
|
|
•
|
The Reinsurance Result improved, mainly via Individual Life, which reported growth in claims recovered from reinsurers.
|
|
•
|
Insurance Service Income dropped 24.0%, primarily driven by D & S given that Pacifico was not awarded a tranche of SISCO VIII for 2025 (having won a tranche
under SISCO VII last year); this dynamic was attenuated by Credit Life, which reported an uptick in premiums allotted to the period, distributed through Bancassurance and Alliances.
|
|
•
|
Insurance Service Expenses dropped 51.6%, mainly fueled by (i) D & S, which reflects the impact of having received no tranche award under SISCO VIII, and (ii)
Individual Life, which reported a drop in expenses for claims. The aforementioned dynamics were partially offset by Credit Life, which reported growth in underwriting expenses in Alliances and an uptick in claims.
|
|
•
|
The Reinsurance Result improved, primarily via D & S, which registered a decrease in ceded premiums.
|
|
|
|||
|
| |
Earnings Release 1Q / 2025
|
Analysis of 1Q25 Consolidated Results
|
| 08 | Operating Expenses |
|
Operating expenses rose 15.6% YoY, driven mainly by core businesses at BCP Stand-alone and innovation portfolio initiatives at
the Credicorp level. Core business expenses at BCP Stand-alone rose due to: (i) higher expenses for employee salaries and benefits, which rose on the back of higher
provisions for variable compensation and an uptick in headcount; and (ii) an increase in administrative expenses, which rose primarily due to an uptick in spending
for Advertising and secondarily due to an increase in cloud use, which reflects growth in transactions among an increasingly digital client base. Expenses for
innovation portfolio initiatives at Credicorp rose 17.5%.
|
| Operating expenses | Quarter | % change | |||
| S/ 000 | 1Q24 | 4Q24 | 1Q25 | QoQ |
YoY
|
|
Salaries and employees benefits
|
1,107,069
|
1,271,578
|
1,361,690
|
7.1%
|
23.0%
|
|
Administrative and general expenses
|
821,748
|
1,150,867
|
869,834
|
-24.4%
|
5.9%
|
|
Depreciation and amortization
|
175,146
|
186,625
|
203,766
|
9.2%
|
16.3%
|
|
Association in participation
|
8,847
|
3,808
|
6,799
|
78.5%
|
-23.1%
|
|
Operating expenses
|
2,112,810
|
2,612,878
|
2,442,089
|
-6.5%
|
15.6%
|
|
•
|
An increase in Employee Salaries and Benefits, which was driven primarily by (i) BCP Stand-alone, which reported
an uptick in provisions for variable compensation, followed by growth in the headcount for new projects, and (ii) Mibanco y Pacifico, due to growth in salaries.
|
|
•
|
The increase reported in Administrative Expenses was attributable to BCP Stand-alone, which registered (i) higher
expenses for Advertising, and (ii) growth in transactions through digital channels, which led expenses for cloud use and other IT-related activities to rise.
|
|
Administrative and General Expenses
|
Quarter |
% change
|
|||
|
S/ 000
|
1Q24
|
4Q24
|
1Q25
|
QoQ
|
YoY |
|
IT expenses and IT third-party services
|
282,905
|
386,150
|
302,029
|
-21.8%
|
6.8%
|
|
Advertising
|
57,734
|
163,897
|
85,390
|
-47.9%
|
47.9%
|
|
Taxes and contributions
|
92,887
|
105,296
|
83,347
|
-20.8%
|
-10.3%
|
|
Audit Services, Consulting and professional fees
|
58,992
|
171,101
|
71,072
|
-58.5%
|
20.5%
|
|
Transport and communications
|
54,064
|
67,398
|
52,810
|
-21.6%
|
-2.3%
|
|
Repair and maintenance
|
32,638
|
50,981
|
31,635
|
-37.9%
|
-3.1%
|
|
Agents’ Fees
|
27,388
|
31,436
|
26,102
|
-17.0%
|
-4.7%
|
|
Services by third-party
|
28,415
|
6,220
|
21,436
|
244.6%
|
-24.6%
|
|
Leases of low value and short-term
|
30,465
|
36,936
|
33,177
|
-10.2%
|
8.9%
|
|
Miscellaneous supplies
|
18,653
|
24,864
|
19,383
|
-22.0%
|
3.9%
|
|
Security and protection
|
15,903
|
16,614
|
16,946
|
2.0%
|
6.6%
|
|
Subscriptions and quotes
|
17,172
|
14,261
|
18,330
|
28.5%
|
6.7%
|
|
Electricity and water
|
11,736
|
15,053
|
10,275
|
-31.7%
|
-12.4%
|
|
Electronic processing
|
7,748
|
8,124
|
7,635
|
-6.0%
|
-1.5%
|
|
Insurance
|
5,172
|
14,312
|
11,719
|
-18.1%
|
126.6%
|
|
Cleaning
|
5,744
|
8,415
|
6,558
|
-22.1%
|
14.2%
|
|
Others
|
74,132
|
29,809
|
71,990
|
141.5%
|
-2.9%
|
|
Total
|
821,748
|
1,150,867
|
869,834
|
-24.4%
|
5.9%
|
|
| |
Earnings Release 1Q / 2025
|
Analysis of 1Q25 Consolidated Results
|
|
08. Operating Expenses
|
|
Operating Expenses (1)
|
Quarter
|
% change
|
|||
|
S/ 000
|
1Q24
|
4Q24
|
1Q25
|
QoQ
|
YoY |
|
Operating Expenses Ex Innovation
|
1,856,886
|
2,257,102
|
2,141,262
|
-5.1%
|
15.3%
|
|
Innovation Portfolio (2)
|
255,924
|
355,776
|
300,827
|
-15.4%
|
17.5%
|
|
Total Operating Expenses
|
2,112,810
|
2,612,878
|
2,442,089
|
-6.5%
|
15.6%
|
|
(1)
|
Management figures.
|
|
(2)
|
Includes innovation portfolio initiatives in subsidiaries and Krealo.
|
|
•
|
Expenses for core businesses excluding IT
|
|
•
|
Growth in expenses for Employee Salaries and Benefits due to (i) provisions for variable compensation, which
rose alongside an improvement in results, and (ii) an increase in headcount.
|
|
•
|
Expenses for marketing and advertising rose to capture deposits and drive sales of digital products.
|
|
•
|
Technology Expenses (IT)
|
|
•
|
More specialized personnel with digital capacities and higher average salaries were hired to execute
strategic projects.
|
|
•
|
Higher expenses for the use of services to process data, in line with growth in the transaction volume via
digital channels as our client base becomes more digitalized. Total monetary transactions and transactions through digital channels rose 64.8% and 77.2%,
respectively.
|
|
|
|||
|
| |
Earnings Release 1Q / 2025
|
Analysis of 1Q25 Consolidated Results
|
| 09 |
Operating Efficiency
|
|
YoY, the efficiency ratio deteriorated 291 bps given that expansion in operating expenses outstripped growth in operating
income. This evolution reflects growth in expenses for disruptive initiatives at the Credicorp level and for core businesses at BCP Stand-alone.
|
|
Subsidiary
|
Quarter
|
% change
|
|||
|
|
1Q24
|
4Q24
|
1Q25
|
QoQ
|
YoY
|
|
BCP Stand-alone
|
35.1%
|
43.7%
|
37.7%
|
-600 bps
|
260 bps
|
|
BCP Bolivia
|
58.1%
|
63.0%
|
69.6%
|
670 bps
|
1160 bps
|
|
Mibanco Peru
|
53.3%
|
52.2%
|
52.9%
|
60 bps
|
-40 bps
|
|
Mibanco Colombia
|
85.5%
|
69.5%
|
70.6%
|
120 bps
|
-1490 bps
|
|
Pacifico
|
27.7%
|
29.6%
|
31.5%
|
190 bps
|
380 bps
|
|
Prima AFP
|
50.4%
|
64.2%
|
54.4%
|
-980 bps
|
400 bps
|
|
Credicorp
|
42.8%
|
48.4%
|
45.7%
|
-270 bps
|
291 bps
|
|
(1)
|
Operating expenses / Operating income (under IFRS 1). Operating expenses = Salaries and employee benefits + Administrative expenses + Depreciation and
amortization + Association in participation + Acquisition cost. Operating income = Net interest, similar income, and expenses + Fee income + Net gain on foreign exchange transactions +
Net gain from associates +Net gain on derivatives held for trading + Net gain from exchange differences + Insurance Underwriting Results + Results for Medical Services
|
|
|
|||
|
| |
Earnings Release 1Q / 2025
|
Analysis of 1Q25 Consolidated Results
|
| 10 |
Regulatory Capital
|
|
|
The Regulatory Capital Ratio at Credicorp was 138% higher than the regulatory minimum.
BCP Stand-alone’s IFRS CET1 Ratio slightly declined 24 bps YoY, stand at 11.62%, aligned with our
internal appetite of 11%. This evolution was fueled by higher RWAs levels driven by loan growth, which was partially offset by a growth in Retained Earnings, which was offset
by the declaration of dividends.
Mibanco’s IFRS CET1 Ratio slightly declined 18 bps YoY, stand at 15.89%, aligned with our internal appetite of 15%.
This result was fueled primarily by a decrease in Retained Earnings, which was primarily associated with dividends declared, and partially offset by a drop in RWA levels, which
fell due to loan contraction.
|
|
10.1
|
Regulatory Capital at Credicorp
|
|
At the end of 1Q25, Credicorp’s Regulatory Capital Ratio stood 138% above the regulatory
minimum. This attests to the Group’s financial solidity and stability. The ratio rose 78 bps QoQ, fueled primarily by an increase in
discretionary reserves in response to dividends declare for 2024. Growth was partially offset by a drop in Retained Earnings, which reflected declarations of dividend payments at BCP Stand-alone and an increase in the balance of Goodwill associated with the acquisition of the remaining 50% stake in the joint venture with
Empresas Banmedica. YoY, the ratio rose 1065 bps driven by the same dynamics seen QoQ and a higher balance of Subordinated Debt associated
with the issuance of subsidiaries.
|
|
Capital Coverage Ratios
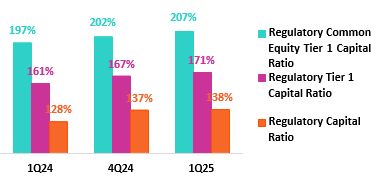
|
|
10.2
|
Analysis of Capital at BCP Stand-alone
|
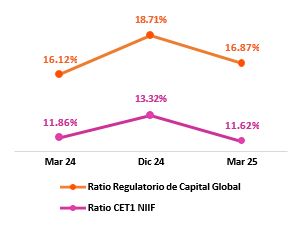 |
|
BCP Stand-alone’s IFRS CET1 Ratio dropped 170 bps QoQ to close 1Q25 at 11.62%, which is above our internal appetite of 11.%. This decline was associated with a drop in the balance for Retained
Earnings, which fell on the back of dividend payments. The drop in RWAs, which was driven by a contraction in Wholesale Loans, partially offset the decline in the aforementioned
balance. YoY, The IFRS CET 1 ratio decreased 24 bps, due primarily to an increase in credit RWAs, which as associated with loan growth, and
in operating RWAs, which accompanied growth in the Bank’s margin. The ratio fell in year-over-year was a partially offset by an increase in Retained Earnings, which rose on the back
of business growth.
Finally, under the parameters of current regulation, the local CET1 Ratio stood at 11.34%, which compares favorably with the minimum requirement of
7.53% at the end of March 2025, and its variations were driven by the same dynamics that drove the evolution of IFRS CET 1. The Regulatory Global Capital Ratio stood at 16.87%
(-184 bps QoQ). This ratio is above the regulatory minimum of 13.89% at the end of March 2025. QoQ,
the decline was fueled by the same dynamics as those seen for IFRS CET1; and YoY, the rise of 74 bps was attributable to an increase in the
balance for Subordinated Debt, which was driven by an issuance in September, and to growth in Retained Earnings, which was offset by an increase in RWAs.
|
|
|
|
|
|||
|
| |
Earnings Release 1Q / 2025
|
Analysis of 1Q25 Consolidated Results
|
|
10. Capital Regulatorio
|
|
10.3
|
Capital Analysis at Mibanco
|
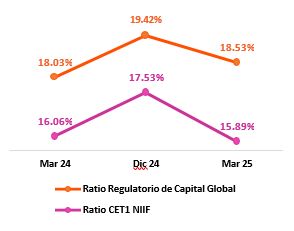 |
|
At the end of 1Q25, Mibanco’s IFRS CET1 Ratio stood at 15.89% (-164 bps QoQ), which
exceeded our internal appetite of 15%. QoQ, this decline was driven by growth in RWAS, which rose alongside loan growth. A drop in Retained
Earnings, which fell due to dividend declarations also impacted the IFRS CET1 result. YoY, this ratio dropped 18 bps due to a reduction in
Retained Earnings, which was fueled by the same dynamics as those seen QoQ. The decrease in the IFRS CET1 Ratio was partially offset by a
reduction in RWA levels due to loan contraction, which reflected the implementation of stricter lending guidelines over the year.
Under the parameters of current regulation, local CET1 stood at 15.48%, which compares favorably with the minimum requirement of
7.75% at the end of March 2025. The variations in this result were driven by the same dynamics as those observed for IFRS CET1. The Regulatory Global Capital Ratio stood at 18.53%
(-89 bps QoQ), which is significantly above the regulatory minimum of 14.55% This variation was fueled by the same dynamics that drove the
evolution of IFRS CET1. YoY, the ratio rose 50 bps, fueled mainly by a decrease in the RWA balance, which was driven primarily by loan
contraction and secondarily by a Subordinated Debt Issuance and growth in the Reserves balance. The aforementioned rise in the IFRS in year-over-year terms was offset by a drop in
Retained Earnings due to dividend declaration.
|
|
|
|
|
|||
|
| |
Earnings Release 1Q / 2025
|
Analysis of 1Q25 Consolidated Results
|
|
|
| 11 |
Economic Outlook
|
|
|
In 1Q25, the Peruvian economy grew 3.9% YoY, the third consecutive quarter at a pace around 4%, favored by
non-primary sectors, whose growth was driven by the recovery of formal employment and real wages.
The annual inflation rate slowed marginally and closed the quarter at 1.3% YoY (2.0% YoY in the fourth quarter
of 2024), approaching the lower limit of the target range of 1-3%. In its May 2025 monetary policy meeting, the BCRP lowered its policy rate 25 basis points to 4.50%,
marking its second rate cut of the year after the first rate cut in January 2025.
According to the BCRP, the exchange rate closed at USDPEN 3.67 in the first quarter of 2025, an appreciation of
2.6% compared to the close of the fourth quarter of 2024, making it one of the best-performing currencies among emerging countries.
|
|
Peru
|
2019
|
2020
|
2021
|
2022
|
2023
|
2024
|
2025 (4)
|
|
GDP (US$ Millions)
|
236,517
|
209,723
|
229,791
|
248,403
|
272,221
|
295,160
|
306,026
|
|
Real GDP (% change)
|
2.2
|
-10.9
|
13.4
|
2.8
|
-0.4
|
3.3
|
3.2
|
|
GDP per capita (US$)
|
7,361
|
6,428
|
6,956
|
7,438
|
8,072
|
8,671
|
8,893
|
|
Domestic demand (% change)
|
2.9
|
-9.3
|
13.9
|
2.4
|
-1.1
|
4.0
|
3.7
|
|
Gross fixed investment (as % GDP)
|
22
|
21
|
25
|
25
|
23
|
23
|
23
|
|
Financial system loan without Reactiva (% change) (1)
|
6.4
|
-4.3
|
12.6
|
9.7
|
2.8
|
1.3
|
6.0
|
|
Inflation, end of period(2)
|
1.9
|
2.0
|
6.4
|
8.5
|
3.2
|
2.0
|
2.3
|
|
Reference Rate, end of period
|
2.25
|
0.25
|
2.50
|
7.50
|
6.75
|
5.00
|
4.25
|
|
Exchange rate, end of period
|
3.31
|
3.62
|
3.99
|
3.81
|
3.71
|
3.76
|
3.75
|
|
Exchange rate, (% change) (3)
|
1.8%
|
-9.3%
|
-10.3%
|
4.5%
|
2.7%
|
-1.3%
|
0.2%
|
|
Fiscal balance (% GDP)
|
-1.6
|
-8.7
|
-2.5
|
-1.7
|
-2.7
|
-3.5
|
-2.7
|
|
Public Debt (as % GDP)
|
26
|
34
|
35
|
33
|
32
|
32
|
34
|
|
Trade balance (US$ Millions)
|
6,893
|
8,098
|
15,115
|
10,331
|
17,150
|
24,081
|
27,000
|
|
(As % GDP)
|
2.9%
|
3.9%
|
6.6%
|
4.2%
|
6.3%
|
8.2%
|
8.8%
|
|
Exports
|
47,995
|
42,822
|
63,114
|
66,339
|
67,108
|
76,172
|
81,500
|
|
Imports
|
41,102
|
34,724
|
47,999
|
56,009
|
49,958
|
52,091
|
54,500
|
|
Current account balance (As % GDP)
|
-0.7%
|
0.8%
|
-2.2%
|
-4.0%
|
0.3%
|
2.2%
|
1.5%
|
|
Net international reserves (US$ Millions)
|
68,316
|
74,707
|
78,495
|
71,883
|
71,033
|
78,987
|
83,000
|
|
(As % GDP)
|
28.9%
|
35.6%
|
34.2%
|
28.9%
|
26.1%
|
26.8%
|
27.1%
|
|
(As months of imports)
|
20
|
26
|
20
|
15
|
17
|
18
|
18
|
|
(1)
|
Financial System, Current Exchange Rate
|
|
(2)
|
Inflation Target: 1%-3%
|
|
(3)
|
Negative % change indicates depreciation.
|
|
(4)
|
Grey area indicates estimates by BCP – Economic Research as of January 2025.
|
|
|
|||
|
| |
Earnings Release 1Q / 2025
|
Analysis of 1Q25 Consolidated Results
|
|
11. Economic Outlook
|
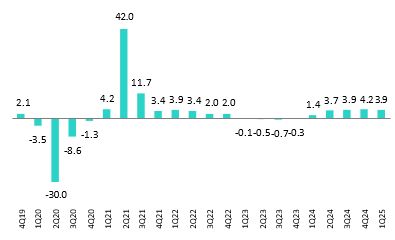
|
|
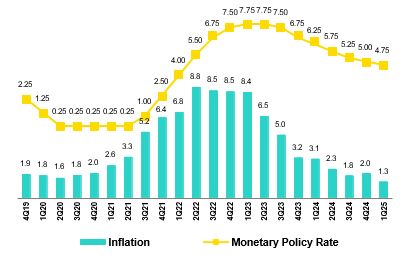
|
|
|
|
|||
|
| |
Earnings Release 1Q / 2025
|
Analysis of 1Q25 Consolidated Results
|
|
11. Economic Outlook
|
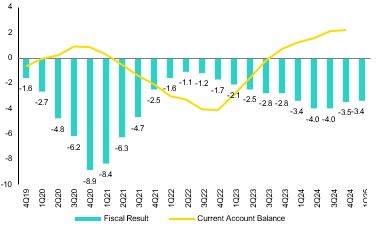
|
|
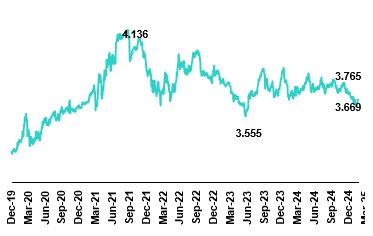
|
|
|
|
|||
|
| |
Earnings Release 1Q / 2025
|
Analysis of 1Q25 Consolidated Results
|
|
11. Economic Outlook
|
|
|
|||
|
| |
Earnings Release 1Q / 2025
|
Analysis of 1Q25 Consolidated Results
|
|
Safe Harbor for Forward-Looking Statements
|
|
•
|
The occurrence of natural disasters or political or social instability in Peru;
|
|
•
|
The adequacy of the dividends that our subsidiaries are able to pay to us, which may affect our ability to pay dividends to
shareholders and corporate expenses;
|
|
•
|
Performance of, and volatility in, financial markets, including Latin-American and other markets;
|
|
•
|
The frequency, severity and types of insured loss events;
|
|
•
|
Fluctuations in interest rate levels;
|
|
•
|
Foreign currency exchange rates, including the Sol/US Dollar exchange rate;
|
|
•
|
Deterioration in the quality of our loan portfolio;
|
|
•
|
Increasing levels of competition in Peru and other markets in which we operate;
|
|
•
|
Developments and changes in laws and regulations affecting the financial sector and adoption of new international guidelines;
|
|
•
|
Changes in the policies of central banks and/or foreign governments;
|
|
•
|
Effectiveness of our risk management policies and of our operational and security systems;
|
|
•
|
Losses associated with counterparty exposures;
|
|
•
|
The scope of the coronavirus (“COVID-19”) outbreak, actions taken to contain the COVID-19 and related economic effects from such
actions and our ability to maintain adequate staffing; and
|
|
•
|
Changes in Bermuda laws and regulations applicable to so-called non-resident entities.
|
|
|
|||
|
| |
Earnings Release 1Q / 2025
|
Analysis of 1Q25 Consolidated Results
|
| 12 |
Appendix
|
|
12.1. Physical Point of Contact
|
50
|
|
|
12.2. Loan Portfolio Quality
|
50
|
|
|
|
|
|
|
12.3. Net Interest Income (NII)
|
54
|
|
|
|
|
|
|
12.4. Net Interest Margin (NIM) and Risk Adjusted NIM
|
54
|
|
|
|
|
|
|
12.5. Regulatory Capital
|
55
|
|
|
|
|
|
|
12.6. Financial Statements and Ratios by Business
|
59
|
|
|
|
|
|
|
12.6.1. Credicorp Consolidated
|
59
|
|
|
|
|
|
|
12.6.2. Credicorp Stand-alone
|
61
|
|
|
|
|
|
|
12.6.3. BCP Consolidated
|
62
|
|
|
|
|
|
|
12.6.4. BCP Stand-alone
|
64
|
|
|
|
|
|
|
12.6.5. BCP Bolivia
|
66
|
|
|
|
|
|
|
12.6.6. Mibanco
|
67
|
|
|
|
|
|
|
12.6.7. Prima AFP
|
68
|
|
|
|
|
|
|
12.6.8. Grupo Pacifico
|
69
|
|
|
|
|
|
|
12.6.9. Investment Management and Advisory
|
70
|
|
|
|
|
|
|
12.7. Table of Calculations
|
71
|
|
|
|
|
|
|
12.8. Glossary of terms
|
72
|
|
|
|||
|
| |
Earnings Release 1Q / 2025
|
Analysis of 1Q25 Consolidated Results
|
|
12. Appendix
|
|
12.1.
|
Physical Point of contact
|
|
Physical Point of Contact (1)
|
|
As of
|
|
change (units)
|
|
|
(Units)
|
Mar 24 | Dec 24 | Mar 25 | QoQ | YoY |
|
Branches (2)
|
655
|
648
|
648
|
-
|
-7 |
|
ATMs
|
2,737
|
2,787
|
2,768
|
(19)
|
31 |
|
Agents
|
11,328
|
12,434
|
11,683
|
(751)
|
355 |
|
Total
|
14,720
|
15,869
|
15,099
|
(770)
|
379 |
|
(1)
|
Includes Physical Point of Contact of BCP Stand-Alone, Mibanco and BCP Bolivia
|
|
(2)
|
Includes Banco de la Nacion branches, which in March 24 were 36, in December 24 were 36 and in March 25 were 36
|
|
12.2.
|
Loan Portfolio Quality
|
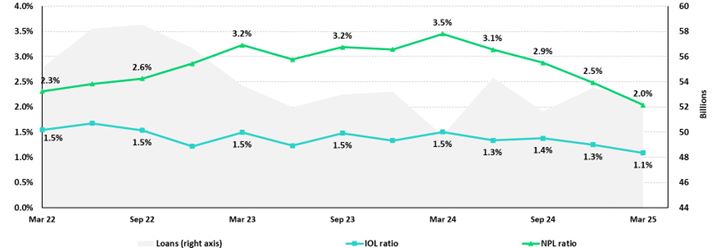
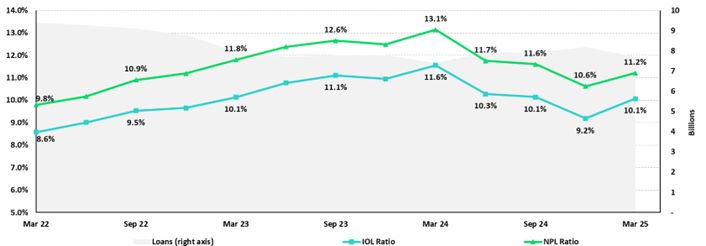
|
|
|||
|
| |
Earnings Release 1Q / 2025
|
Analysis of 1Q25 Consolidated Results
|
|
12. Appendix
|

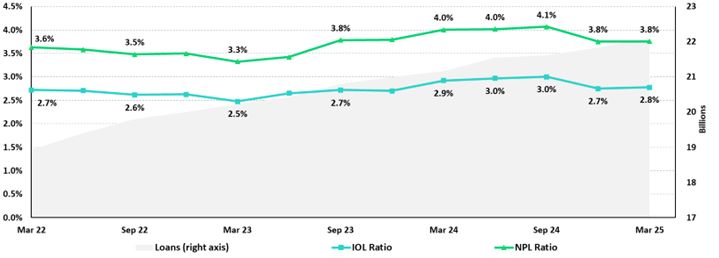
|
|
|||
|
| |
Earnings Release 1Q / 2025
|
Analysis of 1Q25 Consolidated Results
|
|
12. Appendix
|
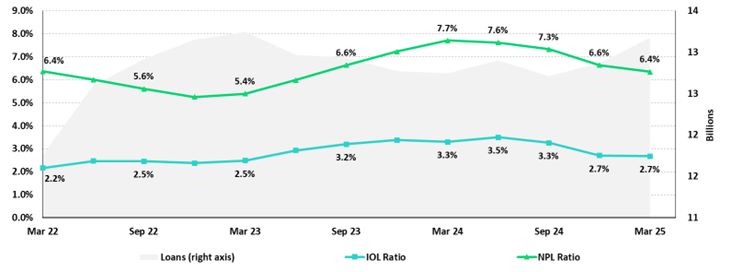

|
|
|||
|
| |
Earnings Release 1Q / 2025
|
Analysis of 1Q25 Consolidated Results
|
|
12.
Appendix
|
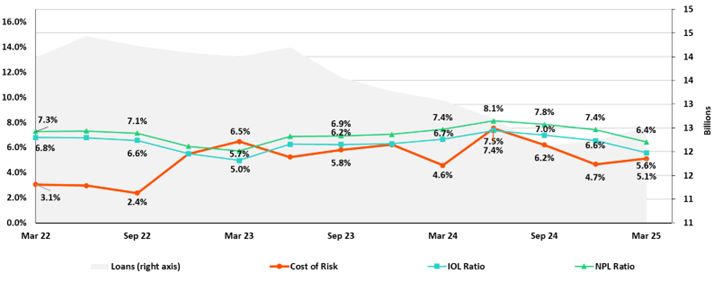
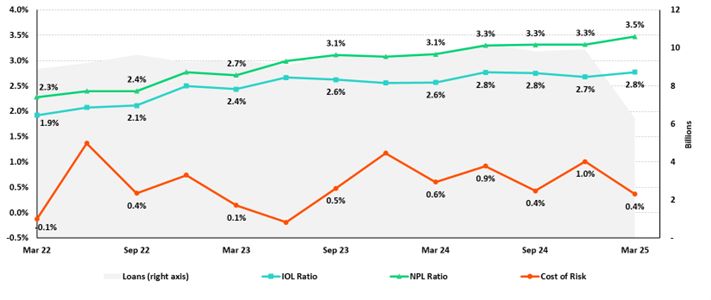
|
|
|||
|
| |
Earnings Release 1Q / 2025
|
Analysis of 1Q25 Consolidated Results
|
|
12.
Appendix
|
|
12.3.
|
Net Interest Income (NII)
|
|
Net interest income
|
|
Quarter |
|
% change
|
|
|
S/000
|
1Q24
|
4Q24
|
1Q25
|
QoQ
|
YoY
|
|
Interest income
|
4,925,926
|
5,012,121
|
4,894,790
|
-2.3%
|
-0.6%
|
|
Interest on loans
|
3,868,792
|
3,940,002
|
3,847,640
|
-2.3%
|
-0.5%
|
|
Dividends on investments
|
10,861
|
15,285
|
25,109
|
64.3%
|
131.2%
|
|
Interest on deposits with banks
|
334,459
|
386,205
|
344,622
|
-10.8%
|
3.0%
|
|
Interest on securities
|
683,075
|
652,155
|
657,872
|
0.9%
|
-3.7%
|
|
Other interest income
|
28,739
|
18,474
|
19,547
|
5.8%
|
-32.0%
|
|
Interest expense
|
1,499,803
|
1,382,327
|
1,322,778
|
-4.3%
|
-11.8%
|
|
Interest expense (excluding Net Insurance Financial Expenses)
|
1,377,799
|
1,250,239
|
1,187,156
|
-5.0%
|
-13.8%
|
|
Interest on deposits
|
779,526
|
655,429
|
619,613
|
-5.5%
|
-20.5%
|
|
Interest on borrowed funds
|
264,884
|
286,638
|
266,202
|
-7.1%
|
0.5%
|
|
Interest on bonds and subordinated notes
|
196,630
|
201,053
|
168,024
|
-16.4%
|
-14.5%
|
|
Other interest expense
|
136,759
|
107,119
|
133,317
|
24.5%
|
-2.5%
|
|
Net Insurance Financial Expenses
|
122,004
|
132,088
|
135,622
|
2.7%
|
11.2%
|
|
Net interest, similar income and expenses
|
3,426,123
|
3,629,794
|
3,572,012
|
-1.6%
|
4.3%
|
|
Provision for credit losses on loan portfolio, net of recoveries
|
814,699
|
743,296
|
581,893
|
0.0%
|
0.0%
|
|
Net interest, similar income and expenses, after provision for
credit losses on loan portfolio
|
2,611,424
|
2,886,498
|
2,990,119
|
3.6%
|
14.5%
|
|
Average interest earning assets
|
225,297,538
|
237,518,087
|
238,435,117
|
0.4%
|
5.8%
|
|
Net interest margin (1)
|
6.30%
|
6.34%
|
6.22%
|
-12 bps
|
-8 bps
|
|
Risk-adjusted Net interest margin (1)
|
4.85%
|
5.08%
|
5.24%
|
16 bps
|
39 bps
|
|
Net provisions for loan losses / Net interest income (1)
|
23.78%
|
20.48%
|
16.29%
|
-419 bps
|
-749 bps
|
|
(1)
|
Annualized. For further detail on the NIM calculation due to IFRS17, please refer to Annex 12.7.
|
|
12.4.
|
Net Interest Margin (NIM) and Risk-Adjusted NIM by Subsidiary
|
|
NIM Breakdown
|
BCP Stand-alone
|
Mibanco
|
BCP Bolivia
|
Credicorp
|
|
1Q24
|
6.03%
|
13.42%
|
2.96%
|
6.30%
|
|
4Q24
|
6.01%
|
14.16%
|
2.96%
|
6.34%
|
|
1Q25
|
5.80%
|
13.94%
|
2.85%
|
6.22%
|
|
Risk-Adjusted NIM
Breakdown
|
BCP
Stand-alone
|
Mibanco
|
BCP
Bolivia
|
Credicorp
|
|
1Q24
|
4.64%
|
9.71%
|
2.46%
|
4.85%
|
|
4Q24
|
4.85%
|
10.66%
|
2.12%
|
5.08%
|
|
1Q25
|
4.98%
|
10.14%
|
2.62%
|
5.24%
|
|
|
|||
|
| |
Earnings Release 1Q / 2025
|
Analysis of 1Q25 Consolidated Results
|
|
|
| 12.5. |
Regulatory Capital
|
|
Regulatory Capital and Capital Adequacy Ratios
|
|
As of |
Change %
|
||
|
S/000
|
Mar 24
|
Dec 24
|
Mar 25
|
QoQ
|
YoY
|
|
Capital Stock
|
1,318,993
|
1,318,993
|
1,318,993
|
-
|
0.0%
|
|
Treasury Stocks
|
(208,343)
|
(208,879)
|
(209,845)
|
0.5%
|
0.7%
|
|
Capital Surplus
|
201,965
|
176,307
|
124,148
|
-29.6%
|
-38.5%
|
|
Legal and Other Capital reserves
|
26,213,432
|
27,202,665
|
32,792,830
|
20.6%
|
25.1%
|
|
Minority interest
|
522,309
|
467,916
|
476,695
|
1.9%
|
-8.7%
|
|
Current and Accumulated Earnings (1)
|
2,639,191
|
6,592,462
|
3,410,505
|
-48.3%
|
29.2%
|
|
Unrealized Gains or Losses (2)
|
(991,283)
|
(504,016)
|
(462,800)
|
-8.2%
|
-53.3%
|
|
Goodwill
|
(768,869)
|
(722,361)
|
(1,698,492)
|
135.1%
|
120.9%
|
|
Intangible Assets (3)
|
(1,935,419)
|
(2,396,687)
|
(2,590,377)
|
8.1%
|
33.8%
|
|
Deductions in Common Equity Tier 1 instruments (4)
|
(699,843)
|
(673,952)
|
(38,573)
|
-94.3%
|
-94.5%
|
|
Subordinated Debt
|
5,733,691
|
8,047,314
|
7,892,454
|
-1.9%
|
37.7%
|
|
Loan loss reserves (5)
|
1,946,564
|
2,033,379
|
1,972,285
|
-3.0%
|
1.3%
|
|
Deductions in Tier 2 instruments (6)
|
(945,603)
|
(1,322,352)
|
(751,236)
|
-43.2%
|
-20.6%
|
|
Total Regulatory Capital (A)
|
33,026,785
|
40,010,790
|
42,236,587
|
5.6%
|
27.9%
|
|
Total Regulatory Common Equity Tier 1 Capital (B)
|
26,292,132
|
31,252,448
|
33,123,084
|
6.0%
|
26.0%
|
|
Total Regulatory Tier 1 Capital (C)
|
26,292,132
|
31,252,448
|
33,123,084
|
6.0%
|
26.0%
|
|
Total Regulatory Capital Requirement (D)
|
25,901,090
|
29,124,775
|
30,571,363
|
5.0%
|
18.0%
|
|
Total Regulatory Common Equity Tier 1 Capital Requirement (E)
|
13,351,145
|
15,445,079
|
15,997,614
|
3.6%
|
19.8%
|
|
Total Regulatory Tier 1 Capital Requirement (F)
|
16,336,793
|
18,681,850
|
19,424,645
|
4.0%
|
18.9%
|
|
Regulatory Capital Ratio (A) / (D)
|
128%
|
137%
|
138%
|
78 pp
|
1065 bps
|
|
Regulatory Common Equity Tier 1 Capital Ratio (B) / (E)
|
197%
|
202%
|
207%
|
470 pp
|
1012 bps
|
|
Regulatory Tier 1 Capital Ratio (C) / (F)
|
161%
|
167%
|
171%
|
323 pp
|
958 bps
|
| (1) |
Earnings include Banco de Crédito del Perú and Mibanco Perú. Losses include all subsidiaries.
|
|
|
(2) |
Gains include Investment Grade Government Bonds and Peruvian Central Bank Certificates of
Deposits. Losses include all bonds.
|
|
|
(3) |
Different to Goodwill. Includes Diferred Tax Assets.
|
|
|
(4) |
Investments in Equity.
|
|
|
(5) |
Up to 1.25% of total risk-weighted assets of Banco de Crédito del Perú, Solución Empresa
Administradora Hipotecaria, Mibanco and Atlantic Security Bank.
|
|
(6)
|
Investments in Tier 2 Subordinated Debt.
|
|
|
|||
|
| |
Earnings Release 1Q / 2025
|
Analysis of 1Q25 Consolidated Results
|
|
|
|
Regulatory Capital
|
|
As of |
Change %
|
||
|
(S/ thousand)
|
Mar 24
|
Dec 24
|
Mar 25
|
QoQ
|
YoY
|
|
Capital Stock
|
12,973,175
|
12,973,175
|
12,973,175
|
0.0%
|
0.0%
|
|
Reserves
|
6,590,921
|
6,124,302
|
6,124,302
|
0.0%
|
-7.1%
|
|
Accumulated earnings
|
2,644,894
|
6,589,252
|
3,418,149
|
-48.1%
|
29.2%
|
|
Loan loss reserves (1)
|
1,662,636
|
1,757,256
|
1,740,158
|
-1.0%
|
4.7%
|
|
Subordinated Debt
|
5,019,300
|
7,339,800
|
7,152,600
|
-2.6%
|
42.5%
|
|
Unrealized Profit or Losses
|
(691,921)
|
(413,658)
|
(341,947)
|
-17.3%
|
-50.6%
|
|
Investment in subsidiaries and others, net of unrealized profit
and net income in subsidiaries
|
(2,416,070)
|
(2,477,732)
|
(2,310,402)
|
-6.8%
|
-4.4%
|
|
Intangibles
|
(1,209,735)
|
(1,515,214)
|
(1,509,701)
|
-0.4%
|
24.8%
|
|
Goodwill
|
(122,083)
|
(122,083)
|
(122,083)
|
0.0%
|
0.0%
|
|
Total Regulatory Capital
|
24,451,116
|
30,255,097
|
27,124,251
|
-10.3%
|
10.9%
|
|
Tier 1 Common Equity (2)
|
17,769,180
|
21,158,042
|
18,231,493
|
-13.8%
|
2.6%
|
|
Regulatory Tier 1 Capital (3)
|
17,769,180
|
21,158,042
|
18,231,493
|
-13.8%
|
2.6%
|
|
Regulatory Tier 2 Capital (4)
|
6,681,936
|
9,097,056
|
8,892,758
|
-2.2%
|
33.1%
|
|
Total risk-weighted assets
|
|
As of |
Change %
|
||
|
(S/ thousand)
|
Mar 24
|
Dec 24
|
Mar 25
|
QoQ
|
YoY
|
|
Market risk-weighted assets
|
3,032,546
|
3,922,295
|
3,903,493
|
-0.5%
|
28.7%
|
|
Credit risk-weighted assets
|
131,793,619
|
139,402,972
|
138,028,766
|
-1.0%
|
4.7%
|
|
Operational risk-weighted assets
|
16,842,059
|
18,409,113
|
18,895,091
|
2.6%
|
12.2%
|
|
Total
|
151,668,224
|
161,734,381
|
160,827,350
|
-0.6%
|
6.0%
|
|
Capital requirement
|
|
As of |
Change %
|
||
|
(S/ thousand)
|
Mar 24
|
Dec 24
|
Mar 25
|
QoQ
|
YoY
|
|
Market risk capital requirement
|
303,255
|
392,230
|
390,349
|
-0.5%
|
28.7%
|
|
Credit risk capital requirement
|
11,861,426
|
13,243,282
|
13,802,877
|
4.2%
|
16.4%
|
|
Operational risk capital requirement
|
1,684,206
|
1,840,911
|
1,889,509
|
2.6%
|
12.2%
|
|
Additional capital requirements
|
5,418,896
|
6,882,642
|
7,057,150
|
2.5%
|
30.2%
|
|
Total
|
19,267,782
|
22,359,066
|
23,139,885
|
3.5%
|
20.1%
|
|
Capital ratios under Local Regulation
|
|
As of |
Change %
|
||
|
Mar 24
|
Dec 24
|
Mar 25
|
QoQ
|
YoY
|
|
|
Common Equity Tier 1 ratio
|
11.72%
|
13.08%
|
11.34%
|
-175 bps
|
-38 bps
|
|
Tier 1 Capital ratio
|
11.72%
|
13.08%
|
11.34%
|
-175 bps
|
-38 bps
|
|
Regulatory Global Capital ratio
|
16.12%
|
18.71%
|
16.87%
|
-184 bps
|
74 bps
|
|
|
[1] |
Up to 1.25% of total risk-weighted assets.
|
|
[2]
|
Common Equity Tier 1 = Capital Stock + Reserves + Accumulated
earnings – Unrealized profits or losses - 100% deductions (investment in subsidiaries, goodwill, intangible assets and
deferred tax assets based on future returns).
|
|
|
[3] |
Regulatory Tier 1 Capital = Common Equity Tier 1 + Tier 1 Subordinated Debt (Perpetual).
|
|
|
[4] |
Regulatory Tier 2 Capital = Subordinated Debt + Loan loss reserves.
|
|
|
|||
|
| |
Earnings Release 1Q / 2025
|
Analysis of 1Q25 Consolidated Results
|
|
|
|
Regulatory Capital
|
|
As of |
% Change
|
||
|
(S/ thousand)
|
Mar 24
|
Dec 24
|
Mar 25
|
QoQ
|
YoY
|
|
Capital Stock
|
1,840,606
|
1,840,606
|
1,840,606
|
0.0%
|
0.0%
|
|
Reserves
|
334,650
|
334,650
|
365,847
|
9.3%
|
9.3%
|
|
Accumulated earnings
|
310,119
|
369,573
|
168,090
|
-54.5%
|
-45.8%
|
|
Loan loss reserves (1)
|
154,452
|
144,751
|
149,412
|
3.2%
|
-3.3%
|
|
Perpetual subordinated debt
|
-
|
-
|
-
|
n.a
|
n.a.
|
|
Subordinated debt
|
173,000
|
167,000
|
267,000
|
59.9%
|
54.3%
|
|
Unrealidez Profit or Losses
|
(4,984)
|
(3,728)
|
(4,037)
|
8.3%
|
-19.0%
|
|
Investment in subsidiaries and others, net of unrealized
profit and net income in subsidiaries
|
(283)
|
(298)
|
(295)
|
-1.1%
|
4.1%
|
|
Intangibles
|
(150,274)
|
(136,691)
|
(119,759)
|
-12.4%
|
-20.3%
|
|
Goodwill
|
(139,180)
|
(139,180)
|
(139,180)
|
0.0%
|
0.0%
|
|
Total Regulatory Capital
|
2,518,105
|
2,576,683
|
2,527,685
|
-1.9%
|
0.4%
|
|
Tier Common Equity (2)
|
2,190,653
|
2,264,932
|
2,111,272
|
-6.8%
|
-3.6%
|
|
Regulatory Tier 1 Capital (3)
|
2,190,653
|
2,264,932
|
2,111,272
|
-6.8%
|
-3.6%
|
|
Regulatory Tier 2 Capital (4)
|
327,452
|
311,751
|
416,412
|
33.6%
|
27.2%
|
|
Total risk-weighted assets
|
|
As of |
% change
|
||
|
(S/ thousand)
|
Mar 24
|
Dec 24
|
Mar 25
|
QoQ
|
YoY
|
|
Market risk-weighted assets
|
252,255
|
241,964
|
225,498
|
-6.8%
|
-10.6%
|
|
Credit risk-weighted assets
|
12,151,596
|
11,419,696
|
11,793,102
|
3.3%
|
-3.0%
|
|
Operational risk-weighted assets
|
1,559,737
|
1,605,950
|
1,623,262
|
1.1%
|
4.1%
|
|
Total
|
13,963,589
|
13,267,611
|
13,641,862
|
2.8%
|
-2.3%
|
|
Capital requirement
|
|
As of |
% change
|
||
|
(S/ thousand)
|
Mar 24
|
Dec 24
|
Mar 25
|
QoQ
|
YoY
|
|
Market risk capital requirement
|
25,226
|
24,196
|
22,550
|
-6.8%
|
-10.6%
|
|
Credit risk capital requirement
|
1,093,644
|
1,084,871
|
1,179,310
|
8.7%
|
7.8%
|
|
Operational risk capital requirement
|
155,974
|
160,595
|
162,326
|
1.1%
|
4.1%
|
|
Additional capital requirements
|
164,047
|
184,428
|
176,897
|
-4.1%
|
7.8%
|
|
Total
|
1,438,889
|
1,454,091
|
1,541,083
|
6.0%
|
7.1%
|
|
Capital ratios under Local Regulation
|
|
As of |
% change
|
||
|
Mar 24
|
Dec 24
|
Mar 25
|
QoQ
|
YoY
|
|
|
Common Equity Tier 1 Ratio
|
15.69%
|
17.07%
|
15.48%
|
-159 bps
|
-21 pbs
|
|
Tier 1 Capital ratio
|
15.69%
|
17.07%
|
15.48%
|
-159 bps
|
-21 pbs
|
|
Regulatory Global Capital Ratio
|
18.03%
|
19.42%
|
18.53%
|
-89 bps
|
50 pbs
|
|
|
[1] |
Up to 1.25% of total risk-weighted assets.
|
|
[2]
|
Common Equity Tier 1 = Capital Stock + Reserves +
Accumulated earnings – Unrealized profits or losses - 100% deductions (investment in subsidiaries, goodwill,
intangible assets and deferred tax assets based on future returns).
|
|
|
[3] |
Regulatory Tier 1 Capital = Common Equity Tier 1 + Tier 1 Subordinated Debt (Perpetual).
|
|
[4]
|
Regulatory Tier 2 Capital = Subordinated Debt + Loan loss reserves.
|
|
|
|||
|
| |
Earnings Release 1Q / 2025
|
Analysis of 1Q25 Consolidated Results
|
|
|
|
Common Equity Tier 1 IFRS
|
|
As of |
% Change
|
||
|
(S/ thousand)
|
Mar 24
|
Dec 24
|
Mar 25
|
QoQ
|
YoY
|
|
Capital and reserves
|
19,051,853
|
18,585,234
|
18,585,234
|
0.0%
|
-2.4%
|
|
Retained earnings
|
3,429,163
|
7,345,245
|
4,176,630
|
-43.1%
|
21.8%
|
|
Unrealized gains (losses)
|
(161,369)
|
81,399
|
140,002
|
72.0%
|
-186.8%
|
|
Goodwill and intangibles
|
(1,650,626)
|
(1,741,267)
|
(1,706,438)
|
-2.0%
|
3.4%
|
|
Investments in subsidiaries
|
(2,570,974)
|
(2,598,905)
|
(2,416,979)
|
-7.0%
|
-6.0%
|
|
Total
|
18,098,046
|
21,671,706
|
18,778,449
|
-13.4%
|
3.8%
|
|
Adjusted RWAs IFRS
|
152,645,988
|
162,676,386
|
161,628,694
|
-0.6%
|
5.9%
|
|
Adjusted Credit RWAs IFRS
|
132,771,383
|
140,344,978
|
138,830,109
|
-1.1%
|
4.6%
|
|
Others
|
19,874,605
|
22,331,409
|
22,798,584
|
2.1%
|
14.7%
|
|
CET1 ratio IFRS
|
11.86%
|
13.32%
|
11.62%
|
-170 bps
|
-24 bps
|
|
Common Equity Tier 1 IFRS
|
|
As of |
% Change
|
||
|
(S/ thousand)
|
Mar 24
|
Dec 24
|
Mar 25
|
QoQ
|
YoY
|
|
Capital and reserves
|
2,703,385
|
2,703,385
|
2,734,582
|
1.2%
|
1.2%
|
|
Retained earnings
|
(62,632)
|
(29,980)
|
(247,483)
|
725.5%
|
295.1%
|
|
Unrealized gains (losses)
|
(8,967)
|
(5,037)
|
(4,257)
|
-15.5%
|
-52.5%
|
|
Goodwill and intangibles
|
(352,162)
|
(310,730)
|
(292,948)
|
-5.7%
|
-16.8%
|
|
Investments in subsidiaries
|
(275)
|
(302)
|
(299)
|
-1.1%
|
8.4%
|
|
Total
|
2,279,349
|
2,357,337
|
2,189,595
|
-7.1%
|
-3.9%
|
|
Adjusted RWAs IFRS
|
14,188,737
|
13,449,807
|
13,782,186
|
2.5%
|
-2.9%
|
|
Adjusted Credit RWAs IFRS
|
12,366,207
|
11,597,881
|
11,933,425
|
2.9%
|
-3.5%
|
|
Others
|
1,822,530
|
1,851,926
|
1,848,760
|
-0.2%
|
1.4%
|
|
CET1 ratio IFRS
|
16.06%
|
17.53%
|
15.89%
|
-164 bps
|
-18 bps
|
|
|
|||
|
| |
Earnings Release 1Q / 2025
|
Analysis of 1Q25 Consolidated Results
|
|
|
| 12.6. |
Financial Statements and Ratios by Business
|
| 12.6.1. |
Credicorp Consolidated
|
|
|
|
As of |
% change
|
||
|
|
Mar 24
|
Dec 24
|
Mar 25
|
QoQ
|
YoY
|
|
ASSETS
|
|||||
|
Cash and due from banks
|
|||||
|
Non-interest bearing
|
8,024,262
|
7,535,259
|
7,015,098
|
-6.9%
|
-12.6%
|
|
Interest bearing
|
31,134,572
|
40,119,937
|
37,521,839
|
-6.5%
|
20.5%
|
|
Total cash and due from banks
|
39,158,834
|
47,655,196
|
44,536,937
|
-6.5%
|
13.7%
|
|
|
|||||
|
Cash collateral, reverse repurchase agreements and securities borrowing
|
1,526,232
|
1,033,177
|
1,835,893
|
77.7%
|
20.3%
|
|
Fair value through profit or loss investments
|
4,448,122
|
4,715,343
|
5,149,628
|
9.2%
|
15.8%
|
|
Fair value through other comprehensive income investments
|
38,047,888
|
40,142,638
|
41,705,253
|
3.9%
|
9.6%
|
|
Amortized cost investments
|
10,059,376
|
8,967,877
|
8,749,729
|
-2.4%
|
-13.0%
|
|
|
|||||
|
Loans
|
140,798,083
|
145,732,273
|
141,196,646
|
-3.1%
|
0.3%
|
|
Current
|
134,593,059
|
140,309,061
|
135,990,251
|
-3.1%
|
1.0%
|
|
Internal overdue loans
|
6,205,024
|
5,423,212
|
5,206,395
|
-4.0%
|
-16.1%
|
|
Less - allowance for loan losses
|
(8,190,343)
|
(7,994,977)
|
(7,742,792)
|
-3.2%
|
-5.5%
|
|
Loans, net
|
132,607,740
|
137,737,296
|
133,453,854
|
-3.1%
|
0.6%
|
|
|
|||||
|
Financial assets designated at fair value through profit or loss
|
868,239
|
932,734
|
871,626
|
-6.6%
|
0.4%
|
|
Property, plant and equipment, net
|
1,815,570
|
1,841,147
|
2,681,862
|
45.7%
|
47.7%
|
|
Due from customers on acceptances
|
322,346
|
528,184
|
639,749
|
21.1%
|
98.5%
|
|
Investments in associates
|
691,908
|
763,918
|
1,002
|
-99.9%
|
-99.9%
|
|
Intangible assets and goodwill, net
|
3,161,382
|
3,289,157
|
4,420,422
|
34.4%
|
39.8%
|
|
Reinsurance contract assets
|
957,474
|
841,170
|
1,126,512
|
33.9%
|
17.7%
|
|
Other assets (1)
|
7,506,630
|
7,641,103
|
9,049,787
|
18.4%
|
20.6%
|
|
|
|||||
|
Total Assets
|
241,171,741
|
256,088,940
|
254,222,254
|
-0.7%
|
5.4%
|
|
|
|||||
|
LIABILITIES AND EQUITY
|
|||||
|
Deposits and obligations
|
|||||
|
Non-interest bearing
|
41,706,139
|
47,160,191
|
49,620,679
|
5.2%
|
19.0%
|
|
Interest bearing
|
106,150,988
|
114,681,875
|
107,998,403
|
-5.8%
|
1.7%
|
|
Total deposits and obligations
|
147,857,127
|
161,842,066
|
157,619,082
|
-2.6%
|
6.6%
|
|
|
|||||
|
Payables from repurchase agreements and securities lending
|
9,491,276
|
9,060,710
|
10,158,614
|
12.1%
|
7.0%
|
|
BCRP instruments
|
6,854,368
|
6,646,830
|
7,064,476
|
6.3%
|
3.1%
|
|
Repurchase agreements with third parties
|
2,527,339
|
2,298,494
|
2,872,797
|
25.0%
|
13.7%
|
|
Repurchase agreements with customers
|
109,569
|
115,386
|
221,341
|
91.8%
|
102.0%
|
|
|
|||||
|
Due to banks and correspondents
|
10,684,673
|
10,754,385
|
10,899,579
|
1.4%
|
2.0%
|
|
Bonds and notes issued
|
17,541,121
|
17,268,443
|
14,391,733
|
-16.7%
|
-18.0%
|
|
Banker’s acceptances outstanding
|
322,346
|
528,184
|
639,749
|
21.1%
|
98.5%
|
|
Insurance contract liability
|
12,343,975
|
13,422,285
|
13,874,732
|
3.4%
|
12.4%
|
|
Financial liabilities at fair value through profit or loss
|
309,228
|
151,485
|
736,192
|
386.0%
|
138.1%
|
|
Other liabilities
|
8,185,785
|
8,084,148
|
9,487,673
|
17.4%
|
15.9%
|
|
|
|||||
|
Total Liabilities
|
206,735,531
|
221,111,706
|
217,807,354
|
-1.5%
|
5.4%
|
|
|
|||||
|
|
|||||
|
Net equity
|
33,853,460
|
34,346,451
|
35,843,202
|
4.4%
|
5.9%
|
|
Capital stock
|
1,318,993
|
1,318,993
|
1,318,993
|
0.0%
|
0.0%
|
|
Treasury stock
|
(208,343)
|
(208,879)
|
(209,845)
|
0.5%
|
0.7%
|
|
Capital surplus
|
201,965
|
176,307
|
124,149
|
-29.6%
|
-38.5%
|
|
Reserves
|
26,213,432
|
27,202,665
|
32,792,830
|
20.6%
|
25.1%
|
|
Other reserves
|
243,405
|
214,627
|
33,460
|
-84.4%
|
-86.3%
|
|
Retained earnings
|
6,084,008
|
5,642,738
|
1,783,615
|
-68.4%
|
-70.7%
|
|
|
|||||
|
Non-controlling interest
|
582,750
|
630,783
|
571,698
|
-9.4%
|
-1.9%
|
|
|
|||||
|
Total Net Equity
|
34,436,210
|
34,977,234
|
36,414,900
|
4.1%
|
5.7%
|
|
|
|||||
|
Total liabilities and equity
|
241,171,741
|
256,088,940
|
254,222,254
|
-0.7%
|
5.4%
|
|
|
|||||
|
Off-balance sheet
|
162,365,717
|
151,223,851
|
144,439,635
|
-4.5%
|
-11.0%
|
|
Total performance bonds, stand-by and L/Cs.
|
20,466,103
|
22,139,322
|
20,843,657
|
-5.9%
|
1.8%
|
|
Undrawn credit lines, advised but not committed
|
88,546,531
|
85,269,774
|
79,021,358
|
-7.3%
|
-10.8%
|
|
Total derivatives (notional) and others
|
53,353,083
|
43,814,755
|
44,574,620
|
1.7%
|
-16.5%
|
|
|
(1) |
Includes mainly accounts receivables from brokerage and others
|
|
*
|
Due to reclassifications, the Balance Sheet may differ from those reported in
previous quarters.
|
|
|
|||
|
| |
Earnings Release 1Q / 2025
|
Analysis of 1Q25 Consolidated Results
|
|
|
|
|
|
Quarter |
% change
|
||
|
|
1Q24
|
4Q24
|
1Q25
|
QoQ
|
YoY
|
|
Interest income and expense
|
|||||
|
Interest and similar income
|
4,925,926
|
5,012,121
|
4,894,790
|
-2.3%
|
-0.6%
|
|
Interest and similar expenses
|
(1,499,803)
|
(1,382,327)
|
(1,322,778)
|
-4.3%
|
-11.8%
|
|
Net interest, similar income and expenses
|
3,426,123
|
3,629,794
|
3,572,012
|
-1.6%
|
4.3%
|
|
Provision for credit losses on loan portfolio
|
(910,189)
|
(857,694)
|
(695,733)
|
-18.9%
|
-23.6%
|
|
Recoveries of written-off loans
|
95,490
|
114,398
|
113,840
|
-0.5%
|
19.2%
|
|
Provision for credit losses on loan portfolio, net of
recoveries
|
(814,699)
|
(743,296)
|
(581,893)
|
-21.7%
|
-28.6%
|
|
Net interest, similar income and expenses, after provision for
credit losses on loan portfolio
|
2,611,424
|
2,886,498
|
2,990,119
|
3.6%
|
14.5%
|
|
|
|||||
|
Other income
|
|||||
|
Fee income
|
856,565
|
973,338
|
994,024
|
2.1%
|
16.0%
|
|
Net gain on foreign exchange transactions
|
305,370
|
385,230
|
343,814
|
-10.8%
|
12.6%
|
|
Net loss on securities
|
61,745
|
(47,377)
|
(28,149)
|
-40.6%
|
-145.6%
|
|
Net gain from associates
|
32,295
|
38,560
|
24,068
|
-37.6%
|
-25.5%
|
|
Net gain (loss) on derivatives held for trading
|
39,984
|
77,962
|
18,499
|
-76.3%
|
-53.7%
|
|
Net gain (loss) from exchange differences
|
(5,621)
|
(21,365)
|
15,959
|
-174.7%
|
-383.9%
|
|
Others
|
102,221
|
176,384
|
322,001
|
82.6%
|
215.0%
|
|
Total other income
|
1,392,559
|
1,582,732
|
1,690,216
|
6.8%
|
21.4%
|
|
Insurance underwriting result
|
458,997
|
407,149
|
416,106
|
2.2%
|
-9.3%
|
|
Insurance Service Result
|
(179,935)
|
(94,466)
|
(86,972)
|
-7.9%
|
-51.7%
|
|
Reinsurance Result
|
279,062
|
312,683
|
329,134
|
5.3%
|
17.9%
|
|
Total insurance underwriting result
|
|||||
|
|
|||||
|
Medical services result
|
0
|
0
|
78,121
|
n.a.
|
n.a.
|
|
Sales of medical services
|
0
|
0
|
(35,432)
|
n.a.
|
n.a.
|
|
Cost of sales of medical services
|
0
|
0
|
42,689
|
n.a.
|
n.a.
|
|
Total medical services result
|
|||||
|
|
|||||
|
Total Expenses
|
|||||
|
Salaries and employee benefits
|
(1,107,069)
|
(1,271,578)
|
(1,361,690)
|
7.1%
|
23.0%
|
|
Administrative, general and tax expenses
|
(821,748)
|
(1,150,867)
|
(869,834)
|
-24.4%
|
5.9%
|
|
Depreciation and amortization
|
(175,146)
|
(186,625)
|
(203,766)
|
9.2%
|
16.3%
|
|
Impairment loss on goodwill
|
0
|
(4,300)
|
0
|
-100.0%
|
n.a.
|
|
Association in participation
|
(8,847)
|
(3,808)
|
(6,799)
|
78.5%
|
-23.1%
|
|
Other expenses
|
(99,672)
|
(409,049)
|
(90,785)
|
-77.8%
|
-8.9%
|
|
Total expenses
|
(2,212,482)
|
(3,026,227)
|
(2,532,874)
|
-16.3%
|
14.5%
|
|
|
|||||
|
Profit before income tax
|
2,070,563
|
1,755,686
|
2,519,284
|
43.5%
|
21.7%
|
|
|
|||||
|
Income tax
|
(528,466)
|
(598,348)
|
(704,469)
|
17.7%
|
33.3%
|
|
|
|||||
|
Net profit
|
1,542,097
|
1,157,338
|
1,814,815
|
56.8%
|
17.7%
|
|
Non-controlling interest
|
30,440
|
30,625
|
37,118
|
21.2%
|
21.9%
|
|
Net profit attributable to Credicorp
|
1,511,657
|
1,126,713
|
1,777,697
|
57.8%
|
17.6%
|
|
|
|||
|
| |
Earnings Release 1Q / 2025
|
Analysis of 1Q25 Consolidated Results
|
|
|
|
12.6.2.
|
Credicorp Stand-alone
|
|
|
As of
|
% change
|
|||
|
Mar 24
|
Dec 24
|
Mar 25
|
QoQ
|
YoY
|
|
|
ASSETS
|
|||||
|
Cash and cash equivalents
|
510,036
|
399,943
|
399,817
|
0.0%
|
-21.6%
|
|
At fair value through profit or loss
|
-
|
-
|
-
|
n.a.
|
n.a.
|
|
Fair value through other comprehensive income investments
|
1,427,450
|
1,262,327
|
1,232,139
|
-2.4%
|
-13.7%
|
|
In subsidiaries and associates investments
|
37,392,797
|
38,291,133
|
39,435,439
|
3.0%
|
5.5%
|
|
Investments at amortized cost
|
640,723
|
695,652
|
686,418
|
-1.3%
|
7.1%
|
|
Other assets
|
294,639
|
6,777
|
250,990
|
n.a.
|
n.a.
|
|
Total Assets
|
40,265,645
|
40,655,832
|
42,004,803
|
3.3%
|
4.3%
|
|
LIABILITIES AND NET SHAREHOLDERS’ EQUITY
|
|||||
|
Due to banks, correspondents and other entities
|
-
|
-
|
-
|
n.a.
|
n.a.
|
|
Bonds and notes issued
|
1,816,584
|
1,829,657
|
1,796,058
|
-1.8%
|
-1.1%
|
|
Other liabilities
|
296,682
|
230,660
|
276,279
|
19.8%
|
-6.9%
|
|
Total Liabilities
|
2,113,266
|
2,060,317
|
2,072,337
|
0.6%
|
-1.9%
|
|
NET EQUITY
|
|||||
|
Capital stock
|
1,318,993
|
1,318,993
|
1,318,993
|
0.0%
|
0.0%
|
|
Capital Surplus
|
384,542
|
384,542
|
384,542
|
0.0%
|
0.0%
|
|
Reserve
|
25,910,975
|
26,651,390
|
32,291,005
|
21.2%
|
24.6%
|
|
Unrealized results
|
17,616
|
35,535
|
(245,864)
|
n.a.
|
n.a.
|
|
Retained earnings
|
10,520,253
|
10,205,055
|
6,183,790
|
-39.4%
|
-41.2%
|
|
Total net equity
|
38,152,379
|
38,595,515
|
39,932,466
|
3.5%
|
4.7%
|
|
Total Liabilities And Equity
|
40,265,645
|
40,655,832
|
42,004,803
|
3.3%
|
4.3%
|
|
|
Quarter |
|
% Change
|
||
|
1Q24
|
4Q24
|
1Q25
|
QoQ
|
YoY
|
|
|
Interest income
|
|||||
|
Net share of the income from investments in subsidiaries and associates
|
1,557,394
|
1,121,288
|
1,660,468
|
48.1%
|
6.6%
|
|
Interest and similar income
|
18,725
|
24,419
|
21,312
|
-12.7%
|
n.a.
|
|
Net gain on financial assets at fair value through profit or loss
|
1,234
|
-
|
-
|
n.a.
|
n.a.
|
|
Total income
|
1,577,353
|
1,145,707
|
1,681,780
|
46.8%
|
6.6%
|
|
Interest and similar expense
|
(13,565)
|
(13,637)
|
(13,129)
|
-3.7%
|
-3.2%
|
|
Administrative and general expenses
|
(4,802)
|
(4,134)
|
(4,958)
|
19.9%
|
3.2%
|
|
Total expenses
|
(18,367)
|
(17,771)
|
(18,087)
|
1.8%
|
-1.5%
|
|
Operating income
|
1,558,986
|
1,127,936
|
1,663,693
|
47.5%
|
6.7%
|
|
Results from exchange differences
|
93
|
175
|
65
|
-62.9%
|
-30.1%
|
|
Other, net
|
111
|
(7)
|
(295)
|
n.a.
|
n.a.
|
|
Profit before income tax
|
1,559,190
|
1,128,104
|
1,663,463
|
47.5%
|
6.7%
|
|
Income tax
|
(43,104)
|
(8,612)
|
(45,071)
|
n.a.
|
4.6%
|
|
Net income
|
1,516,086
|
1,119,492
|
1,618,392
|
44.6%
|
6.7%
|
|
Double Leverage Ratio
|
98.0%
|
99.2%
|
98.8%
|
-46 bps
|
75 bps
|
|
|
|||
|
| |
Earnings Release 1Q / 2025
|
Analysis of 1Q25 Consolidated Results
|
|
|
|
12.6.3
|
BCP Consolidated
|
|
|
As of |
% change
|
|||
|
Mar 24
|
Dec 24
|
Mar 25
|
QoQ
|
YoY
|
|
|
ASSETS
|
|||||
|
Cash and due from banks
|
|||||
|
Non-interest bearing
|
5,842,595
|
5,430,818
|
5,330,664
|
-1.8%
|
-8.8%
|
|
Interest bearing
|
30,040,974
|
39,106,465
|
35,977,823
|
-8.0%
|
19.8%
|
|
Total cash and due from banks
|
35,883,569
|
44,537,283
|
41,308,487
|
-7.2%
|
15.1%
|
|
Cash collateral, reverse repurchase agreements and securities
borrowing
|
415,202
|
19,151
|
776,081
|
n.a
|
86.9%
|
|
Fair value through profit or loss investments
|
465,261
|
603,635
|
537,503
|
-11.0%
|
15.5%
|
|
Fair value through other comprehensive income investments
|
21,739,359
|
23,375,769
|
24,940,660
|
6.7%
|
14.7%
|
|
Amortized cost investments
|
9,389,695
|
8,277,440
|
8,134,166
|
-1.7%
|
-13.4%
|
|
Loans
|
127,359,955
|
132,053,791
|
131,470,639
|
-0.4%
|
3.2%
|
|
Current
|
121,494,564
|
126,990,918
|
126,570,181
|
-0.3%
|
4.2%
|
|
Internal overdue loans
|
5,865,391
|
5,062,873
|
4,900,458
|
-3.2%
|
-16.5%
|
|
Less - allowance for loan losses
|
(7,663,849)
|
(7,443,523)
|
(7,323,541)
|
-1.6%
|
-4.4%
|
|
Loans, net
|
119,696,106
|
124,610,268
|
124,147,098
|
-0.4%
|
3.7%
|
|
Property, furniture and equipment, net (1)
|
1,512,734
|
1,496,066
|
1,643,626
|
9.9%
|
8.7%
|
|
Due from customers on acceptances
|
322,346
|
528,184
|
639,749
|
21.1%
|
98.5%
|
|
Investments in associates
|
23,270
|
29,368
|
24,738
|
-15.8%
|
6.3%
|
|
Other assets (2)
|
6,955,937
|
7,500,552
|
8,045,520
|
7.3%
|
15.7%
|
|
Total Assets
|
196,403,479
|
210,977,716
|
210,197,628
|
-0.4%
|
7.0%
|
|
Liabilities and Equity
|
|||||
|
Deposits and obligations
|
|||||
|
Non-interest bearing
|
38,519,886
|
44,280,933
|
46,181,912
|
4.3%
|
19.9%
|
|
Interest bearing
|
94,436,692
|
103,434,795
|
100,410,686
|
-2.9%
|
6.3%
|
|
Total deposits and obligations
|
132,956,578
|
147,715,728
|
146,592,598
|
-0.8%
|
10.3%
|
|
Payables from repurchase agreements and securities lending
|
7,388,795
|
7,203,885
|
7,892,912
|
9.6%
|
6.8%
|
|
BCRP instruments
|
6,854,368
|
6,646,830
|
7,064,476
|
6.3%
|
3.1%
|
|
Repurchase agreements with third parties
|
534,427
|
557,055
|
828,436
|
48.7%
|
55.0%
|
|
Due to banks and correspondents
|
10,160,253
|
10,165,266
|
10,314,235
|
1.5%
|
1.5%
|
|
Bonds and notes issued
|
13,833,480
|
13,627,208
|
10,759,498
|
-21.0%
|
-22.2%
|
|
Banker’s acceptances outstanding
|
322,346
|
528,184
|
639,749
|
21.1%
|
98.5%
|
|
Financial liabilities at fair value through profit or loss
|
-
|
-
|
367,988
|
n.a.
|
n.a.
|
|
Other liabilities (3)
|
9,283,873
|
5,585,850
|
10,599,135
|
89.7%
|
14.2%
|
|
Total Liabilities
|
173,945,325
|
184,826,121
|
187,166,115
|
1.3%
|
7.6%
|
|
Net equity
|
22,315,713
|
26,007,483
|
22,896,863
|
-12.0%
|
2.6%
|
|
Capital stock
|
12,679,794
|
12,679,794
|
12,679,794
|
0.0%
|
0.0%
|
|
Reserves
|
6,372,059
|
5,905,440
|
5,905,440
|
0.0%
|
-7.3%
|
|
Unrealized gains and losses
|
(159,740)
|
82,590
|
141,193
|
71.0%
|
n.a.
|
|
Retained earnings
|
3,423,600
|
7,339,659
|
4,170,436
|
-43.2%
|
21.8%
|
|
Non-controlling interest
|
142,441
|
144,112
|
134,650
|
-6.6%
|
-5.5%
|
|
Total Net Equity
|
22,458,154
|
26,151,595
|
23,031,513
|
-11.9%
|
2.6%
|
|
Total liabilities and equity
|
196,403,479
|
210,977,716
|
210,197,628
|
-0.4%
|
7.0%
|
|
Off-balance sheet
|
151,059,953
|
139,066,953
|
136,896,925
|
-1.6%
|
-9.4%
|
|
Total performance bonds, stand-by and L/Cs.
|
19,720,490
|
21,683,478
|
20,571,287
|
-5.1%
|
4.3%
|
|
Undrawn credit lines, advised but not committed
|
78,799,124
|
74,193,794
|
72,392,139
|
-2.4%
|
-8.1%
|
|
Total derivatives (notional) and others
|
52,540,339
|
43,189,681
|
43,933,499
|
1.7%
|
-16.4%
|
|
|
(1) |
Right of use asset of lease contracts is included by application of IFRS 16.
|
|
|
(2) |
Mainly includes intangible assets, other receivable accounts, trading derivatives receivable
accounts and tax credit.
|
|
|
(3) |
Mainly includes other payable accounts, trading derivatives payable accounts and taxes for payable.
|
|
|
|||
|
| |
Earnings Release 1Q / 2025
|
Analysis of 1Q25 Consolidated
Results
|
| |
|
|
1Q24
|
Quarter
4Q24
|
|
% change
|
|
|
QoQ
|
YoY
|
||||
|
Interest income and expense
|
|
|
|
|
|
|
Interest and similar income
|
4,278,901
|
4,381,994
|
4,260,384
|
-2.8%
|
-0.4%
|
|
Interest and similar expense (1)
|
(1,119,658)
|
(1,025,087)
|
(975,337)
|
-4.9%
|
-12.9%
|
|
Interest income and expense
|
3,159,243
|
3,356,907
|
3,285,047
|
-2.1%
|
4.0%
|
|
Provision for credit losses on loan portfolio
|
(844,152)
|
(786,209)
|
(648,883)
|
-17.5%
|
-23.1%
|
|
Recoveries of written-off loans
|
90,798
|
108,560
|
108,978
|
0.4%
|
20.0%
|
|
Provision for credit losses on loan portfolio, net
of recoveries
|
(753,354)
|
(677,649)
|
(539,905)
|
-20.3%
|
-28.3%
|
|
Net interest, similar income and expenses, after
provision for credit losses on loan portfolio
|
2,405,889
|
2,679,258
|
2,745,142
|
2.5%
|
14.1%
|
|
Other income
|
|||||
|
Fee income
|
729,700
|
833,341
|
860,089
|
3.2%
|
17.9%
|
|
Net gain on foreign exchange transactions
|
261,882
|
313,538
|
305,799
|
-2.5%
|
16.8%
|
|
Net gain (loss) on securities
|
(10,530)
|
(19,571)
|
11,361
|
n.a.
|
n.a. |
|
Net gain on derivatives held for trading
|
17,957
|
24,881
|
14,635
|
-41.2%
|
-18.5%
|
|
Net loss (gain) from exchange differences
|
6,525
|
(1,989)
|
784
|
n.a.
|
-88.0% |
|
Others
|
56,939
|
95,118
|
23,975
|
-74.8%
|
-57.9%
|
|
Total other income
|
1,062,473
|
1,245,318
|
1,216,643
|
-2.3%
|
14.5%
|
|
Total expenses
|
|||||
|
Salaries and employee benefits
|
(795,569)
|
(973,566)
|
(979,534)
|
0.6%
|
23.1%
|
|
Administrative expenses
|
(630,015)
|
(899,653)
|
(628,741)
|
-30.1%
|
-0.2%
|
|
Depreciation and amortization (2)
|
(142,270)
|
(154,731)
|
(168,136)
|
8.7%
|
18.2%
|
|
Other expenses
|
(52,973)
|
(104,374)
|
(53,526)
|
-48.7%
|
1.0%
|
|
Total expenses
|
(1,620,827)
|
(2,132,324)
|
(1,829,937)
|
-14.2%
|
12.9%
|
|
Profit before income tax
|
1,847,535
|
1,792,252
|
2,131,848
|
18.9%
|
15.4%
|
|
Income tax
|
(462,579)
|
(517,677)
|
(549,462)
|
6.1%
|
18.8%
|
|
Net profit
|
1,384,956
|
1,274,575
|
1,582,386
|
24.2%
|
14.3%
|
|
Non-controlling interest
|
(4,630)
|
(5,867)
|
(4,721)
|
-19.5%
|
2.0%
|
|
Net profit attributable to BCP Consolidated
|
1,380,326
|
1,268,708
|
1,577,665
|
24.4%
|
14.3%
|
| (1) |
Financing expenses related to lease agreements are included according
to the application of IFRS 16.
|
|
|
(2) |
The effect of the application of IFRS 16 is included, which
corresponds to a greater depreciation for the asset for right-of-use”.
|
|
1Q24
|
Quarter
4Q24
|
1Q25
|
Change
|
||
| QoQ |
YoY | ||||
|
Profitability
|
|||||
|
ROAA (1)(2)
|
2.8%
|
2.4%
|
3.0%
|
56 bps
|
17 bps
|
|
ROAE (1)(2)
|
23.3%
|
19.8%
|
25.8%
|
604 bps
|
247 bps
|
|
Net interest margin (1)(2)
|
6.71%
|
6.70%
|
6.48%
|
-21 bps
|
-23 bps
|
|
Risk-adjusted Net interest margin (1)(2)
|
5.11%
|
5.35%
|
5.42%
|
7 bps
|
31 bps
|
|
Funding cost (1)(2)(3)
|
2.74%
|
2.34%
|
2.22%
|
-11 bps
|
-51 bps
|
|
Loan portfolio quality
|
|||||
|
Internal overdue ratio
|
4.6%
|
3.8%
|
3.7%
|
-11 bps
|
-88 bps
|
|
NPL ratio
|
6.6%
|
5.5%
|
5.2%
|
-28 bps
|
-137 bps
|
|
Coverage ratio of IOLs
|
130.7%
|
147.0%
|
149.4%
|
242 bps
|
1878 bps
|
|
Coverage ratio of NPLs
|
91.8%
|
103.2%
|
107.5%
|
428 bps
|
1572 bps
|
|
Cost of risk (4)
|
2.3%
|
2.1%
|
1.6%
|
-44 bps
|
-69 bps
|
|
Operating efficiency
|
|||||
|
Operating expenses / Total income (5)
|
37.6%
|
44.8%
|
39.8%
|
-503 bps
|
222 bps
|
|
Operating expenses / Total average assets (1)(2)(5)
|
3.2%
|
3.9%
|
3.4%
|
-53 bps
|
16 bps
|
|
|
|||
|
| |
Earnings Release 1Q / 2025
|
Analysis of 1Q25 Consolidated Results
|
|
12. Appendix
|
| 12.6.4. |
BCP Stand-alone
|
|
Mar
24
|
As of
Dec 24
|
Mar
25
|
% change
|
||
| QoQ | YoY | ||||
|
ASSETS
|
|
||||
|
Cash and due from banks
|
|||||
|
Non-interest bearing
|
5,150,933
|
4,792,810
|
4,776,238
|
-0.3%
|
-7.3%
|
|
Interest bearing
|
29,572,183
|
38,063,318
|
34,709,343
|
-8.8%
|
17.4%
|
|
Total cash and due from banks
|
34,723,116
|
42,856,128
|
39,485,581
|
-7.9%
|
13.7%
|
|
Cash collateral, reverse repurchase agreements and
securities borrowing
|
415,202
|
19,151
|
776,081
|
n.a
|
86.9% |
|
Fair value through profit or loss investments
|
465,261
|
603,635
|
537,503
|
-11.0%
|
15.5%
|
|
Fair value through other comprehensive income
investments
|
18,996,635
|
20,521,337
|
21,877,682
|
6.6%
|
15.2%
|
|
Amortized cost investments
|
9,250,403
|
8,214,476
|
8,072,234
|
-1.7%
|
-12.7%
|
|
Loans
|
115,355,734
|
120,571,109
|
119,378,598
|
-1.0%
|
3.5%
|
|
Current
|
110,365,981
|
116,314,563
|
115,180,766
|
-1.0%
|
4.4%
|
|
Internal overdue loans
|
4,989,753
|
4,256,546
|
4,197,832
|
-1.4%
|
-15.9%
|
|
Less - allowance for loan losses
|
(6,689,926)
|
(6,513,398)
|
(6,453,864)
|
-0.9%
|
-3.5%
|
|
Loans, net
|
108,665,808
|
114,057,711
|
112,924,734
|
-1.0%
|
3.9%
|
|
Property, furniture and equipment, net (1)
|
1,262,342
|
1,271,219
|
1,428,475
|
12.4%
|
13.2%
|
|
Due from customers on acceptances
|
322,346
|
528,184
|
639,749
|
21.1%
|
98.5%
|
|
Investments in associates
|
2,570,974
|
2,612,080
|
2,431,259
|
-6.9%
|
-5.4%
|
|
Other assets (2)
|
6,647,263
|
6,788,659
|
7,642,355
|
12.6%
|
15.0%
|
|
Total Assets
|
183,319,350
|
197,472,580
|
195,815,653
|
-0.8%
|
6.8%
|
|
Liabilities and Equity
|
|||||
|
Deposits and obligations
|
|||||
|
Non-interest bearing
|
38,529,409
|
44,267,223
|
46,158,361
|
4.3%
|
19.8%
|
|
Interest bearing
|
84,392,216
|
92,516,659
|
89,206,307
|
-3.6%
|
5.7%
|
|
Total deposits and obligations
|
122,921,625
|
136,783,882
|
135,364,668
|
-1.0%
|
10.1%
|
|
Payables from repurchase agreements and securities
lending
|
6,816,019
|
6,711,406
|
7,070,379
|
5.3%
|
3.7%
|
|
BCRP instruments
|
6,281,592
|
6,154,351
|
6,241,943
|
1.4%
|
-0.6%
|
|
Repurchase agreements with third parties
|
534,427
|
557,055
|
828,436
|
48.7%
|
55.0%
|
|
Due to banks and correspondents
|
8,830,355
|
8,962,379
|
9,007,034
|
0.5%
|
2.0%
|
|
Bonds and notes issued
|
13,316,718
|
13,317,657
|
10,350,044
|
-22.3%
|
-22.3%
|
|
Due from customers on acceptances
|
322,346
|
528,184
|
639,749
|
21.1%
|
98.5%
|
|
Financial liabilities at fair value through profit
or loss
|
-
|
-
|
367,988
|
n.a.
|
n.a. |
|
Other liabilities (3)
|
8,792,640
|
5,157,194
|
10,113,925
|
96.1%
|
15.0%
|
|
Total Liabilities
|
160,999,703
|
171,460,702
|
172,913,787
|
0.8%
|
7.4%
|
|
Net equity
|
22,319,647
|
26,011,878
|
22,901,866
|
-12.0%
|
2.6%
|
|
Capital stock
|
12,679,794
|
12,679,794
|
12,679,794
|
0.0%
|
0.0%
|
|
Reserves
|
6,372,059
|
5,905,440
|
5,905,440
|
0.0%
|
-7.3%
|
|
Unrealized gains and losses
|
(161,369)
|
81,399
|
140,002
|
72.0%
|
n.a.
|
|
Retained earnings
|
3,429,163
|
7,345,245
|
4,176,630
|
-43.1%
|
21.8%
|
|
Total Net Equity
|
22,319,647
|
26,011,878
|
22,901,866
|
-12.0%
|
2.6%
|
|
Total liabilities and equity
|
183,319,350
|
197,472,580
|
195,815,653
|
-0.8%
|
6.8%
|
|
Off-balance sheet
|
147,001,354
|
135,041,209
|
133,060,043
|
-1.5%
|
-9.5%
|
|
Total performance bonds, stand-by and L/Cs.
|
19,720,490
|
21,683,478
|
20,571,287
|
-5.1%
|
4.3%
|
|
Undrawn credit lines, advised but not committed
|
75,957,799
|
71,516,643
|
69,917,928
|
-2.2%
|
-8.0%
|
|
Total derivatives (notional) and others
|
51,323,065
|
41,841,088
|
42,570,828
|
1.7%
|
-17.1%
|
| (1) |
Right of use asset of lease contracts is included by application of
IFRS 16.
|
|
|
(2) |
Mainly includes intangible assets, other receivable accounts, trading
derivatives receivable accounts and tax credit
|
|
|
(3) |
Mainly includes other payable accounts, trading derivatives payable
accounts and taxes for payable.
|
|
|
|||
|
| |
Earnings Release 1Q / 2025
|
Analysis of 1Q25 Consolidated Results
|
|
12. Appendix
|
|
|
1Q24
|
Quarter
4Q24
|
1Q25
|
% change
|
|
| QoQ |
YoY | ||||
|
Interest income and expense
|
|||||
|
Interest and similar income
|
3,522,708
|
3,639,485
|
3,519,001
|
-3.3%
|
-0.1%
|
|
Interest and similar expenses (1)
|
(911,699)
|
(857,707)
|
(814,465)
|
-5.0%
|
-10.7%
|
|
Interest income and expense
|
2,611,009
|
2,781,778
|
2,704,536
|
-2.8%
|
3.6%
|
|
Provision for credit losses on loan portfolio
|
(657,384)
|
(616,654)
|
(467,002)
|
-24.3%
|
-29.0%
|
|
Recoveries of written-off loans
|
55,320
|
80,396
|
84,839
|
5.5%
|
53.4%
|
|
Provision for credit losses on loan portfolio, net of recoveries
|
(602,064)
|
(536,258)
|
(382,163)
|
-28.7%
|
-36.5%
|
|
Net interest, similar income and expenses, after provision for credit
losses on loan portfolio
|
2,008,945
|
2,245,520
|
2,322,373
|
3.4%
|
15.6%
|
|
Other income
|
|||||
|
Fee income
|
704,628
|
809,060
|
831,427
|
2.8%
|
18.0%
|
|
Net gain on foreign exchange transactions
|
259,059
|
311,657
|
303,693
|
-2.6%
|
17.2%
|
|
Net gain on securities
|
77,981
|
88,641
|
100,397
|
13.3%
|
28.7%
|
|
Net gain (loss) from associates
|
(535)
|
88
|
1,509
|
n.a.
|
n.a. |
|
Net gain on derivatives held for trading
|
18,725
|
23,551
|
13,752
|
-41.6%
|
-26.6%
|
|
Net loss (gain) from exchange differences
|
8,988
|
(1,525)
|
1,549
|
n.a.
|
-82.8% |
|
Others
|
44,339
|
94,340
|
23,180
|
-75.4%
|
-47.7%
|
|
Total other income
|
1,113,185
|
1,325,812
|
1,275,507
|
-3.8%
|
14.6%
|
|
Total expenses
|
|||||
|
Salaries and employee benefits
|
(588,744)
|
(762,850)
|
(745,935)
|
-2.2%
|
26.7%
|
|
Administrative expenses
|
(555,189)
|
(820,566)
|
(562,439)
|
-31.5%
|
1.3%
|
|
Depreciation and amortization (2)
|
(119,026)
|
(131,376)
|
(145,142)
|
10.5%
|
21.9%
|
|
Other expenses
|
(45,954)
|
(106,338)
|
(48,353)
|
-54.5%
|
5.2%
|
|
Total expenses
|
(1,308,913)
|
(1,821,130)
|
(1,501,869)
|
-17.5%
|
14.7%
|
|
Profit before income tax
|
1,813,217
|
1,750,202
|
2,096,011
|
19.8%
|
15.6%
|
|
Income tax
|
(431,670)
|
(481,509)
|
(517,741)
|
7.5%
|
19.9%
|
|
Net profit
|
1,381,547
|
1,268,693
|
1,578,270
|
24.4%
|
14.2%
|
|
Non-controlling interest
|
-
|
-
|
-
|
n.a.
|
n.a. |
|
Net profit attributable to BCP
|
1,381,547
|
1,268,693
|
1,578,270
|
24.4%
|
14.2%
|
|
|
(1) |
Financing expenses related to lease agreements are included according to the application of
IFRS 16.
|
|
|
(2) |
The effect of the application of IFRS 16 is included, which corresponds to a greater
depreciation for the asset for right-of-use”.
|
|
1Q24
|
Quarter
4Q24
|
1Q25
|
Change
|
||
| QoQ |
YoY | ||||
|
Profitability
|
|||||
|
ROAA (1)(2)
|
3.0%
|
2.6%
|
3.2%
|
60 bps
|
18 bps
|
|
ROAE (1)(2)
|
23.4%
|
19.8%
|
25.8%
|
605 bps
|
246 bps
|
|
Net interest margin (1)(2)
|
6.03%
|
6.01%
|
5.80%
|
-22 bps
|
-24 bps
|
|
Risk-adjusted Net interest margin (1)(2)
|
4.64%
|
4.85%
|
4.98%
|
13 bps
|
34 bps
|
|
Funding cost (1)(2)(3)
|
2.41%
|
2.11%
|
1.99%
|
-12 bps
|
-42 bps
|
|
Loan portfolio quality
|
|||||
|
Internal overdue ratio
|
4.3%
|
3.5%
|
3.5%
|
-1 bps
|
-81 bps
|
|
NPL ratio
|
6.4%
|
5.2%
|
5.0%
|
-20 bps
|
-136 bps
|
|
Coverager rattio of IOLs
|
134.1%
|
153.0%
|
153.7%
|
72 bps
|
1967 bps
|
|
Coverage ratio of NPLs
|
90.8%
|
103.5%
|
107.6%
|
409 bps
|
1678 bps
|
|
Cost of risk (4)
|
2.1%
|
1.8%
|
1.3%
|
-53 bps
|
-78 bps
|
|
Operating efficiency
|
|||||
|
Operating expenses / Total income (5)
|
35.1%
|
43.7%
|
37.7%
|
-600 bps
|
263 bps
|
|
Operating expenses / Total average assets (1)(2)(5)
|
2.8%
|
3.5%
|
3.0%
|
-57 bps
|
18 bps
|
|
|
|||
|
| |
Earnings Release 1Q / 2025
|
Analysis of 1Q25 Consolidated Results
|
|
12. Appendix
|
| 12.6.5. |
BCP Bolivia
|
|
|
Mar 24
|
As of
Dec 24
|
Mar 25
|
% change
|
|
| QoQ | YoY | ||||
|
ASSETS
|
|||||
|
Cash and due from banks
|
2,374,484
|
2,216,270
|
1,646,883
|
-25.7%
|
-30.6%
|
|
Investments
|
1,578,839
|
1,739,760
|
1,248,084
|
-28.3%
|
-20.9%
|
|
Loans
|
9,739,036
|
9,938,971
|
6,293,810
|
-36.7%
|
-35.4%
|
|
Current
|
9,434,678
|
9,609,399
|
6,075,092
|
-36.8%
|
-35.6%
|
|
Internal overdue loans
|
250,051
|
266,296
|
174,431
|
-34.5%
|
-30.2%
|
|
Refinanced loans
|
54,307
|
63,276
|
44,287
|
-30.0%
|
-18.5%
|
|
Less - allowance for loan losses
|
(352,327)
|
(366,704)
|
(226,534)
|
-38.2%
|
-35.7%
|
|
Loans, net
|
9,386,709
|
9,572,267
|
6,067,276
|
-36.6%
|
-35.4%
|
|
Property, furniture and equipment, net
|
65,712
|
132,210
|
81,105
|
-38.7%
|
23.4%
|
|
Other assets
|
339,171
|
314,226
|
210,298
|
-33.1%
|
-38.0%
|
|
Total assets
|
13,744,915
|
13,974,733
|
9,253,646
|
-33.8%
|
-32.7%
|
|
LIABILITIES AND NET SHAREHOLDERS’ EQUITY
|
|||||
|
Deposits and obligations
|
11,727,803
|
12,145,811
|
7,971,085
|
-34.4%
|
-32.0%
|
|
Due to banks and correspondents
|
76,650
|
-
|
-
|
n.a
|
n.a. |
|
Bonds and subordinated debt
|
161,970
|
157,253
|
97,465
|
-38.0%
|
-39.8%
|
|
Other liabilities
|
879,270
|
665,519
|
475,663
|
-28.5%
|
-45.9%
|
|
Total liabilities
|
12,845,693
|
12,968,583
|
8,544,213
|
-34.1%
|
-33.5%
|
|
Net equity
|
899,222
|
1,006,150
|
709,433
|
-29.5%
|
-21.1%
|
|
TOTAL LIABILITIES AND NET EQUITY
|
13,744,915
|
13,974,733
|
9,253,646
|
-33.8%
|
-32.7%
|
|
|
1Q24
|
Quarter
4Q24
|
1Q25
|
% change
|
|
| QoQ | YoY | ||||
|
Interests income, net
|
86,848
|
87,812
|
71,066
|
-19.1%
|
-18.2%
|
|
Provisions for doubtful accounts receivable, net of recoveries
|
(14,653)
|
(25,027)
|
(5,743)
|
-77.1%
|
-60.8%
|
|
Net interest income after provisions
|
72,195
|
62,785
|
65,323
|
4.0%
|
-9.5%
|
|
Non financial income
|
62,748
|
85,923
|
60,815
|
-29.2%
|
-3.1%
|
|
Total expenses
|
(101,422)
|
(114,966)
|
(93,862)
|
-18.4%
|
-7.5%
|
|
Translation result
|
(163)
|
1,281
|
3,768
|
194.1%
|
n.a.
|
|
Income tax
|
(13,002)
|
(11,521)
|
(11,817)
|
2.6%
|
-9.1%
|
|
Net profit
|
20,356
|
23,502
|
24,227
|
3.1%
|
19.0%
|
|
|
Quarter
|
% change
|
|||
|
|
1Q24
|
4Q24
|
1Q25
|
QoQ
|
YoY
|
|
Efficiency ratio
|
58.06%
|
62.97%
|
69.62%
|
665 bps
|
1157 bps
|
|
ROAE
|
9.11%
|
9.52%
|
11.30%
|
178 bps
|
219 bps
|
|
L/D ratio
|
83.04%
|
81.83%
|
78.96%
|
-287 bps
|
-408 bps
|
|
IOL ratio
|
2.57%
|
2.68%
|
2.77%
|
9 bps
|
20 bps
|
|
NPL ratio
|
3.13%
|
3.32%
|
3.48%
|
16 bps
|
35 bps
|
|
Coverage of IOLs
|
140.90%
|
137.71%
|
129.87%
|
-784 bps
|
-1103 bps
|
|
Coverage of NPLs
|
115.76%
|
111.27%
|
103.57%
|
-769 bps
|
-1219 bps
|
|
Branches
|
46
|
46
|
46
|
0.0%
|
0.0%
|
|
Agentes
|
1,350
|
1,834
|
1,848
|
0.8%
|
36.9%
|
|
ATMs
|
315
|
314
|
314
|
0.0%
|
-0.3%
|
|
Employees
|
1,719
|
1,819
|
1,859
|
2.2%
|
8.1%
|
|
|
|||
|
| |
Earnings Release 1Q / 2025
|
Analysis of 1Q25 Consolidated Results
|
|
12. Appendix
|
| 12.6.6. |
Mibanco
|
|
|
Mar 24
|
As of
Dec 24
|
Mar 25
|
% change
|
|
| QoQ | YoY | ||||
|
ASSETS
|
|||||
|
Cash and due from banks
|
1,250,746
|
1,833,225
|
1,931,908
|
5.4%
|
54.5%
|
|
Investments
|
2,882,015
|
2,917,396
|
3,124,911
|
7.1%
|
8.4%
|
|
Total loans
|
13,080,143
|
12,239,171
|
12,525,099
|
2.3%
|
-4.2%
|
|
Current
|
12,106,939
|
11,330,124
|
11,719,353
|
3.4%
|
-3.2%
|
|
Internal overdue loans
|
870,892
|
802,133
|
698,528
|
-12.9%
|
-19.8%
|
|
Refinanced
|
102,312
|
106,914
|
107,218
|
0.3%
|
4.8%
|
|
Allowance for loan losses
|
(968,082)
|
(924,703)
|
(864,812)
|
-6.5%
|
-10.7%
|
|
Net loans
|
12,112,061
|
11,314,468
|
11,660,287
|
3.1%
|
-3.7%
|
|
Property, plant and equipment, net
|
135,215
|
131,261
|
127,401
|
-2.9%
|
-5.8%
|
|
Other assets
|
810,313
|
750,972
|
719,368
|
-4.2%
|
-11.2%
|
|
Total assets
|
17,190,351
|
16,947,322
|
17,563,875
|
3.6%
|
2.2%
|
|
LIABILITIES AND NET SHAREHOLDERS’ EQUITY
|
|
||||
|
Deposits and obligations
|
10,118,296
|
11,060,598
|
11,330,151
|
2.4%
|
12.0%
|
|
Due to banks and correspondents
|
2,428,683
|
1,985,746
|
1,763,462
|
-11.2%
|
-27.4%
|
|
Bonds and subordinated debt
|
516,761
|
309,551
|
409,454
|
32.3%
|
-20.8%
|
|
Other liabilities
|
1,494,825
|
923,059
|
1,577,966
|
70.9%
|
5.6%
|
|
Total liabilities
|
14,558,565
|
14,278,954
|
15,081,033
|
5.6%
|
3.6%
|
|
Net equity
|
2,631,786
|
2,668,368
|
2,482,842
|
-7.0%
|
-5.7%
|
|
TOTAL LIABILITIES AND NET SHAREHOLDERS’ EQUITY
|
17,190,351
|
16,947,322
|
17,563,875
|
3.6%
|
2.2%
|
|
|
1Q24
|
Quarter
4Q24
|
1Q25
|
%
change
|
|
| QoQ | YoY | ||||
|
Net interest income
|
546,271
|
574,720
|
579,900
|
0.9%
|
6.2%
|
|
Provision for loan losses, net of recoveries
|
(150,725)
|
(141,899)
|
(158,212)
|
11.5%
|
5.0%
|
|
Net interest income after provisions
|
395,546
|
432,821
|
421,688
|
-2.6%
|
6.6%
|
|
Non-financial income
|
40,687
|
32,748
|
32,815
|
0.2%
|
-19.3%
|
|
Total expenses
|
(311,728)
|
(312,016)
|
(327,944)
|
5.1%
|
5.2%
|
|
Translation result
|
(972)
|
(466)
|
(749)
|
60.7%
|
-22.9%
|
|
Income taxes
|
(30,960)
|
(36,098)
|
(31,423)
|
-13.0%
|
1.5%
|
|
Net income
|
92,573
|
116,989
|
94,387
|
-19.3%
|
2.0%
|
|
|
1Q24
|
Quarter
4Q24
|
1Q25
|
% change
|
|
| QoQ | YoY | ||||
|
Efficiency ratio
|
53.3%
|
52.2%
|
52.9%
|
65 bps
|
-38 bps
|
|
ROAE
|
13.2%
|
17.3%
|
14.7%
|
-264 bps
|
150 bps
|
|
ROAE incl. Goowdill
|
12.5%
|
16.4%
|
13.9%
|
-254 bps
|
137 bps
|
|
L/D ratio
|
129.3%
|
110.7%
|
110.5%
|
-11 bps
|
-1873 bps
|
|
IOL ratio
|
6.7%
|
6.6%
|
5.6%
|
-98 bps
|
-108 bps
|
|
NPL ratio
|
7.4%
|
7.4%
|
6.4%
|
-99 bps
|
-101 bps
|
|
Coverage of IOLs
|
111.2%
|
115.3%
|
123.8%
|
852 bps
|
1265 bps
|
|
Coverage of NPLs
|
99.5%
|
101.7%
|
107.3%
|
561 bps
|
786 bps
|
|
Branches (1)
|
290
|
283
|
283
|
-
|
(7)
|
|
Employees
|
9,485
|
9,950
|
9,679
|
(271)
|
194
|
|
(1)
|
Includes Banco de la Nacion branches, which in March 24 were 36, in December 24 were 36 and
in March 25 were 36.
|
|
|
|||
|
| |
Earnings Release 1Q / 2025
|
Analysis of 1Q25 Consolidated Results
|
|
12. Appendix
|
| 12.6.7. |
Prima AFP
|
|
Mar 24
|
As of
Dec 24
|
Mar 25
|
% change
|
||
|
QoQ
|
YoY
|
||||
|
Cash and due from banks
|
107,025
|
123,278
|
132,293
|
7.3%
|
23.6%
|
|
Non-interest bearing
|
5,975
|
3,779
|
2,244
|
-40.6%
|
-62.4%
|
|
Interest bearing
|
101,050
|
119,499
|
130,049
|
8.8%
|
28.7%
|
|
Fair value through profit or loss investments
|
366,671
|
306,759
|
302,482
|
-1.4%
|
-17.5%
|
|
Fair value through other comprehensive income investments
|
1,703
|
1,218
|
1,968
|
61.6%
|
15.6%
|
|
Property, plant and equipment, net
|
9,255
|
7,347
|
6,233
|
-15.2%
|
-32.7%
|
|
Other Assets
|
297,719
|
219,369
|
214,822
|
-2.1%
|
-27.8%
|
|
Total Assets
|
782,373
|
657,971
|
657,798
|
0.0%
|
-15.9%
|
|
Due to banks and correspondents
|
2
|
22
|
29
|
31.8%
|
n.a.
|
|
Lease payable
|
5,958
|
3,723
|
2,745
|
-26.3%
|
-53.9%
|
|
Other liabilities
|
333,846
|
178,674
|
265,049
|
48.3%
|
-20.6%
|
|
Total Liabilities
|
339,806
|
182,419
|
267,823
|
46.8%
|
-21.2%
|
|
Capital stock
|
40,505
|
40,505
|
40,505
|
0.0%
|
0.0%
|
|
Reserves
|
20,243
|
20,243
|
20,243
|
0.0%
|
0.0%
|
|
Other reserves
|
297
|
459
|
445
|
-3.1%
|
49.8%
|
|
Retained earnings
|
344,509
|
281,419
|
304,310
|
8.1%
|
-11.7%
|
|
Net Income for the Period
|
37,013
|
132,926
|
24,472
|
-81.6%
|
-33.9%
|
|
Total Liabilities and Equity
|
782,373
|
657,971
|
657,798
|
0.0%
|
-15.9%
|
|
|
1Q24
|
Quarter
4Q24
|
1Q25
|
% change
|
|
| QoQ | YoY | ||||
|
Financial income
|
1,647
|
1,786
|
1,481
|
-17.1%
|
-10.1%
|
|
Financial expenses
|
(467)
|
(1,782)
|
(453)
|
-74.6%
|
-3.0%
|
|
Interest income, net
|
1,180
|
4
|
1,028
|
n.a.
|
-12.9% |
|
Fee income
|
94,527
|
88,102
|
94,072
|
6.8%
|
-0.5%
|
|
Net gain (loss) on securities
|
6,548
|
(2,115)
|
(7,380)
|
n.a.
|
n.a. |
|
Net gain (loss) from exchange differences
|
(257)
|
(32)
|
250
|
n.a.
|
n.a. |
|
Other income
|
175
|
5,628
|
206
|
-96.3%
|
17.7%
|
|
Salaries and employee benefits
|
(22,962)
|
(29,371)
|
(23,431)
|
-20.2%
|
2.0%
|
|
Administrative expenses
|
(18,535)
|
(20,545)
|
(21,577)
|
5.0%
|
16.4%
|
|
Depreciation and amortization
|
(6,606)
|
(6,612)
|
(6,870)
|
3.9%
|
4.0%
|
|
Other expenses
|
(329)
|
(71)
|
(165)
|
n.a.
|
-49.8% |
|
Profit before income tax
|
53,741
|
34,988
|
36,133
|
3.3%
|
-32.8%
|
|
Income tax
|
(16,728)
|
(10,666)
|
(11,661)
|
9.3%
|
-30.3%
|
|
Net profit
|
37,013
|
24,322
|
24,472
|
0.6%
|
-33.9%
|
|
|
Quarter
|
Change
|
|||
|
|
1Q24
|
4Q24
|
1Q25
|
QoQ
|
YoY
|
|
ROE
|
31.4%
|
19.7%
|
22.6%
|
296 bps
|
-879 bps
|
|
Net Interest Margin
|
1.0%
|
0.0%
|
1.0%
|
95 bps
|
-9 bps
|
|
Efficiency Ratio
|
50.4%
|
64.2%
|
54.4%
|
-977 bps
|
401 bps
|
|
Operating Expenses / Total Average Assets
|
25.3%
|
32.6%
|
31.5%
|
-102 bps
|
628 bps
|
|
Prima
4Q24
|
System
4Q24
|
Share %
4Q24
|
Prima
1Q25
|
System
1Q25
|
Share %
1Q25
|
|
|
AUMs (S/ Millions)
|
32,118
|
106,976
|
30%
|
31,702
|
107,622
|
29%
|
|
Affiliates (S/ Millions)
|
2,340,087
|
9,795,699
|
24%
|
2,338,126
|
9,928,899
|
24%
|
|
Collections (S/ Millions)
|
711
|
2,704
|
26%
|
724
|
2,787
|
26%
|
|
|
|||
|
| |
Earnings Release 1Q / 2025
|
Analysis of 1Q25 Consolidated Results
|
|
12. Appendix
|
|
12.6.8.
|
Grupo Pacifico
|
|
Mar 24
|
As of
Dec 24
|
Mar 25
|
% change
|
||
| QoQ | YoY | ||||
|
Total assets
|
16,811,859
|
17,890,138
|
20,352,820
|
13.8%
|
21.1%
|
|
Total Invesment (1)
|
12,485,677
|
13,898,637
|
14,117,211
|
1.6%
|
13.1%
|
|
Total Liabilities
|
13,920,330
|
14,504,765
|
16,430,262
|
13.3%
|
18.0%
|
|
Net equity
|
2,878,536
|
3,369,625
|
3,177,756
|
-5.7%
|
10.4%
|
|
1Q24
|
Quarter
4Q24
|
1Q25
|
% change
|
||
| QoQ | YoY | ||||
|
Insurance Service Result
|
341,794
|
293,055
|
279,931
|
-4.5%
|
-18.1%
|
|
Reinsurance Result
|
(180,053)
|
(102,995)
|
(94,861)
|
-7.9%
|
-47.3%
|
|
Insurance underwriting result
|
161,741
|
190,060
|
185,070
|
-2.6%
|
14.4%
|
|
Sale of medical services
|
-
|
-
|
78,267
|
n.a.
|
n.a. |
|
Cost of sales of medical services
|
-
|
-
|
(35,393)
|
n.a.
|
n.a. |
|
Medical services result
|
-
|
-
|
42,874
|
n.a.
|
n.a. |
|
Interest income
|
219,545
|
208,159
|
238,213
|
14.4%
|
8.5%
|
|
Interest Expenses
|
(129,114)
|
(138,943)
|
(145,698)
|
4.9%
|
12.8%
|
|
Interest expenses attributable to insurance activities
|
(122,004)
|
(132,088)
|
(135,622)
|
2.7%
|
11.2%
|
|
Net Interest Income
|
90,431
|
69,216
|
92,515
|
33.7%
|
2.3%
|
|
Fee Income and Gain in FX
|
(3,262)
|
(4,065)
|
(4,151)
|
2.1%
|
27.3%
|
|
Other Income No Core:
|
|||||
|
Net gain (loss) from exchange differences
|
(182)
|
1,151
|
(351)
|
-130.5%
|
92.9%
|
|
Net loss on securities and associates
|
23,222
|
(15,450)
|
(34,396)
|
122.6%
|
-248.1%
|
|
Other Income not operational
|
29,751
|
52,455
|
26,264
|
-49.9%
|
-11.7%
|
|
Other Income
|
49,529
|
34,089
|
(12,634)
|
-137.1%
|
-125.5%
|
|
Operating expenses
|
(76,174)
|
(84,895)
|
(105,415)
|
24.2%
|
38.4%
|
|
Other expenses
|
(4,979)
|
(25,602)
|
(3,837)
|
-85.0%
|
-22.9%
|
|
Total Expenses
|
(81,153)
|
(110,498)
|
(109,252)
|
-1.1%
|
34.6%
|
|
Income tax
|
(3,795)
|
(13,274)
|
(16,052)
|
20.9%
|
323.0%
|
|
Net income
|
216,753
|
169,594
|
182,521
|
7.6%
|
-15.8%
|
|
(1)
|
Excluding investments in real estate.
|
|
(i)
|
private health insurance managed by Grupo Pacifico and included in its Financial Statements in each of the
accounting lines;
|
|
(ii)
|
corporate health insurance (dependent workers); and
|
|
(iii)
|
medical services.
|
|
|
|||
|
| |
Earnings Release 1Q / 2025
|
Analysis of 1Q25 Consolidated Results
|
|
12.
Appendix
|
| 12.6.9. |
Investment Management & Advisory *
|
|
Investment Management & Advisory *
|
|
Quarter
|
% change
|
||
|
S/ 000
|
1Q24
|
4Q24
|
1Q25
|
QoQ
|
YoY
|
|
Net interest income
|
6,460
|
(15,640)
|
10,441
|
-166.8%
|
61.6%
|
|
Other income
|
233,390
|
214,144
|
264,926
|
23.7%
|
13.5%
|
|
Fee income
|
145,099
|
145,476
|
150,272
|
3.3%
|
3.6%
|
|
Net gain on foreign exchange transactions
|
12,638
|
15,356
|
15,069
|
-1.9%
|
19.2%
|
|
Net gain on sales of securities
|
54,569
|
15,289
|
41,192
|
169.4%
|
-24.5%
|
|
Derivative Result
|
22,028
|
53,081
|
3,864
|
-92.7%
|
-82.5%
|
|
Result from exposure to the exchange rate
|
(12,973)
|
(21,323)
|
12,599
|
-159.1%
|
-197.1%
|
|
Other income
|
12,029
|
6,265
|
41,930
|
n.a.
|
n.a.
|
|
Operating expenses (1)
|
(180,091)
|
(145,999)
|
(202,074)
|
38.4%
|
12.2%
|
|
Operating income
|
59,759
|
52,505
|
73,293
|
39.6%
|
22.6%
|
|
Income taxes
|
(10,943)
|
(22,722)
|
(11,098)
|
-51.2%
|
1.4%
|
|
Non-controlling interest
|
2,576
|
156
|
152
|
-2.6%
|
-94.1%
|
|
Net income
|
46,240
|
29,627
|
62,043
|
109.4%
|
34.2%
|
| (1) |
Includes: Salaries and employee benefits + Administrative expenses + Assigned expenses + Depreciation and
amortization + Tax and contributions + Other expenses.
|
|
|
|||
|
| |
Earnings Release 1Q / 2025
|
Analysis of 1Q25 Consolidated Results
|
|
12. Appendix
|
| 12.7. |
Table of calculations
|
|
Table of calculations (1)
|
||
|
Profitability
|
Interest earning assets
|
Cash and due from banks+Total investments+Cash collateral, reverse repurchase agreements and securities borrowing+Loans |
|
Funding
|
Deposits and obligations+Due to banks and correspondents+BCRP instruments+Repurchase agreements with clients and third parties+Bonds and notes issued |
|
|
Net Interest Margin (NIM)
|
(Net Interest Income (excluding Net Insurance Financial Expenses) (Average Interest Earning Assets) |
|
|
Risk-adjusted Net
Interest Margin (Risk-
adjusted NIM)
|
(Annualized Net Interest Income (excluding Net Insurance Financial Expenses)-Annualized Provisions ) (Average period end and period beginning interest earning assets ) |
|
|
Funding cost
|
(Interest Expense (Does not Include Net Insurance Financial Expenses) (Average Funding ) |
|
|
Core income
|
Net Interest Income+Fee Income+Net Gain on Foreign exchange transactions |
|
|
Other core income
|
Fee Income+Net Gain on Foreign exchange transactions |
|
|
Other non-core income
|
Net Gain Securities+Net Gain from associates+Net Gain of derivatives held for trading+Net Gain from exchange differences+Other non operative income |
|
|
Return on average assets (ROA)
|
(Annualized Net Income attributable to Credicorp) (Average Assets) |
|
|
Return on average equity (ROE)
|
(Annualized Net Income attributable to Credicorp) (Average Net Equity) |
|
|
Portfolio
quality
|
Internal overdue ratio
|
(Internal overdue loans) (Total Loans) |
|
Non – performing loans ratio (NPL
ratio)
|
(Internal overdue loans+Refinanced loans) (Total Loans) |
|
|
Coverage ratio of internal overdue
loans
|
(Allowance for loans losses) (Internal overdue loans) |
|
|
Coverage ratio of non – performing loans
|
(Allowance for loans losses) (Non-performing loans) |
|
|
Cost of risk
|
(Annualized provision for credit losses on loans portfolio, net of recoveries ) (Average Total Loans) |
|
|
Operating performance
|
Operating expenses
|
Salaries and employees benefits+Administrtive expenses+Depreciation and amortization+Association in participation +Acquisition cost |
|
Operating Income
|
Net interest, similar income, and expenses+Fee income+Net gain on foreign exchange transactions+Net gain from associates+Net gain on derivatives held for trading+Net gain from echange differences+Net Insurance Underwriting Results |
|
|
Efficiency ratio
|
Salaries and employee benefits + Administrative expenses + Depreciation and amortization +
Association in participation
Net interest, similar income and expenses + Fee Income + Net gain on foreign exchange transactions +
Net gain from associates+Net gain on derivatives held for trading + Result on exchange differences+Insurance Underwriting Result
|
|
|
Capital
Adequacy
|
Liquidity Coverage ratio
|
Total High Quality Liquid Assets + Min(Total Inflow 30 days; 75% * Total Outflow 30
days)
Total Outflow 30 days
|
|
Regulatory Capital ratio
|
(Regulatory Capital) (Risk -weighted assets) |
|
|
Tier 1 ratio
|
Tier 1(2) Risk -weighted assets |
|
|
Common Equity Tier 1 ratio (3)
|
Capital+Reserves -100% of applicable deductions (4)+ Retained Earnings+Unrealized gains or losses Risk -weighted assets |
|
| (1) |
Averages are determined as the average of period-beginning and period-ending balances.
|
| (2) |
Includes investment in subsidiaries, goodwill, intangibles, and deferred tax that rely on future
profitability.
|
|
(3)
|
Common Equity Tier 1 = Capital Stock + Reserves + Accumulated earnings – Unrealized profits or
losses - 100% deductions (investment in subsidiaries, goodwill, intangible assets, and deferred tax assets based on future
returns).
|
| (4) |
Includes investment in subsidiaries, goodwill, intangible assets, and deferred taxes based on future
returns.
|
|
|
|||
|
| |
Earnings Release 1Q / 2025
|
Analysis of 1Q25 Consolidated Results
|
|
12. Appendix
|
| 12.8. |
Glossary of terms
|
|
Term
|
Definition
|
||
|
AFP
|
Administradora de Fondo de Pensiones or Private Pension Funds Administrators
|
||
|
BCRP
|
Banco Central de Reserva del Perú or Peruvian Central Bank
|
||
|
Financially Included
|
Stock of financially included clients through BCP since 2020. New clients with BCP
savings accounts or new Yape affiliates that: (i) Do not have debt in the financial system nor other
BCP products in the 12 months prior to their inclusion,
and (ii) Have performed at least 3 monthly transactions on average through any BCP channel in the last
3 months
|
||
|
GMV
|
Gross Merchant Volume
|
||
|
Government Program Loans (“GP” or “GP Loans”)
|
Loan Portfolio related to Reactiva Peru, FAE-Mype and Impulso Myperu programs to
respond quickly and effectively to liquidity needs and maintain the payment chain
|
||
|
MAU
|
Monthly Active Users
|
||
|
MEF
|
Ministry of Economy and Finance of Peru
|
||
|
TPV
|
Total Payment Volume
|