| Oklahoma |
001-38656
|
20-0764349 |
|
(State or other jurisdiction of incorporation)
|
(Commission File Number)
|
(IRS Employer Identification No.)
|
| ☐ |
Written communications pursuant to Rule 425 under the Securities Act (17 CFR 230.425)
|
| ☐ |
Soliciting material pursuant to Rule 14a-12 under the Exchange Act (17 CFR 240.14a-12)
|
| ☐ |
Pre-commencement communications pursuant to Rule 14d-2(b) under the Exchange Act (17 CFR 240.14d-2(b))
|
| ☐ |
Pre-commencement communications pursuant to Rule 13e-4(c) under the Exchange Act (17 CFR 240.13e-4(c))
|
|
Title of each class
|
Trading
Symbol(s)
|
Name of each exchange on which
registered
|
|
Common Stock, $0.01 par value
|
BSVN |
The NASDAQ Global Select Market
|
| |
Emerging growth company ☐ |
| Item 2.02. |
Results of Operations and Financial Condition
|
| Item 7.01 |
Regulation FD Disclosure
|
| Item 9.01 |
Financial Statements and Exhibits
|
|
(d)
|
Exhibits.
|
|
BANK7 CORP.
|
||
|
Date: April 10, 2025
|
By:
|
/s/ Kelly J. Harris
|
|
Kelly J. Harris
|
||
|
Executive Vice President and Chief Financial Officer
|
||
|
|
- |
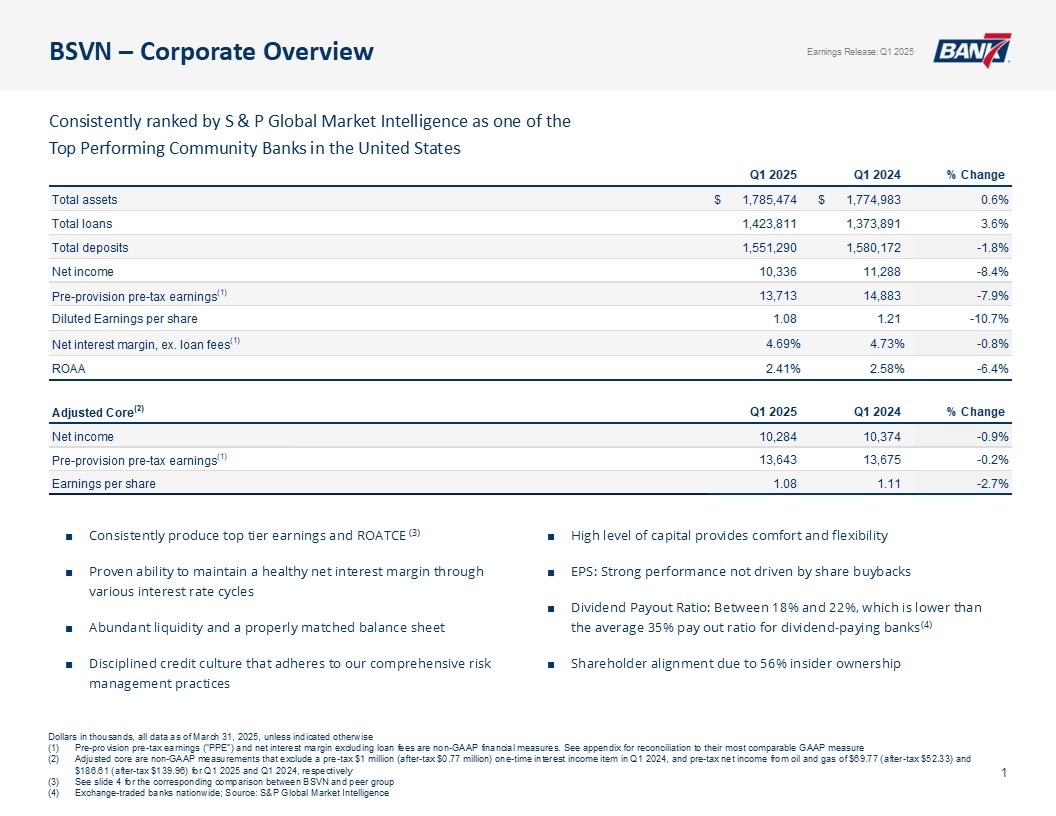
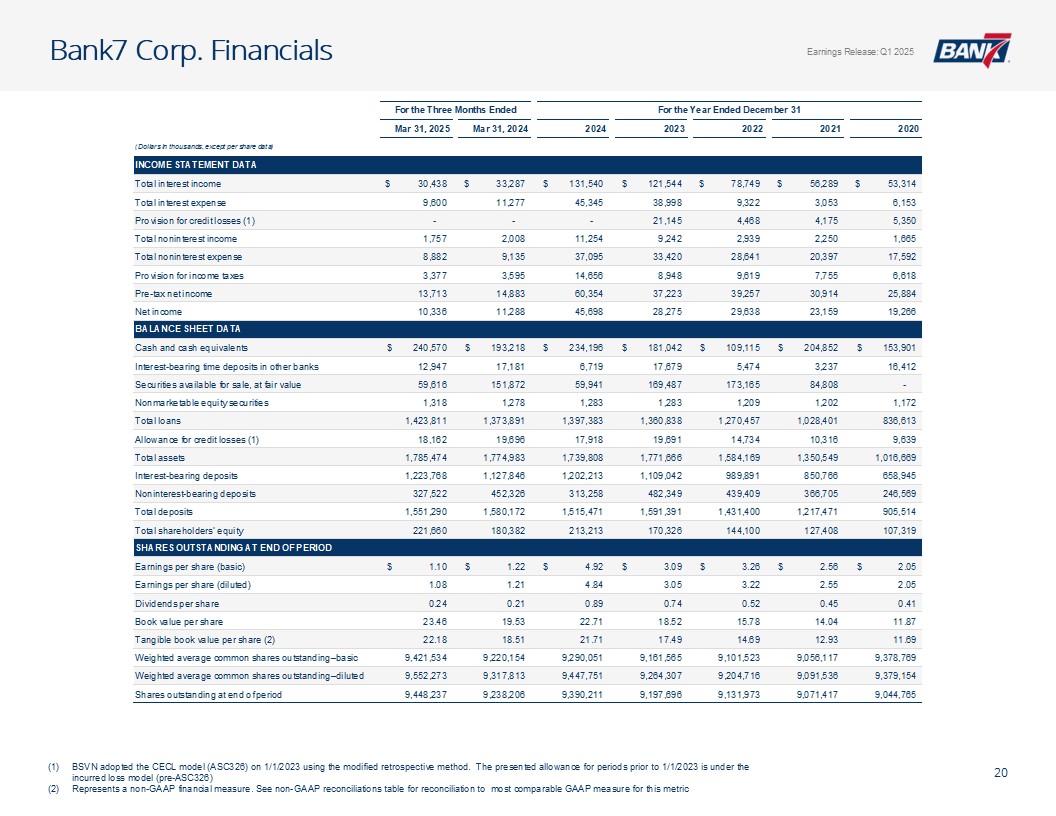
Net income of $10.3 million compared to $11.3 million, a decrease of 8.43%
|
|
|
- |
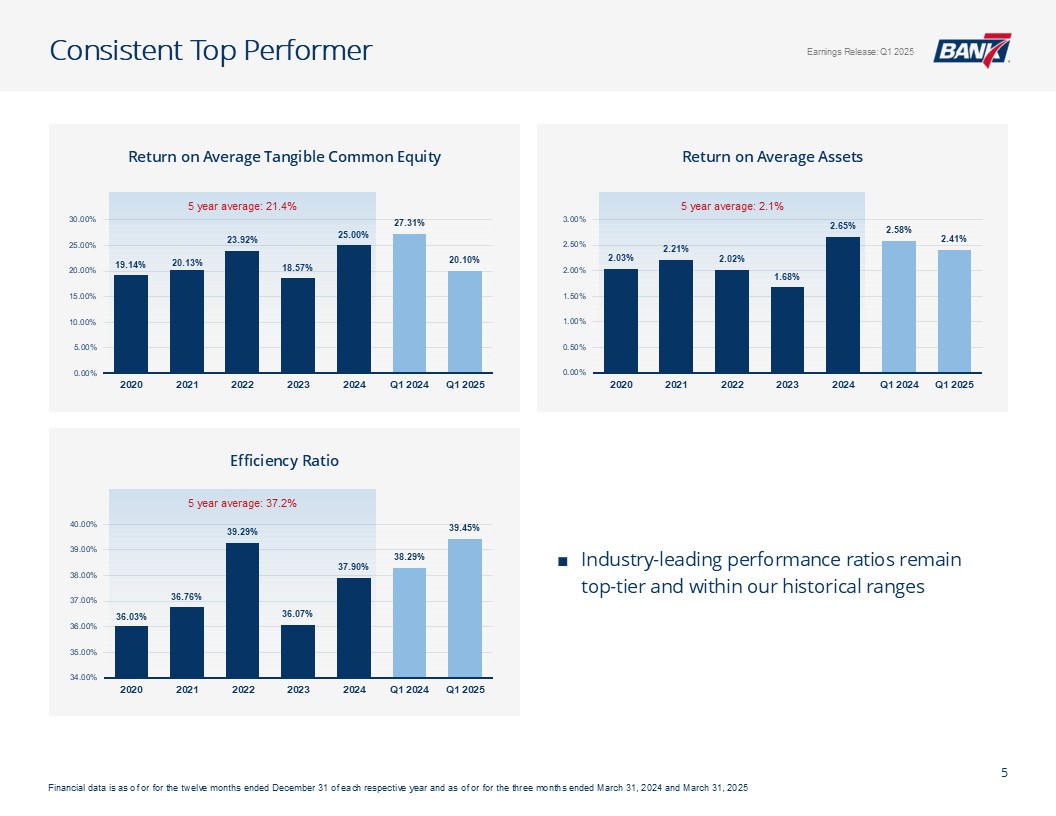
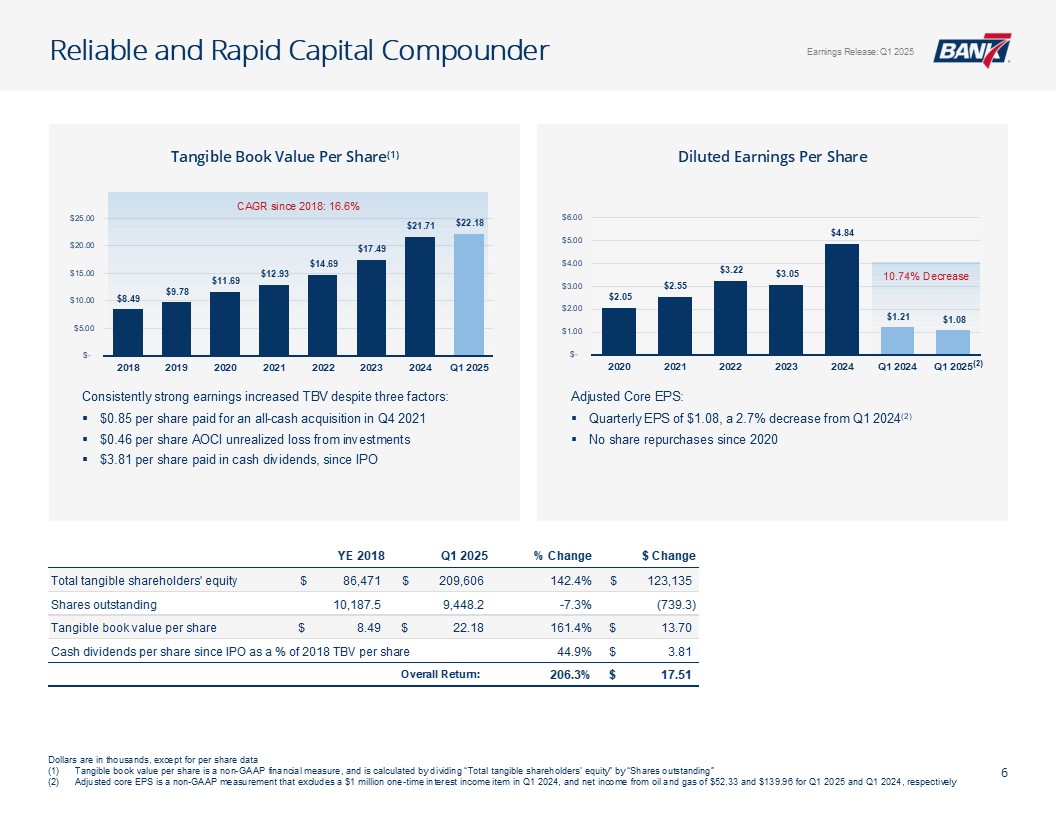
Earnings per share of $1.08 compared to $1.21, a decrease of 10.74%
|
|
|
- |
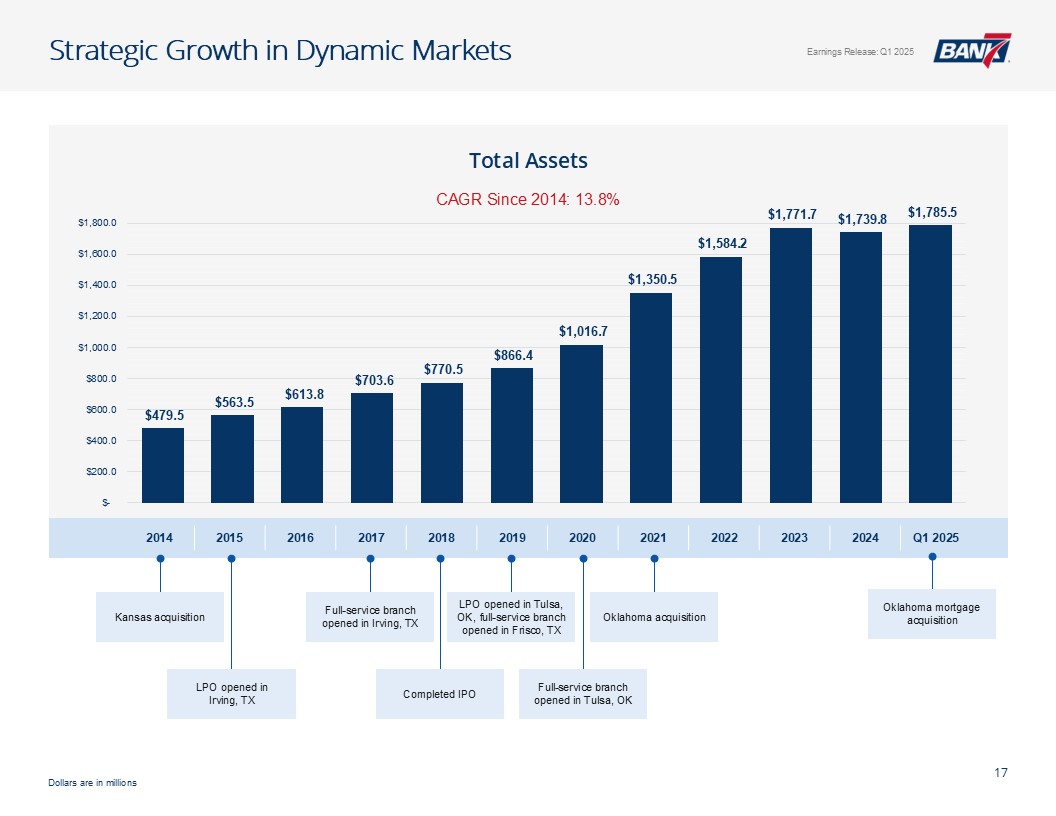
Total assets of $1.8 billion compared to $1.8 billion, an increase of 0.59%
|
|
|
- |
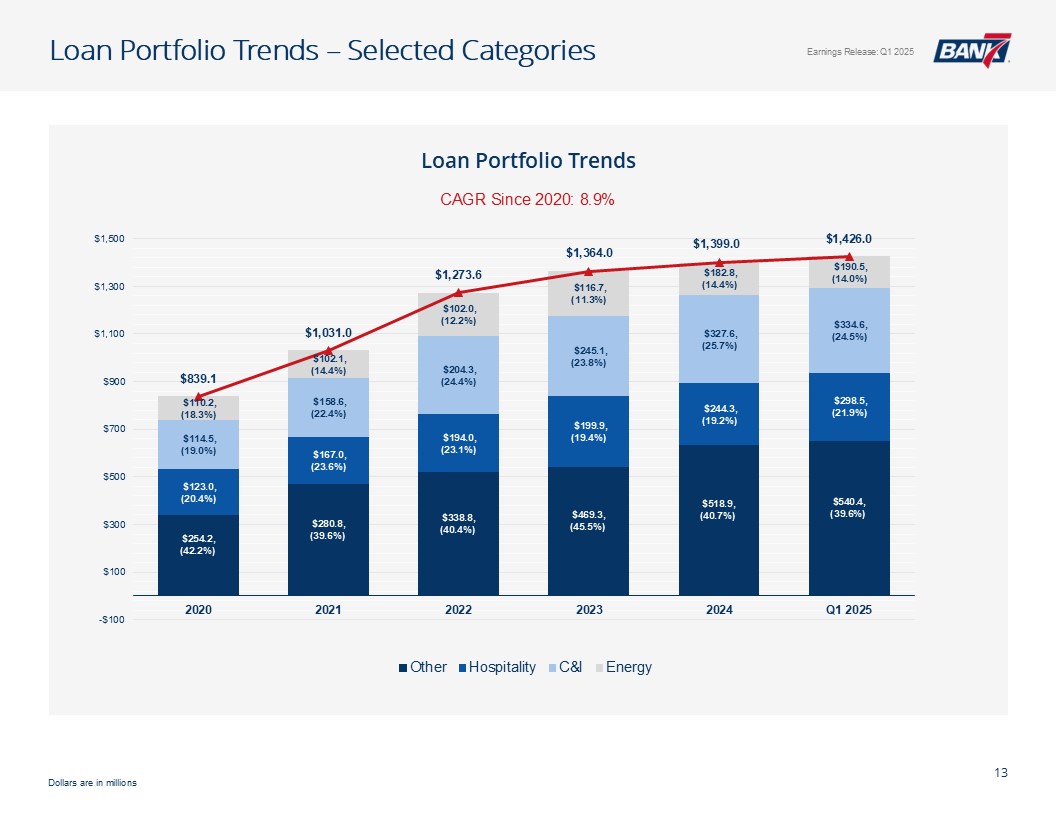
Total loans of $1.4 billion compared to $1.4 billion, an increase of 3.63%
|
|
|
- |
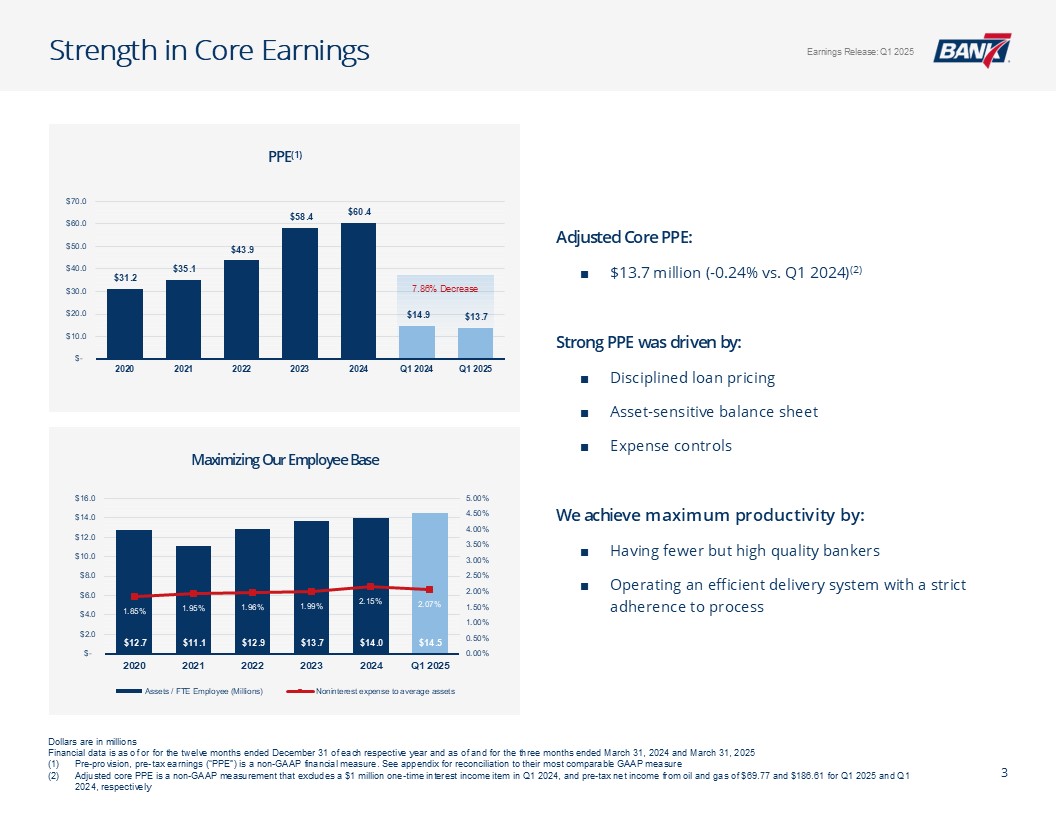
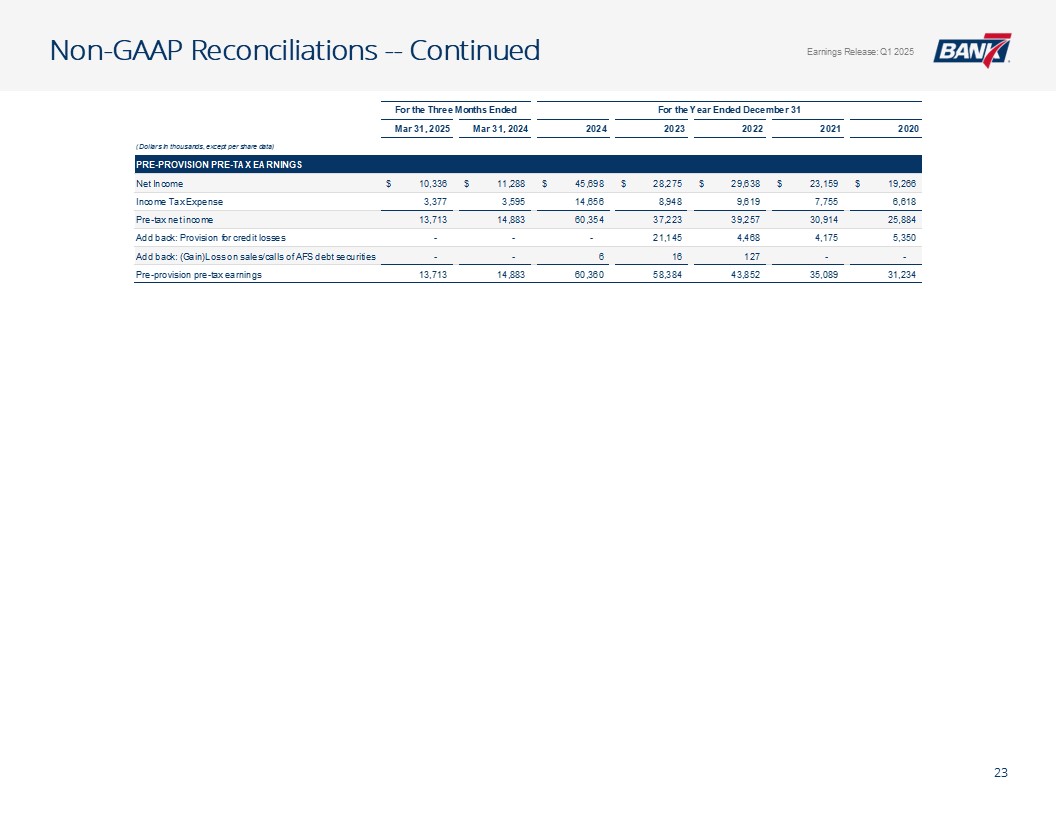
PPE of $13.7 million compared to $14.9 million, a decrease of 7.86%
|
|
|
- |
Total interest income of $30.4 million compared to $33.3 million, a decrease of 8.56%
|
|
For the Three Months Ended
|
||||||||
|
March 31,
2025
|
March 31,
2024
|
|||||||
|
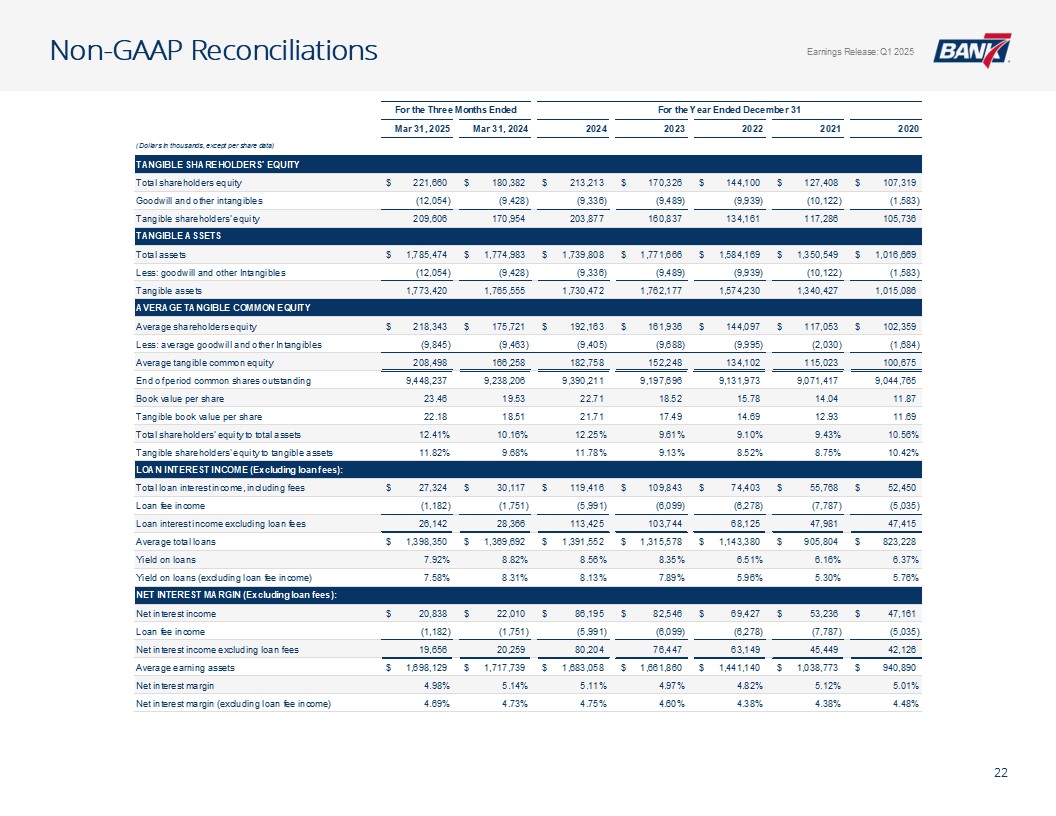
Calculation of Pre-Provision Pre-Tax Earnings ("PPE")
|
(Dollars in thousands)
|
|||||||
|
Net Income
|
$
|
10,336
|
$
|
11,288
|
||||
|
Income Tax Expense
|
3,377
|
3,595 | ||||||
|
Pre-tax net income
|
13,713
|
14,883
|
||||||
|
Add back: Provision for credit losses
|
-
|
- | ||||||
|
Add back: (Gain)Loss on sales/calls of AFS debt securities
|
- | - | ||||||
|
Pre-provision pre-tax earnings
|
13,713 |
14,883
|
||||||
|
Assets
|
March 31, 2025
(unaudited) |
December 31,
2024
|
||||||
|
|
||||||||
|
Cash and due from banks
|
$
|
240,570
|
$
|
234,196
|
||||
|
Interest-bearing time deposits in other banks
|
12,947
|
6,719
|
||||||
|
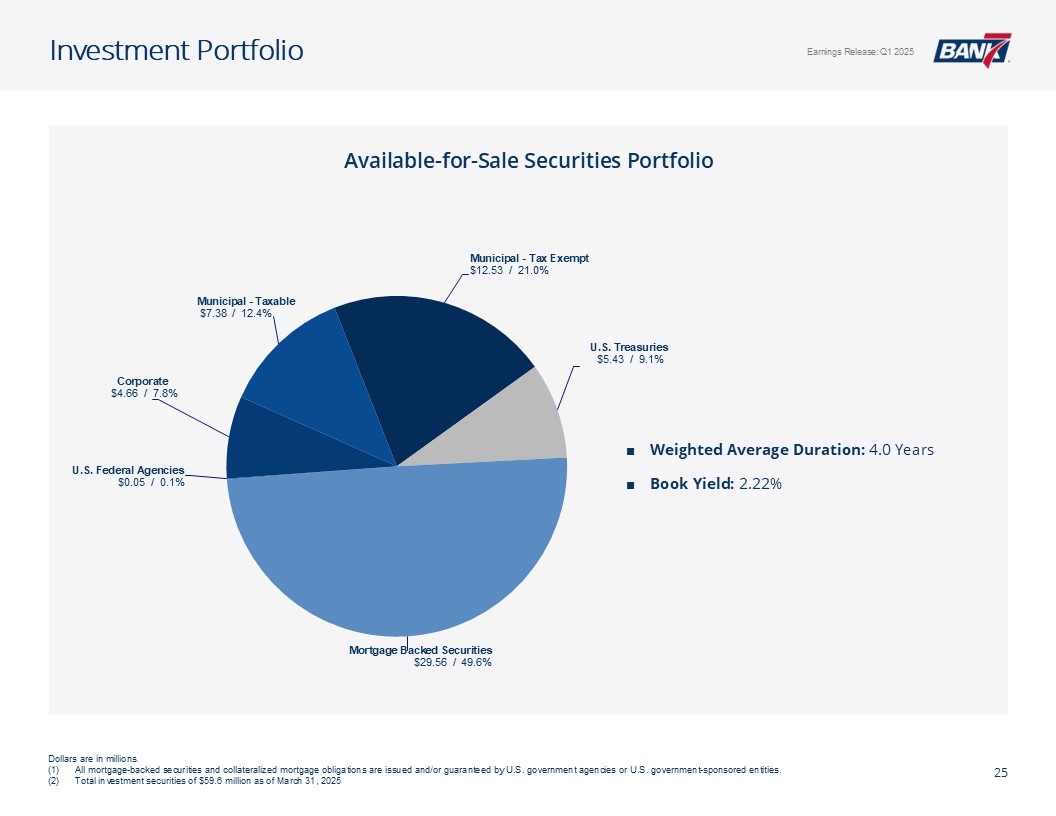
Available-for-sale debt securities
|
59,616
|
59,941
|
||||||
|
Loans, net of allowance for credit losses of $18,162 and $17,918 at March 31, 2025 and December 31, 2024, respectively
|
1,405,649
|
1,379,465
|
||||||
|
Loans held for sale, at fair value
|
2,068
|
-
|
||||||
|
Premises and equipment, net
|
20,721
|
18,137
|
||||||
|
Nonmarketable equity securities
|
1,318
|
1,283
|
||||||
|
Core deposit intangibles
|
846
|
878
|
||||||
|
Goodwill
|
11,208
|
8,458
|
||||||
|
Interest receivable and other assets
|
30,531
|
30,731
|
||||||
|
|
||||||||
|
Total assets
|
$
|
1,785,474
|
$
|
1,739,808
|
||||
|
|
||||||||
|
Liabilities and Shareholders’ Equity
|
||||||||
|
|
||||||||
|
Deposits
|
||||||||
|
Noninterest-bearing
|
$
|
327,522
|
$
|
313,258
|
||||
|
Interest-bearing
|
1,223,768
|
1,202,213
|
||||||
|
|
||||||||
|
Total deposits
|
1,551,290
|
1,515,471
|
||||||
|
|
||||||||
|
Income taxes payable
|
3,565
|
77
|
||||||
|
Interest payable and other liabilities
|
8,959
|
11,047
|
||||||
|
|
||||||||
|
Total liabilities
|
1,563,814
|
1,526,595
|
||||||
|
|
||||||||
|
Shareholders’ equity
|
||||||||
|
Common stock, $0.01 par value; 50,000,000 shares authorized; shares issued and outstanding: 9,448,237 and 9,390,211 at March 31, 2025 and
December 31, 2024, respectively
|
94
|
94
|
||||||
|
Additional paid-in capital
|
101,546
|
101,809
|
||||||
|
Retained earnings
|
124,349
|
116,281
|
||||||
|
Accumulated other comprehensive loss
|
(4,329
|
)
|
(4,971
|
)
|
||||
|
|
||||||||
|
Total shareholders’ equity
|
221,660
|
213,213
|
||||||
|
|
||||||||
|
Total liabilities and shareholders’ equity
|
$
|
1,785,474
|
$
|
1,739,808
|
||||
|
|
Three Months Ended
|
|||||||
|
|
March 31,
|
|||||||
|
|
2025
(unaudited) |
2024
(unaudited) |
||||||
|
Interest Income
|
||||||||
|
Loans, including fees
|
$
|
27,324
|
$
|
30,117
|
||||
|
Interest-bearing time deposits in other banks
|
101
|
253
|
||||||
|
Debt securities, taxable
|
283
|
1,012
|
||||||
|
Debt securities, tax-exempt
|
63
|
73
|
||||||
|
Other interest and dividend income
|
2,667
|
1,832
|
||||||
|
|
||||||||
|
Total interest income
|
30,438
|
33,287
|
||||||
|
|
||||||||
|
Interest Expense
|
||||||||
|
Deposits
|
9,600
|
11,277
|
||||||
|
|
||||||||
|
Total interest expense
|
9,600
|
11,277
|
||||||
|
|
||||||||
|
Net Interest Income
|
20,838
|
22,010
|
||||||
|
|
||||||||
|
Provision for Credit Losses
|
-
|
-
|
||||||
|
|
||||||||
|
Net Interest Income After Provision for Credit Losses
|
20,838
|
22,010
|
||||||
|
|
||||||||
|
Noninterest Income
|
||||||||
|
Mortgage lending income
|
93
|
51
|
||||||
|
Loss on sales, prepayments, and calls of available-for-sale debt securities
|
-
|
-
|
||||||
|
Service charges on deposit accounts
|
218
|
249
|
||||||
|
Other
|
1,446
|
1,708
|
||||||
|
|
||||||||
|
Total noninterest income
|
1,757
|
2,008
|
||||||
|
|
||||||||
|
Noninterest Expense
|
||||||||
|
Salaries and employee benefits
|
5,280
|
5,289
|
||||||
|
Furniture and equipment
|
250
|
230
|
||||||
|
Occupancy
|
592
|
661
|
||||||
|
Data and item processing
|
510
|
458
|
||||||
|
Accounting, marketing and legal fees
|
105
|
99
|
||||||
|
Regulatory assessments
|
83
|
386
|
||||||
|
Advertsing and public relations
|
194
|
145
|
||||||
|
Travel, lodging and entertainment
|
56
|
51
|
||||||
|
Other
|
1,812
|
1,816
|
||||||
|
|
||||||||
|
Total noninterest expense
|
8,882
|
9,135
|
||||||
|
|
||||||||
|
Income Before Taxes
|
13,713
|
14,883
|
||||||
|
Income tax expense
|
3,377
|
3,595
|
||||||
|
Net Income
|
$
|
10,336
|
$
|
11,288
|
||||
|
|
||||||||
|
Earnings per common share - basic
|
$
|
1.10
|
$
|
1.22
|
||||
|
Earnings per common share - diluted
|
1.08
|
1.21
|
||||||
|
Weighted average common shares outstanding - basic
|
9,421,534
|
9,220,154
|
||||||
|
Weighted average common shares outstanding - diluted
|
9,552,273
|
9,317,813
|
||||||
|
|
||||||||
|
Other comprehensive income (loss)
|
||||||||
|
Unrealized gains on securities, net of tax (expense) benefit of ($237) and $0 for the three months ended March 31, 2025 and 2024, respectively
|
$
|
642
|
$
|
456
|
||||
|
Reclassification adjustment for realized losses included in net income net of tax of $0 and $0 for the three months March 31, 2025 and 2024, respectively
|
-
|
-
|
||||||
|
Other comprehensive income (loss)
|
$
|
642
|
$
|
456
|
||||
|
Comprehensive Income
|
$
|
10,978
|
$
|
11,744
|
||||
|
|
Net Interest Margin
|
|||||||||||||||||||||||
|
|
For the Three Months Ended March 31,
|
|||||||||||||||||||||||
|
|
2025
(unaudited) |
2024
(unaudited) |
||||||||||||||||||||||
|
|
Average
Balance |
Interest
Income/ Expense |
Average
Yield/ Rate |
Average
Balance |
Interest
Income/ Expense |
Average
Yield/ Rate |
||||||||||||||||||
|
|
(Dollars in thousands)
|
|||||||||||||||||||||||
|
Interest-Earning Assets:
|
||||||||||||||||||||||||
|
Short-term investments
|
$
|
238,048
|
$
|
2,768
|
4.72
|
%
|
$
|
176,072
|
$
|
2,085
|
4.75
|
%
|
||||||||||||
|
Debt securities, taxable-equivalent
|
48,637
|
283
|
2.36
|
153,468
|
1,012
|
2.64
|
||||||||||||||||||
|
Debt securities, tax exempt
|
12,514
|
63
|
2.04
|
18,269
|
73
|
1.60
|
||||||||||||||||||
|
Loans held for sale
|
580
|
-
|
-
|
238
|
-
|
-
|
||||||||||||||||||
|
Total loans(1)
|
1,398,350
|
27,324
|
7.92
|
1,369,692
|
30,117
|
8.82
|
||||||||||||||||||
|
Total interest-earning assets
|
1,698,129
|
30,438
|
7.27
|
1,717,739
|
33,287
|
7.77
|
||||||||||||||||||
|
Noninterest-earning assets
|
39,957
|
39,769
|
||||||||||||||||||||||
|
Total assets
|
$
|
1,738,086
|
$
|
1,757,508
|
||||||||||||||||||||
|
|
||||||||||||||||||||||||
|
Funding sources:
|
||||||||||||||||||||||||
|
Interest-bearing liabilities:
|
||||||||||||||||||||||||
|
Deposits:
|
||||||||||||||||||||||||
|
Transaction accounts
|
$
|
956,891
|
7,118
|
3.02
|
%
|
$
|
845,129
|
8,196
|
3.89
|
%
|
||||||||||||||
|
Time deposits
|
236,325
|
2,482
|
4.26
|
264,973
|
3,081
|
4.66
|
||||||||||||||||||
|
Total interest-bearing deposits
|
1,193,216
|
9,600
|
3.26
|
1,110,102
|
11,277
|
4.07
|
||||||||||||||||||
|
Total interest-bearing liabilities
|
$
|
1,193,216
|
9,600
|
3.26
|
$
|
1,110,102
|
11,277
|
4.07
|
||||||||||||||||
|
|
||||||||||||||||||||||||
|
Noninterest-bearing liabilities:
|
||||||||||||||||||||||||
|
Noninterest-bearing deposits
|
$
|
316,544
|
$
|
460,028
|
||||||||||||||||||||
|
Other noninterest-bearing liabilities
|
9,983
|
11,657
|
||||||||||||||||||||||
|
Total noninterest-bearing liabilities
|
326,527
|
471,685
|
||||||||||||||||||||||
|
Shareholders' equity
|
218,343
|
175,721
|
||||||||||||||||||||||
|
Total liabilities and shareholders' equity
|
$
|
1,738,086
|
$
|
1,757,508
|
||||||||||||||||||||
|
|
||||||||||||||||||||||||
|
Net interest income
|
$
|
20,838
|
$
|
22,010
|
||||||||||||||||||||
|
Net interest spread
|
4.01
|
%
|
3.70
|
%
|
||||||||||||||||||||
|
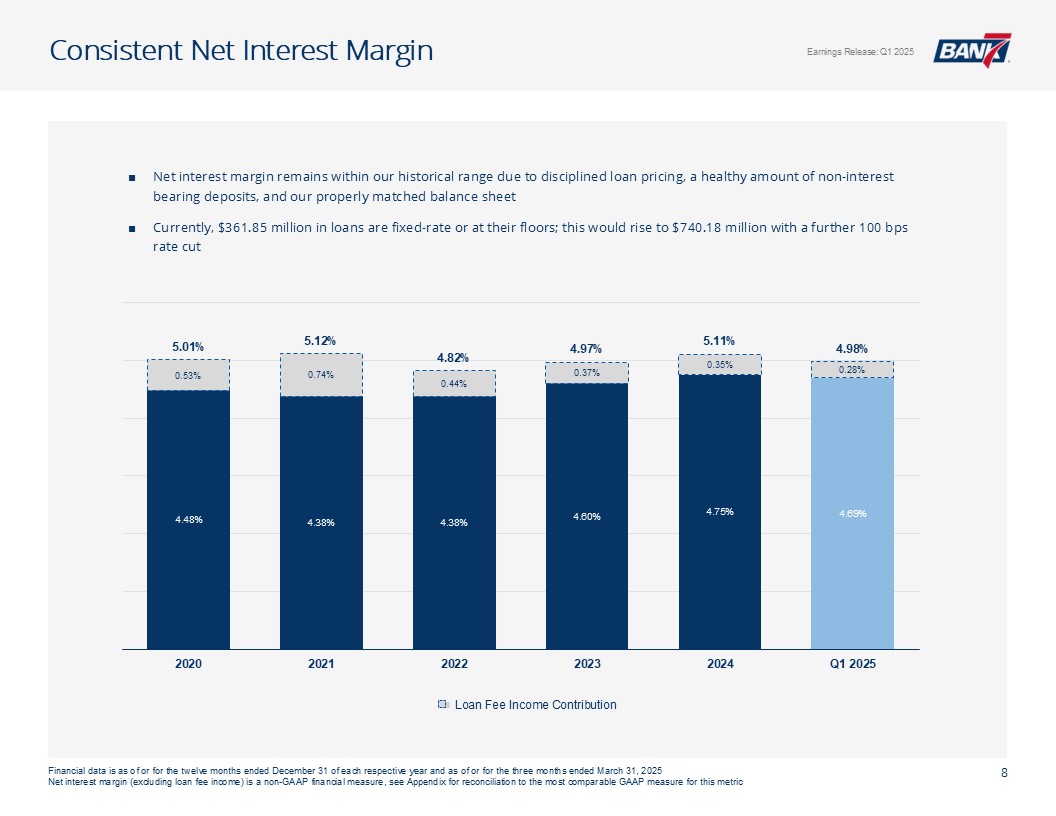
Net interest margin
|
4.98
|
%
|
5.14
|
%
|
||||||||||||||||||||
|
(1)
|
Nonaccrual loans are included in total loans
|