| ☑ |
ANNUAL REPORT PURSUANT TO SECTION 13 OR 15(d) OF THE SECURITIES EXCHANGE ACT OF 1934
|
| ☐ |
TRANSITION REPORT PURSUANT TO SECTION 13 OR 15(d) OF THE SECURITIES EXCHANGE ACT OF 1934
|
|
Delaware
|
23-2424711
|
|
|
(State or other jurisdiction of
incorporation or organization)
|
(I.R.S. Employer
Identification No.)
|
|
|
1195 River Road, Marietta, Pennsylvania
|
17547
|
|
|
(Address of principal executive offices)
|
(Zip code)
|
|
Title of Each Class
|
Trading Symbols
|
Name of Each Exchange on Which Registered
|
||
|
Class A Common Stock, $.01 par value
|
DGICA
|
The NASDAQ Global Select Market
|
||
|
Class B Common Stock, $.01 par value
|
DGICB
|
The NASDAQ Global Select Market
|
|
Large accelerated filer ☐
|
Accelerated filer ☑
|
Non-accelerated filer ☐
|
Smaller reporting company ☐
|
|
Emerging growth company ☐
|
|
Page
|
||
|
PART I
|
||
|
Item 1.
|
1
|
|
|
Item 1A.
|
26
|
|
|
Item 1B.
|
40
|
|
|
Item 1C.
|
40
|
|
|
Item 2.
|
41 | |
|
Item 3.
|
41 |
|
|
Item 4.
|
41
|
|
|
PART II
|
||
|
Item 5.
|
41
|
|
|
Item 6.
|
43
|
|
|
Item 7.
|
44
|
|
|
Item 7A.
|
60 | |
|
Item 8.
|
62
|
|
|
Item 9.
|
107
|
|
|
Item 9A.
|
107 | |
|
Item 9B.
|
107
|
|
| Item 9C. | Disclosure Regarding Foreign Jurisdiction that Prevent Inspections. | 107 |
|
PART III
|
||
|
Item 10.
|
109
|
|
|
Item 11.
|
109 | |
|
Item 12.
|
109 | |
|
Item 13.
|
109 | |
|
Item 14.
|
109 | |
|
PART IV
|
||
|
Item 15.
|
110
|
|
|
Item 16.
|
112
|
| Item 1. |
Business.
|
|
(1)
|
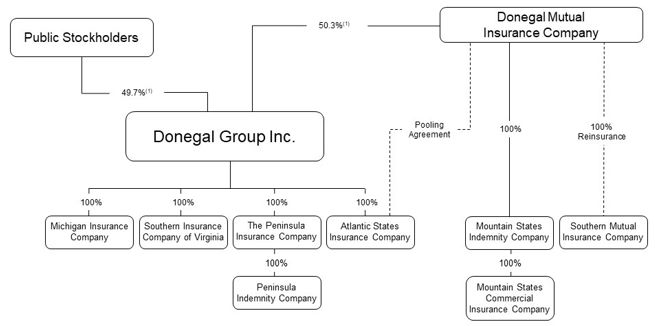
Because of the different relative voting power of our Class A common stock and our Class B common stock, our public stockholders hold approximately 30% of the combined voting power of our Class A common stock and our Class B common
stock and Donegal Mutual holds approximately 70% of the combined voting power of our Class A common stock and our Class B common stock.
|
|
|
• |
both of our members on the coordinating committee must determine that the new agreement or the change in an existing agreement is fair and equitable to us and in the best interests of our stockholders;
|
|
|
• |
both of Donegal Mutual’s members on the coordinating committee must determine that the new agreement or the change in an existing agreement is fair and equitable to Donegal Mutual and in the best interests of its policyholders;
|
|
|
• |
our board of directors must approve the new agreement or the change in an existing agreement; and
|
|
|
• |
Donegal Mutual’s board of directors must approve the new agreement or the change in an existing agreement.
|
|
|
• |
enabling our stable management, the consistent underwriting discipline of our insurance subsidiaries, external growth, long-term profitability and financial strength;
|
|
|
• |
creating operational and expense synergies from the combination of resources and integrated operations of the Donegal Insurance Group;
|
|
|
• |
producing more stable and uniform underwriting results for our insurance subsidiaries over extended periods of time than we could achieve without our relationship with Donegal Mutual;
|
|
|
• |
providing opportunities for growth because of the ability of Donegal Mutual to affiliate and enter into reinsurance agreements with, or otherwise acquire control of, mutual insurance companies and place the business it assumes into
the underwriting pool; and
|
|
|
• |
providing Atlantic States with a significantly larger underwriting capacity because of the underwriting pool Donegal Mutual and Atlantic States have maintained since 1986.
|
|
|
2024
|
2023
|
2022
|
2021
|
2020
|
|||||||||||||||
|
Our GAAP combined ratio
|
98.6
|
%
|
104.4
|
%
|
103.3
|
%
|
101.0
|
%
|
96.0
|
%
|
||||||||||
|
Our SAP combined ratio
|
98.3
|
104.2
|
103.3
|
100.8
|
95.4
|
|||||||||||||||
|
Industry SAP combined ratio (1)
|
98.9
|
101.9
|
103.1
|
100.0
|
98.8
|
|||||||||||||||
| (1) |
As reported (projected for 2024) by A.M. Best Company.
|
|
|
• |
Achieving sustained excellent financial performance.
|
|
|
• |
carefully selecting the product lines, classes of business and individual risks they underwrite;
|
|
|
• |
executing localized strategies to achieve a mix of business they expect will generate targeted margins of profitability;
|
|
|
• |
monitoring premium rate adequacy and adjusting premium rates to achieve targeted growth, returns and retention levels;
|
|
|
• |
utilizing enhanced underwriting and technology tools to inform underwriting decisions and determine coverage availability;
|
|
|
• |
utilizing data analytics and predictive modeling tools to inform risk selection and pricing decisions;
|
|
|
• |
utilizing economic capital modeling tools to carefully manage the geographic concentration of risks they underwrite; and
|
|
|
• |
evaluating their claims history on a regular basis to ensure the adequacy of their underwriting guidelines and product pricing.
|
|
|
• |
Strategically modernizing our operations and processes to transform our business.
|
|
|
• |
Capitalizing on opportunities to grow profitably.
|
|
|
• |
Delivering a superior experience to our agents and policyholders.
|
|
|
• |
training programs;
|
|
|
• |
marketing support;
|
|
|
• |
availability of a personal lines service center that provides comprehensive service for our personal lines policyholders;
|
|
|
• |
availability of a commercial lines small business unit to monitor straight-through processing results and enhance turnaround time for responses to agents for less complicated commercial risks;
|
|
|
• |
availability of a commercial lines service center, which is an optional service enhancement for agencies who prefer that we interact directly with their customers for mid-term policy coverage changes and other service requests; and
|
|
|
• |
accessibility to and regular interactions with marketing and underwriting personnel and senior management of our insurance subsidiaries.
|
|
|
• |
availability of a customer call center, secure website and mobile application for claims reporting;
|
|
|
• |
availability of a secure website and mobile application for access to policy information and documents, payment processing and other features;
|
|
|
• |
timely replies to information requests and policy submissions; and
|
|
|
• |
prompt responses to, and processing of, claims.
|
|
|
• |
Acquiring property and casualty insurance companies to augment the organic growth of our insurance subsidiaries.
|
|
Company Name
|
State of Domicile
|
Year Control Acquired
|
Method of Acquisition/Affiliation
|
|||
|
Southern Heritage Insurance
Company (1)
|
Georgia
|
1998
|
Purchase of stock by us in 1998.
|
|||
|
Le Mars Mutual Insurance
Company of Iowa and then Le Mars Insurance Company (1)
|
Iowa
|
2002
|
Surplus note investment by Donegal Mutual in 2002; conversion to stock company in 2004; acquisition of stock by us in 2004.
|
|||
|
Peninsula Insurance Group
|
Maryland
|
2004
|
Purchase of stock by us in 2004.
|
|||
|
Sheboygan Falls Mutual Insurance Company and then Sheboygan Falls Insurance Company (1)
|
Wisconsin
|
2007
|
Contribution note investment by Donegal Mutual in 2007; conversion to stock company in 2008; acquisition of stock by us in 2008.
|
|||
|
Southern Mutual Insurance
Company (2)
|
Georgia
|
2009
|
Surplus note investment by Donegal Mutual and quota-share reinsurance in 2009.
|
|||
|
Michigan Insurance Company
|
Michigan
|
2010
|
Purchase of stock by us in 2010.
|
|||
|
Mountain States Mutual Casualty Company(3)
|
New Mexico
|
2017
|
Merger with and into Donegal Mutual in 2017.
|
|
|
(1) |
To reduce administrative and compliance costs and expenses, these subsidiaries subsequently merged into one of our existing insurance subsidiaries.
|
|
|
(2) |
Control acquired by Donegal Mutual.
|
|
|
(3) |
Donegal Mutual completed the merger of Mountain States Mutual Casualty Company with and into Donegal Mutual effective May 25, 2017. Donegal Mutual was the surviving company in the merger, and Mountain States insurance subsidiaries
became insurance subsidiaries of Donegal Mutual upon completion of the merger. Donegal Mutual also entered into a 100% quota-share reinsurance agreement with the Mountain States insurance subsidiaries on the merger date. Beginning with
policies effective in 2021, Donegal Mutual places the business of the Mountain States insurance subsidiaries into the underwriting pool.
|
|
|
• |
Commercial automobile — policies that provide protection against liability for bodily injury and property damage arising from automobile accidents and protection against loss from damage to automobiles owned by the insured.
|
|
|
• |
Commercial multi-peril — policies that provide protection to businesses against many perils, usually combining liability and physical damage coverages.
|
|
|
• |
Workers’ compensation — policies employers purchase to provide benefits to employees for injuries sustained during employment. The workers’ compensation laws of each state determine the extent of the coverage we provide.
|
|
|
• |
Private passenger automobile — policies that provide protection against liability for bodily injury and property damage arising from automobile accidents and protection against loss from damage to automobiles owned by the insured.
|
|
|
• |
Homeowners — policies that provide coverage for damage to residences and their contents from a broad range of perils, including fire, lightning, windstorm and theft. These policies also cover liability of the insured arising from
injury to other persons or their property while on the insured’s property and under other specified conditions.
|
|
Year Ended December 31,
|
||||||||||||||||||||||||
|
2024
|
2023
|
2022
|
||||||||||||||||||||||
|
(dollars in thousands)
|
Amount
|
%
|
Amount
|
%
|
Amount
|
%
|
||||||||||||||||||
|
Commercial lines:
|
||||||||||||||||||||||||
|
Automobile
|
$
|
184,989
|
19.6
|
%
|
$
|
174,741
|
19.5
|
%
|
$
|
167,774
|
19.9
|
%
|
||||||||||||
|
Workers’ compensation
|
103,533
|
11.0
|
107,598
|
12.0
|
111,892
|
13.3
|
||||||||||||||||||
|
Commercial multi-peril
|
213,959
|
22.7
|
195,632
|
21.8
|
200,045
|
23.7
|
||||||||||||||||||
|
Other
|
45,439
|
4.9
|
50,458
|
5.7
|
51,135
|
6.0
|
||||||||||||||||||
|
Total commercial lines
|
547,920
|
58.2
|
528,429
|
59.0
|
530,846
|
62.9
|
||||||||||||||||||
|
Personal lines:
|
||||||||||||||||||||||||
|
Automobile
|
243,036
|
25.8
|
215,957
|
24.1
|
181,129
|
21.5
|
||||||||||||||||||
|
Homeowners
|
140,613
|
14.9
|
139,688
|
15.6
|
120,087
|
14.2
|
||||||||||||||||||
|
Other
|
10,712
|
1.1
|
11,623
|
1.3
|
11,468
|
1.4
|
||||||||||||||||||
|
Total personal lines
|
394,361
|
41.8
|
367,268
|
41.0
|
312,684
|
37.1
|
||||||||||||||||||
|
Total business
|
$
|
942,281
|
100.0
|
%
|
$
|
895,697
|
100.0
|
%
|
$
|
843,530
|
100.0
|
%
|
||||||||||||
|
|
• |
assess and select primarily standard and preferred risks;
|
|
|
• |
adhere to disciplined underwriting guidelines;
|
|
|
• |
seek to price risks appropriately based on exposure, risk characteristics, utilization of predictive models and application of underwriting judgment; and
|
|
|
• |
utilize various types of risk management and loss control services.
|
|
Pennsylvania
|
37.6
|
%
|
|
|
Michigan
|
15.9
|
||
|
Maryland
|
8.2
|
||
|
Delaware
|
6.6
|
||
|
Virginia
|
6.1
|
||
|
Ohio
|
4.0
|
||
|
Wisconsin
|
2.9
|
||
|
Indiana
|
2.7
|
||
|
Georgia
|
2.6
|
||
|
North Carolina
|
2.3
|
||
|
Texas
|
2.2
|
||
|
Other
|
8.9
|
||
|
Total
|
100.0
|
%
|
|
Year Ended December 31,
|
||||||||||||
|
(in thousands)
|
2024
|
2023
|
2022
|
|||||||||
|
Gross liability for unpaid losses and loss expenses at beginning of year
|
$
|
1,126,157
|
$
|
1,121,046
|
$
|
1,077,620
|
||||||
|
Less reinsurance recoverable
|
437,014
|
451,184
|
451,261
|
|||||||||
|
Cumulative effect of adoption of updated accounting guidance for credit losses at January 1
|
—
|
1,132
|
—
|
|||||||||
|
Net liability for unpaid losses and loss expenses at beginning of year
|
689,143
|
670,994
|
626,359
|
|||||||||
|
Provision for net losses and loss expenses for claims incurred in the current year
|
619,090
|
625,831
|
608,900
|
|||||||||
|
Change in provision for estimated net losses and loss expenses for claims incurred in prior years
|
(14,972
|
)
|
(16,653
|
)
|
(44,821
|
)
|
||||||
|
Total incurred
|
604,118
|
609,178
|
564,079
|
|||||||||
|
Net losses and loss expense payments for claims incurred during:
|
||||||||||||
|
The current year
|
319,196
|
330,290
|
302,272
|
|||||||||
|
Prior years
|
269,701
|
260,739
|
218,304
|
|||||||||
|
Total paid
|
588,897
|
591,029
|
520,576
|
|||||||||
|
Net liability for unpaid losses and loss expenses at end of year
|
704,364
|
689,143
|
669,862
|
|||||||||
|
Plus reinsurance recoverable
|
416,621
|
437,014
|
451,184
|
|||||||||
|
Gross liability for unpaid losses and loss expenses at end of year
|
$
|
1,120,985
|
$
|
1,126,157
|
$
|
1,121,046
|
||||||
|
Year Ended December 31,
|
||||||||||||||||||||||||||||||||||||||||||||
|
(in thousands)
|
2014
|
2015
|
2016
|
2017
|
2018
|
2019
|
2020
|
2021
|
2022
|
2023
|
2024
|
|||||||||||||||||||||||||||||||||
|
Net liability at end of
year for unpaid
losses and loss
expenses
|
$
|
292,301
|
$
|
322,054
|
$
|
347,518
|
$
|
383,401
|
$
|
475,398
|
$
|
506,906
|
$
|
557,189
|
$
|
626,359
|
$
|
669,862
|
$
|
689,143
|
$
|
704,364
|
||||||||||||||||||||||
|
Net liability re-estimated as of:
|
||||||||||||||||||||||||||||||||||||||||||||
|
One year later
|
299,501
|
325,043
|
354,139
|
419,032
|
462,466
|
493,961
|
525,981
|
581,538
|
653,209
|
674,171
|
||||||||||||||||||||||||||||||||||
|
Two years later
|
299,919
|
329,115
|
375,741
|
413,535
|
450,862
|
479,927
|
498,724
|
564,326
|
638,428
|
|||||||||||||||||||||||||||||||||||
|
Three years later
|
304,855
|
338,118
|
376,060
|
404,902
|
440,168
|
463,441
|
490,177
|
550,972
|
||||||||||||||||||||||||||||||||||||
|
Four years later
|
307,840
|
339,228
|
372,230
|
398,560
|
432,027
|
459,835
|
480,865
|
|||||||||||||||||||||||||||||||||||||
|
Five years later
|
310,354
|
338,020
|
370,960
|
396,695
|
431,115
|
455,494
|
||||||||||||||||||||||||||||||||||||||
|
Six years later
|
310,380
|
338,200
|
372,346
|
396,748
|
429,865
|
|||||||||||||||||||||||||||||||||||||||
|
Seven years later
|
311,594
|
339,625
|
371,859
|
396,167
|
||||||||||||||||||||||||||||||||||||||||
|
Eight years later
|
313,354
|
340,191
|
372,477
|
|||||||||||||||||||||||||||||||||||||||||
|
Nine years later
|
313,539
|
340,800
|
||||||||||||||||||||||||||||||||||||||||||
|
Ten years later
|
314,490
|
|||||||||||||||||||||||||||||||||||||||||||
|
Cumulative
deficiency
(excess)
|
22,189
|
18,746
|
24,959
|
12,766
|
(45,533
|
)
|
(51,412
|
)
|
(76,324
|
)
|
(75,387
|
)
|
(31,434
|
)
|
(14,972
|
)
|
||||||||||||||||||||||||||||
|
Cumulative amount of liability paid through:
|
||||||||||||||||||||||||||||||||||||||||||||
|
One year later
|
$
|
131,779
|
$
|
149,746
|
$
|
163,005
|
$
|
175,883
|
$
|
195,956
|
$
|
172,497
|
$
|
182,223
|
$
|
218,304
|
$
|
260,739
|
$
|
269,701
|
||||||||||||||||||||||||
|
Two years later
|
206,637
|
228,506
|
250,678
|
276,331
|
275,993
|
276,069
|
297,860
|
346,107
|
405,216
|
|||||||||||||||||||||||||||||||||||
|
Three years later
|
251,654
|
274,235
|
306,338
|
317,447
|
335,310
|
343,912
|
374,043
|
426,648
|
||||||||||||||||||||||||||||||||||||
|
Four years later
|
274,248
|
300,715
|
324,628
|
342,583
|
371,231
|
393,068
|
418,283
|
|||||||||||||||||||||||||||||||||||||
|
Five years later
|
287,178
|
309,630
|
337,946
|
362,061
|
394,251
|
414,690
|
||||||||||||||||||||||||||||||||||||||
|
Six years later
|
292,327
|
315,105
|
349,496
|
372,584
|
404,251
|
|||||||||||||||||||||||||||||||||||||||
|
Seven years later
|
295,106
|
321,777
|
355,809
|
378,937
|
||||||||||||||||||||||||||||||||||||||||
|
Eight years later
|
300,306
|
326,617
|
359,527
|
|||||||||||||||||||||||||||||||||||||||||
|
Nine years later
|
303,708
|
329,651
|
||||||||||||||||||||||||||||||||||||||||||
|
Ten years later
|
306,019
|
|||||||||||||||||||||||||||||||||||||||||||
|
Year Ended December 31,
|
||||||||||||||||||||||||||||||||||||
|
(in thousands)
|
2016
|
2017
|
2018
|
2019
|
2020
|
2021
|
2022
|
2023
|
2024
|
|||||||||||||||||||||||||||
|
Gross liability at end of year
|
$
|
606,665
|
$
|
676,672
|
$
|
814,665
|
$
|
869,674
|
$
|
962,007
|
$
|
1,077,620
|
$
|
1,121,046
|
$
|
1,126,157
|
$
|
1,120,985
|
||||||||||||||||||
|
Reinsurance recoverable
|
259,147
|
293,271
|
339,266
|
362,768
|
404,818
|
451,261
|
451,184
|
437,014
|
416,621
|
|||||||||||||||||||||||||||
|
Net liability at end of
year
|
347,518
|
383,401
|
475,398
|
506,906
|
557,189
|
626,359
|
669,862
|
689,143
|
704,364
|
|||||||||||||||||||||||||||
|
Gross re-estimated liability
|
621,200
|
674,826
|
751,479
|
787,575
|
869,571
|
938,746
|
1,011,779
|
1,072,359
|
||||||||||||||||||||||||||||
|
Re-estimated recoverable
|
248,723
|
278,659
|
321,614
|
332,081
|
388,706
|
387,774
|
373,351
|
398,188
|
||||||||||||||||||||||||||||
|
Net re-estimated liability
|
372,477
|
396,167
|
429,865
|
455,494
|
480,865
|
550,972
|
638,428
|
674,171
|
||||||||||||||||||||||||||||
|
Gross cumulative deficiency (excess)
|
14,535
|
(1,846
|
)
|
(63,186
|
)
|
(82,099
|
)
|
(92,436
|
)
|
(138,874
|
)
|
(109,267
|
)
|
(53,798
|
)
|
|||||||||||||||||||||
|
|
• |
excess of loss reinsurance, under which Donegal Mutual and our insurance subsidiaries recovered losses over a set retention of $4.0 million for all property losses and $3.0 million for all liability and workers’ compensation losses
for 2024 (set retention of $4.0 million for all property losses, $6.0 million for all liability losses except workers’ compensation losses and $3.0 million for all workers’ compensation losses for 2025); and
|
|
|
• |
catastrophe reinsurance, under which Donegal Mutual and our insurance subsidiaries recovered 100% of an accumulation of many losses resulting from a single event, including natural disasters, over a set retention of $25.0 million up
to aggregate losses of $175.0 million ($200.0 million for 2025) per occurrence.
|
|
(dollars in thousands)
|
December 31, 2024
|
|||||||
|
Rating(1)
|
Amount
|
Percent
|
||||||
|
U.S. Treasury and U.S. agency securities(2)
|
$
|
474,882
|
35.9
|
%
|
||||
|
Aaa or AAA
|
25,112
|
1.9
|
||||||
|
Aa or AA
|
345,547
|
26.1
|
||||||
|
A
|
222,934
|
16.8
|
||||||
|
BBB
|
198,041
|
15.0
|
||||||
|
BB
|
58,478
|
4.4
|
||||||
|
Allowance for expected credit losses
|
(1,388
|
)
|
(0.1
|
)
|
||||
|
Total
|
$
|
1,323,606
|
100.0
|
%
|
||||
|
|
(1) |
Ratings assigned by Moody’s Investors Services, Inc. or Standard & Poor’s Corporation.
|
|
|
(2) |
Includes mortgage-backed securities of $304.5 million.
|
|
December 31,
|
||||||||||||||||||||||||
|
2024
|
2023
|
2022
|
||||||||||||||||||||||
|
Percent of
|
Percent of
|
Percent of
|
||||||||||||||||||||||
|
(dollars in thousands)
|
Amount
|
Total
|
Amount
|
Total
|
Amount
|
Total
|
||||||||||||||||||
|
Fixed maturities(1):
|
||||||||||||||||||||||||
|
Held to maturity:
|
||||||||||||||||||||||||
|
U.S. Treasury securities and obligations of U.S. government corporations and agencies
|
$
|
86,579
|
6.3
|
%
|
$
|
91,517
|
6.9
|
%
|
$
|
103,362
|
7.9
|
%
|
||||||||||||
|
Obligations of states and political subdivisions
|
371,896
|
26.9
|
376,898
|
28.4
|
382,097
|
29.3
|
||||||||||||||||||
|
Corporate securities
|
236,550
|
17.0
|
201,847
|
15.2
|
190,949
|
14.6
|
||||||||||||||||||
|
Mortgage-backed securities
|
10,689
|
0.8
|
9,235
|
0.7
|
12,031
|
1.0
|
||||||||||||||||||
|
Total held to maturity
|
705,714
|
51.0
|
679,497
|
51.2
|
688,439
|
52.8
|
||||||||||||||||||
|
Available for sale:
|
||||||||||||||||||||||||
|
U.S. Treasury securities and obligations of U.S. government corporations and agencies
|
83,793
|
6.0
|
85,419
|
6.4
|
63,521
|
4.9
|
||||||||||||||||||
|
Obligations of states and political subdivisions
|
37,404
|
2.7
|
38,116
|
2.9
|
40,156
|
3.1
|
||||||||||||||||||
|
Corporate securities
|
202,932
|
14.7
|
196,793
|
14.8
|
202,838
|
15.5
|
||||||||||||||||||
|
Mortgage-backed securities
|
293,763
|
21.2
|
269,020
|
20.3
|
217,277
|
16.6
|
||||||||||||||||||
|
Total available for sale
|
617,892
|
44.6
|
589,348
|
44.4
|
523,792
|
40.1
|
||||||||||||||||||
|
Total fixed maturities
|
1,323,606
|
95.6
|
1,268,845
|
95.6
|
1,212,231
|
92.9
|
||||||||||||||||||
|
Equity securities(2)
|
36,808
|
2.6
|
25,903
|
2.0
|
35,105
|
2.7
|
||||||||||||||||||
|
Short-term investments(3)
|
24,558
|
1.8
|
32,306
|
2.4
|
57,321
|
4.4
|
||||||||||||||||||
|
Total investments
|
$
|
1,384,972
|
100.0
|
%
|
$
|
1,327,054
|
100.0
|
%
|
$
|
1,304,657
|
100.0
|
%
|
||||||||||||
|
|
(1) |
We refer to Notes 1 and 4 to our Consolidated Financial Statements. We value those fixed maturities we classify as held to maturity at amortized cost; we value those fixed maturities we classify as available for sale at fair value.
The total fair value of fixed maturities we classified as held to maturity was $631.6 million at December 31, 2024, $611.5 million at December 31, 2023 and $598.0 million at December 31, 2022. The amortized cost of fixed maturities we
classified as available for sale was $652.6 million at December 31, 2024, $629.7 million at December 31, 2023 and $571.9 million at December 31, 2022.
|
|
|
(2) |
We value equity securities at fair value. The total cost of equity securities was $24.7 million at December 31, 2024, $18.8 million at December 31, 2023 and $30.8 million at December 31, 2022.
|
|
|
(3) |
We value short-term investments at cost, which approximates fair value.
|
|
December 31,
|
||||||||||||||||||||||||
|
2024
|
2023
|
2022
|
||||||||||||||||||||||
|
Percent
of
|
Percent
of
|
Percent
of
|
||||||||||||||||||||||
|
(dollars in thousands)
|
Amount
|
Total
|
Amount
|
Total
|
Amount
|
Total
|
||||||||||||||||||
|
Due in(1):
|
||||||||||||||||||||||||
|
One year or less
|
$
|
56,914
|
4.3
|
%
|
$
|
54,392
|
4.3
|
%
|
$
|
39,094
|
3.2
|
%
|
||||||||||||
|
Over one year through three years
|
210,184
|
15.9
|
130,158
|
10.3
|
107,689
|
8.9
|
||||||||||||||||||
|
Over three years through five years
|
175,577
|
13.3
|
141,994
|
11.2
|
133,068
|
11.0
|
||||||||||||||||||
|
Over five years through ten years
|
318,912
|
24.1
|
347,035
|
27.3
|
357,114
|
29.5
|
||||||||||||||||||
|
Over ten years through fifteen years
|
208,445
|
15.7
|
201,585
|
15.9
|
191,118
|
15.8
|
||||||||||||||||||
|
Over fifteen years
|
50,503
|
3.8
|
116,747
|
9.2
|
154,840
|
12.7
|
||||||||||||||||||
|
Mortgage-backed securities
|
304,459
|
23.0
|
278,260
|
21.9
|
229,308
|
18.9
|
||||||||||||||||||
|
Allowance for expected credit losses
|
(1,388
|
)
|
(0.1
|
)
|
(1,326
|
)
|
(0.1
|
)
|
—
|
—
|
||||||||||||||
|
$
|
1,323,606
|
100.0
|
%
|
$
|
1,268,845
|
100.0
|
%
|
$
|
1,212,231
|
100.0
|
%
|
|||||||||||||
|
|
(1) |
Based on stated maturity dates with no prepayment assumptions. Actual maturities will differ because borrowers may have the right to call or prepay obligations with or without call or prepayment penalties.
|
|
Year Ended December 31,
|
||||||||||||
|
(dollars in thousands)
|
2024
|
2023
|
2022
|
|||||||||
|
Invested assets(1)
|
$
|
1,356,013
|
$
|
1,315,855
|
$
|
1,290,752
|
||||||
|
Investment income(2)
|
44,918
|
40,853
|
34,016
|
|||||||||
|
Average yield
|
3.3
|
%
|
3.1
|
%
|
2.6
|
%
|
||||||
|
Average tax-equivalent yield
|
3.4
|
3.2
|
2.7
|
|||||||||
|
|
(1) |
Average of the aggregate invested amounts at the beginning and end of the period.
|
|
|
(2) |
Investment income is net of investment expenses and does not include investment gains or losses or provision for income taxes.
|
|
Name of Insurance Subsidiary
|
Ordinary Dividend Amount
|
|||
|
Atlantic States
|
$
|
40,741,454
|
||
|
MICO
|
7,822,780
|
|||
|
Peninsula
|
4,734,260
|
|||
|
Southern
|
—
|
|||
|
Total
|
$
|
53,298,494
|
||
|
Name
|
Age
|
Position
|
||
|
Kevin G. Burke
|
59
|
President and Chief Executive Officer of us since 2015; President and Chief Executive Officer of Donegal Mutual since 2018; Executive Vice President and Chief Operating Officer of Donegal Mutual from 2014
to 2018; Senior Vice President of Human Resources of Donegal Mutual and us from 2005 to 2014; other positions from 2000 to 2005.
|
||
|
W. Daniel DeLamater
|
52
|
Executive Vice President and Chief Operating Officer of Donegal Mutual and us since 2024; Senior Vice President of us from 2022 to 2024; Senior Vice President and Head of Field Operations & National Accounts of Donegal Mutual
from 2022 to 2024; Senior Vice President of National Accounts for Donegal Mutual from 2020 to 2022; President of Southern Mutual Insurance Company since 2016; other positions at Southern Mutual Insurance Company from 2000 to 2016.
|
||
|
Jeffery T. Hay
|
50
|
Executive Vice President and Chief Underwriting Officer of Donegal Mutual and us since 2025; Senior Vice President and Chief Underwriting Officer of Donegal Mutual and Senior Vice President of us from
2021 to 2025; Senior Director of Willis Towers Watson from 2018 to 2021; Head of Personal Lines Product Management of The Hartford from 2015 to 2018; other positions at The Hartford from 2005 to 2015.
|
||
|
Jeffrey D. Miller
|
60
|
Executive Vice President and Chief Financial Officer of Donegal Mutual and us since 2014; Senior Vice President and Chief Financial Officer of Donegal Mutual and us from 2005 to 2014; other positions from
1993 to 2005.
|
||
|
Sanjay Pandey
|
58
|
Executive Vice President and Chief Information Officer of Donegal Mutual and us since 2025; Senior Vice President and Chief Information Officer of Donegal Mutual and us from 2013 to 2025; other positions
from 2000 to 2013.
|
||
|
Kristi S. Altshuler
|
44
|
Senior Vice President and Chief Analytics Officer of us since 2020; Senior Vice President and Chief Analytics Officer of Donegal Mutual since 2019; Director of Willis Towers Watson from 2018 to 2019;
Director of Pricing Innovation of USAA from 2014 to 2018; other positions at USAA from 2001 to 2014.
|
||
|
David B. Bawel
|
38
|
Senior Vice President and Chief Accounting Officer of Donegal Mutual and us since 2024; Vice President of Financial Reporting and Analysis of Donegal Mutual and Vice President of us from 2018 to 2024;
Assistant Vice President of Internal Audit of Donegal Mutual from 2012 to 2018.
|
||
|
Noland R. Deas, Jr.
|
57
|
Senior Vice President of Field Operations & National Accounts of Donegal Mutual and Senior Vice President of us since 2024; Senior Regional Vice President of Donegal Mutual from 2022 to 2024 and
Regional Vice President of Donegal Mutual from 2020 to 2022; other positions with Donegal Mutual from 2006 to 2020.
|
||
|
William A. Folmar
|
66
|
Senior Vice President of Claims of Donegal Mutual and Senior Vice President of us since 2019; Vice President of Claims of Donegal Mutual from 2010 to 2019; other positions from 1998 to 2010.
|
||
|
Rick J. Hecker
|
37
|
Senior Vice President and General Counsel of Donegal Mutual and us since 2025; Senior Vice President and General Counsel of Conestoga Title Insurance Company from 2022 to 2024; Vice President and General
Counsel of Conestoga Title Insurance Company from 2021 to 2022.
|
||
|
Christina M. Hoffman
|
50
|
Senior Vice President and Chief Risk Officer of Donegal Mutual and us since 2019; Senior Vice President of Internal Audit of Donegal Mutual and Senior Vice President of us from 2013 to 2019; Vice
President of Internal Audit of Donegal Mutual and Vice President of us from 2009 to 2013.
|
||
|
David W. Sponic
|
60
|
Senior Vice President of Personal Lines of Donegal Mutual and Senior Vice President of us since 2022; Vice President of Personal Lines of Donegal Mutual from 2008 to 2022; other positions from 1990 to
2008.
|
||
|
V. Anthony Viozzi
|
51
|
Senior Vice President and Chief Investment Officer of Donegal Mutual and us since 2012; Vice President of Investments of Donegal Mutual and us from 2007 to 2012.
|
||
|
Daniel J. Wagner
|
64
|
Senior Vice President and Treasurer of Donegal Mutual and us since 2005; other positions from 1987 to 2005.
|
| Item 1A. |
Risk Factors.
|
|
|
• |
trends in claim frequency and severity;
|
|
|
• |
changes in operations;
|
|
|
• |
emerging economic and social trends;
|
|
|
• |
economic and social inflation; and
|
|
|
• |
changes in the regulatory and litigation environments.
|
|
|
• |
the availability of sufficient, reliable data;
|
|
|
• |
the ability to conduct a complete and accurate analysis of available data;
|
|
|
• |
the ability to recognize in a timely manner changes in trends and to project both the severity and frequency of losses with reasonable accuracy;
|
|
|
• |
uncertainties generally inherent in estimates and assumptions;
|
|
|
• |
the ability to project changes in certain operating expense levels with reasonable certainty;
|
|
|
• |
the development, selection and application of appropriate rating formulae or other pricing methodologies;
|
|
|
• |
the effective development, governance and appropriate use of modeling tools to assist with correctly and consistently achieving the intended results in underwriting and pricing;
|
|
|
• |
the ability to innovate with new pricing strategies and the success of those innovations upon implementation;
|
|
|
• |
the ability to secure regulatory approval of premium rates on an adequate and timely basis;
|
|
|
• |
the ability to predict policyholder retention accurately;
|
|
|
• |
unanticipated court decisions, legislation or regulatory action;
|
|
|
• |
unanticipated changes in our claim settlement practices;
|
|
|
• |
changes in driving patterns for auto exposures;
|
|
|
• |
changes in weather patterns for property exposures;
|
|
|
• |
changes in the medical sector of the economy that impact bodily injury loss costs;
|
|
|
• |
changes in new and used car prices, auto repair costs and auto parts prices, including the increasing integration of sophisticated technology-related components;
|
|
|
• |
the impact of emerging technologies, including driver assistance technologies and autonomous vehicles, on pricing, insurance coverages and loss costs;
|
|
|
• |
the impact of inflation and other factors on the cost and availability of construction materials and labor;
|
|
|
• |
the impact of medical advances on the cost and duration of bodily injury claims;
|
|
|
• |
the ability to monitor property concentration in catastrophe-prone areas, such as hurricane, earthquake, wildfire and wind/hail regions; and
|
|
|
• |
the general state of the economy in the states in which our insurance subsidiaries operate.
|
|
|
• |
licensing and examination;
|
|
|
• |
approval of premium rates;
|
|
|
• |
market conduct;
|
|
|
• |
policy forms;
|
|
|
• |
limitations on the nature and amount of certain investments;
|
|
|
• |
claims practices;
|
|
|
• |
mandated participation in involuntary markets and guaranty funds;
|
|
|
• |
reserve adequacy;
|
|
|
• |
insurer solvency;
|
|
|
• |
transactions between affiliates;
|
|
|
• |
the amount of dividends that insurers may pay; and
|
|
|
• |
restrictions on underwriting standards.
|
|
|
• |
insurance company investments;
|
|
|
• |
issues relating to the solvency of insurance companies;
|
|
|
• |
risk-based capital guidelines;
|
|
|
• |
restrictions on the terms and conditions included in insurance policies;
|
|
|
• |
certain methods of accounting;
|
|
|
• |
reserves for unearned premiums, losses and other purposes;
|
|
|
• |
the values at which insurance companies may carry investment securities and the definition of other-than-temporary impairment of investment securities; and
|
|
|
• |
interpretations of existing laws and the development of new laws.
|
|
|
• |
the business operations or a specific operational function of our insurance subsidiaries and Donegal Mutual could be disrupted by the illness of significant numbers of their employees and remedial efforts that would be required upon
discovery of exposure to a communicable illness within their facilities;
|
|
|
• |
the business operations of our insurance subsidiaries and Donegal Mutual are dependent upon technology systems for which regular physical access is required to maintain critical operational capabilities, and the business operations
of our insurance subsidiaries and Donegal Mutual would be adversely impacted by government mandates requiring closure of facilities where those technology systems are located or restricting physical access to such facilities;
|
|
|
• |
the revenues of our insurance subsidiaries and Donegal Mutual may decrease as a result of reduced demand for their insurance products as economic disruption adversely impacts current and potential insurance customers;
|
|
|
• |
our insurance subsidiaries and Donegal Mutual may incur an increase in their losses and loss expenses in certain lines of business as a result of a pandemic and related economic disruption, and such losses and loss expenses may
exceed the reserves our insurance subsidiaries and Donegal Mutual have established or may establish in the future;
|
|
|
• |
our insurance subsidiaries and Donegal Mutual may incur increased costs related to legal disputes over policy coverages or exclusions and their defense against litigation related to a pandemic;
|
|
|
• |
legislative, judicial and regulatory actions may expand coverage definitions, retroactively mandate coverage or otherwise require our insurance subsidiaries and Donegal Mutual to pay losses for damages that their policies explicitly
excluded or did not intend to cover;
|
|
|
• |
legislative, judicial and regulatory actions may require our insurance subsidiaries and Donegal Mutual to reduce or refund premiums, suspend cancellation of policies for non-payment of premiums or otherwise grant extended grace
periods and time allowances for the payment of premium balances due to them;
|
|
|
• |
our insurance subsidiaries and Donegal Mutual may not be able to collect premium balances due to them, resulting in reduced operating cash flows and an increase in premium write-offs that would increase their operating expenses;
|
|
|
• |
our insurance subsidiaries may suffer declines in the market values of their investments as a result of financial market volatility related to pandemic concerns and related economic disruption; and
|
|
|
• |
economic disruption related to a pandemic could result in significant declines in the credit quality of issuers, ratings downgrades or changes in financial market conditions and regulatory changes that might adversely impact the
value of the fixed-maturity investments that our insurance subsidiaries own.
|
|
|
• |
the significant competition among insurance companies to attract independent agents;
|
|
|
• |
the labor-intensive and time-consuming process of selecting new independent agents;
|
|
|
• |
the insistence of our insurance subsidiaries and Donegal Mutual that independent agents adhere to certain standards;
|
|
|
• |
the ability of our insurance subsidiaries and Donegal Mutual to pay competitive and attractive commissions, bonuses and other incentives to independent agents; and
|
|
|
• |
the ongoing consolidation of independent agencies, which may result in the acquisition of independent agencies from which our insurance subsidiaries and Donegal Mutual currently receive business by larger entities with which our
insurance subsidiaries and Donegal Mutual do not have business relationships.
|
|
|
• |
the potential inadequacy of reserves for losses and loss expenses of the other insurer;
|
|
|
• |
the need to supplement management of the other insurer with additional experienced personnel;
|
|
|
• |
conditions imposed by regulatory agencies that make the realization of cost-savings through integration of the operations of the other insurer with our operations more difficult;
|
|
|
• |
our management’s lack of familiarity with the geography, demographics and distribution systems in the markets the other insurer serves that cause the other insurer to fail to meet the growth and profitability objectives we
anticipated at the time of the acquisition or affiliation;
|
|
|
• |
potential difficulties with integration of information technology systems and other operations;
|
|
|
• |
the need of the other insurer for additional capital that we did not anticipate at the time of the acquisition or affiliation; and
|
|
|
• |
the use of more of our management’s time in improving the operations of the other insurer than we originally anticipated.
|
|
|
• |
the perceived financial strength of the insurer;
|
|
|
• |
premium rates;
|
|
|
• |
policy terms and conditions;
|
|
|
• |
policyholder service;
|
|
|
• |
reputation; and
|
|
|
• |
experience.
|
|
|
• |
we and Donegal Mutual periodically review the percentage participation of Atlantic States and Donegal Mutual in the underwriting pool that Donegal Mutual and Atlantic States have maintained since 1986;
|
|
|
• |
our insurance subsidiaries and Donegal Mutual annually review and then establish the terms of certain reinsurance agreements between our insurance subsidiaries and Donegal Mutual;
|
|
|
• |
we and Donegal Mutual allocate certain shared expenses among ourselves and our insurance subsidiaries in accordance with various inter-company expense-sharing agreements; and
|
|
|
• |
we and our insurance subsidiaries may enter into other transactions or contractual relationships with Donegal Mutual.
|
|
|
• |
elect all of the members of our board of directors, who determine our management and policies; and
|
|
|
• |
control the outcome of any corporate transaction or other matter submitted to a vote of our stockholders for approval, including mergers or other acquisition proposals and the sale of all or substantially all of our assets, in each
case regardless of how all of our stockholders other than Donegal Mutual vote their shares.
|
|
|
• |
our board of directors is classified into three classes, so that our stockholders elect only one-third of the members of our board of directors each year;
|
|
|
• |
our stockholders may remove our directors only for cause;
|
|
|
• |
our stockholders may not take stockholder action except at an annual or special meeting of our stockholders;
|
|
|
• |
the request of stockholders holding at least 20% of the combined voting power of our Class A common stock and our Class B common stock is required for a stockholder to call a special meeting of our stockholders;
|
|
|
• |
our by-laws require that stockholders provide advance notice to us to nominate candidates for election to our board of directors or to propose any other item of stockholder business at a stockholders’ meeting;
|
|
|
• |
we do not permit cumulative voting rights in the election of our directors;
|
|
|
• |
our certificate of incorporation does not provide for preemptive rights in connection with any issuance of securities by us; and
|
|
|
• |
our board of directors may issue, without stockholder approval unless otherwise required by law, preferred stock with such terms as our board of directors may determine.
|
| Item 1B. |
Unresolved Staff Comments.
|
| Item 1C. |
Cybersecurity.
|
| Item 2. |
Properties.
|
| Item 3. |
Legal Proceedings.
|
| Item 4. |
Mine Safety Disclosures.
|
| Item 5. |
Market for Registrant’s Common Equity, Related Stockholder Matters and Issuer Purchases of Equity Securities.
|
|
Period
|
(a) Total Number of Shares
(or Units) Purchased
|
(b) Average Price Paid per
Share (or Unit)
|
(c) Total Number of Shares
(or Units) Purchased as
Part of Publicly
Announced Plans or
Programs
|
(d) Maximum Number (or
Approximate Dollar Value)
of Shares (or Units) that
May Yet Be Purchased
Under the Plans or
Programs
|
||||
|
Month #1
October 1-31, 2024
|
Class A – 150,432
Class B – None
|
Class A – $15.49
Class B – None
|
Class A – 150,432
Class B – None
|
(1)
|
||||
|
Month #2
November 1-30, 2024
|
Class A – 235,884
Class B – None
|
Class A – $15.88
Class B – None
|
Class A – 235,884
Class B – None
|
(1)
|
||||
|
Month #3
December 1-31, 2024
|
Class A – 414,122
Class B – None
|
Class A – $16.63
Class B – None
|
Class A – 414,122
Class B – None
|
(1)
|
||||
|
Total
|
Class A – 800,438
Class B – None
|
Class A – $16.20
Class B – None
|
Class A – 800,438
Class B – None
|
|
|
(1) |
Donegal Mutual purchased these shares pursuant to its disclosure on April 29, 2022 that it will, at its discretion, purchase shares of our Class A common stock and Class B common stock at market prices prevailing from time
to time in the open market subject to the provisions of SEC Rule 10b-18 and in privately negotiated transactions. Such disclosure did not stipulate a maximum number of shares that may be purchased under this program.
|
|
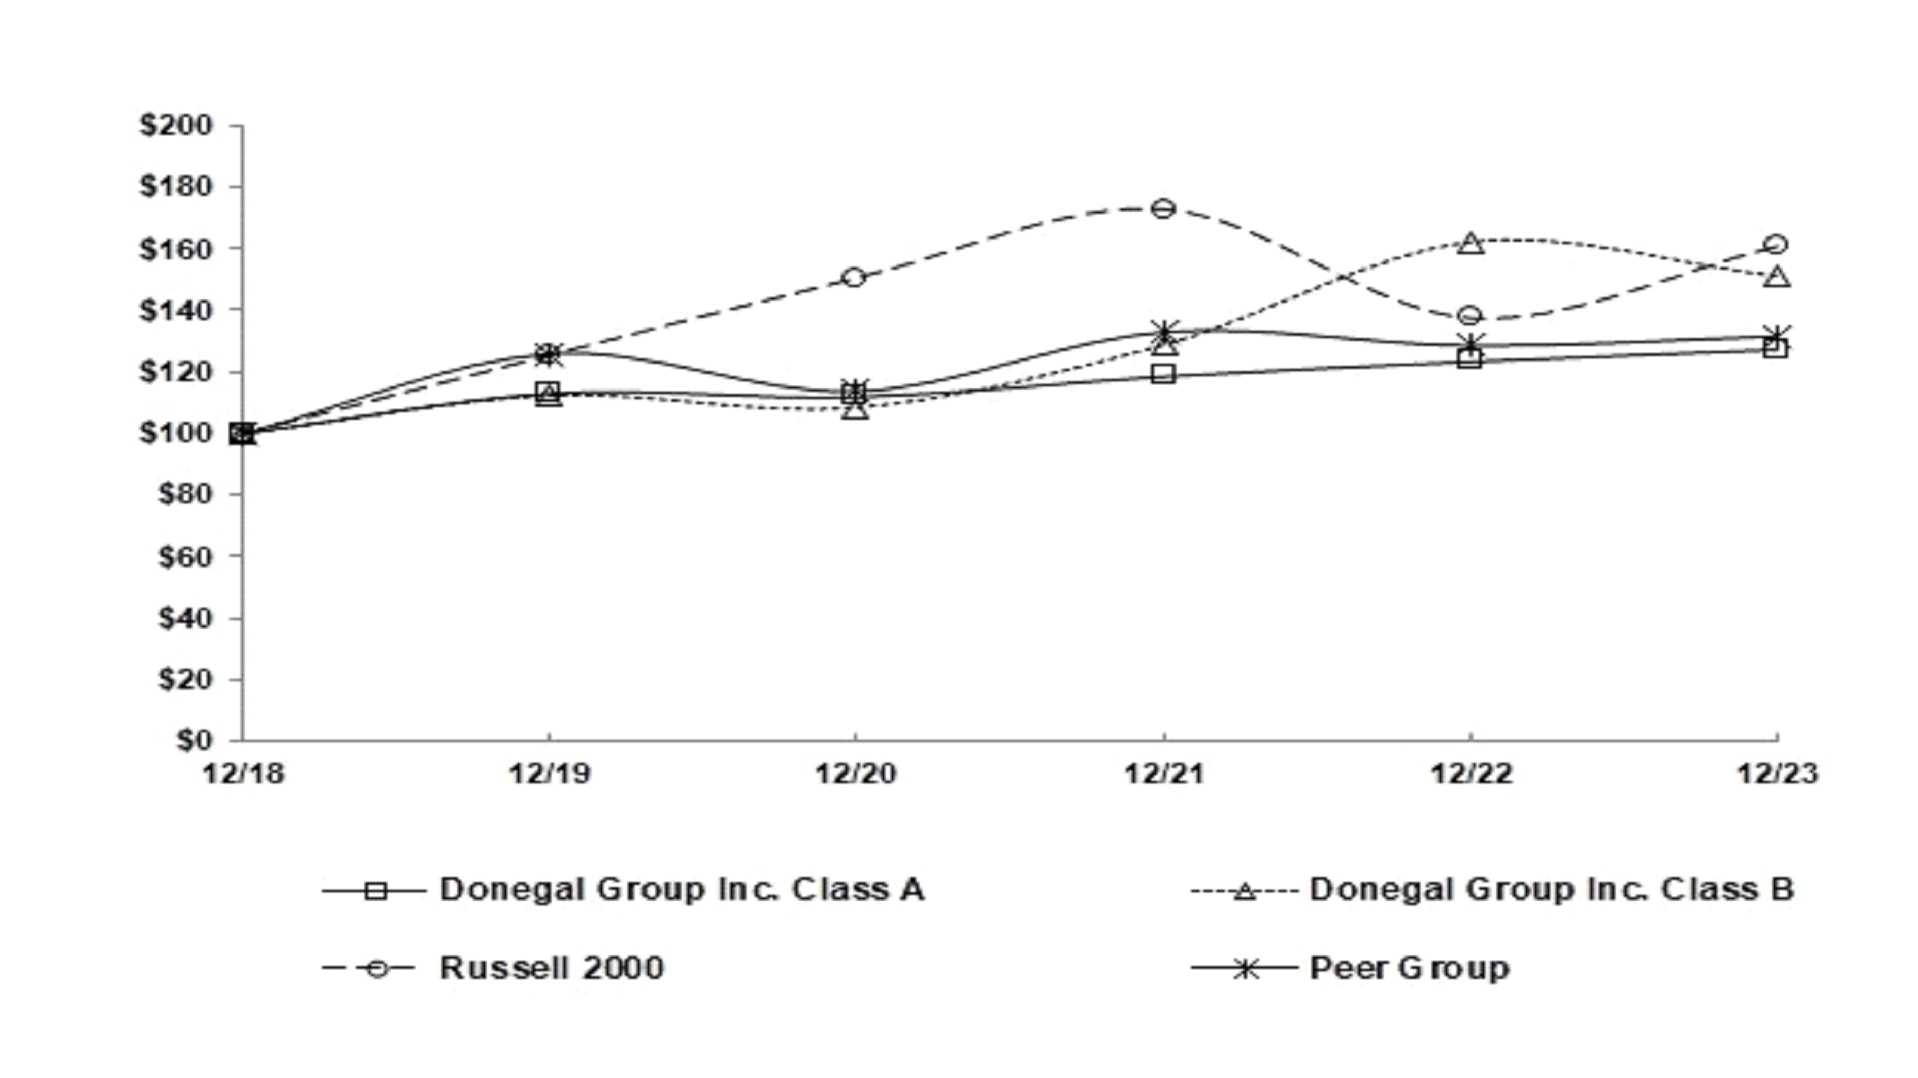
2019
|
2020
|
2021
|
2022
|
2023
|
2024
|
||
|
Donegal Group Inc. Class A
|
$100.00
|
$98.98
|
$104.91
|
$109.16
|
$112.65
|
$130.65
|
|
|
Donegal Group Inc. Class B
|
100.00
|
96.57
|
114.54
|
144.15
|
134.32
|
136.44
|
|
|
Russell 2000
|
100.00
|
119.96
|
137.74
|
109.59
|
128.14
|
142.93
|
|
|
Peer Group
|
100.00
|
90.33
|
105.60
|
102.08
|
104.50
|
136.71
|
| Item 6. |
[Reserved]
|
| Item 7. |
Management’s Discussion and Analysis of Financial Condition and Results of Operations
|
|
2024
|
2023
|
|||||||
|
(in thousands)
|
||||||||
|
Commercial lines:
|
||||||||
|
Automobile
|
$
|
180,757
|
$
|
168,749
|
||||
|
Workers’ compensation
|
129,406
|
122,473
|
||||||
|
Commercial multi-peril
|
208,676
|
217,292
|
||||||
|
Other
|
39,336
|
27,167
|
||||||
|
Total commercial lines
|
558,175
|
535,681
|
||||||
|
Personal lines:
|
||||||||
|
Automobile
|
116,693
|
112,509
|
||||||
|
Homeowners
|
26,591
|
28,001
|
||||||
|
Other
|
2,905
|
12,952
|
||||||
|
Total personal lines
|
146,189
|
153,462
|
||||||
|
Total commercial and personal lines
|
704,364
|
689,143
|
||||||
|
Plus reinsurance recoverable
|
416,621
|
437,014
|
||||||
|
Total liability for losses and loss expenses
|
$
|
1,120,985
|
$
|
1,126,157
|
||||
|
Change in Loss and Loss
Expense Reserves Net of
Reinsurance
|
Adjusted Loss and Loss
Expense Reserves Net of
Reinsurance at
December 31, 2024
|
Percentage Change in
Equity at
December 31, 2024(1)
|
Adjusted Loss and Loss
Expense Reserves Net of
Reinsurance at
December 31, 2023
|
Percentage Change in
Equity at
December 31, 2023(1)
|
||||
|
(dollars in thousands)
|
||||||||
|
-10.0%
|
$633,928
|
10.2%
|
$620,229
|
11.3%
|
||||
|
-7.5
|
651,537
|
7.6
|
637,457
|
8.5
|
||||
|
-5.0
|
669,146
|
5.1
|
654,686
|
5.7
|
||||
|
-2.5
|
686,755
|
2.5
|
671,914
|
2.8
|
||||
|
Base
|
704,364
|
—
|
689,143
|
—
|
||||
|
2.5
|
721,973
|
-2.5
|
706,372
|
-2.8
|
||||
|
5.0
|
739,582
|
-5.1
|
723,600
|
-5.7
|
||||
|
7.5
|
757,191
|
-7.6
|
740,829
|
-8.5
|
||||
|
10.0
|
774,800
|
-10.2
|
758,057
|
-11.3
|
||||
|
(1)
|
Net of income tax effect.
|
|
For the Year Ended December 31,
|
||||||||
|
(dollars in thousands)
|
2024
|
2023
|
||||||
|
Number of claims pending, beginning of period
|
3,144
|
3,366
|
||||||
|
Number of claims reported
|
5,066
|
5,928
|
||||||
|
Number of claims settled or dismissed
|
5,378
|
6,150
|
||||||
|
Number of claims pending, end of period
|
2,832
|
3,144
|
||||||
|
Losses paid
|
$
|
54,597
|
$
|
54,336
|
||||
|
Loss expenses paid
|
$
|
10,953
|
$
|
12,292
|
||||
|
Year Ended December 31,
|
||||||||||||
|
(in thousands)
|
2024
|
2023
|
2022
|
|||||||||
|
Net premiums written:
|
||||||||||||
|
Commercial lines:
|
||||||||||||
|
Automobile
|
$
|
184,989
|
$
|
174,741
|
$
|
167,774
|
||||||
|
Workers’ compensation
|
103,533
|
107,598
|
111,892
|
|||||||||
|
Commercial multi-peril
|
213,959
|
195,632
|
200,045
|
|||||||||
|
Other
|
45,439
|
50,458
|
51,135
|
|||||||||
|
Total commercial lines
|
547,920
|
528,429
|
530,846
|
|||||||||
|
Personal lines:
|
||||||||||||
|
Automobile
|
243,036
|
215,957
|
181,129
|
|||||||||
|
Homeowners
|
140,613
|
139,688
|
120,087
|
|||||||||
|
Other
|
10,712
|
11,623
|
11,468
|
|||||||||
|
Total personal lines
|
394,361
|
367,268
|
312,684
|
|||||||||
|
Total net premiums written
|
$
|
942,281
|
$
|
895,697
|
$
|
843,530
|
||||||
|
Components of combined ratio:
|
||||||||||||
|
Loss ratio
|
64.5
|
%
|
69.1
|
%
|
68.6
|
%
|
||||||
|
Expense ratio
|
33.7
|
34.7
|
34.1
|
|||||||||
|
Dividend ratio
|
0.4
|
0.6
|
0.6
|
|||||||||
|
Combined ratio
|
98.6
|
%
|
104.4
|
%
|
103.3
|
%
|
||||||
|
Revenues:
|
||||||||||||
|
Net premiums earned:
|
||||||||||||
|
Commercial lines
|
$
|
539,683
|
$
|
533,029
|
$
|
521,227
|
||||||
|
Personal lines
|
396,968
|
349,042
|
301,263
|
|||||||||
|
Total net premiums earned
|
936,651
|
882,071
|
822,490
|
|||||||||
|
Net investment income
|
44,918
|
40,853
|
34,016
|
|||||||||
|
Investment gains (losses)
|
4,981
|
3,173
|
(10,185
|
)
|
||||||||
|
Other
|
3,055
|
1,241
|
1,900
|
|||||||||
|
Total revenues
|
$
|
989,605
|
$
|
927,338
|
$
|
848,221
|
||||||
|
Year Ended December 31,
|
||||||||||||
|
(in thousands)
|
2024
|
2023
|
2022
|
|||||||||
|
Components of net income (loss):
|
||||||||||||
|
Underwriting income (loss):
|
||||||||||||
|
Commercial lines
|
$
|
5,826
|
$
|
(6,998
|
)
|
$
|
(22,665
|
)
|
||||
|
Personal lines
|
5,739
|
(35,118
|
)
|
(13,506
|
)
|
|||||||
|
SAP underwriting income (loss)
|
11,565
|
(42,116
|
)
|
(36,171
|
)
|
|||||||
|
GAAP adjustments
|
1,331
|
3,735
|
8,667
|
|||||||||
|
GAAP underwriting income (loss)
|
12,896
|
(38,381
|
)
|
(27,504
|
)
|
|||||||
|
Net investment income
|
44,918
|
40,853
|
34,016
|
|||||||||
|
Investment gains (losses)
|
4,981
|
3,173
|
(10,185
|
)
|
||||||||
|
Other
|
(456
|
)
|
(582
|
)
|
35
|
|||||||
|
Income (loss) before income tax expense (benefit)
|
62,339
|
5,063
|
(3,638
|
)
|
||||||||
|
Income tax expense (benefit)
|
11,477
|
637
|
(1,679
|
)
|
||||||||
|
Net income (loss)
|
$
|
50,862
|
$
|
4,426
|
$
|
(1,959
|
)
|
|||||
|
(in thousands)
|
Commercial Lines
|
Personal
Lines
|
Total
|
|||||||||
|
Net premiums earned
|
$
|
539,683
|
$
|
396,968
|
$
|
936,651
|
||||||
|
Change in net unearned premiums
|
8,237
|
(2,607
|
)
|
5,630
|
||||||||
|
Net premiums written
|
$
|
547,920
|
$
|
394,361
|
$
|
942,281
|
||||||
|
(in thousands)
|
Commercial Lines
|
Personal
Lines
|
Total
|
|||||||||
|
Net premiums earned
|
$
|
533,029
|
$
|
349,042
|
$
|
882,071
|
||||||
|
Change in net unearned premiums
|
(4,600
|
)
|
18,226
|
13,626
|
||||||||
|
Net premiums written
|
$
|
528,429
|
$
|
367,268
|
$
|
895,697
|
||||||
|
(in thousands)
|
Commercial Lines
|
Personal
Lines
|
Total
|
|||||||||
|
Net premiums earned
|
$
|
521,227
|
$
|
301,263
|
$
|
822,490
|
||||||
|
Change in net unearned premiums
|
9,619
|
11,421
|
21,040
|
|||||||||
|
Net premiums written
|
$
|
530,846
|
$
|
312,684
|
$
|
843,530
|
||||||
|
|
• |
the statutory loss ratio, which is the ratio of calendar-year net incurred losses and loss expenses to net premiums earned;
|
|
|
• |
the statutory expense ratio, which is the ratio of expenses incurred for net commissions, premium taxes and underwriting expenses to net premiums written; and
|
|
|
• |
the statutory dividend ratio, which is the ratio of dividends to holders of workers’ compensation policies to net premiums earned.
|
|
Year Ended December 31,
|
||||||||||||
|
2024
|
2023
|
2022
|
||||||||||
|
GAAP Combined Ratios (Total Lines)
|
||||||||||||
|
Loss ratio - core losses
|
54.0
|
%
|
57.5
|
%
|
59.8
|
%
|
||||||
|
Loss ratio - weather-related losses
|
7.2
|
8.3
|
7.7
|
|||||||||
|
Loss ratio - large fire losses
|
4.9
|
5.2
|
6.5
|
|||||||||
|
Loss ratio - net prior-year reserve development
|
-1.6
|
-1.9
|
-5.4
|
|||||||||
|
Loss ratio
|
64.5
|
69.1
|
68.6
|
|||||||||
|
Expense ratio
|
33.7
|
34.7
|
34.1
|
|||||||||
|
Dividend ratio
|
0.4
|
0.6
|
0.6
|
|||||||||
|
Combined ratio
|
98.6
|
%
|
104.4
|
%
|
103.3
|
%
|
||||||
|
Statutory Combined Ratios
|
||||||||||||
|
Commercial lines:
|
||||||||||||
|
Automobile
|
102.6
|
%
|
97.3
|
%
|
98.0
|
%
|
||||||
|
Workers’ compensation
|
104.4
|
96.6
|
97.3
|
|||||||||
|
Commercial multi-peril
|
95.0
|
112.3
|
116.9
|
|||||||||
|
Other
|
80.0
|
85.5
|
80.8
|
|||||||||
|
Total commercial lines
|
98.2
|
101.6
|
103.7
|
|||||||||
|
Personal lines:
|
||||||||||||
|
Automobile
|
97.4
|
109.7
|
103.8
|
|||||||||
|
Homeowners
|
99.6
|
108.6
|
111.0
|
|||||||||
|
Other
|
99.5
|
75.8
|
52.1
|
|||||||||
|
Total personal lines
|
98.3
|
108.2
|
102.8
|
|||||||||
|
Total commercial and personal lines
|
98.3
|
104.2
|
103.3
|
|||||||||
|
December 31,
|
||||||||||||||||
|
2024
|
2023
|
|||||||||||||||
|
Percent of
|
Percent of
|
|||||||||||||||
|
(dollars in thousands)
|
Amount
|
Total
|
Amount
|
Total
|
||||||||||||
|
Fixed maturities:
|
||||||||||||||||
|
Total held to maturity
|
$
|
705,714
|
51.0
|
%
|
$
|
679,497
|
51.2
|
%
|
||||||||
|
Total available for sale
|
617,892
|
44.6
|
589,348
|
44.4
|
||||||||||||
|
Total fixed maturities
|
1,323,606
|
95.6
|
1,268,845
|
95.6
|
||||||||||||
|
Equity securities
|
36,808
|
2.6
|
25,903
|
2.0
|
||||||||||||
|
Short-term investments
|
24,558
|
1.8
|
32,306
|
2.4
|
||||||||||||
|
Total investments
|
$
|
1,384,972
|
100.0
|
%
|
$
|
1,327,054
|
100.0
|
%
|
||||||||
|
(in thousands)
|
Principal
Cash Flows
|
Weighted-
Average
Interest Rate
|
||||||
|
Fixed-maturity and short-term investments:
|
||||||||
|
2025
|
$
|
82,064
|
4.18
|
%
|
||||
|
2026
|
65,538
|
3.93
|
||||||
|
2027
|
73,054
|
3.92
|
||||||
|
2028
|
84,203
|
4.27
|
||||||
|
2029
|
88,485
|
3.78
|
||||||
|
Thereafter
|
998,456
|
3.52
|
||||||
|
Total
|
$
|
1,391,800
|
||||||
|
Fair value
|
$
|
1,274,020
|
||||||
|
Debt:
|
||||||||
|
2026
|
$
|
35,000
|
3.81
|
%
|
||||
|
Total
|
$
|
35,000
|
||||||
|
Fair value
|
$
|
35,000
|
||||||
|
Index to Consolidated Financial Statements and Schedule
|
|
| 63 | |
| 64 |
|
|
|
|
| 65 |
|
| 66 |
|
| 67 | |
|
|
|
|
Report of Independent Registered Public Accounting Firm (KPMG LLP, PCAOB ID 185)
|
105 |
|
|
|
|
Schedule:
|
|
| 113 |
|
December 31,
|
||||||||
|
2024
|
2023
|
|||||||
|
|
|
|||||||
|
Assets
|
||||||||
|
Investments
|
||||||||
|
Fixed maturities
|
||||||||
|
Held to maturity, at amortized cost (fair value $631,568,929
and $611,526,338; net of allowance for expected credit losses of $1,388,240 and $1,325,847)
|
$
|
705,713,916
|
$
|
679,497,038
|
||||
|
Available for sale, at fair value (amortized cost $652,564,965
and $629,727,513)
|
617,891,862
|
589,348,243
|
||||||
|
Equity securities, at fair value
|
36,807,810
|
25,902,956
|
||||||
|
Short-term investments, at cost, which approximates fair value
|
24,558,744
|
32,305,408
|
||||||
|
Total investments
|
1,384,972,332
|
1,327,053,645
|
||||||
|
Cash
|
52,925,931
|
23,792,273
|
||||||
|
Accrued investment income
|
10,361,959
|
9,945,714
|
||||||
|
Premiums receivable
|
181,106,519
|
179,591,821
|
||||||
|
Reinsurance receivable (net of allowance for expected credit losses of $391,432
and $1,394,074)
|
420,741,855
|
441,431,334
|
||||||
|
Deferred policy acquisition costs
|
73,346,967
|
75,043,404
|
||||||
|
Deferred tax asset, net
|
18,769,861
|
19,532,525
|
||||||
|
Prepaid reinsurance premiums
|
176,161,872
|
168,724,465
|
||||||
|
Property and equipment, net
|
2,479,183
|
2,633,405
|
||||||
|
Accounts receivable - securities
|
24,924
|
1,501,079
|
||||||
|
Federal income taxes recoverable
|
—
|
8,102,321
|
||||||
|
Due from affiliate
|
8,410,090
|
1,907,527
|
||||||
|
Goodwill
|
5,625,354
|
5,625,354
|
||||||
|
Other intangible assets
|
958,010
|
958,010
|
||||||
|
Other
|
147,126
|
451,011
|
||||||
|
Total assets
|
$
|
2,336,031,983
|
$
|
2,266,293,888
|
||||
|
Liabilities and Stockholders’ Equity
|
||||||||
|
Liabilities
|
||||||||
|
Losses and loss expenses
|
$
|
1,120,985,050
|
$
|
1,126,156,838
|
||||
|
Unearned premiums
|
612,476,068
|
599,411,468
|
||||||
|
Accrued expenses
|
2,916,705
|
3,946,974
|
||||||
|
Reinsurance balances payable
|
4,345,426
|
8,758,976
|
||||||
|
Borrowings under lines of credit
|
35,000,000
|
35,000,000
|
||||||
|
Cash dividends declared to stockholders
|
6,031,078
|
5,569,992
|
||||||
|
Federal income taxes payable
|
356,103 | — | ||||||
|
Other
|
8,145,422
|
7,704,286
|
||||||
|
Total liabilities
|
1,790,255,852
|
1,786,548,534
|
||||||
|
Stockholders’ Equity
|
||||||||
|
Preferred stock, $0.01 par value, authorized 2,000,000 shares; none
issued
|
—
|
—
|
||||||
|
Class A common stock, $0.01 par value, authorized 50,000,000 shares, issued 32,954,347
and 30,764,555 shares and outstanding 29,951,759 and 27,761,967 shares
|
329,544
|
307,646
|
||||||
|
Class B common stock, $0.01 par value, authorized 10,000,000 shares, issued 5,649,240
shares and outstanding 5,576,775 shares
|
56,492
|
56,492
|
||||||
|
Additional paid-in capital
|
369,679,946
|
335,694,478
|
||||||
|
Accumulated other comprehensive loss
|
(28,200,481
|
)
|
(32,881,822
|
)
|
||||
|
Retained earnings
|
245,136,987
|
217,794,917
|
||||||
|
Treasury stock, at cost
|
(41,226,357
|
)
|
(41,226,357
|
)
|
||||
|
Total stockholders’ equity
|
545,776,131
|
479,745,354
|
||||||
|
Total liabilities and stockholders’ equity
|
$
|
2,336,031,983
|
$
|
2,266,293,888
|
||||
|
Years Ended December 31,
|
||||||||||||
|
2024
|
2023
|
2022
|
||||||||||
|
Statements of Income (Loss)
|
|
|
|
|||||||||
|
Revenues
|
||||||||||||
|
Net premiums earned (includes affiliated reinsurance of $239,521,005,
$237,903,029 and $232,105,306
- see note 3)
|
$
|
936,651,480
|
$
|
882,071,386
|
$
|
822,489,450
|
||||||
|
Investment income, net of investment expenses
|
44,918,162
|
40,853,215
|
34,016,112
|
|||||||||
|
Installment payment fees
|
2,740,505
|
894,137
|
1,516,330
|
|||||||||
|
Lease income
|
313,831
|
346,439
|
383,451
|
|||||||||
|
Net investment gains (losses) (includes ($174,302), ($2,242,190) and ($979,972)
accumulated other comprehensive income reclassification)
|
4,981,072
|
3,172,807
|
(10,184,797
|
)
|
||||||||
|
Total revenues
|
989,605,050
|
927,337,984
|
848,220,546
|
|||||||||
|
Expenses
|
||||||||||||
|
Net losses and loss expenses (includes affiliated reinsurance of $136,662,558,
$150,198,479 and $177,849,040
- see note 3)
|
604,117,716
|
609,177,699
|
564,078,993
|
|||||||||
|
Amortization of deferred policy acquisition costs
|
160,311,000
|
154,214,000
|
142,430,000
|
|||||||||
|
Other underwriting expenses
|
155,253,685
|
151,747,579
|
137,923,739
|
|||||||||
|
Policyholder dividends
|
4,073,481
|
5,313,430
|
5,560,407
|
|||||||||
|
Interest
|
946,020
|
619,813
|
620,558
|
|||||||||
|
Other, net
|
2,564,216
|
1,201,987
|
1,244,948
|
|||||||||
|
Total expenses
|
927,266,118
|
922,274,508
|
851,858,645
|
|||||||||
|
Income (loss) before income tax expense (benefit)
|
62,338,932
|
5,063,476
|
(3,638,099
|
)
|
||||||||
|
Income tax expense (benefit) (includes $36,603, $470,860 and $205,794 income tax
benefit from reclassification items)
|
11,476,680
|
637,972
|
(1,678,694
|
)
|
||||||||
|
Net income (loss)
|
$
|
50,862,252
|
$
|
4,425,504
|
$
|
(1,959,405
|
)
|
|||||
|
Basic earnings (loss) per common share:
|
||||||||||||
|
Class A common stock
|
$
|
1.53
|
$
|
0.14
|
$
|
(0.06
|
)
|
|||||
|
Class B common stock
|
$
|
1.38
|
$
|
0.11
|
$
|
(0.07
|
)
|
|||||
|
Diluted earnings (loss) per common share:
|
||||||||||||
|
Class A common stock
|
$
|
1.53
|
$
|
0.14
|
$
|
(0.06
|
)
|
|||||
|
Class B common stock
|
$
|
1.38
|
$
|
0.11
|
$
|
(0.07
|
)
|
|||||
|
Statements of Comprehensive Income (Loss)
|
||||||||||||
|
Net income (loss)
|
$
|
50,862,252
|
$
|
4,425,504
|
$
|
(1,959,405
|
)
|
|||||
|
Other comprehensive income (loss), net of tax
|
||||||||||||
|
Unrealized gain (loss) on securities:
|
||||||||||||
|
Unrealized holding gain (loss) arising during the period, net of income tax expense (benefit) of $1,207,804, $1,285,390 and ($12,164,443)
|
4,543,642
|
4,246,693
|
(45,761,476
|
)
|
||||||||
|
Reclassification adjustment for losses included in net income (loss), net of income tax benefit of $36,603, $470,860 and $205,794
|
137,699
|
1,771,330
|
774,178
|
|||||||||
|
Other comprehensive income (loss)
|
4,681,341
|
6,018,023
|
(44,987,298
|
)
|
||||||||
|
Comprehensive income (loss)
|
$
|
55,543,593
|
$
|
10,443,527
|
$
|
(46,946,703
|
)
|
|||||
|
Common Stock
|
|
|||||||||||||||||||||||||||||||||||
|
Class A Shares
|
Class B Shares
|
Class A Amount
|
Class B Amount
|
Additional Paid-In Capital
|
Accumulated Other Comprehensive Income (Loss)
|
Retained Earnings
|
Treasury Stock
|
Total Stockholders’ Equity
|
||||||||||||||||||||||||||||
|
Balance, January 1, 2022
|
28,756,203 |
5,649,240
|
$
|
287,562
|
$
|
56,492
|
$
|
304,889,481
|
$
|
3,283,551
|
$
|
263,745,358
|
$
|
(41,226,357
|
)
|
$
|
531,036,087
|
|||||||||||||||||||
|
Issuance of common stock (stock compensation plans)
|
161,254 |
1,613
|
2,122,277
|
2,123,890
|
||||||||||||||||||||||||||||||||
|
Stock-based compensation
|
1,202,806 |
12,028
|
18,252,148
|
18,264,176
|
||||||||||||||||||||||||||||||||
|
Net loss
|
(1,959,405
|
)
|
(1,959,405
|
)
|
||||||||||||||||||||||||||||||||
|
Cash dividends
|
(20,884,438
|
)
|
(20,884,438
|
)
|
||||||||||||||||||||||||||||||||
|
Grant of stock options
|
337,741
|
(337,741
|
)
|
—
|
||||||||||||||||||||||||||||||||
|
Other comprehensive loss
|
(44,987,298
|
)
|
(44,987,298
|
)
|
||||||||||||||||||||||||||||||||
|
Balance, December 31, 2022
|
30,120,263 |
5,649,240
|
$
|
301,203
|
$
|
56,492
|
$
|
325,601,647
|
$
|
(41,703,747
|
)
|
$
|
240,563,774
|
$
|
(41,226,357
|
)
|
$
|
483,593,012
|
||||||||||||||||||
|
Issuance of common stock (stock compensation plans)
|
150,426 |
1,504
|
2,081,186
|
2,082,690
|
||||||||||||||||||||||||||||||||
|
Stock-based compensation
|
493,866 |
4,939
|
7,683,782
|
7,688,721
|
||||||||||||||||||||||||||||||||
|
Net income
|
4,425,504
|
4,425,504
|
||||||||||||||||||||||||||||||||||
|
Cash dividends
|
(22,166,694
|
)
|
(22,166,694
|
)
|
||||||||||||||||||||||||||||||||
|
Grant of stock options
|
327,863
|
(327,863
|
)
|
—
|
||||||||||||||||||||||||||||||||
|
Cumulative effect of adoption of updated guidance for credit losses at January 1, 2023
|
(1,895,902 | ) | (1,895,902 | ) | ||||||||||||||||||||||||||||||||
|
Reclassification of held-to-maturity transfer
|
2,803,902 | (2,803,902 | ) | — | ||||||||||||||||||||||||||||||||
|
Other comprehensive income
|
6,018,023
|
6,018,023
|
||||||||||||||||||||||||||||||||||
|
Balance, December 31, 2023
|
30,764,555 |
5,649,240
|
$
|
307,646
|
$
|
56,492
|
$
|
335,694,478
|
$
|
(32,881,822
|
)
|
$
|
217,794,917
|
$
|
(41,226,357
|
)
|
$
|
479,745,354
|
||||||||||||||||||
|
Issuance of common stock (stock compensation plans)
|
153,366 |
1,534
|
2,006,136
|
2,007,670
|
||||||||||||||||||||||||||||||||
|
Stock-based compensation
|
2,036,426 |
20,364
|
31,621,452
|
31,641,816
|
||||||||||||||||||||||||||||||||
|
Net income
|
50,862,252
|
50,862,252
|
||||||||||||||||||||||||||||||||||
|
Cash dividends
|
(23,162,302
|
)
|
(23,162,302
|
)
|
||||||||||||||||||||||||||||||||
|
Grant of stock options
|
357,880
|
(357,880
|
)
|
—
|
||||||||||||||||||||||||||||||||
|
Other comprehensive income
|
4,681,341
|
4,681,341
|
||||||||||||||||||||||||||||||||||
|
Balance, December 31, 2024
|
32,954,347 |
5,649,240
|
$
|
329,544
|
$
|
56,492
|
$
|
369,679,946
|
$
|
(28,200,481
|
)
|
$
|
245,136,987
|
$
|
(41,226,357
|
)
|
$
|
545,776,131
|
||||||||||||||||||
|
Years Ended December 31,
|
||||||||||||
|
2024
|
2023
|
2022
|
||||||||||
|
Cash Flows from Operating Activities:
|
||||||||||||
|
Net income (loss)
|
$
|
50,862,252
|
$
|
4,425,504
|
$
|
(1,959,405
|
)
|
|||||
|
Adjustments to reconcile net income (loss) to net cash provided by operating activities:
|
||||||||||||
|
Depreciation, amortization and other non-cash items
|
3,873,161
|
4,326,446
|
4,841,559
|
|||||||||
|
Net investment (gains) losses
|
(4,981,072
|
)
|
(3,172,807
|
)
|
10,184,797
|
|||||||
|
Changes in Assets and Liabilities:
|
||||||||||||
|
Losses and loss expenses
|
(5,171,788
|
)
|
5,111,080
|
43,425,457
|
||||||||
|
Unearned premiums
|
13,064,600
|
21,758,338
|
4,694,708
|
|||||||||
|
Accrued expenses
|
(1,030,269
|
)
|
(279,416
|
)
|
197,731
|
|||||||
|
Premiums receivable
|
(1,514,698
|
)
|
(5,745,527
|
)
|
(4,983,714
|
)
|
||||||
|
Deferred policy acquisition costs
|
1,696,437
|
(1,873,174
|
)
|
(5,141,857
|
)
|
|||||||
|
Deferred income taxes
|
(481,743
|
)
|
229,397
|
(2,958,735
|
)
|
|||||||
|
Reinsurance receivable
|
20,689,479
|
13,959,053
|
(1,111,214
|
)
|
||||||||
|
Accrued investment income
|
(416,245
|
)
|
(1,084,422
|
)
|
(646,321
|
)
|
||||||
|
Amounts due from affiliate
|
(6,502,563
|
)
|
(7,080,816
|
)
|
7,096,006
|
|||||||
|
Reinsurance balances payable
|
(4,413,550
|
)
|
5,263,152
|
(450,281
|
)
|
|||||||
|
Prepaid reinsurance premiums
|
(7,437,407
|
)
|
(8,133,066
|
)
|
16,344,443
|
|||||||
|
Current income taxes
|
8,458,424
|
408,576
|
(3,219,959
|
)
|
||||||||
|
Other, net
|
745,019
|
511,426
|
796,805
|
|||||||||
|
Net adjustments
|
16,577,785
|
24,198,240
|
69,069,425
|
|||||||||
|
Net cash provided by operating activities
|
67,440,037
|
28,623,744
|
67,110,020
|
|||||||||
|
Cash Flows from Investing Activities:
|
||||||||||||
|
Purchases of fixed maturities:
|
||||||||||||
|
Held to maturity
|
(56,707,019
|
)
|
(25,226,609
|
)
|
(74,902,605
|
)
|
||||||
|
Available for sale
|
(147,736,805
|
)
|
(150,423,864
|
)
|
(151,994,462
|
)
|
||||||
|
Purchases of equity securities
|
(8,697,500
|
)
|
(5,128,994
|
)
|
(15,862,888
|
)
|
||||||
|
Sales of fixed maturities:
|
||||||||||||
|
Available for sale
|
7,184,635
|
28,154,556
|
24,381,244
|
|||||||||
|
Maturity of fixed maturities:
|
||||||||||||
|
Held to maturity
|
30,548,257
|
32,923,991
|
53,747,886
|
|||||||||
|
Available for sale
|
116,612,046
|
58,277,402
|
75,759,806
|
|||||||||
|
Sales of equity securities
|
3,010,413
|
19,745,875
|
34,973,196
|
|||||||||
|
Net sales (purchases) of property and equipment
|
743
|
(44,701
|
)
|
28,290
|
||||||||
|
Net sales (purchases) of short-term investments
|
7,746,664
|
25,015,703
|
(44,628,770
|
)
|
||||||||
|
Net cash used in investing activities
|
(48,038,566
|
)
|
(16,706,641
|
)
|
(98,498,303
|
)
|
||||||
|
Cash Flows from Financing Activities:
|
||||||||||||
|
Issuance of common stock
|
32,433,403
|
8,645,530
|
19,304,956
|
|||||||||
|
Cash dividends paid
|
(22,701,216
|
)
|
(21,893,692
|
)
|
(20,502,716
|
)
|
||||||
|
Net cash provided by (used in) financing activities
|
9,732,187
|
(13,248,162
|
)
|
(1,197,760
|
)
|
|||||||
|
Net increase (decrease) in cash
|
29,133,658
|
(1,331,059
|
)
|
(32,586,043
|
)
|
|||||||
|
Cash at beginning of year
|
23,792,273
|
25,123,332
|
57,709,375
|
|||||||||
|
Cash at end of year
|
$
|
52,925,931
|
$
|
23,792,273
|
$
|
25,123,332
|
||||||
|
2024
|
2023
|
2022
|
||||||||||
|
Premiums earned
|
$
|
358,062,827
|
$
|
332,272,662
|
$
|
314,321,443
|
||||||
|
Losses and loss expenses
|
201,030,943
|
238,055,099
|
202,228,589
|
|||||||||
|
Prepaid reinsurance premiums
|
169,621,545
|
161,991,511
|
154,472,615
|
|||||||||
|
Liability for losses and loss expenses
|
297,955,741
|
299,947,390
|
277,641,902
|
|||||||||
|
2024
|
2023
|
2022
|
||||||||||
|
Premiums earned
|
$
|
611,864,614
|
$
|
583,559,746
|
$
|
578,216,706
|
||||||
|
Losses and loss expenses
|
354,052,955
|
409,051,306
|
395,794,813
|
|||||||||
|
Unearned premiums
|
297,493,977
|
286,147,727
|
280,031,908
|
|||||||||
|
Liability for losses and loss expenses
|
517,975,350
|
507,527,839
|
496,849,769
|
|||||||||
|
2024
|
2023
|
2022
|
||||||||||
|
Premiums earned
|
$
|
19,517
|
$
|
168,243
|
$
|
17,989,939
|
||||||
|
Losses and loss expenses
|
(3,095,130
|
)
|
2,902,422
|
5,194,974
|
||||||||
|
Liability for losses and loss expenses
|
10,450,447
|
17,852,153
|
22,642,908
|
|||||||||
|
2024
|
2023
|
2022
|
||||||||||
|
Premiums earned
|
$
|
14,261,265
|
$
|
13,215,814
|
$
|
13,800,018
|
||||||
|
Losses and loss expenses
|
19,454,584
|
17,895,306
|
10,517,709
|
|||||||||
|
Liability for losses and loss expenses
|
6,876,255
|
2,497,244
|
1,271,006
|
|||||||||
|
2024
|
2023
|
2022
|
||||||||||
|
Assumed
|
$
|
611,864,614
|
$
|
583,559,746
|
$
|
578,216,706
|
||||||
|
Ceded
|
(372,343,609
|
)
|
(345,656,717
|
)
|
(346,111,400
|
)
|
||||||
|
Net
|
$
|
239,521,005
|
$
|
237,903,029
|
$
|
232,105,306
|
||||||
|
2024
|
2023
|
2022
|
||||||||||
|
Assumed
|
$
|
354,052,955
|
$
|
409,051,306
|
$
|
395,790,312
|
||||||
|
Ceded
|
(217,390,397
|
)
|
(258,852,827
|
)
|
(217,941,272
|
)
|
||||||
|
Net
|
$
|
136,662,558
|
$
|
150,198,479
|
$
|
177,849,040
|
||||||
|
2024
|
||||||||||||||||||||||||
|
|
Carrying Value |
Allowance for Credit Losses
|
Amortized
Cost
|
Gross
Unrealized
Gains
|
Gross
Unrealized
Losses
|
Estimated Fair
Value
|
||||||||||||||||||
|
(in thousands)
|
||||||||||||||||||||||||
| Held to Maturity | ||||||||||||||||||||||||
|
U.S. Treasury securities and obligations of U.S. government corporations and agencies
|
$ | 86,579,024 | $ | 51,632 |
$
|
86,630,656
|
$
|
—
|
$
|
8,484,505
|
$
|
78,146,151
|
||||||||||||
|
Obligations of states and political subdivisions
|
371,895,483 | 259,896 |
372,155,379
|
649,770
|
54,062,089
|
318,743,060
|
||||||||||||||||||
|
Corporate securities
|
236,550,262 | 1,070,337 |
237,620,599
|
272,817
|
13,607,632
|
224,285,784
|
||||||||||||||||||
|
Mortgage-backed securities
|
10,689,147 | 6,375 |
10,695,522
|
—
|
301,588
|
10,393,934
|
||||||||||||||||||
|
Totals
|
$ | 705,713,916 | $ | 1,388,240 |
$
|
707,102,156
|
$
|
922,587
|
$
|
76,455,814
|
$
|
631,568,929
|
||||||||||||
|
2024
|
||||||||||||||||
|
Available for Sale
|
Amortized
Cost
|
Gross
Unrealized
Gains
|
Gross
Unrealized
Losses
|
Estimated Fair
Value
|
||||||||||||
|
U.S. Treasury securities and obligations of U.S. government corporations and agencies
|
$
|
87,514,016
|
$
|
50,451
|
$
|
3,771,832
|
$
|
83,792,635
|
||||||||
|
Obligations of states and political subdivisions
|
41,693,772
|
9,435
|
4,298,787
|
37,404,420
|
||||||||||||
|
Corporate securities
|
211,059,119
|
141,685
|
8,269,108
|
202,931,696
|
||||||||||||
|
Mortgage-backed securities
|
312,298,058
|
216,549
|
18,751,496
|
293,763,111
|
||||||||||||
|
Totals
|
$
|
652,564,965
|
$
|
418,120
|
$
|
35,091,223
|
$
|
617,891,862
|
||||||||
|
2023
|
||||||||||||||||||||||||
|
|
Carrying Value |
Allowance for Credit Losses
|
Amortized
Cost
|
Gross
Unrealized
Gains
|
Gross
Unrealized
Losses
|
Estimated Fair
Value
|
||||||||||||||||||
|
(in thousands)
|
||||||||||||||||||||||||
| Held to Maturity | ||||||||||||||||||||||||
|
U.S. Treasury securities and obligations of U.S. government corporations and agencies
|
$ | 91,517,359 |
$ | 54,668 |
$
|
91,572,027
|
$
|
—
|
$
|
8,885,420
|
$
|
82,686,607
|
||||||||||||
|
Obligations of states and political subdivisions
|
376,897,952 |
265,977 |
377,163,929
|
1,448,585
|
46,844,714
|
331,767,800
|
||||||||||||||||||
|
Corporate securities
|
201,847,288 |
999,685 |
202,846,973
|
207,628
|
14,804,569
|
188,250,032
|
||||||||||||||||||
|
Mortgage-backed securities
|
9,234,439 |
5,517 |
9,239,956
|
—
|
418,057
|
8,821,899
|
||||||||||||||||||
|
Totals
|
$ | 679,497,038 |
$ | 1,325,847 |
$
|
680,822,885
|
$
|
1,656,213
|
$
|
70,952,760
|
$
|
611,526,338
|
||||||||||||
|
2023
|
||||||||||||||||
|
Available for Sale
|
Amortized
Cost
|
Gross
Unrealized
Gains
|
Gross
Unrealized
Losses
|
Estimated Fair
Value
|
||||||||||||
|
U.S. Treasury securities and obligations of U.S. government corporations and agencies
|
$
|
89,367,383
|
$
|
199,299
|
$
|
4,146,999
|
$
|
85,419,683
|
||||||||
|
Obligations of states and political subdivisions
|
41,957,742
|
11,665
|
3,853,623
|
38,115,784
|
||||||||||||
|
Corporate securities
|
211,882,285
|
100,014
|
15,189,332
|
196,792,967
|
||||||||||||
|
Mortgage-backed securities
|
286,520,103
|
594,023
|
18,094,317
|
269,019,809
|
||||||||||||
|
Totals
|
$
|
629,727,513
|
$
|
905,001
|
$
|
41,284,271
|
$
|
589,348,243
|
||||||||
|
Amortized Cost
|
Estimated Fair
Value
|
|||||||
|
Held to maturity
|
||||||||
|
Due in one year or less
|
$
|
26,242,529
|
$
|
26,079,023
|
||||
|
Due after one year through five years
|
188,104,030
|
176,623,906
|
||||||
|
Due after five years through ten years
|
234,909,164
|
215,122,262
|
||||||
|
Due after ten years
|
247,150,911
|
203,349,804
|
||||||
|
Mortgage-backed securities
|
10,695,522
|
10,393,934
|
||||||
|
Total held to maturity
|
$
|
707,102,156
|
$
|
631,568,929
|
||||
|
Available for sale
|
||||||||
|
Due in one year or less
|
$
|
30,880,061
|
$
|
30,671,938
|
||||
|
Due after one year through five years
|
205,273,058
|
197,656,304
|
||||||
|
Due after five years through ten years
|
90,287,938
|
84,003,172
|
||||||
|
Due after ten years
|
13,825,850
|
11,797,337
|
||||||
|
Mortgage-backed securities
|
312,298,058
|
293,763,111
|
||||||
|
Total available for sale
|
$
|
652,564,965
|
$
|
617,891,862
|
||||
|
Cost
|
Gross Gains
|
Gross Losses
|
Estimated Fair
Value
|
|||||||||||||
|
Equity securities
|
$
|
24,725,576
|
$
|
12,087,227
|
$
|
4,993
|
$
|
36,807,810
|
||||||||
|
Cost
|
Gross Gains
|
Gross Losses
|
Estimated Fair
Value
|
|||||||||||||
|
Equity securities
|
$
|
18,843,929
|
$
|
7,059,027
|
$
|
—
|
$
|
25,902,956
|
||||||||
|
2024
|
2023
|
2022
|
||||||||||
|
Fixed maturities
|
$
|
44,450,895
|
$
|
40,445,697
|
$
|
34,945,437
|
||||||
|
Equity securities
|
710,333
|
765,881
|
897,429
|
|||||||||
|
Short-term investments
|
3,621,766
|
2,471,998
|
817,428
|
|||||||||
|
Other
|
29,250
|
29,250
|
29,250
|
|||||||||
|
Investment income
|
48,812,244
|
43,712,826
|
36,689,544
|
|||||||||
|
Investment expenses
|
(3,894,082
|
)
|
(2,859,611
|
)
|
(2,673,432
|
)
|
||||||
|
Net investment income
|
$
|
44,918,162
|
$
|
40,853,215
|
$
|
34,016,112
|
||||||
|
2024
|
2023
|
2022
|
||||||||||
|
Gross realized gains:
|
||||||||||||
|
Fixed maturities
|
$
|
113,699
|
$
|
1,059,244
|
$
|
1,149,761
|
||||||
|
Equity securities
|
289,840
|
2,662,661
|
1,765,923
|
|||||||||
|
Real estate
|
—
|
—
|
477,287
|
|||||||||
|
403,539
|
3,721,905
|
3,392,971
|
||||||||||
|
Gross realized losses:
|
||||||||||||
|
Fixed maturities
|
288,008
|
3,300,351
|
2,129,736
|
|||||||||
|
Equity securities
|
95,290
|
732,940
|
4,113,526
|
|||||||||
|
383,298
|
4,033,291
|
6,243,262
|
||||||||||
|
Net realized gains (losses)
|
20,241
|
(311,386
|
)
|
(2,850,291
|
)
|
|||||||
|
Gross unrealized gains on equity securities
|
5,028,206
|
3,651,125
|
258,532
|
|||||||||
|
Gross unrealized losses on equity securities
|
(4,982
|
)
|
(109,125
|
)
|
(7,593,038
|
)
|
||||||
|
Increase in allowance for credit
losses
|
(62,393 | ) | (57,807 | ) | — | |||||||
|
Net investment gains (losses)
|
$
|
4,981,072
|
$
|
3,172,807
|
$
|
(10,184,797
|
)
|
|||||
|
Change in difference between fair value and cost of investments:
|
||||||||||||
|
Fixed maturities
|
$
|
(530,513
|
)
|
$
|
28,839,658
|
$
|
(177,147,840
|
)
|
||||
|
Equity securities
|
5,023,207
|
2,724,820
|
15,823,189
|
|||||||||
|
Totals
|
$
|
4,492,694
|
$
|
31,564,478
|
$
|
(161,324,651
|
)
|
|||||
|
Less than 12 months
|
12 months or longer
|
|||||||||||||||
|
Fair Value
|
Unrealized Losses
|
Fair Value
|
Unrealized Losses
|
|||||||||||||
|
U.S. Treasury securities and obligations of U.S. government corporations and agencies
|
$
|
37,528,341
|
$
|
349,573
|
$
|
112,322,114
|
$
|
11,906,764
|
||||||||
|
Obligations of states and political subdivisions
|
37,674,513
|
824,487
|
292,851,970
|
57,536,389
|
||||||||||||
|
Corporate securities
|
83,342,468
|
1,505,512
|
311,435,364
|
20,371,228
|
||||||||||||
|
Mortgage-backed securities
|
112,950,244
|
1,261,878
|
153,960,179
|
17,791,206
|
||||||||||||
|
Totals
|
$
|
271,495,566
|
$
|
3,941,450
|
$
|
870,569,627
|
$
|
107,605,587
|
||||||||
|
Less than 12 months
|
12 months or longer
|
|||||||||||||||
|
Fair Value
|
Unrealized Losses
|
Fair Value
|
Unrealized Losses
|
|||||||||||||
|
U.S. Treasury securities and obligations of U.S. government corporations and agencies
|
$
|
32,223,934
|
$
|
217,164
|
$
|
116,537,998
|
$
|
12,815,255
|
||||||||
|
Obligations of states and political subdivisions
|
13,097,410
|
67,913
|
307,429,319
|
50,630,424
|
||||||||||||
|
Corporate securities
|
13,065,558
|
324,293
|
353,862,937
|
29,669,608
|
||||||||||||
|
Mortgage-backed securities
|
46,964,057
|
220,436
|
178,112,881
|
18,291,938
|
||||||||||||
|
Totals
|
$
|
105,350,959
|
$
|
829,806
|
$
|
955,943,135
|
$
|
111,407,225
|
||||||||
|
|
Level 1 - quoted prices in active markets for identical assets and liabilities;
|
|
|
Level 2 - directly or indirectly observable inputs other than Level 1 quoted prices; and
|
|
|
Level 3 - unobservable inputs not corroborated by market data.
|
|
Fair Value Measurements Using
|
||||||||||||||||
|
Fair Value
|
Quoted Prices in
Active Markets
for Identical
Assets (Level 1)
|
Significant
Other Observable
Inputs (Level 2)
|
Significant
Unobservable
Inputs (Level 3)
|
|||||||||||||
|
U.S. Treasury securities and obligations of U.S. government corporations and agencies
|
$
|
83,792,635
|
$
|
—
|
$
|
83,792,635
|
$
|
—
|
||||||||
|
Obligations of states and political subdivisions
|
37,404,420
|
—
|
37,404,420
|
—
|
||||||||||||
|
Corporate securities
|
202,931,696
|
—
|
202,931,696
|
—
|
||||||||||||
|
Mortgage-backed securities
|
293,763,111
|
—
|
293,763,111
|
—
|
||||||||||||
|
Equity securities
|
36,807,810
|
34,707,981
|
2,099,829
|
—
|
||||||||||||
|
Total investments in the fair value hierarchy
|
$
|
654,699,672
|
$
|
34,707,981
|
$
|
619,991,691
|
$
|
—
|
||||||||
|
Fair Value Measurements Using
|
||||||||||||||||
|
Fair Value
|
Quoted Prices in
Active Markets
for Identical
Assets (Level 1)
|
Significant
Other Observable
Inputs (Level 2)
|
Significant
Unobservable
Inputs (Level 3)
|
|||||||||||||
|
U.S. Treasury securities and obligations of U.S. government corporations and agencies
|
$
|
85,419,683
|
$
|
—
|
$
|
85,419,683
|
$
|
—
|
||||||||
|
Obligations of states and political subdivisions
|
38,115,784
|
—
|
38,115,784
|
—
|
||||||||||||
|
Corporate securities
|
196,792,967
|
—
|
196,792,967
|
—
|
||||||||||||
|
Mortgage-backed securities
|
269,019,809
|
—
|
269,019,809
|
—
|
||||||||||||
|
Equity securities
|
25,902,956
|
23,910,968
|
1,991,988
|
—
|
||||||||||||
|
Total investments in the fair value hierarchy
|
$
|
615,251,199
|
$
|
23,910,968
|
$
|
591,340,231
|
$
|
—
|
||||||||
|
2024
|
2023
|
2022
|
||||||||||
|
Balance, January 1
|
$
|
75,043,404
|
$
|
73,170,230
|
$
|
68,028,373
|
||||||
|
Acquisition costs deferred
|
158,614,563
|
156,087,174
|
147,571,857
|
|||||||||
|
Amortization charged to earnings
|
(160,311,000
|
)
|
(154,214,000
|
)
|
(142,430,000
|
)
|
||||||
|
Balance, December 31
|
$
|
73,346,967
|
$
|
75,043,404
|
$
|
73,170,230
|
||||||
|
2024
|
2023
|
Estimated
Useful Life
|
||||||||
|
Office equipment
|
$
|
8,288,988
|
$
|
8,289,730
|
3-15 years
|
|||||
|
Automobiles
|
42,794
|
42,794
|
5 years
|
|||||||
|
Real estate
|
2,575,207
|
2,575,207
|
5-50 years
|
|||||||
|
Software
|
1,386,936
|
1,386,936
|
5 years
|
|||||||
|
12,293,925
|
12,294,667
|
|||||||||
|
Accumulated depreciation
|
(9,814,742
|
)
|
(9,661,262
|
)
|
||||||
|
$
|
2,479,183
|
$
|
2,633,405
|
|||||||
|
2024
|
2023
|
2022
|
||||||||||
|
Balance at January 1
|
$
|
1,126,156,838
|
$
|
1,121,045,758
|
$
|
1,077,620,301
|
||||||
|
Less reinsurance recoverable
|
(437,013,974
|
)
|
(451,184,222
|
)
|
(451,261,306
|
)
|
||||||
|
Cumulative effect of adoption of updated accounting guidance for credit losses at January 1
|
— | 1,131,836 | — | |||||||||
|
Net balance at January 1
|
689,142,864
|
670,993,372
|
626,358,995
|
|||||||||
|
Incurred related to:
|
||||||||||||
|
Current year
|
619,089,646
|
625,831,043
|
608,900,206
|
|||||||||
|
Prior years
|
(14,971,930
|
)
|
(16,653,344
|
)
|
(44,821,213
|
)
|
||||||
|
Total incurred
|
604,117,716
|
609,177,699
|
564,078,993
|
|||||||||
|
Paid related to:
|
||||||||||||
|
Current year
|
319,195,507
|
330,290,039
|
302,272,322
|
|||||||||
|
Prior years
|
269,701,400
|
260,738,168
|
218,304,130
|
|||||||||
|
Total paid
|
588,896,907
|
591,028,207
|
520,576,452
|
|||||||||
|
Net balance at December 31
|
704,363,673
|
689,142,864
|
669,861,536
|
|||||||||
|
Plus reinsurance recoverable
|
416,621,377
|
437,013,974
|
451,184,222
|
|||||||||
|
Balance at December 31
|
$
|
1,120,985,050
|
$
|
1,126,156,838
|
$
|
1,121,045,758
|
||||||
|
Personal
Automobile
|
At December 31, 2024
|
|||||||||||||||||||||||||||||||||||||||||||||||
|
Incurred Claims and Allocated Claim Adjustment Expenses, Net of Reinsurance
For the Year Ended December 31,
|
||||||||||||||||||||||||||||||||||||||||||||||||
|
Accident
Year
|
2015
|
2016
|
2017
|
2018
|
2019
|
2020
|
2021
|
2022
|
2023
|
2024
|
Total IBNR
Plus
Expected
Development
on Reported
Claims
|
Cumulative
Number of
Reported
Claims
|
||||||||||||||||||||||||||||||||||||
|
Unaudited
|
||||||||||||||||||||||||||||||||||||||||||||||||
|
(dollars and reported claims in thousands)
|
||||||||||||||||||||||||||||||||||||||||||||||||
|
2015
|
|
137,569
|
|
139,333
|
|
139,181
|
|
142,493
|
|
142,408
|
|
142,073
|
|
142,010
|
|
141,965
|
|
141,894
|
$
|
141,973
|
$
|
49
|
70
|
|||||||||||||||||||||||||
|
2016
|
150,216
|
153,937
|
157,516
|
157,943
|
156,935
|
156,436
|
156,227
|
155,834
|
155,822
|
114
|
73
|
|||||||||||||||||||||||||||||||||||||
|
2017
|
166,690
|
176,728
|
175,939
|
174,784
|
173,730
|
173,032
|
172,712
|
172,376
|
220
|
79
|
||||||||||||||||||||||||||||||||||||||
|
2018
|
186,580
|
183,358
|
181,558
|
180,787
|
179,732
|
178,990
|
178,799
|
345
|
81
|
|||||||||||||||||||||||||||||||||||||||
|
2019
|
161,056
|
157,689
|
156,300
|
154,805
|
153,883
|
153,253
|
652
|
68
|
||||||||||||||||||||||||||||||||||||||||
|
2020
|
111,483
|
103,585
|
100,339
|
99,253
|
98,506
|
772
|
43
|
|||||||||||||||||||||||||||||||||||||||||
|
2021
|
119,364
|
118,752
|
114,707
|
114,874
|
1,352
|
47
|
||||||||||||||||||||||||||||||||||||||||||
|
2022
|
126,203
|
134,834
|
136,073
|
3,173
|
50
|
|||||||||||||||||||||||||||||||||||||||||||
|
2023
|
152,740
|
155,260
|
6,193
|
52
|
||||||||||||||||||||||||||||||||||||||||||||
|
2024
|
153,403
|
29,466
|
45
|
|||||||||||||||||||||||||||||||||||||||||||||
|
Total
|
$
|
1,460,339
|
||||||||||||||||||||||||||||||||||||||||||||||
|
Personal Automobile
|
||||||||||||||||||||||||||||||||||||||||
|
Cumulative Paid Claims and Allocated Claim Adjustment Expenses, Net of Reinsurance
For the Year Ended December 31, |
||||||||||||||||||||||||||||||||||||||||
|
Accident
Year |
2015
|
2016
|
2017
|
2018
|
2019
|
2020
|
2021
|
2022
|
2023
|
2024
|
||||||||||||||||||||||||||||||
|
Unaudited
|
||||||||||||||||||||||||||||||||||||||||
|
(in thousands)
|
||||||||||||||||||||||||||||||||||||||||
|
2015
|
|
93,611
|
|
116,303
|
|
128,395
|
|
135,027
|
|
139,121
|
|
140,028
|
|
140,892
|
|
141,172
|
|
141,298
|
$
|
141,392
|
||||||||||||||||||||
|
2016
|
102,433
|
129,507
|
143,321
|
151,159
|
153,521
|
154,769
|
155,521
|
155,505
|
155,602
|
|||||||||||||||||||||||||||||||
|
2017
|
111,964
|
142,372
|
159,879
|
166,099
|
169,190
|
170,895
|
171,513
|
171,863
|
||||||||||||||||||||||||||||||||
|
2018
|
115,585
|
150,175
|
163,036
|
169,651
|
173,922
|
176,233
|
177,367
|
|||||||||||||||||||||||||||||||||
|
2019
|
103,101
|
127,187
|
141,004
|
146,667
|
150,017
|
150,842
|
||||||||||||||||||||||||||||||||||
|
2020
|
66,084
|
81,783
|
89,736
|
94,094
|
96,277
|
|||||||||||||||||||||||||||||||||||
|
2021
|
76,477
|
93,998
|
103,427
|
109,052
|
||||||||||||||||||||||||||||||||||||
|
2022
|
83,616
|
109,845
|
125,624
|
|||||||||||||||||||||||||||||||||||||
|
2023
|
99,574
|
127,752
|
||||||||||||||||||||||||||||||||||||||
|
2024
|
101,227
|
|||||||||||||||||||||||||||||||||||||||
|
Total
|
1,356,998
|
|||||||||||||||||||||||||||||||||||||||
|
All outstanding liabilities before 2015, net of reinsurance
|
907
|
|||||||||||||||||||||||||||||||||||||||
|
Liabilities for claims and claims adjustment expenses, net of reinsurance
|
$
|
104,248
|
||||||||||||||||||||||||||||||||||||||
|
Homeowners
|
At December 31, 2024
|
|||||||||||||||||||||||||||||||||||||||||||||||
|
Incurred Claims and Allocated Claim Adjustment Expenses, Net of Reinsurance
For the Year Ended December 31,
|
||||||||||||||||||||||||||||||||||||||||||||||||
|
Accident
Year
|
2015
|
2016
|
2017
|
2018
|
2019
|
2020
|
2021
|
2022
|
2023
|
2024
|
Total IBNR Plus Expected Development on Reported Claims
|
Cumulative Number of Reported Claims
|
||||||||||||||||||||||||||||||||||||
|
Unaudited
|
||||||||||||||||||||||||||||||||||||||||||||||||
|
(dollars and reported claims in thousands)
|
||||||||||||||||||||||||||||||||||||||||||||||||
|
2015
|
|
63,359
|
|
63,925
|
|
63,053
|
|
63,071
|
|
63,099
|
|
62,993
|
|
63,043
|
|
63,036
|
|
63,042
|
$
|
63,041
|
$
|
—
|
14
|
|||||||||||||||||||||||||
|
2016
|
62,443
|
64,064
|
63,735
|
63,355
|
63,279
|
63,409
|
63,472
|
63,478
|
63,462
|
—
|
12
|
|||||||||||||||||||||||||||||||||||||
|
2017
|
79,283
|
79,911
|
79,305
|
79,247
|
79,065
|
78,815
|
78,819
|
78,687
|
—
|
17
|
||||||||||||||||||||||||||||||||||||||
|
2018
|
81,965
|
83,385
|
82,905
|
82,566
|
82,058
|
81,977
|
81,930
|
36
|
19
|
|||||||||||||||||||||||||||||||||||||||
|
2019
|
73,294
|
73,554
|
73,234
|
72,168
|
72,176
|
71,785
|
90
|
16
|
||||||||||||||||||||||||||||||||||||||||
|
2020
|
61,633
|
62,718
|
61,595
|
61,495
|
61,285
|
94
|
14
|
|||||||||||||||||||||||||||||||||||||||||
|
2021
|
67,677
|
66,996
|
65,451
|
64,425
|
269
|
11
|
||||||||||||||||||||||||||||||||||||||||||
|
2022
|
82,433
|
82,045
|
81,838
|
1,066
|
10
|
|||||||||||||||||||||||||||||||||||||||||||
|
2023
|
86,693
|
87,047
|
1,657
|
11
|
||||||||||||||||||||||||||||||||||||||||||||
|
2024
|
85,975
|
8,875
|
10
|
|||||||||||||||||||||||||||||||||||||||||||||
|
Total
|
$
|
739,475
|
|
|||||||||||||||||||||||||||||||||||||||||||||
|
Homeowners
|
||||||||||||||||||||||||||||||||||||||||
|
Cumulative Paid Claims and Allocated Claim Adjustment Expenses, Net of Reinsurance
For the Year Ended December 31,
|
||||||||||||||||||||||||||||||||||||||||
|
Accident
Year
|
2015
|
2016
|
2017
|
2018
|
2019
|
2020
|
2021
|
2022
|
2023
|
2024
|
||||||||||||||||||||||||||||||
|
Unaudited
|
||||||||||||||||||||||||||||||||||||||||
|
(in thousands)
|
||||||||||||||||||||||||||||||||||||||||
|
2015
|
|
51,885
|
|
61,542
|
|
62,204
|
|
62,590
|
|
62,844
|
|
62,943
|
|
62,936
|
|
62,938
|
|
63,042
|
$
|
63,041
|
||||||||||||||||||||
|
2016
|
50,125
|
61,145
|
62,760
|
63,144
|
63,162
|
63,217
|
63,266
|
63,296
|
63,302
|
|||||||||||||||||||||||||||||||
|
2017
|
67,077
|
77,663
|
78,006
|
78,127
|
78,454
|
78,528
|
78,556
|
78,662
|
||||||||||||||||||||||||||||||||
|
2018
|
70,385
|
79,892
|
80,905
|
81,464
|
81,568
|
81,826
|
81,833
|
|||||||||||||||||||||||||||||||||
|
2019
|
58,074
|
69,145
|
70,416
|
70,884
|
71,209
|
71,446
|
||||||||||||||||||||||||||||||||||
|
2020
|
51,226
|
60,348
|
60,809
|
61,189
|
61,181
|
|||||||||||||||||||||||||||||||||||
|
2021
|
52,161
|
63,920
|
64,124
|
64,258
|
||||||||||||||||||||||||||||||||||||
|
2022
|
63,107
|
79,187
|
80,132
|
|||||||||||||||||||||||||||||||||||||
|
2023
|
67,636
|
84,194
|
||||||||||||||||||||||||||||||||||||||
|
2024
|
67,702
|
|||||||||||||||||||||||||||||||||||||||
|
Total
|
715,751
|
|||||||||||||||||||||||||||||||||||||||
|
All outstanding liabilities before 2015, net of reinsurance
|
98
|
|||||||||||||||||||||||||||||||||||||||
|
Liabilities for claims and claims adjustment expenses, net of reinsurance
|
$
|
23,822
|
||||||||||||||||||||||||||||||||||||||
|
Commercial Automobile
|
At December 31, 2024
|
|||||||||||||||||||||||||||||||||||||||||||||||
|
Incurred Claims and Allocated Claim Adjustment Expenses, Net of Reinsurance
For the Year Ended December 31,
|
||||||||||||||||||||||||||||||||||||||||||||||||
|
Accident
Year
|
2015
|
2016
|
2017
|
2018
|
2019
|
2020
|
2021
|
2022
|
2023
|
2024
|
Total IBNR Plus Expected Development on Reported Claims
|
Cumulative Number of Reported Claims
|
||||||||||||||||||||||||||||||||||||
|
Unaudited
|
||||||||||||||||||||||||||||||||||||||||||||||||
|
(dollars and reported claims in thousands)
|
||||||||||||||||||||||||||||||||||||||||||||||||
|
2015
|
|
46,526
|
|
48,323
|
|
51,412
|
|
54,259
|
|
54,517
|
|
54,619
|
|
53,793
|
|
53,477
|
|
53,431
|
$
|
53,339
|
$
|
6
|
12
|
|||||||||||||||||||||||||
|
2016
|
54,302
|
57,353
|
65,905
|
67,127
|
66,894
|
66,085
|
65,922
|
65,602
|
65,537
|
23
|
13
|
|||||||||||||||||||||||||||||||||||||
|
2017
|
61,484
|
67,927
|
67,697
|
67,249
|
65,310
|
64,631
|
65,022
|
64,821
|
43
|
14
|
||||||||||||||||||||||||||||||||||||||
|
2018
|
79,307
|
81,396
|
82,313
|
83,043
|
82,226
|
82,368
|
82,234
|
102
|
16
|
|||||||||||||||||||||||||||||||||||||||
|
2019
|
88,864
|
91,245
|
90,290
|
86,140
|
84,566
|
83,709
|
129
|
16
|
||||||||||||||||||||||||||||||||||||||||
|
2020
|
90,367
|
87,766
|
85,016
|
83,590
|
83,590
|
998
|
14
|
|||||||||||||||||||||||||||||||||||||||||
|
2021
|
109,824
|
99,231
|
96,947
|
97,903
|
2,546
|
15
|
||||||||||||||||||||||||||||||||||||||||||
|
2022
|
115,287
|
108,690
|
109,314
|
7,758
|
15
|
|||||||||||||||||||||||||||||||||||||||||||
|
2023
|
112,135
|
110,821
|
16,917
|
14
|
||||||||||||||||||||||||||||||||||||||||||||
|
2024
|
115,327
|
38,125
|
11
|
|||||||||||||||||||||||||||||||||||||||||||||
|
Total
|
$
|
866,595
|
||||||||||||||||||||||||||||||||||||||||||||||
|
Commercial Automobile
|
||||||||||||||||||||||||||||||||||||||||
|
Cumulative Paid Claims and Allocated Claim Adjustment Expenses, Net of Reinsurance
For the Year Ended December 31,
|
||||||||||||||||||||||||||||||||||||||||
|
Accident
Year |
2015
|
2016
|
2017
|
2018
|
2019
|
2020
|
2021
|
2022
|
2023
|
2024
|
||||||||||||||||||||||||||||||
|
Unaudited
|
||||||||||||||||||||||||||||||||||||||||
|
(in thousands)
|
||||||||||||||||||||||||||||||||||||||||
|
2015
|
|
23,875
|
|
35,342
|
|
41,678
|
|
48,261
|
|
51,605
|
|
51,992
|
|
52,728
|
|
53,052
|
|
53,047
|
$
|
53,333
|
||||||||||||||||||||
|
2016
|
27,033
|
38,237
|
48,837
|
57,237
|
60,485
|
64,421
|
65,076
|
65,273
|
65,315
|
|||||||||||||||||||||||||||||||
|
2017
|
28,707
|
40,213
|
49,703
|
57,128
|
59,889
|
62,187
|
64,074
|
64,219
|
||||||||||||||||||||||||||||||||
|
2018
|
33,862
|
47,941
|
57,451
|
69,487
|
74,421
|
79,308
|
80,375
|
|||||||||||||||||||||||||||||||||
|
2019
|
36,948
|
53,026
|
63,575
|
72,139
|
80,617
|
81,647
|
||||||||||||||||||||||||||||||||||
|
2020
|
31,884
|
46,459
|
60,665
|
70,669
|
78,974
|
|||||||||||||||||||||||||||||||||||
|
2021
|
39,851
|
56,101
|
69,908
|
80,595
|
||||||||||||||||||||||||||||||||||||
|
2022
|
46,242
|
67,367
|
81,554
|
|||||||||||||||||||||||||||||||||||||
|
2023
|
45,387
|
65,131
|
||||||||||||||||||||||||||||||||||||||
|
2024
|
43,206
|
|||||||||||||||||||||||||||||||||||||||
|
Total
|
694,349
|
|||||||||||||||||||||||||||||||||||||||
|
All outstanding liabilities before 2015, net of reinsurance
|
62
|
|||||||||||||||||||||||||||||||||||||||
|
Liabilities for claims and claims adjustment expenses, net of reinsurance
|
$
|
172,308
|
||||||||||||||||||||||||||||||||||||||
|
Commercial Multi-Peril
|
At December 31, 2024
|
|||||||||||||||||||||||||||||||||||||||||||||||
|
Incurred Claims and Allocated Claim Adjustment Expenses, Net of Reinsurance
For the Year Ended December 31,
|
||||||||||||||||||||||||||||||||||||||||||||||||
|
Accident
Year
|
2015
|
2016
|
2017
|
2018
|
2019
|
2020
|
2021
|
2022
|
2023
|
2024
|
Total IBNR Plus Expected Development on Reported Claims
|
Cumulative Number of Reported Claims
|
||||||||||||||||||||||||||||||||||||
|
Unaudited
|
||||||||||||||||||||||||||||||||||||||||||||||||
|
(dollars and reported claims in thousands)
|
||||||||||||||||||||||||||||||||||||||||||||||||
|
2015
|
|
42,070
|
|
43,874
|
|
44,728
|
|
45,104
|
|
45,873
|
|
45,366
|
|
45,420
|
|
45,595
|
|
46,181
|
$
|
45,941
|
$
|
—
|
6
|
|||||||||||||||||||||||||
|
2016
|
43,005
|
46,988
|
48,267
|
48,871
|
48,732
|
48,823
|
48,802
|
48,374
|
48,213
|
18
|
6
|
|||||||||||||||||||||||||||||||||||||
|
2017
|
56,185
|
56,043
|
56,517
|
54,812
|
55,076
|
54,244
|
55,002
|
54,475
|
39
|
7
|
||||||||||||||||||||||||||||||||||||||
|
2018
|
66,265
|
66,470
|
67,749
|
67,810
|
65,911
|
65,900
|
65,727
|
178
|
7
|
|||||||||||||||||||||||||||||||||||||||
|
2019
|
71,865
|
73,836
|
76,326
|
75,821
|
76,015
|
74,995
|
559
|
7
|
||||||||||||||||||||||||||||||||||||||||
|
2020
|
83,195
|
79,910
|
76,490
|
74,796
|
72,624
|
1,722
|
8
|
|||||||||||||||||||||||||||||||||||||||||
|
2021
|
116,827
|
117,574
|
119,321
|
116,202
|
8,459
|
7
|
||||||||||||||||||||||||||||||||||||||||||
|
2022
|
142,395
|
141,935
|
139,486
|
16,187
|
7
|
|||||||||||||||||||||||||||||||||||||||||||
|
2023
|
129,069
|
125,596
|
23,997
|
6
|
||||||||||||||||||||||||||||||||||||||||||||
|
2024
|
119,376
|
43,797
|
5
|
|||||||||||||||||||||||||||||||||||||||||||||
|
Total
|
$
|
862,635
|
||||||||||||||||||||||||||||||||||||||||||||||
|
Commercial Multi-Peril
|
||||||||||||||||||||||||||||||||||||||||
|
Cumulative Paid Claims and Allocated Claim Adjustment Expenses, Net of Reinsurance
For the Year Ended December 31,
|
||||||||||||||||||||||||||||||||||||||||
|
Accident
Year
|
2015
|
2016
|
2017
|
2018
|
2019
|
2020
|
2021
|
2022
|
2023
|
2024
|
||||||||||||||||||||||||||||||
|
Unaudited
|
||||||||||||||||||||||||||||||||||||||||
|
(in thousands)
|
||||||||||||||||||||||||||||||||||||||||
|
2015
|
|
21,837
|
|
29,419
|
|
34,323
|
|
39,162
|
|
42,849
|
|
44,090
|
|
44,439
|
|
44,764
|
|
45,572
|
$
|
45,678
|
||||||||||||||||||||
|
2016
|
19,660
|
29,402
|
34,612
|
41,193
|
43,435
|
44,944
|
47,432
|
48,048
|
48,169
|
|||||||||||||||||||||||||||||||
|
2017
|
27,399
|
36,926
|
42,691
|
46,361
|
49,488
|
51,494
|
52,422
|
53,886
|
||||||||||||||||||||||||||||||||
|
2018
|
30,597
|
42,296
|
48,050
|
54,913
|
59,118
|
62,253
|
63,040
|
|||||||||||||||||||||||||||||||||
|
2019
|
28,210
|
41,266
|
47,522
|
55,951
|
63,156
|
69,762
|
||||||||||||||||||||||||||||||||||
|
2020
|
34,729
|
46,193
|
52,646
|
58,754
|
66,669
|
|||||||||||||||||||||||||||||||||||
|
2021
|
46,768
|
69,735
|
82,580
|
94,484
|
||||||||||||||||||||||||||||||||||||
|
2022
|
57,641
|
86,664
|
100,931
|
|||||||||||||||||||||||||||||||||||||
|
2023
|
56,238
|
82,006
|
||||||||||||||||||||||||||||||||||||||
|
2024
|
45,663
|
|||||||||||||||||||||||||||||||||||||||
|
Total
|
670,288
|
|||||||||||||||||||||||||||||||||||||||
|
All outstanding liabilities before 2015, net of reinsurance
|
814
|
|||||||||||||||||||||||||||||||||||||||
|
Liabilities for claims and claims adjustment expenses, net of reinsurance
|
$
|
193,161
|
||||||||||||||||||||||||||||||||||||||
|
Workers’ Compensation
|
At December 31, 2024
|
|||||||||||||||||||||||||||||||||||||||||||||||
|
Incurred Claims and Allocated Claim Adjustment Expenses, Net of Reinsurance
For the Year Ended December 31, |
||||||||||||||||||||||||||||||||||||||||||||||||
|
Accident
Year
|
2015
|
2016
|
2017
|
2018
|
2019
|
2020
|
2021
|
2022
|
2023
|
2024
|
Total IBNR Plus Expected Development on Reported Claims
|
Cumulative Number of Reported Claims
|
||||||||||||||||||||||||||||||||||||
|
Unaudited
|
||||||||||||||||||||||||||||||||||||||||||||||||
|
(dollars and reported claims in thousands)
|
||||||||||||||||||||||||||||||||||||||||||||||||
|
2015
|
|
53,332
|
|
49,615
|
|
45,991
|
|
44,986
|
|
43,006
|
|
42,597
|
|
42,225
|
|
42,043
|
|
41,875
|
$
|
41,705
|
$
|
92
|
6
|
|||||||||||||||||||||||||
|
2016
|
58,814
|
49,802
|
47,883
|
44,969
|
44,098
|
43,559
|
43,484
|
43,447
|
43,610
|
189
|
6
|
|||||||||||||||||||||||||||||||||||||
|
2017
|
60,450
|
56,351
|
52,687
|
51,464
|
49,557
|
48,802
|
48,668
|
48,504
|
622
|
6
|
||||||||||||||||||||||||||||||||||||||
|
2018
|
62,197
|
55,291
|
52,514
|
47,912
|
47,007
|
46,742
|
46,552
|
694
|
6
|
|||||||||||||||||||||||||||||||||||||||
|
2019
|
60,998
|
59,624
|
57,728
|
56,480
|
55,893
|
56,121
|
631
|
7
|
||||||||||||||||||||||||||||||||||||||||
|
2020
|
57,172
|
57,850
|
57,384
|
56,714
|
56,605
|
1,050
|
6
|
|||||||||||||||||||||||||||||||||||||||||
|
2021
|
67,035
|
65,530
|
64,225
|
64,445
|
2,346
|
7
|
||||||||||||||||||||||||||||||||||||||||||
|
2022
|
67,046
|
67,331
|
69,467
|
3,418
|
7
|
|||||||||||||||||||||||||||||||||||||||||||
|
2023
|
62,401
|
65,137
|
7,311
|
6
|
||||||||||||||||||||||||||||||||||||||||||||
|
2024
|
60,522
|
21,305
|
5
|
|||||||||||||||||||||||||||||||||||||||||||||
|
Total
|
$
|
552,668
|
||||||||||||||||||||||||||||||||||||||||||||||
|
Workers’ Compensation
|
||||||||||||||||||||||||||||||||||||||||
|
Cumulative Paid Claims and Allocated Claim Adjustment Expenses, Net of Reinsurance
For the Year Ended December 31,
|
||||||||||||||||||||||||||||||||||||||||
|
Accident
Year
|
2015
|
2016
|
2017
|
2018
|
2019
|
2020
|
2021
|
2022
|
2023
|
2024
|
||||||||||||||||||||||||||||||
|
Unaudited
|
||||||||||||||||||||||||||||||||||||||||
|
(in thousands)
|
||||||||||||||||||||||||||||||||||||||||
|
2015
|
|
13,071
|
|
27,531
|
|
34,192
|
|
36,929
|
|
37,936
|
|
38,596
|
|
39,096
|
|
39,478
|
|
39,762
|
$
|
39,898
|
||||||||||||||||||||
|
2016
|
14,709
|
30,344
|
37,178
|
40,570
|
41,208
|
41,543
|
41,809
|
42,195
|
42,486
|
|||||||||||||||||||||||||||||||
|
2017
|
15,581
|
31,990
|
39,684
|
42,954
|
44,242
|
45,174
|
45,935
|
46,339
|
||||||||||||||||||||||||||||||||
|
2018
|
17,644
|
31,928
|
37,072
|
41,611
|
43,279
|
44,359
|
44,624
|
|||||||||||||||||||||||||||||||||
|
2019
|
16,939
|
33,009
|
41,740
|
47,121
|
50,079
|
51,944
|
||||||||||||||||||||||||||||||||||
|
2020
|
14,591
|
32,817
|
44,089
|
48,259
|
50,928
|
|||||||||||||||||||||||||||||||||||
|
2021
|
20,931
|
42,633
|
51,781
|
56,162
|
||||||||||||||||||||||||||||||||||||
|
2022
|
18,643
|
41,225
|
51,916
|
|||||||||||||||||||||||||||||||||||||
|
2023
|
17,546
|
39,922
|
||||||||||||||||||||||||||||||||||||||
|
2024
|
15,800
|
|||||||||||||||||||||||||||||||||||||||
|
Total
|
440,019
|
|||||||||||||||||||||||||||||||||||||||
|
All outstanding liabilities before 2015, net of reinsurance
|
6,493
|
|||||||||||||||||||||||||||||||||||||||
|
Liabilities for claims and claims adjustment expenses, net of reinsurance
|
$
|
119,142
|
||||||||||||||||||||||||||||||||||||||
|
At December 31,
|
||||
|
(in thousands)
|
2024
|
|||
|
Net outstanding liabilities:
|
||||
|
Personal automobile
|
$
|
104,248
|
||
|
Homeowners
|
23,822
|
|||
|
Commercial automobile
|
172,308
|
|||
|
Commercial multi-peril
|
193,161
|
|||
|
Workers’ compensation
|
119,142
|
|||
|
Other
|
36,626
|
|||
|
649,307
|
||||
|
Reinsurance recoverable:
|
||||
|
Personal automobile
|
$
|
89,839
|
||
|
Homeowners
|
15,647
|
|||
|
Commercial automobile
|
98,041
|
|||
|
Commercial multi-peril
|
100,308
|
|||
|
Workers’ compensation
|
82,666
|
|||
|
Other
|
12,058
|
|||
|
398,559
|
||||
|
Unallocated loss adjustment expenses
|
$
|
73,119
|
||
|
Gross liability for unpaid losses and loss expenses
|
$
|
1,120,985
|
||
|
Average Annual Percentage Payout of Incurred Claims by Age, Net of Reinsurance
|
||||||||||||||||||||||||||||||||||||||||
|
Years
|
1
|
2
|
3
|
4
|
5
|
6
|
7
|
8
|
9
|
10
|
||||||||||||||||||||||||||||||
|
Personal automobile
|
65.4
|
%
|
17.2
|
%
|
9.0
|
%
|
4.3
|
%
|
2.2
|
%
|
0.9
|
%
|
0.5
|
%
|
0.1
|
%
|
0.1
|
%
|
0.1
|
%
|
||||||||||||||||||||
|
Homeowners
|
81.1
|
16.1
|
1.2
|
0.5
|
0.2
|
0.2
|
—
|
0.1
|
0.1
|
—
|
||||||||||||||||||||||||||||||
|
Commercial automobile
|
41.5
|
18.2
|
13.9
|
12.1
|
6.9
|
3.5
|
1.6
|
0.4
|
—
|
0.5
|
||||||||||||||||||||||||||||||
|
Commercial multi-peril
|
43.5
|
18.5
|
9.9
|
10.2
|
7.6
|
4.6
|
2.2
|
1.6
|
1.0
|
0.2
|
||||||||||||||||||||||||||||||
|
Workers’ compensation
|
30.3
|
32.9
|
15.5
|
7.8
|
3.4
|
2.0
|
1.0
|
0.9
|
0.7
|
0.3
|
||||||||||||||||||||||||||||||
|
FHLB stock purchased and owned as part of the agreement
|
$
|
1,605,000
|
||
|
Collateral pledged, at par (carrying value $40,655,374)
|
44,054,754
|
|||
|
Borrowing capacity currently available
|
3,322,670
|
|
|
• |
excess of loss reinsurance, under which Donegal Mutual and our insurance subsidiaries recovered losses over a set retention of $3.0
million for all liability and workers’ compensation losses and a set retention of $4.0 million for property losses; and
|
|
|
• |
catastrophe reinsurance, under which Donegal Mutual and our insurance subsidiaries recovered 100% of an accumulation of many
losses resulting from a single event, including natural disasters, over a set retention of $25.0 million up to aggregate losses
of $175.0 million per occurrence.
|
|
2024
|
2023
|
2022
|
||||||||||
|
Premiums written
|
$
|
38,495,838
|
$
|
43,030,879
|
$
|
37,002,702
|
||||||
|
Premiums earned
|
38,688,465
|
42,416,710
|
36,947,675
|
|||||||||
|
Losses and loss expenses
|
(2,537,221
|
)
|
16,318,760
|
31,096,016
|
||||||||
|
Prepaid reinsurance premiums
|
6,540,327
|
6,732,955
|
6,118,784
|
|||||||||
|
Liability for losses and loss expenses
|
101,730,415
|
116,717,187
|
149,628,406
|
|||||||||
|
2024
|
2023
|
2022
|
||||||||||
|
Premiums earned
|
$
|
411,032,074
|
$
|
388,073,427
|
$
|
383,059,075
|
||||||
|
Losses and loss expenses
|
214,853,176
|
275,171,587
|
249,037,288
|
|||||||||
|
Prepaid reinsurance premiums
|
176,161,872
|
168,724,466
|
160,591,399
|
|||||||||
|
Liability for losses and loss expenses
|
417,012,858
|
437,013,974
|
451,184,222
|
|||||||||
|
2024
|
2023
|
2022
|
||||||||||
|
Direct
|
$
|
737,539,403
|
$
|
702,227,408
|
$
|
641,971,207
|
||||||
|
Assumed
|
623,210,848
|
589,675,724
|
568,272,026
|
|||||||||
|
Ceded
|
(418,469,480
|
)
|
(396,206,492
|
)
|
(366,714,634
|
)
|
||||||
|
Net premiums written
|
$
|
942,280,771
|
$
|
895,696,640
|
$
|
843,528,599
|
||||||
|
2024
|
2023
|
2022
|
||||||||||
|
Direct
|
$
|
735,818,955
|
$
|
686,584,907
|
$
|
627,331,528
|
||||||
|
Assumed
|
611,864,599
|
583,559,906
|
578,216,997
|
|||||||||
|
Ceded
|
(411,032,074
|
)
|
(388,073,427
|
)
|
(383,059,075
|
)
|
||||||
|
Net premiums earned
|
$
|
936,651,480
|
$
|
882,071,386
|
$
|
822,489,450
|
||||||
|
Percentage of assumed premiums earned to net premiums earned
|
65.3
|
%
|
66.2
|
%
|
70.3
|
%
|
||||||
|
2024
|
2023
|
2022
|
||||||||||
|
Current federal income tax
|
$
|
11,958,424
|
$
|
408,575
|
$
|
1,280,041
|
||||||
|
Deferred federal income tax
|
(481,744
|
)
|
229,397
|
(2,958,735
|
)
|
|||||||
|
Income tax expense (benefit)
|
$
|
11,476,680
|
$
|
637,972
|
$
|
(1,678,694
|
)
|
|||||
|
2024
|
2023
|
2022
|
||||||||||
|
Income (loss) before income tax expense (benefit)
|
$
|
62,338,932
|
$
|
5,063,476
|
$
|
(3,638,099
|
)
|
|||||
|
Tax at federal statutory rate
|
13,091,176
|
1,063,330
|
(764,001
|
)
|
||||||||
|
Tax-exempt interest
|
(1,260,114
|
)
|
(1,328,312
|
)
|
(1,446,102
|
)
|
||||||
|
Proration
|
329,468
|
351,415
|
384,944
|
|||||||||
|
Dividends received deduction
|
(57,759
|
)
|
(77,348
|
)
|
(93,675
|
)
|
||||||
|
Stock options
|
101,600
|
595,602
|
216,893
|
|||||||||
|
Additional tax paid for
prior year
|
(5,157 | ) | 159,261 | (6,071 | ) | |||||||
|
Fixed-maturity dispositions
|
(585,845 | ) | — | — | ||||||||
|
Other, net
|
(136,689
|
)
|
(125,976
|
)
|
29,318
|
|||||||
|
Income tax expense (benefit)
|
$
|
11,476,680
|
$
|
637,972
|
$
|
(1,678,694
|
)
|
|||||
|
2024
|
2023
|
|||||||
|
Deferred tax assets:
|
||||||||
|
Unearned premium
|
$
|
18,377,475
|
$
|
18,130,477
|
||||
|
Loss reserves
|
10,579,697
|
10,067,846
|
||||||
|
Net unrealized losses
|
7,498,822 | 8,743,238 | ||||||
|
Net state operating loss carryforward - DGI Parent
|
7,581,066
|
8,072,420
|
||||||
|
Other
|
1,035,322
|
1,492,635
|
||||||
|
Total gross deferred tax assets
|
45,072,382
|
46,506,616
|
||||||
|
Less valuation allowance
|
(7,581,066
|
)
|
(8,072,420
|
)
|
||||
|
Net deferred tax assets
|
37,491,316
|
38,434,196
|
||||||
|
Deferred tax liabilities:
|
||||||||
|
Deferred policy acquisition costs
|
15,402,863
|
15,759,115
|
||||||
|
Loss reserve transition adjustment
|
271,738
|
564,002
|
||||||
|
Other
|
3,046,854
|
2,578,554
|
||||||
|
Total gross deferred tax liabilities
|
18,721,455
|
18,901,671
|
||||||
|
Net deferred tax asset
|
$
|
18,769,861
|
$
|
19,532,525
|
||||
|
Number of Options
|
Weighted-
Average
Exercise Price
Per Share
|
|||||||
|
Outstanding at December 31, 2021
|
8,109,726
|
|
15.22
|
|||||
|
Granted - 2022
|
956,600
|
14.08
|
||||||
|
Exercised - 2022
|
(1,202,806
|
)
|
14.50
|
|||||
|
Forfeited - 2022
|
(545,618
|
)
|
15.35
|
|||||
|
Expired - 2022
|
(935,723 | ) | 16.81 | |||||
|
Outstanding at December 31, 2022
|
6,382,179
|
14.94
|
||||||
|
Granted - 2023
|
959,200
|
13.87
|
||||||
|
Exercised - 2023
|
(493,866
|
)
|
13.79
|
|||||
|
Forfeited - 2023
|
(379,288
|
)
|
15.29
|
|||||
|
Expired - 2023
|
(1,415,897 | ) | 15.81 | |||||
|
Outstanding at December 31, 2023
|
5,052,328
|
14.58
|
||||||
|
Granted - 2024
|
910,100
|
15.76
|
||||||
|
Exercised - 2024
|
(2,035,226
|
)
|
15.06
|
|||||
|
Forfeited - 2024
|
(211,400
|
)
|
14.19
|
|||||
|
Expired - 2024
|
(229,309
|
)
|
15.63
|
|||||
|
Outstanding at December 31, 2024
|
3,486,493
|
$
|
14.57
|
|||||
|
Exercisable at:
|
||||||||
|
December 31, 2022
|
4,627,630
|
$
|
15.21
|
|||||
|
December 31, 2023
|
3,234,327
|
$
|
14.90
|
|||||
|
December 31, 2024
|
1,792,942
|
$
|
14.24
|
|||||
|
Grant Date
|
Exercise Price
|
Number of Options Outstanding
|
Weighted-Average
Remaining
Contractual Life
|
Number of Options Exercisable
|
|||||||||
|
December 17, 2020
|
|
14.43
|
469,550
|
1.0 years
|
469,550
|
||||||||
|
January 4, 2021
|
14.07
|
10,000
|
1.0 years
|
10,000
|
|||||||||
|
December 16, 2021
|
14.39
|
557,793
|
2.0 years
|
557,793
|
|||||||||
|
December 15, 2022
|
14.09
|
727,750
|
3.0 years
|
485,166
|
|||||||||
|
December 21, 2023
|
13.87 | 811,300 | 4.0
years |
270,433 | |||||||||
| December 19, 2024 | 15.76 | 910,100 | 5.0 years | — | |||||||||
|
Total
|
3,486,493
|
1,792,942
|
|||||||||||
|
Shares Issued
|
||||||||
|
Price
|
Shares
|
|||||||
|
January 1, 2022
|
$ |
12.15
|
24,907
|
|||||
|
July 1, 2022
|
11.56
|
23,454
|
||||||
|
January 1, 2023
|
12.07
|
26,545
|
||||||
|
July 1, 2023
|
12.27
|
28,912
|
||||||
|
January 1, 2024
|
11.89
|
29,787
|
||||||
|
July 1, 2024
|
10.95
|
33,899
|
||||||
|
2024
|
2023
|
2022
|
||||||||||
|
Atlantic States:
|
||||||||||||
|
Statutory capital and surplus
|
$
|
316,926,609
|
$
|
273,626,140
|
$
|
263,579,356
|
||||||
|
Statutory unassigned surplus
|
209,677,754
|
167,301,333
|
158,056,862
|
|||||||||
|
Statutory net income (loss)
|
40,741,454
|
7,193,716
|
(3,124,687
|
)
|
||||||||
|
MICO:
|
||||||||||||
|
Statutory capital and surplus
|
74,616,370
|
71,608,571
|
75,441,871
|
|||||||||
|
Statutory unassigned surplus
|
52,590,070
|
49,582,271
|
53,422,483
|
|||||||||
|
Statutory net income (loss)
|
7,822,780
|
3,298,940
|
(233,391
|
)
|
||||||||
|
Peninsula:
|
||||||||||||
|
Statutory capital and surplus
|
47,342,601
|
50,398,403
|
52,234,684
|
|||||||||
|
Statutory unassigned surplus
|
29,033,401
|
32,089,203
|
33,925,484
|
|||||||||
|
Statutory net income
|
2,140,162
|
4,121,754
|
4,192,697
|
|||||||||
|
Southern:
|
||||||||||||
|
Statutory capital and surplus
|
70,050,664
|
68,041,175
|
64,463,124
|
|||||||||
|
Statutory unassigned surplus
|
(16,898,113
|
)
|
(8,907,602
|
)
|
7,523,951
|
|||||||
|
Statutory net loss
|
(7,147,676
|
)
|
(16,927,267
|
)
|
(410,561
|
)
|
||||||
|
Year Ended December 31,
|
||||||||||||
|
2024
|
2023
|
2022
|
||||||||||
|
Statutory net income (loss) of insurance subsidiaries
|
$
|
43,556,720
|
$
|
(2,312,857
|
)
|
$
|
424,058
|
|||||
|
Increases (decreases):
|
||||||||||||
|
Deferred policy acquisition costs
|
(1,696,437
|
)
|
1,873,174
|
5,141,857
|
||||||||
|
Deferred federal income taxes
|
481,744
|
(229,397
|
)
|
2,958,735
|
||||||||
|
Salvage and subrogation recoverable
|
3,674,600
|
3,644,800
|
5,195,800
|
|||||||||
|
Consolidating eliminations and adjustments
|
(9,024,921
|
)
|
(10,574,579
|
)
|
(14,791,466
|
)
|
||||||
|
Parent-only net income (loss)
|
13,870,546
|
12,024,363
|
(888,389
|
)
|
||||||||
|
Net income (loss)
|
$
|
50,862,252
|
$
|
4,425,504
|
$
|
(1,959,405
|
)
|
|||||
|
December 31,
|
||||||||||||
|
2024
|
2023
|
2022
|
||||||||||
|
Statutory capital and surplus of insurance subsidiaries
|
$
|
508,936,244
|
$
|
463,674,289
|
$
|
455,719,035
|
||||||
|
Increases (decreases):
|
||||||||||||
|
Deferred policy acquisition costs
|
73,346,967
|
75,043,404
|
73,170,230
|
|||||||||
|
Deferred federal income taxes
|
(13,302,370
|
)
|
(13,072,768
|
)
|
(23,794,084
|
)
|
||||||
|
Salvage and subrogation recoverable
|
36,025,600
|
32,351,000
|
28,706,200
|
|||||||||
|
Non-admitted assets and other adjustments, net
|
1,722,807
|
1,328,142
|
712,623
|
|||||||||
|
Fixed maturities
|
(33,993,851
|
)
|
(41,036,366
|
)
|
(49,367,986
|
)
|
||||||
|
Parent-only equity and other adjustments
|
(26,959,266
|
)
|
(38,542,347
|
)
|
(1,553,006
|
)
|
||||||
|
Stockholders’ equity
|
$
|
545,776,131
|
$
|
479,745,354
|
$
|
483,593,012
|
||||||
|
2024
|
2023
|
2022
|
||||||||||
|
Income taxes
|
$
|
3,500,000
|
$
|
—
|
$
|
4,500,000
|
||||||
|
Interest
|
969,089
|
618,519
|
623,947
|
|||||||||
|
Year Ended December 31,
|
||||||||||||
|
(in thousands)
|
2024
|
2023
|
2022
|
|||||||||
|
Basic earnings (loss) per share:
|
||||||||||||
|
Numerator:
|
||||||||||||
|
Allocation of net income (loss)
|
$
|
43,178
|
$
|
3,788
|
$
|
(1,571
|
)
|
|||||
|
Denominator:
|
||||||||||||
|
Weighted-average shares outstanding
|
28,155
|
27,469
|
26,409
|
|||||||||
|
Basic earnings (loss) per share
|
$
|
1.53
|
$
|
0.14
|
$
|
(0.06
|
)
|
|||||
|
Diluted earnings (loss) per share:
|
||||||||||||
|
Numerator:
|
||||||||||||
|
Allocation of net income (loss)
|
$
|
43,178
|
$
|
3,788
|
$
|
(1,571
|
)
|
|||||
|
Denominator:
|
||||||||||||
|
Number of shares used in basic computation
|
28,155
|
27,469
|
26,409
|
|||||||||
|
Weighted-average effect of dilutive securities
|
||||||||||||
|
Add: Director and employee stock options
|
91
|
94
|
—
|
|||||||||
|
Number of shares used in per share computations
|
28,246
|
27,563
|
26,409
|
|||||||||
|
Diluted earnings (loss) per share
|
$
|
1.53
|
$
|
0.14
|
$
|
(0.06
|
)
|
|||||
|
Year Ended December 31,
|
||||||||||||
|
(in thousands)
|
2024
|
2023
|
2022
|
|||||||||
|
Basic and diluted earnings (loss) per share:
|
||||||||||||
|
Numerator:
|
||||||||||||
|
Allocation of net income (loss)
|
$
|
7,684
|
$
|
638
|
$
|
(388
|
)
|
|||||
|
Denominator:
|
||||||||||||
|
Weighted-average shares outstanding
|
5,577
|
5,577
|
5,577
|
|||||||||
|
Basic and diluted earnings (loss) per share
|
$
|
1.38
|
$
|
0.11
|
$
|
(0.07
|
)
|
|||||
|
December 31,
|
2024
|
2023
|
||||||
|
Assets
|
||||||||
|
Investment in subsidiaries/affiliates (equity method)
|
$
|
559,452
|
$
|
506,855
|
||||
|
Short-term investments
|
6,551
|
1,469
|
||||||
|
Cash
|
20,014
|
8,043
|
||||||
|
Property and equipment
|
385
|
504
|
||||||
|
Other
|
2,013
|
4,866
|
||||||
|
Total assets
|
$
|
588,415
|
$
|
521,737
|
||||
|
Liabilities and Stockholders’ Equity
|
||||||||
|
Liabilities
|
||||||||
|
Cash dividends declared to stockholders
|
$
|
6,031
|
$
|
5,570
|
||||
|
Notes payable to subsidiary
|
35,000
|
35,000
|
||||||
|
Other
|
1,608
|
1,422
|
||||||
|
Total liabilities
|
42,639
|
41,992
|
||||||
|
Stockholders’ equity
|
545,776
|
479,745
|
||||||
|
Total liabilities and stockholders’ equity
|
$
|
588,415
|
$
|
521,737
|
||||
|
Year Ended December 31,
|
2024
|
2023
|
2022
|
|||||||||
|
Statements of Income (Loss)
|
||||||||||||
|
Revenues
|
||||||||||||
|
Dividends from subsidiaries
|
$
|
15,000
|
$
|
13,000
|
$
|
—
|
||||||
|
Other
|
669
|
638
|
526
|
|||||||||
|
Total revenues
|
15,669
|
13,638
|
526
|
|||||||||
|
Expenses
|
||||||||||||
|
Operating expenses
|
1,314
|
1,202
|
1,245
|
|||||||||
|
Interest
|
1,120
|
787
|
787
|
|||||||||
|
Total expenses
|
2,434
|
1,989
|
2,032
|
|||||||||
|
Income (loss) before income tax benefit and equity in undistributed net income (loss) of subsidiaries
|
13,235
|
11,649
|
(1,506
|
)
|
||||||||
|
Income tax benefit
|
(635
|
)
|
(375
|
)
|
(618
|
)
|
||||||
|
Income (loss) before equity in undistributed net income (loss) of subsidiaries
|
13,870
|
12,024
|
(888
|
)
|
||||||||
|
Equity in undistributed net income (loss) of subsidiaries
|
36,992
|
(7,598
|
)
|
(1,071
|
)
|
|||||||
|
Net income (loss)
|
$
|
50,862
|
$
|
4,426
|
$
|
(1,959
|
)
|
|||||
|
Statements of Comprehensive Income (Loss)
|
||||||||||||
|
Net income (loss)
|
$
|
50,862
|
$
|
4,426
|
$
|
(1,959
|
)
|
|||||
|
Other comprehensive income (loss), net of tax
|
||||||||||||
|
Unrealized gain (loss) - subsidiaries
|
4,681
|
6,018
|
(44,988
|
)
|
||||||||
|
Other comprehensive income (loss), net of tax
|
4,681
|
6,018
|
(44,988
|
)
|
||||||||
|
Comprehensive income (loss)
|
$
|
55,543
|
$
|
10,444
|
$
|
(46,947
|
)
|
|||||
|
Year Ended December 31,
|
2024
|
2023
|
2022
|
|||||||||
|
Cash flows from operating activities:
|
||||||||||||
|
Net income (loss)
|
$
|
50,862
|
$
|
4,426
|
$
|
(1,959
|
)
|
|||||
|
Adjustments:
|
||||||||||||
|
Equity in undistributed net (income) loss of subsidiaries
|
(36,992
|
)
|
7,598
|
1,071
|
||||||||
|
Other
|
3,159
|
(168
|
)
|
(1,972
|
)
|
|||||||
|
Net adjustments
|
(33,833
|
)
|
7,430
|
(901
|
)
|
|||||||
|
Net cash provided (used)
|
17,029
|
11,856
|
(2,860
|
)
|
||||||||
|
Cash flows from investing activities:
|
||||||||||||
|
Net (purchase) sale of short-term investments
|
(5,082
|
)
|
5,856
|
(7,316
|
)
|
|||||||
|
Net purchase of property and equipment
|
—
|
(45
|
)
|
—
|
||||||||
|
Investment in subsidiaries
|
(10,924
|
)
|
(819
|
)
|
(768
|
)
|
||||||
|
Other
|
— | 30 | (28 | ) | ||||||||
|
Net cash (used) received
|
(16,006
|
)
|
5,022
|
(8,112
|
)
|
|||||||
|
Cash flows from financing activities:
|
||||||||||||
|
Cash dividends paid
|
(22,701
|
)
|
(21,894
|
)
|
(20,503
|
)
|
||||||
|
Issuance of common stock
|
33,649
|
9,771
|
20,388
|
|||||||||
|
Net cash received (used)
|
10,948
|
(12,123
|
)
|
(115
|
)
|
|||||||
|
Net change in cash
|
11,971
|
4,755
|
(11,087
|
)
|
||||||||
|
Cash at beginning of year
|
8,043
|
3,288
|
14,375
|
|||||||||
|
Cash at end of year
|
$
|
20,014
|
$
|
8,043
|
$
|
3,288
|
||||||
|
2024
|
||||||||||||||||
|
Investments
|
Commercial Lines
|
Personal
Lines
|
Total
|
|||||||||||||
|
(in thousands)
|
||||||||||||||||
|
Revenues:
|
||||||||||||||||
|
Net premiums earned
|
$
|
—
|
$
|
539,683
|
$
|
396,968
|
$
|
936,651
|
||||||||
|
Net investment income
|
44,918
|
—
|
—
|
44,918
|
||||||||||||
|
Investment gains
|
4,981
|
—
|
—
|
4,981
|
||||||||||||
|
Total segment revenues
|
49,899
|
539,683
|
396,968
|
986,550
|
||||||||||||
|
Other
|
3,055
|
|||||||||||||||
|
Total revenues
|
$
|
989,605
|
||||||||||||||
|
Segment expenses:
|
||||||||||||||||
|
Net losses and loss expenses
|
—
|
336,353
|
271,918
|
608,271
|
||||||||||||
|
Other underwriting expenses
|
—
|
193,431
|
119,311
|
312,742
|
||||||||||||
|
Policyholder dividends
|
—
|
4,073
|
—
|
4,073
|
||||||||||||
|
Total segment expenses
|
—
|
533,857
|
391,229
|
925,086
|
||||||||||||
|
SAP underwriting income
|
—
|
5,826
|
5,739
|
11,565
|
||||||||||||
|
GAAP adjustments
|
1,331
|
|||||||||||||||
|
GAAP underwriting income
|
12,896
|
|||||||||||||||
|
Net investment income
|
44,918
|
|||||||||||||||
|
Investment gains
|
4,981
|
|||||||||||||||
|
Other
|
(456
|
)
|
||||||||||||||
|
Income before income tax expense
|
$
|
62,339
|
||||||||||||||
|
2023
|
||||||||||||||||
|
Investments
|
Commercial Lines
|
Personal
Lines
|
Total
|
|||||||||||||
|
(in thousands)
|
||||||||||||||||
|
Revenues:
|
||||||||||||||||
|
Net premiums earned
|
$
|
—
|
$
|
533,029
|
$
|
349,042
|
$
|
882,071
|
||||||||
|
Net investment income
|
40,853
|
—
|
—
|
40,853
|
||||||||||||
|
Investment gains
|
3,173
|
—
|
—
|
3,173
|
||||||||||||
|
Total segment revenues
|
44,026
|
533,029
|
349,042
|
926,097
|
||||||||||||
|
Other
|
1,241
|
|||||||||||||||
|
Total revenues
|
$
|
927,338
|
||||||||||||||
|
Segment expenses:
|
||||||||||||||||
|
Net losses and loss expenses
|
—
|
346,177
|
265,894
|
612,071
|
||||||||||||
|
Other underwriting expenses
|
—
|
188,537
|
118,266
|
306,803
|
||||||||||||
|
Policyholder dividends
|
—
|
5,313
|
—
|
5,313
|
||||||||||||
|
Total segment expenses
|
—
|
540,027
|
384,160
|
924,187
|
||||||||||||
|
SAP underwriting loss
|
—
|
(6,998
|
)
|
(35,118
|
)
|
(42,116
|
)
|
|||||||||
|
GAAP adjustments
|
3,735
|
|||||||||||||||
|
GAAP underwriting loss
|
(38,381
|
)
|
||||||||||||||
|
Net investment income
|
40,853
|
|||||||||||||||
|
Investment gains
|
3,173
|
|||||||||||||||
|
Other
|
(582
|
)
|
||||||||||||||
|
Income before income tax expense
|
$
|
5,063
|
||||||||||||||
|
2022
|
||||||||||||||||
|
Investments
|
Commercial Lines
|
Personal
Lines
|
Total
|
|||||||||||||
|
(in thousands)
|
||||||||||||||||
|
Revenues:
|
||||||||||||||||
|
Net premiums earned
|
$
|
—
|
$
|
521,227
|
$
|
301,263
|
$
|
822,490
|
||||||||
|
Net investment income
|
34,016
|
—
|
—
|
34,016
|
||||||||||||
|
Investment losses
|
(10,185
|
)
|
—
|
—
|
(10,185
|
)
|
||||||||||
|
Total segment revenues
|
23,831
|
521,227
|
301,263
|
846,321
|
||||||||||||
|
Other
|
1,900
|
|||||||||||||||
|
Total revenues
|
$
|
848,221
|
||||||||||||||
|
Segment expenses:
|
||||||||||||||||
|
Net losses and loss expenses
|
—
|
350,719
|
217,581
|
568,300
|
||||||||||||
|
Other underwriting expenses
|
—
|
187,613
|
97,188
|
284,801
|
||||||||||||
|
Policyholder dividends
|
—
|
5,560
|
—
|
5,560
|
||||||||||||
|
Total segment expenses
|
—
|
543,892
|
314,769
|
858,661
|
||||||||||||
|
SAP underwriting loss
|
—
|
(22,665
|
)
|
(13,506
|
)
|
(36,171
|
)
|
|||||||||
|
GAAP adjustments
|
8,667
|
|||||||||||||||
|
GAAP underwriting loss
|
(27,504
|
)
|
||||||||||||||
|
Net investment income
|
34,016
|
|||||||||||||||
|
Investment losses
|
(10,185
|
)
|
||||||||||||||
|
Other
|
35
|
|||||||||||||||
|
Loss before income tax benefit
|
$
|
(3,638
|
)
|
|||||||||||||
|
At and For the Year Ended
December 31, 2024
|
At and For the Year Ended
December 31, 2023
|
|||||||||||||||
|
Held-to-
Maturity, Net
of Allowance
for Expected
Credit Losses
|
Allowance for
Expected Credit
Losses
|
Held-to-
Maturity, Net
of Allowance
for Expected
Credit Losses
|
Allowance for
Expected Credit
Losses
|
|||||||||||||
|
(in thousands)
|
||||||||||||||||
|
Balance at beginning of period
|
$ | 679,497 | $ | 1,326 | $ | 688,439 | $ | — | ||||||||
|
Cumulative effect of adoption of updated accounting guidance for credit losses
|
— | 1,268 | ||||||||||||||
|
Current period change for expected credit losses
|
62
|
58
|
||||||||||||||
|
Balance at end of period
|
$ | 705,714 | $ | 1,388 | $ | 679,497 | $ | 1,326 | ||||||||
|
At and For the Year Ended
December 31, 2024
|
At and For the Year Ended
December 31, 2023
|
|||||||||||||||
|
Reinsurance
Receivable, Net
of Allowance
for Expected
Credit Losses
|
Allowance for
Expected
Credit Losses
|
Reinsurance
Receivable, Net
of Allowance
for Expected
Credit Losses
|
Allowance for
Expected
Credit Losses
|
|||||||||||||
|
(in thousands)
|
||||||||||||||||
|
Balance at beginning of period
|
$ | 441,431 | $ | 1,394 | $ | 456,522 | $ | — | ||||||||
|
Cumulative effect of adoption of updated accounting guidance for credit losses
|
— | 1,132 | ||||||||||||||
|
Current period change for expected credit losses
|
(1,003
|
)
|
262
|
|||||||||||||
|
Balance at end of period
|
$ | 420,742 | $ | 391 | $ | 441,431 | $ | 1,394 | ||||||||
|
|
• |
evaluating the Company’s actuarial methods by comparing them to generally accepted actuarial practices
|
|
|
• |
developing an independent estimate of reserves for certain lines of business using methods consistent with generally accepted actuarial practices by independently forming assumptions of loss development factors, a priori ratios, and
the weighting of actuarial methods when more than one was used, considering internal and external factors
|
|
|
• |
assessing the Company’s internal actuarial analysis for certain lines of business by reviewing the assumptions and actuarial methods used, which included the selection of loss development factors, a
priori ratios, and the weighting of actuarial methods when more than one was used, considering internal and external factors
|
|
|
• |
developing a range of reserves and comparing to the Company’s recorded reserves and assessing movement of the Company’s recorded reserves within that range.
|

| Item 9. |
Changes in and Disagreements with Accountants on Accounting and Financial Disclosure.
|
| Item 9A. |
Controls and Procedures.
|
| Item 9B. |
Other Information.
|
| Item 10. |
Directors, Executive Officers and Corporate Governance.
|
| Item 11. |
Executive Compensation.
|
| Item 12. |
Security Ownership of Certain Beneficial Owners and Management and Related Stockholder Matters.
|
| Item 13. |
Certain Relationships and Related Transactions, and Director Independence.
|
| Item 14. |
Principal Accounting Fees and Services.
|
| Item 15. |
Exhibits, Financial Statement Schedules.
|
|
|
(a) |
Financial statements, financial statement schedule and exhibits filed:
|
|
|
(i) |
Consolidated Financial Statements
|
|
Page
|
|
|
105
|
|
|
Donegal Group Inc. and Subsidiaries:
|
|
|
63
|
|
|
64
|
|
|
65
|
|
| 66 | |
|
67
|
|
|
(Filed as Exhibit 23.1)
|
|
|
(b) |
Financial Statement Schedule
|
|
113
|
|
|
Filed herewith
|
|
|
(c) |
Exhibits
|
|
Exhibit No.
|
Description of Exhibits
|
|
Reference
|
|
|
|
|
|
|
|
|
3.1
|
Certificate of Incorporation of Donegal Group Inc., as amended.
|
|
(g)
|
|
|
|
|
|
|
|
|
3.2
|
Second Amended and Restated By-laws of Donegal Group Inc.
|
|
(n)
|
|
|
3.3
|
State of Delaware Certificate of Change of Registered Agent and/or Registered Office
|
(o)
|
||
|
|
|
|
|
|
|
4.1
|
Description of Donegal Group Inc’s Securities Registered pursuant to Section 12 of the Exchange Act.
|
(k)
|
||
|
Management Contracts and Compensatory Plans or Arrangements
|
||||
|
|
|
|
|
|
|
10.1
|
Employment Agreement dated as of October 1, 2020 among Donegal Mutual Insurance Company, Donegal Group Inc. and Kevin G. Burke.
|
(j)
|
||
|
10.2
|
Employment Agreement dated as of October 1, 2020 among Donegal Mutual Insurance Company, Donegal Group Inc. and Jeffrey D. Miller.
|
(j)
|
||
|
10.3
|
Form of Employment Agreement dated as of October 1, 2020 among Donegal Mutual Insurance Company, Donegal Group Inc. and Our Executive Officers
Other Than Kevin G. Burke and Jeffrey D. Miller.
|
(p)
|
||
|
10.4
|
Donegal Mutual Insurance Company 401(k) Plan.
|
|
(a)
|
|
|
|
|
|
||
|
10.5
|
Amendment No. 1 effective January 1, 2000 to Donegal Mutual Insurance Company 401(k) Plan.
|
|
(a)
|
|
|
|
|
|
||
|
10.6
|
Amendment No. 2 effective January 6, 2000 to Donegal Mutual Insurance Company 401(k) Plan.
|
|
(b)
|
|
|
|
|
|
||
|
10.7
|
Amendment No. 3 effective July 23, 2001 to Donegal Mutual Insurance Company 401(k) Plan.
|
|
(b)
|
|
|
10.8
|
Amendment No. 4 effective January 1, 2002 to Donegal Mutual Insurance Company 401(k) Plan.
|
|
(b)
|
|
|
|
|
|
||
|
10.9
|
Amendment No. 5 effective December 31, 2001 to Donegal Mutual Insurance Company 401(k) Plan.
|
|
(b)
|
|
|
10.10
|
|
Amendment No. 6 effective July 1, 2002 to Donegal Mutual Insurance Company 401(k) Plan.
|
(c)
|
|
|
10.11
|
Donegal Group Inc. 2019 Equity Incentive Plan for Employees.
|
(h)
|
||
|
10.12
|
Donegal Group Inc. 2019 Equity Incentive Plan for Directors.
|
(h)
|
||
|
10.13
|
Donegal Group Inc. 2020 Long-Term Executive Incentive Plan.
|
(i)
|
||
|
10.14
|
Donegal Group Inc. 2021 Employee Stock Purchase Plan.
|
(m)
|
||
|
10.15
|
Donegal Group Inc. Cash Incentive Bonus Plan for 2022.
|
(l)
|
||
|
10.16
|
Donegal Group Inc. Cash Incentive Bonus Plan for 2023.
|
(p)
|
||
|
10.17
|
Donegal Group Inc. Cash Incentive Bonus Plan for 2024.
|
(r)
|
||
|
10.18
|
Donegal Group Inc. 2023 Long-Term Executive Incentive Plan.
|
(p)
|
||
|
10.19
|
Donegal Group Inc. 2024 Equity Incentive Plan for Employees.
|
(s)
|
||
|
10.20
|
Donegal Group Inc. 2024 Equity Incentive Plan for Directors.
|
(s)
|
||
|
10.21
|
Filed herewith
|
|||
|
Other Material Contracts
|
||||
|
|
|
|
|
|
|
10.22
|
Amended and Restated Proportional Reinsurance Agreement dated March 1, 2010 between Donegal Mutual Insurance Company and Atlantic States
Insurance Company.
|
|
(e)
|
|
|
|
|
|
|
|
|
10.23
|
Amended and Restated Tax Sharing Agreement dated December 1, 2010 among Donegal Group Inc., Atlantic States Insurance Company, Southern
Insurance Company of Virginia, Le Mars Insurance Company, The Peninsula Insurance Company, Peninsula Indemnity Company and Michigan Insurance Company.
|
|
(f)
|
|
|
10.24
|
Amended and Restated Services Allocation Agreement dated September 1, 2021 among Donegal Mutual Insurance Company, Donegal Group Inc., Atlantic
States Insurance Company, Southern Insurance Company of Virginia, The Peninsula Insurance Company, Peninsula Indemnity Company and Michigan Insurance Company.
|
|
(l)
|
|
|
|
|
|
|
|
|
10.25
|
Quota-share Reinsurance Agreement dated December 1, 2010 between Donegal Mutual Insurance Company and Michigan Insurance Company.
|
|
(f)
|
|
|
|
|
|
|
|
|
10.26
|
Discretionary Loan Agreement between Donegal Group Inc. and M&T Bank dated August 1, 2020.
|
(k)
|
||
|
10.27
|
Amendment to Discretionary Loan Agreement between Donegal Group Inc. and M&T Bank dated September 24, 2021 - terms effective as of June 30,
2023 benchmark transition event.
|
(q)
|
||
|
10.28
|
Donegal Group Inc. 2024 Agency Stock Purchase Plan.
|
(t)
|
||
|
14
|
Code of Business Conduct and Ethics.
|
|
(d)
|
|
|
|
|
|
|
|
|
19
|
Filed herewith
|
|||
|
21
|
|
Filed herewith
|
||
|
|
|
|
|
|
|
23.1
|
|
Filed herewith
|
||
|
|
|
|
|
|
|
31.1
|
|
Filed herewith
|
||
|
|
|
|
|
|
|
31.2
|
|
Filed herewith
|
||
|
32.1
|
|
Filed herewith
|
||
|
32.2
|
|
Filed herewith
|
||
|
97.1
|
Donegal Group Inc. Incentive Compensation Recoupment Policy.
|
(r)
|
||
|
Exhibit 101.INS
|
XBRL Instance Document
|
Filed herewith
|
||
|
Exhibit 101.SCH
|
XBRL Taxonomy Extension Schema Document
|
Filed herewith
|
||
|
Exhibit 101.PRE
|
XBRL Taxonomy Presentation Linkbase Document
|
Filed herewith
|
||
|
Exhibit 101.CAL
|
XBRL Taxonomy Calculation Linkbase Document
|
Filed herewith
|
||
|
Exhibit 101.LAB
|
XBRL Taxonomy Label Linkbase Document
|
Filed herewith
|
||
|
Exhibit 101.DEF
|
XBRL Taxonomy Extension Definition Linkbase Document
|
Filed herewith
|
|
(a)
|
We incorporate such exhibit by reference to the like-described exhibit in Registrant’s Form 10-K Report for the year ended December 31, 1999.
|
|
(b)
|
We incorporate such exhibit by reference to the like-described exhibit in Registrant’s Form 10-K Report for the year ended December 31, 2001.
|
|
(c)
|
We incorporate such exhibit by reference to the like-described exhibit in Registrant’s Form 10-K Report for the year ended December 31, 2002.
|
|
(d)
|
We incorporate such exhibit by reference to the like-described exhibit in Registrant’s Form 10-K Report for the year ended December 31, 2003.
|
|
(e)
|
We incorporate such exhibit by reference to the like-described exhibit in Registrant’s Form 10-K Report for the year ended December 31, 2009.
|
|
(f)
|
We incorporate such exhibit by reference to the like-described exhibit in Registrant’s Form 10-K Report for the year ended December 31, 2010.
|
|
(g)
|
We incorporate such exhibit by reference to the like-described exhibit in Registrant’s Form 10-Q Report for the quarter ended June 30, 2019.
|
|
(h)
|
We incorporate such exhibit by reference to the copy of such plan in Registrant’s definitive proxy statement for its Annual Meeting of Stockholders held on
April 18, 2019 filed on March 18, 2019.
|
|
(i)
|
We incorporate such exhibit by reference to the like-described exhibit in Registrant’s Form 10-K Report for the year ended December 31, 2019.
|
|
(j)
|
We incorporate such exhibit by reference to the like-described exhibit in Registrant's Form 8-K Report dated October 1, 2020.
|
|
(k)
|
We incorporate such exhibit by reference to the like-described exhibit in Registrant’s Form 10-K Report for the year ended December 31, 2020.
|
|
(l)
|
We incorporate such exhibit by reference to the like-described exhibit in Registrant’s Form 10-K Report for the year ended December 31, 2021.
|
|
(m)
|
We incorporate such exhibit by reference to the copy of such plan in Registrant’s definitive proxy statement for its Annual Meeting of Stockholders held on
April 15, 2021 filed on March 15, 2021.
|
|
(n)
|
We incorporate such exhibit by reference to the like-described exhibit in Registrant’s Form 8-K Report dated July 22, 2022.
|
|
(o)
|
We incorporate such exhibit by reference to the like-described exhibit in Registrant’s Form 8-K Report dated August 10, 2022.
|
|
(p)
|
We incorporate such exhibit by reference to the like-described exhibit in Registrant’s Form 10-K Report for the year ended December 31, 2022.
|
|
(q)
|
We incorporate such exhibit by reference to the like-described exhibit in Registrant’s Form 10-Q Report for the quarter ended June 30, 2023.
|
|
(r)
|
We incorporate such exhibit by reference to the like-described exhibit in Registrant’s Form 10-K Report for the year ended December 31, 2023.
|
|
(s)
|
We incorporate such exhibit by reference to the copy of such plan in Registrant’s definitive proxy statement for its Annual Meeting of Stockholders held on
April 18, 2024 filed on March 15, 2024.
|
|
(t)
|
We incorporate such exhibit by reference to the like-described exhibit in Registrant’s For S-3 Registration Statement filed on August 30, 2024.
|
| Item 16. |
Form 10-K Summary.
|
|
Segment
|
Net
Premiums
Earned
|
Net
Investment
Income
|
Net Losses
and Loss
Expenses
|
Amortization
of Deferred
Policy
Acquisition
Costs
|
Other
Underwriting
Expenses
|
Net
Premiums
Written
|
||||||||||||||||||
|
Year Ended December 31, 2024
|
||||||||||||||||||||||||
|
Commercial lines
|
$
|
539,683
|
$
|
—
|
$
|
334,363
|
$
|
92,368
|
$
|
89,455
|
$
|
547,920
|
||||||||||||
|
Personal lines
|
396,968
|
—
|
269,755
|
67,943
|
65,799
|
394,361
|
||||||||||||||||||
|
Investments
|
—
|
44,918
|
—
|
—
|
—
|
—
|
||||||||||||||||||
|
|
$
|
936,651
|
$
|
44,918
|
$
|
604,118
|
$
|
160,311
|
$
|
155,254
|
$
|
942,281
|
||||||||||||
|
Year Ended December 31, 2023
|
||||||||||||||||||||||||
|
Commercial lines
|
$
|
533,029
|
$
|
—
|
$
|
345,401
|
$
|
94,842
|
$
|
93,325
|
$
|
528,429
|
||||||||||||
|
Personal lines
|
349,042
|
—
|
263,777
|
59,372
|
58,423
|
367,268
|
||||||||||||||||||
|
Investments
|
—
|
40,853
|
—
|
—
|
—
|
—
|
||||||||||||||||||
|
|
$
|
882,071
|
$
|
40,853
|
$
|
609,178
|
$
|
154,214
|
$
|
151,748
|
$
|
895,697
|
||||||||||||
|
Year Ended December 31, 2022
|
||||||||||||||||||||||||
|
Commercial lines
|
$
|
521,227
|
$
|
—
|
$
|
342,456
|
$
|
91,965
|
$
|
89,056
|
$
|
530,846
|
||||||||||||
|
Personal lines
|
301,263
|
—
|
221,623
|
50,465
|
48,868
|
312,684
|
||||||||||||||||||
|
Investments
|
—
|
34,016
|
—
|
—
|
—
|
—
|
||||||||||||||||||
|
|
$
|
822,490
|
$
|
34,016
|
$
|
564,079
|
$
|
142,430
|
$
|
137,924
|
$
|
843,530
|
||||||||||||
|
|
At December 31,
|
|||||||||||||||
|
Segment
|
Deferred
Policy
Acquisition
Costs
|
Liability
For Losses
and Loss
Expenses
|
Unearned
Premiums
|
Other Policy
Claims and
Benefits
Payable
|
||||||||||||
|
2024
|
||||||||||||||||
|
Commercial lines
|
$
|
44,160
|
$
|
887,820
|
$
|
368,756
|
$
|
—
|
||||||||
|
Personal lines
|
29,187
|
233,165
|
243,720
|
—
|
||||||||||||
|
Investments
|
—
|
—
|
—
|
—
|
||||||||||||
|
|
$
|
73,347
|
$
|
1,120,985
|
$
|
612,476
|
$
|
—
|
||||||||
|
2023
|
||||||||||||||||
|
Commercial lines
|
$
|
42,775
|
$
|
869,393
|
$
|
341,664
|
$
|
—
|
||||||||
|
Personal lines
|
32,268
|
256,764
|
257,747
|
—
|
||||||||||||
|
Investments
|
—
|
—
|
—
|
—
|
||||||||||||
|
|
$
|
75,043
|
$
|
1,126,157
|
$
|
599,411
|
$
|
—
|
||||||||
|
|
DONEGAL GROUP INC.
|
|
|
|
By:
|
/s/ Kevin G. Burke
|
|
|
|
Kevin G. Burke, President and Chief Executive Officer
|
| Date: March 10, 2025 | ||
|
Signature
|
Title
|
Date
|
||
|
/s/ Kevin G. Burke
|
President, Chief Executive Officer and a Director
|
March 10, 2025
|
||
|
Kevin G. Burke
|
(principal executive officer)
|
|||
|
/s/ Jeffrey D. Miller
|
Executive Vice President and Chief Financial Officer
|
March 10, 2025
|
||
|
Jeffrey D. Miller
|
(principal financial and accounting officer)
|
|||
|
/s/ Scott A. Berlucchi
|
Director
|
March 10, 2025
|
||
|
Scott A. Berlucchi
|
||||
|
/s/ Dennis J. Bixenman
|
Director
|
March 10, 2025
|
||
|
Dennis J. Bixenman
|
||||
|
/s/ Jack L. Hess
|
Director
|
March 10, 2025
|
||
|
Jack L. Hess
|
||||
|
/s/ Barry C. Huber
|
Director
|
March 10, 2025
|
||
|
Barry C. Huber
|
||||
|
/s/ David C. King
|
Director
|
March 10, 2025
|
||
|
David C. King
|
||||
|
/s/ Kevin M. Kraft, Sr.
|
Director
|
March 10, 2025
|
||
|
Kevin M. Kraft, Sr.
|
||||
|
/s/ Jon M. Mahan
|
Director
|
March 10, 2025
|
||
|
Jon M. Mahan
|
||||
|
/s/ S. Trezevant Moore, Jr.
|
Director
|
March 10, 2025
|
||
|
S. Trezevant Moore, Jr.
|
||||
|
/s/ Britta H. Schatz
|
Director
|
March 10, 2025
|
||
|
Britta H. Schatz
|
||||
|
/s/ Annette B. Szady
|
Director
|
March 10, 2025
|
||
|
Annette B. Szady
|
|
|
• |
Base Salary x Incentive Level Bonus % x Weighting % = Performance Bonus
|
|
|
• |
Sum of Performance Bonuses = Total Bonus Earned
|
|
|
1. |
Participants must be employed by Donegal Mutual Insurance Company on or before October 1, 2025 to be eligible to participate in this Plan. Participants must be employed by the Donegal Mutual Insurance Company
on December 31, 2025 in order to receive a bonus payment under this Plan.
|
|
|
2. |
No bonus is payable under this Plan unless the employees and managers of Donegal Mutual Insurance Company qualify for bonuses under their respective incentive plans.
|
|
|
3. |
Any bonuses earned under this Plan shall be paid prior to March 15, 2026.
|
|
|
4. |
Approved participants in this Plan are listed in Appendix 1. Any changes to the participants in this Plan and the incentive levels for such participants must be approved by the Joint Compensation Committee of
the Boards of Directors of Donegal Mutual Insurance Company and Donegal Group Inc. (“the Joint Compensation Committee”).
|
|
|
5. |
This Plan provides for a discretionary pool calculated in similar fashion to the bonuses for Plan participants using a “base salary” equivalent of $1,000,000. The discretionary pool may be allocated among
participants in this Plan or other officers, managers or employees in the sole discretion of the Joint Compensation Committee. The President shall provide a recommendation to the Joint Compensation Committee with respect to high performers
who should be considered for allocations from the discretionary pool.
|
|
|
6. |
Payment of bonuses under this Plan may be capped by the Joint Compensation Committee in their sole discretion.
|
|
|
Incentive Levels - Bonus % of Salary |
||||||
| Participants |
Threshold |
Level 1 |
Level 2 |
Target | Level 3 |
Level 4 |
Maximum |
|
|
|||||||
| Kevin G. Burke |
40 |
50 |
60 |
70 |
80 |
90 |
100 |
| W. Daniel DeLamater |
40 |
50 |
60 |
70 |
80 |
90 |
100 |
| Jeffrey D. Miller |
40 |
50 |
60 |
70 |
80 |
90 |
100 |
| Kristi S. Altshuler |
40 |
50 |
60 |
70 |
80 |
90 |
100 |
| David B. Bawel |
40 |
50 |
60 |
70 |
80 |
90 |
100 |
| Noland R. Deas, Jr. |
40 |
50 |
60 |
70 |
80 |
90 |
100 |
| William A. Folmar |
40 |
50 |
60 |
70 |
80 |
90 |
100 |
| Jeffery T. Hay |
40 |
50 |
60 |
70 |
80 |
90 |
100 |
| Christina M. Hoffman |
40 |
50 |
60 |
70 |
80 |
90 |
100 |
| Sanjay Pandey |
40 |
50 |
60 |
70 |
80 |
90 |
100 |
| V. Anthony Viozzi |
40 | 50 | 60 | 70 | 80 | 90 | 100 |
| Daniel J. Wagner |
40 |
50 |
60 |
70 |
80 |
90 |
100 |
| Discretionary Pool |
40 |
50 |
60 |
70 |
80 |
90 |
100 |
|
|
|||||||
|
Performance
Measure
|
Performance Objectives |
|||||||||||||||
| Weighting |
Threshold | Level 1 |
Level 2 |
Target | Level 3 |
Level 4 |
Maximum |
|||||||||
|
|
||||||||||||||||
|
Commercial Lines
Premium Growth
|
15.0% | 4.5% | 5.0% | 5.5% | 6.0% | 6.5% | 7.0% | 7.5% | ||||||||
|
|
||||||||||||||||
|
Adjusted Statutory
Combined Ratio
|
65.0% | 100.0% | 99.0% | 98.0% | 97.0% | 96.0% | 95.0% | 94.0% | ||||||||
|
|
||||||||||||||||
|
Operating Return
on Equity
|
20.0% | 7.0% | 8.0% | 9.0% | 10.0% | 11.0% |
12.0%
|
13.0% | ||||||||
|
|
||||||||||||||||
| I. |
GENERAL RULE
|
| • |
exposure to investigations by the SEC;
|
|
|
• |
criminal and civil prosecution;
|
|
|
• |
disgorgement of any profits realized or losses avoided through use of the information;
|
|
|
• |
monetary fines up to three times the gain obtained or loss avoided or imprisonment; and
|
|
|
• |
termination of employment.
|
| II. |
DEFINITIONS
|
| • |
earnings estimates;
|
|
|
• |
dividend increases or decreases;
|
|
|
• |
acquisitions;
|
|
|
• |
sales of substantial assets;
|
|
|
• |
change in debt ratings;
|
|
|
• |
significant write-downs of assets or additions to loss reserves or contingent liabilities;
|
|
|
• |
liquidity problems;
|
|
|
• |
extraordinary management developments;
|
|
|
• |
public offerings;
|
|
|
• |
major price or market changes;
|
|
|
• |
significant litigation; or
|
|
|
• |
investigations, enforcement actions or other material regulatory actions by governmental bodies.
|
|
|
• |
DGI's website;
|
|
|
• |
an earnings conference call;
|
|
|
• |
the Dow Jones broad tape;
|
|
|
• |
news wire services such as Associated Press or Reuters;
|
|
|
• |
publication by newspapers or magazines with national circulation such as The Wall Street Journal or The New York Times; and
|
|
|
• |
public documents filed with the SEC, such as periodic reports on Forms 8-K, 10-Q and 10-K, prospectuses or proxy statements.
|
| III. |
OTHER TRADING RESTRICTIONS ON DIRECTORS AND EXECUTIVE OFFICERS
|
| IV. |
REQUIREMENT FOR PRE-CLEARANCE OF TRANSACTIONS BY DIRECTORS AND EXECUTIVE OFFICERS
|
| • |
The Director or Executive Officer obtains a written pre-clearance letter from DGI's President and Chief Executive Officer or Chief Financial Officer pre-clearing the proposed
transaction before commencing the proposed transaction. In requesting a pre- clearance letter, the Director or Executive Officer must provide the President and Chief
Executive Officer or Chief Financial Officer of DGI a request letter in the form provided by DGI that shall include:
|
| • |
a specific written description of all of the material details (e.g., dollar amounts and number of shares involved, type of transaction and whether pursuant to a plan) about the
proposed transaction; and
|
|
|
• |
a written representation signed by the Director or Executive Officer that affirms that the Director or Executive Officer is not aware of, and does not have possession of, any
material non-public information regarding DGI. This representation may be made by means of a conformed signature in an e- mail.
|
|
|
• |
For stock option exercises, Computershare shall be responsible for the timely filing of any Form 144 notices required because the proposed transaction involves the sale by the
Director or Executive Officer of more than 5,000 shares of Class A or Class B common stock of DGI or aggregate proceeds of more than $50,000 in any period of three consecutive months. For all other transactions, the Chief Financial Officer
of DGI shall be responsible for any such Form 144 notices required.
|
|
|
• |
The Director or Executive Officer shall notify the Chief Financial Officer of DGI of the execution of any transactions pursuant to a pre-clearance letter on the date of the
execution of the transactions. The Chief Financial Officer of DGI or his designee shall file on behalf of such Director or Executive Officer the SEC Forms 3, 4 or 5s required to disclose such transaction.
|
|
|
• |
Window Periods. A Director or Officer may effect
transactions in securities issued by DGI only during a Window Period or an Other Period, subject to the condition that any Director or Executive Officer complies with the pre-clearance procedures set forth in Section IV(A). Window
Periods begin on the third business day following the date of DGI's publication of its results of operations for a calendar quarter and expire on the earlier of the 21st calendar day
following such date of publication or the close of business on the day immediately preceding the next meeting of DGI's Board of Directors. In the event that DGI's President and Chief Executive Officer or Chief Financial Officer
determines that a Window Period must be terminated and a Blackout Period imposed, DGI will so notify each Director and Officer.
|
|
|
• |
Blackout Periods. Directors or Officers may not engage
in transactions involving securities issued by DGI during a Blackout Period, subject to the limited exception set forth below. Blackout Periods begin on the 15th day of the last month
of each calendar quarter and continue until the commencement of the next Window Period. In the event a Director or Officer has an unanticipated personal hardship, DGI may permit a transaction involving securities issued by DGI during a
Blackout Period provided the proposed transaction receives the prior approval of three members of DGI's Board of Directors, the Director or Officer does not then possess material non-public information regarding DGI and the Director or
Officer complies with the pre-clearance procedures as provided in Section IV(A) of this Policy.
|
|
|
• |
Other Periods: Other Periods begin on the first
calendar day following the expiration of a Window Period and continue until the first day of the next succeeding Blackout Period. All proposed transactions by a Director or Officer in securities issued by DGI during an Other Period shall
only be effected in compliance with the pre-clearance procedures as provided in Section IV(A) of this Policy. In addition to that compliance, the issuance of a pre- clearance letter in compliance with Section IV(A)(2) shall require the
written determination of the President and Chief Executive Officer of DGI or Chief Financial Officer of DGI that the proposed transaction is appropriate in light of facts and circumstances then prevailing.
|
| V. |
TRADING PLANS
|
|
|
• |
The Director or Officer is entering into the plan in good faith and not as a scheme to evade SEC Rule 10b5-1; and
|
|
|
• |
Upon adoption of an SEC Rule 10b5-1 trading plan, the Director or Officer shall comply with this Policy, the Code of Business Conduct and Ethics of DGI and applicable
provisions of the federal securities laws.
|
|
|
• |
expressly specify the securities the Director or Officer proposes to purchase or sell, the prices at which and the dates on which the Director or Officer proposes to purchase
or sell securities issued by DGI;
|
|
|
• |
include a written formula or algorithm, or computer program, for determining amounts, prices and dates; or
|
|
|
• |
not permit the Director or Officer to exercise any subsequent influence over how, when or whether to effect purchases or sales, provided, in addition, that any other person who
does exercise such influence pursuant to the binding contract, instruction or written plan, such as a broker, is not aware of any material non-public information relating to DGI when doing so.
|
| VI. |
SEC REPORTING REQUIREMENTS
|
| A. |
Form 4: Two-Day Filing Requirement
|
|
|
• |
The Form 4 two-day period begins to run on the date of execution of the transaction, e.g., a purchase or sale of a security issued by DGI on a Monday must be reported to the
SEC before 10:00 p.m. eastern time on the ensuing Wednesday.
|
|
|
• |
Securities transactions subject to Section 16 of the 1934 Act include any transactions in which a Director or Executive Officer has a beneficial interest, including
transactions by a Director or Executive Officer's Related Interests.
|
|
|
• |
The following Director or Executive Officer transactions involving securities issued by DGI are subject to the two-day Form 4 filing requirements:
|
|
|
• |
purchases or sales of securities issued by DGI in either brokered transactions or private transactions;
|
|
|
• |
stock option grants;
|
|
|
• |
restricted stock grants;
|
|
|
• |
stock option exercises, including cashless exercises;
|
|
|
• |
purchases or sales of securities issued by DGI on behalf of a trust for which the Director or Executive Officer serves as trustee or is a beneficiary; and
|
|
|
• |
bonuses or other awards in the form of DGI stock.
|
|
|
B. |
Form 4: Five-Day Filing Requirement
|
|
|
• |
The Form 4 filing requirement provides for an extension of the Form 4 filing deadline where the Director or Executive Officer may not control the exact date on which the
transaction occurs. The five-day filing requirement applies to voluntary stock purchases under DGI's Dividend Reinvestment and Stock Purchase Plan (the "Reinvestment Plan").
|
|
|
• |
Transactions involving DGI stock in those plans require Form 4 filings on the earlier of: (i) two days after
the date the Director or Executive Officer is notified of the completion of the trade or (ii) the fifth business day following the transaction. Because of the fifth day following the transaction may occur before the Director or
Executive Officer receives notice, DGI has implemented procedures to track Director or Executive Officer transactions in the affected plans to ensure that timely SEC filings occur with respect to all reportable transactions.
|
|
|
C. |
Transactions Exempt From SEC Reporting
|
|
|
• |
The following transactions by Directors and Executive Officers of DGI remain exempt from SEC Section 16, and do not require any filing with the SEC:
|
|
|
• |
acquisitions of DGI Class A common stock through normal payroll contributions to DGI's 401(k) Plan, including matching contributions made by DGI;
|
|
|
• |
acquisitions of DGI Class A or Class B common stock through stock splits or stock dividends;
|
|
|
• |
reinvestment of dividends to purchase DGI Class A common stock, but not voluntary purchases, under the Reinvestment Plan; and
|
|
|
• |
purchases of DGI Class A common stock under DGI's employee stock purchase plan and agents stock purchase plan.
|
|
|
• |
Gifts of shares of common stock of DGI by Directors and Executive Officers must be reported annually on Form 5, unless the Director or Executive Officer has previously filed a
Form 4 on a voluntary basis to report the gift.
|
|
|
D. |
Compliance Procedures
|
|
|
• |
Electronic Filing/Powers of Attorney: All Directors or
Executive Officers shall, with the assistance of the Chief Financial Officer of DGI, obtain a code identification from the SEC, which code will permit the Chief Financial Officer of DGI or his designee to file electronically all Forms 3,
4 or 5 and Forms 144 on behalf of such Director or Executive Officer.
|
|
|
• |
Broker Requirements: All Directors or Executive
Officers are urged to register their shares with Computershare and not hold them in broker street name. If such Director's or Executive Officer's shares are held in broker street name, then the Director or Executive Officer and any
Related Interests are required to execute a Broker Instruction Form with their broker. This Form imposes the following two restrictions on brokers who propose to execute purchases and sales of stock of DGI on behalf of such Director or
Executive Officer:
|
|
|
• |
not to enter any order without confirming with the Chief Financial Officer of DGI that the transaction has been pre- cleared and complies with the brokerage firm's compliance
procedures (e.g. Rule 144); and
|
|
|
• |
to advise the Chief Financial Officer of DGI regarding the relevant details of all purchases or sales in DGI stock conducted by the broker simultaneously with the execution of
the transaction.
|
|
|
• |
Rule 144 Requirements. A Director or Executive Officer
of DGI must comply with the provisions of the Securities Act of 1933, as amended (the "1933 Act") prior to effecting sales of DGI's Class A or Class B common stock in a public market. In order for any such person to sell shares of DGI
Class A or Class B common stock, the sale of the shares must either be registered under the 1933 Act, which is unlikely to occur, or comply with an exemption from such registration. This requirement for registration or exemption with
respect to a sale of shares of DGI's Class A or Class B common stock applies to all shares held by a Director or Executive Officer, including, but not limited to, shares purchased on the open market or shares purchased privately.
|
|
|
• |
The Director or Executive Officer must file a Form 144 with the SEC concurrently with placing the sale order with a broker or upon execution of the trade with a market maker if
the contemplated sale involves more than 5,000 shares of common stock of DGI or $50,000 in gross proceeds in any period of three consecutive months.
|
|
|
• |
DGI must be current in its reporting requirements under the 1934 Act at the time of sale;
|
|
|
• |
If the shares of DGI proposed to be sold were acquired in a private transaction (i.e., directly from DGI or an affiliate), the Director or Executive Officer must have held and
beneficially owned the shares for a period of six months before a sale can be made under Rule 144.
|
|
|
• |
The amount of common stock of DGI that may be sold in any period of three consecutive months may not exceed the greater of 1% of the outstanding common stock of DGI
(approximately 250,000 shares) or the average weekly trading volume on NASDAQ during the four calendar weeks preceding the sale; and
|
|
|
• |
The common stock of DGI must be sold in unsolicited "brokers' transactions" or directly to "market makers" or in "riskless principal transactions" as those terms are defined in
Rule 144.
|
| VII. |
INTERPRETATION
|
|
Name
|
State of Incorporation
|
|
|
Atlantic States Insurance Company
|
Pennsylvania
|
|
|
Southern Insurance Company of Virginia
|
Virginia
|
|
|
The Peninsula Insurance Company
|
Pennsylvania
|
|
|
Peninsula Indemnity Company*
|
Pennsylvania
|
|
|
Michigan Insurance Company
|
Michigan
|
|
/s/ Kevin G. Burke
|
|
|
Kevin G. Burke, President and Chief Executive Officer
|
|
|
Date: March 10, 2025
|
|
/s/ Jeffrey D. Miller
|
|
|
Jeffrey D. Miller, Executive Vice President
and Chief Financial Officer
|
|
|
Date: March 10, 2025
|
|
|
/s/ Kevin G. Burke
|
|
|
Kevin G. Burke, President and Chief Executive Officer
|
|
Date: March 10, 2025
|
|
/s/ Jeffrey D. Miller
|
|
|
Jeffrey D. Miller, Executive Vice President
and Chief Financial Officer
|
|
|
Date: March 10, 2025
|