|
Exhibit
|
Description
|
|
|
Press Release – 2025 Rhyolite Ridge Lithium-Boron Mineral Resource Estimate
|
|
ioneer Ltd
|
||
|
(registrant)
|
||
|
Date: March 5, 2025
|
By: /s/ Ian Bucknell
|
|
|
Name:
|
Ian Bucknell | |
|
Title:
|
Chief Financial Officer & Company Secretary | |
 |

|
| • |
45% increase in the Rhyolite Ridge South Basin Mineral Resource estimate
|
| • |
510 million tonnes (Mt) containing 3.97 Mt of lithium carbonate equivalent and 14.66 Mt of boric acid equivalent – all within the fully permitted Project boundary
|
| • |
81% of the Resource now sits in the Measured & Indicated category
|
| • |
Three distinct Streams provide maximum flexibility around lithium carbonate and boric acid production rates
|
| • |
Underpins forthcoming Ore Reserve estimate, set for April 2025 release
|
|
|
• |
Total Mineral Resource of 510 Mt
|
|
|
• |
Contained lithium carbonate equivalent (LCE) of 3.97 Mt
|
|
|
• |
Contained boric acid equivalent (BAE) of 14.66 Mt
|
|
|
• |
Measured & Indicated Resource for Stream 1 of 152 Mt
|
|
|
• |
Measured & Indicated Resource for Streams 1 & 2 of 366 Mt
|
|
|
• |
Stream 1 – lithium mineralisation with high-boron and low-clay content
179Mt Resource containing 1.54Mt Lithium Carbonate and 12.00Mt Boric Acid.
|
|
|
• |
Stream 2 – lithium mineralisation with low-boron and low-clay content
274Mt Resource containing 1.78Mt Lithium Carbonate and 2.25Mt Boric Acid. |
|
|
• |
Stream 3 – lithium mineralisation with low-boron and high-clay content
58Mt Resource containing 0.64Mt Lithium Carbonate and 0.41Mt Boric Acid.
|
|
Summary of February 2025 Mineral Resource Estimate
|
Contained
|
|||||||
|
Stream
|
Classification
|
Tonnage
(ktonnes)
|
Li
(ppm)
|
B
(ppm)
|
Li2CO3
(Wt.%)
|
H3BO3
(Wt.%)
|
Li2CO3
(ktonnes)
|
H3BO3
(ktonnes)
|
|
1
|
Measured
|
64,380
|
1,752
|
12,670
|
0.93
|
7.24
|
600
|
4,664
|
|
Indicated
|
87,372
|
1,551
|
11,280
|
0.83
|
6.45
|
721
|
5,636
|
|
|
Inferred
|
26,873
|
1,554
|
11,102
|
0.83
|
6.35
|
222
|
1,706
|
|
|
Total
|
178,625
|
1,624
|
11,754
|
0.86
|
6.72
|
1,544
|
12,005
|
|
|
2
|
Measured
|
68,713
|
1,257
|
1,554
|
0.67
|
0.89
|
460
|
611
|
|
Indicated
|
145,061
|
1,196
|
1,583
|
0.64
|
0.90
|
923
|
1,313
|
|
|
Inferred
|
60,199
|
1,249
|
941
|
0.66
|
0.54
|
400
|
324
|
|
|
Total
|
273,973
|
1,223
|
1,434
|
0.65
|
0.82
|
1,783
|
2,247
|
|
|
3
|
Measured
|
19,191
|
2,203
|
1,552
|
1.17
|
0.89
|
225
|
170
|
|
Indicated
|
29,066
|
2,112
|
1,187
|
1.12
|
0.68
|
327
|
197
|
|
|
Inferred
|
9,518
|
1,789
|
716
|
0.95
|
0.41
|
91
|
39
|
|
|
Total
|
57,775
|
2,089
|
1,231
|
1.11
|
0.70
|
642
|
407
|
|
|
ALL
|
Grand Total
|
510,373
|
1,461
|
5,023
|
0.78
|
2.87
|
3,969
|
14,659
|
| 2 |

|
 |
|
Stream 1
|
Stream 2
|
Stream 3
|
|
|
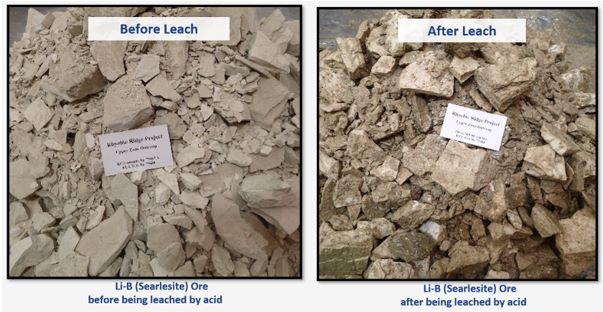
Before Leach
|
 |
 |
 |
|
After Leach
|
 |
 |
 |
|
Boron
|
HIGH
|
LOW
|
LOW
|
|
Clay
|
LOW
|
LOW
|
HIGH
|
|
Units
|
B5, L6
|
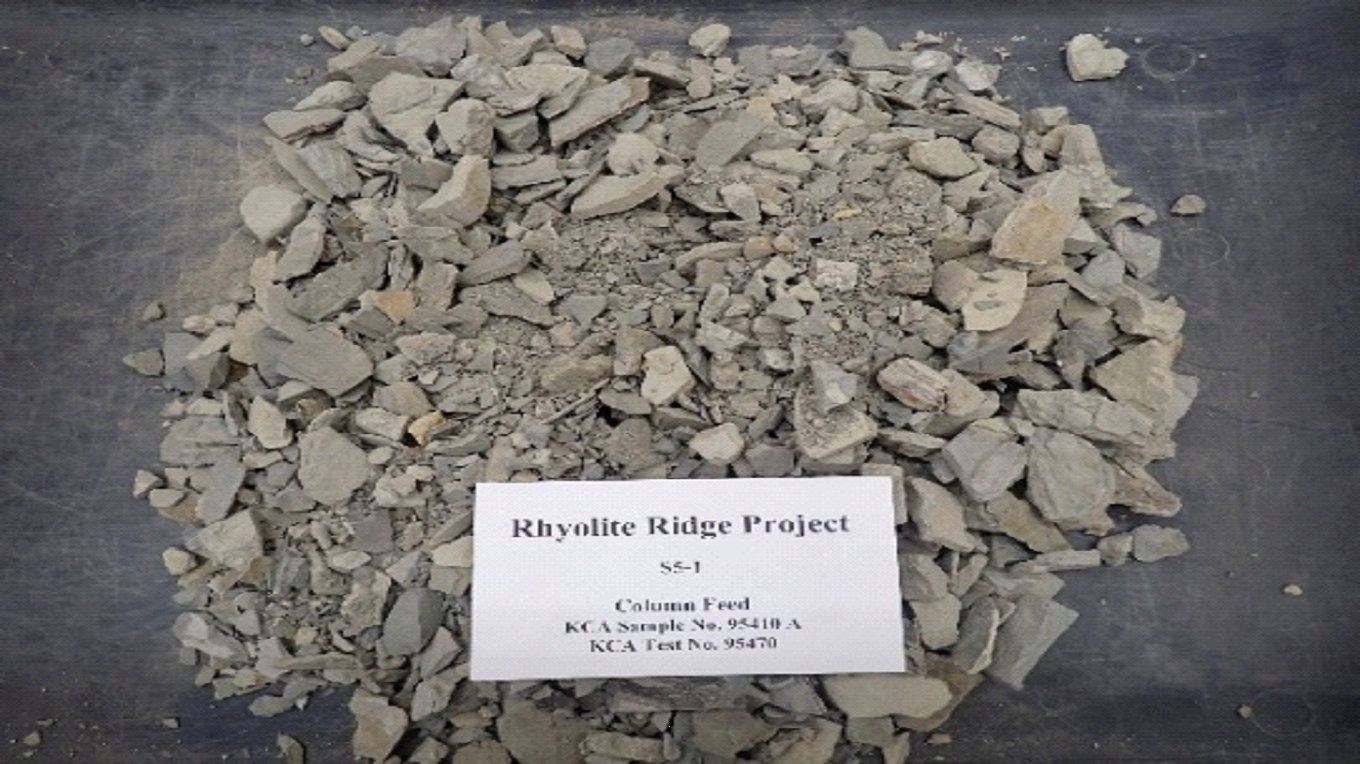
S5, L6
|
M5
|
|
Leach Method
|
VAT
|
VAT or HEAP
|
AGITATED TANK
|
| 3 |
|
|
| 4 |
|
|
|
Chad Yeftich
|
Ian Bucknell
|
|
U.S. Investor Relations
E: ir@ioneer.com
|
Aus. Investor Relations
E: ir@ioneer.com
|
|
Daniel Francis, FGS Global
|
|
|
U.S. Media Relations
E: daniel.francis@fgsglobal.com
|
|
| 5 |
|
|
| 6 |
|
|
Stream
|
Group
|
Classification
|
Tonnage
(ktonnes)
|
Li
ppm
|
B
ppm
|
Li2CO3
Wt. %
|
H3BO3
Wt. %
|
Contained
|
|
|
Li2CO3
(ktonnes)
|
H3BO3
(ktonnes)
|
||||||||
|
Stream 1 (>= 5,000 ppm B)
|
Upper
Zone
B5 Unit
|
Measured
|
38,404
|
1,891
|
15,282
|
1.01
|
8.74
|
386
|
3,356
|
|
Indicated
|
38,670
|
1,743
|
13,996
|
0.93
|
8.00
|
359
|
3,095
|
||
|
Inferred
|
10,627
|
1,712
|
10,564
|
0.91
|
6.04
|
97
|
642
|
||
|
Total
|
87,701
|
1,804
|
14,143
|
0.96
|
8.09
|
842
|
7,092
|
||
|
Upper
Zone
M5
Unit
|
Measured
|
4,562
|
2,350
|
7,592
|
1.25
|
4.34
|
57
|
198
|
|
|
Indicated
|
4,224
|
2,231
|
7,450
|
1.19
|
4.26
|
50
|
180
|
||
|
Inferred
|
763
|
2,197
|
6,515
|
1.17
|
3.73
|
9
|
28
|
||
|
Total
|
9,549
|
2,285
|
7,443
|
1.22
|
4.26
|
116
|
406
|
||
|
Upper
Zone
S5 Unit
|
Measured
|
3,693
|
1,419
|
7,641
|
0.75
|
4.37
|
28
|
161
|
|
|
Indicated
|
4,747
|
1,285
|
7,415
|
0.68
|
4.24
|
32
|
201
|
||
|
Inferred
|
1,572
|
1,400
|
6,469
|
0.75
|
3.70
|
12
|
58
|
||
|
Total
|
10,012
|
1,352
|
7,350
|
0.72
|
4.20
|
72
|
421
|
||
|
Upper
Zone
Total
|
Measured
|
46,659
|
1,899
|
13,926
|
1.01
|
7.96
|
471
|
3,715
|
|
|
Indicated
|
47,641
|
1,741
|
12,760
|
0.93
|
7.30
|
441
|
3,476
|
||
|
Inferred
|
12,962
|
1,703
|
9,829
|
0.91
|
5.62
|
117
|
728
|
||
|
Total
|
107,262
|
1,805
|
12,913
|
0.96
|
7.38
|
1,030
|
7,920
|
||
|
Lower Zone
L6 Unit
|
Measured
|
17,721
|
1,366
|
9,362
|
0.73
|
5.35
|
129
|
949
|
|
|
Indicated
|
39,731
|
1,324
|
9,507
|
0.70
|
5.44
|
280
|
2,160
|
||
|
Inferred
|
13,911
|
1,415
|
12,288
|
0.75
|
7.03
|
105
|
977
|
||
|
Total
|
71,363
|
1,352
|
10,013
|
0.72
|
5.73
|
514
|
4,086
|
||
|
Total
Stream 1 (all zones)
|
Measured
|
64,380
|
1,752
|
12,670
|
0.93
|
7.24
|
600
|
4,664
|
|
|
Indicated
|
87,372
|
1,551
|
11,280
|
0.83
|
6.45
|
721
|
5,636
|
||
|
Inferred
|
26,873
|
1,554
|
11,102
|
0.83
|
6.35
|
222
|
1,706
|
||
|
Total
|
178,625
|
1,624
|
11,754
|
0.86
|
6.72
|
1,544
|
12,005
|
||
|
Stream 2 ($16.54/tonne net value cut-off grade, Low Clay)
|
Upper
Zone
B5 Unit
|
Measured
|
4,963
|
2,229
|
2,213
|
1.19
|
1.27
|
59
|
63
|
|
Indicated
|
4,734
|
2,120
|
2,515
|
1.13
|
1.44
|
53
|
68
|
||
|
Inferred
|
3,616
|
1,715
|
1,805
|
0.91
|
1.03
|
33
|
37
|
||
|
Total
|
13,313
|
2,050
|
2,210
|
1.09
|
1.26
|
145
|
168
|
||
|
Upper
Zone
S5 Unit
|
Measured
|
21,087
|
1,090
|
1,281
|
0.58
|
0.73
|
122
|
154
|
|
|
Indicated
|
26,144
|
988
|
1,242
|
0.53
|
0.71
|
138
|
186
|
||
|
Inferred
|
11,925
|
1,003
|
1,206
|
0.53
|
0.69
|
64
|
82
|
||
|
Total
|
59,156
|
1,027
|
1,248
|
0.55
|
0.71
|
323
|
422
|
||
|
Upper
Zone
Total
|
Measured
|
26,050
|
1,307
|
1,458
|
0.70
|
0.83
|
181
|
217
|
|
|
Indicated
|
30,878
|
1,162
|
1,437
|
0.62
|
0.82
|
191
|
254
|
||
|
Inferred
|
15,541
|
1,169
|
1,345
|
0.62
|
0.77
|
97
|
120
|
||
|
Total
|
72,469
|
1,215
|
1,425
|
0.65
|
0.81
|
469
|
590
|
||
|
Lower Zone
L6 Unit
|
Measured
|
42,663
|
1,227
|
1,613
|
0.65
|
0.92
|
279
|
393
|
|
|
Indicated
|
114,183
|
1,206
|
1,622
|
0.64
|
0.93
|
733
|
1,059
|
||
|
Inferred
|
44,658
|
1,277
|
800
|
0.68
|
0.46
|
304
|
204
|
||
|
Total
|
201,504
|
1,226
|
1,438
|
0.65
|
0.82
|
1,315
|
1,657
|
||
|
Total
Stream 2 (all zones)
|
Measured
|
68,713
|
1,257
|
1,554
|
0.67
|
0.89
|
460
|
611
|
|
|
Indicated
|
145,061
|
1,196
|
1,583
|
0.64
|
0.90
|
923
|
1,313
|
||
|
Inferred
|
60,199
|
1,249
|
941
|
0.66
|
0.54
|
400
|
324
|
||
|
Total
|
273,973
|
1,223
|
1,434
|
0.65
|
0.82
|
1,783
|
2,247
|
||
|
Stream 3($16.54/tonne net value cut-off grade,
High Clay)
|
Total
Stream 3 (M5 zone)
|
Measured
|
19,191
|
2,203
|
1,552
|
1.17
|
0.89
|
225
|
170
|
|
Indicated
|
29,066
|
2,112
|
1,187
|
1.12
|
0.68
|
327
|
197
|
||
|
Inferred
|
9,518
|
1,789
|
716
|
0.95
|
0.41
|
91
|
39
|
||
|
Total
|
57,775
|
2,089
|
1,231
|
1.11
|
0.70
|
642
|
407
|
||
|
Grand Total All Streams and All Units
|
Measured
|
152,284
|
1,585
|
6,253
|
0.84
|
3.58
|
1,285
|
5,445
|
|
|
Indicated
|
261,499
|
1,417
|
4,779
|
0.75
|
2.73
|
1,971
|
7,146
|
||
|
Inferred
|
96,590
|
1,387
|
3,745
|
0.74
|
2.14
|
713
|
2,069
|
||
|
Total
|
510,373
|
1,461
|
5,023
|
0.78
|
2.87
|
3,969
|
14,659
|
|
Processing Stream
|
Group
|
Classification |
Tonnes
(M)
|
Li
(ppm)
|
B
(ppm)
|
Li2CO3
(wt.
%)
|
H3BO3
(wt.
%)
|
Li2CO3
(kt)
|
H3BO3
(kt)
|
|
Combined Streams
|
February
2025
Resource
|
Mea + Ind
|
413.8
|
1,479
|
5,321
|
0.79
|
3.04
|
3,256
|
12,590
|
|
Inf
|
96.6
|
1,387
|
3,745
|
0.74
|
2.14
|
713
|
2,069
|
||
|
Total
|
510.4
|
1,461
|
5,023
|
0.78
|
2.87
|
3,969
|
14,659
|
||
|
April
2024 Resource
|
Mea + Ind
|
258.1
|
1731
|
6779
|
0.9
|
3.9
|
2,378
|
10,004
|
|
|
Inf
|
93.3
|
1759
|
5272
|
1.0
|
3.0
|
873
|
2,813
|
||
|
Total
|
351.4
|
1739
|
6379
|
0.9
|
3.6
|
3,251
|
12,817
|
||
|
Variation
|
Mea + Ind
|
155.7
|
1,060
|
2,905
|
0.56
|
1.66
|
878
|
2,586
|
|
|
Inf
|
3.3
|
-4.91
|
-22.80
|
-160
|
-744
|
||||
|
Total
|
159.0
|
849
|
2,026
|
0.45
|
1.16
|
718
|
1,842
|
|
|
• |
The change in the calculation of acid consumption during processing and accounting for this cost has lowered the process costs; the extraction of calcium (Ca) in seam S5 was reduced from 100% to 80% and in seam L6 from 100% to 89% when
Ca <= 10% and 64% when Ca > 10%, based on metallurgical test work, thus lowering the acid consumption.
|
|
|
• |
The definition of the resource pit shell includes a G&A cost of $US 16.54/tonne (not included for the April 2024 resource pit shell), but this cost did not negatively impact the size of the resource pit
shell.
|
|
|
• |
The removal of the 1090 ppm Lithium cutoff for Streams 2 and 3, replacing it with a $US 16.54/tonne net value cutoff. This increased the amount of lower grade Lithium tonnage to be included in the mineral resource.
|
|
|
• |
The Rhyolite Ridge Mineral Resource area extends over a north-south strike length of 4,240 m (from 4,337,540 mN – 4,341,780mN), has a maximum width of 2,110m (863,330 mE – 865,440 mE) and includes the 585 m vertical interval from
2,065mRL to 1,480 mRL.
|
|
|
• |
The Rhyolite Ridge Project tenements (unpatented mining claims) are owned by Ioneer Minerals Corporation, a company wholly owned by Ioneer Ltd. The unpatented mining claims are located on US federal land administered by the Bureau of
Land Management (BLM).
|
|
|
• |
Lithium and boron mineralisation is stratiform in nature and is hosted within Late Miocene-age carbonate-rich sedimentary rock, deposited in a lacustrine environment in the Basin and Range terrain of Nevada, USA.
|
|
|
• |
Drill holes used in the Mineral Resource estimate included 50 reverse circulation (RC) holes and 110 core holes for a total of 32,530m within the defined mineralisation. The full database for the
South Basin contains records for 166 drill holes for 33,519m of drilling.
|
|
|
• |
Drill hole spacing is 100m by 100m (or less) over most of the deposit.
|
|
|
• |
Drill holes were logged for a combination of geological and geotechnical attributes. The core has been photographed and measured for RQD and core recovery.
|
|
|
• |
Drilling was conducted by American Lithium Minerals Inc., the previous owner of the property between 2010 and 2011 and by ioneer in 2017 to 2019 and 2022 to 2024. For RC drilling, a 12.7-centimetre (cm)
hammer was used with sampling conducted on 1.52m intervals and split using a rig mounted rotary splitter. The hammer was replaced with a tri-cone bit in instances of high groundwater flow. For diamond core, PQ and HQ core size diameter with
standard tube was used. Core recoveries of 93% were achieved by ioneer at the project. The core was sampled as half core at 1.52m intervals using a standard electric core saw.
|
|
|
• |
Samples were submitted to ALS Minerals Laboratory in Reno, Nevada for sample preparation and analysis. The entire sample was oven dried at 105˚C and crushed to -2 millimetre (mm). A sub-sample of
the crushed material was then pulverised to better than 85% passing -75 microns (µm) using a LM5 pulveriser. The pulverised sample was split with multiple feed in a Jones riffle splitter until a
100-200 gram (g) sub-sample was obtained for analysis.
|
|
|
• |
Analysis of the samples was conducted using aqua regia 2-acid for ICP-MS on a multi-element suite. This method is appropriate for understanding sedimentary lithium deposits and is a total method.
|
|
|
• |
Standards for lithium and boron and blanks were routinely inserted into sample batches and acceptable levels of accuracy were reportedly obtained. Based on an evaluation of the quality assurance and quality control (QA/QC) results all assay data has been deemed by the IMC Competent Person as suitable and fit for purpose in Mineral Resource estimation.
|
|
|
• |
The Mineral Resource estimate presented in this Report has been constrained by the application of an optimized Mineral Resource pit shell. The Mineral Resource pit shell was developed using the Independent
Mining Consultants, Inc. (IMC) Mine Planning software.
|
|
|
• |
The Mineral Resource estimate assumes the use of three processing streams: one which can process ore with boron content greater than 5,000 ppm and two which can process ore with boron content less than 5,000
ppm.
|
|
|
• |
The Mineral Resource estimate has been constrained by applying a 5,000 ppm Boron cut-off grade to HiB-Li mineralisation within the B5, M5, S5 and L6 geological units as well as a $16.54/tonne net value cut-off grade to LoB-Li
mineralisation in the M5, B5, S5 and L6 geological units.
|
|
•
|
Key input parameters and assumptions for the Mineral Resource pit shell included the following:
|
|
|
• |
B cut-off grade of 5,000 ppm for HiB-Li processing stream and no B cut-off grade for LoB-Li processing stream
|
|
|
• |
No Li cut-off grade for HiB-Li processing stream and net value cutoff of $16.54/tonne for LoB-Li processing stream
|
|
|
• |
Overall pit slope angle of 42 degrees in all rock units (wall angle guidance provided by Geo-Logic Associates who developed the geotechnical design).
|
|
|
• |
Fixed mining cost of US$1.69 /tonne and a variable incremental mining cost of $0.005/tonne per vertical meter from reference elevation of 6,210ft amsl
|
|
|
• |
G&A cost of US$16.54/tonne processed
|
|
|
• |
Ore processing and grade control costs include a fixed cost per tonne and a variable cost of acid based on the acid consumption rate which is calculated for each block within the mineralized seams. For HiB-Li Processing Stream the fixed
cost is $30.50/mt and the acid costs range between $30.93/mt to $52.12/mt based on the average grades per seam. For LoB-Li Processing Streams, the fixed cost ranges between $17.53/mt to $30.80/mt and the acid costs range between $26.33/mt
to $50.01/mt based on the average grades per seam.
|
|
|
• |
Boron and Li recovery of 80.2% and 85.7% respectively for HiB-Li Processing Stream.
|
|
|
• |
Boron Recovery for LoB-Li Processing Stream variable by lithology as follows: 65% in M5 Unit, 80.2% in B5 unit, 50% in S5 unit, and 37.3% in L6 unit.
|
|
|
• |
Lithium Recovery for LoB-Li Processing Streams variable by lithology as follows: 78% in M5 unit, 85.7% in B5 unit, 88% in S5 unit, and 85% in L6 unit.
|
|
|
• |
Boric Acid sales price of US$1,172.78/tonne.
|
|
|
• |
Lithium Carbonate sales price of US$19,351.38/tonne.
|
|
|
• |
Sales/Transport costs are included in the process cost.
|
|
|
• |
Drill core samples were assayed on nominal 1.52 m lengths and this data set was composited to 1.52m lengths which respected seam contacts and was used for the interpolation of grade data into a 1.52m bench height block model. The data
set honoured geological contacts (i.e. assay intervals did not span unit contacts).
|
|
|
• |
Based on a statistical analysis, extreme B grade values were identified in some of the units other than the targeted G5, B5, M5, S5, G6, L6 and Lis units. The units other than these units were not estimated so no grade capping was
applied to the drill hole database. The units B5, M5, S5 and L6 are the units of economic interest and the grades in these units and the adjacent units were estimated for completeness when re-blocking to a 9.14m bench height block model
used to tabulate the mineral resource.
|
|
|
• |
The geological model was developed as a gridded surface stratigraphic model with fault domains included which offset the stratigraphic units in various areas of the deposit. The geological model was developed by GSI under direction of
ioneer and provided to IMC as the geologic basis for grade estimation. IMC has reviewed the geological model and accepts the interpretation.
|
|
|
• |
Domaining in the model was constrained by the roof and floor surfaces of the geological units. The unit boundaries were modelled as hard boundaries, with samples interpolated only within the unit in which they occurred.
|
|
|
• |
The geological model used as the basis for estimating Mineral Resources was developed as a stratigraphic gridded surface model using a 7.6m regularized grid. The grade block model was developed using a 7.6m north-south by 7.6m east-west
by 1.52m vertical block dimension (no sub-blocking was applied). The grid cell and block size dimensions represent 25 percent of the nominal drill hole spacing across the model area. The model was reblocked to 9.14 m high blocks (six 1.52m
blocks combined vertically) for assigning the economic attributes and tabulating the mineral resource.
|
|
|
• |
Inverse Distance Squared (‘ID2’) grade interpolation was used for the estimate, constrained by stratigraphic unit roof and floor surfaces from the geological model. The search direction for estimating grade varied and followed
the floor orientation of the seams which changed within some of the fault block domains. The search distances ranged from 533 m in B5 to 229 m in S5. The number of drill hole composites used to estimate the grades of a model block ranges
from a minimum of two composites to a maximum of 10 composites, with no more than 3 composites from one drill hole.
|
|
|
• |
The density values used to convert volumes to tonnages were assigned on a by-geological unit basis using mean values calculated from 120 density samples collected from drill core during the 2018 and more recent 2022-2023 P1 and P2
drilling programs. The density values by seam ranged from 1.53 grams per cubic centimeter (‘g/cm3’) for S3 to 1.98/cm3 in seam L6. The density analyses performed by geotechnical consultants present during both the
2018 and 2022-2023 drilling programs (P1 and P2) followed a strict repeatable process in sample collection and analysis utilizing the Archimedes-principle (water displacement) method for density determination, with values reported in dry
basis. This provided consistent representative data. The 2018 and 2022-2023 data aligned well and proved to be representative across the resource.
|
|
|
• |
Estimated Mineral Resources were classified as follows:
|
|
|
• |
Measured: Between 107 and 122m spacing between points of observation depending on the seam, with sample interpolation from a minimum of four drill holes.
|
|
|
• |
Indicated: Between 168 and 244m spacing between points of observation depending on the seam, with sample interpolation from a minimum of two drill holes.
|
|
|
• |
Inferred: To the limit of the estimation range (maximum 533m, depending on the seam), with sample interpolation from a minimum of one drill hole (2 composites).
|
|
|
• |
The Mineral Resource classification included the consideration of data reliability, spatial distribution and abundance of data and continuity of geology, fault structures and grade parameters.
|
|
|
• |
The Mineral Resource estimate presented in this Report was developed with the assumption that the HiB-Li mineralization within the Mineral Resource pit shell has a reasonable prospect for eventual economic extraction using current
conventional open pit mining methods.
|
|
|
• |
The basis of the mining assumptions made in establishing the reasonable prospects for eventual economic extraction of the HiB-Li mineralization are based on preliminary results from mine design and planning work that is in-progress as
part of an ongoing update to the Feasibility Study for the Project based on new information.
|
|
|
• |
The basis of the metallurgical assumptions made in establishing the reasonable prospects for eventual economic extraction of the HiB-Li (Stream 1) mineralization are based on results from metallurgical and material processing work that
was developed as part of the ongoing Feasibility Study for the Project. This test work was performed using current processing and recovery methods for producing Boric acid and Lithium carbonate products.
|
|
|
• |
A second process stream (Stream 2) to recover Li from low boron mineralized- low clay (LoB-Li) units has been confirmed. Current results indicate a reasonable process and expectation for economic extraction of the LoB-Li from the S5, B5
and L6 units. This test work was performed using current processing and recovery methods for producing Boric acid and Lithium carbonate products.
|
|
|
• |
A third process stream (Stream 3) to recover Li from low boron high clay mineralized (LoB-Li) units has been confirmed. Current results indicate a reasonable process and expectation for economic extraction of the LoB-Li from M5 unit.
This test work was performed using current processing and recovery methods for producing Boric acid and Lithium carbonate products.
|
|
|
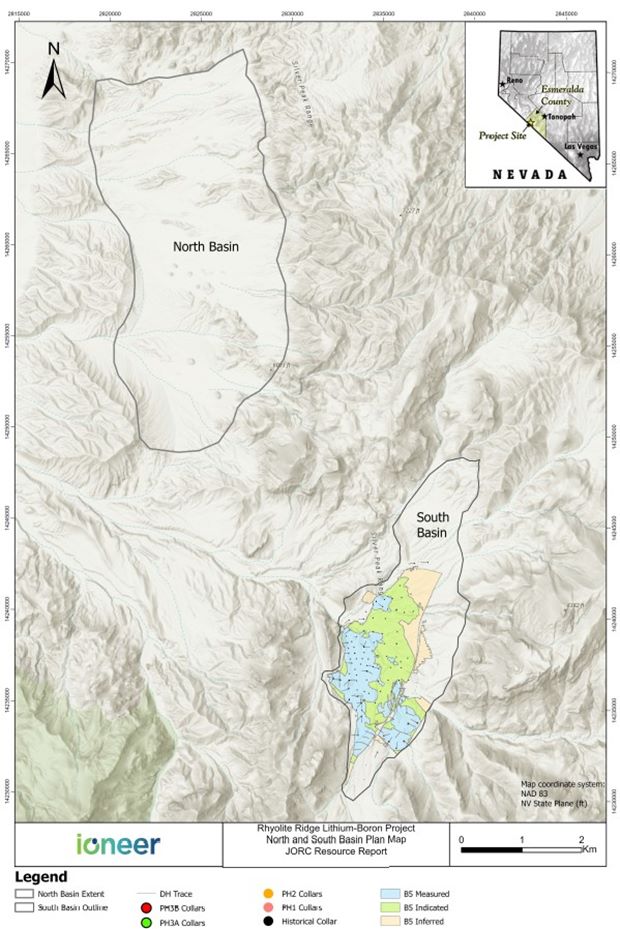
1. |
North and South Basin plan showing the location of drill holes, Resource and tenement boundary.
|
|
|
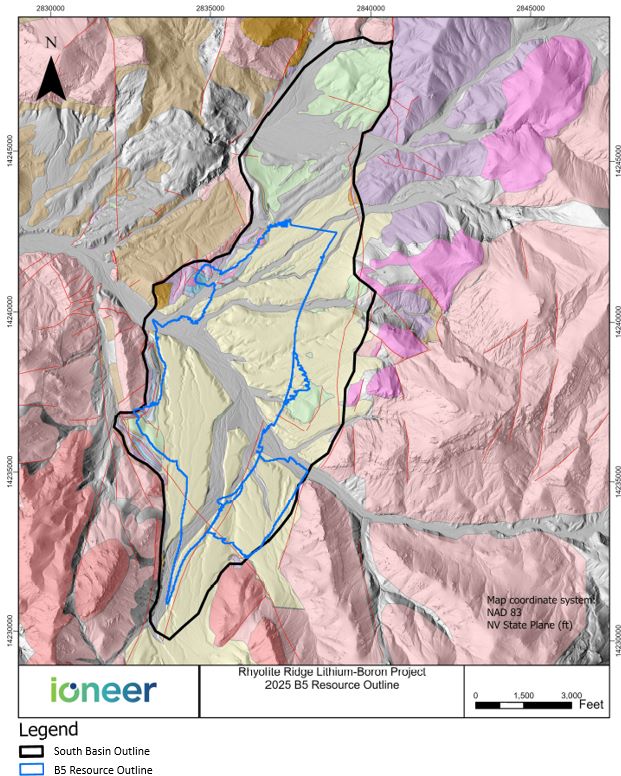
2. |
South Basin plan showing outlines of Measured, Indicated and Inferred Mineral Resources
|
|
|
3. |
South Basin South- North Cross Section looking West
|
|
|
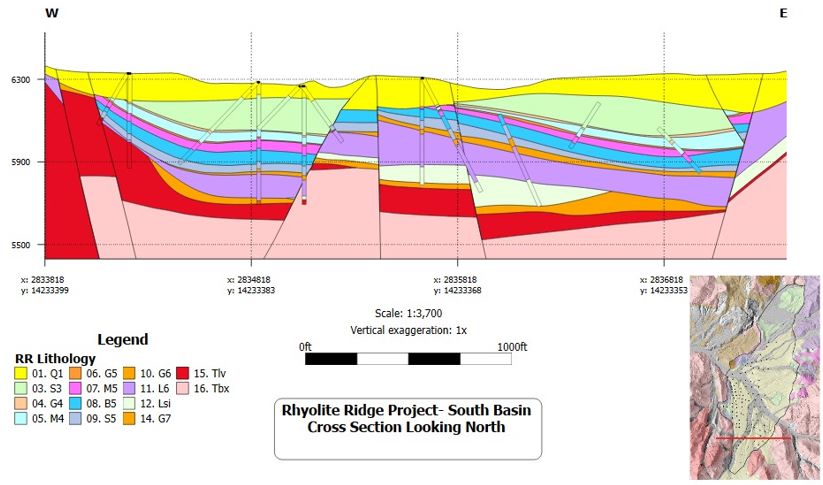
4. |
South Basin Cross Section Looking North
|

|
APPENDIX D: JORC Code, 2012 Edition - Table 1
|
|
Criteria
|
JORC Code 2012 Explanation
|
Commentary
|
|
Sampling Techniques
|
• Nature and quality of sampling (e.g. cut channels, random chips, or specific specialised industry
standard measurement tools appropriate to the minerals under investigation, such as down hole gamma sondes, or handheld XRF instruments, etc.). These examples should not be taken as limiting the broad meaning of sampling
|
• The nature and quality of the sampling from the various sampling programs includes the following:
• Reverse circulation (RC) Drilling: a sample was collected every 1.52 metre (m) from a 127-millimetre (mm)
diameter drill hole and split using a rig-mounted rotary splitter. Samples, with a mean weight of 4.8 kilograms (kg) were submitted to ALS Minerals laboratory in Reno, NV where they were processed for
assay. RC samples represent 49% of the total intervals sampled to date.
• Core Drilling: Core samples were collected from HQ (63.5 mm core diameter) and PQ (85.0 mm core diameter) drill core, on a mean interval of
1.52 m, and cut using a water-cooled diamond blade core saw. Samples, with a mean weight of 1.8 kg, were submitted to ALS where they were proceeded for assay.
• Drill Hole Deviation: Inclined core drill holes were surveyed to obtain downhole deviation by the survey company (International Directional
Services, LLC) or drilling company (Idea Drilling, Alford Drilling, IG Drilling, Boart Long Year, Major Drilling,) with a downhole Reflex Mems Gyros and Veracio TruShot tools and, for all but three of the drill holes. One drill hole could
not be surveyed due to tool error (SBH-72), and two were intentionally surveyed using an Acoustic Televiewer (SBH-60, SBH-79).
• Trenches: In addition to sampling from drill holes, samples were collected from 19 mechanically excavated trenches in 2010. The trenches
were excavated from the outcrop/subcrop using a backhoe and or hand tools. Chip samples were then collected from the floor of the trench. Due to concerns with correlation and reliability of the results from the trenches, The Competent
Person has not included any of this data in the geological model or Mineral Resource estimate.
|
|
APPENDIX D: JORC Code, 2012 Edition - Table 1
|
|
Criteria
|
JORC Code 2012 Explanation
|
Commentary
|
|
• Include reference to measures taken to ensure sample representivity and the appropriate calibration of
any measurement tools or systems used.
|
• Measures taken to ensure sample representivity include the following:
• Due to the nature of RC samples, lithological boundaries are not easily honoured; therefore, continuous 1.52 m sample intervals were taken
to ensure as representative a sample as possible. Lithological boundaries were adjusted as needed by a senior Ioneer geologist once the assay results were received.
• Core sample intervals were selected to reflect visually identifiable lithological boundaries wherever possible, to ensure sample
representivity. In cases where the lithological boundaries were gradational, the best possible interval was chosen and validated by geochemical assay results.
• All chip and core sampling were completed by or supervised by a senior Ioneer geologist. The senior Ioneer, Newfield’s and WSP geologists
referenced here, and throughout this Table 1, have sufficient relevant experience for the exploration methods employed, the type of mineralization being evaluated, and are registered professional geologists in their jurisdiction; however,
they are not Competent Persons according to the definition presented in JORC as they are not members of one of the Recognized Professional Organization” included in the ASX list referenced by JORC.
• The Competent Person was not directly involved during the exploration drilling programs and except for observing sampling procedures on
two drill holes during the site visit (August 10, 2023), was not present to observe sample selection. Based on review of the procedures during the site visit and subsequent review of the data, it is the opinion of the Competent Person that
the measures taken to ensure sample representivity were reasonable for the purpose of estimating Mineral Resources.
|
|
APPENDIX D: JORC Code, 2012 Edition - Table 1
|
|
Criteria
|
JORC Code 2012 Explanation
|
Commentary
|
|
• Aspects of the determination of mineralisation that are Material to the Public Report. In cases
where ‘industry standard’ work has been done this would be relatively simple (eg ‘reverse circulation drilling was used to obtain 1 m samples from which 3 kg was pulverised to produce a 30 g charge for fire assay’). In other
cases more explanation may be required, such as where there is coarse gold that has inherent sampling problems. Unusual commodities or mineralisation types (e.g. submarine nodules) may warrant disclosure of detailed information
|
• Aspects of the determination of mineralization included visual identification of mineralized intervals by a senior Ioneer geologist using
lithological characteristics including clay and carbonate content, grain size and the presence of key minerals such as Ulexite (hydrated sodium calcium borate hydroxide) and Searlesite (sodium borosilicate). A visual distinction between
some units, particularly where geological contacts were gradational was initially made. Final unit contacts were then determined by a senior Ioneer geologist once assay data were available.
• The Competent Person was not directly involved during the exploration drilling programs; however, the visual identification of mineralized
zones and the process for updating unit and mineralized contacts was reviewed with the Ioneer senior geologist during the site visit. The Competent Person evaluated the identified mineralized intervals against the analytical results and
agrees with the methodology used by Ioneer to determine material mineralization.
|
|
|
Drilling
techniques
|
• Drill type (e.g. core, reverse circulation, open-hole hammer, rotary air blast, auger, Bangka, sonic,
etc..) and details (e.g. core diameter, triple or standard tube, depth of diamond tails, face-sampling bit or other type, whether core is oriented and if so, by what method, etc.).
|
• Both RC and core drilling techniques have been used on the Project. Exploration drilling programs targeting Lithium-Boron (Li-B) mineralization on the Project have been implemented by American Lithium Minerals Inc. (2010-2012) and Ioneer (formerly Global Geoscience) in 2016, 2017, 2018, 2019, 2022, and 2023.
• Prior to 2018, all RC drilling was conducted using a 127 mm hammer. All pre-2018 core drill holes were drilled using HQ sized core with a
double-tube core barrel.
• For the 2018-2023 drilling programs, all core holes (vertical and inclined) were tricone drilled through unconsolidated alluvium, then
cored through to the end of the drill hole. A total of 91 core holes were drilled, 64 holes were PQ diameter and 27 were drilled as HQ diameter. Drilling was completed using a triple-tube core barrel (split inner tube) which was preferred
to a double-tube core barrel (solid inner tube) as the triple-tube improved core recovery and core integrity during core removal from the core barrel.
|
|
Drill sample recovery
|
• Method of recording and assessing core and chip sample recoveries and results assessed.
|
• Prior to 2017, chip recovery was not recorded for the RC drilling therefore the Competent Person cannot comment on drill sample recovery
for this period of drilling.
For the 2017 RC drilling program, the drill holes were geologically logged as they were being drilled; however, no estimates of chip recoveries were recorded.
Therefore, the Competent Person cannot comment on drill sample recovery for this period of drilling.
|
|
APPENDIX D: JORC Code, 2012 Edition - Table 1
|
|
Criteria
|
JORC Code 2012 Explanation
|
Commentary
|
|
• For the 2010-2012 and 2016 core drilling programs, both core recovery and rock quality index (RQD) were recorded for each cored interval.
Core recovery was determined by measuring the recovered linear core length and then calculating the recovered percentage against the total length of the core run from the drill advance. The core recovery for all the drilling ranged from
0% to 100%, with over 65 % of the drill holes having greater than 80% mean core recovery. The core recovery values were recorded by the logging geologist and reviewed by the senior Ioneer geologist. The majority of the 2010-2012 and 2016
core drill holes reported greater than 95% recovery in the B5, M5 and L6 mineralized intervals.
• For the 2018-2019 drilling program, both core recovery and RQD were recorded for each cored interval. Core recovery was determined by
measuring the recovered linear core length and then calculating the recovered percentage against the total length of the core run from the drill advance. The core recovery for all the drilling ranged from 41% to 100%, with over 65% of the
drill holes having greater than 90% mean core recovery. The core recovery values were recorded by the logging geologist and reviewed by the senior Ioneer geologist. In the target mineralized intervals (M5, B5 & L6), the mean core
recovery was 86% in the B5, 87% in the M5 and 95% in the L6 units, with most of the drill holes reporting greater than 90% recovery in the mineralized intervals.
• The Competent Person considers the core recovery for the 2023, 2022, 2018- 2019, 2016 and 2010-2012 core drilling programs to be acceptable
based on statistical analysis which identified no grade bias between sample intervals with high versus low core recoveries. On this basis, the Competent Person has made the reasonable assumption that the sample results are reliable for use
in estimating Mineral Resources.
|
||
|
• Measures taken to maximise sample recovery and ensure representative nature of the samples.
|
• Chip recoveries were not recorded for the 2010-2012 and 2017 RC drilling programs, and there is no indication of measures taken to maximize
sample recovery and ensure representative nature of samples.
• No specific measures for maximizing sample recovery were documented for the 2010-2012 and 2016 core drilling programs.
• During the 2018-2023 drilling programs, Ioneer used a triple-tube core barrel to maximize sample recovery and ensure
|
|
APPENDIX D: JORC Code, 2012 Edition - Table 1
|
|
Criteria
|
JORC Code 2012 Explanation
|
Commentary
|
|
representative nature of samples. The use of triple-tube was originally used during the 2018 drill program. A triple-tube core barrel
generally provides improved core recovery over double-tube core barrels, resulting in more complete and representative intercepts for core logging, sampling and geotechnical evaluation. It also limited any potential sample bias due to
preferential loss/gain of material.
|
||
|
• Whether a relationship exists between sample recovery and grade and whether sample bias may have
occurred due to preferential loss/gain of fine/coarse material.
|
• Chip recovery was not recorded for the 2010-2012 and 2017 RC drilling program and, therefore, there is no basis for evaluating the
relationship between grade and sample recovery for samples from these programs.
• Based on the Competent Person’s review of the 2010-2012, 2016 and 2018-2019, 2022-2023 drilling recovery and grade data there was no
observable relationship between sample recovery and grade.
|
|
|
Logging
|
• Whether core and chip samples have been geologically and geotechnically logged to a level of detail to
support appropriate Mineral Resource estimation, mining studies and metallurgical studies.
|
• All core and chip samples have been geologically logged to a level of detail to support appropriate Mineral Resource estimation, such that
there are lithological intervals for each drill hole, with a correlatable geological/lithological unit assigned to each interval.
• The 2018-2019 and 2022-2023 drilling were also geotechnically logged to a level of detail to support appropriate Mineral Resource
estimation.
• The Competent Person has reviewed all unit boundaries in conjunction with the Ioneer senior geologist, and where applicable, adjustments
have been made to the mineralized units based on the assay results intervals to limit geological dilution.
|
|
• Whether logging is qualitative or quantitative in nature.
|
• The RC and core logging were both qualitative (geological/lithological descriptions and observations) and quantitative (unit lengths, angles
of contacts and structural features and fabrics).
|
|
|
• Core (or costean, channel, etc.) photography.
|
• All chip trays and Core photography was completed on every core drill hole for the 2010-2012, 2016, 2018-2019 and 2022-2023 drilling
programs.
|
|
|
• The total length and percentage of the relevant intersections logged.
|
• Prior to 2018, a total length of 8,900 m of RC drilling and 6,000 m of core drilling was completed for the Project, 100% of which was
geologically logged by a logging geologist and reviewed by the senior Ioneer geologist.
• For the 2018-2019 drilling, a total length of 548 m of RC drilling and
|
|
APPENDIX D: JORC Code, 2012 Edition - Table 1
|
|
Criteria
|
JORC Code 2012 Explanation
|
Commentary
|
|
• The total length and percentage of the relevant intersections logged.
(Con’t)
|
9,321 m of core drilling was completed for the Project, 100% of which was geologically logged by a logging geologist and reviewed by the
senior Ioneer geologist
• For the 2018-2019 drilling, 86% of the 9,321 m of core was geotechnically logged by an engineering geologist/ geotechnical engineer and
reviewed by the senior Ioneer geologist.
• For the 2022-2023 drilling, 100% of the 7,362m of core was geotechnically logged by an engineering geologist/ geotechnical engineer and
reviewed by the senior Ioneer geologist
The Competent Person reviewed the geological core logging and sample selection for two drill holes.
|
|
|
• If core, whether cut or sawn and whether quarter, half or all core taken.
|
• The following sub-sampling techniques and sample selection procedures apply to drill core samples:
• During the 2010-2012 and 2016 program, core samples were collected on a mean 1.52 m down hole interval and cut in two halves using a manual
core splitter. The entire sample was submitted for analysis with no sub-sampling prior to submittal.
• During the 2018-2019 drilling program, core samples were collected for every 1.52 m down hole interval and cut using a water-cooled diamond
blade core saw utilizing the following methodology for the two target units. For the M5 unit, ½ core samples were submitted for assay, while the remaining ½ core was retained for reference. For the B5 unit, ¼ core samples were submitted for
assay, while ¼ was reserved for future metallurgical test work and ½ core was retained reference.
• During the 2022-2023 drilling programs, core samples were collected for target units every 1.52 m down hole interval. Target units were cut
using a water-cooled diamond blade core saw utilizing the following methodology for the target units. For the M4, M5, B5, S5 and L6 unit, ½ core samples (HQ) or ¼ core samples (PQ) were submitted for assay, while the remaining ½- ¾ core was
retained for reference.
|
|
APPENDIX D: JORC Code, 2012 Edition - Table 1
|
|
Criteria
|
JORC Code 2012 Explanation
|
Commentary
|
|
Sub-sampling
techniques
and sample
preparation
Sub-sampling
techniques
and sample
preparation
|
• If core, whether cut or sawn and whether quarter, half or all core taken. If non-core, whether riffled, tube sampled, rotary split,
etc. and whether sampled wet or dry.
|
• The following sub-sampling techniques and sample selection procedures apply to drill core samples:
• During the 2010-2012 and 2016 program, core samples were collected on a mean 1.52 m down hole interval and cut in two halves using a
manual core splitter. The entire sample was submitted for analysis with no sub-sampling prior to submittal.
• During the 2018-2019 drilling program, core samples were collected for every 1.52 m down hole interval and cut using a water-cooled
diamond blade core saw utilizing the following methodology for the two target units. For the M5 unit, ½ core samples were submitted for assay, while the remaining ½ core was retained for reference. For the B5 unit, ¼ core samples were
submitted for assay, while ¼ was reserved for future metallurgical test work and ½ core was retained for reference.
• During the 2022-2024 drilling programs, core samples were collected for target units every 1.52 m down hole interval. Target units were
cut using a water-cooled diamond blade core saw utilizing the following methodology for the target units. For the M4, M5, B5, S5 and L6 unit, ½ core samples (HQ) or ¼ core samples (PQ) were submitted for assay, while the remaining ½-
¾ core was retained for reference.
• The following sub-sampling techniques and sample selection procedures apply to RC Chip Samples:
• Pre-2017 RC chips samples were collected using a wet rotary splitter approximately every 1.52 m depth interval. Two samples were
collected for every interval (one main sample and one duplicate). Only the main sample was submitted for analysis.
2017 RC chip samples were collected using a wet rotary splitter attached to a cyclone. One, approximately 10 kg, sample was collected every 1.52 m depth
interval. All samples were submitted for analysis.
|
|
APPENDIX D: JORC Code, 2012 Edition - Table 1
|
|
Criteria
|
JORC Code 2012 Explanation
|
Commentary
|
|
• For all sample types, the nature, quality and appropriateness of the sample preparation
technique.
|
• The Competent Person considers the nature, type and quality of the sample preparation techniques to be appropriate based on the
general homogeneous nature of the mineralized zones and the drilling methods employed to obtain each sample (i.e., RC and core).
|
|
|
• Quality control procedures adopted for all sub-sampling stages to maximise representivity of
samples.
|
• Quality control procedures adopted for sub-sampling to maximize representivity include the following:
• During 2016-2017 and 2018-2023 drilling programs, field duplicate/replicate samples were obtained. For the 2017 and 2023 RC drilling,
a duplicate sample was collected every 20th sample. For the 2016 and 2018-2023 core drilling programs two ¼ core samples were taken at the same time and were analysed in sequence by the laboratory to assess the representivity.
• Twin drill holes at the same site were drilled during the 2010- 2012 drilling program. The twin drill hole pairing comprises one RC
drill hole (SBH-04) and one core drill hole (SBHC-01). The Competent Person recommends twinning additional drill hole pairs as part of any future pre-production or infill drilling programs to allow for a more robust review of sample
representivity.
• The Competent Person reviewed the results of the duplicate/replicate sampling and twin drill holes. For the duplicate/replicate
samples, the R2 value is 0.99, which is very good. Visual observation of the lithological intervals and the assays for the twin drill holes show that they are very similar, despite the difference in drilling techniques.
|
|
|
• Measures taken to ensure that the sampling is representative of the in situ material collected,
including for instance results for field duplicate/second-half sampling.
|
• The Competent Person considers the samples to be representative of the in-situ material as they conform to lithological boundaries
determined during core logging. A review of the primary and duplicate sample analyses indicates a high degree of agreement between the two sample sets (R2 value of 0.99).
|
|
|
• Whether sample sizes are appropriate to the grain size of the material
being sampled.
|
• The Competent Person Considers the sample sizes to be appropriate given the general homogeneous nature of the mineralized zones. The two main types of
mineralization are lithium mineralization with high boron >/=5,000 parts per million (ppm) (HiB-Li) and lithium mineralization with low boron <5,000
ppm (LoB-Li). The HiB-Li mineralization occurs consistently throughout the B5, M5 and L6 target zones, while LoB-Li mineralization occurs throughout the M5, S5 and L6 units, and is not nuggety
or confined to discreet high-grade and low-grade bands.
|
|
APPENDIX D: JORC Code, 2012 Edition - Table 1
|
|
Criteria
|
JORC Code 2012 Explanation
|
Commentary
|
|
Quality of
assay data
and
laboratory
tests
|
• The nature, quality and appropriateness of the assaying and laboratory procedures used and whether the technique is
considered partial or total.
|
• The nature and quality of the assaying and laboratory procedures used include the following:
• All RC and core samples were processed, crushed, split, and then a sub-sample was pulverized by ALS Minerals in Reno, Nevada.
• All sub-samples were analysed by Aqua Regia with ICP mass spectrometry (ICP-MS) finish for
51 elements (including Lithium (Li)) and Boron (B) by Na2O2 fusion/ICP high grade analysis (>/=10,000 ppm B).
• Additionally, 95% of the 2018-2019 samples were analysed for Inorganic Carbon and 30% were analysed for Fluorine (F).
• The laboratory techniques are total.
• The Competent Person considers the nature and quality of the laboratory analysis methods and procedures to be appropriate for the
type of mineralization.
|
|
• For geophysical tools, spectrometers, handheld XRF instruments, etc., the parameters used in
determining the analysis including instrument make and model, reading
times, calibrations factors applied and their derivation, etc..
|
• Not applicable to this Report, no geophysical tools, spectrometers, handheld XRF instruments were used on the Project.
|
|
|
• Nature of quality control procedures adopted (e.g. standards, blanks, duplicates, external
laboratory checks) and whether acceptable levels of accuracy (i.e. lack of bias) and precision have been established.
|
• The following Quality Assurance and Quality Control (QA/QC) procedures were adopted for
the various drilling programs:
• During the 2010-2012 program, Standard Reference Material (SRM) samples and a small number of field blanks were also
inserted regularly into the sample sequence to QA/QC of the laboratory analysis.
• For 2016-2017 program, a duplicate sample was collected every 20th primary sample. Field blanks and SRM’s were also inserted
approximately every 25 samples to assess QA/QC.
|
|
APPENDIX D: JORC Code, 2012 Edition - Table 1
|
|
Criteria
|
JORC Code 2012 Explanation
|
Commentary
|
|
Quality of assay data and
laboratory
(Con’t)
|
• During the 2018-2019 and 2022-2023 programs, QA/QC samples comprising 1 field blank and 1 SRM standard inserted into each
sample batch every 25 samples. Submission of field duplicates, laboratory coarse/pulp replicates and umpire assays were submitted in later stages of the 2018-2019 and 2022-2023 drilling programs.
• The Competent Person reviewed the SRM, field blanks and field duplicates and determined the following:
• SRMs: Review of the five SRMs used determined that there was a reasonable variability for Li between the upper and lower control
limits (± 2 standard deviation (SD)), however B shows an overall bias towards lower than expected values (i.e. less than the mean) for all sample programs. For each of the 5 SRMs, there were
some sample outliers (both low and high); however, the majority fell within the control limits. It is recommended that two additional SRM samples be added which have grades between current high and low grade samples and are closer
to the cutoff range for boron ( 5,000 ppm).
• Field Blanks: Review of the field blanks indicate that there is some variability in both the Li and B results. There are several
samples that return higher than expected values, with an increased number being from the 2018-2019 drilling program. Further review is required to determine if this is a result of the material used for field blanks (coarse
dolomite) or a problem with the laboratory analysis.
• Field Duplicates: No field duplicates were submitted for the pre-2018 drilling programs. Review of the 230 field duplicate sample
pairs from the 2018-2019 drilling program determined that there was a strong correlation between each pair, as evidenced by an R2 value of 0.99 for Li.
• Umpire Laboratory Duplicates: 20 assay pulp rejects were sent from ALS to American Assay Laboratories (AAL) in Sparks, NV for umpire laboratory
analysis. Review of the 20 umpire duplicate pairs found a strong correlation between each pair, with B returning an R2 value of 0.98.
• The Competent Person reviewed the control charts produced for each SRM, field blank and field duplicate, and determined that there
was an acceptable level of accuracy and precision for each for the purpose of estimating Mineral Resources.
|
|
APPENDIX D: JORC Code, 2012 Edition - Table 1
|
|
Criteria
|
JORC Code 2012 Explanation
|
Commentary
|
|
Verification of sampling and assaying
|
The verification of significant intersections by either independent or alternative company personnel.
|
• Significant intersections have been verified by visual inspection of the drill core intervals by at least two Ioneer geologists for all drilling
programs.
|
|
The use of twinned holes.
|
• One pair of twin drill holes at the same site were drilled during the 2010-2012 drilling program. The twin drill hole pairing
comprises one RC drill hole (SBH-04) and one core drill hole (SBHC-01).
• The Competent Person reviewed and assessed two drill holes and the variance for thickness and grade parameters were within acceptable levels.
|
|
|
Documentation of primary data, data entry procedures, data verification, data storage (physical and electronic) protocols.
|
• For the 2022-2023 drilling programs, the field protocols utilized in the 2018-2019 drilling program were reviewed by both Ioneer
and WSP. These protocols were refined and improved to assure proper compliance. Formal Documentation and enforcement by WSP and Ioneer personnel actively involved in the program.
• For the 2018-2019 drilling program, Newfields developed a series of field protocols covering all aspects of the exploration
program, including surveying, logging, sampling and data documentation. These protocols were followed throughout the 2018-2019 drilling program. Formal documentation of field protocols does not exist prior to the 2018-2019
program; however, the same senior personnel were involved in the earlier programs and field protocols employed were essentially the same as those documented in the 2018-2019 protocols.
• Primary field data was captured on paper logs for the 2010-2012 drilling program, then transcribed into Microsoft (MS) Excel files. For the 2016 through 2019 drilling, all field data was captured directly into formatted MS Excel files by logging geologists. All primary field data was reviewed by the senior
ioneer geologist.
• Data is stored in digital format in a MS Access database. This database was compiled, updated and maintained by Newfields
personnel during the 2018-2019 drilling program.
|
|
|
Documentation of primary data, data entry procedures, data verification, data storage (physical and electronic) protocols.
|
• The Competent Person used the relevant information from various tabular data files provided by ioneer and Newfields in a MS
Access database, which was reviewed and verified by the Competent Person prior to inclusion in the geological model.
|
|
|
Discuss any adjustment to assay data.
|
• There has been no adjustment to assay data.
|
|
APPENDIX D: JORC Code, 2012 Edition - Table 1
|
|
Criteria
|
JORC Code 2012 Explanation
|
Commentary
|
|
Location of data points
|
• Accuracy and quality of surveys used to locate drill holes (collar and down-hole surveys), trenches, mine
workings and other locations used in Mineral Resource estimation.
|
• Accuracy and quality of surveys used to locate drill holes is as follows:
• All inclined core drill holes were surveyed to obtain downhole deviation using a downhole Reflex Mems Gyros tool, except for
SBH-72, which could not be surveyed due to tool error. Two core drill holes (SBH-60, SBH-79) were surveyed using an Acoustic Televiewer instead of the Gyros tool.
• All 2018-2019 drill hole collars were surveyed using a differentially corrected GPS (DGPS).
• Locatable pre-2018 drill holes that were previously only surveyed by handheld GPS have been re-surveyed in 2019 using DPGS. Some
pre-2018 drill holes could not be located by the surveyor in 2019, and the original locations were assumed to be correct.
• Upon completion, drill casing was removed, and drill collars were marked with a permanent concrete monument with the drill hole
name and date recorded on a metal tag on the monument.
|
|
• Specification of the grid system used.
|
• All pre-2018 and 2018-2019 drill holes were originally surveyed using handheld GPS units in UTM Zone 11 North, North American
Datum 1983 (NAD83) coordinate system. Pre-2018 drill holes were re-surveyed using DPGS in NAD83 in 2017/2018.
• All 2018-2019 drill holes and locatable pre-2018 drill holes were re-surveyed in 2019 using DPGS in NAD83 coordinate system. All
surveyed coordinates were subsequently converted to Nevada
• State Plane Coordinate System of 1983, West Zone (NVSPW 1983) for use in developing the
geological model. Those holes that could not be located had the original coordinates converted to NVSPW 1983 and their locations verified against the original locations.
• All 2022-2023 holes were surveyed Nevada State Plane Coordinate System of 1983, West Zone (NVSPW 1983) for use in
developing the geological model.
|
|
|
• Quality and adequacy of topographic control.
|
• The quality and adequacy of the topographic surface and the topographic control is very good based on comparison against survey
monuments, surveyed drill hole collars and other surveyed surface features.
• A 2018 satellite survey with an accuracy of ± 0.17 m was produced for the Project by PhotoSat Information Ltd. The final report
generated by PhotoSat stated that the difference between the satellite and ioneer provided ground survey control points was less than 0.8 m.
|
|
|
|
• The topographic survey was prepared in NAD83, which was converted to NVSPW 1983 by Newfields prior to geological modelling.
|
|
APPENDIX D: JORC Code, 2012 Edition - Table 1
|
|
Criteria
|
JORC Code 2012 Explanation
|
Commentary
|
|
Data spacing
and
distribution
|
• Data spacing for reporting of Exploration Results.
|
• Drill holes are generally spaced between 90 m and 170 m on east- west cross-section lines spaced approximately 180 m apart.
There was no distinction between RC and core holes for the purpose of drill hole spacing.
• For the 2018-2023 drilling program, there were multiple occurrences where several inclined drill holes were drilled from the
same drill pad and oriented at varying angles away from each other. The collar locations for these inclined drill holes drilled from the same pad varied in distance from 0.3 m to 6.0 m apart; intercept distances on the floors of
the target units were typically in excess of 90 m spacing.
|
|
• Whether the data spacing and distribution is sufficient to establish the degree of
geological and grade continuity appropriate for the Mineral Resource and Ore Reserve
estimation procedure(s) and classifications applied.
|
• The spacing is considered sufficient to establish geological and grade continuity appropriate for a Mineral Resource
estimation.
|
|
|
• Whether sample compositing has been applied.
|
• Samples were predominately (91%) 1.52 m intervals honouring lithological boundaries. The sample intervals were composited to
1.52m lengths, respecting the seam contacts to regularize the database used for grade estimation. The 1.52 m sample length represents the modal value of the sample length distribution and the 1.52m vertical block height in the
model.
|
|
|
Orientation of
data in relation
to geological structure
|
Whether the orientation of sampling achieves unbiased sampling of possible structures and the extent to which this is known, considering the deposit type.
|
• Drill holes were angled between -45 and -90 degrees from horizontal and at an azimuth of between 0- and 350-degrees.
• Inclined drill holes orientated between 220- and 350-degrees azimuth introduced minimal sample bias, as they primarily intercepted the mineralization at
angles near orthogonal (94 drill holes with intercept angles between 70-90 degrees) to the dip of the beds, approximating true-thickness.
|
|
APPENDIX D: JORC Code, 2012 Edition - Table 1
|
|
Criteria
|
JORC Code 2012 Explanation
|
Commentary
|
|
• If the relationship between the drilling orientation and the orientation of key mineralised
structures is considered to have introduced a sampling bias, this should be assessed and reported if material.
|
• Inclined drill holes orientated between 0- and 220-degrees azimuth, especially those that were drilled at between 20- and
135-degrees azimuth, generally intercepted the beds down dip (14 drill holes with intercept angles between 20-70 degrees), exaggerating the mineralized zone widths in these drill holes.
|
|
|
Sample
security
|
• The measures taken to ensure sample security.
|
• The measures taken to ensure sample security include the following:
• For the 2010-2012 drill holes, samples were securely stored on-site and then collected from site by ALS. Chain of custody forms
were maintained by ALS.
• For the 2016-2017 drill holes, samples were securely stored on-site and then collected from site by ALS and transported to the
laboratory by truck. Chain of custody forms were maintained by ALS.
• For the 2018-2019 and 2022-2023 drill holes, core was transported daily by ioneer and/or Newfields personnel from the drill site to
the ioneer secure core shed (core storage) facility in Tonopah. Core awaiting logging was stored in the core shed until it was logged and sampled, at which time it was stored in secured sea cans inside a fenced and locked core
storage facility on site. Samples were sealed in poly-woven sample bags, labelled with a pre-form numbered and barcoded sample tag, and securely stored until shipped to or dropped off at the ALS laboratory in Reno by either ioneer
or Newfields personnel. Chain of custody forms were maintained by either Newfields or ioneer and ALS.
|
|
Audits
or
reviews
|
• The results of any audits or reviews of sampling techniques and data.
|
• There were no audits performed on the RC sampling or for the pre-2018 drilling programs.
• The Competent Person reviewed the core and sampling techniques during a site visit in August 2023. The Competent Person found
that the sampling techniques were appropriate for collecting data for the purpose of preparing geological models and Mineral Resource estimates.
|
|
APPENDIX D: JORC Code, 2012 Edition - Table 1
|
|
Criteria
|
JORC Code 2012 Explanation
|
Commentary
|
|
Mineral
tenement and
land tenure
status
|
• Type, reference name/number, location and ownership including agreements or material issues
with third parties such as joint ventures, partnerships, overriding royalties, native title interests, historical sites, wilderness or national park and environmental settings.
|
• The mineral tenement and land tenure for the South Basin of Rhyolite Ridge (the Project) comprise 386 unpatented Lode Mining
Claims (totalling approximately 3,150 hectare (Ha)); claim groups SLB, SLM and RR, spatial extents of which are presented in maps and tables within the body of the Report are held by Ioneer
Minerals Corporation, a wholly owned subsidiary of Ioneer. The Competent Person has relied upon information provided by Ioneer regarding mineral tenement and land tenure for the Project; the Competent Person has not performed any
independent legal verification of the mineral tenement and land tenure.
• The Competent Person is not aware of any agreements or material issues with third parties such as joint ventures, partnerships,
overriding royalties, native title interests, historical sites, wilderness or national park and environmental settings relating to the 386 Lode Mining Claims for the Project.
• The mineral tenement and land tenure referenced above excludes
241 additional unpatented Lode Mining Claims (totaling approximately 2,000 Ha) for the North Basin which are located outside of the current South Basin
Project Area presented in this Report. These additional claims are held by Ioneer subsidiaries (NLB claim group; 160 claims and BH claim group; 81 claims).
|
|
• The security of the tenure held at the time of reporting along with any known impediments
to obtaining a licence to operate in the area.
|
• There are no identified concerns regarding the security of tenure nor are there any known impediments to obtaining a license to
operate within the limits of the Project. The 386 unpatented Lode Mining Claims for the Project are located on federal land and are administered by the United States Department of the Interior - Bureau of Land Management (BLM).
|
|
|
Exploration
done by other parties
|
• Acknowledgment and appraisal of exploration by other parties.
|
• There have been two previous exploration campaigns targeting Li-B mineralization at the Project site.
|
|
APPENDIX D: JORC Code, 2012 Edition - Table 1
|
|
Criteria
|
JORC Code 2012 Explanation
|
Commentary
|
|
|
|
• US Borax conducted surface sampling and drilling in the 1980s, targeting B mineralization, with less emphasis on Li
mineralization. A total of 44 drill holes (totalling approximately 14,900 m) were drilled in the North Borate Hills area, with an additional 16 drill holes (unknown total meterage) in the South Basin area. These drill holes were
not available for use in the current Study.
• American Lithium Minerals Inc and Japan Oil, Gas and Metals National Corporation (JOGMEC)
conducted further Li exploration in the South Basin area in 2010-2012. The exploration included at least 465 surface and trench samples and 36 drill holes (totalling approximately 8,800 m), of which 21 were core and 15 were RC.
Data collected from this program, including drill core, was made available to ioneer. The Competent Person reviewed the data available from this program and believes this exploration program, except for the trench data, was
conducted appropriately and the information generated is of high enough quality to include in preparing the current geological model and Mineral Resource estimate.
• Due to concerns regarding the ability to reliably correlate the trenches with specific geological units as well as concerns
regarding representivity of samples taken from incomplete exposures of the units in the trenches, the Competent Person does not feel the trench sample analytical results are appropriate for use and has excluded them from use in
preparing the geological model and Mineral Resource estimate.
|
|
Geology
|
• Deposit type, geological setting and style of mineralisation.
|
• The HiB-Li and LoB-Li mineralization at Rhyolite Ridge occurs in two separate late-Miocene sedimentary basins; the North Basin
and the South Basin, located within the Silver Peak Range in the Basin and Range terrain of Nevada, USA. The South Basin is the focus of the Study presented in this Report and the following is focused on the geology and
mineralization of the South Basin.
• The South Basin stratigraphy comprises lacustrine sedimentary rocks of the Cave Spring Formation overlaying volcanic flows and
volcaniclastic rocks of the Rhyolite Ridge Volcanic unit. The Rhyolite Ridge Volcanic unit is dated at approximately 6 mega-annum (Ma) and comprises rhyolite tuffs, tuff breccias and flows.
|
|
APPENDIX D: JORC Code, 2012 Edition - Table 1
|
|
Criteria
|
JORC Code 2012 Explanation
|
Commentary
|
|
The Rhyolite Ridge Volcanic rocks are underlain by sedimentary rocks of the Silver Peak Formation.
• The Cave Spring Formation comprises a series of 11 sedimentary units deposited in a lacustrine environment, as shown in the
following table. Within the study area the Cave Spring Formation can reach total thickness in excess of 400 m. Age dating of overlying units outside of the area and dates for the underlying Rhyolite Ridge Volcanic unit bracket
deposition of the Cave Spring Formation between 4-6 Ma; this relatively young geological age indicates limited time for deep burial and compaction of the units. The Cave Spring Formation units are generally laterally continuous
over several miles across the extent of the South Basin; however, thickness of the units can vary due to both primary depositional and secondary structural features. The sedimentary sequence generally fines upwards, from coarse
clastic units at the base of the formation, upwards through siltstones, marls and carbonate units towards the top of the sequence.
• The key mineralized units are in the Cave Spring Formation and are, from top to bottom, the M5 (high-grade Li, low- to
moderate- grade B bearing carbonate-clay rich marl), the B5 (high-grade B, moderate-grade Li marl), the S5 (low- to high Li, very low B) and the L6 (broad zone of laterally discontinuous low- to high- grade Li and B mineralized
horizons within a larger low-grade to barren sequence of siltstone-claystone). The sequence is marked by a series of four thin (generally on the scale of several meters or less) coarse gritstone layers (G4 through G7); these units
are interpreted to be pyroclastic deposits that blanketed the area. The lateral continuity across the South Basin along with the distinctive visual appearance of the gritstone layers relative to the less distinguishable sequence
of siltstone-claystone-marl that comprise the bulk of the Cave Spring Formation make the four grit stone units good marker horizons within the stratigraphic sequence.
• The Cave Springs Formation is unconformably overlain by a unit of poorly sorted alluvium, ranging from 0 to 40 m (mean of 20 m)
within the Study Area. The alluvium is unconsolidated and comprises sand through cobble sized clasts (with isolated occurrences of large boulder sized clasts) of the Rhyolite Ridge Volcanic Rocks and other nearby volcanic units.
|
|
APPENDIX D: JORC Code, 2012 Edition - Table 1
|
|
Criteria
|
JORC Code 2012 Explanation
|
Commentary
|
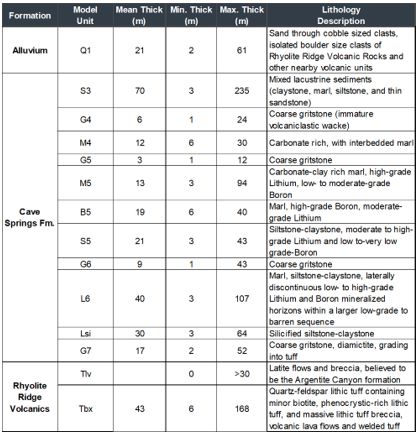 • Structurally, the South Basin is bounded along its western and eastern margins by regional scale high angle faults of unknown
displacement, while localized steeply dipping normal, reverse and strike-slip faults transect the Cave Spring formation throughout the
|
|
APPENDIX D: JORC Code, 2012 Edition - Table 1
|
|
Criteria
|
JORC Code 2012 Explanation
|
Commentary
|
|
the basin. Displacement on these faults is generally poorly known but most appear to be on the order of tens of meters of
displacement although several located along the edge of the basin may have displacements greater than 30 m. Major fault structures within the basin tend to have a series of minor faults associated with them. These tend to have
smaller offset than the parent fault structure. Along the western side, South Basin is folded into a broad, open syncline with the sub-horizontal fold axis oriented approximately north-south. The syncline is asymmetric, moderate
to locally steep dips along the western limb. The stratigraphy is further folded, including a significant southeast plunging syncline located in the southern part of the study area.
• HiB-Li and LoB-Li mineralization is interpreted to have been emplaced by hydrothermal/epithermal fluids travelling up the basin
bounding faults; based on HiB-Li and LoB-Li grade distribution and continuity it is believed the primary fluid pathway was along the western bounding fault. Differential mineralogical and permeability characteristics of the
various units within the Cave Spring Formation resulted in the preferential emplacement of HiB-Li bearing minerals in the B5 and L6 units and LoB-Li bearing minerals in the M5, S5 and L6 units. HiB-Li mineralization occurs in
isolated locations in some of the other units in the sequence, but with nowhere near the grade and continuity observed in the aforementioned units.
|
||
|
Drill hole Information
|
• A summary of all information material to the understanding of the exploration results
including a tabulation of the following information for all Material drill holes:
o easting and northing of the drill hole collar
o elevation or RL (Reduced Level – elevation above sea level in feet) of the drill hole collar
o dip and azimuth of the hole
o down hole length and interception depth
o hole length.
|
• Exploration Results are not being reported.
• A summary table providing key details for all identified drill holes for the Project is presented by type and drilling campaign
in the following table:
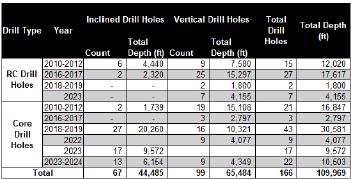
|
|
APPENDIX D: JORC Code, 2012 Edition - Table 1
|
|
Criteria
|
JORC Code 2012 Explanation
|
Commentary
|
|
• If the exclusion of this information is justified on the basis that the information is not
Material and this exclusion does not detract from the understanding of the report, the Competent Person should clearly explain why this is the case.
|
• Of the 166 drill holes reviewed, 162 (50 RC and 112 core) were included in the geological model and were omitted. One RC twin
hole was omitted in favour of the cored hole at the same location. Three water/geotechnical drill holes were omitted due to a lack of lithology and quality data relevant to the geological model.
|
|
|
Data
aggregation methods
|
• In reporting Exploration Results, weighting averaging techniques, maximum and/or minimum
grade truncations (e.g. cutting of high grades) and cut-off grades are usually Material and should be stated.
|
• Exploration Results are not being reported.
• All grade parameters presented as part of the Mineral Resource estimates prepared by IMC are presented as mass weighted grades.
• Drill core samples are predominately 1.52 m lengths (91%) and this data set composited to regularized 1.52m lengths, respecting
seam contacts and used for the interpolation of grade data into the block model. The data set honoured geological contacts (i.e. composite intervals did not span unit contacts). The data set is the 1.52 m composited developed from
the drill hole assay database.
• No minimum bottom cuts or maximum top cuts were applied to the thickness or grade data used to construct the geological models.
No interpolation was applied to B and Li grade data for units other than the targeted units (G5, M5, B5, S5, G6, L6 and Lsi; discussed further in the Estimation and Modelling Techniques section of this Table 1).
• A cut-off grade of 5,000 ppm B for the HiB-Li mineralization and 16.54/tonne net value for the LoB-Li mineralization was applied
during the Mineral Resource tabulation for the purpose of establishing reasonable prospects of eventual economic extraction based on high level mining, metallurgical and processing grade parameters identified by mining,
metallurgical and processing studies performed to date on the Project.
|
|
• Where aggregate intercepts incorporate short lengths of high grade results and longer lengths
of low grade results, the procedure used for such aggregation should be stated
and some typical examples of such aggregations should be shown in detail.
|
• Not applicable as individual intercepts or Exploration Results are not being reported.
|
|
|
• The assumptions used for any reporting of metal equivalent values should be clearly stated.
|
• Metal equivalents were not used in the Mineral Resource estimates prepared by IMC.
|
|
APPENDIX D: JORC Code, 2012 Edition - Table 1
|
|
Criteria
|
JORC Code 2012 Explanation
|
Commentary
|
|
Relationship between mineralisation widths and
intercept
lengths
|
• These relationships are particularly important in the reporting of Exploration Results.
|
• All drill hole intercepts presented in the Report are down hole thickness not true thickness. As discussed in the Orientation
of Data section of this Table 1, most drill hole intercepts are approximately orthogonal to the dip of the beds (intercept angles between 70-90 degrees).
|
|
• If the geometry of the mineralisation with respect to the drill hole angle is known, its
nature should be reported.
|
• Based on the geometry of the mineralization, it is reasonable to treat all samples collected from inclined drill holes at
intercept angles of greater than 70 degrees as representative of the true thickness of the zone sampled.
|
|
|
• If it is not known and only the down hole lengths are
reported, there should be a clear statement to this effect (e.g. ‘down hole length, true width not known’).
|
• Not applicable as individual down hole intercepts or Exploration Results are not being reported.
|
|
|
Diagrams
|
• Appropriate maps and sections (with scales) and tabulations of intercepts should be included for any
significant discovery being reported These should include, but not be limited to a plan view of drill hole collar locations and appropriate sectional views.
|
• Appropriate plan maps and sections are appended to the Report.
|
|
Balanced
reporting
|
• Where comprehensive reporting of all Exploration Results is not practicable, representative reporting of both low and
high grades and/or widths should be practiced to avoid misleading reporting of Exploration Results.
|
• Exploration Results are not being reported.
|
|
Other
substantive exploration
data
|
• Other exploration data, if meaningful and material, should be reported including (but not limited to): geological
observations; geophysical survey results; geochemical survey results; bulk samples – size and method of treatment; metallurgical test results; bulk density, groundwater, geotechnical and rock characteristics; potential
deleterious or contaminating substances.
|
• Surficial geological mapping performed by a senior ioneer geologist was used in support of the drill holes to define the
outcrops and subcrops as well as bedding dip attitudes in the geological modelling. Mapped geological contacts and faults were imported into the model and used as surface control points for the corresponding beds or structures.
• Magnetic and Gravity geophysical surveys were performed and interpreted to inform the geological model, particularly in the
identification of faulting and geologic structures.
|
|
Further work
|
• The nature and scale of planned further work (e.g. tests for lateral extensions or depth
extensions or large-scale step-
out drilling).
|
• Additional in-fill drilling and sampling may be performed based on the results of current mining project studies
|
|
• Diagrams clearly highlighting the areas of possible extensions, including the main
geological interpretations
and future drilling areas, provided this information is not commercially sensitive.
|
• Refer to Figure 1 in the body of this report.
|
|
APPENDIX D: JORC Code, 2012 Edition - Table 1
|
|
Criteria
|
JORC Code 2012 explanation
|
Commentary
|
|
Database
integrity
|
• Measures taken to ensure that data has not been corrupted by, for example, transcription or
keying errors, between its initial collection and its use for Mineral Resource estimation purposes.
|
• Measures taken to ensure the data has not been corrupted by transcription or keying errors or omissions included recording of drill
hole data and observations by the logging geologists using formatted logging sheets in Microsoft (MS) Excel. Data and observations entered into the logging sheets were reviewed by senior
ioneer geologists prior to importing into Torque Database
• IMC evaluated the tabular data provided by ioneer for errors or omissions as part of the data validation procedures described
in the following section.
|
|
• Data validation procedures used.
|
• IMC performed data validation on the drill hole database records using available underlying data and documentation including
but not limited to original drill hole descriptive logs, core photos and laboratory assay certificates. Drill hole data validation checks were performed using a series of in-house data checks to evaluate for common drill hole data
errors including, but not limited to, data gaps and omissions, overlapping lithology or sample intervals, miscorrelated units, drill hole deviation errors and other indicators of data corruption including transcription and keying
errors.
• Database assay values for every sample were visually compared to the laboratory assay certificates to ensure the tabular assay
data was free of errors or omissions by Golder for the 2020 resource estimate. IMC compared database to certificates for about 20% of the phase 2 and 3 drill holes and found no errors.
|
|
|
Site visits
|
• Comment on any site visits undertaken by the Competent Person and the outcome of those
visits.
|
• The IMC Competent Person Herbert E. Welhener made a personal site inspection, this visit was performed on the Project site on
August 10th 2023 for the Project.
During the site visit the IMC Competent Person visited the ioneer core shed in Tonopah NV, and the South Basin area of the Rhyolite Ridge Project site, which is the focus of
the current exploration and resource evaluation efforts by ioneer.
|
|
APPENDIX D: JORC Code, 2012 Edition - Table 1
|
|
Criteria
|
JORC Code 2012 explanation
|
Commentary
|
|
• The IMC Competent Person observed the active drilling, logging and sampling process and interviewed site personnel regarding
exploration drilling, logging, sampling and chain of custody procedures.
• The outcome of the site visit was that the IMC Competent Person developed an understanding of the general geology of the
Rhyolite Ridge Project. The IMC Competent Person was also able to visually confirm the presence of a selection of monumented drill holes from each of the previous drilling programs as well as to observe drilling, logging and
sampling procedures during the current drilling program and to review documentation for the logging, sampling and chain of custody protocols for previous drilling programs.
|
||
|
• If no site visits have been undertaken indicate why this is the case.
|
• Not applicable.
|
|
|
Geological interpretation
|
• Confidence in (or conversely, the uncertainty of) the geological interpretation of the
mineral deposit.
|
• The IMC Competent Person is confident that the geological interpretation of the mineral deposit is reasonable for the purposes
of Mineral Resource estimation.
|
|
• Nature of the data used and of any assumptions made.
|
• The data used in the development of the geological interpretation included drill hole data and observations collected from 112
core and 50 RC drill holes, supplemented by surface mapping of outcrops and faults performed by ioneer personnel. Regional scale public domain geological maps and studies were also incorporated into the geological interpretation.
• It is assumed that the mineralized zones are continuous between drill holes as well as between drill holes and surface mapping.
It is also assumed that grades vary between drill holes based on a distance-weighted interpolator.
|
|
|
• The effect, if any, of alternative interpretations on Mineral Resource estimation.
|
• There are no known alternative interpretations.
|
|
|
• The use of geology in guiding and controlling Mineral Resource estimation.
|
• Geology was used directly in guiding and controlling the Mineral Resource estimation. The mineralized zones were modelled as
stratigraphically controlled HiB-Li and LoB-Li deposits. As such, the primary directions of continuity for the mineralization are horizontally within the preferentially mineralized B5, M5, S5 and L6 geological units.
|
|
APPENDIX D: JORC Code, 2012 Edition - Table 1
|
|
Criteria
|
JORC Code 2012 explanation
|
Commentary
|
|
• The factors affecting continuity both of grade and geology.
|
• The primary factor affecting the continuity of both geology and grade is the lithology of the geological units. HiB-Li
mineralization is favourably concentrated in marl-claystone of the B5 and L6 units and LoB-Li in the M5, S5 and L6 units. Mineralogy of the units also has a direct effect on the continuity of the mineralization, with elevated B
grades in the B5 and M5 units associated with a distinct reduction in carbonate and clay content in the units, while higher Li values tend to be associated with elevated carbonate content in these units and sometimes k-felspar.
• Additional factors affecting the continuity of geology and grade include the spatial distribution and thickness of the host
rocks which have been impacted by both syn-depositional and post- depositional geological processes (i.e. localized faulting, erosion and so forth).
|
|
|
Dimensions
|
• The extent and variability of the Mineral Resource expressed as length (along strike or
otherwise), plan width, and depth below surface to the upper and lower limits of the Mineral Resource.
|
• The Mineral Resource evaluation presented in this Report covers an area of approximately 458 Ha within the South Basin of
Rhyolite Ridge. The Mineral Resource plan dimensions, defined by the spatial extent of the B5 unit Inferred classification limits, are approximately 3,650 m North-South by 1,400 m East-West. The upper and lower limits of the
Mineral Resource span from surface, where the mineralized units outcrop locally, through to a maximum depth of 420 m below surface for the base of the lower mineralized zone (L6 unit).
• Variability of the Mineral Resource is associated primarily with the petrophysical and geochemical properties of the individual
geological units in the Cave Spring Formation. These properties played a key role in determining units that were favourable for hosting HiB-Li and LoB-Li mineralization versus those that were not.
|
|
Estimation
and modelling techniques
|
• The nature and appropriateness of the estimation technique(s) applied and key assumptions,
including
treatment of extreme grade values, domaining, interpolation parameters and maximum distance of extrapolation from data points. If a computer assisted estimation method was chosen include a description of computer software and parameters used. |
• Geological modelling and Mineral Resource estimation for the Project was performed under the supervision of the Competent Person
• Based on a statistical analysis, extreme B grade values were identified in some of the units other than the targeted B5, M5, S5
and L6 units. Boron, Lithium and the other elements were estimated in only units B5, M5, S5 and L6, and the adjacent units of G5, G6 and Lsi. Grades in the adjacent units were incorporated into the re-blocked model with a 9.14m
bench height (combined six 1.52 m benches).
|
|
APPENDIX D: JORC Code, 2012 Edition - Table 1
|
|
Criteria
|
JORC Code 2012 explanation
|
Commentary
|
||||
|
|
|
• The geological model was developed as a gridded surface stratigraphic model by NewFields and ioneer and provided to IMC as
surfaces and solids. The stratigraphically constrained grade block model was developed using Hexagon and IMC software, which are computer-assisted geological, grade modelling, and estimation software applications.
• Domaining in the model was constrained by the roof and floor surfaces of the geological units. The unit boundaries were
modelled as hard boundaries, with samples interpolated only within the unit in which they occurred. The impact of faulting is represented in fault blocks which generated sub-sets of the seam units. The faulting altered the
orientation of the seam floors and was used during the grade estimation process. Grade continuity is assumed across faults which in some cases offset the seams in a vertical direction. A larger vertical window was used during
grade estimation to allow estimation of grades across faults, still limited to the seam being estimated.
• Key modelling and estimation parameters included the following:
|
||||
| Estimation Parameter | Description | |||||
| Estimation Block Size | 7.62 x 7.62 x 1.524 m | |||||
| Estimation Method | Inverse Distance Squared | |||||
| Seams for Grade Estimation | G5, M5, B5, S5, G6, L6, Lsi | |||||
| Maximum search distance, G5 | 305 x 305 x 61 m | |||||
| Maximum search distance, M5 | 533 x 305 x 61 m | |||||
| Maximum search distance, B5 | 533 x 305 x 61 m | |||||
| Maximum search distance, S5 | 229 x 229 x 61 m | |||||
| Maximum search distance, G6 | 229 x 229 x 61 m | |||||
| Maximum search distance, L6 | 305 x 305 x 61 m | |||||
| Maximum search distance, Lsi | 305 x 305 x 61 m | |||||
| Minimum & Maximum samples | 2 and 10 | |||||
| Maximum samples per hole | 3 | |||||
|
APPENDIX D: JORC Code, 2012 Edition - Table 1
|
|
Criteria
|
JORC Code 2012 explanation
|
Commentary
|
|
• The availability of check estimates, previous estimates and/or mine
production records and whether the Mineral Resource estimate takes appropriate account of such data.
|
• The Table below presents a summary comparison of the current February 2025 Mineral Resource estimate against the previous Mineral Resource estimate for
the Project, prepared by IMC in April 2024.
|
|
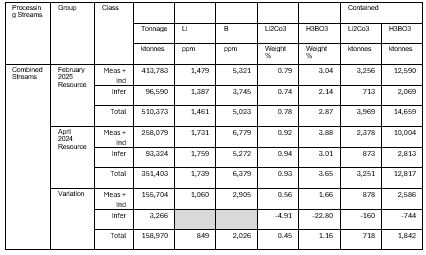
• There has been no HiB-Li or LoB-Li production on the Project to date.
|
|
• The assumptions made regarding recovery of by-products.
|
• No by-products are being considered for recovery at present.
|
|
|
• Estimation of deleterious elements or other non-grade variables of economic significance
(e.g. sulphur for acid mine drainage characterisation).
|
• In addition to Li and B, the geological model also included 10 additional non-grade elements (Sr, Ca, Mg, Na, K, Rb, Cs, Mo,
Fe, Al) to allow for calculation of acid consumption values for the metallurgical process. No deleterious elements were estimated.
|
|
|
• In the case of block model interpolation, the block size in relation to the average sample
spacing and the search employed.
|
• The stratigraphic gridded surface model was developed using a 7.62 m regularized grid. The grade block model was developed from the stratigraphic
model using a 7.62 m North-South by 7.62 m East-West by 1.52 m vertical block dimension with no sub-blocks. The block size dimensions represent 12 percent of the closer spaced drill hole spacing and 6 percent of the wider
spaced spacing across the model area.
• Grade interpolation into the model blocks was performed using an
|
|
APPENDIX D: JORC Code, 2012 Edition - Table 1
|
|
Criteria
|
JORC Code 2012 explanation
|
Commentary
|
|
Inverse Distance Squared (ID2) interpolator with unique search distances for each of the 7 seams being estimated as shown in the
table above. The same search parameters were used for all of the elements being estimated (B, Li, Sr, Ca, Mg, Na, K, Rb, Cs, Mo, Fe, Al) within each of the seams.
|
||
|
• Any assumptions behind modelling of selective mining units.
|
• The mining selective vertical unit of 9.14m is based on the selected mining equipment. The 1.52 m bench block model was re-blocked
after grade estimation to 9.14m bench height blocks keeping the horizontal dimensions the same at 7.62 by 7.62m.
• The re-blocked 9.14m was developed in the following steps:
• Seams and fault block domains were assigned to the model from the surfaces and solids files;
• Tonnes per block from the 1.52 m model were added together;
• Grades were weighted averaged by tonnes per 1.52 m blocks;
• Class was assigned by majority; when equal number of 1.52m blocks were present, the lower class was assigned;
• Fault block domains with no drill data and received grade estimates from surrounding data received a classification of inferred.
|
|
|
• Any assumptions about correlation between variables.
|
• No assumptions or calculations relating to the correlation between variables were made at this time.
|
|
|
• Description of how the geological interpretation was used to control the resource estimates.
|
• The geological interpretation was used to control the Mineral Resource estimate by developing a contiguous stratigraphic model
(all units in the sequence were modelled) of the host rock units deposited within the basin, the roof and floor contacts of which then served as hard contacts for constraining the grade interpolation. Grade values were
interpolated within the geological units using only samples intersected within those units.
|
|
|
• Discussion of basis for using or not using grade cutting or capping.
|
• Grade capping or cutting was not applied for the targeted mineralized units B5, M5, S5 and L6, and adjacent units included in
the estimation process as a statistical analysis of the grade data indicated there was no bias or influence by extreme outlier grade values.
• Mineral Resources were not estimated for the other units. Grades have been estimated for adjacent units to allow for potential
mining dilution.
|
|
APPENDIX D: JORC Code, 2012 Edition - Table 1
|
|
Criteria
|
JORC Code 2012 explanation
|
Commentary
|
|
The process of validation, the checking process used, the comparison of model data to drill hole data, and use of reconciliation data if available.
|
The geological model validation and review process involved visual inspection of drill hole data as compared to model geology and grade parameters using plan isopleth maps and
approximately 300 m spaced cross-sections through the model. Drill hole and model values were compared statistically along with grade estimates using polygon and ordinary kriging approaches.
• No reconciliation data is available because the property is not in production.
|
|
|
Moisture
|
Whether the tonnages are estimated on a dry basis or with natural moisture, and the method of determination of the moisture content.
|
• The estimated Mineral Resource tonnages are presented on a dry basis.
• A moisture content evaluation needs to be done as part of future analytical programs.
|
|
Cut-off
parameters
|
• The basis of the adopted cut-off grade(s) or quality parameters applied.
|
• The Mineral Resource estimate presented in this Report has been constrained by the application of an optimized Mineral Resource
pit shell. The Mineral Resource pit shell was developed using the IMC Mine Planning software.
• The Mineral Resource estimate assumes the use of three processing streams: one which can process ore with boron content greater
than 5,000 ppm and two which can process ore with boron content less than 5,000 ppm.
• Key input parameters and assumptions for the Mineral Resource pit shell included the following:
• B cut-off grade of 5,000 ppm for HiB-Li processing stream and no B cut-off grade for LoB-Li processing stream
• No Li cut-off grade for HiB-Li processing stream and $16.54/t net value cutoff for LoB-Li processing stream
• Overall pit slope angle of 42 degrees (wall angle guidance provided byGeo-Logic Associates who developed the geotechnical design).
• Mining cost of US$1.69/tonne based on recent studies by ioneer.
• G&A cost of US$16.54/tonne processed based on recent studies by ioneer.
• Ore processing and grade control costs vary by process stream and seam unit and are divided into fixed cost and the cost of acid
consumption. Shown below are the costs based on the average grades of the acid consuming elements in the Mineral Resource:
|
|
APPENDIX D: JORC Code, 2012 Edition - Table 1
|
|
Criteria
|
JORC Code 2012 explanation
|
Commentary
|
|
• Stream 1 (HiB-Li): fixed process cost = $30.50/mt and acid costs range between $33.93/mt and $52.12/mt based on the average grades of the acid consuming
elements in each seam.
Streams 2 & 3 (LoB-Li): both the fixed and acid costs vary by seam with the fixed cost ranging between $15.19.mt to $30.80/mt and the acid costs range
between $5.08/mt and $67.93/mt.
• Boron and Li recovery of 80.2% and 85.7% respectively for HiB-Li Processing Stream .
• Boron Recovery for LoB-Li Processing Stream variable by lithology as follows: 65% in M5 Unit, 80.2% in B5 unit, 50% in S5 unit, and 37% in L6 unit.
• Lithium Recovery for LoB-Li Processing Stream variable by lithology as follows: 78% in M5 unit, 85.7% in B5 unit, 88% in S5 unit, and 85% in L6 unit.
• Boric Acid sales price of US$1,172.78/tonne.
• Lithium Carbonate sales price of US$19,351.380/tonne.
• Sales/Transport costs are included in the process fixed cost/t.
|
||
|
Mining
factors or assumptions
|
• Assumptions made regarding possible mining methods, minimum mining dimensions and internal
(or, if applicable, external) mining dilution. It is always necessary as part of the process of determining reasonable prospects for eventual economic extraction to consider potential mining methods, but the assumptions made
regarding mining methods and parameters when estimating Mineral Resources may not always be rigorous. Where this is the case, this should be reported with an explanation of the basis of the mining assumptions made.
|
• The Mineral Resource estimate presented in this Report was developed with the assumption that the HiB-Li and LoB-Li
mineralization within the Mineral Resource pit shell, as described in the preceding section, has a reasonable prospect for eventual economic extraction using current conventional open pit mining methods.
• Except for the Mineral Resource pit shell criteria discussed in the preceding section, no other mining factors, assumptions or
mining parameters such as mining recovery, mining loss or dilution have been applied to the Mineral Resource estimate presented in this Report.
|
|
APPENDIX D: JORC Code, 2012 Edition - Table 1
|
|
Criteria
|
JORC Code 2012 explanation
|
Commentary
|
|
Metallurgical factors or assumptions
|
The basis for assumptions or predictions regarding metallurgical amenability. It is always necessary as part of the process of
determining reasonable prospects for eventual economic extraction to consider potential metallurgical methods, but the assumptions regarding metallurgical treatment processes and parameters made when reporting Mineral Resources
may not always be rigorous. Where this is the case, this should be reported with an explanation of the basis of the metallurgical assumptions made.
|
• The basis of the metallurgical assumptions made in establishing the reasonable prospects for eventual economic extraction of
the HiB-Li mineralization are based on results from metallurgical and material processing work that was developed as part of the ongoing Feasibility Study for the Project. This test work was performed using current processing and
recovery methods for producing Boric acid and Lithium carbonate products
A second process stream to recover Li from low boron mineralized (LoB-Li) units is being developed. Current results indicate a reasonable process and expectation for economic
extraction of the LoB-Li from the S5, M5 and L6 units. This test work was performed using current processing and recovery methods for producing Boric acid and Lithium carbonate products.
|
|
Environment-
al factors or assumptions
|
Assumptions made regarding possible waste and process residue disposal options. It is always necessary as part of the process of
determining reasonable prospects for eventual economic extraction to consider the potential environmental impacts of the mining and processing operation. While at this stage the determination of potential environmental impacts,
particularly for a greenfields project, may not always be well advanced, the status of early consideration of these potential environmental impacts should be reported. Where these aspects have not been considered this should be
reported with an explanation of the environmental assumptions made.
|
The project will require waste and process residue disposal. Assumptions have been made that all environmental requirements will be achieved through necessary studies, designs
and permits.
• Currently, baseline studies and detailed designs have been completed for both waste and process residue disposal facilities.
• In December 2022, the United States Fish and Wildlife Service (USFWS) listed Tiehm’s buckwheat as an endangered species under
the Endangered Species Act (ESA) and has designated critical habitat by way of applying a 500 m radius around several distinct plant populations that occur on the Project site. Ioneer is committed to the protection and
conservation of the Tiehm’s buckwheat. The Project’s Mine Plan of Operations was submitted to the BLM in July 2022. In October 2024, Ioneer received its federal permit for the Rhyolite Ridge Lithium-Boron Project from the BLM. The
formal Record of Decision (ROD) follows the issuance in September 2024 of the final Environmental Impact Statement (EIS) by the BLM As part of the final EIS, the U.S. Fish and Wildlife Service, which oversees the administration
of the Endangered Species Act (ESA), also formally released the ESA Section 7 Biological Opinion concluding Rhyolite Ridge will not jeopardise Tiehm’s buckwheat or adversely modify its critical habitat.
• The mineral resource pit shell used to constrain the February 2025, mineral resource estimate was not adjusted to account for
any impacts from avoidance of Tiehm’s buckwheat or minimisation of disturbance within the designated critical habitat. Environmental and permitting assumptions and factors will be taken into consideration during future modifying
factors studies for the Project. These permitting assumptions and factors may result in potential changes to the Mineral Resource footprint in the future.
|
|
APPENDIX D: JORC Code, 2012 Edition - Table 1
|
|
Criteria
|
JORC Code 2012 explanation
|
Commentary
|
|
Bulk density
|
• The density values used to convert volumes to tonnages were assigned on a by-geological unit basis using mean values calculated
from 120 density samples collected from drill core during the 2018-2019 and the 2023-2024 drilling programs. The density analyses were performed using the water displacement method for density determination, with values reported
in dry basis.
|
|
|
• Whether assumed or determined. If assumed, the basis for the assumptions. If determined, the
method used, whether wet or dry, the frequency of the measurements, the nature, size and representativeness of the samples.
|
• The application of assigned densities by geological unit assumes that there will be minimal variability in density within each of
the units across their spatial extents within the Project area. The use of assigned density with a very low number of samples, as is the case with several waste units, is a factor that increases the uncertainty and represents a
risk to the Mineral Resource estimate confidence
|
|
|
• The bulk density for bulk material must have been measured by methods that adequately account for void
spaces (vugs, porosity, etc.), moisture and differences between rock and alteration zones within the deposit.
|
• The Archimedes-principle method for density determination accounts for void
spaces, moisture and differences in rock type.
|
|
APPENDIX D: JORC Code, 2012 Edition - Table 1
|
|
Criteria
|
JORC Code 2012 explanation
|
Commentary
|
|
Bulk density
(Con’t)
|
Discuss assumptions for bulk density estimates used in the evaluation process of the different materials.
|
• Density values were assigned for all geological units in the model, including mineralized units as well as overburden,
interburden and underburden waste units. By-unit densities were assigned in the grade block model based on the block geological unit code as follows:
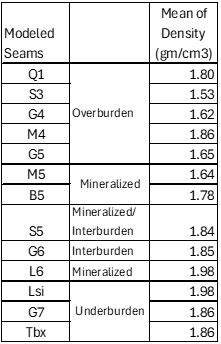 |
|
APPENDIX D: JORC Code, 2012 Edition - Table 1
|
|
Criteria
|
JORC Code 2012 explanation
|
Commentary
|
|
Classification
|
The basis for the classification of the Mineral Resources into varying confidence categories.
|
• The Mineral Resource estimate for the Project is reported here in accordance with the “Australian Code for Reporting of
Exploration Results, Mineral Resources and Ore Reserves” as prepared by the Joint Ore Reserves Committee (the JORC Code, 2012 Edition).
• IMC performed a statistical and geostatistical analysis for the purpose of evaluating the confidence of continuity of the
geological units and grade parameters. The results of this analysis were applied to developing the Mineral Resource classification criteria for the 1.52m bench height block model.
• Estimated Mineral Resources were classified as follows:
• Measured: Between 107 and 122 m spacing between points of observation depending on the seam, with sample interpolation from a
minimum of four drill holes.
• Indicated: Between 168 and 244 m spacing between points of observation, with sample interpolation from a minimum of two drill holes.
• Inferred: To the limit of the estimation range (maximum 533 m, depending on the seam), with sample interpolation from a minimum of one drill hole.
• The class was assigned from the 1.52m model to the 9.14m model by majority of the six 1.52m blocks combined to one 9.14m block, with the following
exceptions:
• If equal number of two classes (3 blocks and 3 blocks) the lower class was assigned,
• If the block is located within a fault block of a particular seam that has no drill data or less than two holes and was assigned grades from
surrounding data, the class was set to inferred.
|
|
• Whether appropriate account has been taken of all relevant factors (i.e. relative confidence
in tonnage/grade estimations, reliability of input data, confidence in continuity of geology and metal values, quality, quantity and distribution of the data).
|
• The Mineral Resource classification has included the consideration of data reliability, spatial distribution and abundance of
data and continuity of geology and grade parameters
|
|
|
• Whether the result appropriately reflects the Competent Person’s view of the deposit.
|
• It is the Competent Persons view that the classification criteria applied to the Mineral Resource estimate are appropriate for
the reliability and spatial distribution of the base data and reflect the confidence of continuity of the modelled geology and grade parameters.
|
|
APPENDIX D: JORC Code, 2012 Edition - Table 1
|
|
Criteria
|
JORC Code 2012 explanation
|
Commentary
|
|
• The results of any audits or reviews of Mineral Resource estimates.
|
• Beyond high level review for the purpose of understanding the Project history, no formal audits or reviews of previous or
historical Mineral Resource estimates were performed as part of the scope of work; Mineral Resource estimation evaluation is limited to the estimate prepared by IMC and presented in this Report.
|
|
|
• Where appropriate a statement of the relative accuracy and confidence level in the Mineral
Resource estimate using an approach or procedure deemed appropriate by the Competent Person. For example, the application of statistical or geostatistical procedures to quantify the relative accuracy of the resource within
stated confidence limits, or, if such an approach is not deemed appropriate, a qualitative discussion of the factors that could affect the relative accuracy and confidence of the estimate.
|
• IMC performed a statistical and geostatistical analysis and applied Mineral Resource classification criteria to reflect the
relative confidence level of the estimated Mineral Resource tonnes and grades estimated globally across the model area for the Project.
|
|
|
Audits or
reviews
|
• The statement should specify whether it relates to global or local estimates, and, if local,
state the relevant tonnages, which should be relevant to technical and economic evaluation. Documentation should include assumptions made and the procedures used.
|
• The Mineral Resource tonnes and grade have been estimated globally across the model area for the Project.
|
|
Discussion of relative
accuracy/ confidence
|
These statements of relative accuracy and confidence of the estimate should be compared with production data, where available.
|
• Reconciliation against production data/results was not possible as the Project is currently in the development stage and there
has been no production on the Project to date.
|