UNITED STATES
SECURITIES AND EXCHANGE COMMISSION
WASHINGTON, D.C. 20549
FORM 8-K
CURRENT REPORT
PURSUANT TO SECTION 13 OR 15(d) OF THE
SECURITIES EXCHANGE ACT OF 1934
Date of report (Date of earliest event reported): July 31, 2025
AGREE REALTY CORPORATION
(Exact name of registrant as specified in its charter)
Maryland
(State or other jurisdiction of incorporation)
|
1-12928 (Commission file number) |
38-3148187 (I.R.S. Employer Identification No.) |
|
32301 Woodward Avenue Royal Oak, Michigan (Address of principal executive offices) |
48073 (Zip code) |
(Registrant’s telephone number, including area code) (248) 737-4190
Not applicable
(Former name or former address, if changed since last report)
Check the appropriate box below if the Form 8-K filing is intended to simultaneously satisfy the filing obligation of the registrant under any of the following provisions:
| ¨ | Written communications pursuant to Rule 425 under the Securities Act (17 CFR 230.425) |
| ¨ | Soliciting material pursuant to Rule 14a-12 under the Exchange Act (17 CFR 240.14a-12) |
| ¨ | Pre-commencement communications pursuant to Rule 14d-2(b) under the Exchange Act (17 CFR 240.14d-2(b)) |
| ¨ | Pre-commencement communications pursuant to Rule 13e-4(c) under the Exchange Act (17 CFR 240.13e-4(c)) |
Securities registered pursuant to Section 12(b) of the Act:
| Title of each class | Trading Symbol(s) | Name of each exchange on which registered |
| Common Stock, $0.0001 par value | ADC | New York Stock Exchange |
| Depositary Shares, each representing one-thousandth of a share of 4.25% Series A Cumulative Redeemable Preferred Stock, $0.0001 par value | ADCPrA | New York Stock Exchange |
Indicate by check mark whether the registrant is an emerging growth company as defined in Rule 405 of the Securities Act of 1933 (§230.405 of this chapter) or Rule 12b-2 of the Securities Exchange Act of 1934 (§240.12b-2 of this chapter).
Emerging growth company ¨
If an emerging growth company, indicate by check mark if the registrant has elected not to use the extended transition period for complying with any new or revised financial accounting standards provided pursuant to Section 13(a) of the Exchange Act. ¨
| Item 2.02. | Results of Operations and Financial Condition. |
On July 31, 2025, Agree Realty Corporation (the “Company”) issued a press release announcing its results of operations for the second quarter ended June 30, 2025, and posted an updated investor presentation to its website. The press release is furnished as Exhibit 99.1 to this report. The investor presentation is furnished as Exhibit 99.2 to this report.
The information furnished with this Item 2.02 (including Exhibits 99.1 and 99.2 under Item 9.01 below) of this Current Report on Form 8-K shall not be deemed to be “filed” for purposes of Section 18 of the Securities Exchange Act of 1934, as amended (the “Exchange Act”), or otherwise subject to the liabilities of such section, nor shall such information be deemed to be incorporated by reference in any filing under the Securities Act of 1933, as amended, or the Exchange Act, except as shall be expressly set forth by specific reference in such a filing.
| Item 9.01. | Financial Statements and Exhibits. |
| (d) | Exhibits |
| Exhibit | Description |
| 99.1 | Press release, dated July 31, 2025, reporting the Company’s results of operations for the second quarter ended June 30, 2025. |
| 99.2 | July 2025 Investor Presentation. |
| 104 | Cover Page Interactive Data File (embedded within the Inline XBRL document). |
SIGNATURES
Pursuant to the requirements of the Securities Exchange Act of 1934, the registrant has duly caused this report to be signed on its behalf by the undersigned hereunto duly authorized.
| AGREE REALTY CORPORATION | |||
| By: | /s/ Peter Coughenour | ||
| Name: | Peter Coughenour | ||
| Title: | Chief Financial Officer and Secretary | ||
Date: July 31, 2025
Exhibit 99.1
 |
32301 Woodward Ave. Royal Oak, MI 48073 www.agreerealty.com
FOR IMMEDIATE RELEASE |
Agree Realty Corporation Reports Second Quarter 2025 Results
Raises 2025 Investment Guidance to $1.4 Billion to $1.6 Billion
Increases 2025 AFFO Per Share Guidance to $4.29 to $4.32
Royal Oak, MI, July 31, 2025 -- Agree Realty Corporation (NYSE: ADC) (the “Company”) today announced results for the quarter ended June 30, 2025. All per share amounts included herein are on a diluted per common share basis unless otherwise stated.
Second Quarter 2025 Financial and Operating Highlights:
| § | Invested approximately $350 million in 110 retail net lease properties across all three external growth platforms | |
| § | Net Income per share attributable to common stockholders decreased 18.5% to $0.43 | |
| § | Core Funds from Operations (“Core FFO”) per share increased 1.3% to $1.05 | |
| § | Adjusted Funds from Operations (“AFFO”) per share increased 1.7% to $1.06 | |
| § | Declared a monthly dividend of $0.256 per common share for June, a 2.4% year-over-year increase | |
| § | Completed a public bond offering of $400 million of 5.60% senior unsecured notes due 2035 with an all-in rate of 5.35% inclusive of prior hedging activity | |
| § | Completed a forward equity offering of 5.2 million shares of common stock, including the underwriters’ option to purchase additional shares, raising anticipated net proceeds of approximately $387 million | |
| § | Balance sheet positioned for growth at 3.1 times proforma net debt to recurring EBITDA; 5.2 times excluding unsettled forward equity | |
| § | Approximately $2.3 billion of liquidity at quarter end including availability on the revolving credit facility, outstanding forward equity, and cash on hand |
First Half 2025 Financial and Operating Highlights:
| § | Invested approximately $727 million in 162 retail net lease properties across all three external growth platforms | |
| § | Committed approximately $140 million to 25 development or Developer Funding Platform (“DFP”) projects completed or under construction | |
| § | Net Income per share attributable to common stockholders decreased 11.1% to $0.85 | |
| § | Core FFO per share increased 2.2% to $2.09 | |
| § | AFFO per share increased 2.4% to $2.12 | |
| § | Declared dividends of $1.527 per share, a 2.4% year-over-year increase | |
| § | Raised approximately $603 million of forward equity via the Company's at-the-market equity (“ATM”) program and an overnight offering | |
| § | Settled 3.3 million shares of outstanding forward equity for net proceeds of approximately $225 million |
Financial Results
Net Income Attributable to Common Stockholders
Net Income for the three months ended June 30, 2025 decreased 10.5% to $47.3 million, compared to $52.9 million for the comparable period in 2024. Net Income per share for the three months ended June 30th decreased 18.5% to $0.43 compared to $0.52 for the comparable period in 2024.
Net Income for the six months ended June 30, 2025 decreased 3.5% to $92.5 million, compared to $95.9 million for the comparable period in 2024. Net Income per share for the six months ended June 30th decreased 11.1% to $0.85 compared to $0.95 for the comparable period in 2024.
Core FFO
Core FFO for the three months ended June 30, 2025 increased 11.3% to $115.9 million, compared to Core FFO of $104.2 million for the comparable period in 2024. Core FFO per share for the three months ended June 30th increased 1.3% to $1.05, compared to Core FFO per share of $1.03 for the comparable period in 2024.
Core FFO for the six months ended June 30, 2025 increased 10.9% to $228.6 million, compared to Core FFO of $206.2 million for the comparable period in 2024. Core FFO per share for the six months ended June 30th increased 2.2% to $2.09, compared to Core FFO per share of $2.05 for the comparable period in 2024.
AFFO
AFFO for the three months ended June 30, 2025 increased 11.7% to $117.7 million, compared to AFFO of $105.3 million for the comparable period in 2024. AFFO per share for the three months ended June 30th increased 1.7% to $1.06, compared to AFFO per share of $1.04 for the comparable period in 2024.
AFFO for the six months ended June 30, 2025 increased 11.1% to $231.6 million, compared to AFFO of $208.6 million for the comparable period in 2024. AFFO per share for the six months ended June 30th increased 2.4% to $2.12, compared to AFFO per share of $2.07 for the comparable period in 2024.
Dividend
In the second quarter, the Company declared monthly cash dividends of $0.256 per common share for each of April, May and June 2025. The monthly dividends declared during the second quarter reflect an annualized dividend amount of $3.072 per common share, representing a 2.4% increase over the annualized dividend amount of $3.00 per common share from the second quarter of 2024. The dividends represent payout ratios of approximately 73% of Core FFO per share and 72% of AFFO per share, respectively.
For the six months ended June 30, 2025, the Company declared monthly cash dividends totaling $1.527 per common share, a 2.4% increase over the dividends of $1.491 per common share declared for the comparable period in 2024. The dividends represent payout ratios of approximately 73% of Core FFO per share and 72% of AFFO per share, respectively.
Subsequent to quarter end, the Company declared a monthly cash dividend of $0.256 per common share for July 2025. The July monthly dividend reflects an annualized dividend amount of $3.072 per common share, representing a 2.4% increase over the annualized dividend amount of $3.00 per common share from the third quarter of 2024. The July dividend is payable on August 14, 2025 to stockholders of record at the close of business on July 31, 2025.
Additionally, subsequent to quarter end, the Company declared a monthly cash dividend on its 4.25% Series A Cumulative Redeemable Preferred Stock of $0.08854 per depositary share, which is equivalent to $1.0625 per annum. The dividend is payable on August 1, 2025 to stockholders of record at the close of business on July 22, 2025.
Earnings Guidance
The table below provides estimates for significant components of our 2025 earnings guidance. In addition, the AFFO per share guidance range includes an estimate for the dilutive impact of the Company's outstanding forward equity calculated in accordance with the treasury stock method.
| Prior 2025 Guidance(1) |
Revised 2025 Guidance |
|||
| AFFO per share(2) | $4.27 to $4.30 | $4.29 to $4.32 | ||
| General and administrative expenses (% of adjusted revenue)(3) | 5.6% to 5.9% | 5.6% to 5.9% | ||
| Non-reimbursable real estate expenses (% of adjusted revenue)(3) | 1.0% to 1.5% | 1.0% to 1.5% | ||
| Income and other tax expense | $3 to $4 million | $2.5 to $3 million | ||
| Investment volume | $1.3 to $1.5 billion | $1.4 to $1.6 billion | ||
| Disposition volume | $10 to $50 million | $10 to $50 million |
The Company’s 2025 guidance is subject to risks and uncertainties more fully described in this press release and in the Company’s filings with the Securities and Exchange Commission (the “SEC”).
| (1) | As issued on April 22, 2025. | |
| (2) | The Company does not provide guidance with respect to the most directly comparable GAAP financial measure or provide reconciliations to GAAP from its forward-looking non-GAAP financial measure of AFFO per share guidance due to the inherent difficulty of forecasting the effect, timing and significance of certain amounts in the reconciliation that would be required by Item 10(e)(1)(i)(B) of Regulation S-K. Examples of these amounts include impairments of assets, gains and losses from sales of assets, and depreciation and amortization from new acquisitions or developments. In addition, certain non-recurring items may also significantly affect net income but are generally adjusted for in AFFO. Based on our historical experience, the dollar amounts of these items could be significant and could have a material impact on the Company’s GAAP results for the guidance period. | |
| (3) | Adjusted revenue excludes the impact of the amortization of above and below market lease intangibles. |
CEO Comments
"We are very pleased with our strong performance during the first half of the year,” said Joey Agree, President and Chief Executive Officer. “During the quarter, we strategically raised over $800 million of debt and equity capital, bolstering our fortress balance sheet which now has $2.3 billion of liquidity. Given the continued strong performance of our portfolio, our fully funded balance sheet, and increasing activity across all three external growth platforms, we are increasing full-year 2025 investment guidance to a range of $1.4 billion to $1.6 billion and raising 2025 AFFO per share guidance to a range of $4.29 to $4.32.”
Portfolio Update
As of June 30, 2025, the Company’s portfolio consisted of 2,513 properties located in all 50 states and contained approximately 52.0 million square feet of gross leasable area. At quarter end, the portfolio was approximately 99.6% leased, had a weighted-average remaining lease term of approximately 8.0 years, and generated 67.8% of annualized base rents from investment grade retail tenants.
Ground Lease Portfolio
During the second quarter, the Company acquired one ground lease for an aggregate purchase price of approximately $3.8 million, representing 1.0% of annualized base rents acquired.
As of June 30, 2025, the Company’s ground lease portfolio consisted of 232 leases located in 37 states and totaled approximately 6.4 million square feet of gross leasable area. Properties ground leased to tenants represented 10.3% of annualized base rents.
At quarter end, the ground lease portfolio was fully occupied, had a weighted-average remaining lease term of approximately 9.4 years, and generated 88.1% of annualized base rents from investment grade retail tenants.
Acquisitions
Total acquisition volume for the second quarter was approximately $327.5 million and included 91 properties net leased to leading retailers operating in sectors including auto parts, general merchandise, grocery stores, off-price, farm and rural supply, crafts and novelties, and tire and auto service. The properties are located in 29 states and leased to tenants operating in 21 sectors.
The properties were acquired at a weighted-average capitalization rate of 7.1% and had a weighted-average remaining lease term of approximately 12.2 years. Approximately 53.3% of annualized base rents acquired were generated from investment grade retail tenants.
For the six months ended June 30, 2025, total acquisition volume was approximately $686.4 million. The 137 acquired properties are located in 36 states and leased to tenants who operate in 25 retail sectors. The properties were acquired at a weighted-average capitalization rate of 7.2% and had a weighted-average remaining lease term of approximately 12.8 years. Approximately 61.4% of annualized base rents were generated from investment grade retail tenants.
Dispositions
During the second quarter, the Company sold four properties for gross proceeds of approximately $6.2 million. During the six months ended June 30, 2025, the Company sold five properties for gross proceeds of approximately $8.7 million.
The Company anticipates disposition volume for the full year 2025 to be between $10 million and $50 million.
Development and Developer Funding Platform
During the second quarter, the Company commenced one development or DFP project, with total anticipated costs of approximately $8.6 million. Construction continued during the quarter on 14 projects with anticipated costs totaling approximately $90.4 million. The Company completed four projects during the quarter with total costs of approximately $13.4 million.
For the six months ended June 30, 2025, the Company had 25 development or DFP projects completed or under construction with anticipated total costs of approximately $139.6 million. The projects are leased to leading retailers including TJX Companies, Burlington, 7-Eleven, Boot Barn, Starbucks, Gerber Collision, and Sunbelt Rentals.
The following table presents estimated costs for the Company's active or completed development and DFP projects for the six months ended June 30, 2025:
| Quarter of Delivery | Number of Projects |
Costs Funded to Date |
Remaining Funding Costs |
Anticipated Total Project Costs |
||||||||||||
| Q1 2025 | 6 | $ | 27,234 | $ | - | $ | 27,234 | |||||||||
| Q2 2025 | 4 | 13,403 | - | 13,403 | ||||||||||||
| Q3 2025 | 7 | 33,332 | 15,199 | 48,531 | ||||||||||||
| Q4 2025 | 5 | 17,776 | 12,557 | 30,333 | ||||||||||||
| Q1 2026 | 1 | 1,934 | 11,847 | 13,781 | ||||||||||||
| Q2 2026 | 1 | 1,523 | 1,127 | 2,650 | ||||||||||||
| Q4 2026 | 1 | 2,473 | 1,227 | 3,700 | ||||||||||||
| Total | 25 | $ | 97,675 | $ | 41,957 | $ | 139,632 | |||||||||
Development and DFP project costs are in thousands; any differences are the result of rounding. Costs Funded to Date may include adjustments related to completed projects to arrive at the correct Anticipated Total Project Costs.
Leasing Activity and Expirations
During the second quarter, the Company executed new leases, extensions or options on approximately 948,000 square feet of gross leasable area throughout the existing portfolio. Notable new leases, extensions or options included a 218,000-square foot Walmart Supercenter in Franklin, Ohio, a 58,000-square foot Best Buy in Palmdale, California, and five geographically diverse leases with TJX Companies comprising over 125,000-square feet.
For the six months ended June 30, 2025, the Company executed new leases, extensions or options on approximately 1.5 million square feet of gross leasable area throughout the existing portfolio.
As of June 30, 2025, the Company’s 2025 lease maturities represented 0.4% of annualized base rents. The following table presents contractual lease expirations within the Company’s portfolio as of June 30, 2025, assuming no tenants exercise renewal options:
| Year | Leases | Annualized Base Rent (1) |
Percent of Annualized Base Rent |
Gross |
Percent of Gross Leasable Area |
|||||||||||||||
| 2025 | 16 | $ | 2,601 | 0.4 | % | 230 | 0.4 | % | ||||||||||||
| 2026 | 91 | 19,751 | 2.9 | % | 2,057 | 4.0 | % | |||||||||||||
| 2027 | 165 | 37,322 | 5.5 | % | 3,489 | 6.7 | % | |||||||||||||
| 2028 | 177 | 46,400 | 6.9 | % | 4,057 | 7.8 | % | |||||||||||||
| 2029 | 210 | 66,393 | 9.8 | % | 6,268 | 12.1 | % | |||||||||||||
| 2030 | 323 | 69,766 | 10.3 | % | 5,819 | 11.2 | % | |||||||||||||
| 2031 | 210 | 51,540 | 7.6 | % | 3,845 | 7.4 | % | |||||||||||||
| 2032 | 243 | 50,883 | 7.5 | % | 3,679 | 7.1 | % | |||||||||||||
| 2033 | 220 | 50,298 | 7.5 | % | 3,935 | 7.6 | % | |||||||||||||
| 2034 | 216 | 49,913 | 7.4 | % | 3,339 | 6.4 | % | |||||||||||||
| Thereafter | 833 | 229,674 | 34.2 | % | 15,056 | 29.3 | % | |||||||||||||
| Total Portfolio | 2,704 | $ | 674,541 | 100.0 | % | 51,774 | 100.0 | % | ||||||||||||
The contractual lease expirations presented above exclude the effect of replacement tenant leases that had been executed as of June 30, 2025, but that had not yet commenced. Annualized Base Rent and gross leasable area (square feet) are in thousands; any differences are the result of rounding.
| (1) | Annualized Base Rent represents the annualized amount of contractual minimum rent required by tenant lease agreements as of June 30, 2025, computed on a straight-line basis. Annualized Base Rent is not, and is not intended to be, a presentation in accordance with generally accepted accounting principles (“GAAP”). The Company believes annualized contractual minimum rent is useful to management, investors, and other interested parties in analyzing concentrations and leasing activity. |
Top Tenants
The Company added Genuine Parts Company (NAPA Auto Parts) to its top tenants during the second quarter of 2025. The following table presents annualized base rents for all tenants that represent 1.5% or greater of the Company’s total annualized base rent as of June 30, 2025:
| Tenant | Annualized Base Rent(1) |
Percent of Annualized Base Rent |
||||||
| Walmart | $ | 40,287 | 6.0 | % | ||||
| Tractor Supply | 32,580 | 4.8 | % | |||||
| Dollar General | 28,437 | 4.2 | % | |||||
| Best Buy | 21,721 | 3.2 | % | |||||
| O'Reilly Auto Parts | 20,724 | 3.1 | % | |||||
| Kroger | 20,534 | 3.0 | % | |||||
| TJX Companies | 20,068 | 3.0 | % | |||||
| CVS | 20,027 | 3.0 | % | |||||
| Hobby Lobby | 19,097 | 2.8 | % | |||||
| Dollar Tree | 18,618 | 2.8 | % | |||||
| Lowe's | 17,884 | 2.7 | % | |||||
| Gerber Collision | 15,386 | 2.3 | % | |||||
| Sunbelt Rentals | 15,321 | 2.3 | % | |||||
| 7-Eleven | 14,690 | 2.2 | % | |||||
| Burlington | 14,653 | 2.2 | % | |||||
| Sherwin-Williams | 12,439 | 1.8 | % | |||||
| Home Depot | 11,384 | 1.7 | % | |||||
| Genuine Parts Company (NAPA Auto Parts) | 11,144 | 1.7 | % | |||||
| Wawa | 10,410 | 1.5 | % | |||||
| Other(2) | 309,137 | 45.7 | % | |||||
| Total Portfolio | $ | 674,541 | 100.0 | % | ||||
Annualized Base Rent is in thousands; any differences are the result of rounding.
Bolded and italicized tenants represent additions for the three months ended June 30, 2025.
(1) Refer to footnote 1 on page 6 for the Company’s definition of Annualized Base Rent.
(2) Includes tenants generating less than 1.5% of Annualized Base Rent.
Retail Sectors
The following table presents annualized base rents for all the Company’s retail sectors as of June 30, 2025:
| Sector | Annualized Base Rent(1) |
Percent of Annualized Base Rent |
||||||
| Grocery Stores | $ | 71,484 | 10.6 | % | ||||
| Home Improvement | 59,248 | 8.8 | % | |||||
| Tire and Auto Service | 51,757 | 7.7 | % | |||||
| Convenience Stores | 51,271 | 7.6 | % | |||||
| Auto Parts | 46,950 | 7.0 | % | |||||
| Dollar Stores | 45,511 | 6.7 | % | |||||
| Off-Price Retail | 40,304 | 6.0 | % | |||||
| General Merchandise | 35,732 | 5.3 | % | |||||
| Farm and Rural Supply | 34,351 | 5.1 | % | |||||
| Consumer Electronics | 25,316 | 3.8 | % | |||||
| Pharmacy | 24,978 | 3.7 | % | |||||
| Crafts and Novelties | 21,416 | 3.2 | % | |||||
| Health Services | 16,853 | 2.5 | % | |||||
| Warehouse Clubs | 16,809 | 2.5 | % | |||||
| Equipment Rental | 16,377 | 2.4 | % | |||||
| Discount Stores | 15,653 | 2.3 | % | |||||
| Dealerships | 15,078 | 2.2 | % | |||||
| Health and Fitness | 13,557 | 2.0 | % | |||||
| Restaurants - Quick Service | 13,087 | 1.9 | % | |||||
| Specialty Retail | 9,612 | 1.4 | % | |||||
| Sporting Goods | 9,293 | 1.4 | % | |||||
| Financial Services | 7,388 | 1.1 | % | |||||
| Restaurants - Casual Dining | 5,716 | 0.8 | % | |||||
| Home Furnishings | 4,700 | 0.7 | % | |||||
| Shoes | 4,134 | 0.6 | % | |||||
| Theaters | 3,976 | 0.6 | % | |||||
| Pet Supplies | 3,782 | 0.6 | % | |||||
| Beauty and Cosmetics | 3,493 | 0.5 | % | |||||
| Entertainment Retail | 2,651 | 0.4 | % | |||||
| Apparel | 2,161 | 0.3 | % | |||||
| Miscellaneous | 1,279 | 0.2 | % | |||||
| Office Supplies | 624 | 0.1 | % | |||||
| Total Portfolio | $ | 674,541 | 100.0 | % | ||||
Annualized Base Rent is in thousands; any differences are the result of rounding.
(1) Refer to footnote 1 on page 6 for the Company’s definition of Annualized Base Rent.
Geographic Diversification
The following table presents annualized base rents for all states that represent 1.5% or greater of the Company’s total annualized base rent as of June 30, 2025:
| State | Annualized Base Rent(1) |
Percent of Annualized Base Rent |
||||||
| Texas | $ | 48,361 | 7.2 | % | ||||
| Illinois | 40,548 | 6.0 | % | |||||
| Michigan | 36,528 | 5.4 | % | |||||
| Ohio | 34,177 | 5.1 | % | |||||
| Pennsylvania | 33,539 | 5.0 | % | |||||
| Florida | 33,237 | 4.9 | % | |||||
| New York | 32,792 | 4.9 | % | |||||
| North Carolina | 32,419 | 4.8 | % | |||||
| California | 29,212 | 4.3 | % | |||||
| Georgia | 25,976 | 3.9 | % | |||||
| New Jersey | 24,194 | 3.6 | % | |||||
| Wisconsin | 19,780 | 2.9 | % | |||||
| Missouri | 18,562 | 2.8 | % | |||||
| Louisiana | 18,449 | 2.7 | % | |||||
| Virginia | 16,980 | 2.5 | % | |||||
| South Carolina | 15,864 | 2.4 | % | |||||
| Kansas | 15,556 | 2.3 | % | |||||
| Mississippi | 15,502 | 2.3 | % | |||||
| Minnesota | 14,065 | 2.1 | % | |||||
| Connecticut | 13,474 | 2.0 | % | |||||
| Indiana | 12,861 | 1.9 | % | |||||
| Massachusetts | 12,727 | 1.9 | % | |||||
| Tennessee | 12,686 | 1.9 | % | |||||
| Alabama | 11,244 | 1.7 | % | |||||
| Oklahoma | 10,488 | 1.6 | % | |||||
| Other(2) | 95,320 | 13.9 | % | |||||
| Total Portfolio | $ | 674,541 | 100.0 | % | ||||
Annualized Base Rent is in thousands; any differences are the result of rounding.
(1) Refer to footnote 1 on page 6 for the Company’s definition of Annualized Base Rent.
(2) Includes states generating less than 1.5% of Annualized Base Rent.
Capital Markets, Liquidity and Balance Sheet
Capital Markets
In April 2025, the Company completed a follow-on public offering of approximately 5.2 million shares of common stock, including the full exercise of the underwriters' option to purchase additional shares, in connection with forward sale agreements. Upon settlement, the offering is anticipated to raise net proceeds of $387.2 million after deducting fees and making certain other adjustments as provided in the equity distribution agreements.
In May 2025, the Company completed a $400 million public bond offering of 5.60% senior unsecured notes due 2035 (the "Notes"). In connection with the offering, the Company terminated related swap agreements of $325 million, receiving $13.6 million upon termination. Considering the effect of the terminated swap agreements, the all-in rate to the Company for the Notes is 5.35%.
During the second quarter, the Company entered into forward sale agreements in connection with its ATM program to sell an aggregate of 0.4 million shares of common stock for net proceeds of $27.4 million. Additionally, the Company settled 0.7 million shares under existing forward sale agreements for net proceeds of $41.2 million.
The following table presents the Company’s outstanding forward equity offerings as of June 30, 2025:
| Forward Equity Offerings |
Shares Sold |
Shares Settled |
Shares Remaining |
Net Proceeds Received |
Anticipated Net Proceeds Remaining |
|||||||||||||||
| Q3 2024 ATM Forward Offerings | 6,602,317 | 2,869,424 | 3,732,893 | $ | 196,707,425 | $ | 271,392,061 | |||||||||||||
| Q4 2024 ATM Forward Offerings | 739,013 | - | 739,013 | - | 55,081,875 | |||||||||||||||
| October 2024 Forward Offering | 5,060,000 | - | 5,060,000 | - | 366,942,092 | |||||||||||||||
| Q1 2025 ATM Forward Offerings | 2,408,201 | - | 2,408,201 | - | 181,396,169 | |||||||||||||||
| Q2 2025 ATM Forward Offerings | 362,021 | - | 362,021 | - | 27,384,328 | |||||||||||||||
| April 2025 Forward Offering | 5,175,000 | - | 5,175,000 | - | 387,195,570 | |||||||||||||||
| Total Forward Equity Offerings | 20,346,552 | 2,869,424 | 17,477,128 | $ | 196,707,425 | $ | 1,289,392,095 | |||||||||||||
Liquidity
As of June 30, 2025, the Company had total liquidity of $2.3 billion, which includes $1.0 billion of availability under its revolving credit facility after adjusting for outstanding commercial paper notes and revolver borrowings, $1.3 billion of outstanding forward equity, and $8.9 million of cash on hand. The Company’s $1.25 billion revolving credit facility includes an accordion option that allows the Company to request additional lender commitments of up to a total of $2.0 billion.
Balance Sheet
As of June 30, 2025, the Company’s net debt to recurring EBITDA was 5.2 times. The Company’s proforma net debt to recurring EBITDA was 3.1 times when deducting the $1.3 billion of anticipated net proceeds from the outstanding forward equity offerings from the Company’s net debt of $3.2 billion as of June 30, 2025. The Company’s fixed charge coverage ratio was 4.2 times at quarter end.
The Company’s total debt to enterprise value was 28.2% as of June 30, 2025. Enterprise value is calculated as the sum of net debt, the liquidation value of the Company’s preferred stock, and the market value of the Company’s outstanding shares of common stock, assuming conversion of Agree Limited Partnership (the “Operating Partnership” or “OP”) common units into common stock of the Company.
For the three months and six months ended June 30, 2025, the Company's fully diluted weighted-average shares outstanding were 110.4 million and 109.0 million, respectively. The basic weighted-average shares outstanding for the three and six months ended June 30, 2025 were 109.8 million and 108.4 million, respectively.
For the three months and six months ended June 30, 2025, the Company's fully diluted weighted-average shares and units outstanding were 110.7 million and 109.3 million, respectively. The basic weighted-average shares and units outstanding for the three and six months ended June 30, 2025 were 110.1 million and 108.8 million, respectively.
The Company’s assets are held by, and its operations are conducted through, the Operating Partnership, of which the Company is the sole general partner. As of June 30, 2025, there were 347,619 Operating Partnership common units outstanding, and the Company held a 99.7% common interest in the Operating Partnership.
Conference Call/Webcast
The Company will host its quarterly analyst and investor conference call on Friday, August 1, 2025 at 9:00 AM ET. To participate in the conference call, please dial (800) 715-9871 approximately ten minutes before the call begins.
Additionally, a webcast of the conference call will be available via the Company’s website. To access the webcast, visit www.agreerealty.com ten minutes prior to the start of the conference call and go to the Investors section of the website. A replay of the conference call webcast will be archived and available online through the Investors section of www.agreerealty.com.
About Agree Realty Corporation
Agree Realty Corporation is a publicly traded real estate investment trust that is RETHINKING RETAIL through the acquisition and development of properties net leased to industry-leading, omni-channel retail tenants. As of June 30, 2025, the Company owned and operated a portfolio of 2,513 properties, located in all 50 states and containing approximately 52.0 million square feet of gross leasable area. The Company’s common stock is listed on the New York Stock Exchange under the symbol “ADC”. For additional information on the Company and RETHINKING RETAIL, please visit www.agreerealty.com.
Forward-Looking Statements
This press release contains forward-looking statements within the meaning of Section 27A of the Securities Act of 1933, as amended (the “Securities Act”) and Section 21E of the Securities Exchange Act of 1934, as amended (the “Exchange Act”). The Company intends such forward-looking statements to be covered by the safe harbor provisions for forward-looking statements contained in the Private Securities Litigation Reform Act of 1995 and includes this statement for purposes of complying with these safe harbor provisions. Forward-looking statements, which are based on certain assumptions and describe the Company’s future plans, strategies and expectations, are generally identifiable by use of the words “anticipate,” “estimate,” “should,” “expect,” “believe,” “intend,” “may,” “will,” “seek,” “could,” “project” or other similar expressions. You should not rely on forward-looking statements since they involve known and unknown risks, uncertainties and other factors which are, in some cases, beyond the Company’s control and which could materially affect the Company’s results of operations, financial condition, cash flows, performance or future achievements or events. Factors which may cause actual results to differ materially from current expectations include, but are not limited to, the factors included in the Company’s Annual Report on Form 10-K for the year ended December 31, 2024, including those set forth under the headings “Business,” “Risk Factors,” and “Management’s Discussion and Analysis of Financial Condition and Results of Operations” and subsequent quarterly reports filed with the SEC. The forward-looking statements included in this press release are made as of the date hereof. Unless legally required, the Company disclaims any obligation to update any forward-looking statements, whether as a result of new information, future events, changes in the Company’s expectations or assumptions or otherwise.
For further information about the Company’s business and financial results, please refer to the “Management’s Discussion and Analysis of Financial Condition and Results of Operations” and “Risk Factors” sections of the Company’s SEC filings, including, but not limited to, its Annual Report on Form 10-K and Quarterly Reports on Form 10-Q, copies of which may be obtained at the Investor Relations section of the Company’s website at www.agreerealty.com.
The Company defines the “weighted-average capitalization rate” for acquisitions and dispositions as the sum of contractual fixed annual rents computed on a straight-line basis over the primary lease terms and anticipated annual net tenant recoveries, divided by the purchase and sale prices for occupied properties.
The Company defines the "all-in rate" as the interest rate that reflects the straight-line amortization of the terminated swap agreements and original issuance discount, as applicable.
References to “Core FFO” and “AFFO” in this press release are representative of Core FFO attributable to OP common unitholders and AFFO attributable to OP common unitholders. Detailed calculations for these measures are shown in the Reconciliation of Net Income to FFO, Core FFO and Adjusted FFO table as “Core Funds From Operations – OP Common Unitholders” and “Adjusted Funds from Operations – OP Common Unitholders”.
###
Contact:
Peter Coughenour
Chief Financial Officer
Agree Realty Corporation
(248) 737-4190
Agree Realty Corporation
Consolidated Balance Sheet
($ in thousands, except share and per-share data)
(Unaudited)
| June 30, 2025 | December 31, 2024 | |||||||
| Assets: | ||||||||
| Real Estate Investments: | ||||||||
| Land | $ | 2,663,023 | $ | 2,514,167 | ||||
| Buildings | 5,872,397 | 5,412,564 | ||||||
| Less accumulated depreciation | (638,960 | ) | (564,429 | ) | ||||
| Property under development | 62,165 | 55,806 | ||||||
| Net real estate investments | 7,958,625 | 7,418,108 | ||||||
| Real estate held for sale, net | 3,473 | - | ||||||
| Cash and cash equivalents | 5,824 | 6,399 | ||||||
| Cash held in escrows | 3,087 | - | ||||||
| Accounts receivable - tenants, net | 108,117 | 106,416 | ||||||
| Lease intangibles, net of accumulated amortization of $517,216 and $461,419 at June 30, 2025 and December 31, 2024, respectively | 923,092 | 864,937 | ||||||
| Other assets, net | 82,526 | 90,586 | ||||||
| Total Assets | $ | 9,084,744 | $ | 8,486,446 | ||||
| Liabilities: | ||||||||
| Mortgage notes payable, net | 41,886 | 42,210 | ||||||
| Unsecured term loans, net | 347,767 | 347,452 | ||||||
| Senior unsecured notes, net | 2,582,892 | 2,237,759 | ||||||
| Unsecured revolving credit facility and commercial paper notes | 247,000 | 158,000 | ||||||
| Dividends and distributions payable | 29,039 | 27,842 | ||||||
| Accounts payable, accrued expenses, and other liabilities | 132,089 | 116,273 | ||||||
| Lease intangibles, net of accumulated amortization of $48,389 and $46,003 at June 30, 2025 and December 31, 2024, respectively | 49,667 | 46,249 | ||||||
| Total Liabilities | $ | 3,430,340 | $ | 2,975,785 | ||||
| Equity: | ||||||||
| Preferred Stock, $.0001 par value per share, 4,000,000 shares authorized, 7,000 shares Series A outstanding, at stated liquidation value of $25,000 per share, at June 30, 2025 and December 31, 2024 | 175,000 | 175,000 | ||||||
| Common stock, $.0001 par value, 360,000,000 and 180,000,000 shares authorized, 110,666,238 and 107,248,705 shares issued and outstanding at June 30, 2025 and December 31, 2024, respectively | 11 | 10 | ||||||
| Additional paid-in-capital | 5,992,510 | 5,765,582 | ||||||
| Dividends in excess of net income | (545,372 | ) | (470,622 | ) | ||||
| Accumulated other comprehensive income | 31,891 | 40,076 | ||||||
| Total equity - Agree Realty Corporation | $ | 5,654,040 | $ | 5,510,046 | ||||
| Non-controlling interest | 364 | 615 | ||||||
| Total Equity | $ | 5,654,404 | $ | 5,510,661 | ||||
| Total Liabilities and Equity | $ | 9,084,744 | $ | 8,486,446 | ||||
Agree Realty Corporation
Consolidated Statements of Operations and Comprehensive Income
($ in thousands, except share and per share-data)
(Unaudited)
|
Three months ended June 30, |
Six months ended June 30, |
|||||||||||||||
| 2025 | 2024 | 2025 | 2024 | |||||||||||||
| Revenues | ||||||||||||||||
| Rental Income | $ | 175,397 | $ | 152,424 | $ | 344,510 | $ | 301,847 | ||||||||
| Other | 130 | 151 | 177 | 182 | ||||||||||||
| Total Revenues | $ | 175,527 | $ | 152,575 | $ | 344,687 | $ | 302,029 | ||||||||
| Operating Expenses | ||||||||||||||||
| Real estate taxes | $ | 12,833 | $ | 10,721 | $ | 24,346 | $ | 21,422 | ||||||||
| Property operating expenses | 8,416 | 6,487 | 16,797 | 13,860 | ||||||||||||
| Land lease expense | 550 | 415 | 1,036 | 830 | ||||||||||||
| General and administrative | 11,332 | 9,707 | 22,104 | 19,222 | ||||||||||||
| Depreciation and amortization | 58,939 | 50,454 | 114,693 | 98,917 | ||||||||||||
| Provision for impairment | 2,961 | - | 7,292 | 4,530 | ||||||||||||
| Total Operating Expenses | $ | 95,031 | $ | 77,784 | $ | 186,268 | $ | 158,781 | ||||||||
| Gain on sale of assets, net | 1,510 | 7,156 | 2,282 | 9,252 | ||||||||||||
| Gain (loss) on involuntary conversion, net | - | 20 | - | (35 | ) | |||||||||||
| Income from Operations | $ | 82,006 | $ | 81,967 | $ | 160,701 | $ | 152,465 | ||||||||
| Other (Expense) Income | ||||||||||||||||
| Interest expense, net | $ | (32,274 | ) | $ | (26,416 | ) | $ | (63,037 | ) | $ | (50,867 | ) | ||||
| Income and other tax expense | (425 | ) | (1,004 | ) | (1,250 | ) | (2,154 | ) | ||||||||
| Other (expense) income | 46 | 366 | 87 | 483 | ||||||||||||
| Net Income | $ | 49,353 | $ | 54,913 | $ | 96,501 | $ | 99,927 | ||||||||
| Less net income attributable to non-controlling interest | 155 | 189 | 307 | 344 | ||||||||||||
| Net Income Attributable to Agree Realty Corporation | $ | 49,198 | $ | 54,724 | $ | 96,194 | $ | 99,583 | ||||||||
| Less Series A Preferred Stock Dividends | 1,859 | 1,859 | 3,718 | 3,718 | ||||||||||||
| Net Income Attributable to Common Stockholders | $ | 47,339 | $ | 52,865 | $ | 92,476 | $ | 95,865 | ||||||||
| Net Income Per Share Attributable to Common Stockholders | ||||||||||||||||
| Basic | $ | 0.43 | $ | 0.53 | $ | 0.85 | $ | 0.95 | ||||||||
| Diluted | $ | 0.43 | $ | 0.52 | $ | 0.85 | $ | 0.95 | ||||||||
| Other Comprehensive Income | ||||||||||||||||
| Net Income | $ | 49,353 | $ | 54,913 | $ | 96,501 | $ | 99,927 | ||||||||
| Amortization of interest rate swaps | (880 | ) | (675 | ) | (1,616 | ) | (1,305 | ) | ||||||||
| Change in fair value and settlement of interest rate swaps | 3,435 | 4,172 | (6,596 | ) | 15,716 | |||||||||||
| Total Comprehensive Income | 51,908 | 58,410 | 88,289 | 114,338 | ||||||||||||
| Less comprehensive income attributable to non-controlling interest | 163 | 201 | 280 | 394 | ||||||||||||
| Comprehensive Income Attributable to Agree Realty Corporation | $ | 51,745 | $ | 58,209 | $ | 88,009 | $ | 113,944 | ||||||||
| Weighted Average Number of Common Shares Outstanding - Basic | 109,758,046 | 100,349,943 | 108,419,011 | 100,319,591 | ||||||||||||
| Weighted Average Number of Common Shares Outstanding - Diluted | 110,377,221 | 100,454,703 | 108,996,422 | 100,415,466 | ||||||||||||
Agree Realty Corporation
Reconciliation of Net Income to FFO, Core FFO and Adjusted FFO
($ in thousands, except share and per-share data)
(Unaudited)
|
Three months ended June 30, |
Six
months ended |
|||||||||||||||
| 2025 | 2024 | 2025 | 2024 | |||||||||||||
| Net Income | $ | 49,353 | $ | 54,913 | $ | 96,501 | $ | 99,927 | ||||||||
| Less Series A Preferred Stock Dividends | 1,859 | 1,859 | 3,718 | 3,718 | ||||||||||||
| Net Income attributable to OP Common Unitholders | 47,494 | 53,054 | 92,783 | 96,209 | ||||||||||||
| Depreciation of rental real estate assets | 38,698 | 33,531 | 75,861 | 65,497 | ||||||||||||
| Amortization of lease intangibles - in-place leases and leasing costs | 19,679 | 16,424 | 37,743 | 32,420 | ||||||||||||
| Provision for impairment | 2,961 | - | 7,292 | 4,530 | ||||||||||||
| (Gain) loss on sale or involuntary conversion of assets, net | (1,510 | ) | (7,176 | ) | (2,282 | ) | (9,217 | ) | ||||||||
| Funds from Operations - OP Common Unitholders | $ | 107,322 | $ | 95,833 | $ | 211,397 | $ | 189,439 | ||||||||
| Amortization of above (below) market lease intangibles, net and assumed mortgage debt discount, net | 8,620 | 8,381 | 17,250 | 16,759 | ||||||||||||
| Core Funds from Operations - OP Common Unitholders | $ | 115,942 | $ | 104,214 | $ | 228,647 | $ | 206,198 | ||||||||
| Straight-line accrued rent | (3,789 | ) | (3,496 | ) | (7,798 | ) | (6,343 | ) | ||||||||
| Stock based compensation expense | 3,259 | 2,789 | 6,388 | 5,213 | ||||||||||||
| Amortization of financing costs and original issue discounts | 1,703 | 1,302 | 3,315 | 2,488 | ||||||||||||
| Non-real estate depreciation | 562 | 499 | 1,089 | 1,000 | ||||||||||||
| Adjusted Funds from Operations - OP Common Unitholders | $ | 117,677 | $ | 105,308 | $ | 231,641 | $ | 208,556 | ||||||||
| Funds from Operations Per Common Share and OP Unit - Basic | $ | 0.97 | $ | 0.95 | $ | 1.94 | $ | 1.88 | ||||||||
| Funds from Operations Per Common Share and OP Unit - Diluted | $ | 0.97 | $ | 0.95 | $ | 1.93 | $ | 1.88 | ||||||||
| Core Funds from Operations Per Common Share and OP Unit - Basic | $ | 1.05 | $ | 1.03 | $ | 2.10 | $ | 2.05 | ||||||||
| Core Funds from Operations Per Common Share and OP Unit - Diluted | $ | 1.05 | $ | 1.03 | $ | 2.09 | $ | 2.05 | ||||||||
| Adjusted Funds from Operations Per Common Share and OP Unit - Basic | $ | 1.07 | $ | 1.05 | $ | 2.13 | $ | 2.07 | ||||||||
| Adjusted Funds from Operations Per Common Share and OP Unit - Diluted | $ | 1.06 | $ | 1.04 | $ | 2.12 | $ | 2.07 | ||||||||
| Weighted Average Number of Common Shares and OP Units Outstanding - Basic | 110,105,665 | 100,697,562 | 108,766,630 | 100,667,210 | ||||||||||||
| Weighted Average Number of Common Shares and OP Units Outstanding - Diluted | 110,724,840 | 100,802,322 | 109,344,041 | 100,763,085 | ||||||||||||
| Additional supplemental disclosure | ||||||||||||||||
| Scheduled principal repayments | $ | 254 | $ | 239 | $ | 505 | $ | 474 | ||||||||
| Capitalized interest | 497 | 398 | 939 | 701 | ||||||||||||
| Capitalized building improvements | 2,762 | 3,296 | 3,362 | 3,789 | ||||||||||||
Non-GAAP Financial Measures
Funds from Operations (“FFO” or “Nareit FFO”)
FFO is defined by the National Association of Real Estate Investment Trusts, Inc. (“Nareit”) to mean net income computed in accordance with GAAP, excluding gains (or losses) from sales of real estate assets and/or changes in control, plus real estate related depreciation and amortization and any impairment charges on depreciable real estate assets, and after adjustments for unconsolidated partnerships and joint ventures. Historical cost accounting for real estate assets in accordance with GAAP implicitly assumes that the value of real estate assets diminishes predictably over time. Since real estate values instead have historically risen or fallen with market conditions, most real estate industry investors consider FFO to be helpful in evaluating a real estate company’s operations. FFO should not be considered an alternative to net income as the primary indicator of the Company’s operating performance, or as an alternative to cash flow as a measure of liquidity. Further, while the Company adheres to the Nareit definition of FFO, its presentation of FFO is not necessarily comparable to similarly titled measures of other REITs due to the fact that all REITs may not use the same definition.
Core Funds from Operations (“Core
FFO”)
The Company defines Core FFO as Nareit FFO with the addback of (i) noncash amortization of acquisition purchase
price related to above- and below- market lease intangibles and discount on assumed debt and (ii) certain infrequently occurring
items that reduce or increase net income in accordance with GAAP. Management believes that its measure of Core FFO facilitates useful
comparison of performance to its peers who predominantly transact in sale-leaseback transactions and are thereby not required by GAAP
to allocate purchase price to lease intangibles. Unlike many of its peers, the Company has acquired the substantial majority of its net-leased
properties through acquisitions of properties from third parties or in connection with the acquisitions of ground leases from third parties.
Core FFO should not be considered an alternative to net income as the primary indicator of the Company’s operating performance,
or as an alternative to cash flow as a measure of liquidity. Further, the Company’s presentation of Core FFO is not necessarily
comparable to similarly titled measures of other REITs due to the fact that all REITs may not use the same definition.
Adjusted
Funds from Operations (“AFFO”)
AFFO is a non-GAAP financial measure of operating performance used by many companies
in the REIT industry. AFFO further adjusts FFO and Core FFO for certain non-cash items that reduce or increase net income computed in
accordance with GAAP. Management considers AFFO a useful supplemental measure of the Company’s performance, however, AFFO should
not be considered an alternative to net income as an indication of its performance, or to cash flow as a measure of liquidity or ability
to make distributions. The Company’s computation of AFFO may differ from the methodology for calculating AFFO used by other equity
REITs, and therefore may not be comparable to such other REITs.
Agree Realty Corporation
Reconciliation of Non-GAAP Financial Measures
($ in thousands, except share and per-share data)
(Unaudited)
| Three months ended June 30, |
||||
| 2025 | ||||
| Mortgage notes payable, net | $ | 41,886 | ||
| Unsecured term loan, net | 347,767 | |||
| Senior unsecured notes, net | 2,582,892 | |||
| Unsecured revolving credit facility and commercial paper notes | 247,000 | |||
| Total Debt per the Consolidated Balance Sheet | $ | 3,219,545 | ||
| Unamortized debt issuance costs and discounts, net | 30,854 | |||
| Total Debt | $ | 3,250,399 | ||
| Cash and cash equivalents | $ | (5,824 | ) | |
| Cash held in escrows | (3,087 | ) | ||
| Net Debt | $ | 3,241,488 | ||
| Anticipated Net Proceeds from Forward Equity Offerings | (1,289,392 | ) | ||
| Proforma Net Debt | $ | 1,952,096 | ||
| Net Income | $ | 49,353 | ||
| Interest expense, net | 32,274 | |||
| Income and other tax expense | 425 | |||
| Depreciation of rental real estate assets | 38,698 | |||
| Amortization of lease intangibles - in-place leases and leasing costs | 19,679 | |||
| Non-real estate depreciation | 562 | |||
| Provision for Impairment | 2,961 | |||
| (Gain) loss on sale or involuntary conversion of assets, net | (1,510 | ) | ||
| EBITDAre | $ | 142,442 | ||
| Run-Rate Impact of Investment, Disposition and Leasing Activity | $ | 4,356 | ||
| Amortization of above (below) market lease intangibles, net | 8,537 | |||
| Recurring EBITDA | $ | 155,335 | ||
| Annualized Recurring EBITDA | $ | 621,340 | ||
| Total Debt per the Consolidated Balance Sheet to Annualized Net Income | 16.5 | x | ||
| Net Debt to Recurring EBITDA | 5.2 | x | ||
| Proforma Net Debt to Recurring EBITDA | 3.1 | x | ||
| Non-GAAP Financial Measures
Total Debt and Net Debt
The Company defines Total Debt as debt per the consolidated balance sheet excluding unamortized debt issuance costs, original issue discounts and debt discounts. Net Debt is defined as Total Debt less cash, cash equivalents and cash held in escrows. The Company considers the non-GAAP measures of Total Debt and Net Debt to be key supplemental measures of the Company's overall liquidity, capital structure and leverage because they provide industry analysts, lenders and investors useful information in understanding our financial condition. The Company's calculation of Total Debt and Net Debt may not be comparable to Total Debt and Net Debt reported by other REITs that interpret the definitions differently than the Company. The Company presents Net Debt on both an actual and proforma basis, assuming the net proceeds of the Forward Offerings (see below) are used to pay down debt. The Company believes the proforma measure may be useful to investors in understanding the potential effect of the Forward Offerings on the Company's capital structure, its future borrowing capacity, and its ability to service its debt.
Forward Offerings
The Company has 17,477,128 shares remaining to be settled under the Forward Equity Offerings. Upon settlement, the offerings are anticipated to raise net proceeds of approximately $1.3 billion based on the applicable forward sale price as of June 30, 2025. The applicable forward sale price varies depending on the offering. The Company is contractually obligated to settle the offerings by certain dates between August 2025 and October 2026.
EBITDAre
EBITDAre is defined by Nareit to mean net income computed in accordance with GAAP, plus interest expense, income tax expense, depreciation and amortization, any gains (or losses) from sales of real estate assets and/or changes in control, any impairment charges on depreciable real estate assets, and after adjustments for unconsolidated partnerships and joint ventures. The Company considers the non-GAAP measure of EBITDAre to be a key supplemental measure of the Company's performance and should be considered along with, but not as an alternative to, net income or loss as a measure of the Company's operating performance. The Company considers EBITDAre a key supplemental measure of the Company's operating performance because it provides an additional supplemental measure of the Company's performance and operating cash flow that is widely known by industry analysts, lenders and investors. The Company’s calculation of EBITDAre may not be comparable to EBITDAre reported by other REITs that interpret the Nareit definition differently than the Company.
Recurring EBITDA
The Company defines Recurring EBITDA as EBITDAre with the addback of noncash amortization of above- and below- market lease intangibles, and after adjustments for the run-rate impact of the Company's investment and disposition activity for the period presented, as well as adjustments for non-recurring benefits or expenses. The Company considers the non-GAAP measure of Recurring EBITDA to be a key supplemental measure of the Company's performance and should be considered along with, but not as an alternative to, net income or loss as a measure of the Company's operating performance. The Company considers Recurring EBITDA a key supplemental measure of the Company's operating performance because it represents the Company's earnings run rate for the period presented and because it is widely followed by industry analysts, lenders and investors. Our Recurring EBITDA may not be comparable to Recurring EBITDA reported by other companies that have a different interpretation of the definition of Recurring EBITDA. Our ratio of net debt to Recurring EBITDA is used by management as a measure of leverage and may be useful to investors in understanding the Company’s ability to service its debt, as well as assess the borrowing capacity of the Company. Our ratio of net debt to Recurring EBITDA is calculated by taking annualized Recurring EBITDA and dividing it by our net debt per the consolidated balance sheet.
Annualized Net Income
Represents net income for the three months ended June 30, 2025, on an annualized basis. |
Agree Realty Corporation
Rental Income
($ in thousands, except share and per share-data)
(Unaudited)
|
Three months ended June 30, |
Six
months ended |
|||||||||||||||
| 2025 | 2024 | 2025 | 2024 | |||||||||||||
| Rental Income Source(1) | ||||||||||||||||
| Minimum rents(2) | $ | 160,205 | $ | 140,945 | $ | 314,211 | $ | 277,979 | ||||||||
| Percentage rents(2) | 557 | 337 | 2,113 | 1,705 | ||||||||||||
| Operating cost reimbursement(2) | 19,383 | 15,943 | 37,471 | 32,412 | ||||||||||||
| Straight-line rental adjustments(3) | 3,789 | 3,496 | 7,798 | 6,343 | ||||||||||||
| Amortization of (above) below market lease intangibles(4) | (8,537 | ) | (8,297 | ) | (17,083 | ) | (16,592 | ) | ||||||||
| Total Rental Income | $ | 175,397 | $ | 152,424 | $ | 344,510 | $ | 301,847 | ||||||||
|
(1) The Company adopted Financial Accounting Standards Board Accounting Standards Codification (“FASB ASC”) 842 “Leases” using the modified retrospective approach as of January 1, 2019. The Company adopted the practical expedient in FASB ASC 842 that alleviates the requirement to separately present lease and non-lease components of lease contracts. As a result, all income earned pursuant to tenant leases is reflected as one line, “Rental Income,” in the consolidated statement of operations. The purpose of this table is to provide additional supplementary detail of Rental Income.
(2) Represents contractual rentals and/or reimbursements as required by tenant lease agreements, recognized on an accrual basis of accounting. The Company believes that the presentation of contractual lease income is not, and is not intended to be, a presentation in accordance with GAAP. The Company believes this information is frequently used by management, investors, analysts and other interested parties to evaluate the Company’s performance.
(3) Represents adjustments to recognize minimum rents on a straight-line basis, consistent with the requirements of FASB ASC 842.
(4) In allocating the fair value of an acquired property, above- and below-market lease intangibles are recorded based on the present value of the difference between the contractual amounts to be paid pursuant to the leases at the time of acquisition and the Company’s estimate of current market lease rates for the property. |
Exhibit 99.2
JULY 202 5
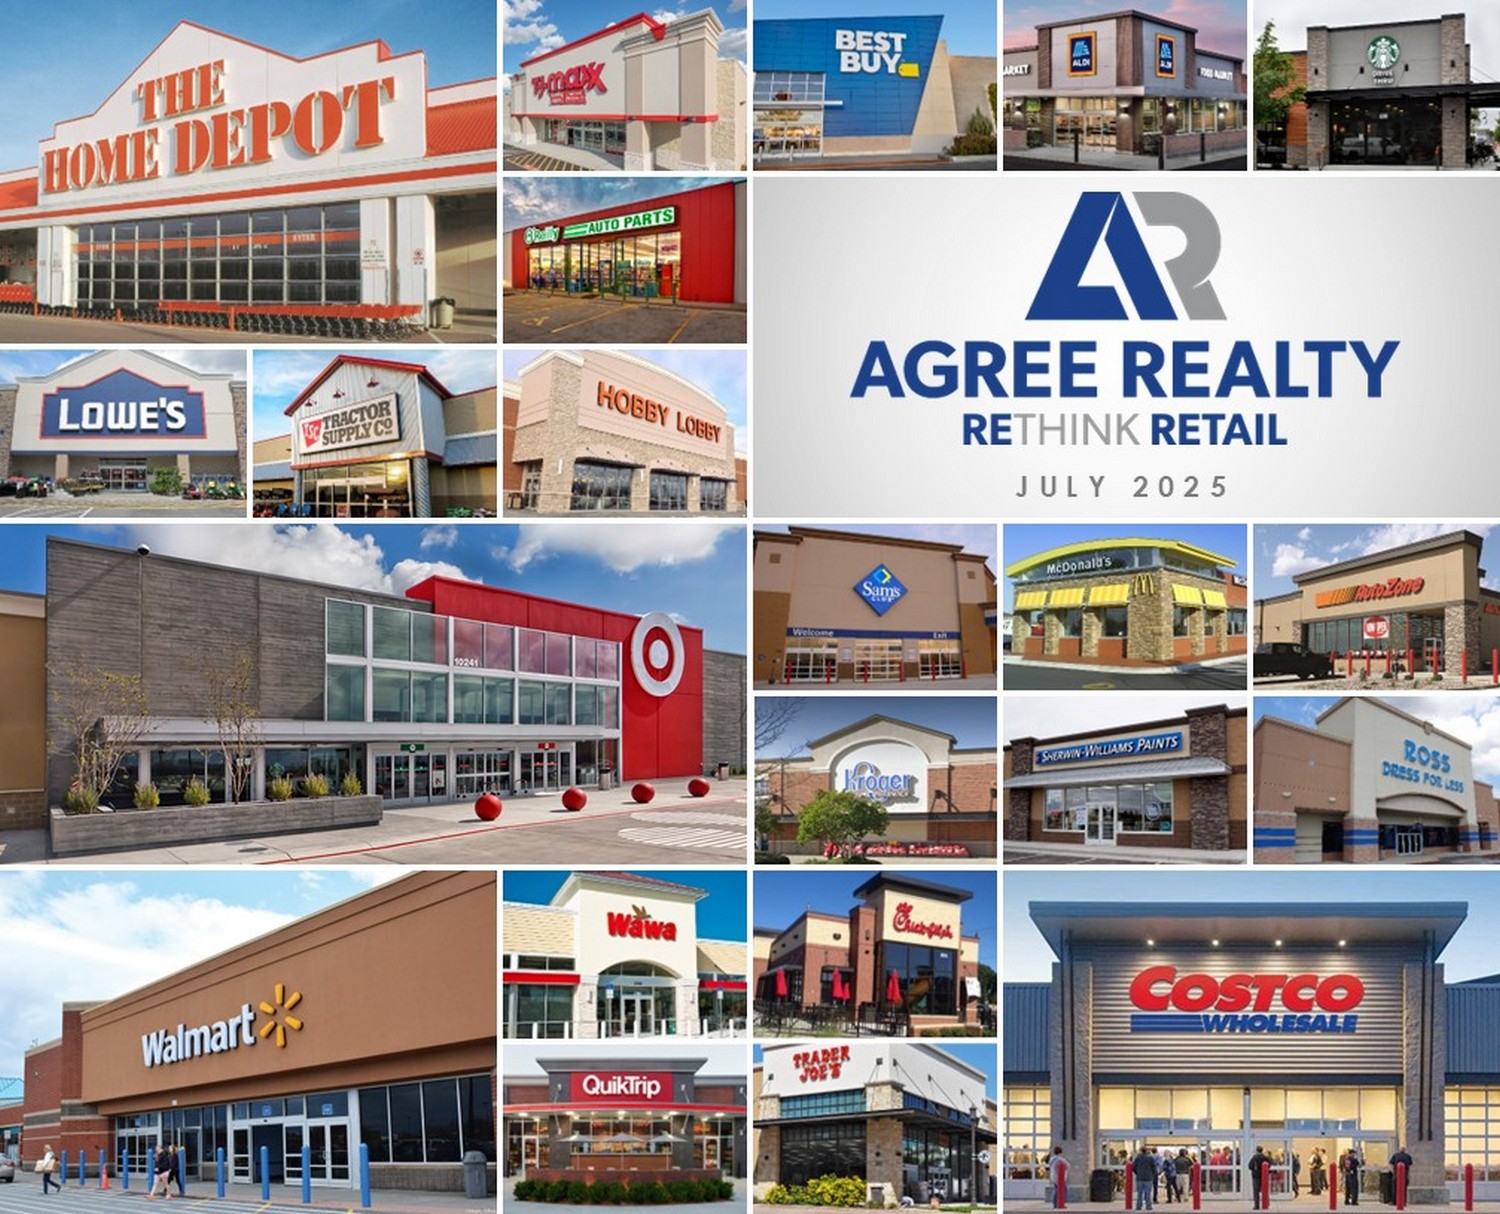
1 © 20 25 AGREE REALTY CORPORATION . ALL RIGHTS RESERVED. Agree Realty Overview (NYSE: ADC) OUR COMPANY NET LEASE REIT FOCUSED ON THE ACQUISITION & DEVELOPMENT OF HIGH - QUALITY RETAIL PROPERTIES Founded in 1971 by Executive Chairman, Richard Agree Public on the NYSE since 1994 $ 11.6 billion (1) retail net lease REIT headquartered in Royal Oak, Michigan 2,513 retail properties totaling approximately 52.0 million square feet in all 50 states Investment grade issuer ratings of Baa1 from Moody’s and BBB+ from S&P RE THINK RETAIL Capitalize on distinct market positioning in the retail net lease space Focus on industry - leading retailers through our three unique external growth platforms Leverage our real estate acumen and relationships to identify superior risk - adjusted opportunities Maintain a conservative and flexible capital structure that enables our growth trajectory Provide consistent, high - quality earnings growth and a well - covered, growing dividend As of June 30, 2025, unless otherwise noted. (1) Enterprise Value as of July 25 , 2025. Refer to footnote 4 on slide 30 for the Company’s definition of Enterprise Value.
2 © 20 25 AGREE REALTY CORPORATION . ALL RIGHTS RESERVED. consistency noun steadfast adherence to the same principles, course, or form [ kuh n - sis - tuh n - see ]
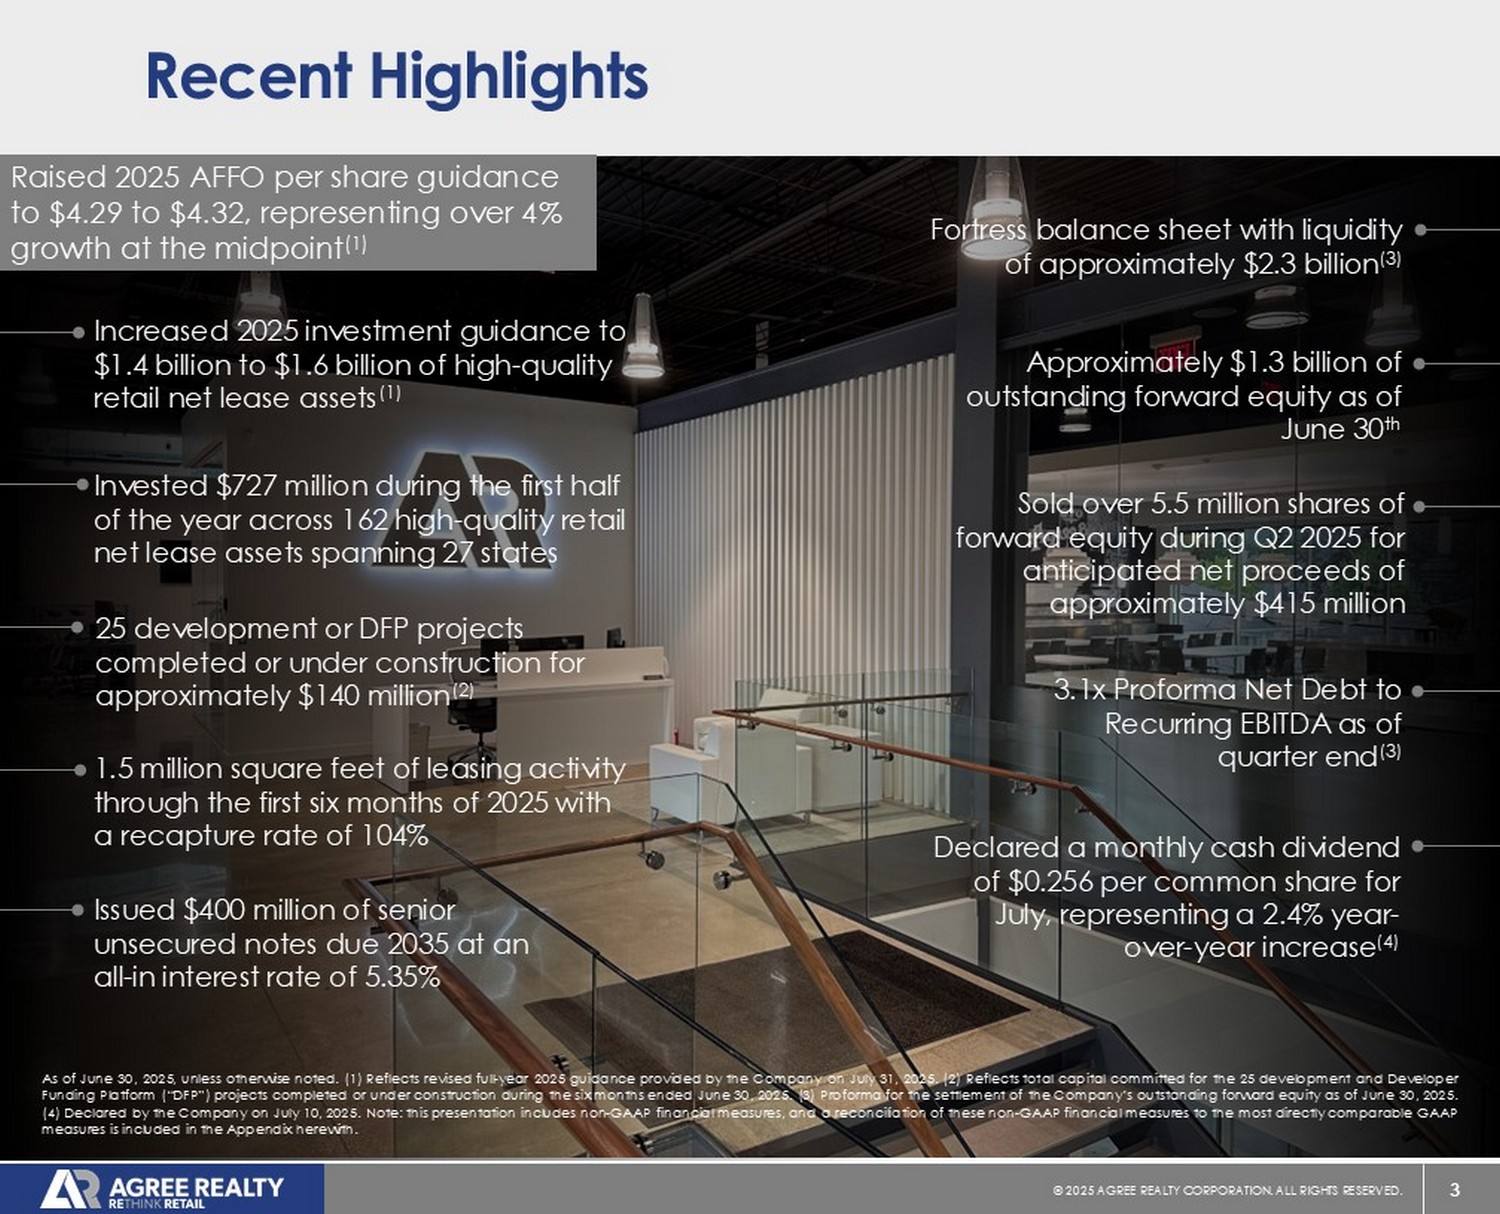
3 © 20 25 AGREE REALTY CORPORATION . ALL RIGHTS RESERVED. As of June 30 , 2025 , unless otherwise noted . ( 1 ) Reflects revised full - year 2025 guidance provided by the Company on July 31 , 2025 . ( 2 ) Reflects total capital committed for the 25 development and Developer Funding Platform (“DFP”) projects completed or under construction during the six months ended June 30 , 2025 . ( 3 ) Proforma for the settlement of the Company’s outstanding forward equity as of June 30 , 2025 . ( 4 ) Declared by the Company on July 10 , 2025 . Note : this presentation includes non - GAAP financial measures, and a reconciliation of these non - GAAP financial measures to the most directly comparable GAAP measures is included in the Appendix herewith . Recent Highlights Fortress balance sheet with liquidity of approximately $2.3 billion (3) Raised 2025 AFFO per share guidance to $4.29 to $4.32, representing over 4% growth at the midpoint (1) Issued $400 million of senior unsecured notes due 2035 at an all - in interest rate of 5.35% Sold over 5.5 million shares of forward equity during Q2 2025 for anticipated net proceeds of approximately $415 million Approximately $1.3 billion of outstanding forward equity as of June 30 th Increased 2025 investment guidance to $1.4 billion to $1.6 billion of high - quality retail net lease assets (1) Invested $727 million during the first half of the year across 162 high - quality retail net lease assets spanning 27 states 3.1x Proforma Net Debt to Recurring EBITDA as of quarter end (3) Declared a monthly cash dividend of $0.256 per common share for July, representing a 2.4% year - over - year increase (4) 1.5 million square feet of leasing activity through the first six months of 2025 with a recapture rate of 104% 25 development or DFP projects completed or under construction for approximately $140 million (2)
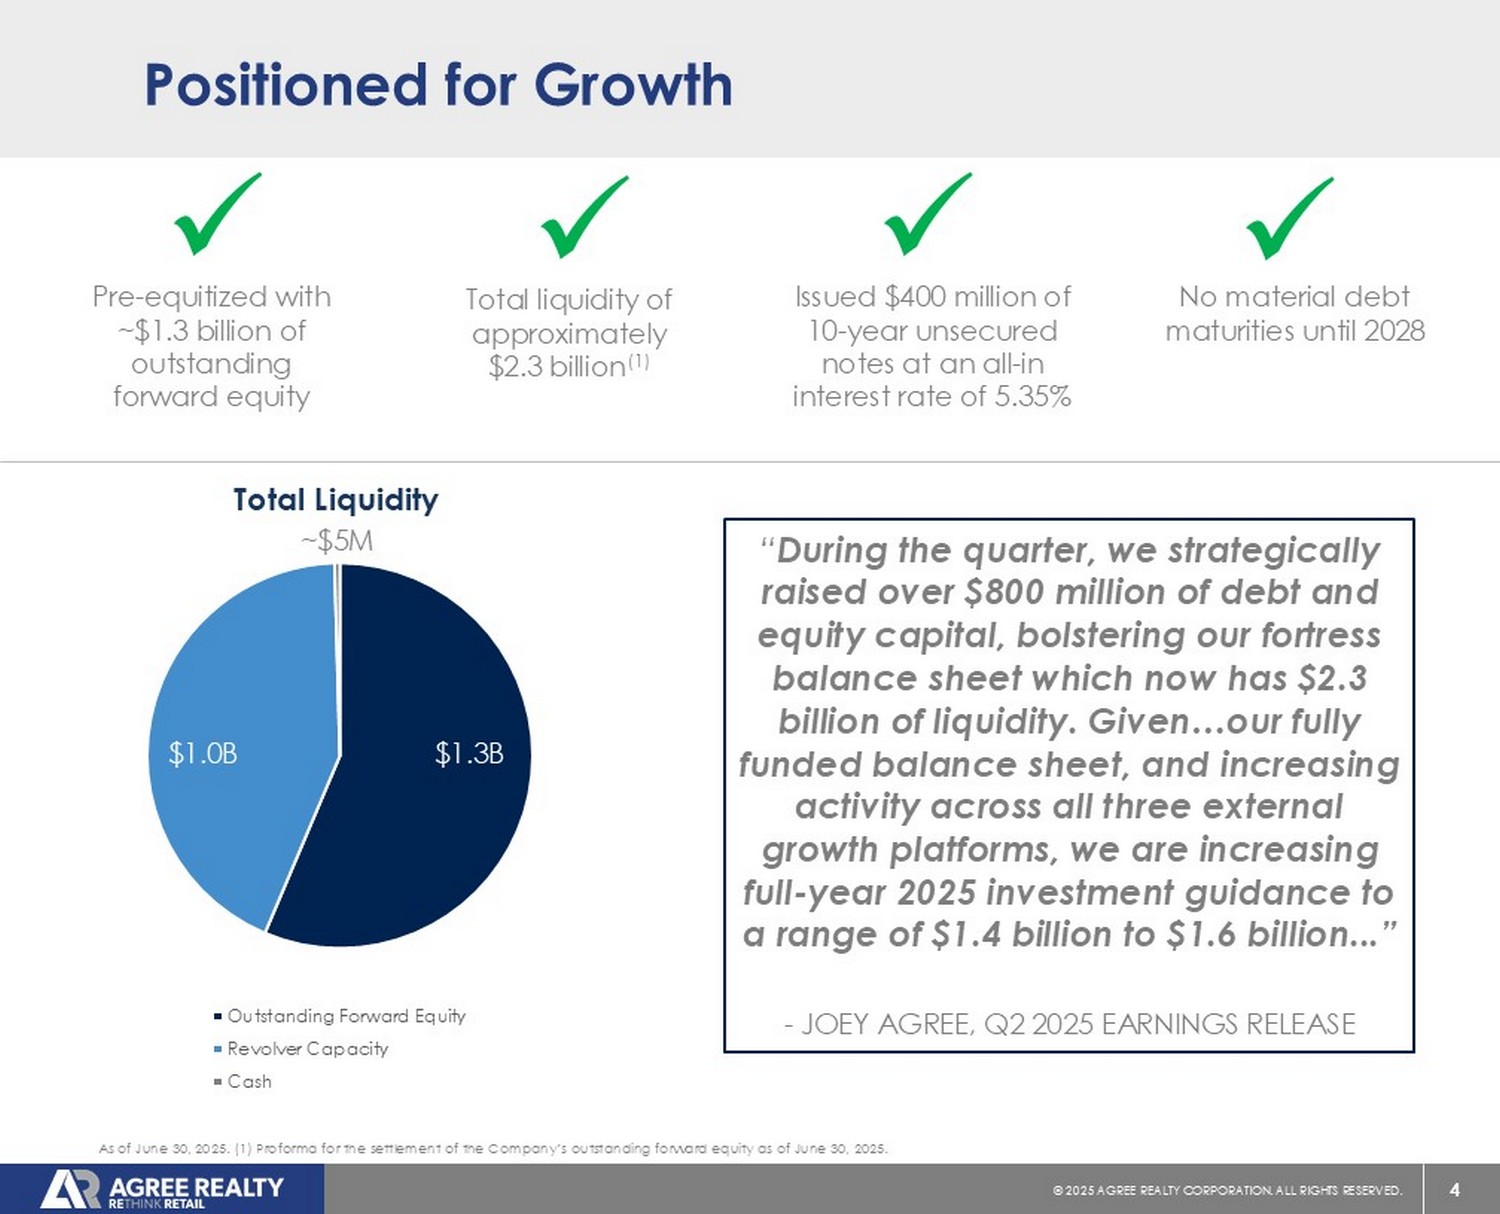
4 © 20 25 AGREE REALTY CORPORATION . ALL RIGHTS RESERVED. $1.3B $1.0B ~$5M Total Liquidity Outstanding Forward Equity Revolver Capacity Cash x A Pre - equitized with ~$1.3 billion of outstanding forward equity x A Total liquidity of approximately $2.3 billion (1) x A Issued $400 million of 10 - year unsecured notes at an all - in interest rate of 5.35% x A No material debt maturities until 2028 As of June 30, 2025. (1) Proforma for the settlement of the Company’s outstanding forward equity as of June 30, 2025. Positioned for Growth “ During the quarter, we strategically raised over $800 million of debt and equity capital, bolstering our fortress balance sheet which now has $2.3 billion of liquidity.
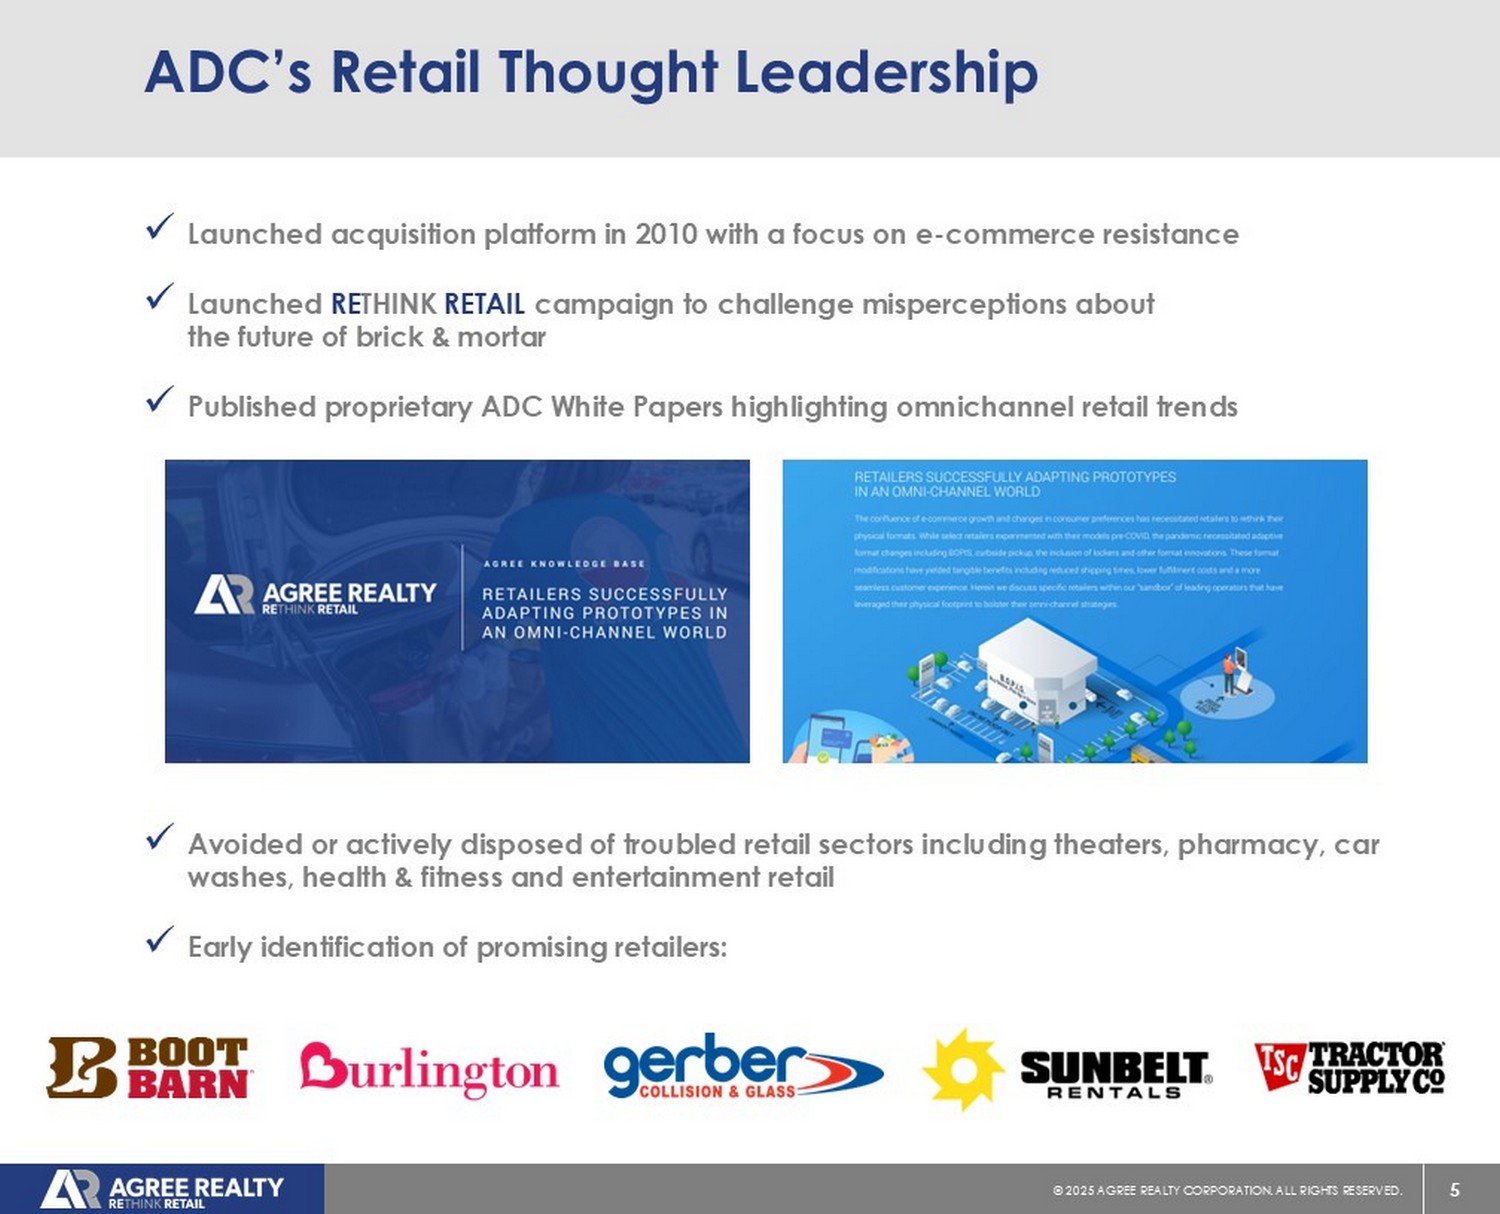
Given…our fully funded balance sheet, and increasing activity across all three external growth platforms, we are increasing full - year 2025 investment guidance to a range of $1.4 billion to $1.6 billion...” - JOEY AGREE, Q2 2025 EARNINGS RELEASE 5 © 20 25 AGREE REALTY CORPORATION . ALL RIGHTS RESERVED. ADC’s Retail Thought Leadership x Launched acquisition platform in 2010 with a focus on e - commerce resistance x Launched RE THINK RETAIL campaign to challenge misperceptions about the future of brick & mortar x Published proprietary ADC White Papers highlighting omnichannel retail trends x Avoided or actively disposed of troubled retail sectors including theaters, pharmacy, car washes, health & fitness and entertainment retail x Early identification of promising retailers:
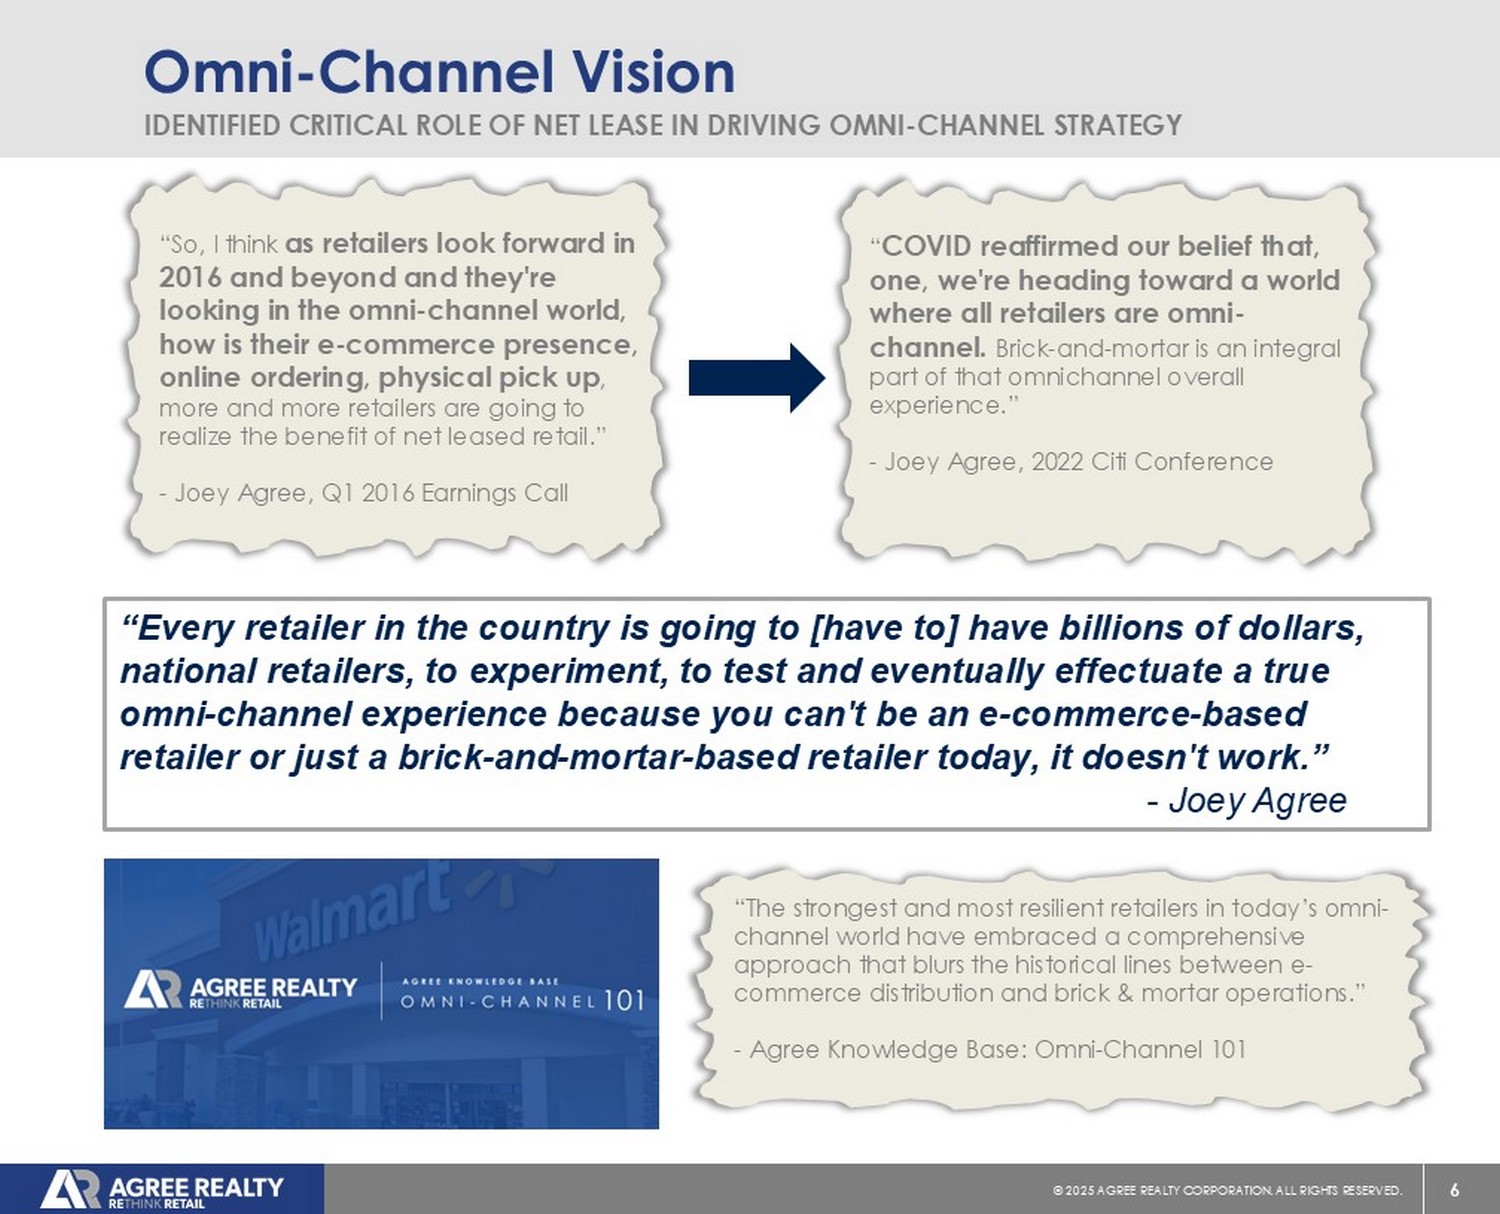
6 © 20 25 AGREE REALTY CORPORATION . ALL RIGHTS RESERVED. Omni - Channel Vision IDENTIFIED CRITICAL ROLE OF NET LEASE IN DRIVING OMNI - CHANNEL STRATEGY “The strongest and most resilient retailers in today’s omni - channel world have embraced a comprehensive approach that blurs the historical lines between e - commerce distribution and brick & mortar operations.” - Agree Knowledge Base: Omni - Channel 101 “E very retailer in the country is going to [have to ] have billions of dollars, national retailers, to experiment, to test and eventually effectuate a true omni - channel experience because you can't be an e - commerce - based retailer or just a brick - and - mortar - based retailer today, it doesn't work.” - Joey Agree “So, I think as retailers look forward in 2016 and beyond and they're looking in the omni - channel world, how is their e - commerce presence, online ordering, physical pick up , more and more retailers are going to realize the benefit of net leased retail.” - Joey Agree, Q1 2016 Earnings Call “ COVID reaffirmed our belief that, one, we're heading toward a world where all retailers are omni - channel. Brick - and - mortar is an integral part of that omnichannel overall experience.
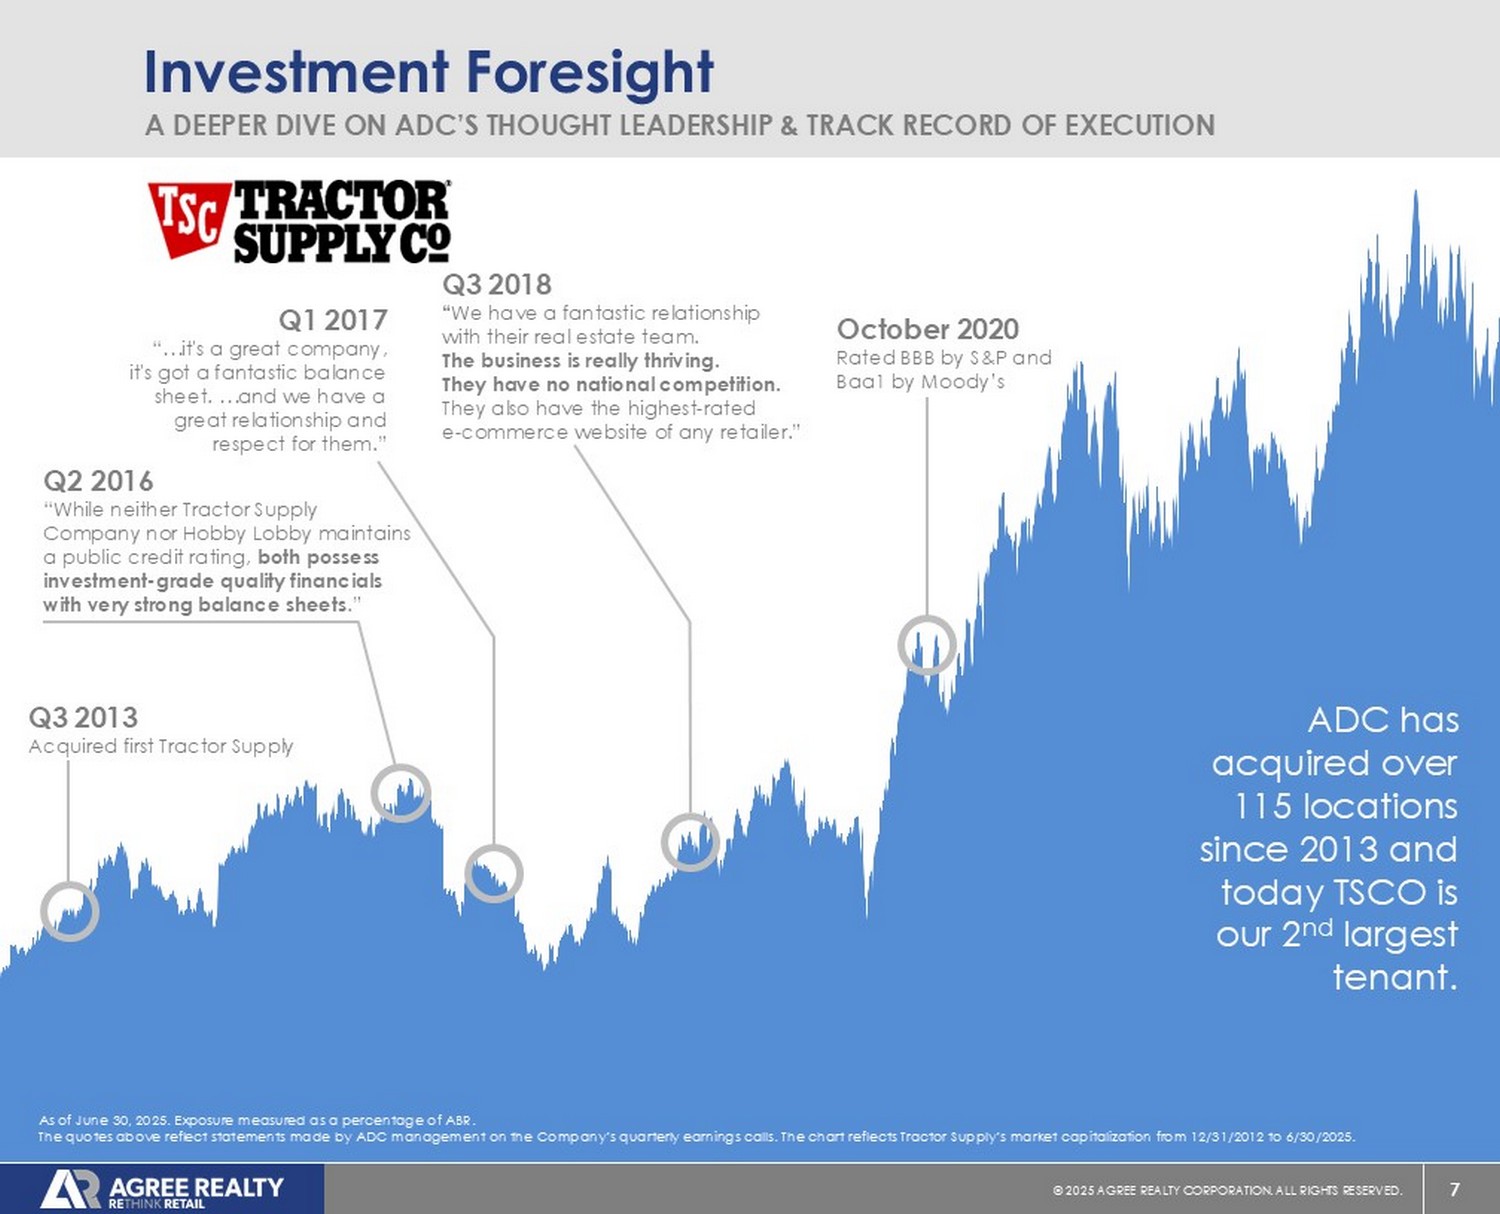
” - Joey Agree, 2022 Citi Conference 7 © 20 25 AGREE REALTY CORPORATION . ALL RIGHTS RESERVED. October 2020 Rated BBB by S&P and Baa1 by Moody’s Q 2 2016 “While neither Tractor Supply Company nor Hobby Lobby maintains a public credit rating, both possess investment - grade quality financials with very strong balance sheets .” Q1 2017 “…it's a great company, it's got a fantastic balance sheet. …and we have a great relationship and respect for them.” Q3 2018 “ We have a fantastic relationship with their real estate team. The business is really thriving. They have no national competition. They also have the highest - rated e - commerce website of any retailer.” Investment Foresight A DEEPER DIVE ON ADC’S THOUGHT LEADERSHIP & TRACK RECORD OF EXECUTION As of June 30, 2025. Exposure measured as a percentage of ABR. The quotes above reflect statements made by ADC management on the Company’s quarterly earnings calls. The chart reflects Trac tor Supply’s market capitalization from 12/31/2012 to 6/30/2025. ADC has acquired over 115 locations since 2013 and today TSCO is our 2 nd largest tenant.
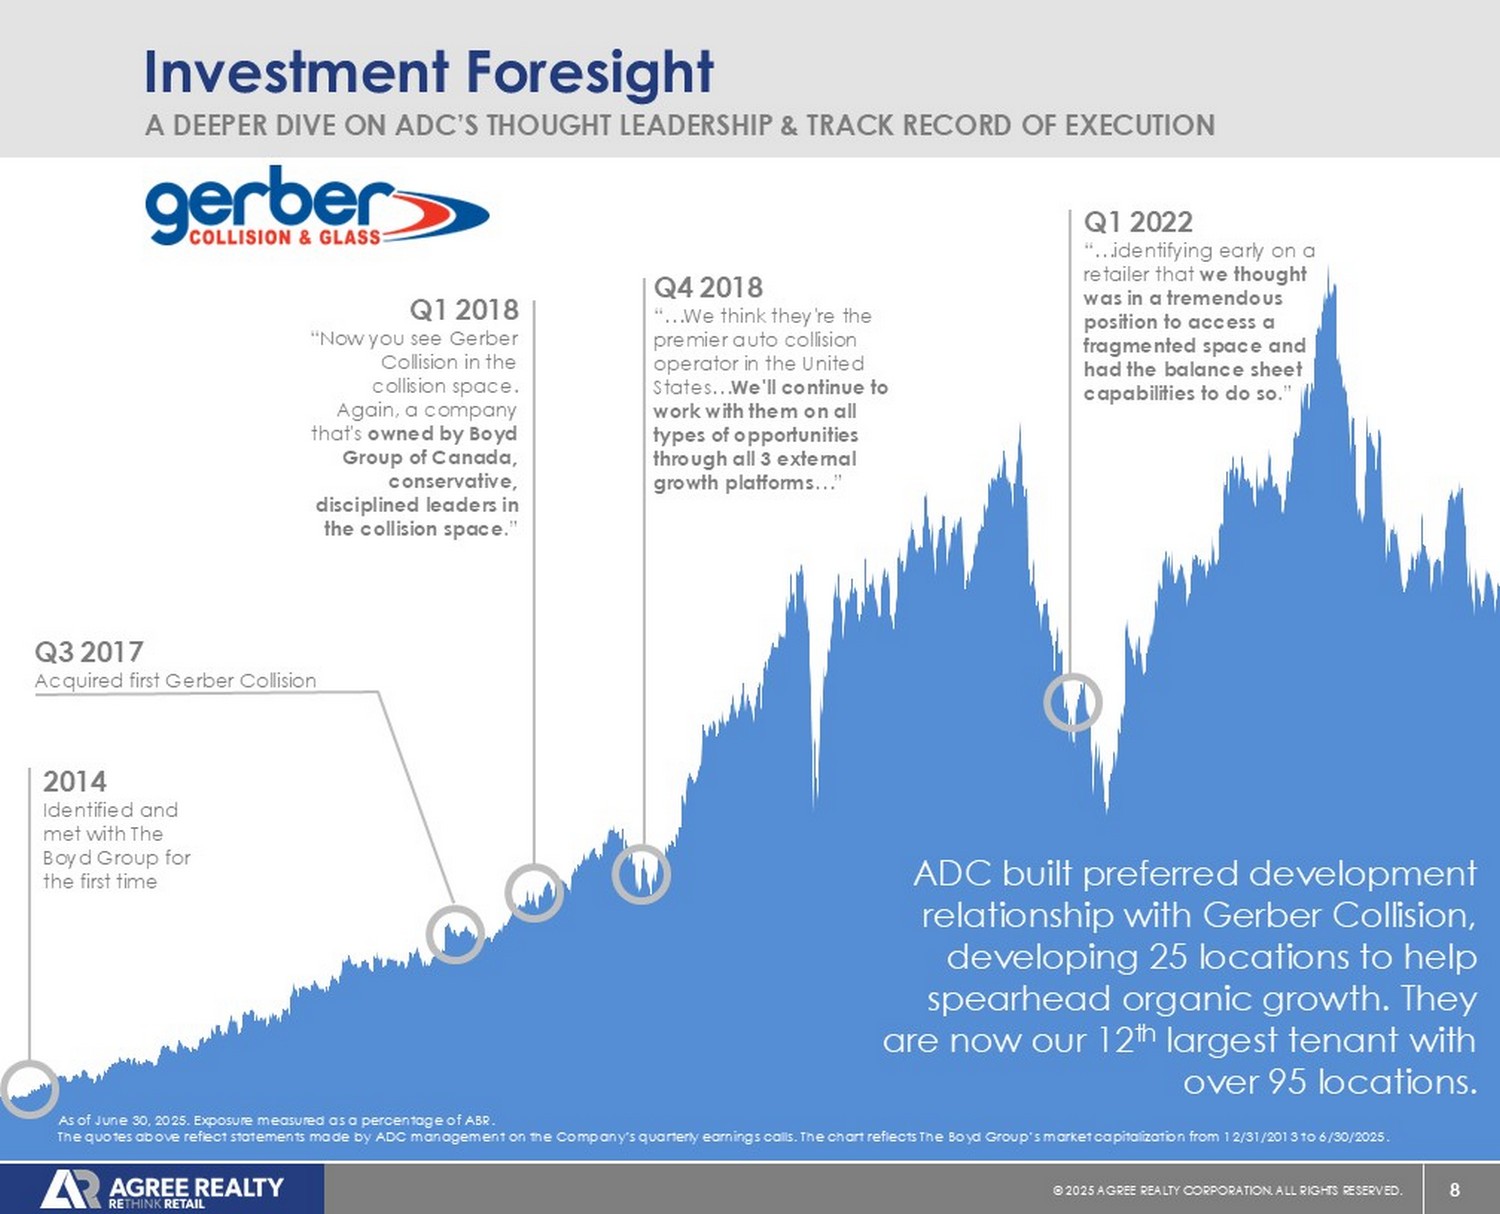
Q3 2013 Acquired first Tractor Supply 8 © 20 25 AGREE REALTY CORPORATION . ALL RIGHTS RESERVED. Investment Foresight A DEEPER DIVE ON ADC’S THOUGHT LEADERSHIP & TRACK RECORD OF EXECUTION Q3 2017 Acquired first Gerber Collision Q4 2018 “…We think they're the premier auto collision operator in the United States… We'll continue to work with them on all types of opportunities through all 3 external growth platforms …” Q1 2022 “…identifying early on a retailer that we thought was in a tremendous position to access a fragmented space and had the balance sheet capabilities to do so .” ADC built preferred development relationship with Gerber Collision, developing 25 locations to help spearhead organic growth. They are now our 12 th largest tenant with over 95 locations. As of June 30, 2025. Exposure measured as a percentage of ABR. The quotes above reflect statements made by ADC management on the Company’s quarterly earnings calls. The chart reflects The Boy d Group’s market capitalization from 12/31/2013 to 6/30/2025. Q1 2018 “Now you see Gerber Collision in the collision space.
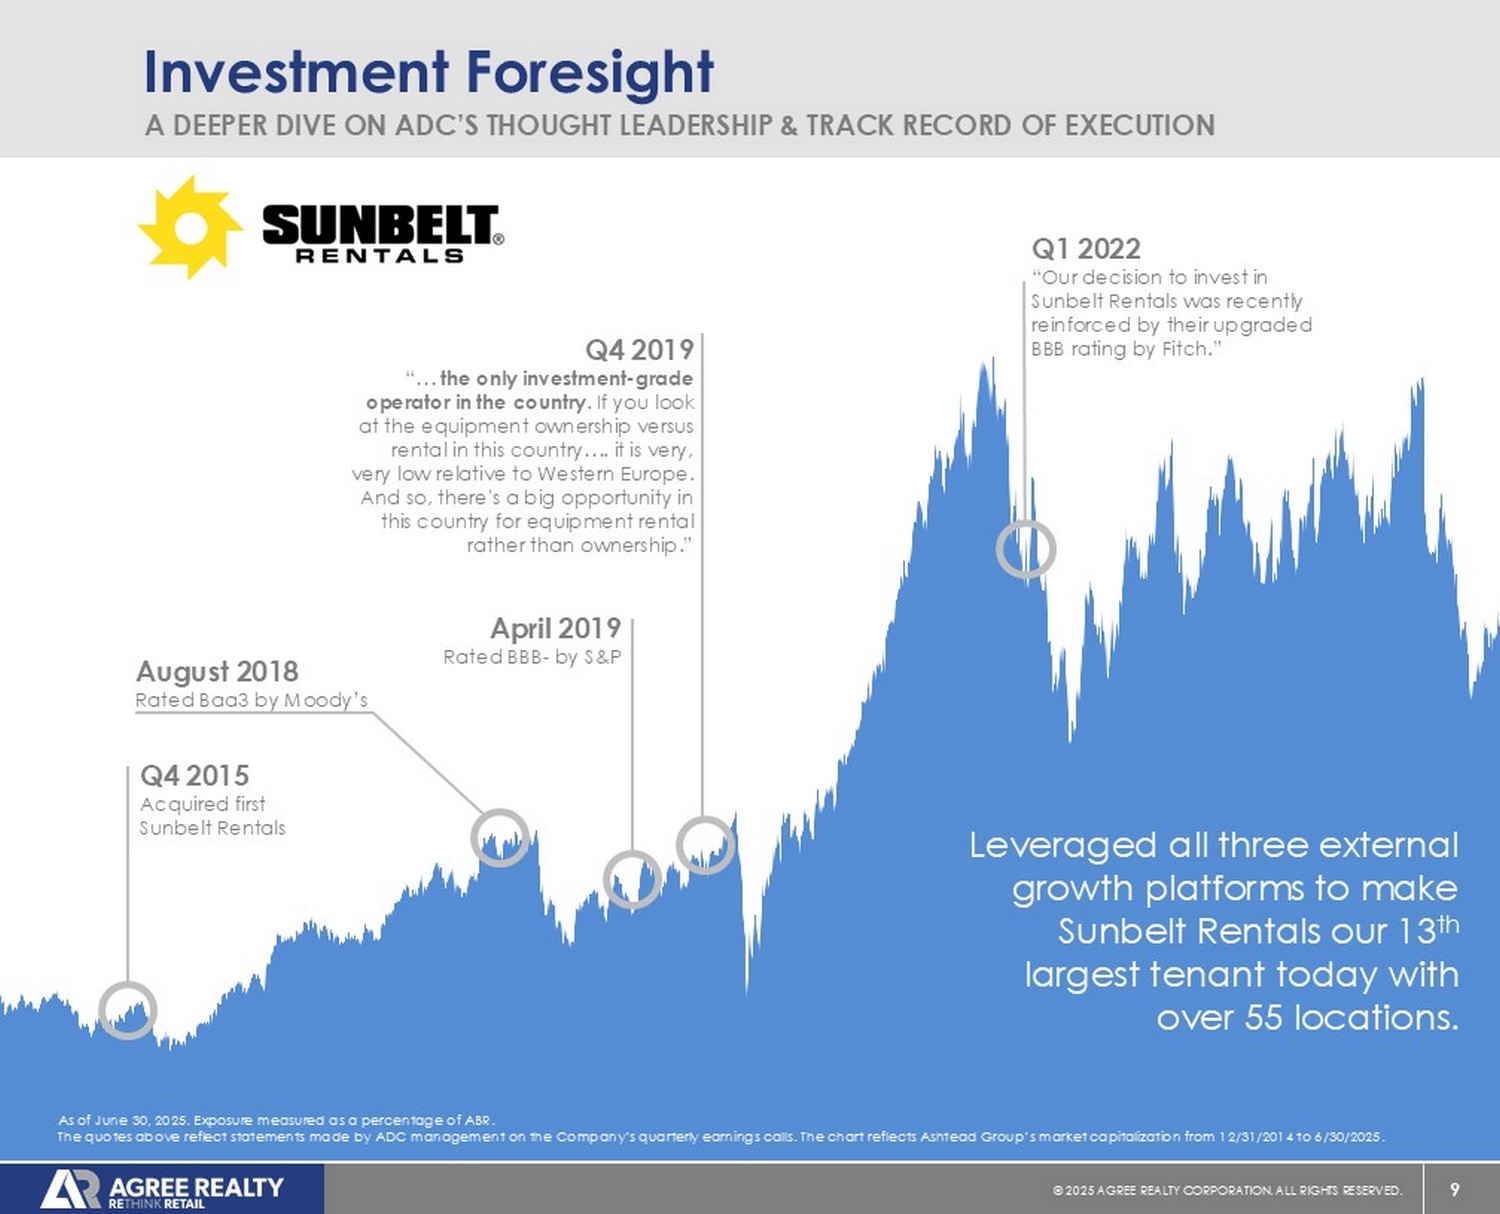
Again, a company that's owned by Boyd Group of Canada, conservative, disciplined leaders in the collision space .” 2014 Identified and met with The Boyd Group for the first time 9 © 20 25 AGREE REALTY CORPORATION . ALL RIGHTS RESERVED. Investment Foresight A DEEPER DIVE ON ADC’S THOUGHT LEADERSHIP & TRACK RECORD OF EXECUTION Leveraged all three external growth platforms to make Sunbelt Rentals our 13 th largest tenant today with over 55 locations. As of June 30, 2025. Exposure measured as a percentage of ABR. The quotes above reflect statements made by ADC management on the Company’s quarterly earnings calls. The chart reflects Asht ead Group’s market capitalization from 12/31/2014 to 6/30/2025. Q4 2015 Acquired first Sunbelt Rentals Q4 2019 “… the only investment - grade operator in the country . If you look at the equipment ownership versus rental in this country…. it is very, very low relative to Western Europe. And so, there's a big opportunity in this country for equipment rental rather than ownership.” April 2019 Rated BBB - by S&P August 2018 Rated Baa3 by Moody’s Q1 2022 “Our decision to invest in Sunbelt Rentals was recently reinforced by their upgraded BBB rating by Fitch.”
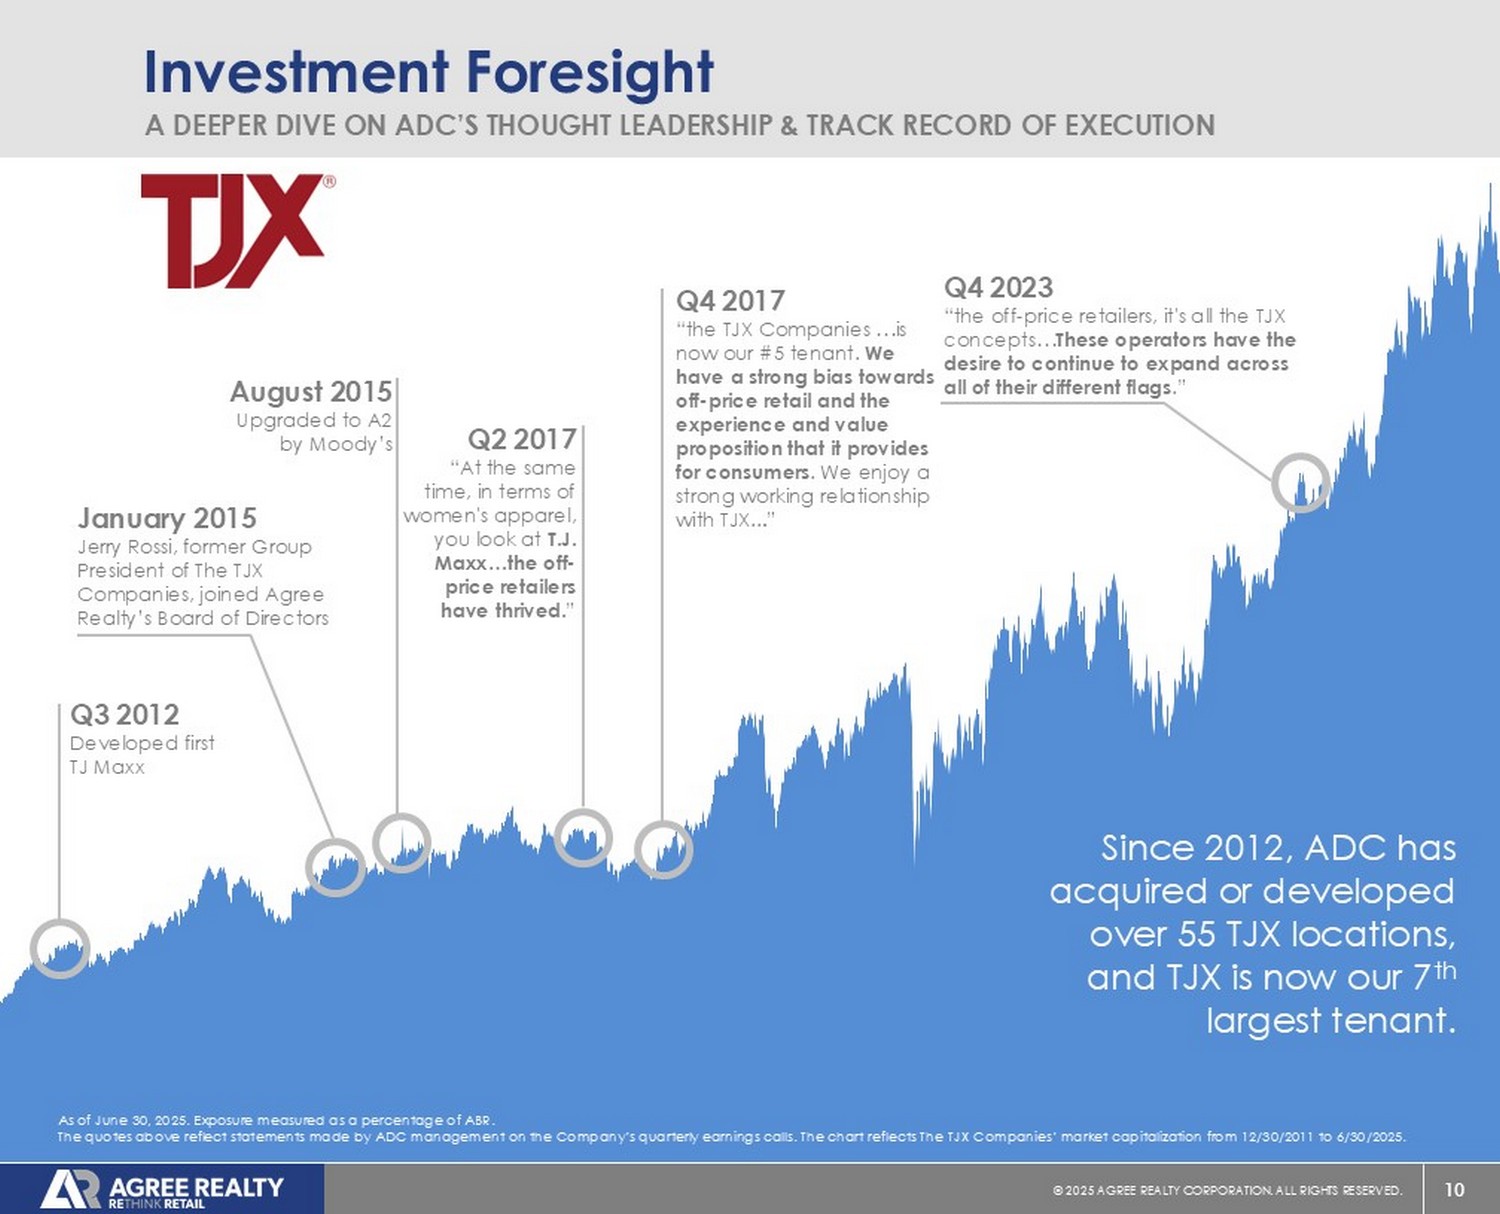
10 © 20 25 AGREE REALTY CORPORATION . ALL RIGHTS RESERVED. Investment Foresight A DEEPER DIVE ON ADC’S THOUGHT LEADERSHIP & TRACK RECORD OF EXECUTION Since 2012, ADC has acquired or developed over 55 TJX locations, and TJX is now our 7 th largest tenant. As of June 30, 2025. Exposure measured as a percentage of ABR. The quotes above reflect statements made by ADC management on the Company’s quarterly earnings calls. The chart reflects The TJX Companies’ market capitalization from 12/30/2011 to 6/30/2025. Q3 2012 Developed first TJ Maxx Q4 2023 “the off - price retailers, it's all the TJX concepts… These operators have the desire to continue to expand across all of their different flags .” August 2015 Upgraded to A2 by Moody’s Q2 2017 “At the same time, in terms of women's apparel, you look at T.J. Maxx…the off - price retailers have thrived. ” Q4 2017 “the TJX Companies …is now our #5 tenant. We have a strong bias towards off - price retail and the experience and value proposition that it provides for consumers . We enjoy a strong working relationship with TJX.. .
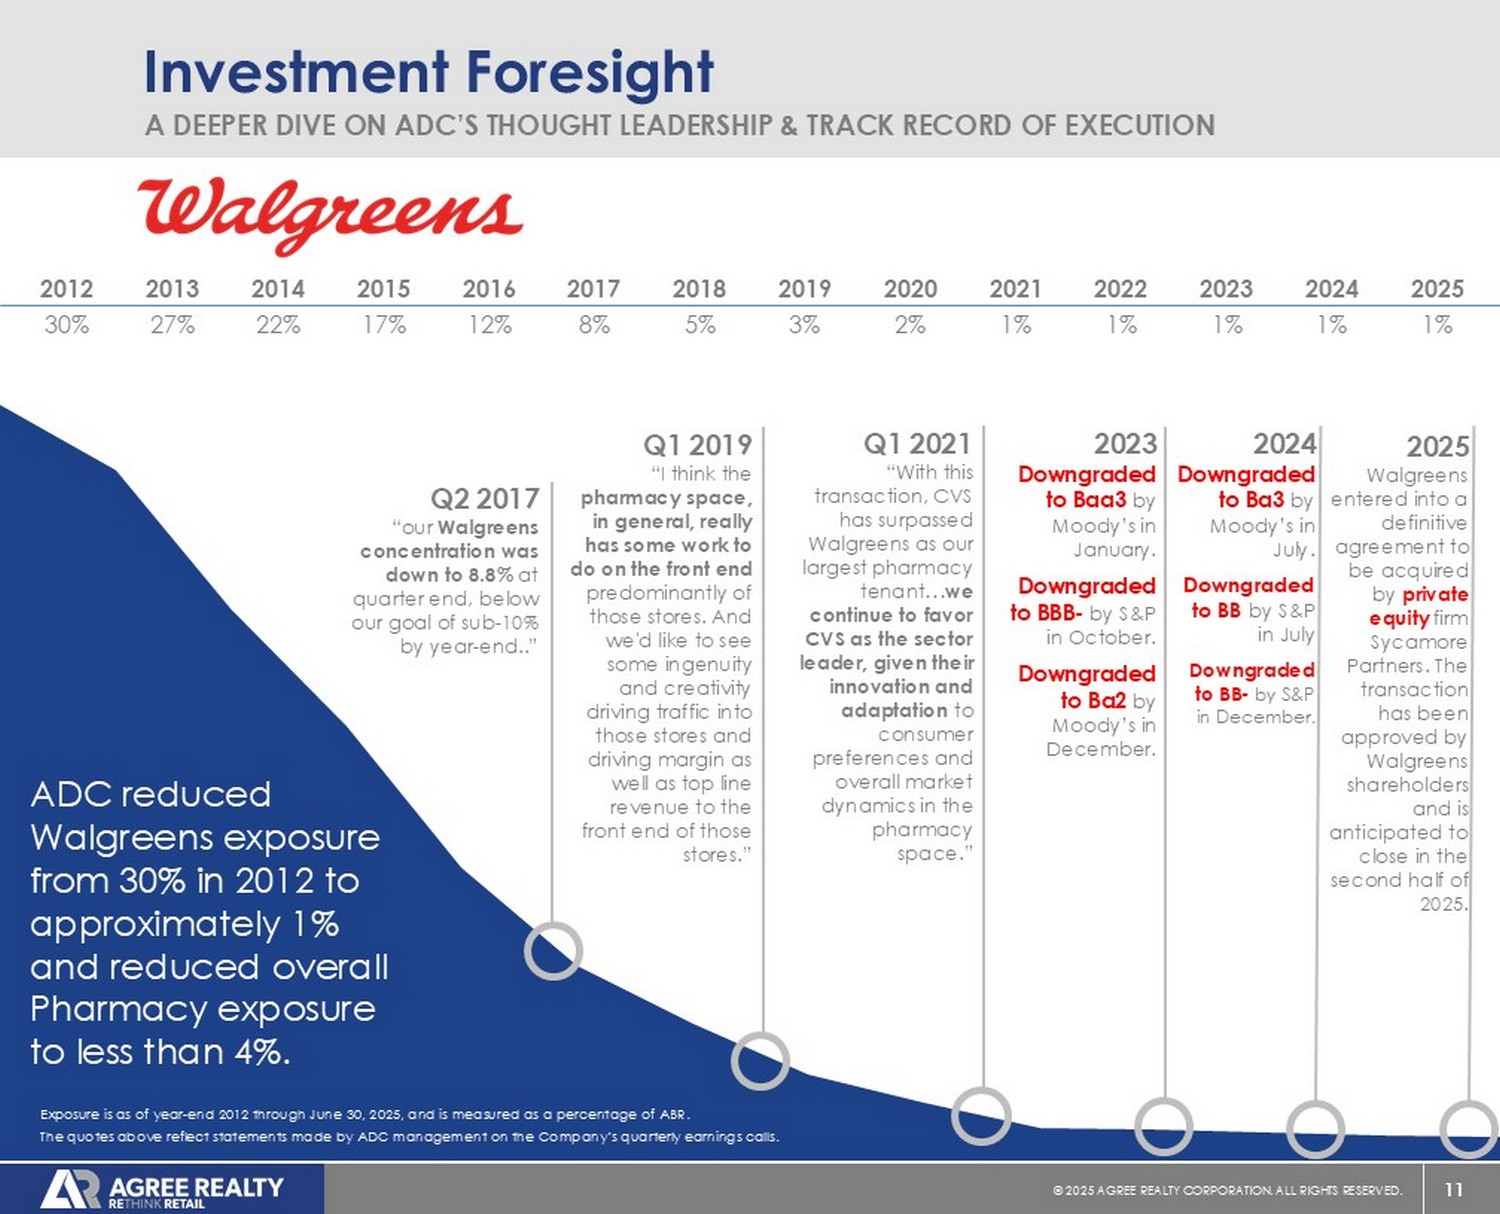
” January 2015 Jerry Rossi, former Group President of The TJX Companies, joined Agree Realty’s Board of Directors 11 © 20 25 AGREE REALTY CORPORATION . ALL RIGHTS RESERVED. Investment Foresight A DEEPER DIVE ON ADC’S THOUGHT LEADERSHIP & TRACK RECORD OF EXECUTION 2025 2024 2023 2022 2021 2020 2019 2018 2017 2016 2015 2014 2013 2012 1% 1% 1% 1% 1% 2% 3% 5% 8% 12% 17% 22% 27% 30% Q2 2017 “our Walgreens concentration was down to 8.8% at quarter end, below our goal of sub - 10% by year - end..” Q1 2021 “With this transaction, CVS has surpassed Walgreens as our largest pharmacy tenant… we continue to favor CVS as the sector leader, given their innovation and adaptation to consumer preferences and overall market dynamics in the pharmacy space.” Q1 2019 “ I think the pharmacy space, in general, really has some work to do on the front end predominantly of those stores. And we'd like to see some ingenuity and creativity driving traffic into those stores and driving margin as well as top line revenue to the front end of those stores.” ADC reduced Walgreens exposure from 30% in 2012 to approximately 1% and reduced overall Pharmacy exposure to less than 4%. Exposure is as of year - end 2012 through June 30, 2025, and is measured as a percentage of ABR. The quotes above reflect statements made by ADC management on the Company’s quarterly earnings calls. 2023 Downgraded to Baa3 by Moody’s in January. Downgraded to BBB - by S&P in October. Downgraded to Ba2 by Moody’s in December. 2024 Downgraded to Ba3 by Moody’s in July. Downgraded to BB by S&P in July Downgraded to BB - by S&P in December. 2025 Walgreens entered into a definitive agreement to be acquired by private equity firm Sycamore Partners. The transaction has been approved by Walgreens shareholders and is anticipated to close in the second half of 2025.
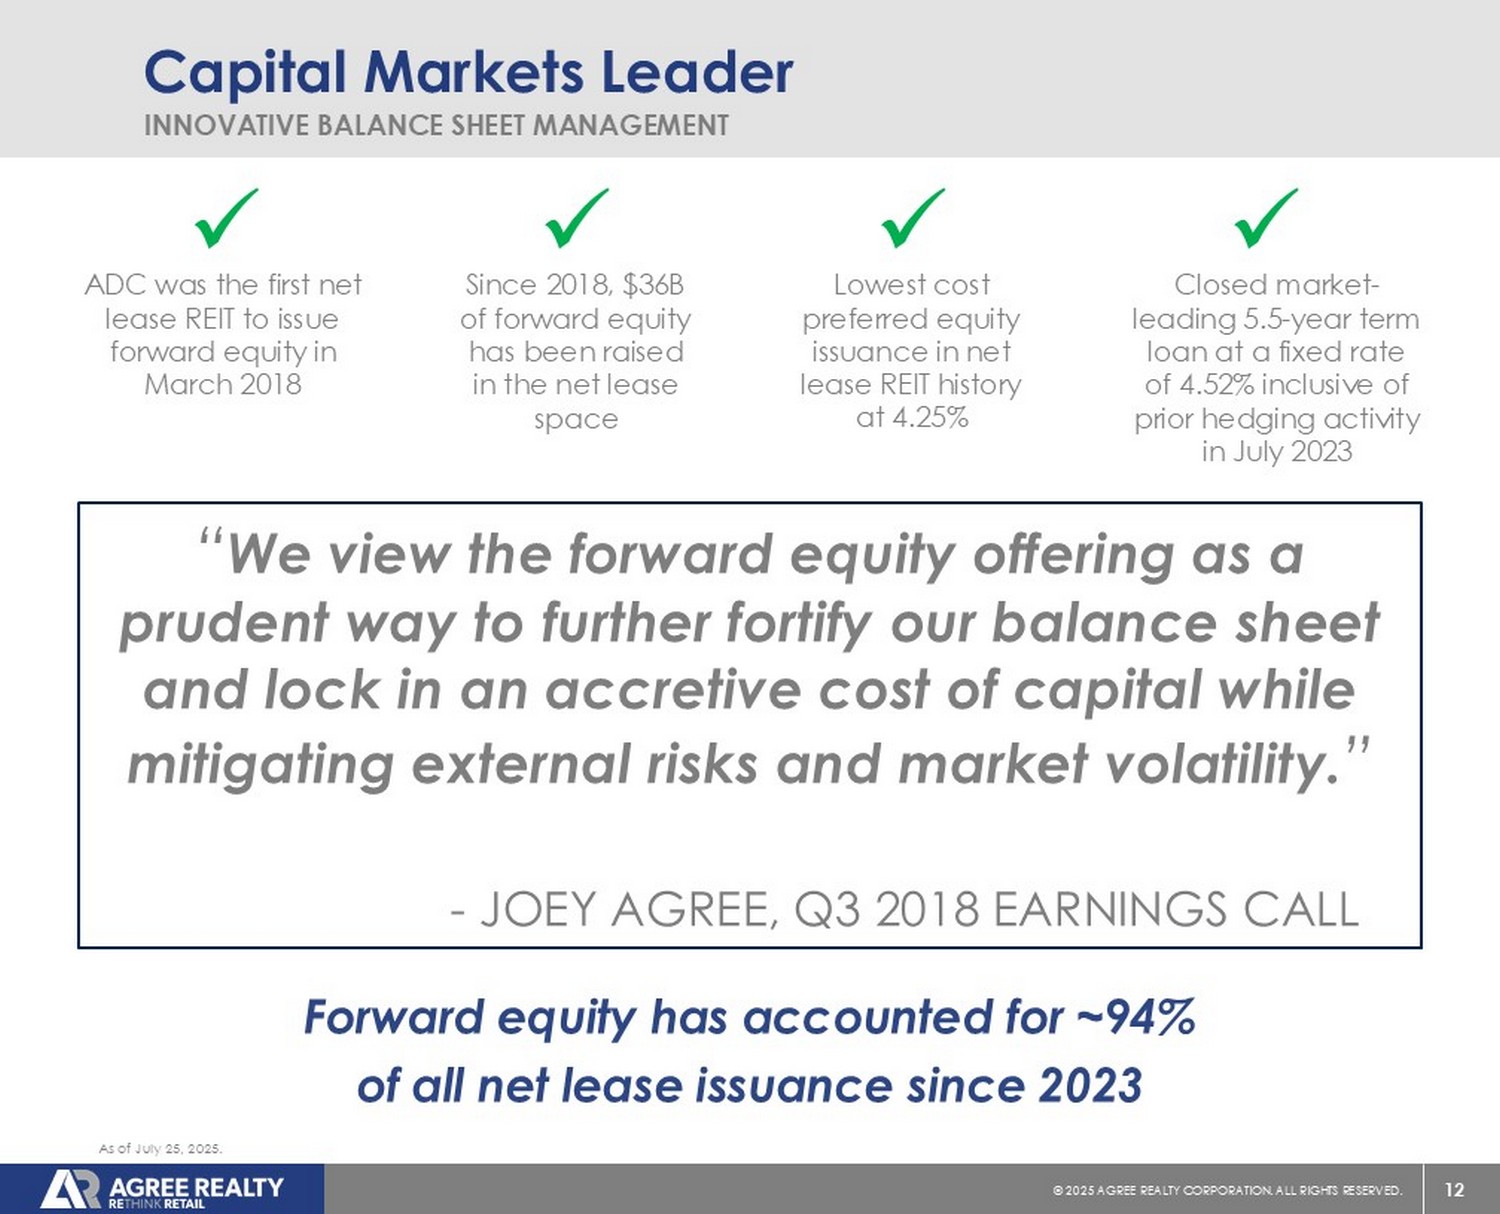
12 © 20 25 AGREE REALTY CORPORATION . ALL RIGHTS RESERVED. Capital Markets Leader INNOVATIVE BALANCE SHEET MANAGEMENT “ We view the forward equity offering as a prudent way to further fortify our balance sheet and lock in an accretive cost of capital while mitigating external risks and market volatility. ” - JOEY AGREE, Q3 2018 EARNINGS CALL x A ADC was the first net lease REIT to issue forward equity in March 2018 x A Since 2018, $36B of forward equity has been raised in the net lease space x A Lowest cost preferred equity issuance in net lease REIT history at 4.25% x A Closed market - leading 5.5 - year term loan at a fixed rate of 4.52% inclusive of prior hedging activity in July 2023 Forward equity has accounted for ~94% of all net lease issuance since 2023 As of July 25, 2025.
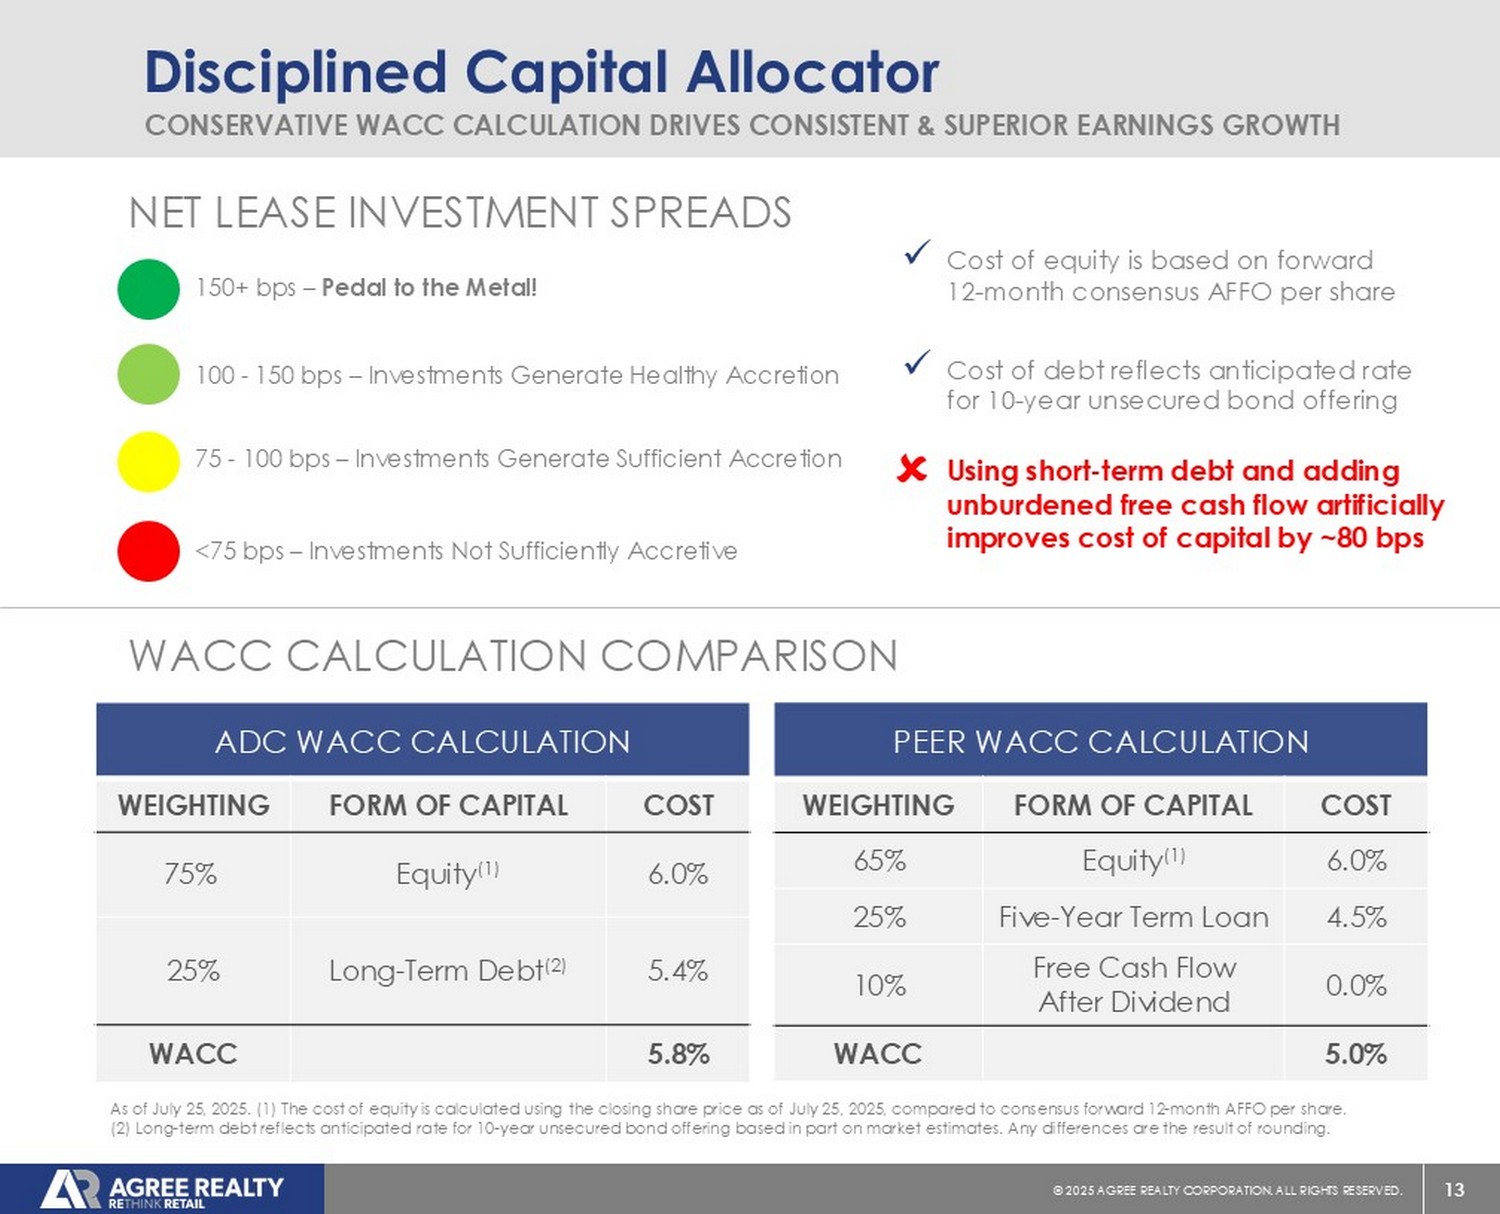
13 © 20 25 AGREE REALTY CORPORATION . ALL RIGHTS RESERVED. Disciplined Capital Allocator CONSERVATIVE WACC CALCULATION DRIVES CONSISTENT & SUPERIOR EARNINGS GROWTH ADC WACC CALCULATION COST FORM OF CAPITAL WEIGHTING 6.0% Equity (1) 75% 5.4% Long - Term Debt (2) 25% 5.8% WACC PEER WACC CALCULATION COST FORM OF CAPITAL WEIGHTING 6.0% Equity (1) 65% 4.5% Five - Year Term Loan 25% 0.0% Free Cash Flow After Dividend 10% 5.0% WACC 150+ bps – Pedal to the Metal! 100 - 150 bps – Investments Generate Healthy Accretion 75 - 100 bps – Investments Generate Sufficient Accretion <75 bps – Investments Not Sufficiently Accretive As of July 25 , 2025 . ( 1 ) The cost of equity is calculated using the closing share price as of July 25 , 2025 , compared to consensus forward 12 - month AFFO per share . ( 2 ) Long - term debt reflects anticipated rate for 10 - year unsecured bond offering based in part on market estimates . Any differences are the result of rounding .
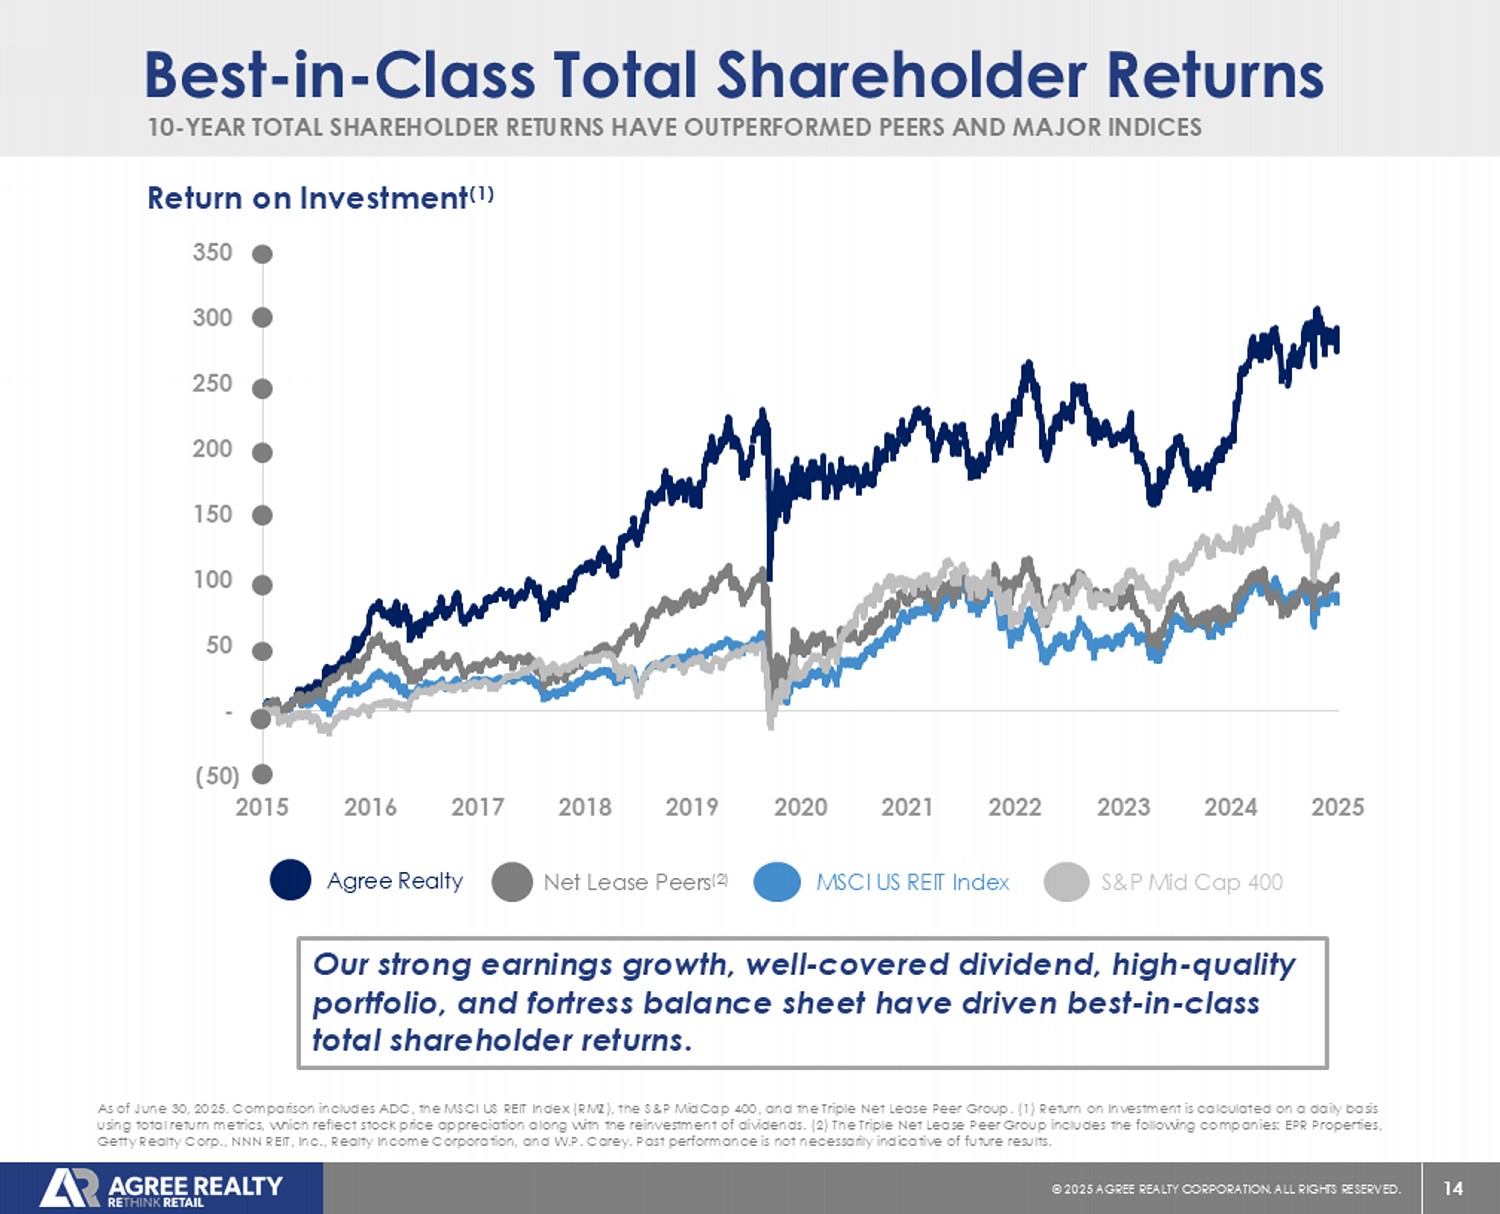
x Cost of equity is based on forward 12 - month consensus AFFO per share x Cost of debt reflects anticipated rate for 10 - year unsecured bond offering WACC CALCULATION COMPARISON NET LEASE INVESTMENT SPREADS x Using short - term debt and adding unburdened free cash flow artificially improves cost of capital by ~80 bps 14 © 20 25 AGREE REALTY CORPORATION . ALL RIGHTS RESERVED. (50) - 50 100 150 200 250 300 350 2015 2016 2017 2018 2019 2020 2021 2022 2023 2024 2025 Best - in - Class Total Shareholder Returns As of June 30, 2025. Comparison includes ADC, the MSCI US REIT Index (RMZ), the S&P MidCap 400, and the Triple Net Lease Peer Group. (1) Return on Investment is calculated on a daily basis using total return metrics, which reflect stock price appreciation along with the reinvestment of dividends. (2) The Triple N et Lease Peer Group includes the following companies: EPR Properties, Getty Realty Corp., NNN REIT, Inc., Realty Income Corporation, and W.P. Carey. Return on Investment (1) 1 c 10 - YEAR TOTAL SHAREHOLDER RETURNS HAVE OUTPERFORMED PEERS AND MAJOR INDICES Our strong earnings growth, well - covered dividend, high - quality portfolio, and fortress balance sheet have driven best - in - class total shareholder returns. Net Lease Peers (2) Agree Realty S&P Mid Cap 400 MSCI US REIT Index The Country’s Leading Retail Portfolio
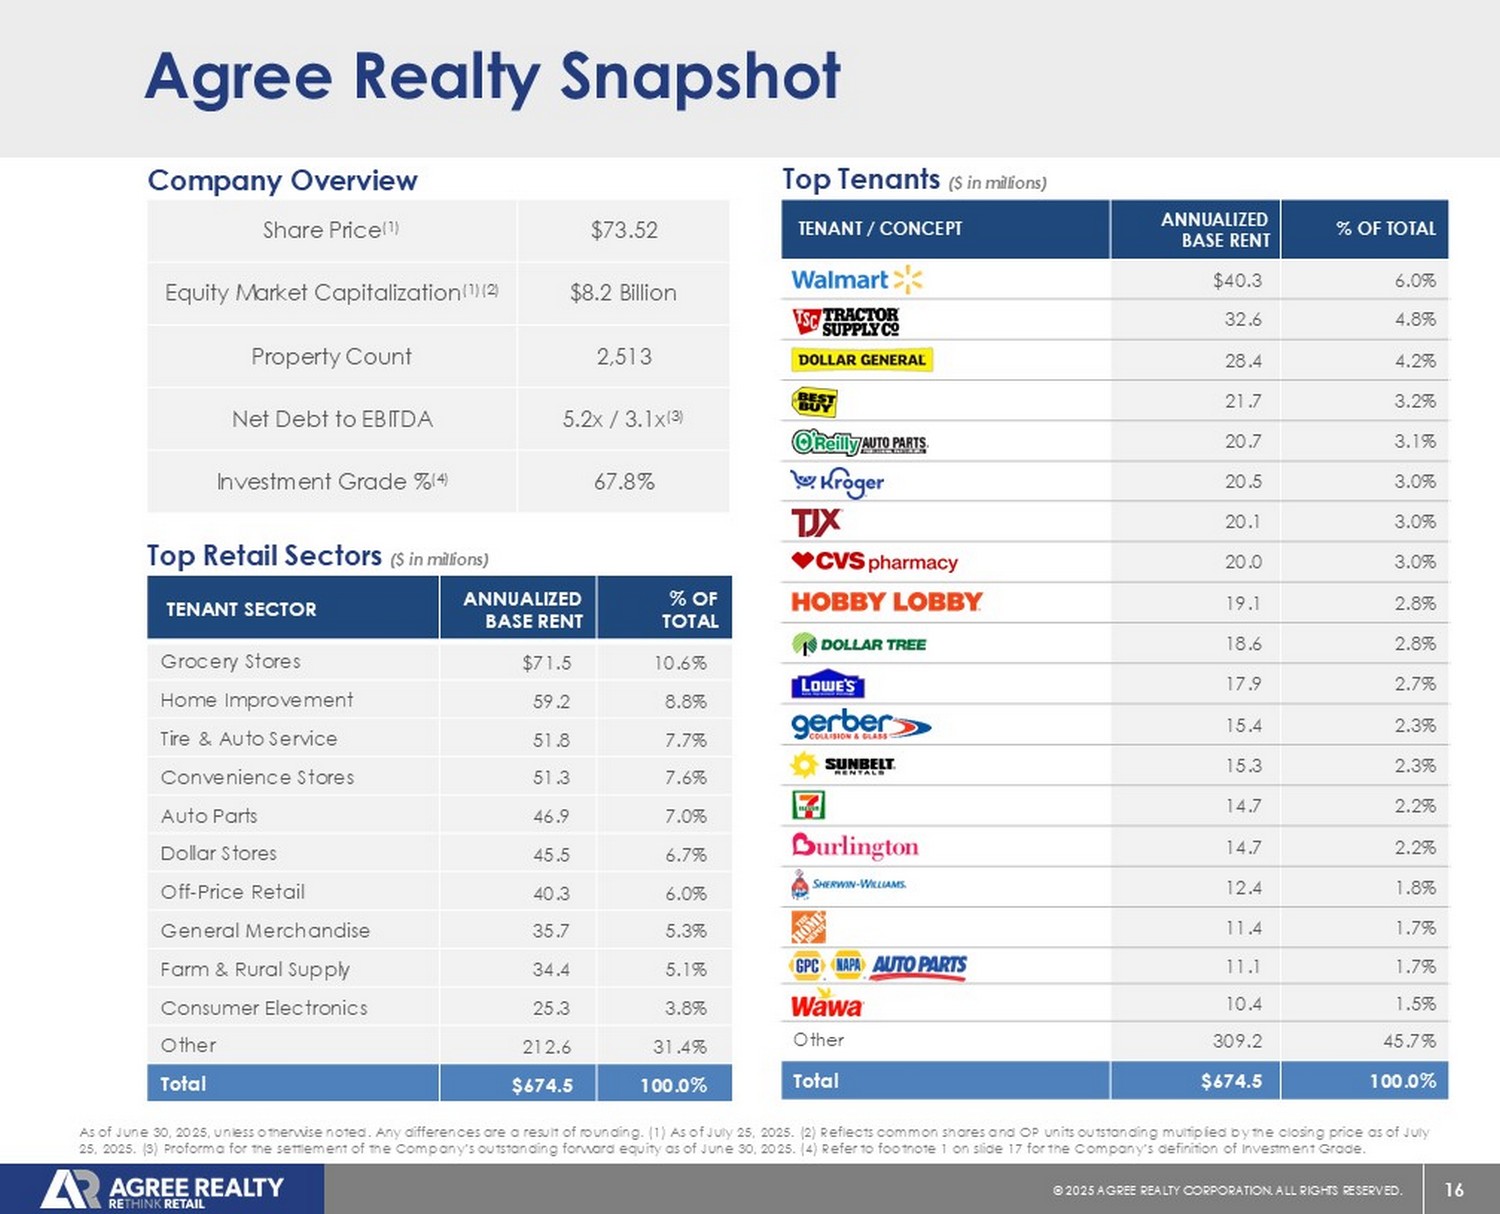
16 © 20 25 AGREE REALTY CORPORATION . ALL RIGHTS RESERVED. % OF TOTAL ANNUALIZED BASE RENT TENANT / CONCEPT 6.0% $40.3 4.8% 32.6 4.2% 28.4 3.2% 21.7 3.1% 20.7 3.0% 20.5 3.0% 20.1 3.0% 20.0 2.8% 19.1 2.8% 18.6 2.7% 17.9 2.3% 15.4 2.3% 15.3 2.2% 14.7 2.2% 14.7 1.8% 12.4 1.7% 11.4 1.7% 11.1 1.5% 10.4 45.7% 309.2 Other 100.0% $674.5 Total Agree Realty Snapshot % OF TOTAL ANNUALIZED BASE RENT TENANT SECTOR 10.6% $71.5 Grocery Stores 8.8% 59.2 Home Improvement 7.7% 51.8 Tire & Auto Service 7.6% 51.3 Convenience Stores 7.0% 46.9 Auto Parts 6.7% 45.5 Dollar Stores 6.0% 40.3 Off - Price Retail 5.3% 35.7 General Merchandise 5.1% 34.4 Farm & Rural Supply 3.8% 25.3 Consumer Electronics 31.4% 212.6 Other 100.0% $674.5 Total $73.52 Share Price (1) $8.2 Billion Equity Market Capitalization (1)(2) 2,513 Property Count 5.2x / 3.1x (3) Net Debt to EBITDA 67.8% Investment Grade % (4) Company Overview Top Tenants ($ in millions) Top Retail Sectors ($ in millions) As of June 30, 2025, unless otherwise noted. Any differences are a result of rounding. (1) As of July 25, 2025. (2) Reflects com mon shares and OP units outstanding multiplied by the closing price as of July 25, 2025. (3) Proforma for the settlement of the Company’s outstanding forward equity as of June 30, 2025. (4) Refer to footn ote 1 on slide 17 for the Company’s definition of Investment Grade.
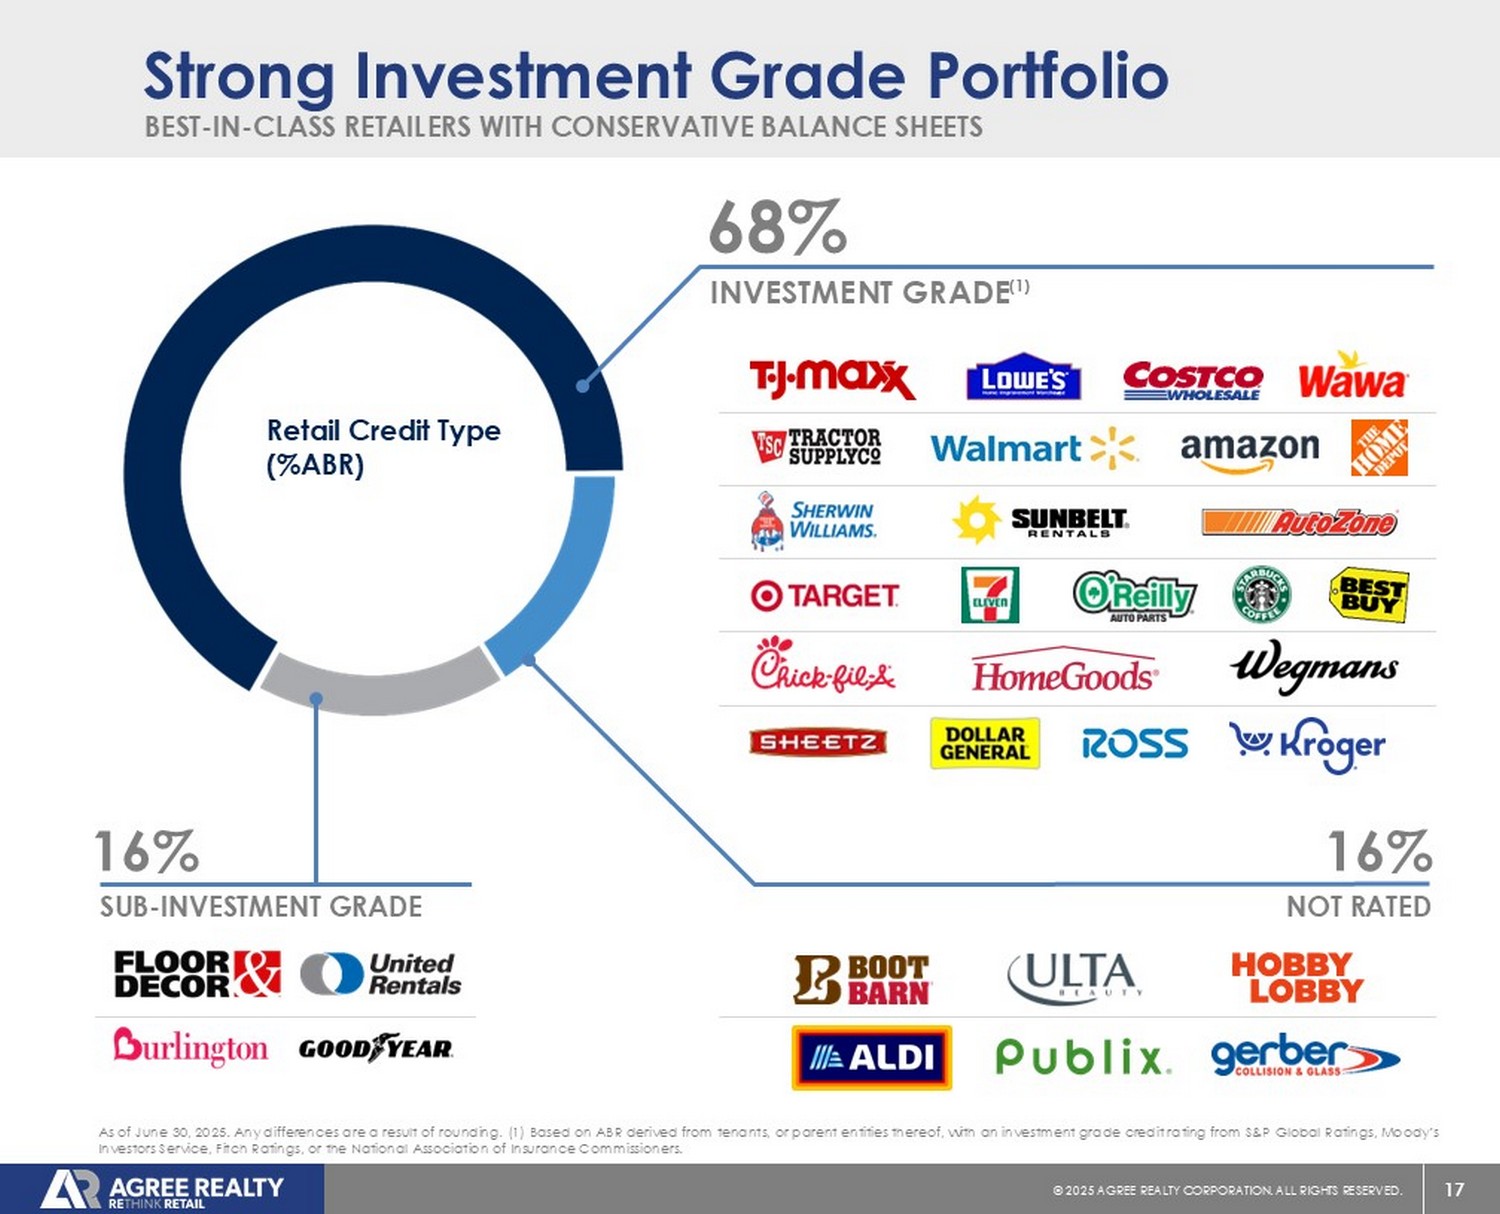
17 © 20 25 AGREE REALTY CORPORATION . ALL RIGHTS RESERVED. BEST - IN - CLASS RETAILERS WITH CONSERVATIVE BALANCE SHEETS Strong Investment Grade Portfolio 16% SUB - INVESTMENT GRADE 16% NOT RATED 68% INVESTMENT GRADE (1) As of June 30, 2025. Any differences are a result of rounding. (1) Based on ABR derived from tenants, or parent entities ther eof , with an investment grade credit rating from S&P Global Ratings, Moody’s Investors Service, Fitch Ratings, or the National Association of Insurance Commissioners. Retail Credit Type (%ABR)
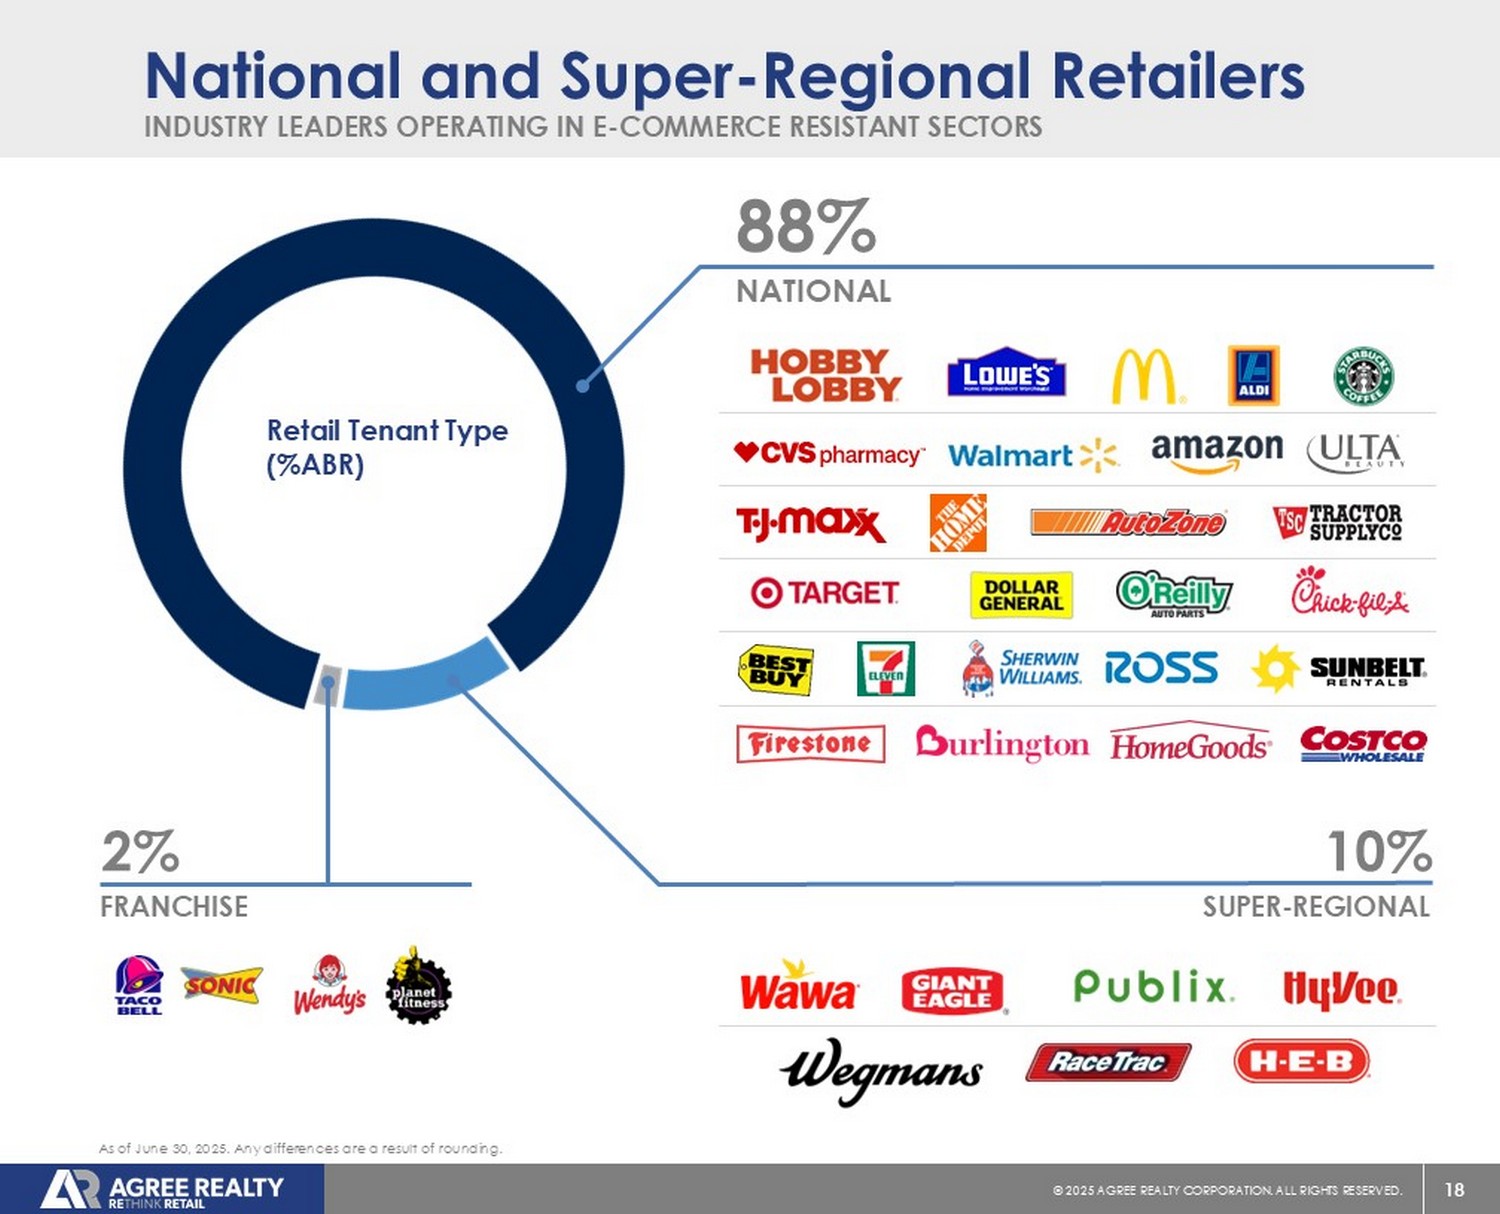
18 © 20 25 AGREE REALTY CORPORATION . ALL RIGHTS RESERVED. INDUSTRY LEADERS OPERATING IN E - COMMERCE RESISTANT SECTORS National and Super - Regional Retailers 2% FRANCHISE 10% SUPER - REGIONAL 88% NATIONAL As of June 30, 2025. Any differences are a result of rounding. Retail Tenant Type (%ABR)
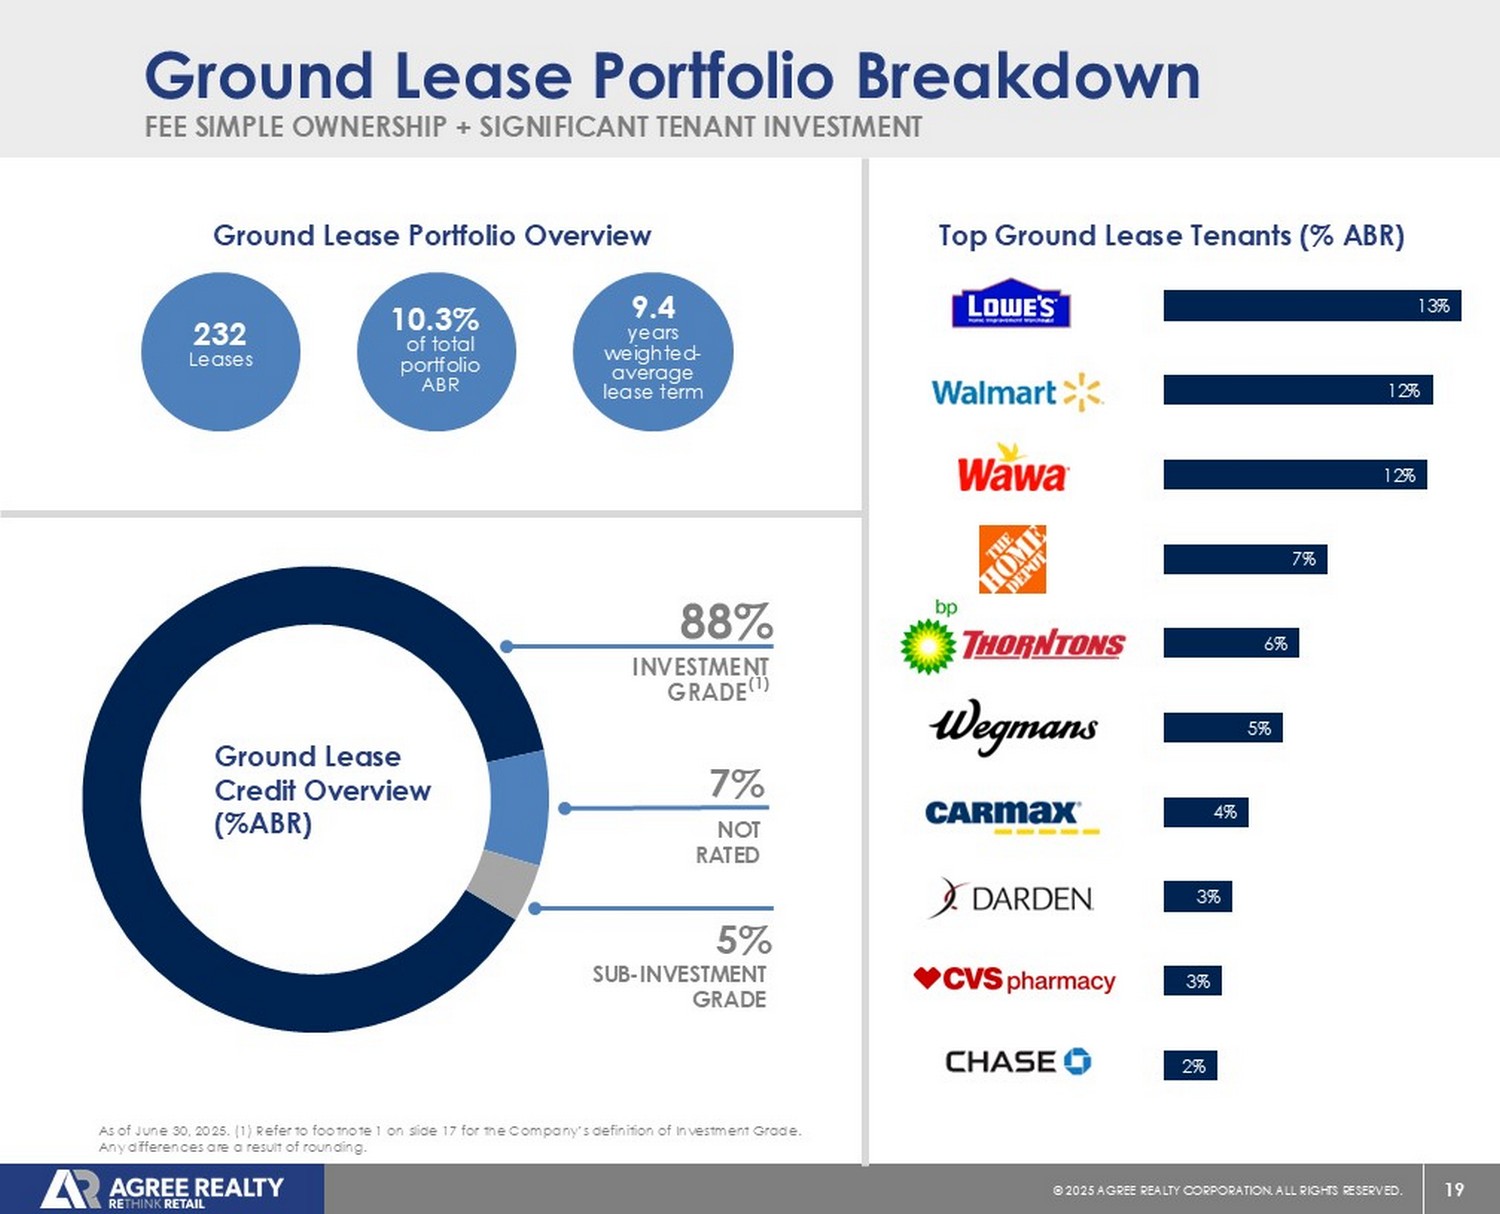
19 © 20 25 AGREE REALTY CORPORATION . ALL RIGHTS RESERVED. 13% 12% 12% 7% 6% 5% 4% 3% 3% 2% As of June 30, 2025. (1) Refer to footnote 1 on slide 17 for the Company’s definition of Investment Grade. Any differences are a result of rounding. FEE SIMPLE OWNERSHIP + SIGNIFICANT TENANT INVESTMENT Ground Lease Portfolio Breakdown Ground Lease Credit Overview (%ABR) 88% INVESTMENT GRADE (1) 7% NOT RATED 5% SUB - INVESTMENT GRADE Ground Lease Portfolio Overview 232 Leases 10.3% of total portfolio ABR 9.4 years weighted - average lease term Top Ground Lease Tenants (% ABR)
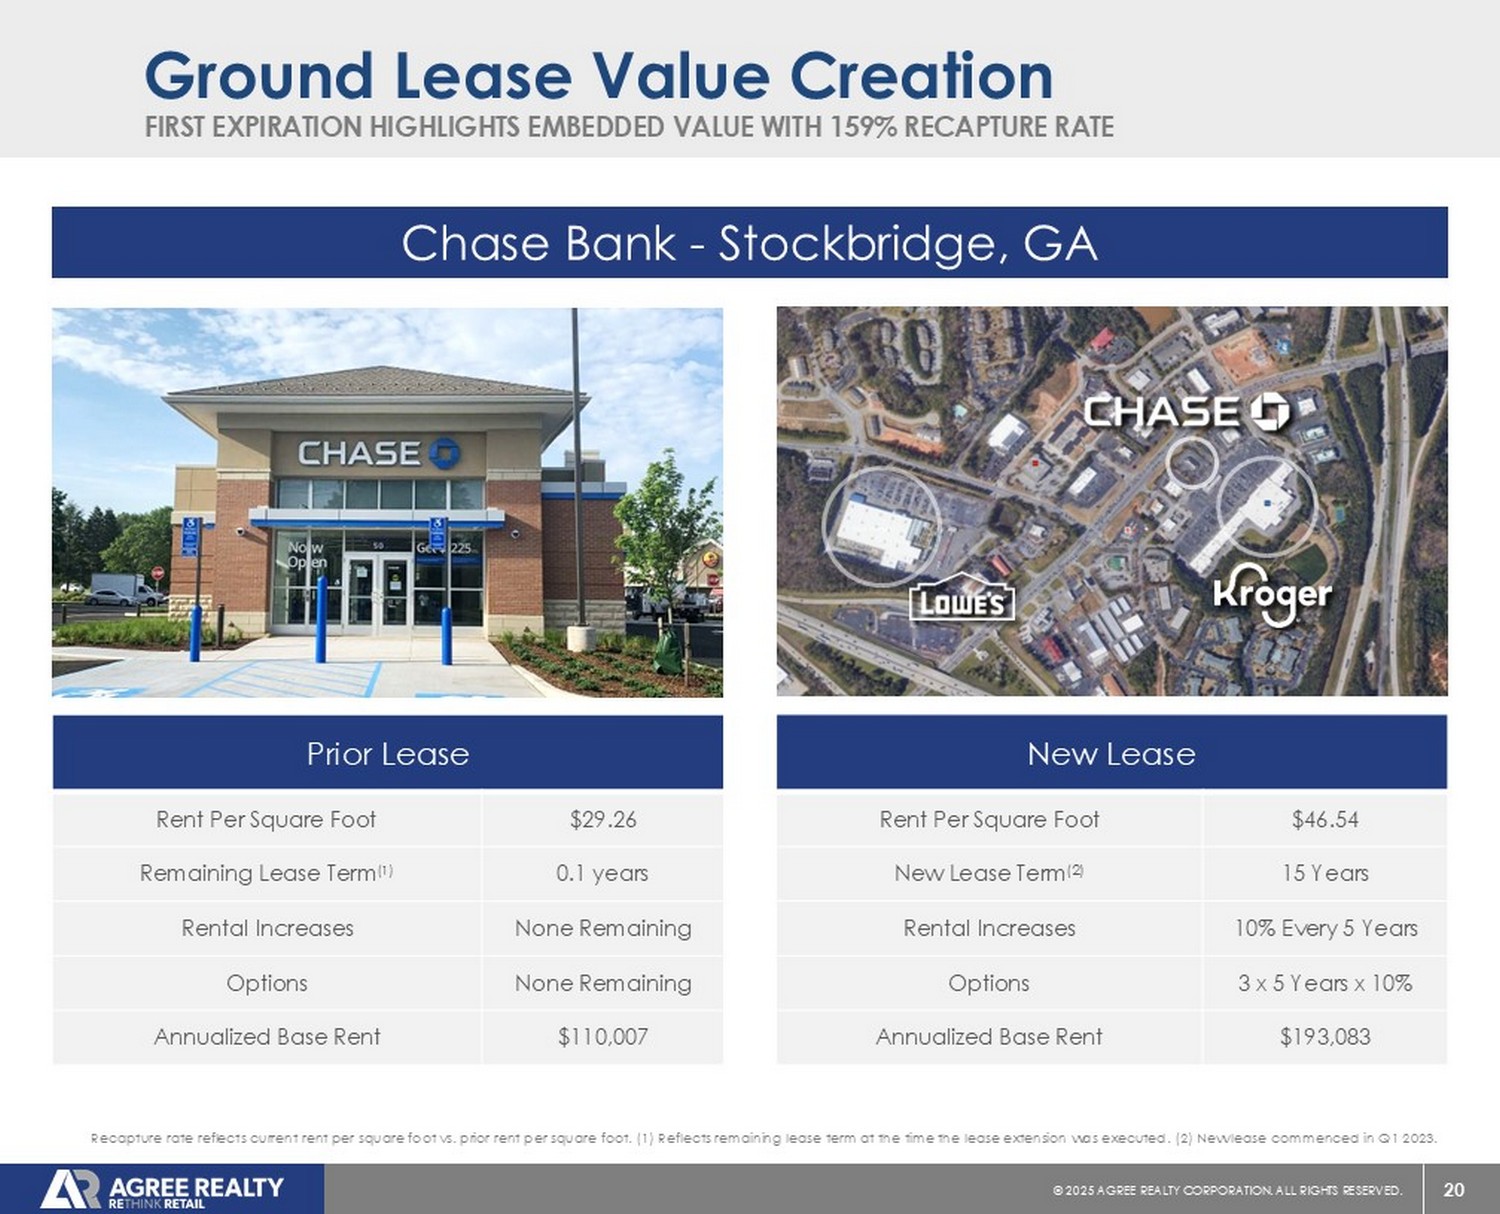
20 © 20 25 AGREE REALTY CORPORATION . ALL RIGHTS RESERVED. FIRST EXPIRATION HIGHLIGHTS EMBEDDED VALUE WITH 159% RECAPTURE RATE Ground Lease Value Creation Chase Bank - Stockbridge, GA New Lease $46.54 Rent Per Square Foot 15 Years New Lease Term (2) 10% Every 5 Years Rental Increases 3 x 5 Years x 10% Options $193,083 Annualized Base Rent Prior Lease $29.26 Rent Per Square Foot 0.1 years Remaining Lease Term (1) None Remaining Rental Increases None Remaining Options $110,007 Annualized Base Rent Recapture rate reflects current rent per square foot vs. prior rent per square foot. (1) Reflects remaining lease term at the time the lease extension was executed. (2) New lease commenced in Q1 2023.
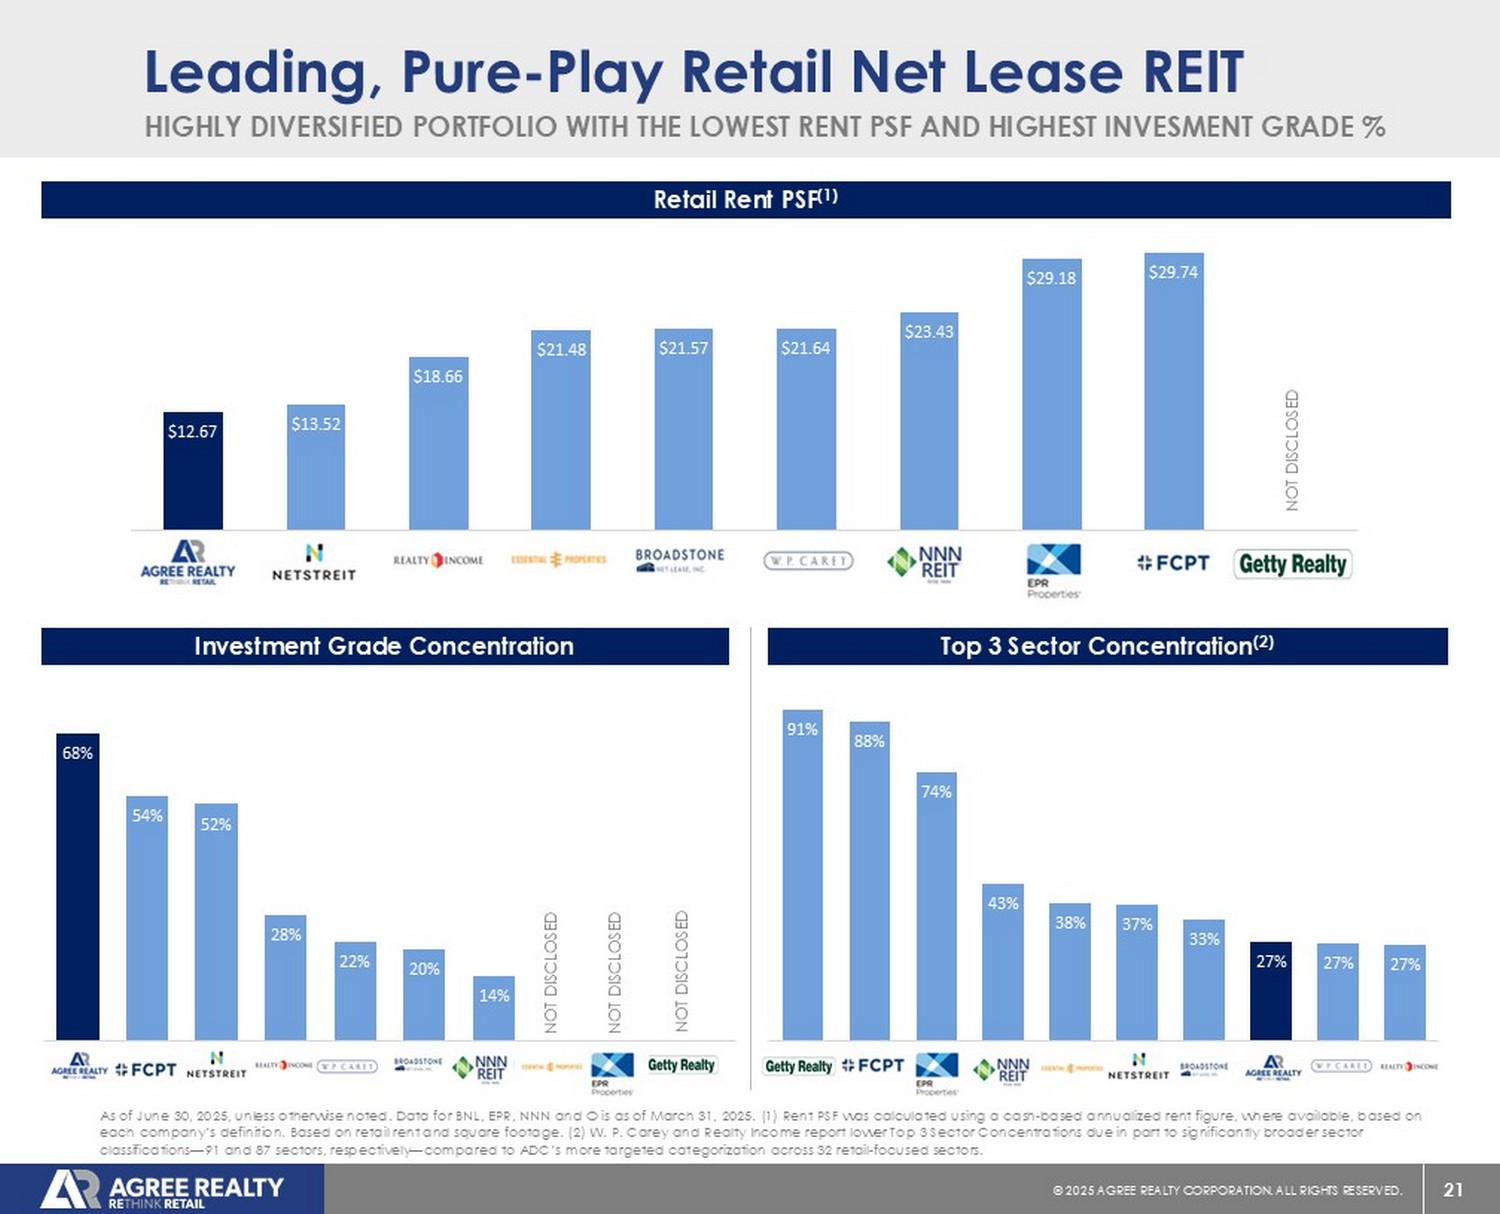
21 © 20 25 AGREE REALTY CORPORATION . ALL RIGHTS RESERVED. 91% 88% 74% 43% 38% 37% 33% 27% 27% 27% GTY FCPT EPR NNN EPRT NTST BNL ADC WPC O 68% 54% 52% 28% 22% 20% 14% 0% 0% 0% ADC FCPT NTST O WPC BNL NNN EPRT EPR GTY $12.67 $13.52 $18.66 $21.48 $21.57 $21.64 $23.43 $29.18 $29.74 $30.00 ADC NTST O EPRT BNL WPC NNN EPR FCPT GTY Leading, Pure - Play Retail Net Lease REIT HIGHLY DIVERSIFIED PORTFOLIO WITH THE LOWEST RENT PSF AND HIGHEST INVESMENT GRADE % Retail Rent PSF (1) As of June 30, 2025, unless otherwise noted. Data for BNL, EPR, NNN and O is as of March 31, 2025. (1) Rent PSF was calculate d u sing a cash - based annualized rent figure, where available, based on each company’s definition. Based on retail rent and square footage. (2) W. P. Carey and Realty Income report lower Top 3 Sect or Concentrations due in part to significantly broader sector classifications — 91 and 87 sectors, respectively — compared to ADC’s more targeted categorization across 32 retail - focused sectors. Investment Grade Concentration Top 3 Sector Concentration (2) NOT DISCLOSED NOT DISCLOSED NOT DISCLOSED NOT DISCLOSED Disciplined Investment Strategy & Active Portfolio Management

23 © 20 25 AGREE REALTY CORPORATION . ALL RIGHTS RESERVED.
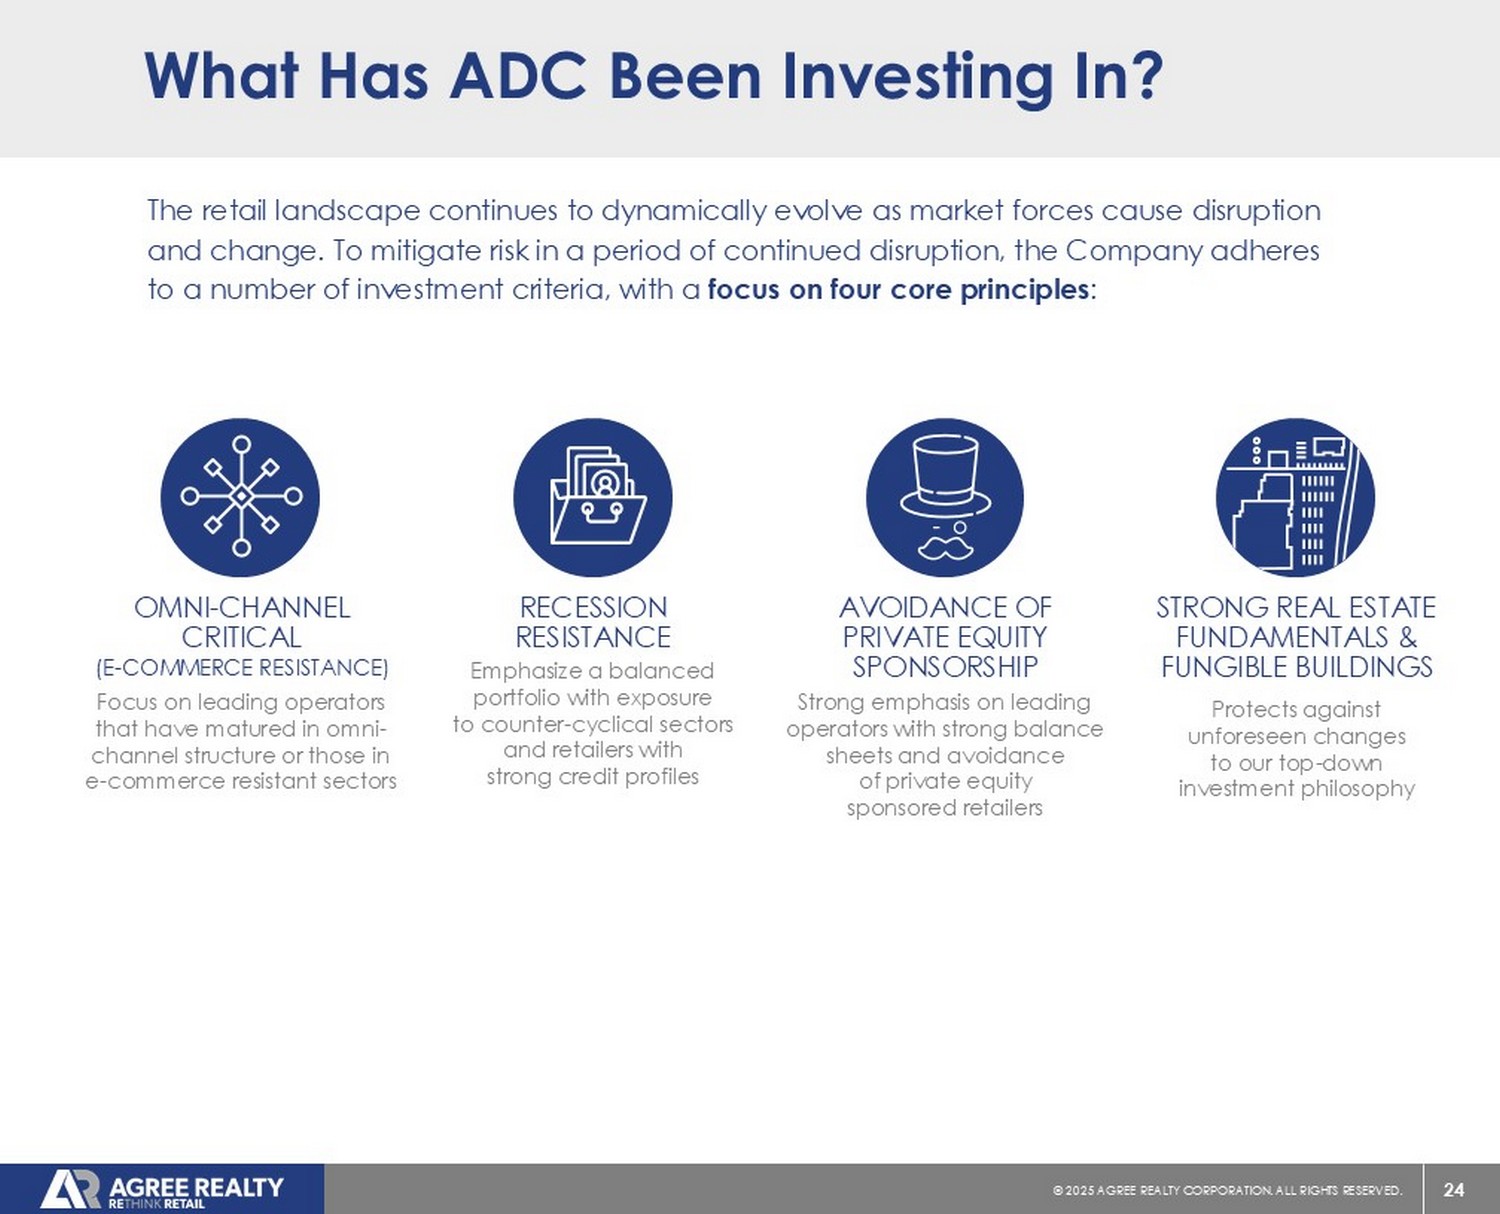
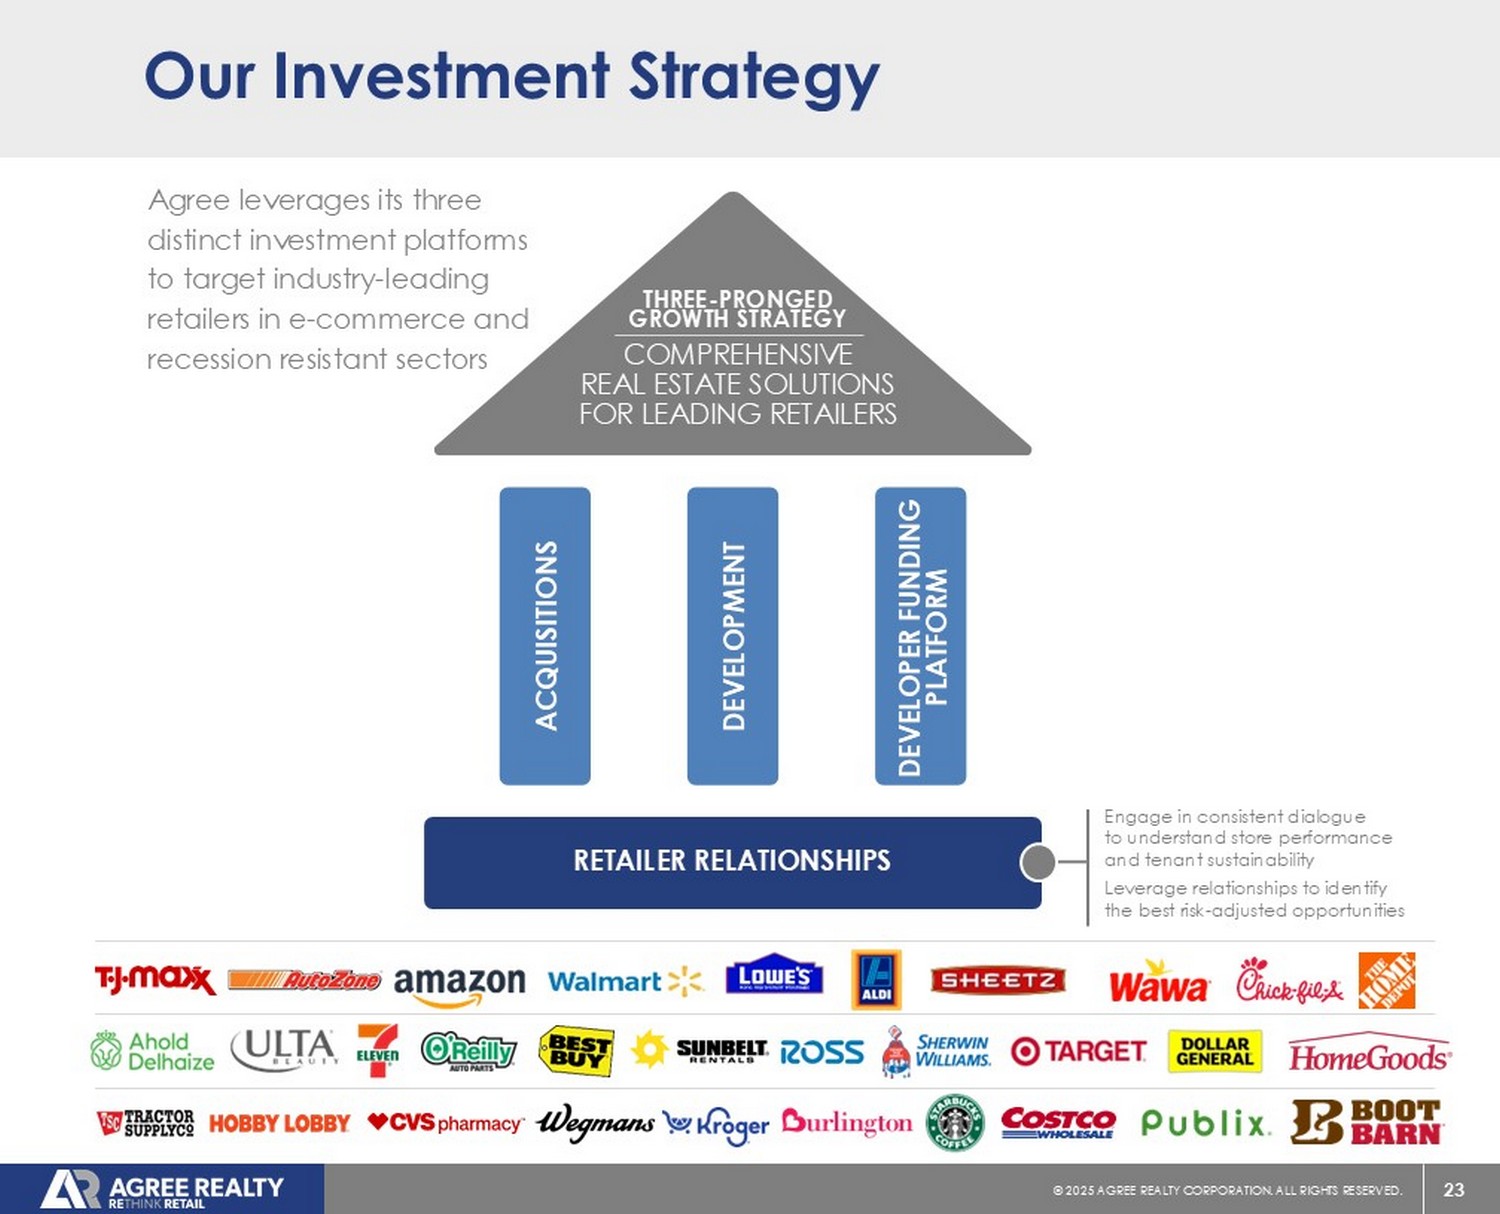
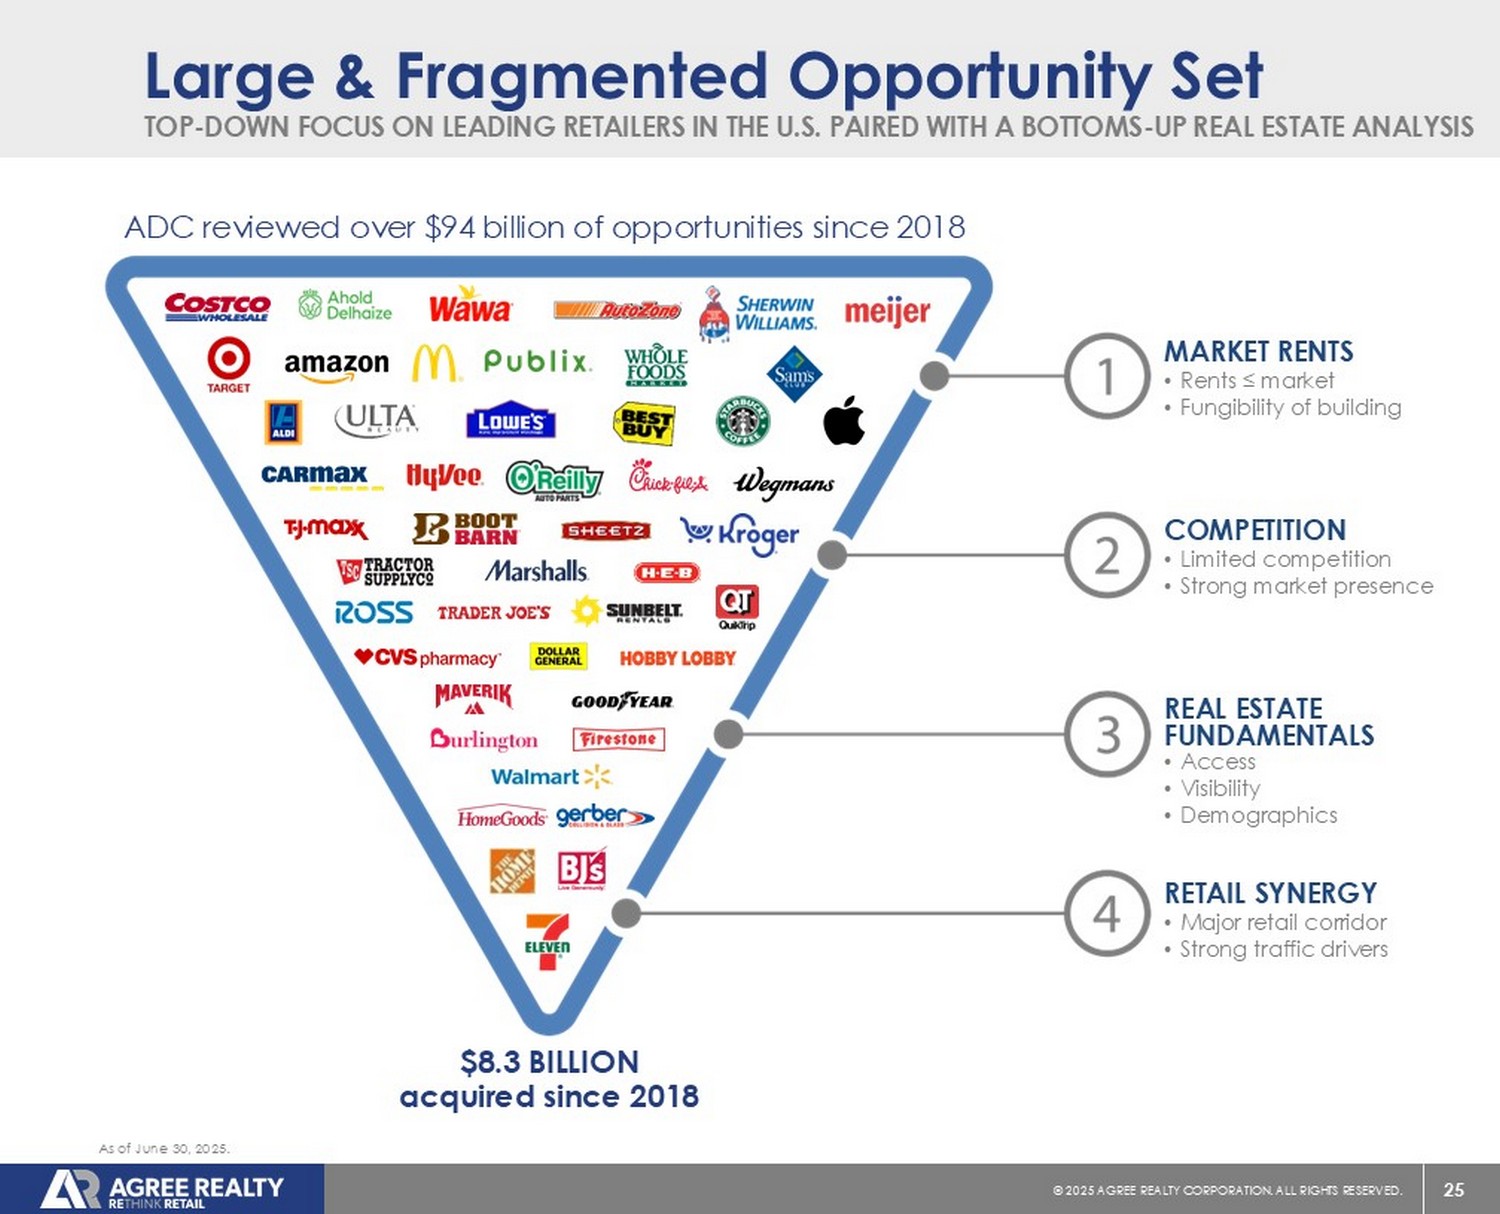
Engage in consistent dialogue to understand store performance and tenant sustainability Leverage relationships to identify the best risk - adjusted opportunities Our Investment Strategy Agree leverages its three distinct investment platforms to target industry - leading retailers in e - commerce and recession resistant sectors THREE - PRONGED GROWTH STRATEGY COMPREHENSIVE REAL ESTATE SOLUTIONS FOR LEADING RETAILERS ACQUISITIONS DEVELOPMENT DEVELOPER FUNDING PLATFORM RETAILER RELATIONSHIPS 24 © 20 25 AGREE REALTY CORPORATION . ALL RIGHTS RESERVED. What Has ADC Been Investing In? The retail landscape continues to dynamically evolve as market forces cause disruption and change. To mitigate risk in a period of continued disruption, the Company adheres to a number of investment criteria, with a focus on four core principles : Focus on leading operators that have matured in omni - channel structure or those in e - commerce resistant sectors OMNI - CHANNEL CRITICAL (E - COMMERCE RESISTANCE) Emphasize a balanced portfolio with exposure to counter - cyclical sectors and retailers with strong credit profiles RECESSION RESISTANCE Strong emphasis on leading operators with strong balance sheets and avoidance of private equity sponsored retailers AVOIDANCE OF PRIVATE EQUITY SPONSORSHIP Protects against unforeseen changes to our top - down investment philosophy STRONG REAL ESTATE FUNDAMENTALS & FUNGIBLE BUILDINGS 25 © 20 25 AGREE REALTY CORPORATION . ALL RIGHTS RESERVED. TOP - DOWN FOCUS ON LEADING RETAILERS IN THE U.S. PAIRED WITH A BOTTOMS - UP REAL ESTATE ANALYSIS Large & Fragmented Opportunity Set REAL ESTATE FUNDAMENTALS • Rents ≤ market • Fungibility of building MARKET RENTS • Limited competition • Strong market presence COMPETITION • Access • Visibility • Demographics • Major retail corridor • Strong traffic drivers RETAIL SYNERGY ADC reviewed over $94 billion of opportunities since 2018 $8.3 BILLION acquired since 2018 As of June 30, 2025.
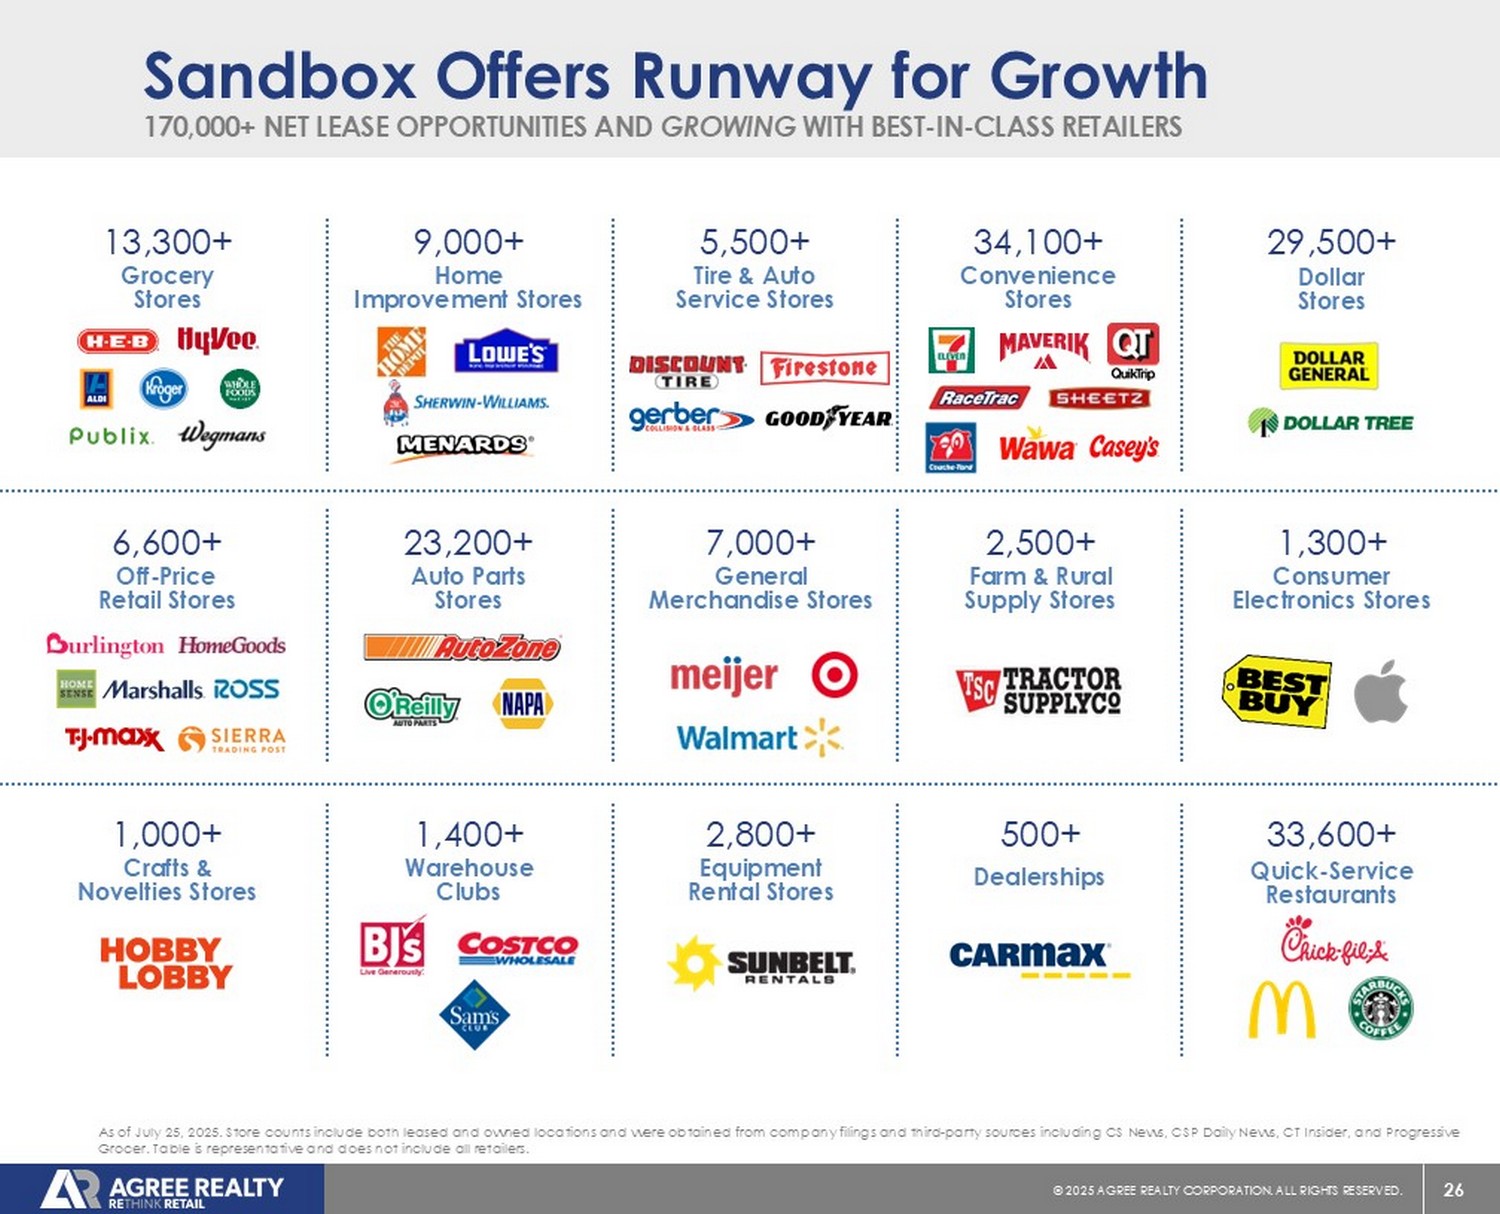
26 © 20 25 AGREE REALTY CORPORATION . ALL RIGHTS RESERVED. As of July 25, 2025. Store counts include both leased and owned locations and were obtained from company filings and third - party sources including CS News, CSP Daily News, CT Insider, and Progressive Grocer. Table is representative and does not include all retailers.
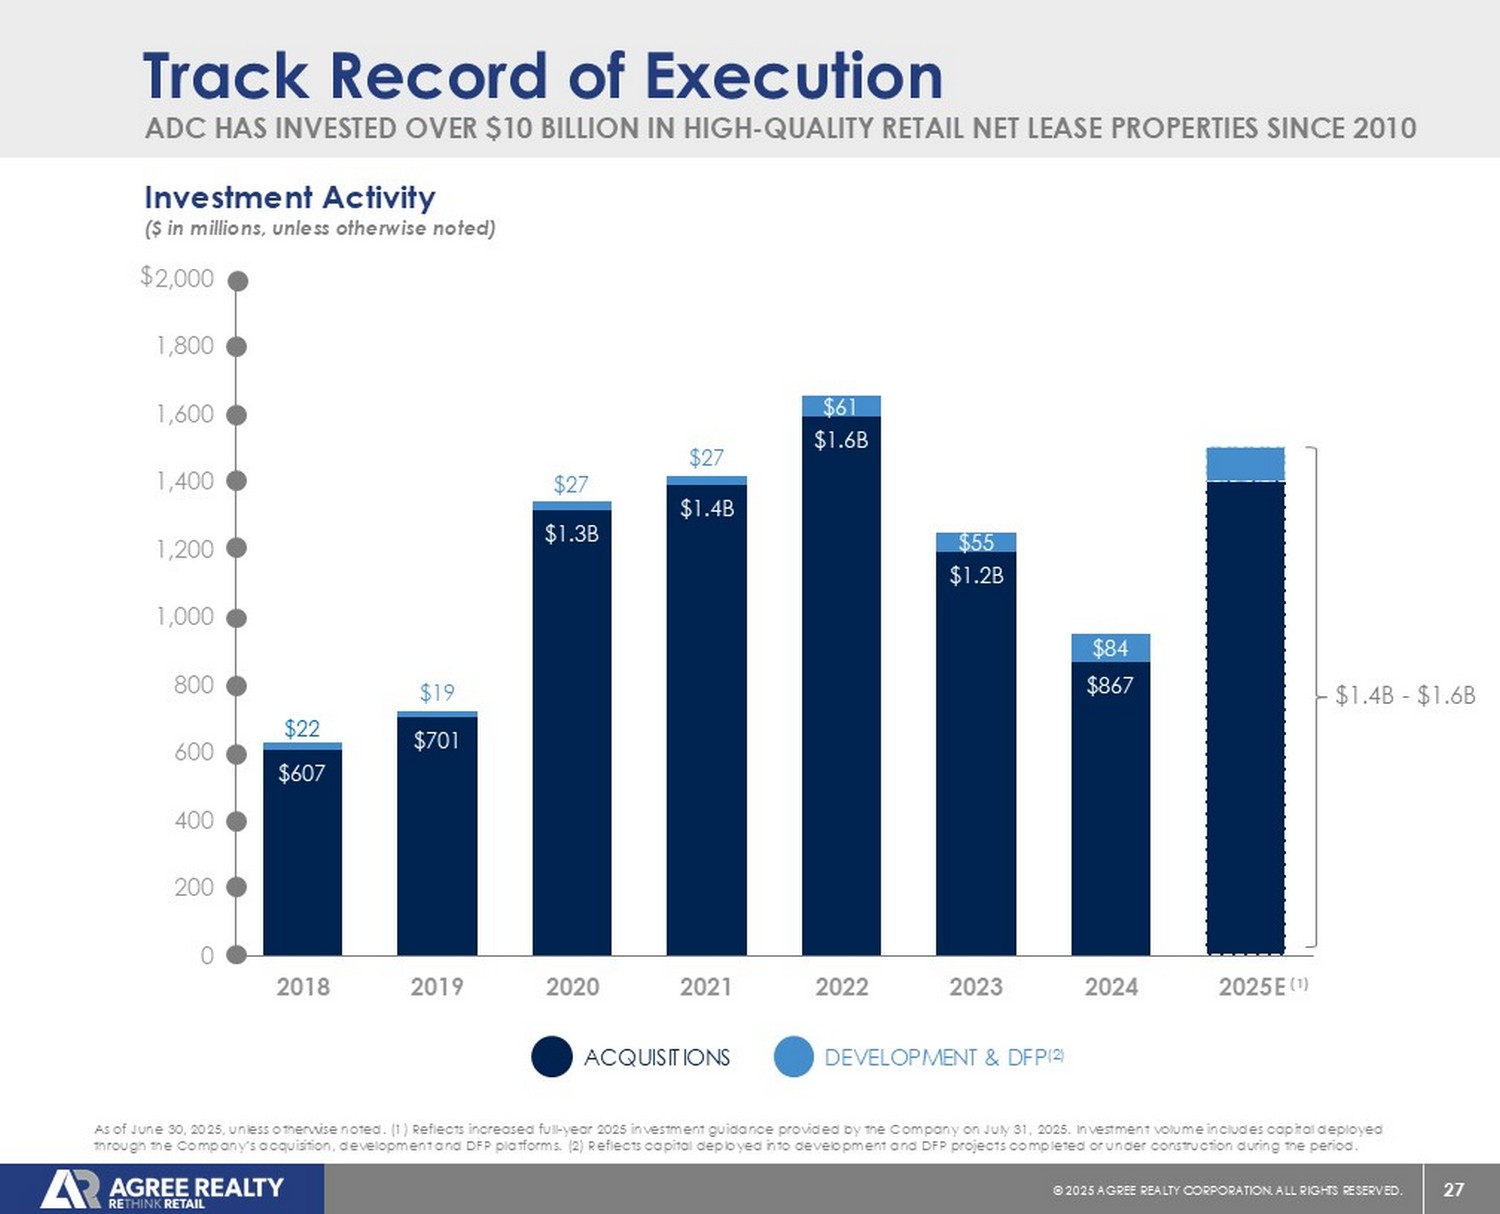
170,000+ NET LEASE OPPORTUNITIES AND GROWING WITH BEST - IN - CLASS RETAILERS Sandbox Offers Runway for Growth Auto Parts Stores 23,200+ Farm & Rural Supply Stores 2,500+ Crafts & Novelties Stores 1,000+ Quick - Service Restaurants 33,600+ Equipment Rental Stores 2,800+ Warehouse Clubs 1,400+ Home Improvement Stores 9,000+ Consumer Electronics Stores 1,300+ Grocery Stores 13,300+ Dealerships 500+ Convenience Stores 34,100+ Off - Price Retail Stores 6,600+ Tire & Auto Service Stores 5,500+ Dollar Stores 29,500+ General Merchandise Stores 7,000+ 27 © 20 25 AGREE REALTY CORPORATION . ALL RIGHTS RESERVED. $607 $701 $1.3B $1.4B $1.6B $1.2B $867 $22 $19 $27 $27 $61 $55 $84 0 200 400 600 800 1,000 1,200 1,400 1,600 1,800 2,000 2018 2019 2020 2021 2022 2023 2024 2025 ADC HAS INVESTED OVER $10 BILLION IN HIGH - QUALITY RETAIL NET LEASE PROPERTIES SINCE 2010 Track Record of Execution DEVELOPMENT & DFP (2) ACQUISITIONS Investment Activity ($ in millions, unless otherwise noted) As of June 30, 2025, unless otherwise noted. (1) Reflects increased full - year 2025 investment guidance provided by the Company o n July 31, 2025. Investment volume includes capital deployed through the Company’s acquisition, development and DFP platforms. (2) Reflects capital deployed into development and DFP proj ect s completed or under construction during the period.
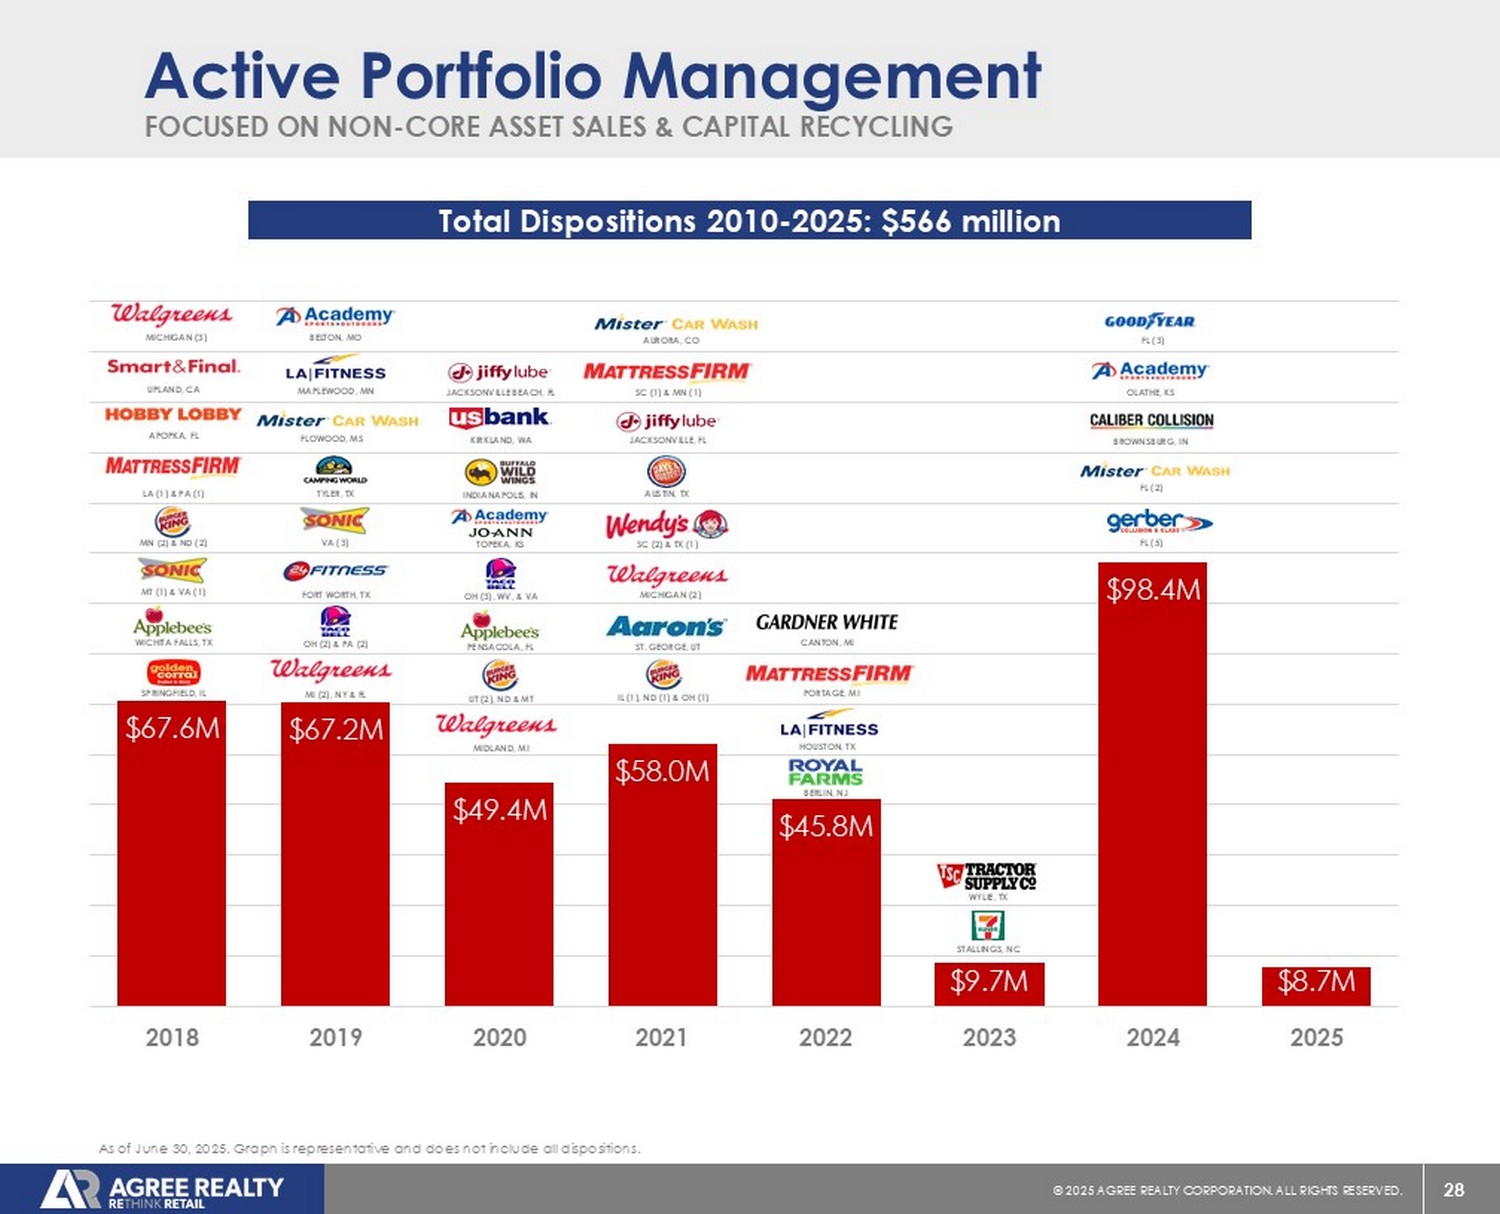
$ E (1) $1.4B - $1.6B 28 © 20 25 AGREE REALTY CORPORATION . ALL RIGHTS RESERVED. $67.6M $67.2M $49.4M $58.0M $45.8M $9.7M $98.4M $8.7M 2018 2019 2020 2021 2022 2023 2024 2025 BERLIN, NJ HOUSTON, TX PORTAGE, MI CANTON, MI FOCUSED ON NON - CORE ASSET SALES & CAPITAL RECYCLING Active Portfolio Management As of June 30, 2025. Graph is representative and does not include all dispositions. Total Dispositions 2010 - 2025: $566 million STALLINGS, NC MT (1) & VA (1) WICHITA FALLS, TX SPRINGFIELD, IL UPLAND, CA APOPKA, FL LA (1) & PA (1) MN (2) & ND (2) MICHIGAN (3) FORT WORTH, TX OH (2) & PA (2) FLOWOOD, MS MAPLEWOOD, MN TYLER, TX BELTON, MO MI (2), NY & FL VA (3) MIDLAND, MI UT (2), ND & MT PENSACOLA, FL OH (3), WV, & VA TOPEKA, KS INDIANAPOLIS, IN KIRKLAND, WA JACKSONVILLE BEACH, FL IL (1), ND (1) & OH (1) MICHIGAN (2) ST.
Fortified Balance Sheet
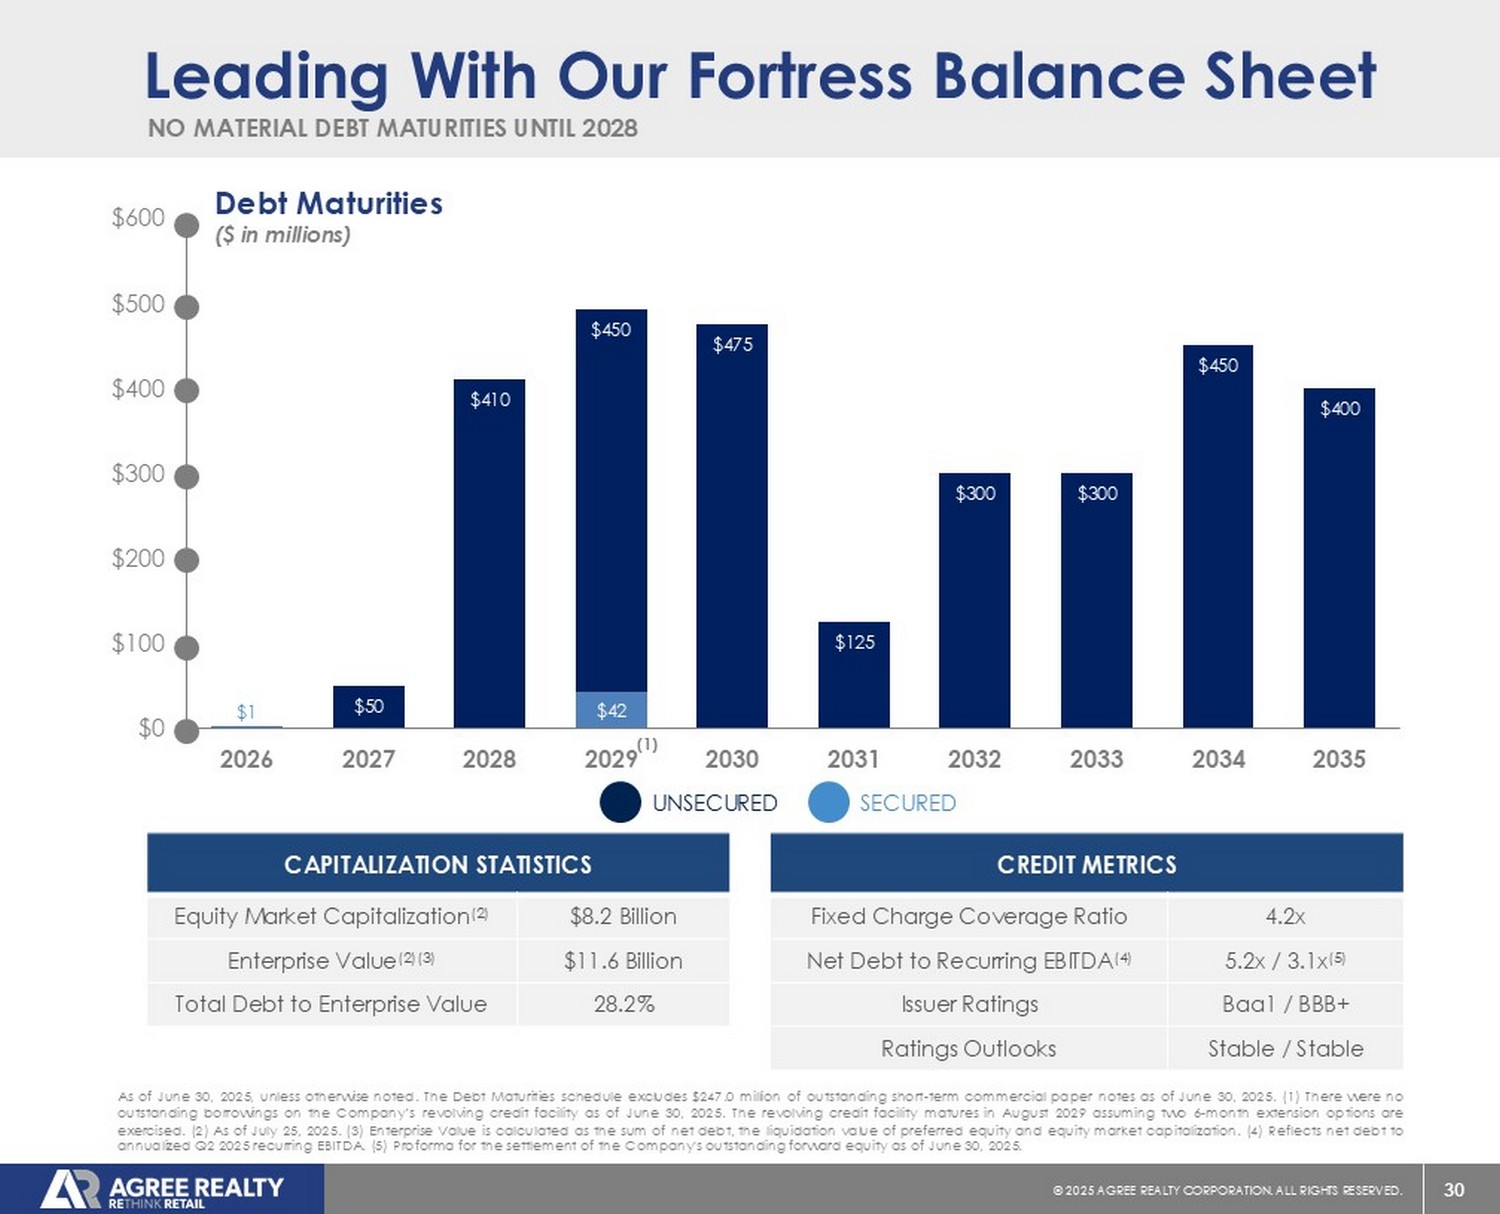
GEORGE, UT SC (2) & TX (1) AUSTIN, TX JACKSONVILLE, FL SC (1) & MN (1) AURORA, CO WYLIE, TX FL (5) FL (2) FL (3) OLATHE, KS BROWNSBURG, IN 30 © 20 25 AGREE REALTY CORPORATION . ALL RIGHTS RESERVED. $1 $42 $0 $50 $410 $450 $475 $125 $300 $300 $450 $400 $0 $100 $200 $300 $400 $500 $600 2026 2027 2028 2029 2030 2031 2032 2033 2034 2035 Leading With Our Fortress Balance Sheet CAPITALIZATION STATISTICS $8.2 Billion Equity Market Capitalization (2) $11.6 Billion Enterprise Value (2)(3) 28.2% Total Debt to Enterprise Value CREDIT METRICS 4.2x Fixed Charge Coverage Ratio 5.2x / 3.1x (5) Net Debt to Recurring EBITDA (4) Baa1 / BBB+ Issuer Ratings Stable / Stable Ratings Outlooks As of June 30 , 2025 , unless otherwise noted . The Debt Maturities schedule excludes $ 247 . 0 million of outstanding short - term commercial paper notes as of June 30 , 2025 . ( 1 ) There were no outstanding borrowings on the Company’s revolving credit facility as of June 30 , 2025 . The revolving credit facility matures in August 2029 assuming two 6 - month extension options are exercised . ( 2 ) As of July 25 , 2025 . ( 3 ) Enterprise Value is calculated as the sum of net debt, the liquidation value of preferred equity and equity market capitalization . ( 4 ) Reflects net debt to annualized Q 2 2025 recurring EBITDA . ( 5 ) Proforma for the settlement of the Company's outstanding forward equity as of June 30 , 2025 . Debt Maturities ($ in millions) SECURED UNSECURED NO MATERIAL DEBT MATURITIES UNTIL 2028 (1)
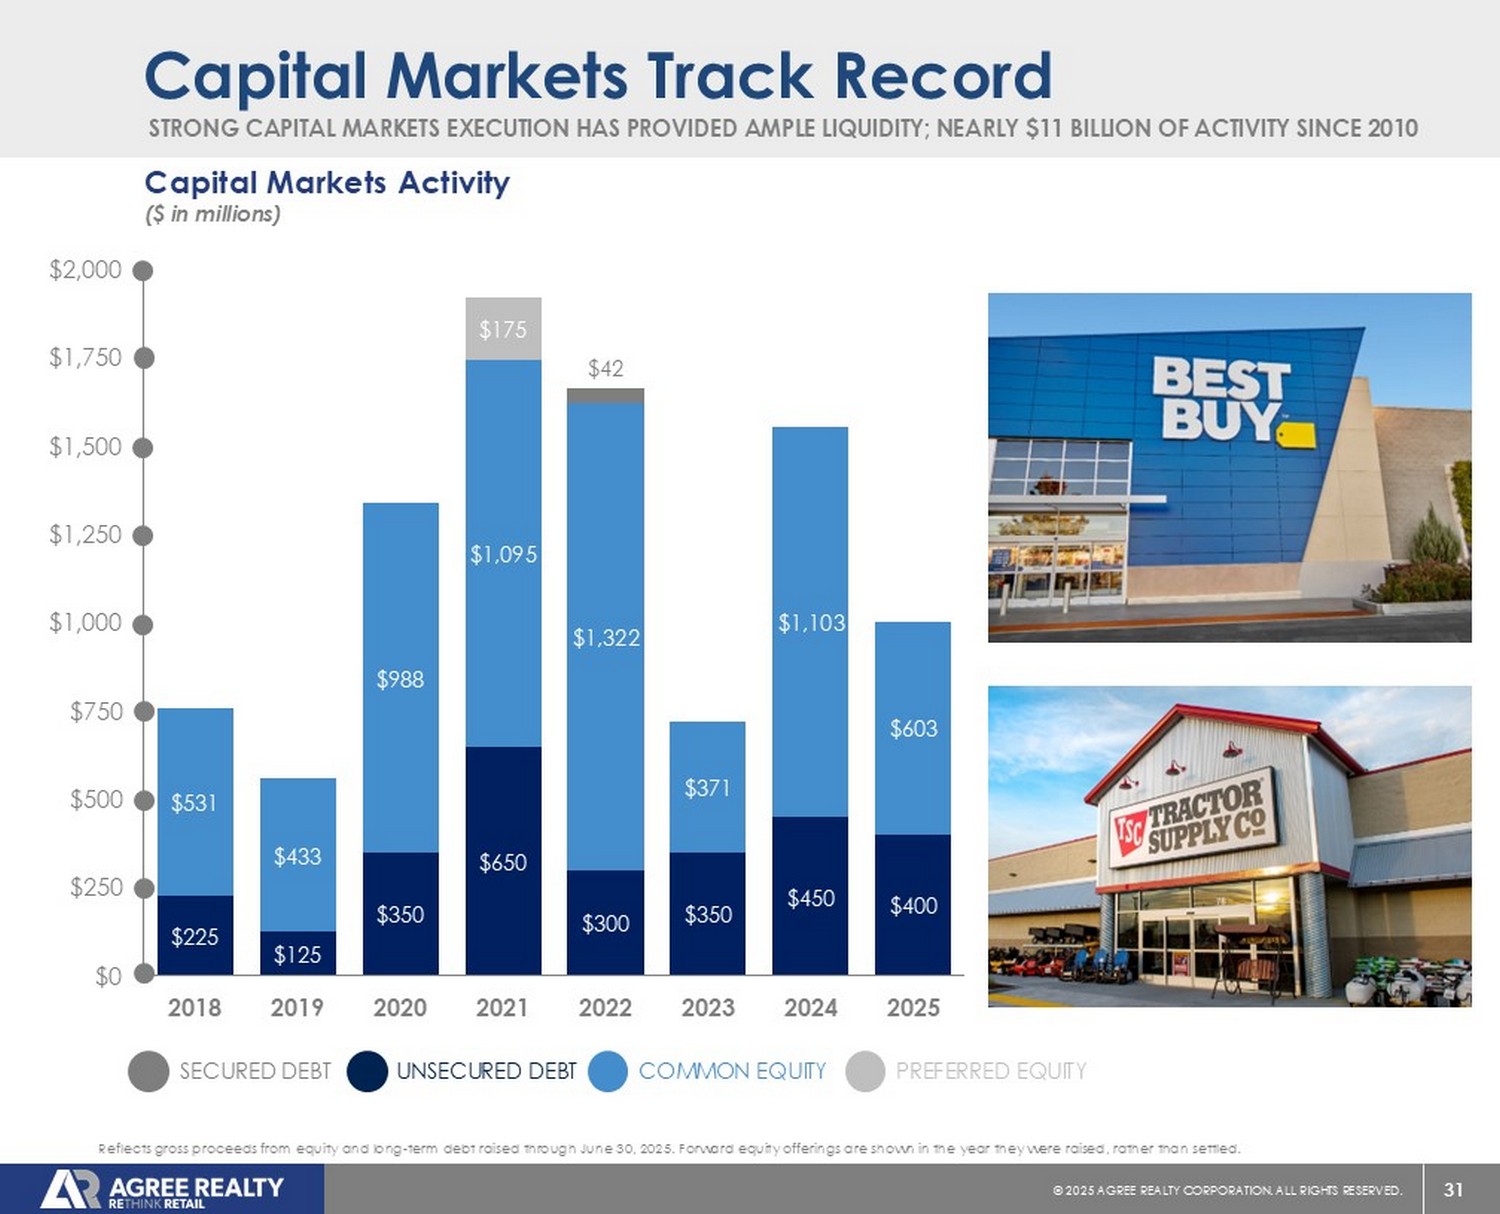
31 © 20 25 AGREE REALTY CORPORATION . ALL RIGHTS RESERVED. STRONG CAPITAL MARKETS EXECUTION HAS PROVIDED AMPLE LIQUIDITY; NEARLY $11 BILLION OF ACTIVITY SINCE 2010 Capital Markets Track Record Reflects gross proceeds from equity and long - term debt raised through June 30, 2025. Forward equity offerings are shown in the y ear they were raised, rather than settled.
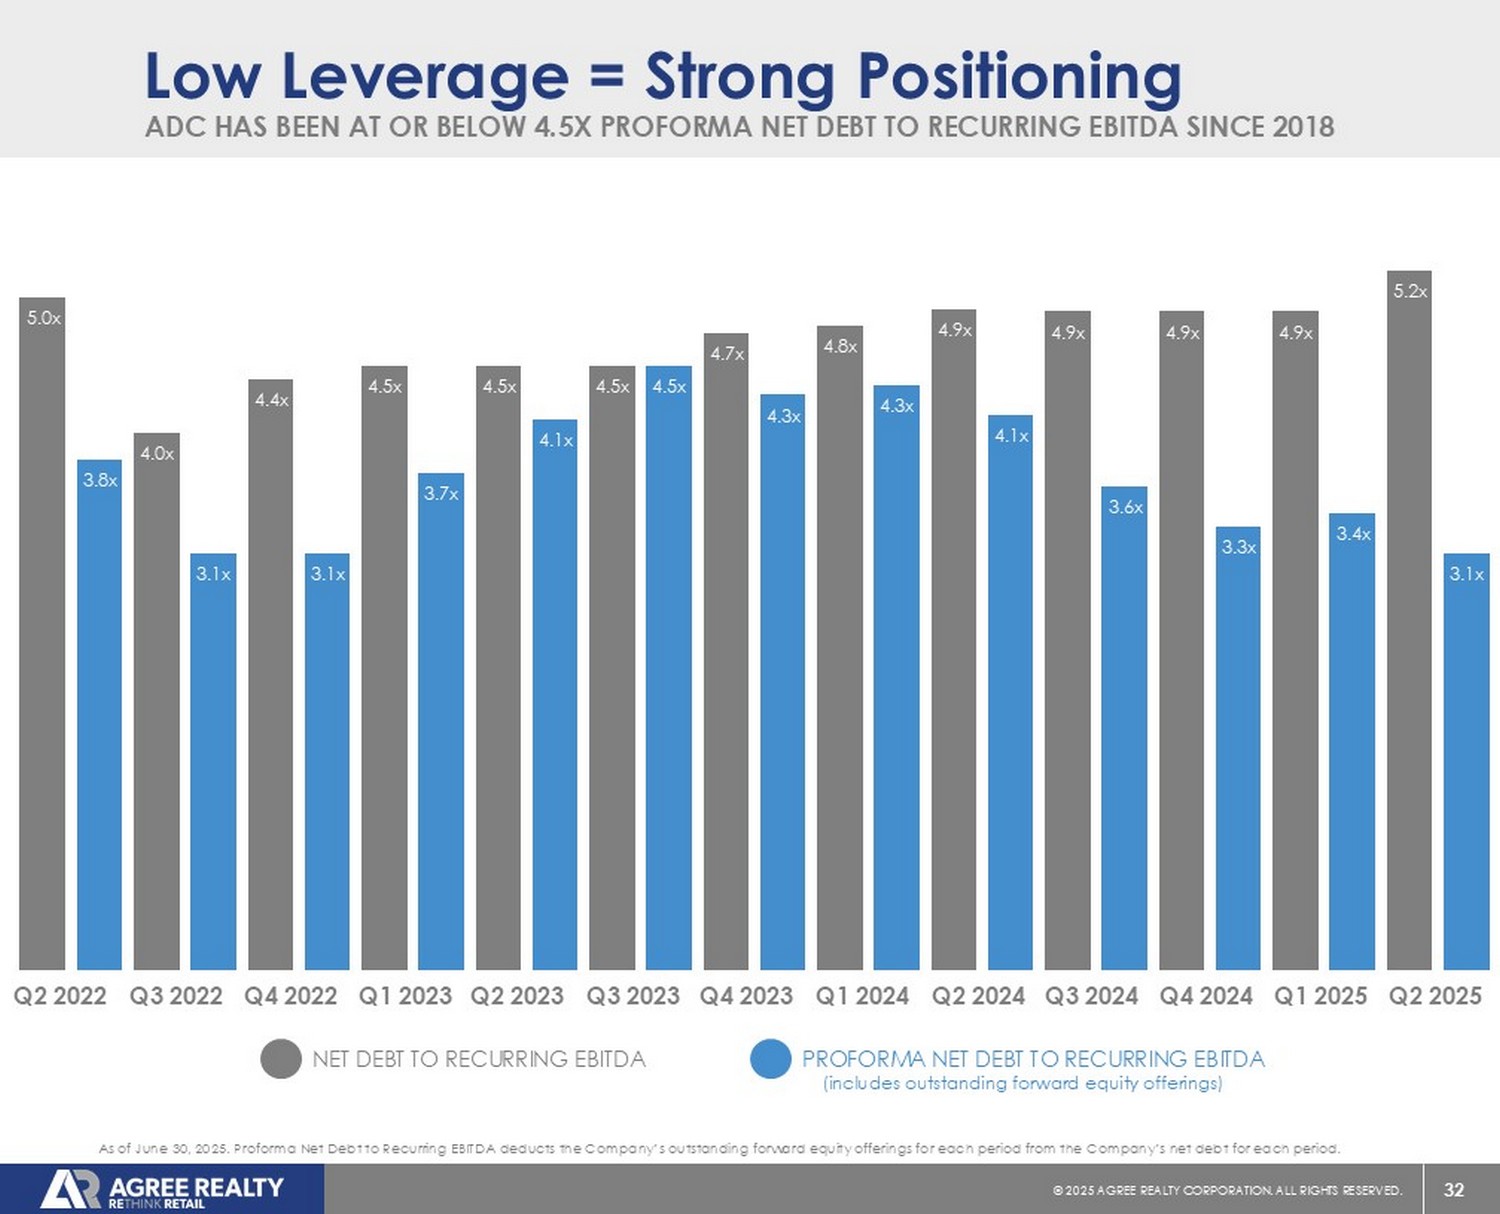
Capital Markets Activity ($ in millions) COMMON EQUITY UNSECURED DEBT SECURED DEBT PREFERRED EQUITY $225 $125 $350 $650 $300 $350 $450 $400 $531 $433 $988 $1,095 $1,322 $371 $1,103 $603 $42 $175 $0 $250 $500 $750 $1,000 $1,250 $1,500 $1,750 $2,000 2018 2019 2020 2021 2022 2023 2024 2025 32 © 20 25 AGREE REALTY CORPORATION . ALL RIGHTS RESERVED. 5.0x 3.8x 4.0x 3.1x 4.4x 3.1x 4.5x 3.7x 4.5x 4.1x 4.5x 4.5x 4.7x 4.3x 4.8x 4.3x 4.9x 4.1x 4.9x 3.6x 4.9x 3.3x 4.9x 3.4x 5.2x 3.1x (includes outstanding forward equity offerings) ADC HAS BEEN AT OR BELOW 4.5X PROFORMA NET DEBT TO RECURRING EBITDA SINCE 2018 Low Leverage = Strong Positioning As of June 30, 2025. Proforma Net Debt to Recurring EBITDA deducts the Company’s outstanding forward equity offerings for eac h p eriod from the Company’s net debt for each period.
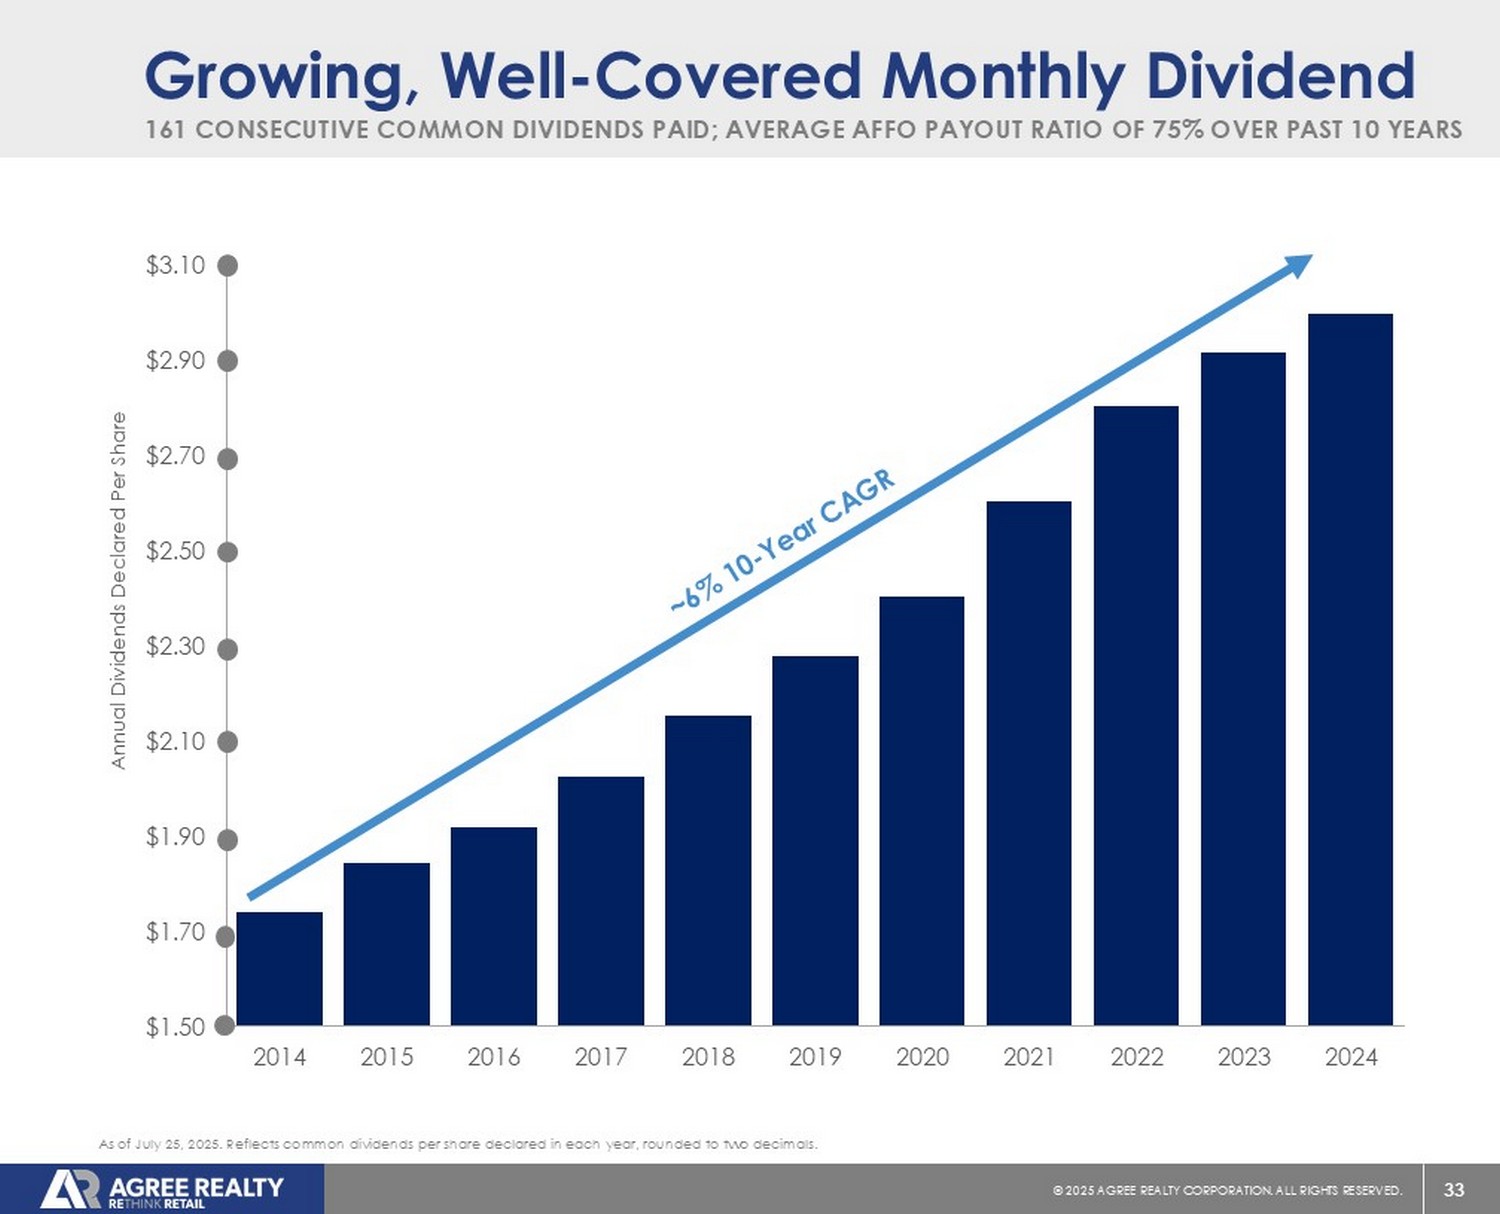
PROFORMA NET DEBT TO RECURRING EBITDA NET DEBT TO RECURRING EBITDA Q4 2024 Q1 2025 Q2 2025 Q3 2022 Q4 2022 Q1 2023 Q2 2023 Q3 2023 Q4 2023 Q1 2024 Q2 2024 Q3 2024 Q2 2022 33 © 20 25 AGREE REALTY CORPORATION . ALL RIGHTS RESERVED. $1.50 $1.70 $1.90 $2.10 $2.30 $2.50 $2.70 $2.90 $3.10 2014 2015 2016 2017 2018 2019 2020 2021 2022 2023 2024 Annual Dividends Declared Per Share 161 CONSECUTIVE COMMON DIVIDENDS PAID; AVERAGE AFFO PAYOUT RATIO OF 75% OVER PAST 10 YEARS Growing, Well - Covered Monthly Dividend As of July 25, 2025. Reflects common dividends per share declared in each year, rounded to two decimals.
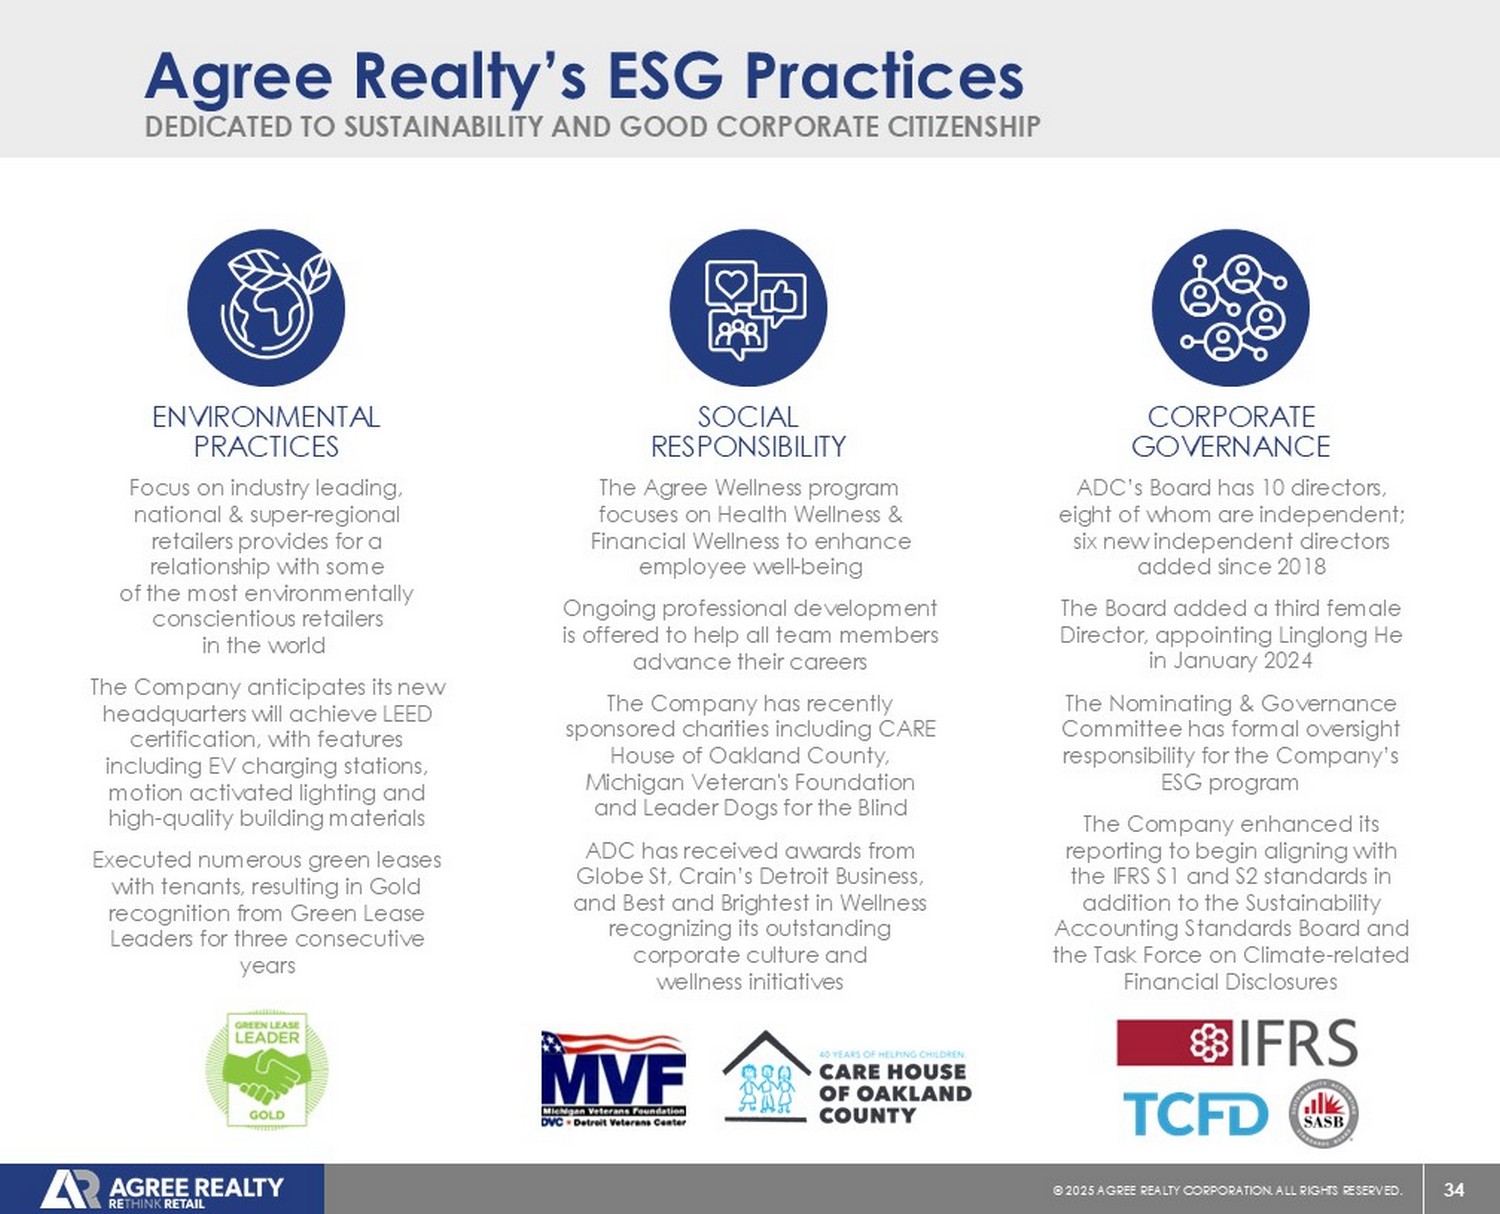
34 © 20 25 AGREE REALTY CORPORATION . ALL RIGHTS RESERVED. The Agree Wellness program focuses on Health Wellness & Financial Wellness to enhance employee well - being Ongoing professional development is offered to help all team members advance their careers The Company has recently sponsored charities including CARE House of Oakland County, Michigan Veteran's Foundation and Leader Dogs for the Blind ADC has received awards from Globe St, Crain’s Detroit Business, and Best and Brightest in Wellness recognizing its outstanding corporate culture and wellness initiatives SOCIAL RESPONSIBILITY DEDICATED TO SUSTAINABILITY AND GOOD CORPORATE CITIZENSHIP Agree Realty’s ESG Practices Focus on industry leading, national & super - regional retailers provides for a relationship with some of the most environmentally conscientious retailers in the world The Company anticipates its new headquarters will achieve LEED certification, with features including EV charging stations, motion activated lighting and high - quality building materials Executed numerous green leases with tenants, resulting in Gold recognition from Green Lease Leaders for three consecutive years ENVIRONMENTAL PRACTICES ADC’s Board has 10 directors, eight of whom are independent; six new independent directors added since 2018 The Board added a third female Director, appointing Linglong He in January 2024 The Nominating & Governance Committee has formal oversight responsibility for the Company’s ESG program The Company enhanced its reporting to begin aligning with the IFRS S1 and S2 standards in addition to the Sustainability Accounting Standards Board and the Task Force on Climate - related Financial Disclosures CORPORATE GOVERNANCE 35 © 20 25 AGREE REALTY CORPORATION . ALL RIGHTS RESERVED. Investment Summary Highlights FORTIFIED BALANCE SHEET HIGHEST - QUALITY RETAIL REAL ESTATE INVESTMENT GRADE ISSUER RATINGS Robust growth trajectory MULTI - YEAR TRACK RECORD OF EXECUTION Well - covered & consistent dividend
36 © 20 25 AGREE REALTY CORPORATION . ALL RIGHTS RESERVED.
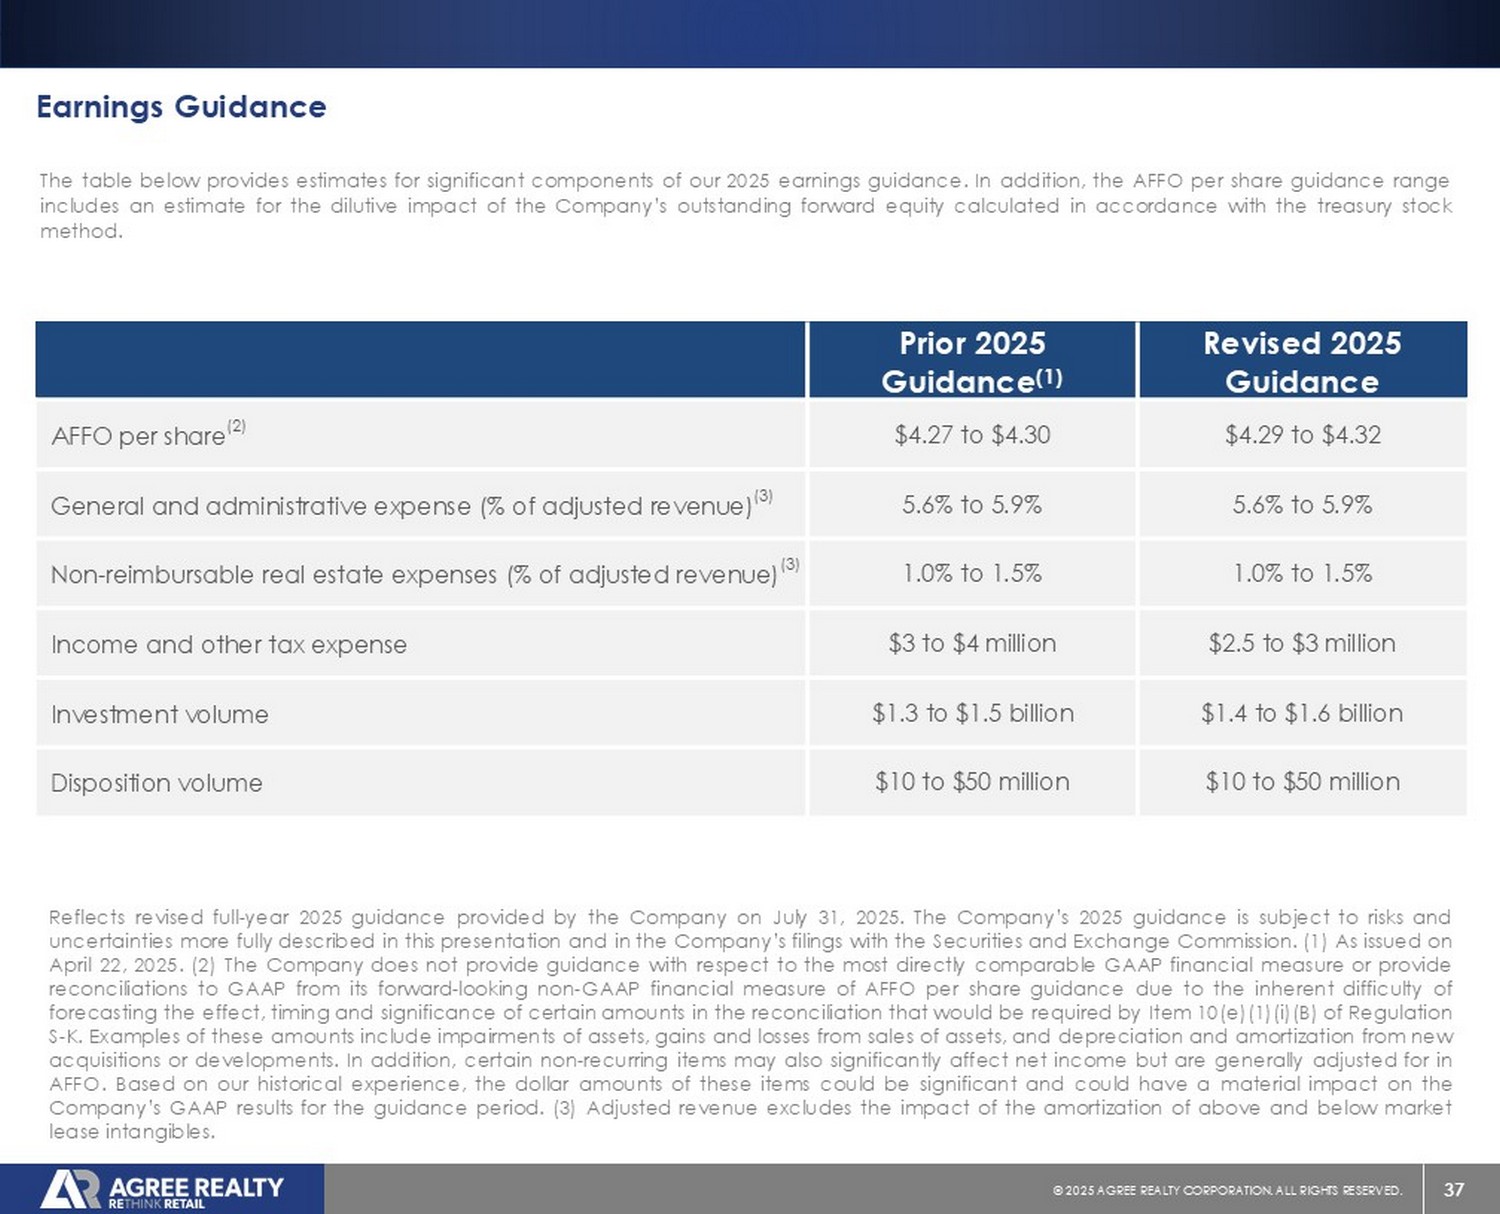
APPENDIX 37 © 20 25 AGREE REALTY CORPORATION . ALL RIGHTS RESERVED. Earnings Guidance Revised 2025 Guidance Prior 2025 Guidance (1) $4.29 to $4.32 $4.27 to $4.30 AFFO per share (2) 5.6% to 5.9% 5.6% to 5.9% General and administrative expense (% of adjusted revenue) (3) 1.0% to 1.5% 1.0% to 1.5% Non - reimbursable real estate expenses (% of adjusted revenue) (3) $2.5 to $3 million $3 to $4 million Income and other tax expense $1.4 to $1.6 billion $1.3 to $1.5 billion Investment volume $10 to $50 million $10 to $50 million Disposition volume Reflects revised full - year 2025 guidance provided by the Company on July 31 , 2025 . The Company’s 2025 guidance is subject to risks and uncertainties more fully described in this presentation and in the Company’s filings with the Securities and Exchange Commission . ( 1 ) As issued on April 22 , 2025 . ( 2 ) The Company does not provide guidance with respect to the most directly comparable GAAP financial measure or provide reconciliations to GAAP from its forward - looking non - GAAP financial measure of AFFO per share guidance due to the inherent difficulty of forecasting the effect, timing and significance of certain amounts in the reconciliation that would be required by Item 10 (e)( 1 )( i )(B) of Regulation S - K . Examples of these amounts include impairments of assets, gains and losses from sales of assets, and depreciation and amortization from new acquisitions or developments . In addition, certain non - recurring items may also significantly affect net income but are generally adjusted for in AFFO . Based on our historical experience, the dollar amounts of these items could be significant and could have a material impact on the Company’s GAAP results for the guidance period . ( 3 ) Adjusted revenue excludes the impact of the amortization of above and below market lease intangibles . The table below provides estimates for significant components of our 2025 earnings guidance . In addition, the AFFO per share guidance range includes an estimate for the dilutive impact of the Company’s outstanding forward equity calculated in accordance with the treasury stock method .
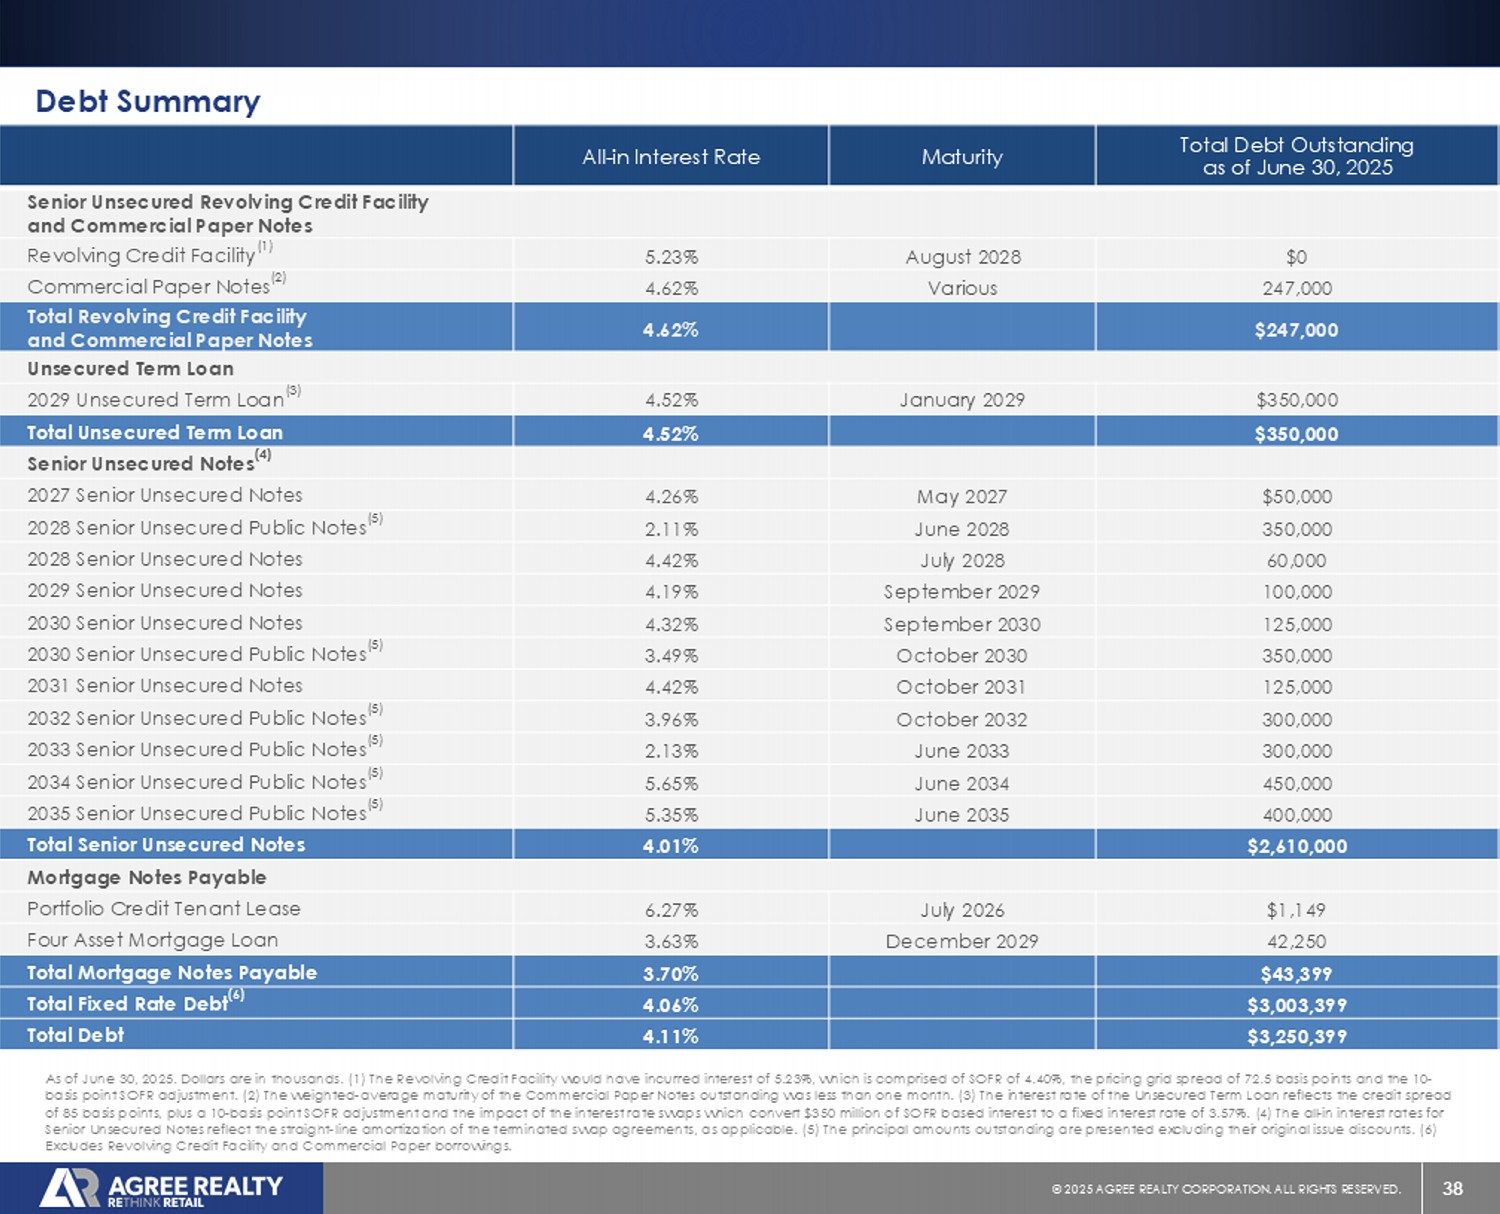
38 © 20 25 AGREE REALTY CORPORATION . ALL RIGHTS RESERVED. Debt Summary Total Debt Outstanding as of June 30, 2025 Maturity All - in Interest Rate Senior Unsecured Revolving Credit Facility and Commercial Paper Notes $0 August 2028 5.23% Revolving Credit Facility (1) $247,000 Various 4.62% Commercial Paper Notes (2) $247,000 4.62% Total Revolving Credit Facility and Commercial Paper Notes Unsecured Term Loan $350,000 January 2029 4.52% 2029 Unsecured Term Loan (3) $350,000 4.52% Total Unsecured Term Loan Senior Unsecured Notes (4) 50,000 May 2027 4.26% 2027 Senior Unsecured Notes 350,000 June 2028 2.11% 2028 Senior Unsecured Public Notes (5) 60,000 July 2028 4.42% 2028 Senior Unsecured Notes 100,000 September 2029 4.19% 2029 Senior Unsecured Notes 125,000 September 2030 4.32% 2030 Senior Unsecured Notes 350,000 October 2030 3.49% 2030 Senior Unsecured Public Notes (5) 125,000 October 2031 4.42% 2031 Senior Unsecured Notes 300,000 October 2032 3.96% 2032 Senior Unsecured Public Notes (5) 300,000 June 2033 2.13% 2033 Senior Unsecured Public Notes (5) 450,000 June 2034 5.65% 2034 Senior Unsecured Public Notes (5) 400,000 June 2035 5.35% 2035 Senior Unsecured Public Notes (5) $2,610,000 4.01% Total Senior Unsecured Notes Mortgage Notes Payable $1,149 July 2026 6.27% Portfolio Credit Tenant Lease 42,250 December 2029 3.63% Four Asset Mortgage Loan $43,399 3.70% Total Mortgage Notes Payable $3,003,399 4.06% Total Fixed Rate Debt (6) $3,250,399 4.11% Total Debt As of June 30, 2025. Dollars are in thousands. (1) The Revolving Credit Facility would have incurred interest of 5.23%, which is comprised of SOFR of 4.40%, the pricing grid spread of 72.5 basis points and the 10 - basis point SOFR adjustment. (2) The weighted - average maturity of the Commercial Paper Notes outstanding was less than one month . (3) The interest rate of the Unsecured Term Loan reflects the credit spread of 85 basis points, plus a 10 - basis point SOFR adjustment and the impact of the interest rate swaps which convert $350 million o f SOFR based interest to a fixed interest rate of 3.57%. (4) The all - in interest rates for Senior Unsecured Notes reflect the straight - line amortization of the terminated swap agreements, as applicable. (5) The principa l amounts outstanding are presented excluding their original issue discounts. (6) Excludes Revolving Credit Facility and Commercial Paper borrowings.
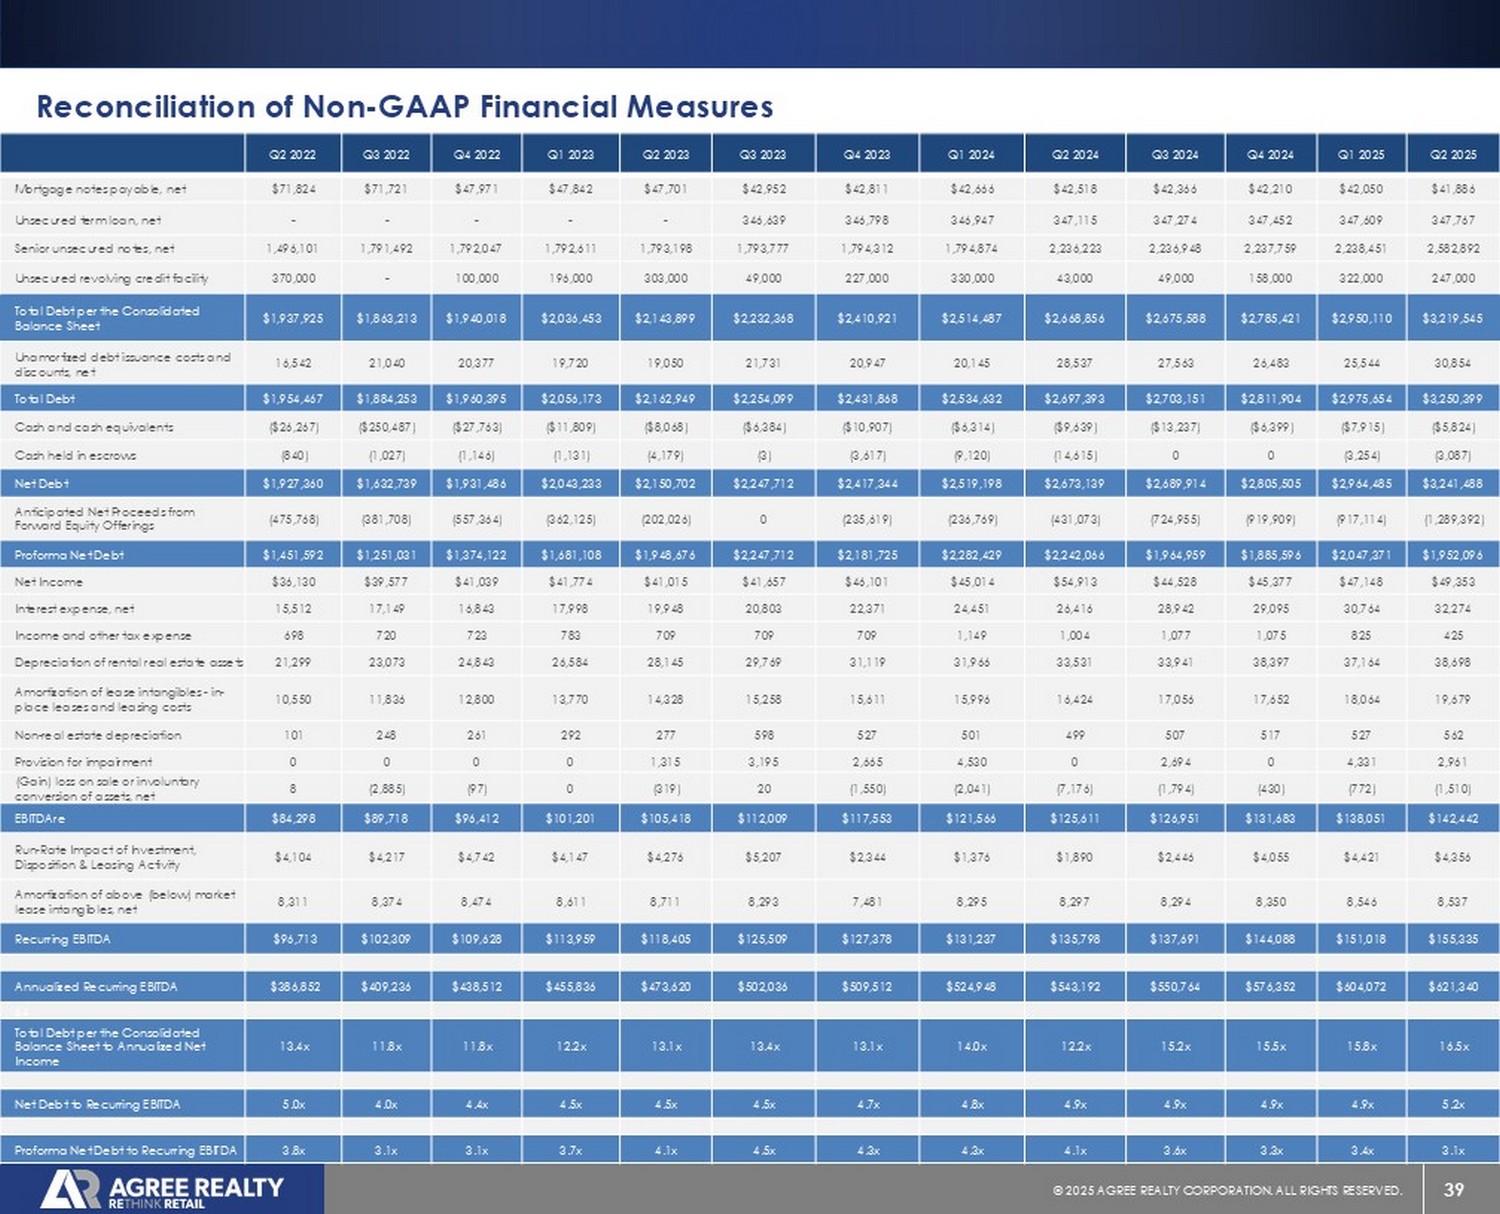
39 © 20 25 AGREE REALTY CORPORATION . ALL RIGHTS RESERVED. Reconciliation of Non - GAAP Financial Measures Q2 2025 Q1 2025 Q4 2024 Q3 2024 Q2 2024 Q1 2024 Q4 2023 Q3 2023 Q2 2023 Q1 2023 Q4 2022 Q3 2022 Q2 2022 $41,886 $42,050 $42,210 $42,366 $42,518 $42,666 $42,811 $42,952 $47,701 $47,842 $47,971 $71,721 $71,824 Mortgage notes payable, net 347,767 347,609 347,452 347,274 347,115 346,947 346,798 346,639 - - - - - Unsecured term loan, net 2,582,892 2,238,451 2,237,759 2,236,948 2,236,223 1,794,874 1,794,312 1,793,777 1,793,198 1,792,611 1,792,047 1,791,492 1,496,101 Senior unsecured notes, net 247,000 322,000 158,000 49,000 43,000 330,000 227,000 49,000 303,000 196,000 100,000 - 370,000 Unsecured revolving credit facility $3,219,545 $2,950,110 $2,785,421 $2,675,588 $2,668,856 $2,514,487 $2,410,921 $2,232,368 $2,143,899 $2,036,453 $1,940,018 $1,863,213 $1,937,925 Total Debt per the Consolidated Balance Sheet 30,854 25,544 26,483 27,563 28,537 20,145 20,947 21,731 19,050 19,720 20,377 21,040 16,542 Unamortized debt issuance costs and discounts, net $3,250,399 $2,975,654 $2,811,904 $2,703,151 $2,697,393 $2,534,632 $2,431,868 $2,254,099 $2,162,949 $2,056,173 $1,960,395 $1,884,253 $1,954,467 Total Debt ($5,824) ($7,915) ($6,399) ($13,237) ($9,639) ($6,314) ($10,907) ($6,384) ($8,068) ($11,809) ($27,763) ($250,487) ($26,267) Cash and cash equivalents (3,087) (3,254) 0 0 (14,615) (9,120) (3,617) (3) (4,179) (1,131) (1,146) (1,027) (840) Cash held in escrows $3,241,488 $2,964,485 $2,805,505 $2,689,914 $2,673,139 $2,519,198 $2,417,344 $2,247,712 $2,150,702 $2,043,233 $1,931,486 $1,632,739 $1,927,360 Net Debt (1,289,392) (917,114) (919,909) (724,955) (431,073) (236,769) (235,619) 0 (202,026) (362,125) (557,364) (381,708) (475,768) Anticipated Net Proceeds from Forward Equity Offerings $1,952,096 $2,047,371 $1,885,596 $1,964,959 $2,242,066 $2,282,429 $2,181,725 $2,247,712 $1,948,676 $1,681,108 $1,374,122 $1,251,031 $1,451,592 Proforma Net Debt $49,353 $47,148 $45,377 $44,528 $54,913 $45,014 $46,101 $41,657 $41,015 $41,774 $41,039 $39,577 $36,130 Net Income 32,274 30,764 29,095 28,942 26,416 24,451 22,371 20,803 19,948 17,998 16,843 17,149 15,512 Interest expense, net 425 825 1,075 1,077 1,004 1,149 709 709 709 783 723 720 698 Income and other tax expense 38,698 37,164 38,397 33,941 33,531 31,966 31,119 29,769 28,145 26,584 24,843 23,073 21,299 Depreciation of rental real estate assets 19,679 18,064 17,652 17,056 16,424 15,996 15,611 15,258 14,328 13,770 12,800 11,836 10,550 Amortization of lease intangibles - in - place leases and leasing costs 562 527 517 507 499 501 527 598 277 292 261 248 101 Non - real estate depreciation 2,961 4,331 0 2,694 0 4,530 2,665 3,195 1,315 0 0 0 0 Provision for impairment (1,510) (772) (430) (1,794) (7,176) (2,041) (1,550) 20 (319) 0 (97) (2,885) 8 (Gain) loss on sale or involuntary conversion of assets, net $142,442 $138,051 $131,683 $126,951 $125,611 $121,566 $117,553 $112,009 $105,418 $101,201 $96,412 $89,718 $84,298 EBITDAre $4,356 $4,421 $4,055 $2,446 $1,890 $1,376 $2,344 $5,207 $4,276 $4,147 $4,742 $4,217 $4,104 Run - Rate Impact of Investment, Disposition & Leasing Activity 8,537 8,546 8,350 8,294 8,297 8,295 7,481 8,293 8,711 8,611 8,474 8,374 8,311 Amortization of above (below) market lease intangibles, net $155,335 $151,018 $144,088 $137,691 $135,798 $131,237 $127,378 $125,509 $118,405 $113,959 $109,628 $102,309 $96,713 Recurring EBITDA $621,340 $604,072 $576,352 $550,764 $543,192 $524,948 $509,512 $502,036 $473,620 $455,836 $438,512 $409,236 $386,852 Annualized Recurring EBITDA 64 16.5x 15.8x 15.5x 15.2x 12.2x 14.0x 13.1x 13.4x 13.1x 12.2x 11.8x 11.8x 13.4x Total Debt per the Consolidated Balance Sheet to Annualized Net Income 5.2x 4.9x 4.9x 4.9x 4.9x 4.8x 4.7x 4.5x 4.5x 4.5x 4.4x 4.0x 5.0x Net Debt to Recurring EBITDA 3.1x 3.4x 3.3x 3.6x 4.1x 4.3x 4.3x 4.5x 4.1x 3.7x 3.1x 3.1x 3.8x Proforma Net Debt to Recurring EBITDA 40 © 20 25 AGREE REALTY CORPORATION . ALL RIGHTS RESERVED. 2024 2023 2022 2021 2020 2019 2018 2017 2016 2015 2014 $189,832 $170,547 $153,035 $122,876 $91,972 $80,763 $58,798 $58,790 $45,797 $39,762 $18,913 Net Income (7,437) (7,437) (7,437) (2,148) 0 0 0 0 0 0 0 Series A Preferred Stock Dividends $182,395 $163,110 $145,598 $120,728 $91,972 $80,763 $58,798 $58,790 $45,797 $39,762 $18,913 Net Income attributable to OP Common Unitholders $137,835 $115,617 $88,685 $66,732 $48,367 $34,349 $24,553 $19,507 $15,200 $11,466 $8,362 Depreciation of rental real estate assets 67,128 58,967 44,107 28,379 17,882 11,071 8,271 7,076 8,135 4,957 2,616 Amortization of lease intangibles - in - place leases and leasing costs 7,224 7,175 1,015 1,919 4,137 1,609 2,319 0 0 0 3,020 Provision for impairment (11,441) (1,849) (5,258) (15,111) (8,004) (13,306) (11,180) (14,193) (9,964) (12,135) 405 (Gain) loss on sale or involuntary conversion of assets, net $383,141 $343,020 $274,147 $202,647 $154,354 $114,486 $82,761 $71,180 $59,168 $44,050 $33,316 Funds from Operations - OP Common Unitholders $0 $0 $0 $14,614 $0 $0 $0 $0 $0 $0 $0 Loss on extinguishment of debt & settlement of related hedges 33,571 33,430 33,563 24,284 15,885 13,501 10,668 5,091 0 0 0 Amortization of above (below) market lease intangibles $416,712 $376,450 $307,710 $241,545 $170,239 $127,987 $93,429 $76,271 $59,168 $44,050 $33,316 Core Funds from Operations - OP Common Unitholders ($12,711) ($12,142) ($13,176) ($11,857) ($7,818) ($7,093) ($4,648) ($3,548) ($3,582) ($2,450) ($1,416) Straight - line accrued rent 10,805 8,338 6,464 5,467 4,995 4,106 3,227 2,589 2,441 1,992 1,987 Stock based compensation expense 5,988 4,403 3,141 1,197 826 706 578 574 516 494 398 Amortization of financing costs 0 0 0 0 0 0 0 0 333 180 0 Loss on extinguishment of debt 2,024 1,693 778 618 509 283 146 78 72 62 123 Non - real estate depreciation 0 0 0 0 0 (475) 0 (230) (541) (463) (463) Other $422,818 $378,742 $304,917 $236,970 $168,751 $125,514 $92,732 $75,734 $58,407 $43,865 $33,945 Adjusted Funds from Operations - OP Common Unitholders $3.75 $3.58 $3.45 $3.00 $2.93 $2.75 $2.53 $2.54 $2.54 $2.39 $2.18 FFO Per Common Share and OP Unit - Diluted $4.08 $3.93 $3.87 $3.58 $3.23 $3.08 $2.85 $2.72 $2.54 $2.39 $2.18 Core FFO Per Common Share and OP Unit - Diluted $4.14 $3.95 $3.83 $3.51 $3.20 $3.02 $2.83 $2.70 $2.51 $2.38 $2.22 Adjusted FFO Per Common Share and OP Unit - Diluted 102,223,923 95,785,031 79,512,005 67,486,698 52,744,353 41,571,233 32,748,741 28,047,966 23,307,418 18,413,034 15,314,514 Weighted Average Number of Common Shares and OP Units Outstanding - Diluted Reconciliation of Net Income to FFO, Core FFO and AFFO Note: The Company began reporting Core FFO in 2018.
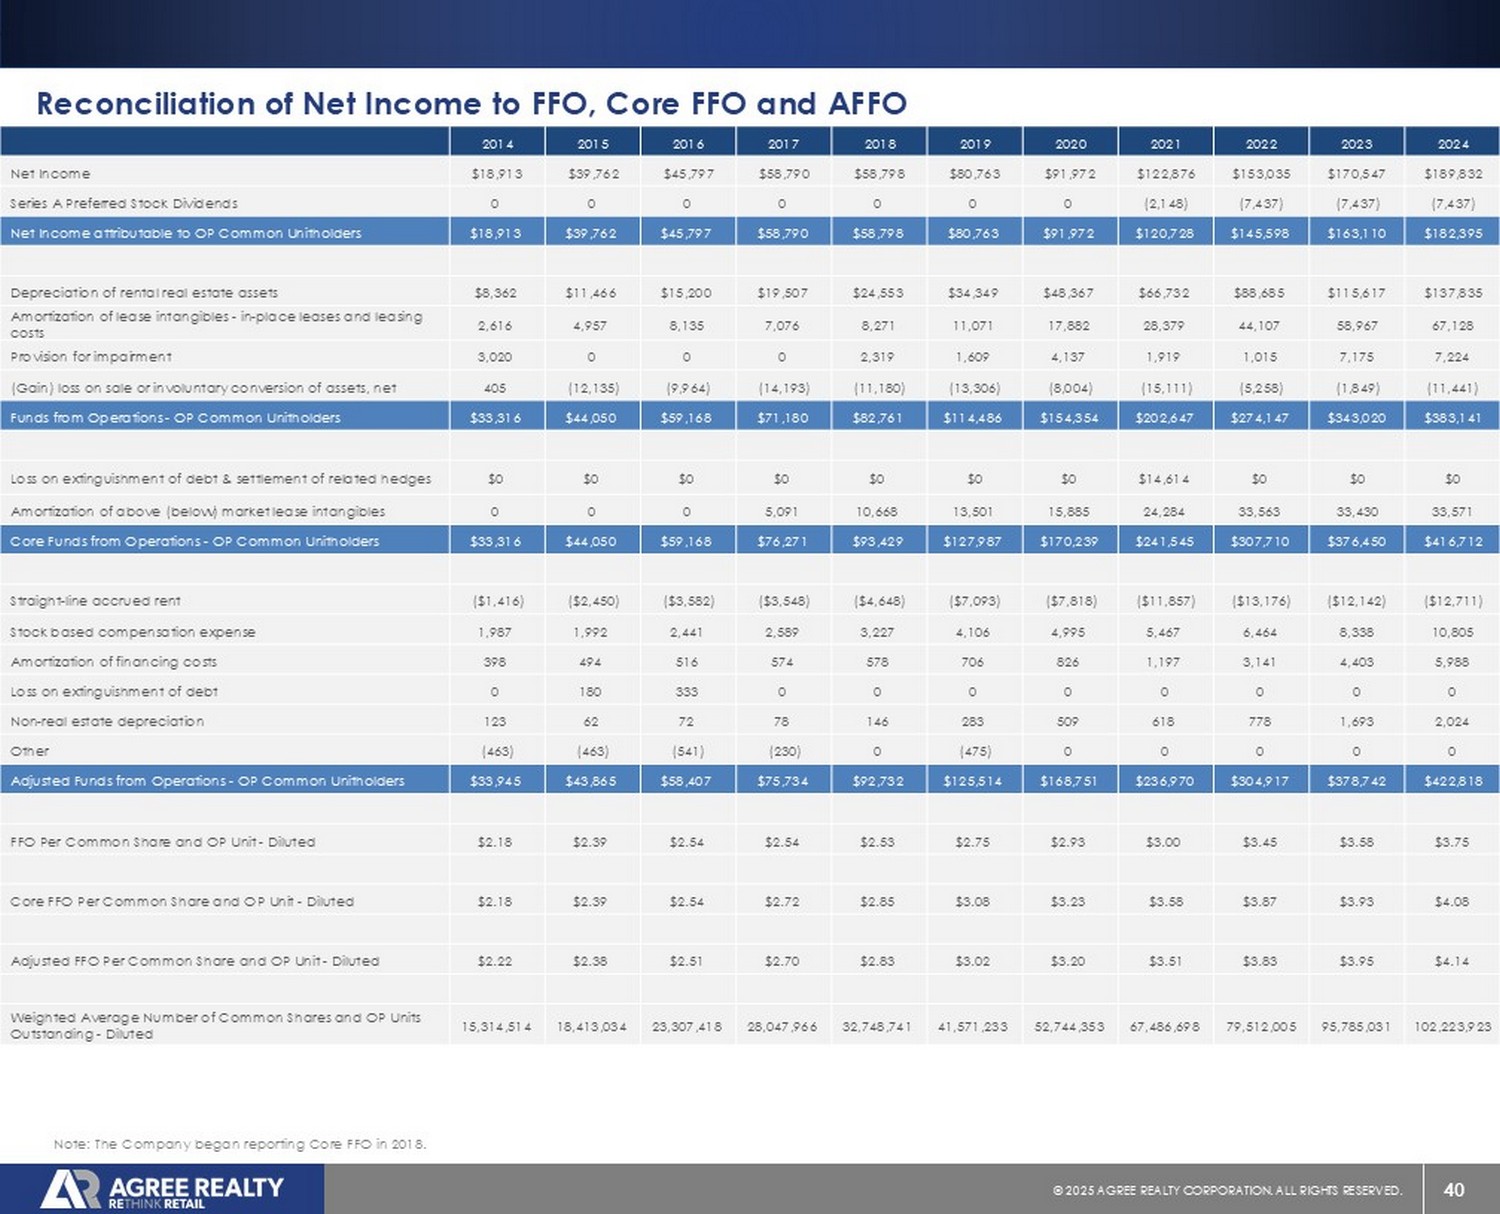
41 © 20 25 AGREE REALTY CORPORATION . ALL RIGHTS RESERVED. Forward - Looking Statements This presentation contains forward - looking statements within the meaning of Section 27 A of the Securities Act of 1933 , as amended (the “Securities Act”) and Section 21 E of the Securities Exchange Act of 1934 , as amended (the “Exchange Act”) . The Company intends such forward - looking statements to be covered by the safe harbor provisions for forward - looking statements contained in the Private Securities Litigation Reform Act of 1995 and includes this statement for purposes of complying with these safe harbor provisions . Forward - looking statements are generally identifiable by use of forward - looking terminology such as “may,” “can,” “will,” “should,” “potential,” “intend,” “expect,” “seek,” “anticipate,” “estimate,” “approximately,” “believe,” “could,” “project,” “predict,” “forecast,” “continue,” “assume,” “plan,” references to “outlook” or other similar words or expressions . Forward - looking statements, including statements regarding our financial projections and operations, are based on certain assumptions and can include future expectations, future economic, competitive and market conditions, future plans and strategies, financial and operating projections and forecasts and other forward - looking information and estimates . These forward - looking statements are subject to various risks and uncertainties, many of which are beyond the Company’s control, which could cause actual results to differ materially from such statements . Certain factors could occur that might cause actual results to vary, including the potential adverse effect of ongoing worldwide economic uncertainties, disruptions in the banking system and financial markets, and increased inflation on the financial condition, results of operations, cash flows and performance of the Company and its tenants, the real estate market and the global economy and financial markets, the general deterioration in national economic conditions, tenant financial health, property acquisitions and the timing of these investments and acquisitions, weakening of real estate markets, decreases in the availability of credit, increases in interest rates, adverse changes in the retail industry, the Company’s continuing ability to qualify as a REIT and other risks and uncertainties as described in greater detail in the Company’s filings with the Securities and Exchange Commission (the “SEC”), including, without limitation, the Company’s Annual Report on Form 10 - K and subsequent Quarterly Reports on Form 10 - Q . Except as required by law, the Company disclaims any obligation to update any forward - looking statements, whether as a result of new information, future events or otherwise . For further information about the Company’s business and financial results, please refer to the “Management’s Discussion and Analysis of Financial Condition and Results of Operations” and “Risk Factors” sections of the Company’s SEC filings, including, but not limited to, its Annual Report on Form 10 - K and Quarterly Reports on Form 10 - Q, copies of which may be obtained at the Investors section of the Company’s website at www . agreerealty . com . Most information in this presentation is as of June 30 , 2025 , unless otherwise noted . The Company undertakes no duty to update the statements in this presentation to conform the statements to actual results or changes in the Company’s expectations .
42 © 20 25 AGREE REALTY CORPORATION . ALL RIGHTS RESERVED. Non - GAAP Financial Measures This presentation includes a non - GAAP financial measure, Net Debt to Recurring EBITDA, which is presented on an actual and proforma basis . A reconciliation of this non - GAAP financial measure to the most directly comparable GAAP measure is included on slide 39 . The components of this ratio and their use and utility to management are described further in the section below . Components of Net Debt to Recurring EBITDA EBITDAre is defined by Nareit to mean net income computed in accordance with GAAP, plus interest expense, income tax expense, depreciation and amortization, any gains (or losses) from sales of real estate assets and/or changes in control, any impairment charges on depreciable real estate assets, and after adjustments for unconsolidated partnerships and joint ventures . The Company considers the non - GAAP measure of EBITDAre to be a key supplemental measure of the Company's performance and should be considered along with, but not as an alternative to, net income or loss as a measure of the Company's operating performance . The Company considers EBITDAre a key supplemental measure of the Company's operating performance because it provides an additional supplemental measure of the Company's performance and operating cash flow that is widely known by industry analysts, lenders and investors . The Company’s calculation of EBITDAre may not be comparable to EBITDAre reported by other REITs that interpret the Nareit definition differently than the Company . Recurring EBITDA The Company defines Recurring EBITDA as EBITDAre with the addback of noncash amortization of above - and below - market lease intangibles, and after adjustments for the run - rate impact of the Company's investment and disposition activity for the period presented, as well as adjustments for non - recurring benefits or expenses . The Company considers the non - GAAP measure of Recurring EBITDA to be a key supplemental measure of the Company's performance and should be considered along with, but not as an alternative to, net income or loss as a measure of the Company's operating performance . The Company considers Recurring EBITDA a key supplemental measure of the Company's operating performance because it represents the Company's earnings run rate for the period presented and because it is widely followed by industry analysts, lenders and investors . Our Recurring EBITDA may not be comparable to Recurring EBITDA reported by other companies that have a different interpretation of the definition of Recurring EBITDA . Our ratio of net debt to Recurring EBITDA is used by management as a measure of leverage and may be useful to investors in understanding the Company’s ability to service its debt, as well as assess the borrowing capacity of the Company . Our ratio of net debt to Recurring EBITDA is calculated by taking annualized Recurring EBITDA and dividing it by our net debt per the consolidated balance sheet . Total Debt and Net Debt The Company defines Total Debt as debt per the consolidated balance sheet excluding unamortized debt issuance costs, original issue discounts and debt discounts . Net Debt is defined as Total Debt less cash, cash equivalents and cash held in escrows . The Company considers the non - GAAP measures of Total Debt and Net Debt to be key supplemental measures of the Company's overall liquidity, capital structure and leverage because they provide industry analysts, lenders and investors useful information in understanding our financial condition . The Company's calculation of Total Debt and Net Debt may not be comparable to Total Debt and Net Debt reported by other REITs that interpret the definitions differently than the Company . The Company presents Net Debt on both an actual and proforma basis, assuming the net proceeds of the Forward Offerings (see below) are used to pay down debt . The Company believes the proforma measure may be useful to investors in understanding the potential effect of the Forward Offerings on the Company's capital structure, its future borrowing capacity, and its ability to service its debt . Anticipated Net Proceeds from Outstanding Forwards Since the first quarter of 2018 , the Company has utilized forward sale agreements to sell shares of common stock . Selling common stock through forward sale agreements enables the Company to set the price of such shares upon pricing the offering (subject to certain adjustments) while delaying the issuance of such shares and the receipt of the net proceeds by the Company . Given the Company’s frequent use of forward sale agreements, the Company considers the non - GAAP measure of Anticipated Net Proceeds from Outstanding Forwards to be a key supplemental measure of the Company's overall liquidity, capital structure and leverage . The Company defines Anticipated Net Proceeds from Outstanding Forwards as the number of shares outstanding under forward sale agreements at the end of each quarter, multiplied by the applicable forward sale price for each agreement, respectively .
43 © 20 25 AGREE REALTY CORPORATION . ALL RIGHTS RESERVED. Non - GAAP Financial Measures This presentation also includes the non - GAAP measures of Annualized Base Rent (“ABR”), Annualized Net Income, Weighted - Average Capitalization Rate, Funds From Operations (“FFO” or “ Nareit FFO”), Core Funds From Operations (“Core FFO”) and Adjusted Funds From Operations (“AFFO”) . FFO, Core FFO and AFFO are reconciled to the most directly comparable GAAP measure on slide 40 . Annualized Base Rent (“ABR”) ABR represents the annualized amount of contractual minimum rent required by tenant lease agreements, computed on a straight - line basis . ABR is not, and is not intended to be, a presentation in accordance with GAAP . The Company believes annualized contractual minimum rent is useful to management, investors, and other interested parties in analyzing concentrations and leasing activity . Annualized Net Income represents Net Income for the respective quarter, on an annualized basis . Weighted - Average Capitalization Rate The Company defines the “weighted - average capitalization rate” for acquisitions and dispositions as the sum of contractual fixed annual rents computed on a straight - line basis over the primary lease terms and anticipated annual net tenant recoveries, divided by the purchase and sale prices for occupied properties . Components of Funds from Operations, Core Funds from Operations, and Adjusted Funds from Operations Funds from Operations (“FFO” or “ Nareit FFO”) is defined by the National Association of Real Estate Investment Trusts, Inc . (“ Nareit ”) to mean net income computed in accordance with GAAP, excluding gains (or losses) from sales of real estate assets and/or changes in control, plus real estate related depreciation and amortization and any impairment charges on depreciable real estate assets, and after adjustments for unconsolidated partnerships and joint ventures . Historical cost accounting for real estate assets in accordance with GAAP implicitly assumes that the value of real estate assets diminishes predictably over time . Since real estate values instead have historically risen or fallen with market conditions, most real estate industry investors consider FFO to be helpful in evaluating a real estate company’s operations . FFO should not be considered an alternative to net income as the primary indicator of the Company’s operating performance, or as an alternative to cash flow as a measure of liquidity . Further, while the Company adheres to the Nareit definition of FFO, its presentation of FFO is not necessarily comparable to similarly titled measures of other REITs due to the fact that all REITs may not use the same definition . Core Funds from Operations (“Core FFO”) The Company defines Core FFO as Nareit FFO with the addback of ( i ) noncash amortization of acquisition purchase price related to above - and below - market lease intangibles and discount on assumed debt and (ii) certain infrequently occurring items that reduce or increase net income in accordance with GAAP . Management believes that its measure of Core FFO facilitates useful comparison of performance to its peers who predominantly transact in sale - leaseback transactions and are thereby not required by GAAP to allocate purchase price to lease intangibles . Unlike many of its peers, the Company has acquired the substantial majority of its net - leased properties through acquisitions of properties from third parties or in connection with the acquisitions of ground leases from third parties . Core FFO should not be considered an alternative to net income as the primary indicator of the Company’s operating performance, or as an alternative to cash flow as a measure of liquidity . Further, the Company’s presentation of Core FFO is not necessarily comparable to similarly titled measures of other REITs due to the fact that all REITs may not use the same definition . Adjusted Funds from Operations (“AFFO”) is a non - GAAP financial measure of operating performance used by many companies in the REIT industry . AFFO further adjusts FFO and Core FFO for certain non - cash items that reduce or increase net income computed in accordance with GAAP . Management considers AFFO a useful supplemental measure of the Company’s performance, however, AFFO should not be considered an alternative to net income as an indication of its performance, or to cash flow as a measure of liquidity or ability to make distributions . The Company’s computation of AFFO may differ from the methodology for calculating AFFO used by other equity REITs, and therefore may not be comparable to such other REITs .
44 © 20 25 AGREE REALTY CORPORATION . ALL RIGHTS RESERVED. CONTACT PETER COUGHENOUR Chief Financial Officer (248) 737 - 4190 investors@agreerealty.com