UNITED STATES
SECURITIES AND EXCHANGE COMMISSION
Washington, D.C. 20549
FORM 8-K
CURRENT REPORT
Pursuant to Section 13 or 15(d) of The Securities Exchange Act of 1934
June 4, 2025
Date of Report (date of earliest event reported)
Valmont Industries, Inc.
(Exact name of registrant as specified in its charter)
Delaware
(State or other jurisdiction of incorporation)
| 1-31429 | 47-0351813 |
| (Commission File Number) | (I.R.S. Employer Identification No.) |
| 15000 Valmont Plaza | 68154 |
| Omaha NE | |
| (Address of Principal Executive Offices) | (Zip Code) |
(402) 963-1000
Registrant's telephone number, including area code
(Former name or former address, if changed since last report.)
Check the appropriate box below if the Form 8-K filing is intended to simultaneously satisfy the filing obligation of the registrant under any of the following provisions (see General Instruction A.2. below):
| ¨ | Written communications pursuant to Rule 425 under the Securities Act (17 CFR 230.425) |
| ¨ | Soliciting material pursuant to Rule 14a-12 under the Exchange Act (17 CFR 240.14a-12) |
| ¨ | Pre-commencement communications pursuant to Rule 14d-2(b) under the Exchange Act (17 CFR 240.14d-2(b)) |
| ¨ | Pre-commencement communications pursuant to Rule 13e-4(c) under the Exchange Act (17 CFR 240.13e-4(c)) |
Securities registered pursuant to Section 12(b) of the Act:
| Title of each class | Trading Symbol(s) | Name of each exchange on which registered | ||
| Common Stock, $1.00 par value | VMI | New York Stock Exchange |
Indicate by check mark whether the registrant is an emerging growth company as defined in Rule 405 of the Securities Act of 1933 (§230.405 of this chapter) or Rule 12b-2 of the Securities Exchange Act of 1934 (§240.12b-2 of this chapter).
Emerging growth company ¨
If an emerging growth company, indicate by check mark if the registrant has elected not to use the extended transition period for complying with any new or revised financial accounting standards provided pursuant to Section 13(a) of the Exchange Act. ¨
| Item 7.01 | Regulation FD Disclosure. |
On Wednesday, June 4, 2025, Valmont Industries, Inc. (the “Company”) will participate in the William Blair & Company 45th Annual Growth Stock Conference in Chicago, IL. As previously announced a live webcast of the presentation will be available online at investors.valmont.com by clicking on the Events and Presentations link. A copy of the presentation to be used by the Company during the webcast is furnished with this Form 8-K as Exhibit 99.1 and is incorporated herein by reference.
The information in Item 7.01 is being furnished and shall not be deemed “filed” for the purpose of Section 18 of the Securities Exchange Act of 1934, as amended (the “Exchange Act”), or otherwise subject to the liabilities of that section. The information in Item 7.01 shall not be deemed incorporated by reference in any filing under the Securities Act of 1933, as amended, or the Exchange Act, except as shall be expressly set forth by specific reference in such a filing.
| Item 9.01. | Financial Statements and Exhibits. |
(d) Exhibits.
| Exhibit No. | Description | |
| 99.1 | Presentation Slides | |
| 104 | Cover Page Interactive File (the cover page XBRL tags are embedded in the Inline XBRL document) |
SIGNATURES
Pursuant to the requirements of the Securities Exchange Act of 1934, the registrant has duly caused this report to be signed on its behalf by the undersigned hereunto duly authorized.
| Valmont Industries, Inc. | |||
| Date: June 4, 2025 | |||
| By: | /s/ Thomas Liguori | ||
| Name: | Thomas Liguori | ||
| Title: | Executive Vice President and Chief Financial Officer | ||
Exhibit 99.1
|
Valmont® © 2025 Industries, Inc. William Blair 45th Annual Growth Stock Conference June 4, 2025 |
|
These slides (and the accompanying oral discussion) contain forward-looking statements within the meaning of the Private Securities Litigation Reform Act of 1995. These statements are based on assumptions made by management, considering its experience in the industries where Valmont operates, perceptions of historical trends, current conditions, expected future developments, and other relevant factors. It is important to note that these statements are not guarantees of future performance or results. They involve risks, uncertainties (some of which are beyond Valmont’s control), and assumptions. While management believes these forward-looking statements are based on reasonable assumptions, numerous factors could cause actual results to differ materially from those anticipated. These factors include, among other things, risks described in Valmont’s reports to the Securities and Exchange Commission (“SEC”), the Company’s actual cash flows and net income, future economic and market circumstances, industry conditions, company performance and financial results, operational efficiencies, availability and price of raw materials, availability and market acceptance of new products, product pricing, domestic and international competitive environments, geopolitical risks, and actions and policy changes by domestic and foreign governments. The Company cautions that any forward-looking statements in this release are made as of its publication date and does not undertake to update these statements, except as required by law. Disclosure Regarding Forward-Looking Statements 2 Valmont Industries, Inc. | June 4, 2025 |
|
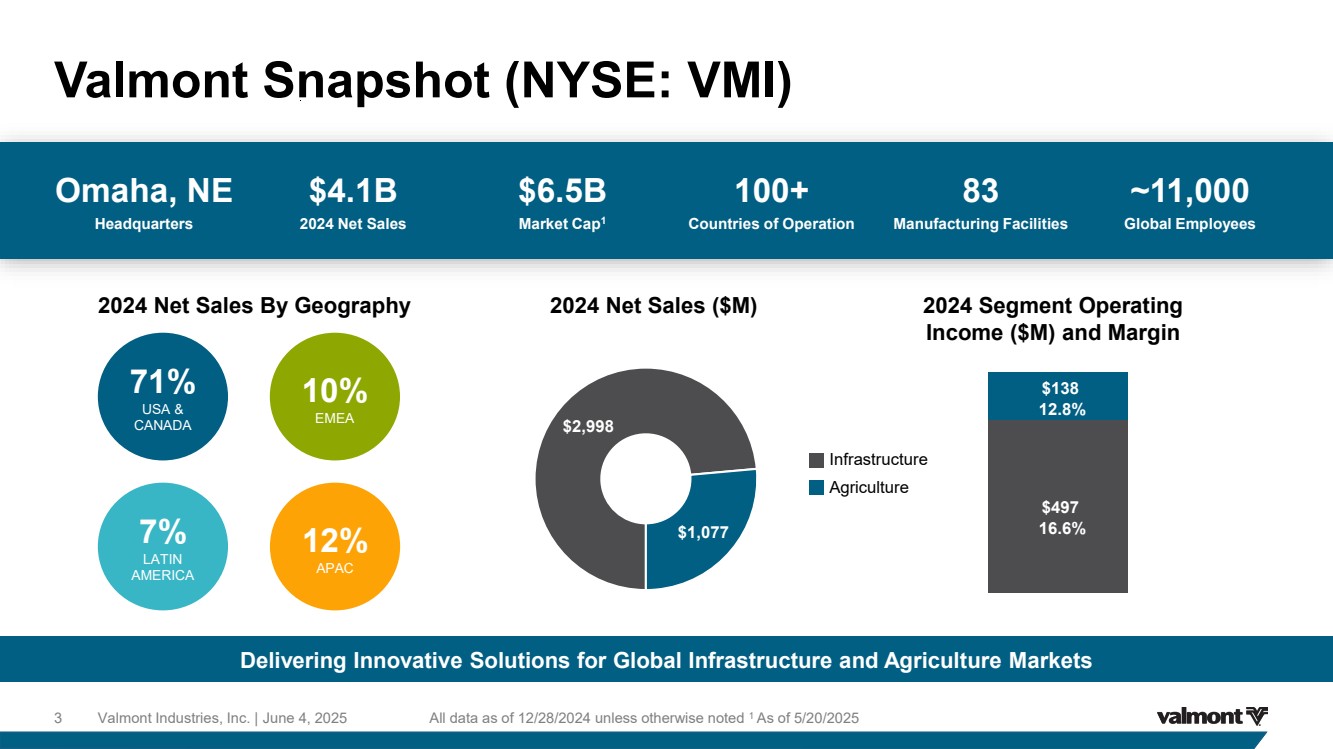
Valmont Industries, Inc. | Valmont Snapshot (NYSE: VMI) June 4, 2025 $4.1B 2024 Net Sales Omaha, NE Headquarters $6.5B Market Cap1 ~11,000 Global Employees 100+ Countries of Operation 83 Manufacturing Facilities 2024 Net Sales ($M) 2024 Segment Operating Income ($M) and Margin 71% USA & CANADA 7% LATIN AMERICA 10% EMEA 12% APAC Delivering Innovative Solutions for Global Infrastructure and Agriculture Markets 2024 Net Sales By Geography All data as of 12/28/2024 unless otherwise noted 1 As of 5/20/2025 $2,998 $1,077 $497 $138 Infrastructure Agriculture 16.6% 12.8% 3 |
|
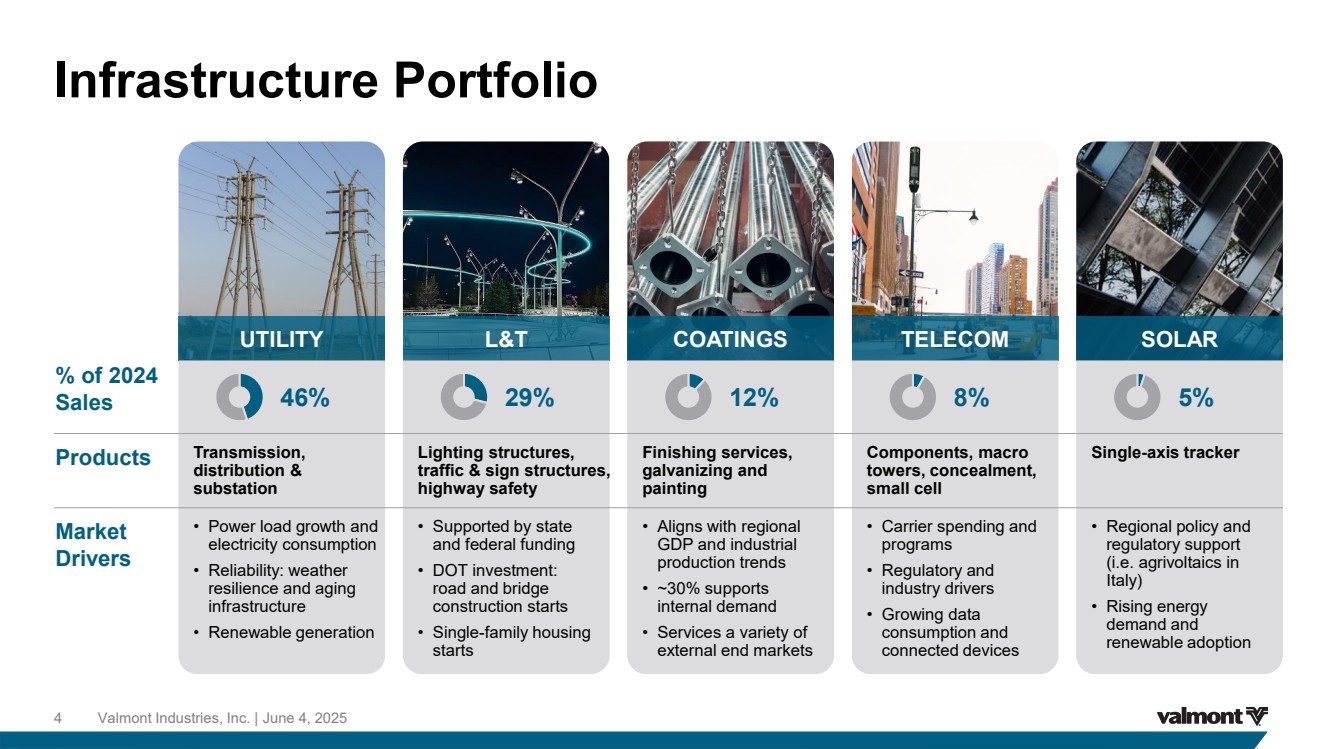
Valmont Industries, Inc. | Infrastructure Portfolio 4 June 4, 2025 UTILITY L&T COATINGS TELECOM SOLAR Products Transmission, distribution & substation Finishing services, galvanizing and painting Components, macro towers, concealment, small cell Single-axis tracker 46% 29% 12% 8% 5% Market Drivers • Power load growth and electricity consumption • Reliability: weather resilience and aging infrastructure • Renewable generation • Supported by state and federal funding • DOT investment: road and bridge construction starts • Single-family housing starts • Aligns with regional GDP and industrial production trends • ~30% supports internal demand • Services a variety of external end markets • Carrier spending and programs • Regulatory and industry drivers • Growing data consumption and connected devices • Regional policy and regulatory support (i.e. agrivoltaics in Italy) • Rising energy demand and renewable adoption % of 2024 Sales Lighting structures, traffic & sign structures, highway safety |
|
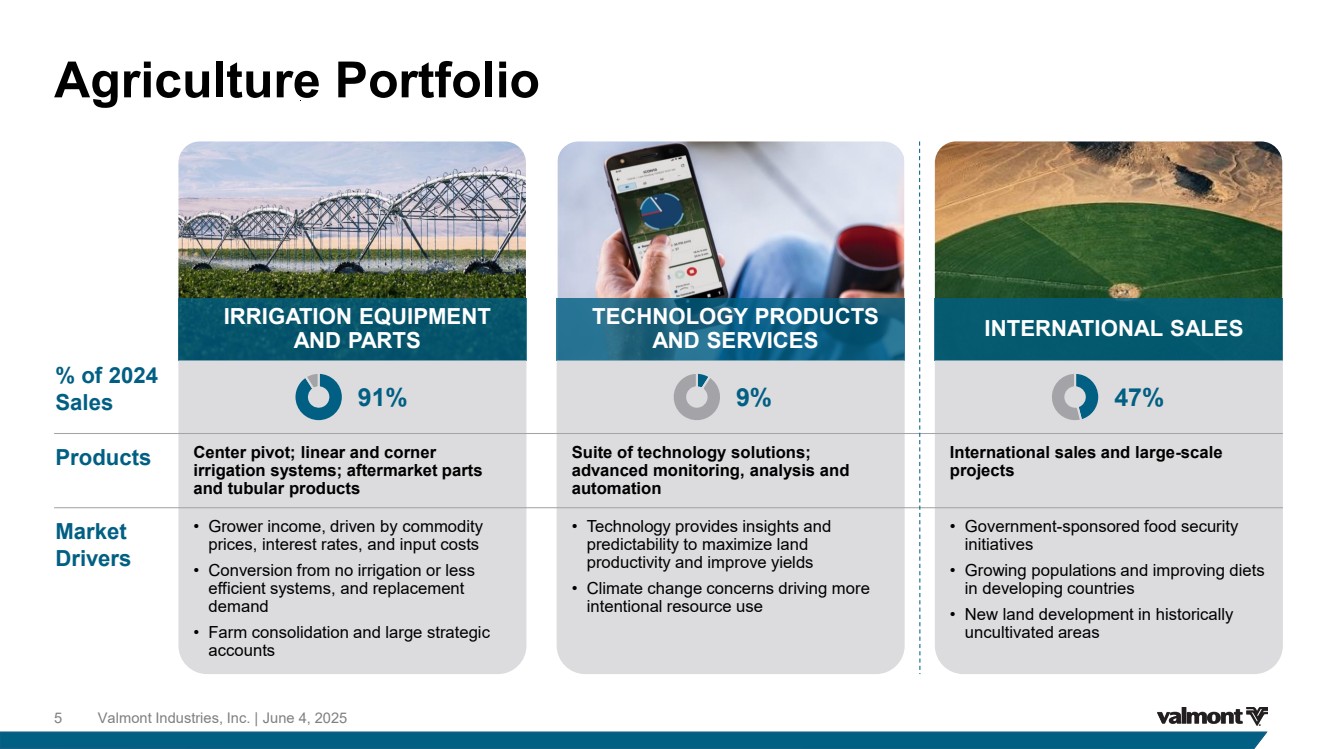
Valmont Industries, Inc. | IRRIGATION EQUIPMENT AND PARTS Center pivot; linear and corner irrigation systems; aftermarket parts and tubular products 91% • Grower income, driven by commodity prices, interest rates, and input costs • Conversion from no irrigation or less efficient systems, and replacement demand • Farm consolidation and large strategic accounts TECHNOLOGY PRODUCTS AND SERVICES Suite of technology solutions; advanced monitoring, analysis and automation 9% • Technology provides insights and predictability to maximize land productivity and improve yields • Climate change concerns driving more intentional resource use INTERNATIONAL SALES International sales and large-scale projects 47% • Government-sponsored food security initiatives • Growing populations and improving diets in developing countries • New land development in historically uncultivated areas Agriculture Portfolio Products Market Drivers % of 2024 Sales 5 June 4, 2025 |
|
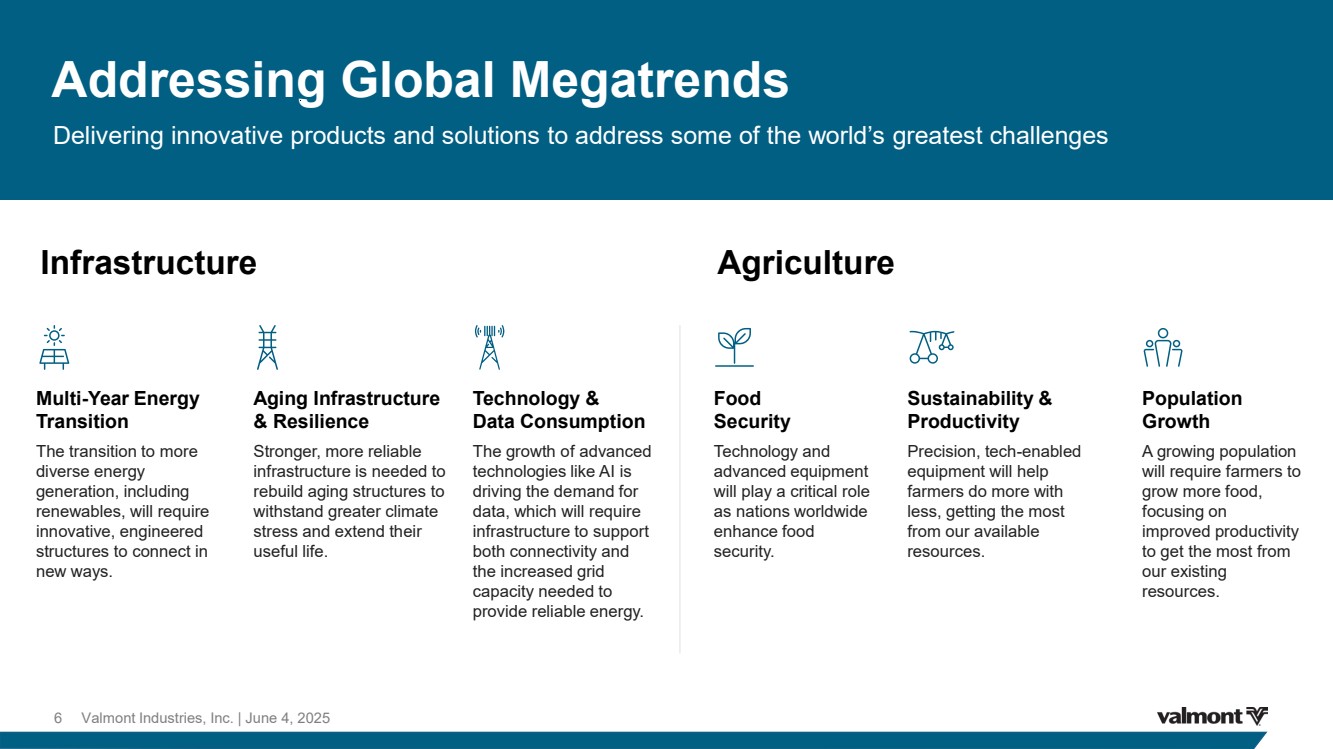
Valmont Industries, Inc. | June 4, 2025 Multi-Year Energy Transition The transition to more diverse energy generation, including renewables, will require innovative, engineered structures to connect in new ways. Aging Infrastructure & Resilience Stronger, more reliable infrastructure is needed to rebuild aging structures to withstand greater climate stress and extend their useful life. Technology & Data Consumption The growth of advanced technologies like AI is driving the demand for data, which will require infrastructure to support both connectivity and the increased grid capacity needed to provide reliable energy. Food Security Technology and advanced equipment will play a critical role as nations worldwide enhance food security. Sustainability & Productivity Precision, tech-enabled equipment will help farmers do more with less, getting the most from our available resources. Population Growth A growing population will require farmers to grow more food, focusing on improved productivity to get the most from our existing resources. Addressing Global Megatrends Delivering innovative products and solutions to address some of the world’s greatest challenges Infrastructure Agriculture 6 |
|
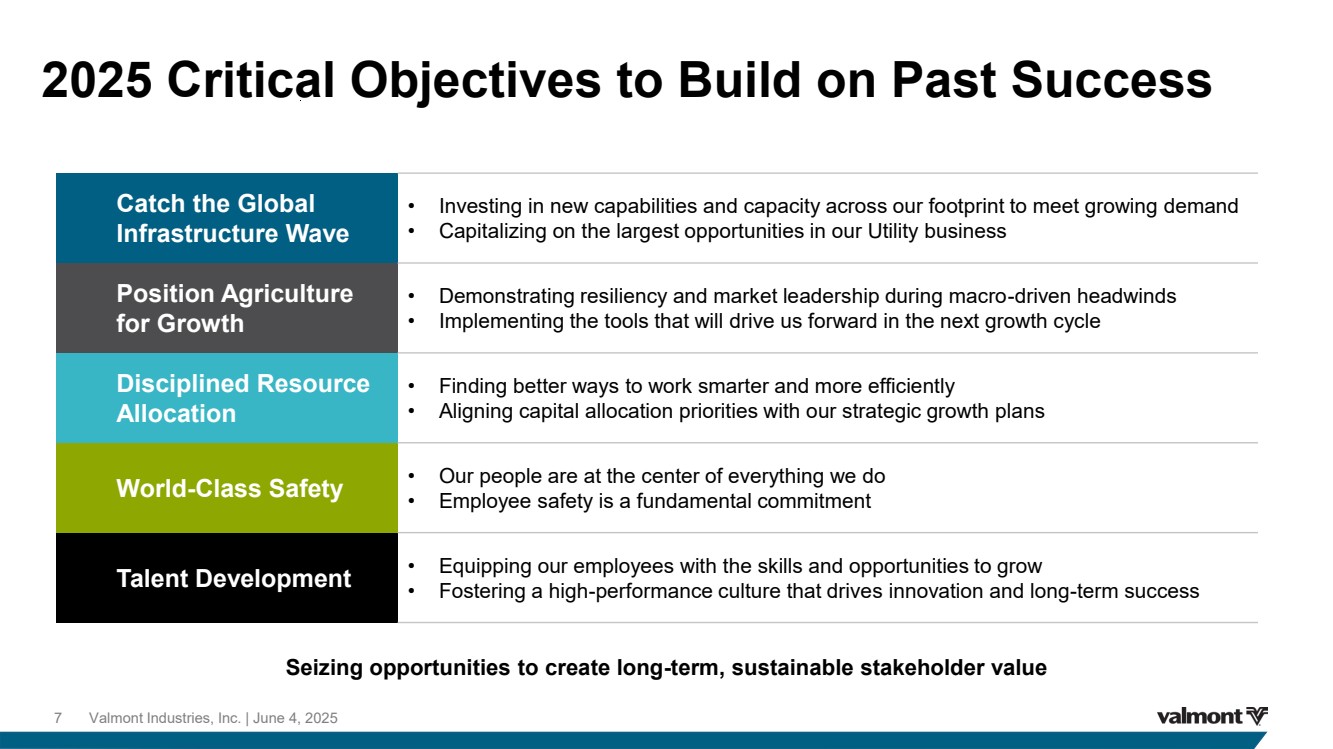
2025 Critical Objectives to Build on Past Success Catch the Global Infrastructure Wave • Investing in new capabilities and capacity across our footprint to meet growing demand • Capitalizing on the largest opportunities in our Utility business Position Agriculture for Growth • Demonstrating resiliency and market leadership during macro-driven headwinds • Implementing the tools that will drive us forward in the next growth cycle Disciplined Resource Allocation • Finding better ways to work smarter and more efficiently • Aligning capital allocation priorities with our strategic growth plans World-Class Safety • Our people are at the center of everything we do • Employee safety is a fundamental commitment Talent Development • Equipping our employees with the skills and opportunities to grow • Fostering a high-performance culture that drives innovation and long-term success Seizing opportunities to create long-term, sustainable stakeholder value 7 Valmont Industries, Inc. | June 4, 2025 |
|
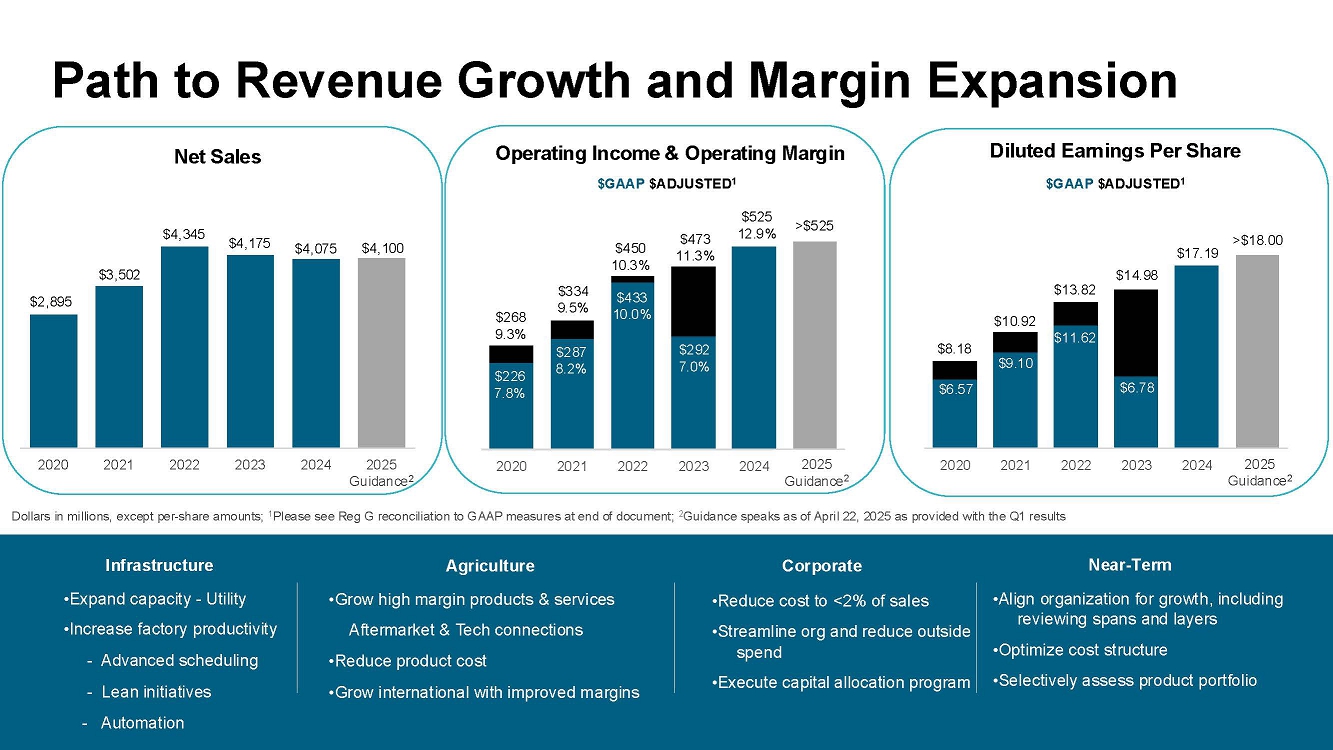
$2,895 $3,502 $4,345 $4,175 $4,075 $4,100 2020 2021 2022 2023 2024 2025 Guidance2 Path to Revenue Growth and Margin Expansion Expand capacity - Utility Increase factory productivity - Advanced scheduling - Lean initiatives - Automation Grow high margin products & services Aftermarket & Tech connections Reduce product cost Grow international with improved margins Reduce cost to 2% of sales Streamline org and reduce outside spend Execute capital allocation program Agriculture Corporate Infrastructure Operating Income & Operating Margin Net Sales Diluted Earnings Per Share 9.3% 9.5% 10.3% 11.3% 12.9% Align organization for growth, including reviewing spans and layers Optimize cost structure Selectively assess product portfolio Near-Term Dollars in millions, except per-share amounts; 1Please see Reg G reconciliation to GAAP measures at end of document; 2Guidance speaks as of April 22, 2025 as provided with the Q1 results 2020 2021 2022 2023 2024 2025 $226 7.8% $287 8.2% $292 7.0% $525 12.9% $268 9.3% $334 9.5% $473 11.3% $525 2020 2021 2022 2023 2024 2025 $6.57 $9.10 $6.78 $17.19 $8.18 $10.92 $14.98 $18.00 $GAAP $ADJUSTED1 $13.82 $11.62 $433 10.0% $450 10.3% 2025 Guidance2 2025 Guidance2 $GAAP $ADJUSTED1 |
|
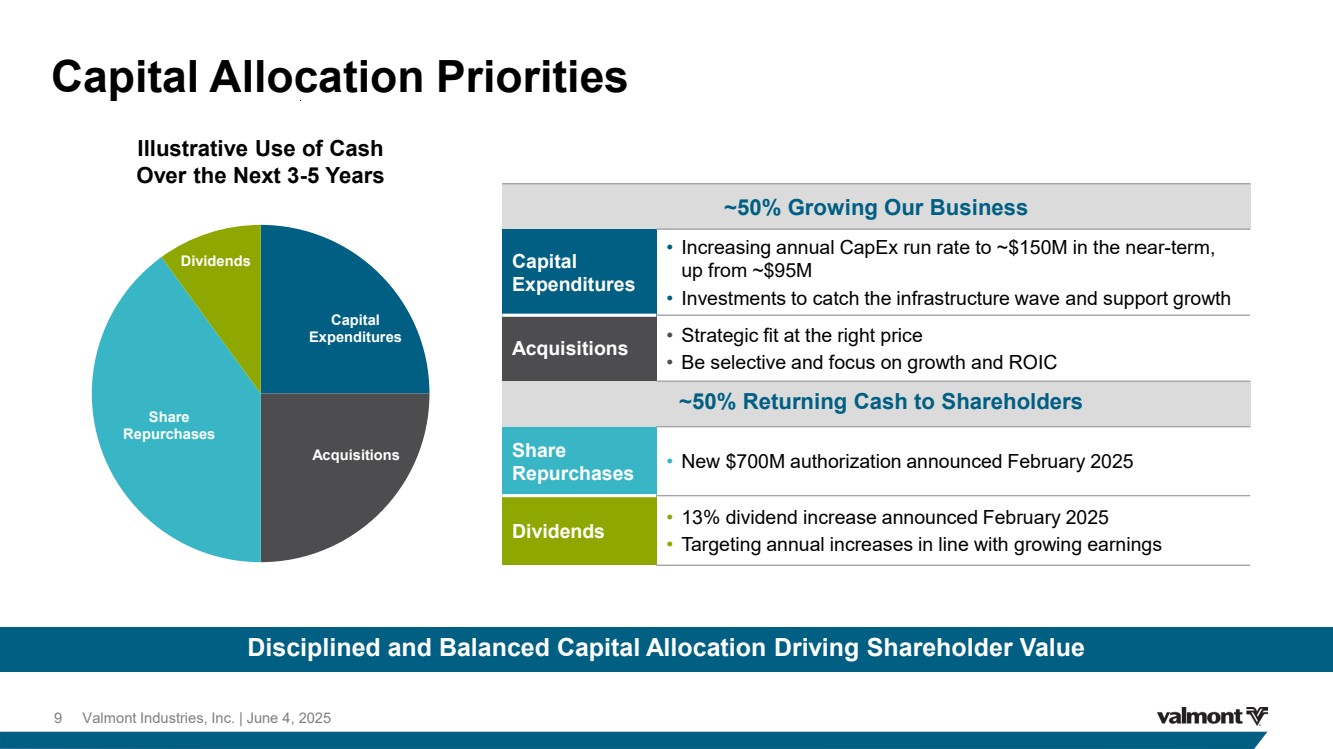
Valmont Industries, Inc. | June 4, 2025 Disciplined and Balanced Capital Allocation Driving Shareholder Value Capital Allocation Priorities ~50% Growing Our Business Capital Expenditures • Increasing annual CapEx run rate to ~$150M in the near-term, up from ~$95M • Investments to catch the infrastructure wave and support growth Acquisitions • Strategic fit at the right price • Be selective and focus on growth and ROIC ~50% Returning Cash to Shareholders Share Repurchases • New $700M authorization announced February 2025 Dividends • 13% dividend increase announced February 2025 • Targeting annual increases in line with growing earnings Capital Expenditures Acquisitions Share Repurchases Dividends Illustrative Use of Cash Over the Next 3-5 Years 9 |
|
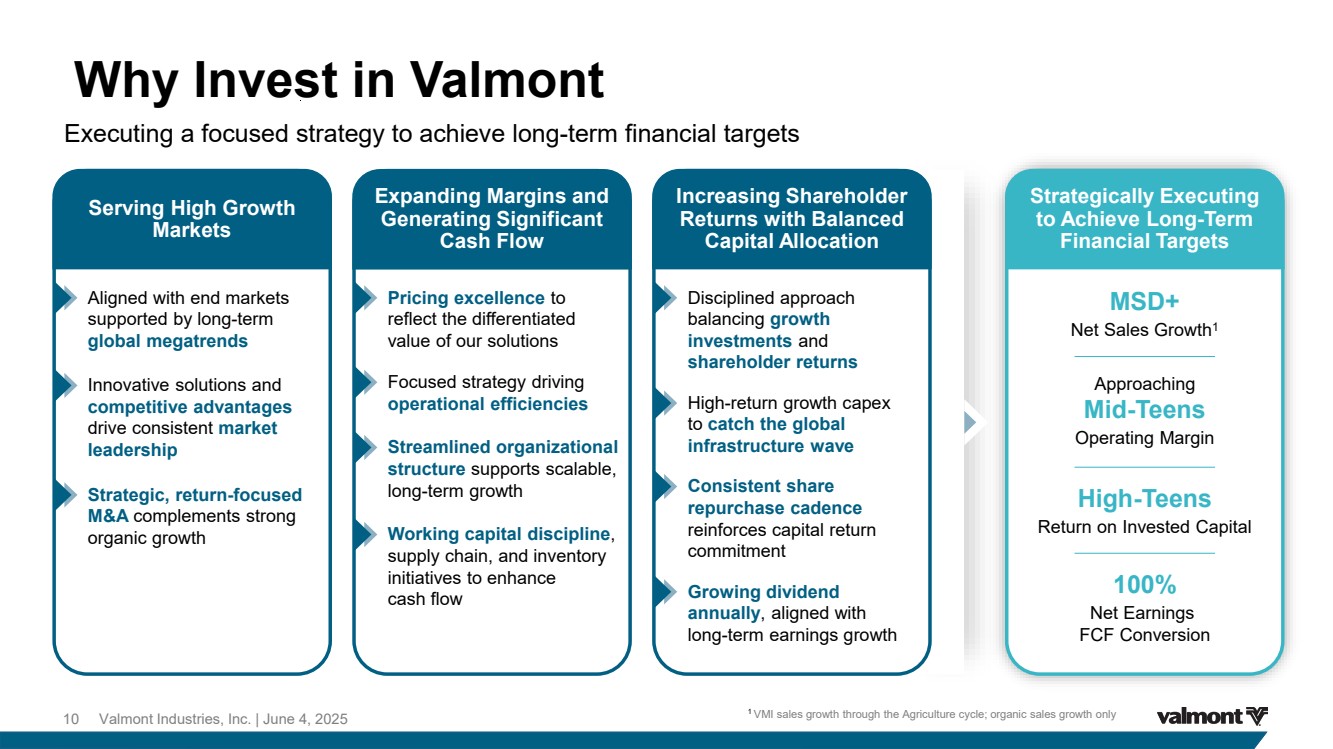
Why Invest in Valmont Executing a focused strategy to achieve long-term financial targets 1 VMI sales growth through the Agriculture cycle; organic sales growth only Serving High Growth Markets Expanding Margins and Generating Significant Cash Flow Increasing Shareholder Returns with Balanced Capital Allocation Strategically Executing to Achieve Long-Term Financial Targets Aligned with end markets supported by long-term global megatrends Innovative solutions and competitive advantages drive consistent market leadership Strategic, return-focused M&A complements strong organic growth Pricing excellence to reflect the differentiated value of our solutions Focused strategy driving operational efficiencies Streamlined organizational structure supports scalable, long-term growth Working capital discipline, supply chain, and inventory initiatives to enhance cash flow Disciplined approach balancing growth investments and shareholder returns High-return growth capex to catch the global infrastructure wave Consistent share repurchase cadence reinforces capital return commitment Growing dividend annually, aligned with long-term earnings growth MSD+ Net Sales Growth1 Approaching Mid-Teens Operating Margin High-Teens Return on Invested Capital 100% Net Earnings FCF Conversion 10 Valmont Industries, Inc. | June 4, 2025 |
|
Q&A 11 Valmont Industries, Inc. | June 4, 2025 |
|
Appendix 12 Valmont Industries, Inc. | June 4, 2025 |
|
Reconciliation of Non-GAAP Financial Measures to Reported Financial Measures Management utilizes non-GAAP financial measures to assess the Company’s historical and prospective financial performance, evaluate operational profitability on a consistent basis, factor into executive compensation decisions, and enhance transparency for the investment community. These non-GAAP measures are intended to supplement, not replace, the Company’s reported financial results prepared in accordance with GAAP. It is important to note that other companies may calculate these measures differently, which can limit their usefulness for comparison across organizations. The following non-GAAP measures have been included in this financial communication: • Adjusted Operating Income, Adjusted Operating Margin, Adjusted Net Earnings, and Adjusted Diluted EPS: These metrics provide meaningful supplemental insights into the Company’s operating performance by excluding items that are not considered part of core operating results. This approach enhances comparability across reporting periods. Adjustments may include costs or benefits associated with acquisitions, divestitures, expenses related to realignment or restructuring programs, goodwill or intangible asset impairment, significant expenses or benefits from changes in tax laws or rates, cumulative effects of changes in accounting standards, refinancing-related expenses, loss or gain from a partial or full settlement of the U.K defined benefit pension plan obligation, losses from natural disasters, and other non-recurring items. 13 Valmont Industries, Inc. | June 4, 2025 |
|
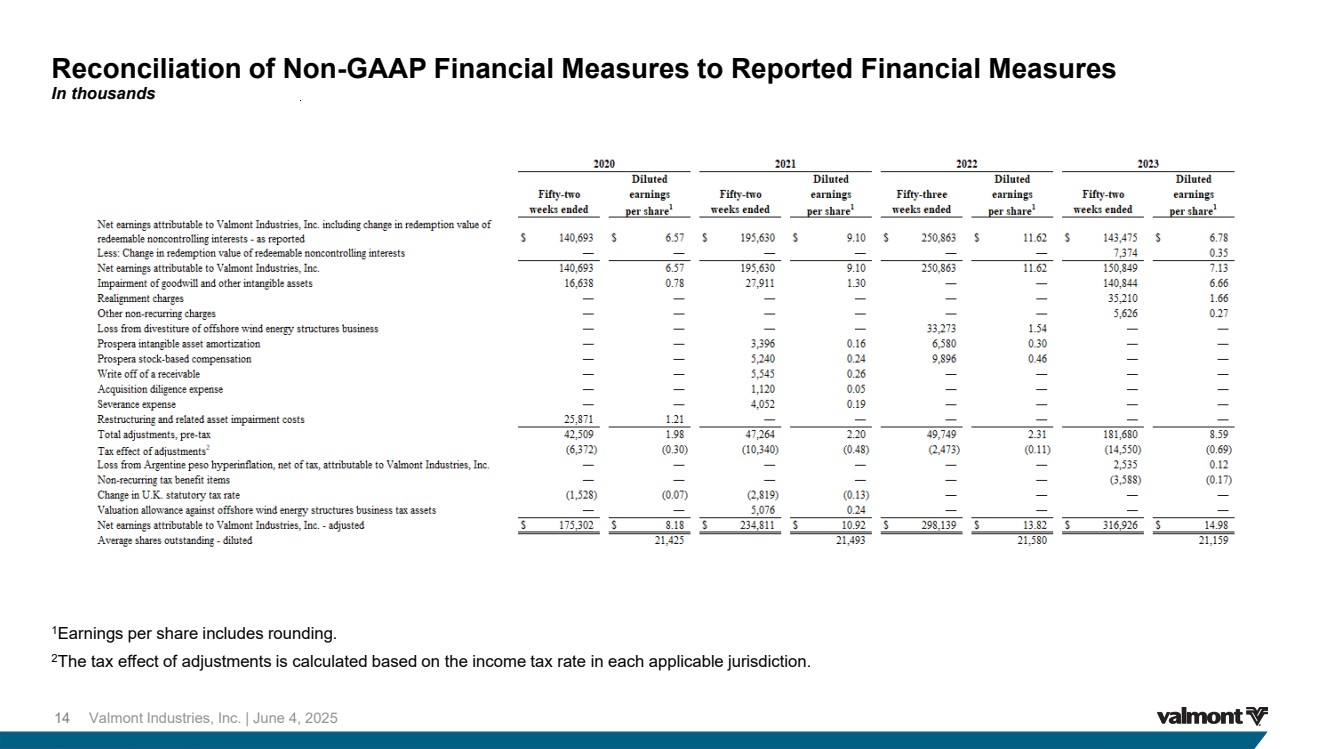
Reconciliation of Non-GAAP Financial Measures to Reported Financial Measures In thousands 1Earnings per share includes rounding. 2The tax effect of adjustments is calculated based on the income tax rate in each applicable jurisdiction. 14 Valmont Industries, Inc. | June 4, 2025 |
|
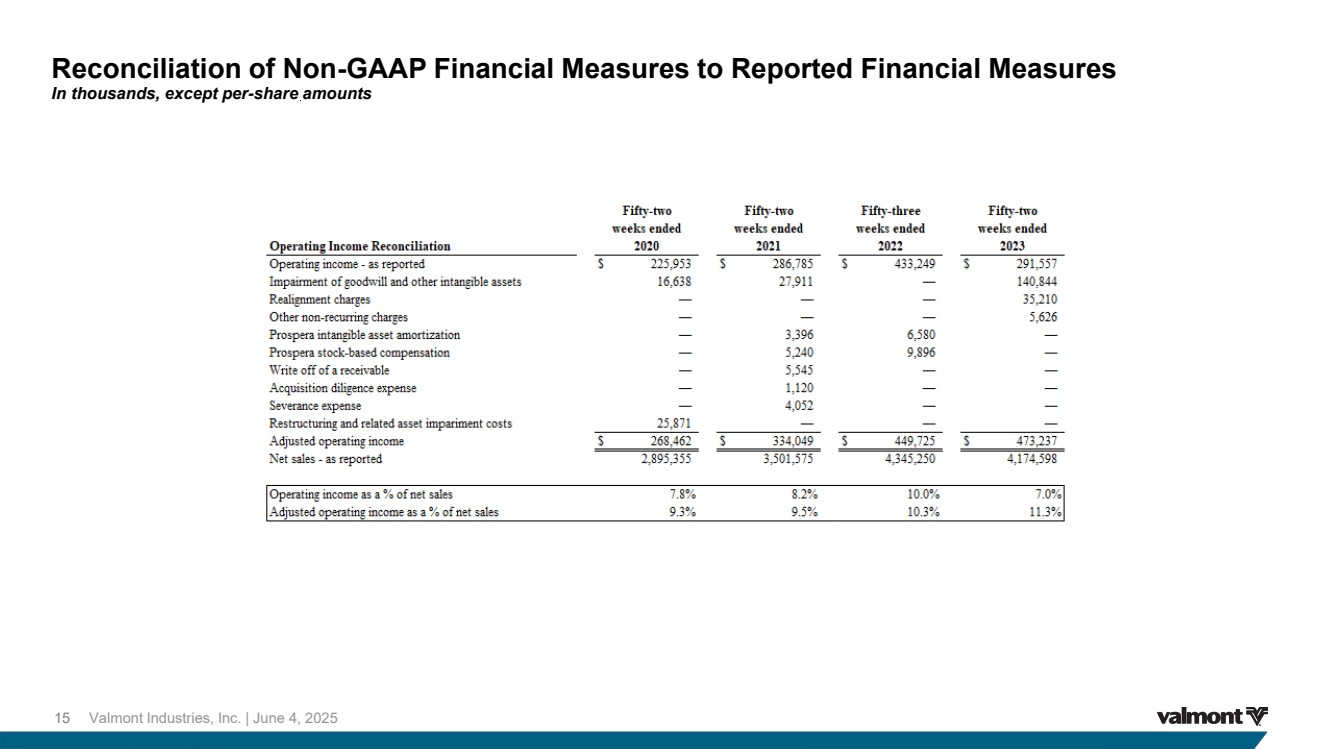
Reconciliation of Non-GAAP Financial Measures to Reported Financial Measures In thousands, except per-share amounts 15 Valmont Industries, Inc. | June 4, 2025 |