UNITED STATES
SECURITIES AND EXCHANGE COMMISSION
Washington, D.C. 20549
FORM 8-K
CURRENT REPORT
Pursuant to Section 13 or 15(d) of the Securities Exchange Act of 1934
Date of Report (Date of Earliest Event Reported): September 23, 2024
AAR CORP.
(Exact name of registrant as specified in its charter)
| Delaware | 1-6263 | 36-2334820 | ||
| (State of Incorporation) | (Commission File Number) | (IRS Employer Identification No.) |
| One AAR Place |
| 1100 N. Wood Dale Road |
| Wood Dale, Illinois 60191 |
| (Address and Zip Code of Principal Executive Offices) |
| Registrant’s telephone number, including area code: (630) 227-2000 |
Not Applicable
(Former name or former address, if changed since last report)
Check the appropriate box below if the Form 8-K filing is intended to simultaneously satisfy the filing obligation of the registrant under any of the following provisions:
¨ Written communications pursuant to Rule 425 under the Securities Act (17 CFR 230.425)
¨ Soliciting material pursuant to Rule 14a-12 under the Exchange Act (17 CFR 240.14a-12)
¨ Pre-commencement communications pursuant to Rule 14d-2(b) under the Exchange Act (17 CFR 240.14d-2(b))
¨ Pre-commencement communications pursuant to Rule 13e-4(c) under the Exchange Act (17 CFR 240.13e-4(c))
Securities registered pursuant to Section 12(b) of the Act:
| Title of Each Class | Trading Symbol(s) | Name of Each Exchange on Which Registered | ||
| Common Stock, $1.00 par value | AIR | New York Stock Exchange | ||
| Chicago Stock Exchange |
Indicate by check mark whether the registrant is an emerging growth company as defined in Rule 405 of the Securities Act of 1933 (§ 230.405 of this chapter) or Rule 12b-2 of the Securities Exchange Act of 1934 (§ 240.12b-2 of this chapter). Emerging growth company ¨
If an emerging growth company, indicate by check mark if the registrant has elected not to use the extended transition period for complying with any new or revised financial accounting standards provided pursuant to Section 13(a) of the Exchange Act. ¨
| Item 2.02 | Results of Operations and Financial Condition. |
On September 23, 2024, AAR CORP. (the “Company”) issued a press release and supplemental slide presentation reporting the Company’s financial results for the first quarter ended August 31, 2024. Copies of the Company’s press release and supplemental slide presentation are attached hereto as Exhibit 99.1 and Exhibit 99.2, respectively.
The information furnished under Item 2.02 of this Current Report on Form 8-K and the exhibit attached hereto shall not be deemed to be “filed” for the purposes of Section 18 of the Securities Exchange Act of 1934, as amended, or otherwise subject to the liabilities of that section. It may only be incorporated by reference in another filing under the Exchange Act or Securities Act of 1933, as amended, if such subsequent filing specifically references this Form 8-K.
| Item 9.01 | Financial Statements and Exhibits. |
(d) Exhibits.
| Exhibit No. | Description | |
| 99.1 | Press Release issued by AAR CORP. dated September 23, 2024. | |
| 99.2 | Slide Presentation by AAR CORP. dated September 23, 2024. | |
| 104 | Cover Page Interactive Data File (embedded within the Inline XBRL document) |
SIGNATURE
Pursuant to the requirements of the Securities Exchange Act of 1934, the registrant has duly caused this report to be signed on its behalf by the undersigned hereunto duly authorized.
| Date: September 23, 2024 | ||
| AAR CORP. | ||
| By: | ||
| /s/ SEAN M. GILLEN | ||
| Sean M. Gillen | ||
| Senior Vice President and Chief Financial Officer | ||
| (Principal Financial Officer) | ||
Exhibit 99.1
AAR reports first quarter fiscal year 2025 results
| · | First quarter sales of $662 million, up 20% over the prior year |
| · | First quarter GAAP diluted earnings per share of $0.50 compared to a loss per share of $0.02 in Q1 FY2024 |
| · | First quarter adjusted diluted earnings per share of $0.85, up 9% from $0.78 in Q1 FY2024 |
| · | Sales growth of 20% in both our commercial and government businesses |
Wood Dale, Illinois, September 23, 2024 — AAR CORP. (NYSE: AIR), a leading provider of aviation services to commercial and government operators, MROs, and OEMs, today reported first quarter fiscal year 2025 consolidated sales of $661.7 million and net income of $18.0 million, or $0.50 per diluted share. For the first quarter of the prior year, the Company reported sales of $549.7 million and a net loss of $0.6 million, or $0.02 per diluted share. Our adjusted diluted earnings per share in the first quarter of fiscal year 2025 were $0.85, compared to $0.78 in the first quarter of the prior year.
Consolidated first quarter sales increased 20% over the prior year quarter. Our consolidated sales to commercial customers and to government customers both increased 20% over the prior year quarter. These increases were primarily due to the acquisition of the Product Support business and organic growth. Sales to commercial customers were 71% of consolidated sales in both the current and prior year quarters.
“During the quarter, we continued to execute well across the company. We drove 26% organic growth in our new parts distribution activities, had strong operational performance in our hangars and saw a return to growth in our government business. The quarter also included meaningful contributions from Trax, and the recent Product Support acquisition continues to exceed our expectations,” said John M. Holmes, Chairman, President and Chief Executive Officer of AAR CORP.
|
|
Selling, general, and administrative expenses were $75.9 million in the current quarter, compared to $74.7 million in the prior year quarter. Acquisition, amortization, and integration expenses were $7.1 million in the current quarter compared to $2.9 million in the prior year quarter.
Operating margins were 6.6% in the current quarter, compared to 4.6% in the prior year quarter. Adjusted operating margin increased from 7.3% in the prior year quarter to 9.1% in the current year quarter. The improved adjusted margin over the prior year is primarily driven by the favorable contribution from the recently acquired Product Support business as well as improved execution.
During and subsequent to the quarter, we received multiple new contract awards, including:
| · | Five-year firm fixed price IDIQ contract with an aggregate ceiling value of approximately $1.2 billion from the U.S. Navy’s Naval Air Systems Command (NAVAIR) to perform engine depot maintenance and repair for its P-8A Poseidon Aircraft fleet |
| · | Five-year firm fixed price IDIQ contract with an aggregate ceiling value of approximately $1.2 billion by NAVAIR to perform P-8A Poseidon depot airframe maintenance and depot field team support for the U.S. Navy, government of Australia, and foreign military sales customers |
| · | Multiple, long-term distribution agreements with Ontic that expand our support across various government and commercial platforms |
Net interest expense for the quarter was $18.3 million, compared to $5.4 million last year, primarily due to increased debt levels as a result of funding the Product Support acquisition. Average diluted share count increased from 35.1 million shares in the prior year quarter to 35.6 million shares in the current year quarter. From a capital deployment perspective, we are prioritizing debt repayment but will evaluate share repurchases along with other attractive investment opportunities to deploy our capital. We have $52.5 million remaining on our $150 million share repurchase program.
|
|
Cash flow used in operating activities was $18.6 million during the current quarter compared to $18.7 million in the prior year quarter. As of August 31, 2024, our net debt was $942.7 million and our net leverage, pro forma for the last twelve months adjusted EBITDA of the Product Support business was 3.31x. Excluding our accounts receivable financing program, our cash flow used in operating activities was $33.9 million in the current quarter.
Holmes concluded, “We have been expanding our adjusted operating margin each quarter over the past three years and I am proud of our team’s strong execution. As we continue to drive growth in our higher margin activities as well as fully integrate the Product Support business, we expect further margin expansion. Demand remains exceptionally strong for our services and we expect continued growth across both our commercial and government businesses.”
Conference call information
On Monday, September 23, 2024, at 4 p.m. Central time, AAR will hold a conference call to discuss the results. A listen-only webcast and slides can be accessed at https://edge.media-server.com/mmc/p/4zxrgath/. Participants may join via phone by registering at https://register.vevent.com/register/BI842bfc6277834251b3d46d91d48ddae4. Once registered, participants will receive a dial-in number and a unique PIN that will allow them to access the call. The slides are also available on AAR’s website at https://www.aarcorp.com/f1q25investor.pdf.
A replay of the conference call will be available for on-demand listening shortly after the completion of the call at the webcast link and will remain available for approximately one year.
About AAR
AAR is a global aerospace and defense aftermarket solutions company with operations in over 20 countries. Headquartered in the Chicago area, AAR supports commercial and government customers through four operating segments: Parts Supply, Repair & Engineering, Integrated Solutions, and Expeditionary Services. Additional information can be found at https://www.aarcorp.com/.

Contact: Investor Relations | +1-630-227-2017 | investors@aarcorp.com
|
|
This press release contains certain statements relating to future results, which are forward-looking statements as that term is defined in the Private Securities Litigation Reform Act of 1995, which reflect management’s expectations about future conditions, including, but not limited to, continued demand in the commercial and government aviation markets, anticipated activities and benefits under extended, expanded and new services, supply and distribution agreements, opportunities for capital deployment and margin improvement, earnings performance, contributions from our recent acquisitions, and expectations for our new parts distribution activities.
Forward-looking statements often address our expected future operating and financial performance and financial condition, or sustainability targets, goals, commitments, and other business plans, and often may also be identified because they contain words such as “anticipate,” “believe,” “continue,” “could,” “estimate,” “expect,” “intend,” “likely,” “may,” “might,” “plan,” “potential,” “predict,” “project,” “seek,” “should,” “target,” “will,” “would,” or similar expressions and the negatives of those terms.
These forward-looking statements are based on the beliefs of Company management, as well as assumptions and estimates based on information available to the Company as of the dates such assumptions and estimates are made, and are subject to certain risks and uncertainties that could cause actual results to differ materially from historical results or those anticipated, depending on a variety of factors, including: (i) factors that adversely affect the commercial aviation industry; (ii) adverse events and negative publicity in the aviation industry; (iii) a reduction in sales to the U.S. government and its contractors; (iv) cost overruns and losses on fixed-price contracts; (v) nonperformance by subcontractors or suppliers; (vi) a reduction in outsourcing of maintenance activity by airlines; (vii) a shortage of skilled personnel or work stoppages; (viii) competition from other companies; (ix) financial, operational and legal risks arising as a result of operating internationally; (x) inability to integrate acquisitions effectively and execute operational and financial plans related to the acquisitions; (xi) failure to realize the anticipated benefits of acquisitions; (xii) circumstances associated with divestitures; (xiii) inability to recover costs due to fluctuations in market values for aviation products and equipment; (xiv) cyber or other security threats or disruptions; (xv) a need to make significant capital expenditures to keep pace with technological developments in our industry; (xvi) restrictions on use of intellectual property and tooling important to our business; (xvii) inability to fully execute our stock repurchase program and return capital to stockholders; (xviii) limitations on our ability to access the debt and equity capital markets or to draw down funds under loan agreements; (xix) non-compliance with restrictive and financial covenants contained in our debt and loan agreements; (xx) changes in or non-compliance with laws and regulations related to federal contractors, the aviation industry, international operations, safety, and environmental matters, and the costs of complying with such laws and regulations; and (xxi) exposure to product liability and property claims that may be in excess of our liability insurance coverage. Should one or more of those risks or uncertainties materialize adversely, or should underlying assumptions or estimates prove incorrect, actual results may vary materially from those described. Those events and uncertainties are difficult or impossible to predict accurately and many are beyond our control.
For a discussion of these and other risks and uncertainties, refer to our Annual Report on Form 10-K, Part I, “Item 1A, Risk Factors” and our other filings from time to time with the U.S Securities and Exchange Commission. These events and uncertainties are difficult or impossible to predict accurately and many are beyond the Company’s control. The risks described in these reports are not the only risks we face, as additional risks and uncertainties are not currently known or foreseeable or impossible to predict accurately or risks that are beyond the Company’s control or deemed immaterial may materially adversely affect our business, financial condition or results of operations in future periods. We assume no obligation to update any forward-looking statements to reflect events or circumstances after the date of such statements or to reflect the occurrence of anticipated or unanticipated events.
|
|
AAR CORP. and subsidiaries
| Condensed consolidated statements of operations | Three months ended | |||||||
| (In millions except per share data - unaudited) | August 31, | |||||||
| 2024 | 2023 | |||||||
| Sales | $ | 661.7 | $ | 549.7 | ||||
| Cost of sales | 544.5 | 448.4 | ||||||
| Gross profit | 117.2 | 101.3 | ||||||
| Provision for credit losses | 0.2 | 0.4 | ||||||
| Selling, general and administrative | 75.9 | 74.7 | ||||||
| Earnings (Loss) from joint ventures | 2.3 | (0.9 | ) | |||||
| Operating income | 43.4 | 25.3 | ||||||
| Pension settlement charge | –– | (26.7 | ) | |||||
| Losses related to sale and exit of business | (0.1 | ) | (0.7 | ) | ||||
| Interest expense, net | (18.3 | ) | (5.4 | ) | ||||
| Other expense, net | (0.1 | ) | –– | |||||
| Income (Loss) before income taxes | 24.9 | (7.5 | ) | |||||
| Income tax expense (benefit) | 6.9 | (6.9 | ) | |||||
| Net income (loss) | $ | 18.0 | $ | (0.6 | ) | |||
| Earnings (Loss) per share – Basic and Diluted | $ | 0.50 | $ | (0.02 | ) | |||
| Share data: | ||||||||
| Weighted average shares outstanding – Basic | 35.2 | 34.7 | ||||||
| Weighted average shares outstanding – Diluted | 35.6 | 35.1 | ||||||
|
|
AAR CORP. and subsidiaries
| Condensed consolidated balance sheets (In millions) |
August 31,
2024 |
May 31, 2024 |
||||||
| (unaudited) | ||||||||
| ASSETS | ||||||||
| Cash and cash equivalents | $ | 49.3 | $ | 85.8 | ||||
| Restricted cash | 13.8 | 10.3 | ||||||
| Accounts receivable, net | 310.9 | 287.2 | ||||||
| Contract assets | 147.9 | 123.2 | ||||||
| Inventories, net | 748.2 | 733.1 | ||||||
| Rotable assets and equipment on or available for lease | 70.4 | 81.5 | ||||||
| Other current assets | 86.4 | 68.5 | ||||||
| Total current assets | 1,426.9 | 1,389.6 | ||||||
| Property, plant, and equipment, net | 161.5 | 171.7 | ||||||
| Goodwill and intangible assets, net | 783.9 | 790.2 | ||||||
| Rotable assets supporting long-term programs | 170.8 | 166.3 | ||||||
| Operating lease right-of-use assets, net | 93.4 | 96.6 | ||||||
| Other non-current assets | 146.8 | 155.6 | ||||||
| Total assets | $ | 2,783.3 | $ | 2,770.0 | ||||
| LIABILITIES AND EQUITY | ||||||||
| Accounts payable | $ | 257.5 | $ | 238.0 | ||||
| Other current liabilities | 209.4 | 228.9 | ||||||
| Total current liabilities | 466.9 | 466.9 | ||||||
| Long-term debt | 981.0 | 985.4 | ||||||
| Operating lease liabilities | 78.9 | 80.3 | ||||||
| Other liabilities and deferred revenue | 46.3 | 47.6 | ||||||
| Total liabilities | 1,573.1 | 1,580.2 | ||||||
| Equity | 1,210.2 | 1,189.8 | ||||||
| Total liabilities and equity | $ | 2,783.3 | $ | 2,770.0 | ||||
|
|
AAR CORP. and subsidiaries
| Condensed consolidated statements of cash flows (In millions – unaudited) |
Three months ended August 31, |
|||||||
| 2024 | 2023 | |||||||
| Cash flows used in operating activities: | ||||||||
| Net income (loss) | $ | 18.0 | $ | (0.6 | ) | |||
| Adjustments to reconcile net income (loss) to net cash used in operating activities: | ||||||||
| Depreciation and amortization | 14.2 | 8.4 | ||||||
| Stock-based compensation expense | 5.0 | 4.3 | ||||||
| Pension settlement charge | –– | 26.7 | ||||||
| Changes in certain assets and liabilities: | ||||||||
| Accounts receivable | (23.7 | ) | (40.5 | ) | ||||
| Contract assets | (24.5 | ) | (12.3 | ) | ||||
| Inventories | (14.8 | ) | (39.8 | ) | ||||
| Prepaid expenses and other current assets | (8.5 | ) | (8.8 | ) | ||||
| Rotable assets supporting long-term programs | (6.5 | ) | (1.0 | ) | ||||
| Accounts payable and other current liabilities | 8.5 | 54.2 | ||||||
| Other | 13.7 | (9.1 | ) | |||||
| Net cash used in operating activities – continuing operations | (18.6 | ) | (18.5 | ) | ||||
| Net cash used in operating activities – discontinued operations | –– | (0.2 | ) | |||||
| Net cash used in operating activities | (18.6 | ) | (18.7 | ) | ||||
| Cash flows used in investing activities: | ||||||||
| Property, plant, and equipment expenditures | (7.9 | ) | (9.1 | ) | ||||
| Acquisition | 2.9 | –– | ||||||
| Other | (0.3 | ) | (2.5 | ) | ||||
| Net cash used in investing activities | (5.3 | ) | (11.6 | ) | ||||
| Cash flows provided by (used in) financing activities: | ||||||||
| Short-term borrowings (repayments) on Revolving Credit Facility, net | (5.0 | ) | 35.0 | |||||
| Other | (4.1 | ) | 3.7 | |||||
| Net cash provided by (used in) financing activities | (9.1 | ) | 38.7 | |||||
| Increase (Decrease) in cash, cash equivalents, and restricted cash | (33.0 | ) | 8.4 | |||||
| Cash, cash equivalents, and restricted cash at beginning of period | 96.1 | 81.8 | ||||||
| Cash, cash equivalents, and restricted cash at end of period | $ | 63.1 | $ | 90.2 | ||||
|
|
AAR CORP. and subsidiaries
| Third-party sales by operating segment (In millions - unaudited) |
Three months ended August 31, |
|||||||
| 2024 | 2023 | |||||||
| Parts Supply | $ | 249.7 | $ | 236.8 | ||||
| Repair & Engineering | 217.6 | 137.5 | ||||||
| Integrated Solutions | 168.9 | 156.3 | ||||||
| Expeditionary Services | 25.5 | 19.1 | ||||||
| $ | 661.7 | $ | 549.7 | |||||
| Operating income (loss) by operating segment (In millions - unaudited) |
Three months ended August 31, |
|||||||
| 2024 | 2023 | |||||||
| Parts Supply | $ | 30.1 | $ | 15.1 | ||||
| Repair & Engineering | 21.1 | 9.1 | ||||||
| Integrated Solutions | 7.7 | 7.7 | ||||||
| Expeditionary Services | (1.7 | ) | 1.3 | |||||
| 57.2 | 33.2 | |||||||
| Corporate and other | (13.8 | ) | (7.9 | ) | ||||
| $ | 43.4 | $ | 25.3 | |||||
Adjusted net income, adjusted diluted earnings per share, adjusted operating margin, adjusted cash provided by (used in) operating activities, adjusted EBITDA, net debt, net debt to adjusted EBITDA (net leverage), and net debt to pro forma adjusted EBITDA (net pro forma leverage) are “non-GAAP financial measures” as defined in Regulation G of the Securities Exchange Act of 1934, as amended (the “Exchange Act”). We believe these non-GAAP financial measures are relevant and useful for investors as they illustrate our core operating performance, cash flows, and leverage unaffected by the impact of certain items that management does not believe are indicative of our ongoing and core operating activities. When reviewed in conjunction with our GAAP results and the accompanying reconciliations, we believe these non-GAAP financial measures provide additional information that is useful to gain an understanding of the factors and trends affecting our business and provide a means by which to compare our operating performance and leverage against that of other companies in the industries we compete. These non-GAAP measures should be considered as a supplement to, and not as a substitute for, or superior to, the corresponding measures calculated in accordance with GAAP.
Our non-GAAP financial measures reflect adjustments for certain items including, but not limited to, the following:
| · | Investigation costs comprised of legal and professional fees related to addressing potential violations of the U.S. Foreign Corrupt Practices Act, which we self-reported to the U.S. Department of Justice and other agencies. | |
| · | Expenses associated with recent acquisition activity including professional fees for legal, due diligence, and other acquisition activities, bridge financing fees, intangible asset amortization, integration costs, and compensation expense related to contingent consideration and retention agreements. | |
| · | Pension settlement charges associated with the settlement and termination of our frozen defined benefit pension plan. | |
| · | Legal judgments related to or impacted by the Russia/Ukraine conflict. | |
| · | Contract termination/restructuring costs comprised of gains and losses that are recognized at the time of modifying, terminating, or restructuring certain customer and vendor contracts, including the loss recognized from the U.S. government exercising their termination for convenience in the first quarter of fiscal 2025 for our Mobility business’s new-generation pallet contract. | |
| · | Losses related to the sale and exit from joint ventures and our Composites manufacturing business, including legal fees for the performance guarantee associated with the Composites’ A220 aircraft contract. |
|
|
Adjusted EBITDA is net income (loss) before interest income (expense), other income (expense), income taxes, depreciation and amortization, stock-based compensation, and items of an unusual nature including but not limited to business divestitures and acquisitions, workforce actions, investigation and remediation compliance costs, pension settlement charges, legal judgments, acquisition, integration, and amortization expenses from recent acquisition activity, and significant customer contract terminations.
Pursuant to the requirements of Regulation G of the Exchange Act, we are providing the following tables that reconcile the above-mentioned non-GAAP financial measures to the most directly comparable GAAP financial measures:
| Adjusted net income (In millions - unaudited) |
Three months ended August 31, |
|||||||
| 2024 | 2023 | |||||||
| Net income (loss) | $ | 18.0 | $ | (0.6 | ) | |||
| Acquisition, integration, and amortization expenses | 9.0 | 2.8 | ||||||
| Investigation costs | 5.0 | 1.1 | ||||||
| Contract termination costs | 3.2 | –– | ||||||
| Loss (Gain) related to sale of business/joint venture | (1.3 | ) | 0.7 | |||||
| Pension settlement charge | –– | 26.7 | ||||||
| Russian bankruptcy court judgment | –– | 11.2 | ||||||
| Tax effect on adjustments (a) | (3.6 | ) | (14.6 | ) | ||||
| Adjusted net income | $ | 30.3 | $ | 27.3 | ||||
| (a) | Calculation uses estimated statutory tax rates on non-GAAP adjustments except for the tax effect of the pension settlement charge which includes income taxes previously recognized in accumulated other comprehensive loss. |
| Adjusted diluted earnings per share (unaudited) |
Three months ended August 31, |
|||||||
| 2024 | 2023 | |||||||
| Diluted earnings (loss) per share | $ | 0.50 | $ | (0.02 | ) | |||
| Acquisition, integration, and amortization expenses | 0.25 | 0.08 | ||||||
| Investigation costs | 0.14 | 0.03 | ||||||
| Contract termination costs | 0.09 | –– | ||||||
| Loss (Gain) related to sale of business/joint venture | (0.03 | ) | 0.02 | |||||
| Pension settlement charge | –– | 0.76 | ||||||
| Russian bankruptcy court judgment | –– | 0.32 | ||||||
| Tax effect on adjustments (a) | (0.10 | ) | (0.41 | ) | ||||
| Adjusted diluted earnings per share | $ | 0.85 | $ | 0.78 | ||||
| (a) | Calculation uses estimated statutory tax rates on non-GAAP adjustments except for the tax effect of the pension settlement charge which includes income taxes previously recognized in accumulated other comprehensive loss. |
|
|
| Adjusted operating margin (In millions - unaudited) |
Three months ended | |||||||||||
| August 31, 2024 |
May 31, 2024 |
August 31, 2023 |
||||||||||
| Sales | $ | 661.7 | $ | 656.5 | $ | 549.7 | ||||||
| Contract termination costs | (9.5 | ) | 2.3 | –– | ||||||||
| Adjusted sales | $ | 652.2 | $ | 658.8 | $ | 549.7 | ||||||
| Operating income | $ | 43.4 | $ | 32.6 | $ | 25.3 | ||||||
| Acquisition, integration, and amortization expenses | 9.0 | 18.6 | 2.8 | |||||||||
| Investigation costs | 5.0 | 4.8 | 1.1 | |||||||||
| Contract termination costs | 3.2 | 4.8 | –– | |||||||||
| Gain related to sale of joint venture | (1.4 | ) | –– | –– | ||||||||
| Severance charges | –– | 0.5 | –– | |||||||||
| Russian bankruptcy court judgment | –– | –– | 11.2 | |||||||||
| Adjusted operating income | $ | 59.2 | $ | 61.3 | $ | 40.4 | ||||||
| Adjusted operating margin | 9.1 | % | 9.3 | % | 7.3 | % | ||||||
|
Adjusted cash flows used in operating activities (In millions - unaudited) |
Three months ended August 31, |
|||||||
| 2024 | 2023 | |||||||
| Cash flows used in operating activities | $ | (18.6 | ) | $ | (18.7 | ) | ||
| Amounts outstanding on accounts receivable financing program: | ||||||||
| Beginning of period | 13.7 | 12.8 | ||||||
| End of period | (29.0 | ) | (13.7 | ) | ||||
| Adjusted cash flows used in operating activities | $ | (33.9 | ) | $ | (19.6 | ) | ||
| Adjusted EBITDA (In millions - unaudited) |
Three months ended August 31, |
Year ended May 31, |
||||||||||
| 2024 | 2023 | 2024 | ||||||||||
| Net income (loss) | $ | 18.0 | $ | (0.6 | ) | $ | 46.3 | |||||
| Income tax expense (benefit) | 6.9 | (6.9 | ) | 12.0 | ||||||||
| Other expense, net | 0.1 | –– | 0.4 | |||||||||
| Interest expense, net | 18.3 | 5.4 | 41.0 | |||||||||
| Depreciation and amortization | 13.5 | 8.4 | 41.2 | |||||||||
| Acquisition and integration expenses | 5.0 | 1.8 | 29.7 | |||||||||
| Investigation costs | 5.0 | 1.1 | 10.5 | |||||||||
| Contract termination/restructuring costs and loss provisions, net | 3.2 | –– | 4.8 | |||||||||
| Loss (Gain) related to sale of business/joint venture | (1.3 | ) | 0.7 | 2.8 | ||||||||
| Pension settlement charge | –– | 26.7 | 26.7 | |||||||||
| Russian bankruptcy court judgment | –– | 11.2 | 11.2 | |||||||||
| Severance charges | –– | –– | 0.5 | |||||||||
| Stock-based compensation | 5.0 | 4.3 | 15.3 | |||||||||
| Adjusted EBITDA | $ | 73.7 | $ | 52.1 | $ | 242.4 | ||||||
|
|
| Net debt (In millions - unaudited) |
August 31, 2024 |
August 31, 2023 |
||||||
| Total debt | $ | 992.0 | $ | 307.0 | ||||
| Less: Cash and cash equivalents | (49.3 | ) | (70.3 | ) | ||||
| Net debt | $ | 942.7 | $ | 236.7 | ||||
| Net debt to adjusted EBITDA (In millions - unaudited) |
||||
| Adjusted EBITDA for the year ended May 31, 2024 | $ | 242.4 | ||
| Less: Adjusted EBITDA for the three months ended August 31, 2023 | (52.1 | ) | ||
| Plus: Adjusted EBITDA for the three months ended August 31, 2024 | 73.7 | |||
| Adjusted EBITDA for the twelve months ended August 31, 2024 | $ | 264.0 | ||
| Net debt at August 31, 2024 | $ | 942.7 | ||
| Net debt to Adjusted EBITDA | 3.57 | |||
| Net debt to pro forma adjusted EBITDA (In millions - unaudited) |
||||
| AAR CORP. adjusted EBITDA for the twelve months ended August 31, 2024 | $ | 264.0 | ||
| Plus: Product Support adjusted EBITDA for the six months ended February 29, 2024 | 20.4 | |||
| Pro forma adjusted EBITDA for the twelve months ended August 31, 2024 | $ | 284.4 | ||
| AAR CORP. net debt at August 31, 2024 | $ | 942.7 | ||
| Net debt to pro forma adjusted EBITDA | 3.31 | |||
|
|
Exhibit 99.2

Fiscal Q 1 202 5 Earnings Call NYSE: AIR September 23 , 2024
Forward - looking statements 1 © 2024 AAR CORP. All rights reserved worldwide. Note: All results and expectations in the presentation reflect continuing operations unless otherwise noted. This presentation contains certain statements relating to future results, which are forward - looking statements as that term is defined in the Private Securities Litigation Reform Act of 1995, which reflect management’s expectations about future conditions, including, but not limited to continued demand in the commercial aviation market, the life and utilization of current generation aircraft, anticipated activities and benefits under extended, expanded and new services, supply and distribution agreements, opportunities for capital deployment and margin improvement, earnings performance, contributions from our recent acquisitions, the expansion of capacity in our hangars, expectations for our USM and parts supply businesses, and our 3 - 5 year organic targets. Forward - looking statements often address our expected future operating and financial performance and financial condition, or targets, goals, commitments, and other business plans, and often may also be identified because they contain words such as “anticipate,” “believe,” “continue,” “could,” “estimate,” “expect,” “intend,” “likely,” “may,” “might,” “plan,” “potential,” “predict,” “project,” “seek,” “should,” “target,” “will,” “would,” or similar expressions and the negatives of those terms. These forward - looking statements are based on the beliefs of Company management, as well as assumptions and estimates based on information available to the Company as of the dates such assumptions and estimates are made, and are subject to certain risks and uncertainties that could cause actual results to differ materially from historical results or those anticipated, depending on a variety of factors, including: (i) factors that adversely affect the commercial aviation industry; (ii) adverse events and negative publicity in the aviation industry; (iii) a reduction in sales to the U.S. government and its contractors; (iv) cost overruns and losses on fixed - price contracts; (v) nonperformance by subcontractors or suppliers; (vi) a reduction in outsourcing of maintenance activity by airlines; (vii) a shortage of skilled personnel or work stoppages; (viii) competition from other companies; (ix) financial, operational and legal risks arising as a result of operating internationally; (x) inability to integrate acquisitions effectively and execute operational and financial plans related to the acquisitions, such as the acquisition of Trax USA Corp. and the Product Support Business of Triumph Group Inc.; (xi) failure to realize the anticipated benefits of acquisitions; (xii) circumstances associated with divestitures; (xiii) inability to recover costs due to fluctuations in market values for aviation products and equipment; (xiv) cyber or other security threats or disruptions; (xv) a need to make significant capital expenditures to keep pace with technological developments in our industry; (xvi) restrictions on use of intellectual property and tooling important to our business; (xvii) inability to fully execute our stock repurchase program and return capital to stockholders; (xviii) limitations on our ability to access the debt and equity capital markets or to draw down funds under loan agreements; (xix) non - compliance with restrictive and financial covenants contained in our debt and loan agreements; (xx) changes in or non - compliance with laws and regulations related to federal contractors, the aviation industry, international operations, safety, and environmental matters, and the costs of complying with such laws and regulations; and (xxi) exposure to product liability and property claims that may be in excess of our liability insurance coverage. Should one or more of those risks or uncertainties materialize adversely, or should underlying assumptions or estimates prove incorrect, actual results may vary materially from those described. Those events and uncertainties are difficult or impossible to predict accurately and many are beyond our control. For a discussion of these and other risks and uncertainties, refer to our Annual Report on Form 10 - K, Part I, “Item 1A, Risk Factors” and our other filings filed from time to time with the U.S. Securities and Exchange Commission. We assume no obligation to update any forward - looking statements to reflect events or circumstances after the date of such statements or to reflect the occurrence of anticipated or unanticipated events. Non - GAAP Financial Measures: This presentation includes certain non - GAAP financial measures. Please refer to the Appendix for additional information on these non - GAAP financial measures and reconciliations to the comparable GAAP measures. Unless otherwise noted, the statements included and the information provided in this presentation are made as of September 23 , 2024.
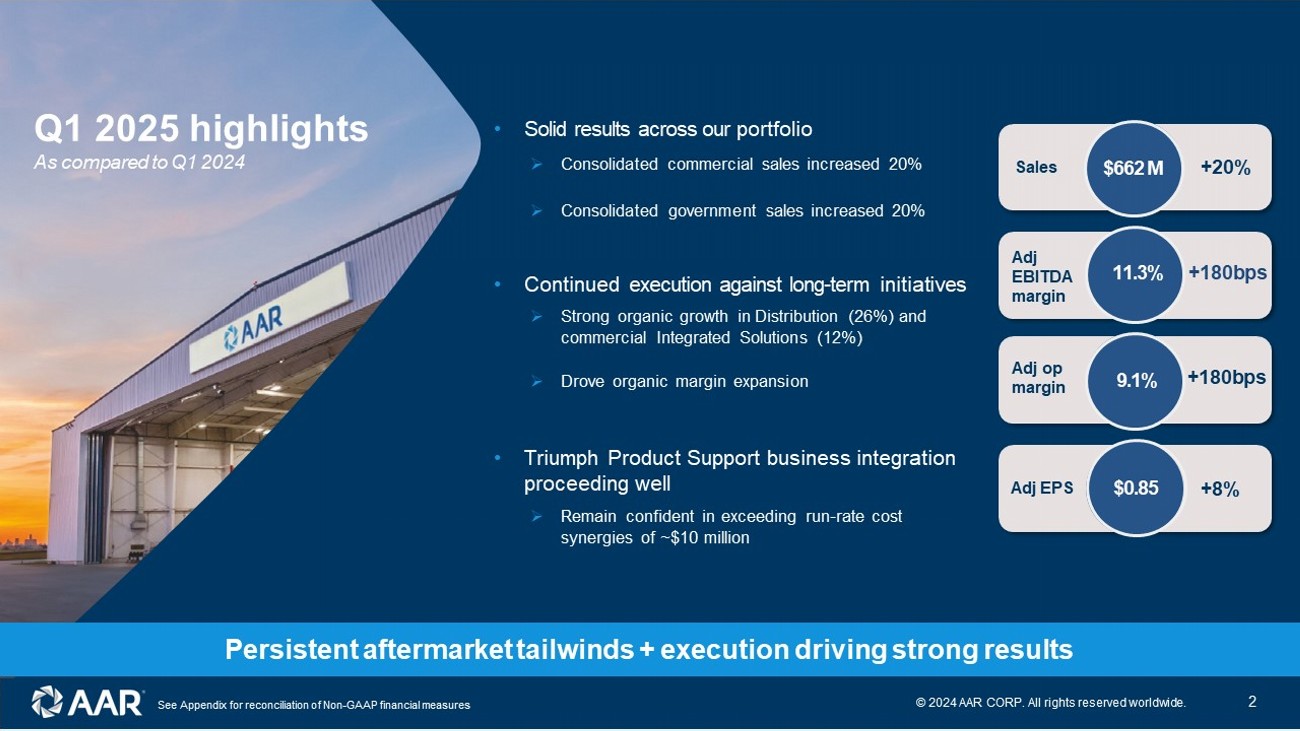
Q 1 202 5 highlights As compared to Q 1 202 4 Sales $6 62 M + 20 % Adj op margin 9. 1 % +1 8 0bps Adj EPS $0.8 5 + 8 % • Solid results across our portfolio » Consolidated commercial sales increased 20% » Consolidated government sales increased 20% • Continued execution against long - term initiatives » Strong organic growth in Distribution ( 26 %) and commercial Integrated Solutions (1 2 %) » Drove o rganic margin expansion • Triumph Product Support business integration proceeding well » Remain confident in exceeding run - rate cost synergies of ~$10 million Adj EBITDA margin 11.3 % + 180 bps 2 © 2024 AAR CORP. All rights reserved worldwide.
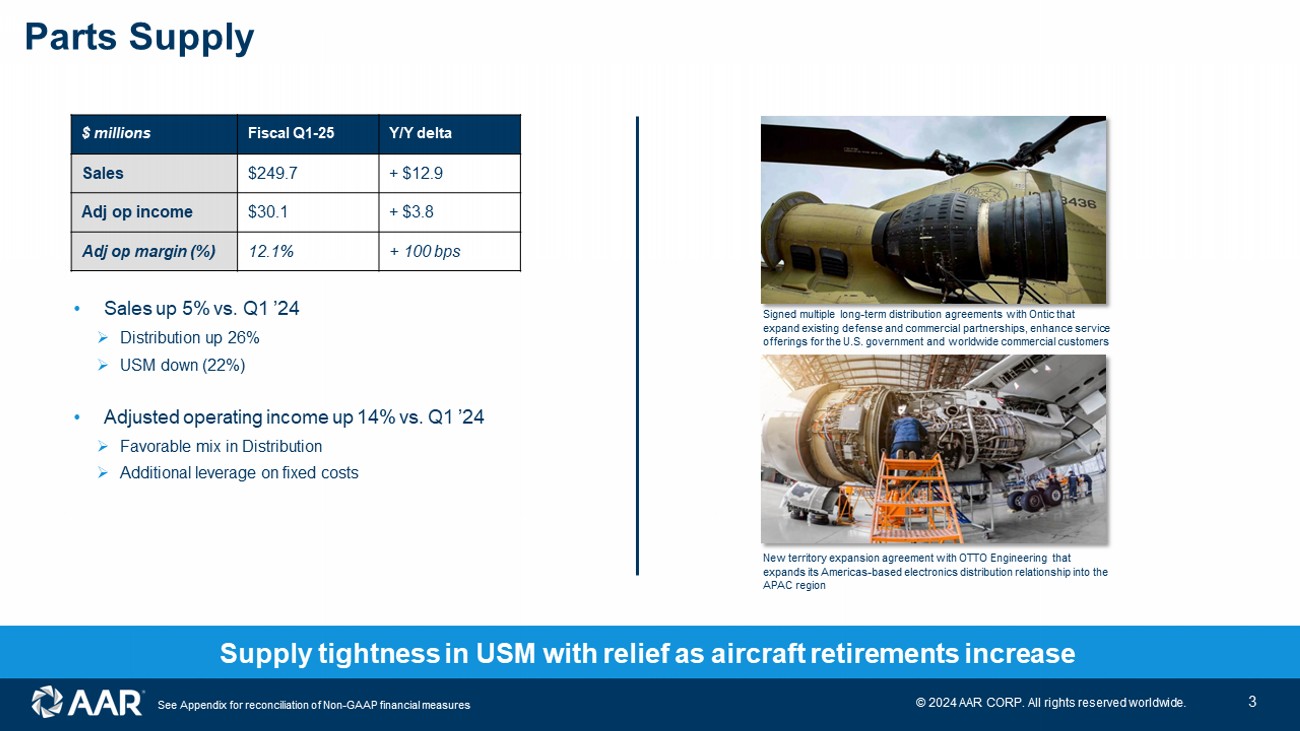
See Appendix for reconciliation of Non - GAAP financial measures Persistent aftermarket tailwinds + execution driving strong results • Sales up 5 % vs. Q 1 ’2 4 » Distribution up 26% » USM down ( 22 % ) • Adjusted operating income up 14 % vs. Q 1 ’2 4 » Favorable mix in Distribution » Additional leverage on fixed costs Parts Supply Y/Y delta Fiscal Q 1 - 25 $ millions + $ 12.9 $2 49.7 Sales + $ 3 . 8 $ 30.1 Adj op income + 100 bps 1 2.1 % Adj op margin (%) Signed multiple long - term distribution agreements with Ontic that expand existing defense and commercial partnerships, enhance service offerings for the U.S. government and worldwide commercial customers New territory expansion agreement with OTTO Engineering that expands its Americas - based electronics distribution relationship into the APAC region . Supply tightness in USM with relief as aircraft retirements increase 3 © 2024 AAR CORP. All rights reserved worldwide.
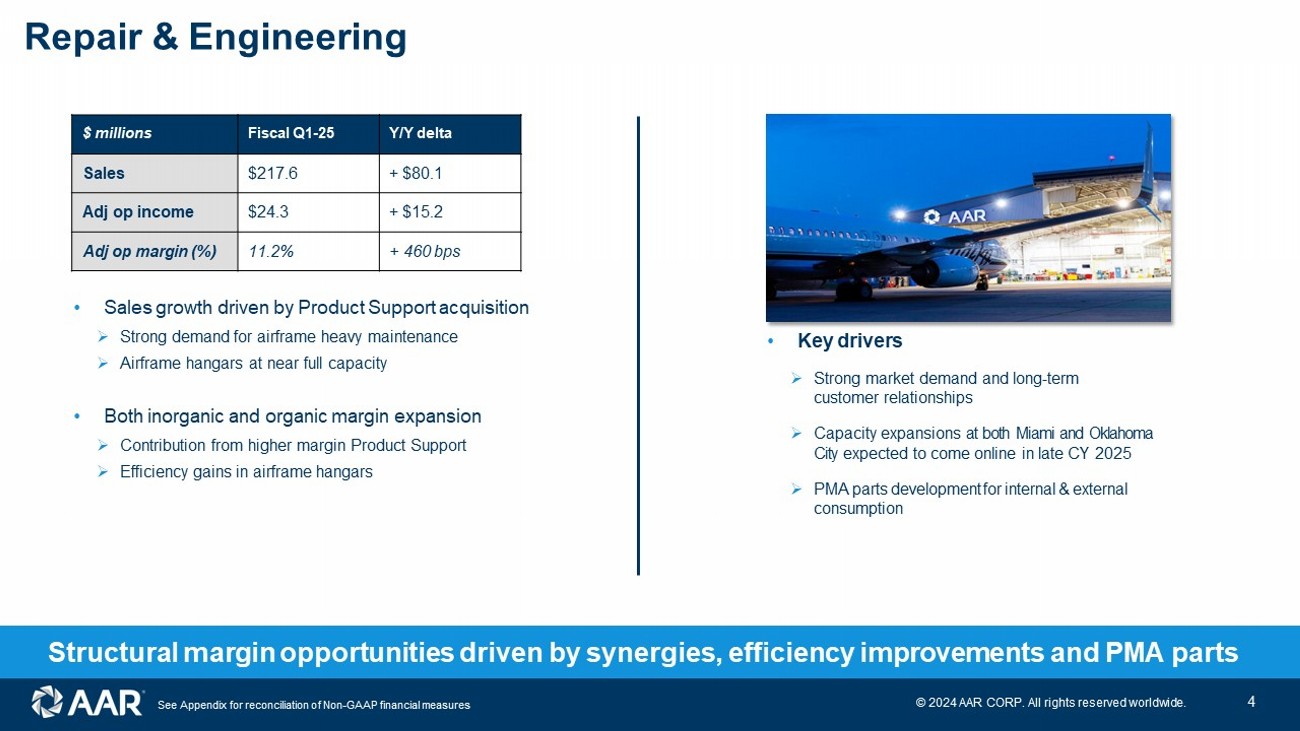
See Appendix for reconciliation of Non - GAAP financial measures • Sales growth driven by Product Support acquisition » Strong demand for airframe heavy maintenance » Airframe hangars a t near full capacity • Both inorganic and organic margin expansion » Contribution from higher margin Product Support » Efficiency gains in airframe hangars Repair & Engineering Structural margin opportunities driven by synergies, efficiency improvements and PMA parts • Key drivers » Strong market demand and long - term customer relationships » Capacity expansions at both Miami and Oklahoma City expected to come online in late CY 2025 » PMA parts development for internal & external consumption Y/Y delta Fiscal Q 1 - 25 $ millions + $ 80.1 $2 17 . 6 Sales + $15. 2 $2 4 . 3 Adj op income + 4 60 bps 11. 2 % Adj op margin (%) 4 © 2024 AAR CORP. All rights reserved worldwide.
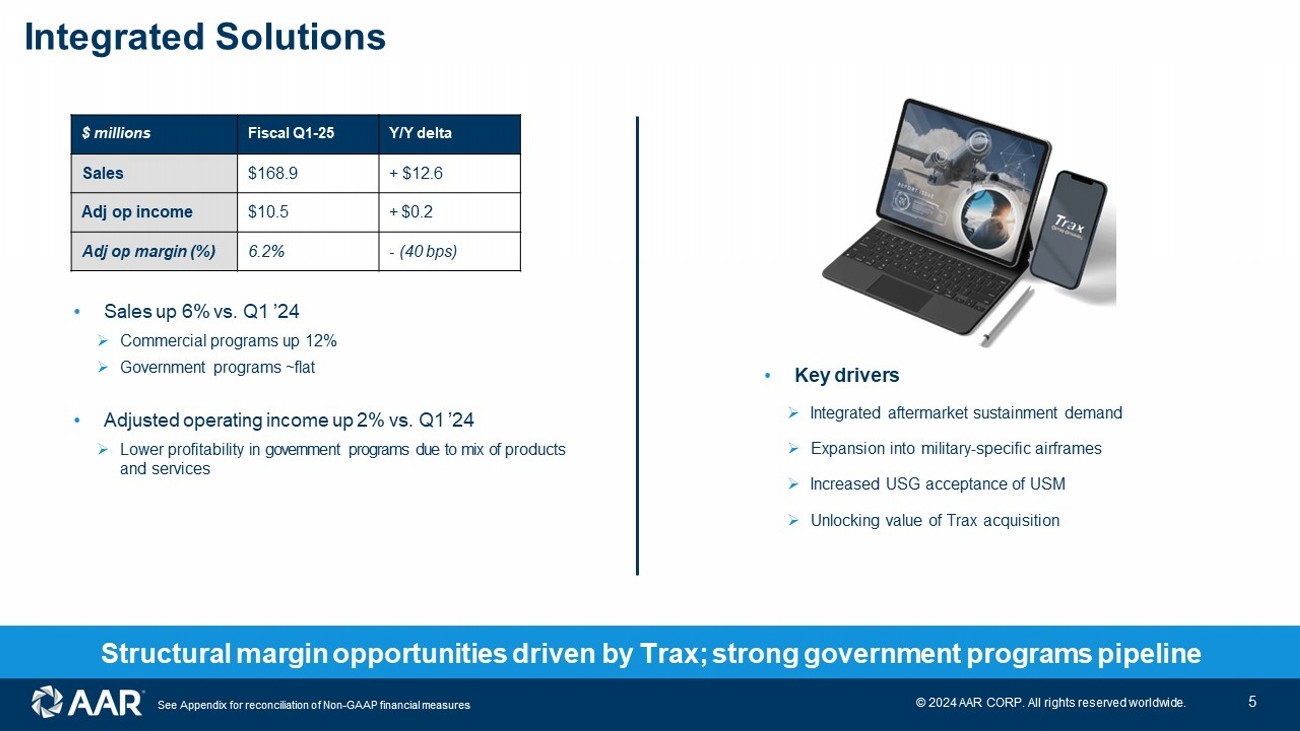
See Appendix for reconciliation of Non - GAAP financial measures • Sales up 6 % vs. Q 1 ’2 4 » Commercial programs up 12 % » Government programs ~flat • Adjusted operating income up 2 % vs. Q 1 ’2 4 » Lower profitability in government programs due to mix of products and services Integrated Solutions Structural margin opportunities driven by Trax; strong government programs pipeline Y/Y delta Fiscal Q 1 - 25 $ millions + $ 12.6 $16 8.9 S ales + $0. 2 $ 10 . 5 Adj op income - (40 bps) 6.2% Adj op margin (%) • Key drivers » Integrated aftermarket sustainment demand » Expansion into military - specific airframes » Increased USG acceptance of USM » Unlocking value of Trax acquisition 5 © 2024 AAR CORP. All rights reserved worldwide. See Appendix for reconciliation of Non - GAAP financial measures Non - GAAP financial measures 8 © 2024 AAR CORP.

Appendix
All rights reserved worldwide. This presentation includes financial results for the Company with respect to adjusted diluted earnings per share from continuing operations, adjusted sales, adjusted EBITDA and adjusted operating income, which are “non - GAAP financial measures” as defined in Regulation G of the Securities Exchange Act of 1934, as amended (the “Exchange Act”). We believe these non - GAAP financial measures are relevant and useful for investors as they illustrate our actual operating performance unaffected by the impact of certain items. When reviewed in conjunction with our GAAP results and the accompanying reconciliations, we believe these non - GAAP financial measures provide additional information that is useful to gain an understanding of the factors and trends affecting our business and provide a means by which to compare our operating performance against that of other companies in the industries we compete. These non - GAAP measures should be considered as a supplement to, and not as a substitute for, or superior to, the corresponding measures calculated in accordance with GAAP. Adjusted EBITDA is income from continuing operations before interest income (expense), other income (expense), income taxes, depreciation and amortization, stock - based compensation, and items of an unusual nature including but not limited to business divestitures and acquisitions, workforce actions, COVID - related subsidies and costs, impairment and exit charges, facility consolidation and repositioning costs, investigation and remediation compliance costs, equity investment gains and losses, pension settlement charges, legal judgments, acquisition, integration and amortization expenses from recent acquisition activity, and significant customer events such as early terminations, contract restructurings, forward loss provisions, and bankruptcies. Adjusted operating income is adjusted EBITDA gross of depreciation and amortization and stock - based compensation. Pursuant to the requirements of Regulation G of the Exchange Act, we provide tables that reconcile the above - mentioned non - GAAP financial measures to the most directly comparable GAAP financial measures in the Appendix at the end of this presentation. The Company is not providing a reconciliation of forward - looking adjusted operating margin, adjusted EBITDA margin, and adjusted EPS growth to the most directly comparable forward - looking GAAP measure because the information is not available without unreasonable effort. This is due to the inherent difficulty of forecasting the timing and amount of certain items, such as, but not limited to, unusual gains and losses, the ultimate outcome of pending litigation, the impact and timing of potential acquisitions and divestitures, and other structural changes or their probable significance. Each of the adjustments has not occurred, are out of the Company's control and/or cannot be reasonably predicted. For this reason, the Company is unable to address the probable significance of the unavailable information.
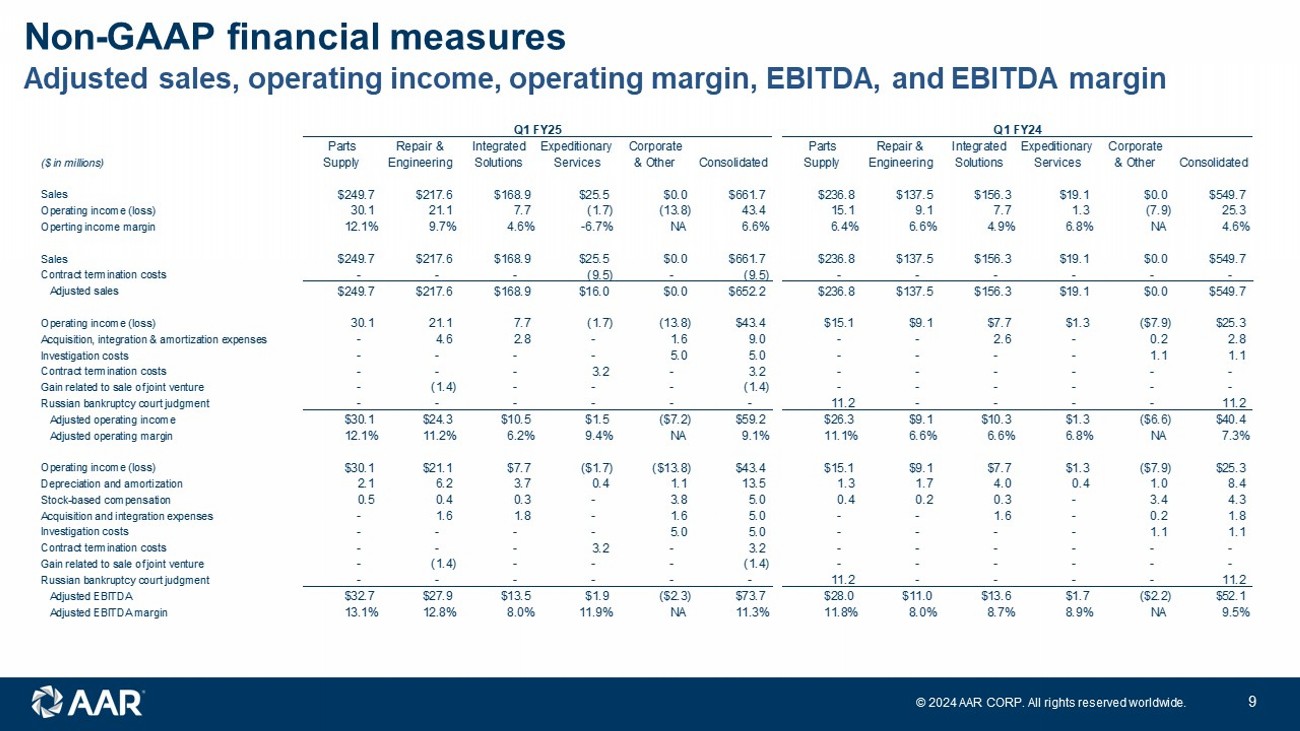
Non - GAAP financial measures A djusted sales, operating income, operating margin, EBITDA, and EBITDA margin 9 © 2024 AAR CORP. All rights reserved worldwide. Q1 FY25 Q1 FY24 Parts Repair & Integrated Expeditionary Corporate Parts Repair & Integrated Expeditionary Corporate ($ in millions) Supply Engineering Solutions Services & Other Consolidated Supply Engineering Solutions Services & Other Consolidated Sales $249.7 $217.6 $168.9 $25.5 $0.0 $661.7 $236.8 $137.5 $156.3 $19.1 $0.0 $549.7 Operating income (loss) 30.1 21.1 7.7 (1.7) (13.8) 43.4 15.1 9.1 7.7 1.3 (7.9) 25.3 Operting income margin 12.1% 9.7% 4.6% -6.7% NA 6.6% 6.4% 6.6% 4.9% 6.8% NA 4.6% Sales $249.7 $217.6 $168.9 $25.5 $0.0 $661.7 $236.8 $137.5 $156.3 $19.1 $0.0 $549.7 Contract termination costs - - - (9.5) - (9.5) - - - - - - Adjusted sales $249.7 $217.6 $168.9 $16.0 $0.0 $652.2 $236.8 $137.5 $156.3 $19.1 $0.0 $549.7 Operating income (loss) 30.1 21.1 7.7 (1.7) (13.8) $43.4 $15.1 $9.1 $7.7 $1.3 ($7.9) $25.3 Acquisition, integration & amortization expenses - 4.6 2.8 - 1.6 9.0 - - 2.6 - 0.2 2.8 Investigation costs - - - - 5.0 5.0 - - - - 1.1 1.1 Contract termination costs - - - 3.2 - 3.2 - - - - - - Gain related to sale of joint venture - (1.4) - - - (1.4) - - - - - - Russian bankruptcy court judgment - - - - - - 11.2 - - - - 11.2 Adjusted operating income $30.1 $24.3 $10.5 $1.5 ($7.2) $59.2 $26.3 $9.1 $10.3 $1.3 ($6.6) $40.4 Adjusted operating margin 12.1% 11.2% 6.2% 9.4% NA 9.1% 11.1% 6.6% 6.6% 6.8% NA 7.3% Operating income (loss) $30.1 $21.1 $7.7 ($1.7) ($13.8) $43.4 $15.1 $9.1 $7.7 $1.3 ($7.9) $25.3 Depreciation and amortization 2.1 6.2 3.7 0.4 1.1 13.5 1.3 1.7 4.0 0.4 1.0 8.4 Stock-based compensation 0.5 0.4 0.3 - 3.8 5.0 0.4 0.2 0.3 - 3.4 4.3 Acquisition and integration expenses - 1.6 1.8 - 1.6 5.0 - - 1.6 - 0.2 1.8 Investigation costs - - - - 5.0 5.0 - - - - 1.1 1.1 Contract termination costs - - - 3.2 - 3.2 - - - - - - Gain related to sale of joint venture - (1.4) - - - (1.4) - - - - - - Russian bankruptcy court judgment - - - - - - 11.2 - - - - 11.2 Adjusted EBITDA $32.7 $27.9 $13.5 $1.9 ($2.3) $73.7 $28.0 $11.0 $13.6 $1.7 ($2.2) $52.1 Adjusted EBITDA margin 13.1% 12.8% 8.0% 11.9% NA 11.3% 11.8% 8.0% 8.7% 8.9% NA 9.5% Non - GAAP financial measures Adjusted EBITDA and EBITDA margin 1 1 © 2024 AAR CORP.
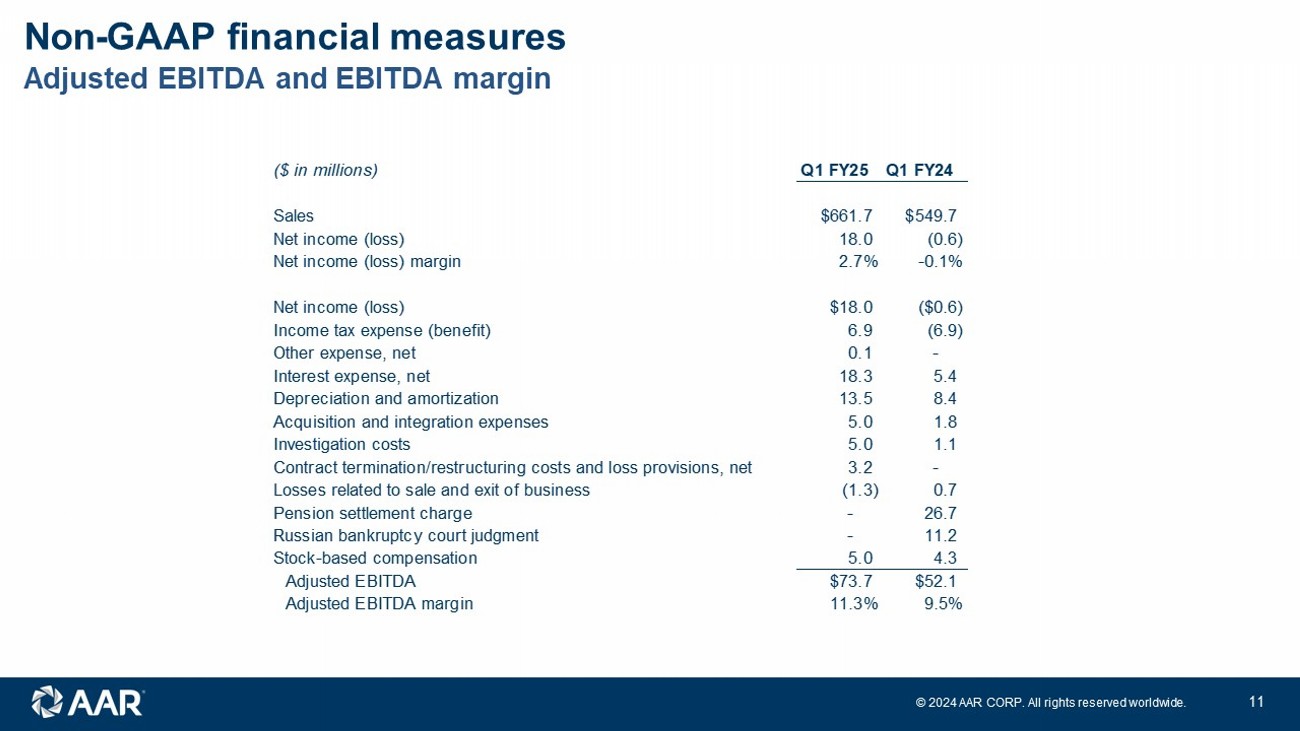
All rights reserved worldwide. ($ in millions) Q1 FY25 Q1 FY24 Sales $661.7 $549.7 Net income (loss) 18.0 (0.6) Net income (loss) margin 2.7% -0.1% Net income (loss) $18.0 ($0.6) Income tax expense (benefit) 6.9 (6.9) Other expense, net 0.1 - Interest expense, net 18.3 5.4 Depreciation and amortization 13.5 8.4 Acquisition and integration expenses 5.0 1.8 Investigation costs 5.0 1.1 Contract termination/restructuring costs and loss provisions, net 3.2 - Losses related to sale and exit of business (1.3) 0.7 Pension settlement charge - 26.7 Russian bankruptcy court judgment - 11.2 Stock-based compensation 5.0 4.3 Adjusted EBITDA $73.7 $52.1 Adjusted EBITDA margin 11.3% 9.5% Non - GAAP financial measures Adjusted diluted earnings per share 1 2 © 2024 AAR CORP.
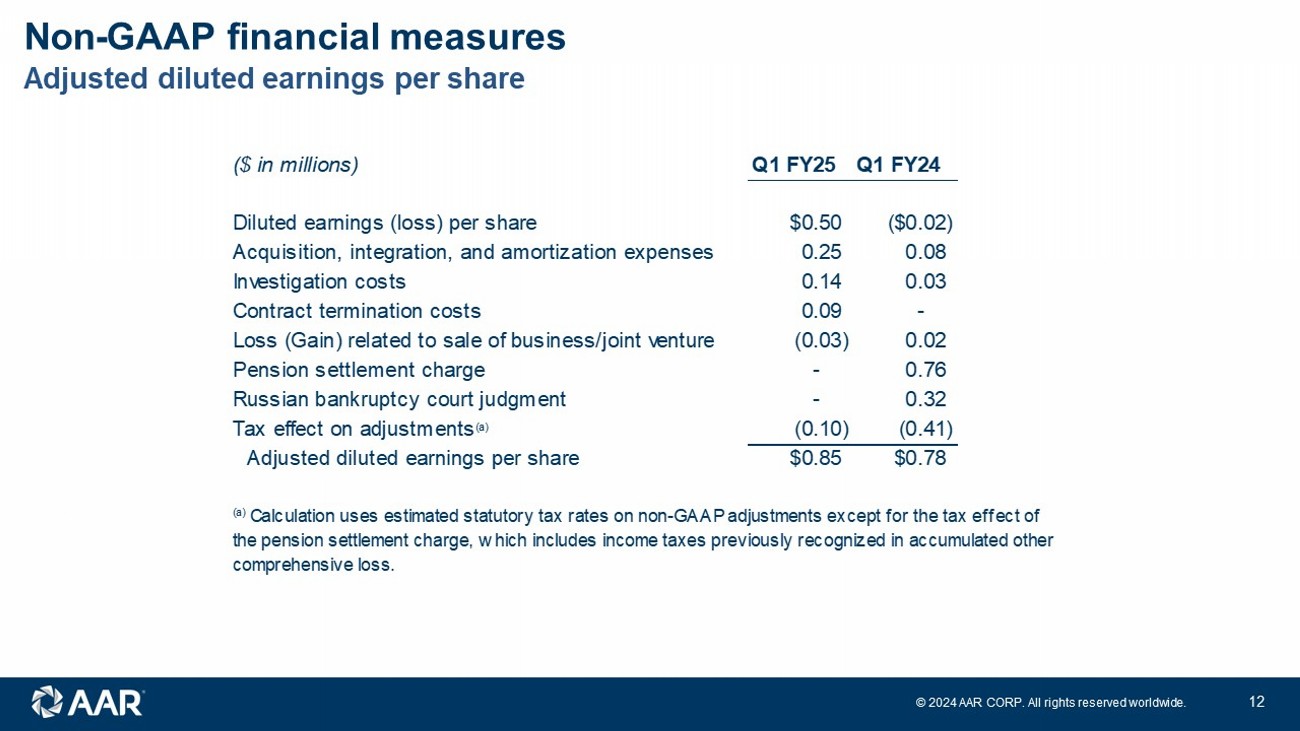
All rights reserved worldwide. ($ in millions) Q1 FY25 Q1 FY24 Diluted earnings (loss) per share $0.50 ($0.02) Acquisition, integration, and amortization expenses 0.25 0.08 Investigation costs 0.14 0.03 Contract termination costs 0.09 - Loss (Gain) related to sale of business/joint venture (0.03) 0.02 Pension settlement charge - 0.76 Russian bankruptcy court judgment - 0.32 Tax effect on adjustments (a) (0.10) (0.41) Adjusted diluted earnings per share $0.85 $0.78 (a) Calculation uses estimated statutory tax rates on non-GAAP adjustments except for the tax effect of the pension settlement charge, which includes income taxes previously recognized in accumulated other comprehensive loss.