
| Maryland | 001-13145 | 36-4150422 | ||||||||||||
| (State or other jurisdiction | (Commission File Number) | (I.R.S. Employer | ||||||||||||
| of incorporation or organization) | Identification No.) | |||||||||||||
| 200 East Randolph Drive, | Chicago, | IL | 60601 | |||||||||||||||||||||||
| (Address of principal executive offices) | (Zip Code) | |||||||||||||||||||||||||
| Registrant's telephone number, including area code: | (312) | 782-5800 | ||||||||||||||||||||||||
Former name or former address, if changed since last report: Not Applicable |
||||||||||||||||||||||||||
| ☐ | Written communications pursuant to Rule 425 under Securities Act (17 CFR 230.425) | ||||
| ☐ | Soliciting material pursuant to Rule 14a-12 under the Exchange Act (17 CFR 240.14a-12) | ||||
| ☐ | Pre-commencement communications pursuant to Rule 14d-2(b) under the Exchange Act (17 CFR 240.14d-2(b)) | ||||
| ☐ | Pre-commencement communications pursuant to Rule 13e-4(c) under the Exchange Act (17 CFR 240.13e-4(c)) | ||||
| Title of each class | Trading Symbol | Name of each exchange on which registered | ||||||||||||
| Common Stock, par value $0.01 | JLL | The New York Stock Exchange | ||||||||||||
| News release issued by Jones Lang LaSalle Incorporated on August 6, 2025 announcing its | |||||
| financial results for the second quarter ended June 30, 2025. | |||||
| 104 | Cover Page Interactive Data File (embedded within the Inline XBRL document) | ||||
| Dated: August 6, 2025 | |||||||||||
| Jones Lang LaSalle Incorporated | |||||||||||
| By: /s/ Kelly Howe | |||||||||||
| Name: Kelly Howe | |||||||||||
| Title: Chief Financial Officer | |||||||||||
| News Release |  |
|||||||||||||
|
Summary Financial Results
($ in millions, except per share data, "LC" = local currency)
|
Three Months Ended June 30, | Six Months Ended June 30, | |||||||||||||||||||||||||||||||||
| 2025 | 2024 | % Change in USD | % Change in LC | 2025 | 2024 | % Change in USD | % Change in LC | ||||||||||||||||||||||||||||
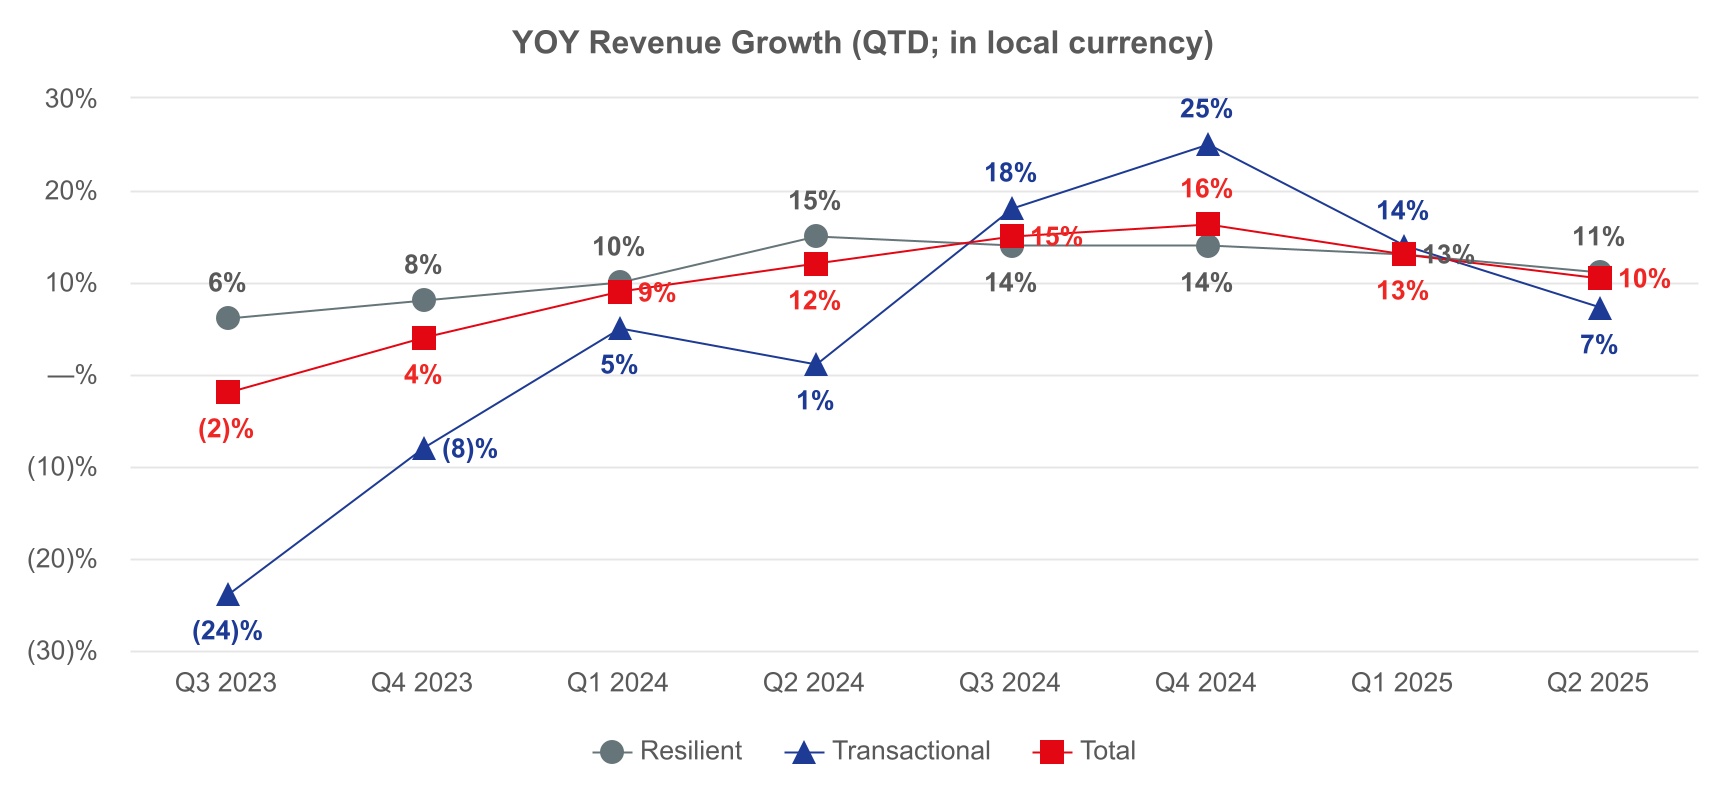
| Revenue | $ | 6,250.1 | $ | 5,628.7 | 11 | % | 10 | % | $ | 11,996.5 | $ | 10,753.2 | 12 | % | 12 | % | |||||||||||||||||||
| Net income attributable to common shareholders | $ | 112.3 | $ | 84.4 | 33 | % | 32 | % | $ | 167.6 | $ | 150.5 | 11 | % | 10 | % | |||||||||||||||||||
Adjusted net income attributable to common shareholders1 |
159.4 | 123.2 | 29 | 29 | 271.0 | 209.2 | 30 | 28 | |||||||||||||||||||||||||||
| Diluted earnings per share | $ | 2.32 | $ | 1.75 | 33 | % | 32 | % | $ | 3.46 | $ | 3.12 | 11 | % | 10 | % | |||||||||||||||||||
Adjusted diluted earnings per share1 |
3.30 | 2.55 | 29 | 29 | 5.60 | 4.33 | 29 | 28 | |||||||||||||||||||||||||||
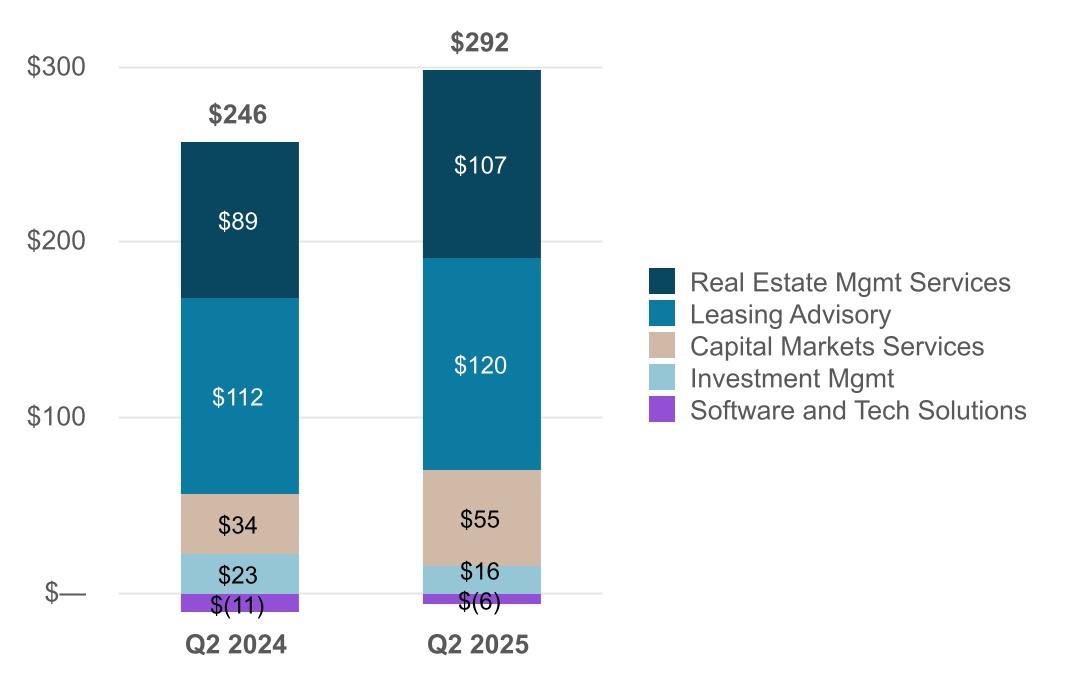
Adjusted EBITDA1 |
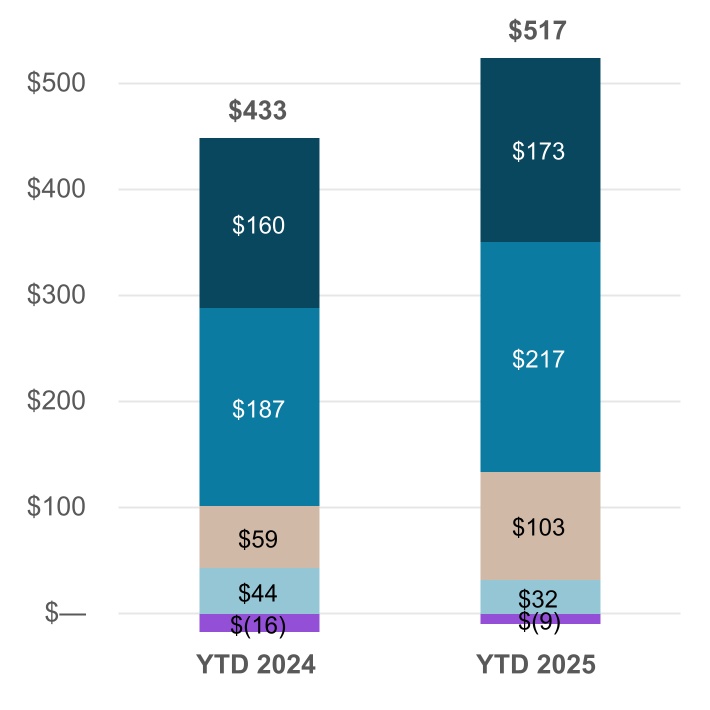
$ | 291.7 | $ | 246.3 | 18 | % | 17 | % | $ | 516.5 | $ | 433.4 | 19 | % | 19 | % | |||||||||||||||||||
| Cash flows from operating activities | $ | 332.8 | $ | 273.9 | 22 | % | n/a | $ | (434.8) | $ | (403.6) | (8) | % | n/a | |||||||||||||||||||||
Free Cash Flow6 |
288.4 | 235.7 | 22 | % | n/a | (523.7) | (485.0) | (8) | % | n/a | |||||||||||||||||||||||||
|
Consolidated
($ in millions, "LC" = local currency) |
Three Months Ended June 30, | % Change in USD | % Change in LC | Six Months Ended June 30, | % Change in USD | % Change in LC | |||||||||||||||||||||||||||||||||||||||||
| 2025 | 2024 | 2025 | 2024 | ||||||||||||||||||||||||||||||||||||||||||||
| Real Estate Management Services | $ | 4,894.0 | $ | 4,369.9 | 12 | % | 11 | % | $ | 9,463.4 | $ | 8,439.1 | 12 | % | 12 | % | |||||||||||||||||||||||||||||||
| Leasing Advisory | 676.8 | 642.2 | 5 | 5 | 1,262.9 | 1,162.6 | 9 | 9 | |||||||||||||||||||||||||||||||||||||||
| Capital Markets Services | 520.3 | 457.6 | 14 | 12 | 955.6 | 835.2 | 14 | 14 | |||||||||||||||||||||||||||||||||||||||
| Investment Management | 103.1 | 102.6 | — | (2) | 201.6 | 206.0 | (2) | (3) | |||||||||||||||||||||||||||||||||||||||
| Software and Technology Solutions | 55.9 | 56.4 | (1) | (1) | 113.0 | 110.3 | 2 | 3 | |||||||||||||||||||||||||||||||||||||||
| Total revenue | $ | 6,250.1 | $ | 5,628.7 | 11 | % | 10 | % | $ | 11,996.5 | $ | 10,753.2 | 12 | % | 12 | % | |||||||||||||||||||||||||||||||
Gross contract costs6 |
$ | 4,186.8 | $ | 3,747.4 | 12 | % | 11 | % | $ | 8,129.1 | $ | 7,246.1 | 12 | % | 13 | % | |||||||||||||||||||||||||||||||
| Platform operating expenses | 1,844.6 | 1,717.4 | 7 | 6 | 3,509.0 | 3,227.3 | 9 | 9 | |||||||||||||||||||||||||||||||||||||||
Restructuring and acquisition charges5 |
21.3 | 11.5 | 85 | 87 | 41.0 | 13.2 | 211 | 213 | |||||||||||||||||||||||||||||||||||||||
| Total operating expenses | $ | 6,052.7 | $ | 5,476.3 | 11 | % | 10 | % | $ | 11,679.1 | $ | 10,486.6 | 11 | % | 12 | % | |||||||||||||||||||||||||||||||
Net non-cash MSR and mortgage banking derivative activity1 |
$ | (4.2) | $ | (11.8) | 64 | % | 64 | % | $ | (17.1) | $ | (20.8) | 18 | % | 18 | % | |||||||||||||||||||||||||||||||
Note: For discussion and reconciliation of non-GAAP financial measures, see the Notes following the Financial Statements in this news release. Percentage variances in the Performance Highlights below are calculated and presented on a local currency basis, unless otherwise noted. | |||||||||||||||||||||||||||||||||||||||||||||||
|
($ in millions, except per share data, "LC" = local currency)
|
Three Months Ended June 30, | Six Months Ended June 30, | |||||||||||||||||||||||||||||||||
| 2025 | 2024 | % Change in USD | % Change in LC | 2025 | 2024 | % Change in USD | % Change in LC | ||||||||||||||||||||||||||||
| Net income attributable to common shareholders | $ | 112.3 | $ | 84.4 | 33 | % | 32 | % | $ | 167.6 | $ | 150.5 | 11 | % | 10 | % | |||||||||||||||||||
Adjusted net income attributable to common shareholders1 |
159.4 | 123.2 | 29 | 29 | 271.0 | 209.2 | 30 | 28 | |||||||||||||||||||||||||||
| Diluted earnings per share | $ | 2.32 | $ | 1.75 | 33 | % | 32 | % | $ | 3.46 | $ | 3.12 | 11 | % | 10 | % | |||||||||||||||||||
Adjusted diluted earnings per share1 |
3.30 | 2.55 | 29 | 29 | 5.60 | 4.33 | 29 | 28 | |||||||||||||||||||||||||||
Adjusted EBITDA1 |
$ | 291.7 | $ | 246.3 | 18 | % | 17 | % | $ | 516.5 | $ | 433.4 | 19 | % | 19 | % | |||||||||||||||||||
| Effective tax rate ("ETR") | 19.5 | % | 19.5 | % | 0 bps | n/a | 19.5 | % | 19.5 | % | 0 bps | n/a | |||||||||||||||||||||||
|
($ in millions)
|
Three Months Ended June 30, | Six Months Ended June 30, | |||||||||||||||||||||||||||
| 2025 | 2024 | Change in USD | 2025 | 2024 | Change in USD | ||||||||||||||||||||||||
| Cash flows from operating activities | $ | 332.8 | $ | 273.9 | 22 | % | $ | (434.8) | $ | (403.6) | (8) | % | |||||||||||||||||
Free Cash Flow6 |
288.4 | 235.7 | 22 | % | (523.7) | (485.0) | (8) | % | |||||||||||||||||||||
| Three Months Ended June 30, | Six Months Ended June 30, | ||||||||||||||||
| 2025 | 2024 | 2025 | 2024 | ||||||||||||||
| Total number of shares repurchased (in thousands) | 176.5 | 103.7 | 251.8 | 214.4 | |||||||||||||
| Total paid for shares repurchased (in millions) | $ | 41.4 | $ | 20.1 | $ | 61.2 | $ | 40.2 | |||||||||
| June 30, 2025 | March 31, 2025 | June 30, 2024 | |||||||||||||||
| Net Debt (in millions) | $ | 1,586.7 | $ | 1,754.0 | $ | 1,752.0 | |||||||||||
| Net Leverage Ratio | 1.2x | 1.4x | 1.7x | ||||||||||||||
| Corporate Liquidity (in millions) | $ | 3,321.4 | $ | 3,312.4 | $ | 2,449.4 | |||||||||||
|
Real Estate Management Services
($ in millions, "LC" = local currency) |
Three Months Ended June 30, | % Change in USD | % Change in LC | Six Months Ended June 30, | % Change in USD | % Change in LC | |||||||||||||||||||||||||||||||||||||||||
| 2025 | 2024 | 2025 | 2024 | ||||||||||||||||||||||||||||||||||||||||||||
| Revenue | $ | 4,894.0 | $ | 4,369.9 | 12 | % | 11 | % | $ | 9,463.4 | $ | 8,439.1 | 12 | % | 12 | % | |||||||||||||||||||||||||||||||
| Workplace Management | 3,349.1 | 3,021.1 | 11 | 10 | 6,612.7 | 5,892.8 | 12 | 13 | |||||||||||||||||||||||||||||||||||||||
| Project Management | 971.6 | 788.1 | 23 | 22 | 1,719.1 | 1,444.5 | 19 | 19 | |||||||||||||||||||||||||||||||||||||||
| Property Management | 454.4 | 436.6 | 4 | 4 | 900.0 | 866.3 | 4 | 4 | |||||||||||||||||||||||||||||||||||||||
| Portfolio Services and Other | 118.9 | 124.1 | (4) | (5) | 231.6 | 235.5 | (2) | (2) | |||||||||||||||||||||||||||||||||||||||
| Segment operating expenses | $ | 4,816.5 | $ | 4,309.6 | 12 | % | 11 | % | $ | 9,349.1 | $ | 8,336.8 | 12 | % | 12 | % | |||||||||||||||||||||||||||||||
| Segment platform operating expenses | 643.5 | 592.5 | 9 | 7 | 1,245.8 | 1,150.6 | 8 | 9 | |||||||||||||||||||||||||||||||||||||||
Gross contract costs6 |
4,173.0 | 3,717.1 | 12 | 12 | 8,103.3 | 7,186.2 | 13 | 13 | |||||||||||||||||||||||||||||||||||||||
Adjusted EBITDA1 |
$ | 106.6 | $ | 88.6 | 20 | % | 19 | % | $ | 172.9 | $ | 160.0 | 8 | % | 7 | % | |||||||||||||||||||||||||||||||
| Note: For discussion and reconciliation of non-GAAP financial measures, see the Notes following the Financial Statements in this news release. Percentage variances in the Performance Highlights below are calculated and presented on a local currency basis, unless otherwise noted. | |||||||||||||||||||||||||||||||||||||||||||||||
|
Leasing Advisory
($ in millions, "LC" = local currency) |
Three Months Ended June 30, | % Change in USD | % Change in LC | Six Months Ended June 30, | % Change in USD | % Change in LC | |||||||||||||||||||||||||||||||||||||||||
| 2025 | 2024 | 2025 | 2024 | ||||||||||||||||||||||||||||||||||||||||||||
| Revenue | $ | 676.8 | $ | 642.2 | 5 | % | 5 | % | $ | 1,262.9 | $ | 1,162.6 | 9 | % | 9 | % | |||||||||||||||||||||||||||||||
| Leasing | 651.5 | 619.1 | 5 | 5 | 1,217.6 | 1,116.4 | 9 | 9 | |||||||||||||||||||||||||||||||||||||||
| Advisory, Consulting and Other | 25.3 | 23.1 | 10 | 8 | 45.3 | 46.2 | (2) | (2) | |||||||||||||||||||||||||||||||||||||||
| Segment operating expenses | $ | 567.8 | $ | 539.3 | 5 | % | 5 | % | $ | 1,069.0 | $ | 994.2 | 8 | % | 8 | % | |||||||||||||||||||||||||||||||
| Segment platform operating expenses | 564.5 | 531.0 | 6 | 6 | 1,063.7 | 979.5 | 9 | 9 | |||||||||||||||||||||||||||||||||||||||
Gross contract costs6 |
3.3 | 8.3 | (60) | (60) | 5.3 | 14.7 | (64) | (64) | |||||||||||||||||||||||||||||||||||||||
Adjusted EBITDA1 |
$ | 120.4 | $ | 112.1 | 7 | % | 6 | % | $ | 217.4 | $ | 186.9 | 16 | % | 15 | % | |||||||||||||||||||||||||||||||
| Note: For discussion and reconciliation of non-GAAP financial measures, see the Notes following the Financial Statements in this news release. Percentage variances in the Performance Highlights below are calculated and presented on a local currency basis, unless otherwise noted. | |||||||||||||||||||||||||||||||||||||||||||||||
|
Capital Markets Services
($ in millions, "LC" = local currency) |
Three Months Ended June 30, | % Change in USD | % Change in LC | Six Months Ended June 30, | % Change in USD | % Change in LC | |||||||||||||||||||||||||||||||||||||||||
| 2025 | 2024 | 2025 | 2024 | ||||||||||||||||||||||||||||||||||||||||||||
| Revenue | $ | 520.3 | $ | 457.6 | 14 | % | 12 | % | $ | 955.6 | $ | 835.2 | 14 | % | 14 | % | |||||||||||||||||||||||||||||||
| Investment Sales, Debt/Equity Advisory and Other, excluding Net non-cash MSR | 384.8 | 332.1 | 16 | 14 | 710.3 | 599.8 | 18 | 18 | |||||||||||||||||||||||||||||||||||||||
| Net non-cash MSR and mortgage banking derivative activity | (4.2) | (11.8) | 64 | 64 | (17.1) | (20.8) | 18 | 18 | |||||||||||||||||||||||||||||||||||||||
| Value and Risk Advisory | 97.7 | 95.8 | 2 | — | 179.3 | 176.0 | 2 | 2 | |||||||||||||||||||||||||||||||||||||||
| Loan Servicing | 42.0 | 41.5 | 1 | 1 | 83.1 | 80.2 | 4 | 4 | |||||||||||||||||||||||||||||||||||||||
| Segment operating expenses | $ | 488.3 | $ | 453.5 | 8 | % | 6 | % | $ | 908.5 | $ | 831.9 | 9 | % | 9 | % | |||||||||||||||||||||||||||||||
| Segment platform operating expenses | 486.6 | 441.7 | 10 | 9 | 905.7 | 806.5 | 12 | 12 | |||||||||||||||||||||||||||||||||||||||
Gross contract costs6 |
1.7 | 11.8 | (86) | (85) | 2.8 | 25.4 | (89) | (89) | |||||||||||||||||||||||||||||||||||||||
Adjusted EBITDA1 |
$ | 54.7 | $ | 33.8 | 62 | % | 61 | % | $ | 103.3 | $ | 58.8 | 76 | % | 73 | % | |||||||||||||||||||||||||||||||
| Note: For discussion and reconciliation of non-GAAP financial measures, see the Notes following the Financial Statements in this news release. Percentage variances in the Performance Highlights below are calculated and presented on a local currency basis, unless otherwise noted. | |||||||||||||||||||||||||||||||||||||||||||||||
|
Investment Management
($ in millions, "LC" = local currency) |
Three Months Ended June 30, | % Change in USD | % Change in LC | Six Months Ended June 30, | % Change in USD | % Change in LC | |||||||||||||||||||||||||||||||||||||||||
| 2025 | 2024 | 2025 | 2024 | ||||||||||||||||||||||||||||||||||||||||||||
| Revenue | $ | 103.1 | $ | 102.6 | — | % | (2) | % | $ | 201.6 | $ | 206.0 | (2) | % | (3) | % | |||||||||||||||||||||||||||||||
| Advisory fees | 93.3 | 93.1 | — | (2) | 182.6 | 185.4 | (2) | (2) | |||||||||||||||||||||||||||||||||||||||
| Transaction fees and other | 6.5 | 6.9 | (6) | (9) | 15.0 | 15.8 | (5) | (6) | |||||||||||||||||||||||||||||||||||||||
| Incentive fees | 3.3 | 2.6 | 27 | 24 | 4.0 | 4.8 | (17) | (19) | |||||||||||||||||||||||||||||||||||||||
| Segment operating expenses | $ | 89.5 | $ | 90.3 | (1) | % | (3) | % | $ | 175.2 | $ | 174.9 | — | % | — | % | |||||||||||||||||||||||||||||||
| Segment platform operating expenses | 81.2 | 81.5 | — | (3) | 158.7 | 157.7 | 1 | — | |||||||||||||||||||||||||||||||||||||||
Gross contract costs6 |
8.3 | 8.8 | (6) | (5) | 16.5 | 17.2 | (4) | (4) | |||||||||||||||||||||||||||||||||||||||
Adjusted EBITDA1 |
$ | 16.3 | $ | 22.7 | (28) | % | (32) | % | $ | 32.1 | $ | 43.7 | (27) | % | (28) | % | |||||||||||||||||||||||||||||||
| Note: For discussion and reconciliation of non-GAAP financial measures, see the Notes following the Financial Statements in this news release. Percentage variances in the Performance Highlights below are calculated and presented on a local currency basis, unless otherwise noted. | |||||||||||||||||||||||||||||||||||||||||||||||
| Quarter-to-date | |||||
| Beginning balance (March 31, 2025) | $ | 82.3 | |||
| Asset acquisitions/takeovers | 1.3 | ||||
| Asset dispositions/withdrawals | (1.3) | ||||
| Valuation changes | 0.7 | ||||
| Foreign currency translation | 1.2 | ||||
| Change in uncalled committed capital and cash held | 0.7 | ||||
| Ending balance (June 30, 2025) | $ | 84.9 | |||
| Trailing Twelve Months | |||||
| Beginning balance (June 30, 2024) | $ | 86.6 | |||
| Asset acquisitions/takeovers | 5.8 | ||||
| Asset dispositions/withdrawals | (7.6) | ||||
| Valuation changes | 1.9 | ||||
| Foreign currency translation | 0.2 | ||||
| Change in uncalled committed capital and cash held | (2.0) | ||||
| Ending balance (June 30, 2025) | $ | 84.9 | |||
|
Software and Technology Solutions
($ in millions, "LC" = local currency) |
Three Months Ended June 30, | % Change in USD | % Change in LC | Six Months Ended June 30, | % Change in USD | % Change in LC | |||||||||||||||||||||||||||||||||||||||||
| 2025 | 2024 | 2025 | 2024 | ||||||||||||||||||||||||||||||||||||||||||||
| Revenue | $ | 55.9 | $ | 56.4 | (1) | % | (1) | % | $ | 113.0 | $ | 110.3 | 2 | % | 3 | % | |||||||||||||||||||||||||||||||
| Segment operating expenses | $ | 69.3 | $ | 72.1 | (4) | % | (4) | % | $ | 136.3 | $ | 135.6 | 1 | % | 1 | % | |||||||||||||||||||||||||||||||
| Segment platform operating expenses, excluding Carried interest | 71.3 | 68.5 | 4 | 4 | 140.0 | 130.9 | 7 | 7 | |||||||||||||||||||||||||||||||||||||||
Carried interest (benefit) expense(a) |
(2.5) | 2.2 | (214) | (217) | (4.9) | 2.1 | (333) | (336) | |||||||||||||||||||||||||||||||||||||||
Gross contract costs6 |
0.5 | 1.4 | (64) | (64) | 1.2 | 2.6 | (54) | (51) | |||||||||||||||||||||||||||||||||||||||
Adjusted EBITDA1 |
$ | (6.3) | $ | (10.9) | 42 | % | 43 | % | $ | (9.2) | $ | (16.0) | 43 | % | 41 | % | |||||||||||||||||||||||||||||||
| Note: For discussion and reconciliation of non-GAAP financial measures, see the Notes following the Financial Statements in this news release. Percentage variances in the Performance Highlights below are calculated and presented on a local currency basis, unless otherwise noted. | |||||||||||||||||||||||||||||||||||||||||||||||
| (a) Carried interest expense/benefit is associated with equity earnings/losses on Spark Venture Funds investments. | |||||||||||||||||||||||||||||||||||||||||||||||
| Connect with us |  |
||||
| Live Webcast | Conference Call | ||||||||||
|
Management will offer a live webcast for shareholders, analysts and investment professionals on Wednesday, August 6, 2025, at 9:00 a.m. Eastern. Following the live broadcast, an audio replay will be available.
The link to the live webcast and audio replay can be accessed at the Investor Relations website: ir.jll.com.
|
The conference call can be accessed live over the phone by dialing (888) 660-6392; the conference ID number is 5398158. Listeners are asked to please dial in 10 minutes prior to the call start time and provide the conference ID number to be connected. |
||||||||||
| Supplemental Information | Contact | ||||||||||
Supplemental information regarding the second quarter 2025 earnings call has been posted to the Investor Relations section of JLL's website: ir.jll.com. |
If you have any questions, please contact Sean Coghlan, Head of Investor Relations. |
||||||||||
Phone: |
+1 312 252 8943 | ||||||||||
Email: |
JLLInvestorRelations@jll.com
|
||||||||||
| JONES LANG LASALLE INCORPORATED | |||||||||||||||||||||||
| Consolidated Statements of Operations (Unaudited) | |||||||||||||||||||||||
| Three Months Ended June 30, | Six Months Ended June 30, | ||||||||||||||||||||||
| (in millions, except share and per share data) | 2025 | 2024 | 2025 | 2024 | |||||||||||||||||||
| Revenue | $ | 6,250.1 | $ | 5,628.7 | $ | 11,996.5 | $ | 10,753.2 | |||||||||||||||
| Operating expenses: | |||||||||||||||||||||||
| Compensation and benefits | $ | 2,835.1 | $ | 2,599.2 | $ | 5,509.7 | $ | 5,014.8 | |||||||||||||||
| Operating, administrative and other | 3,128.6 | 2,803.3 | 5,989.1 | 5,335.3 | |||||||||||||||||||
| Depreciation and amortization | 67.7 | 62.3 | 139.3 | 123.3 | |||||||||||||||||||
Restructuring and acquisition charges5 |
21.3 | 11.5 | 41.0 | 13.2 | |||||||||||||||||||
| Total operating expenses | $ | 6,052.7 | $ | 5,476.3 | $ | 11,679.1 | $ | 10,486.6 | |||||||||||||||
| Operating income | $ | 197.4 | $ | 152.4 | $ | 317.4 | $ | 266.6 | |||||||||||||||
| Interest expense, net of interest income | 35.3 | 41.7 | 59.9 | 72.2 | |||||||||||||||||||
| Equity losses | (27.4) | (15.4) | (53.0) | (19.1) | |||||||||||||||||||
| Other income | 2.5 | 9.7 | 4.2 | 11.2 | |||||||||||||||||||
| Income before income taxes and noncontrolling interest | 137.2 | 105.0 | 208.7 | 186.5 | |||||||||||||||||||
| Income tax provision | 26.7 | 20.5 | 40.7 | 36.4 | |||||||||||||||||||
| Net income | 110.5 | 84.5 | 168.0 | 150.1 | |||||||||||||||||||
Net (loss) income attributable to noncontrolling interest |
(1.8) | 0.1 | 0.4 | (0.4) | |||||||||||||||||||
| Net income attributable to common shareholders | $ | 112.3 | $ | 84.4 | $ | 167.6 | $ | 150.5 | |||||||||||||||
| Basic earnings per common share | $ | 2.36 | $ | 1.77 | $ | 3.53 | $ | 3.17 | |||||||||||||||
| Basic weighted average shares outstanding (in 000's) | 47,483 | 47,539 | 47,475 | 47,512 | |||||||||||||||||||
| Diluted earnings per common share | $ | 2.32 | $ | 1.75 | $ | 3.46 | $ | 3.12 | |||||||||||||||
| Diluted weighted average shares outstanding (in 000's) | 48,334 | 48,317 | 48,372 | 48,302 | |||||||||||||||||||
| Please reference accompanying financial statement notes. | |||||||||||||||||||||||
| JONES LANG LASALLE INCORPORATED | |||||||||||||||||||||||
| Selected Segment Financial Data (Unaudited) | |||||||||||||||||||||||
| Three Months Ended June 30, | Six Months Ended June 30, | ||||||||||||||||||||||
| (in millions) | 2025 | 2024 | 2025 | 2024 | |||||||||||||||||||
| Real Estate Management Services | |||||||||||||||||||||||
| Revenue | $ | 4,894.0 | $ | 4,369.9 | $ | 9,463.4 | $ | 8,439.1 | |||||||||||||||
| Platform compensation and benefits | $ | 465.8 | $ | 416.5 | $ | 897.4 | $ | 817.0 | |||||||||||||||
| Platform operating, administrative and other | 147.5 | 146.8 | 286.7 | 275.4 | |||||||||||||||||||
| Depreciation and amortization | 30.2 | 29.2 | 61.7 | 58.2 | |||||||||||||||||||
| Segment platform operating expenses | 643.5 | 592.5 | 1,245.8 | 1,150.6 | |||||||||||||||||||
Gross contract costs6 |
4,173.0 | 3,717.1 | 8,103.3 | 7,186.2 | |||||||||||||||||||
| Segment operating expenses | $ | 4,816.5 | $ | 4,309.6 | $ | 9,349.1 | $ | 8,336.8 | |||||||||||||||
| Segment operating income | $ | 77.5 | $ | 60.3 | $ | 114.3 | $ | 102.3 | |||||||||||||||
| Add: | |||||||||||||||||||||||
| Equity earnings | 0.5 | 0.3 | 0.9 | 1.4 | |||||||||||||||||||
Depreciation and amortization(a) |
29.2 | 28.3 | 59.8 | 56.3 | |||||||||||||||||||
| Net income attributable to noncontrolling interest | (0.6) | (0.3) | (2.1) | — | |||||||||||||||||||
Adjusted EBITDA1 |
$ | 106.6 | $ | 88.6 | $ | 172.9 | $ | 160.0 | |||||||||||||||
| (a) This adjustment excludes the noncontrolling interest portion of amortization of acquisition-related intangibles which is not attributable to common shareholders. | |||||||||||||||||||||||
| JONES LANG LASALLE INCORPORATED | |||||||||||||||||||||||
| Selected Segment Financial Data (Unaudited) Continued | |||||||||||||||||||||||
| Three Months Ended June 30, | Six Months Ended June 30, | ||||||||||||||||||||||
| (in millions) | 2025 | 2024 | 2025 | 2024 | |||||||||||||||||||
| Leasing Advisory | |||||||||||||||||||||||
| Revenue | $ | 676.8 | $ | 642.2 | $ | 1,262.9 | $ | 1,162.6 | |||||||||||||||
| Platform compensation and benefits | $ | 479.3 | $ | 460.7 | $ | 906.1 | $ | 842.5 | |||||||||||||||
| Platform operating, administrative and other | 74.2 | 61.3 | 134.6 | 118.9 | |||||||||||||||||||
| Depreciation and amortization | 11.0 | 9.0 | 23.0 | 18.1 | |||||||||||||||||||
| Segment platform operating expenses | 564.5 | 531.0 | 1,063.7 | 979.5 | |||||||||||||||||||
Gross contract costs6 |
3.3 | 8.3 | 5.3 | 14.7 | |||||||||||||||||||
| Segment operating expenses | $ | 567.8 | $ | 539.3 | $ | 1,069.0 | $ | 994.2 | |||||||||||||||
| Segment operating income | $ | 109.0 | $ | 102.9 | $ | 193.9 | $ | 168.4 | |||||||||||||||
| Add: | |||||||||||||||||||||||
| Equity earnings | — | 0.1 | — | 0.1 | |||||||||||||||||||
| Depreciation and amortization | 11.0 | 9.0 | 23.0 | 18.1 | |||||||||||||||||||
| Other income | 1.7 | 0.7 | 2.7 | 1.6 | |||||||||||||||||||
| Adjustments: | |||||||||||||||||||||||
| Interest on employee loans, net of forgiveness | (1.3) | (0.6) | (2.2) | (1.3) | |||||||||||||||||||
Adjusted EBITDA1 |
$ | 120.4 | $ | 112.1 | $ | 217.4 | $ | 186.9 | |||||||||||||||
| JONES LANG LASALLE INCORPORATED | |||||||||||||||||||||||
| Selected Segment Financial Data (Unaudited) Continued | |||||||||||||||||||||||
| Three Months Ended June 30, | Six Months Ended June 30, | ||||||||||||||||||||||
| (in millions) | 2025 | 2024 | 2025 | 2024 | |||||||||||||||||||
| Capital Markets Services | |||||||||||||||||||||||
| Revenue | $ | 520.3 | $ | 457.6 | $ | 955.6 | $ | 835.2 | |||||||||||||||
| Platform compensation and benefits | $ | 374.1 | $ | 341.1 | $ | 703.6 | $ | 628.7 | |||||||||||||||
| Platform operating, administrative and other | 95.0 | 83.3 | 165.7 | 144.1 | |||||||||||||||||||
| Depreciation and amortization | 17.5 | 17.3 | 36.4 | 33.7 | |||||||||||||||||||
| Segment platform operating expenses | 486.6 | 441.7 | 905.7 | 806.5 | |||||||||||||||||||
Gross contract costs6 |
1.7 | 11.8 | 2.8 | 25.4 | |||||||||||||||||||
| Segment operating expenses | $ | 488.3 | $ | 453.5 | $ | 908.5 | $ | 831.9 | |||||||||||||||
| Segment operating income | $ | 32.0 | $ | 4.1 | $ | 47.1 | $ | 3.3 | |||||||||||||||
| Add: | |||||||||||||||||||||||
| Equity earnings | 0.8 | 0.5 | 2.4 | 0.6 | |||||||||||||||||||
| Depreciation and amortization | 17.5 | 17.3 | 36.4 | 33.7 | |||||||||||||||||||
| Other income | 0.9 | 0.8 | 1.7 | 1.4 | |||||||||||||||||||
| Adjustments: | |||||||||||||||||||||||
| Net non-cash MSR and mortgage banking derivative activity | 4.2 | 11.8 | 17.1 | 20.8 | |||||||||||||||||||
| Interest on employee loans, net of forgiveness | (0.7) | (0.7) | (1.4) | (1.0) | |||||||||||||||||||
Adjusted EBITDA1 |
$ | 54.7 | $ | 33.8 | $ | 103.3 | $ | 58.8 | |||||||||||||||
| JONES LANG LASALLE INCORPORATED | |||||||||||||||||||||||
| Selected Segment Financial Data (Unaudited) Continued | |||||||||||||||||||||||
| Three Months Ended June 30, | Six Months Ended June 30, | ||||||||||||||||||||||
| (in millions) | 2025 | 2024 | 2025 | 2024 | |||||||||||||||||||
| Investment Management | |||||||||||||||||||||||
| Revenue | $ | 103.1 | $ | 102.6 | $ | 201.6 | $ | 206.0 | |||||||||||||||
| Platform compensation and benefits | $ | 60.9 | $ | 59.0 | $ | 119.2 | $ | 120.3 | |||||||||||||||
| Platform operating, administrative and other | 17.5 | 20.5 | 33.8 | 33.4 | |||||||||||||||||||
| Depreciation and amortization | 2.8 | 2.0 | 5.7 | 4.0 | |||||||||||||||||||
| Segment platform operating expenses | 81.2 | 81.5 | 158.7 | 157.7 | |||||||||||||||||||
Gross contract costs6 |
8.3 | 8.8 | 16.5 | 17.2 | |||||||||||||||||||
| Segment operating expenses | $ | 89.5 | $ | 90.3 | $ | 175.2 | $ | 174.9 | |||||||||||||||
| Segment operating income | $ | 13.6 | $ | 12.3 | $ | 26.4 | $ | 31.1 | |||||||||||||||
| Add: | |||||||||||||||||||||||
| Depreciation and amortization | 2.8 | 2.0 | 5.7 | 4.0 | |||||||||||||||||||
| Other (expense) income | (0.1) | 8.2 | — | 8.2 | |||||||||||||||||||
Net loss attributable to noncontrolling interest(a) |
— | 0.2 | — | 0.4 | |||||||||||||||||||
Adjusted EBITDA1 |
$ | 16.3 | $ | 22.7 | $ | 32.1 | $ | 43.7 | |||||||||||||||
| Equity losses | $ | (1.3) | $ | (7.3) | $ | (7.4) | $ | (11.2) | |||||||||||||||
| (a) This adjustment excludes the noncontrolling interest portion of Equity earnings which is not attributable to common shareholders. | |||||||||||||||||||||||
| JONES LANG LASALLE INCORPORATED | |||||||||||||||||||||||
| Selected Segment Financial Data (Unaudited) Continued | |||||||||||||||||||||||
| Three Months Ended June 30, | Six Months Ended June 30, | ||||||||||||||||||||||
| (in millions) | 2025 | 2024 | 2025 | 2024 | |||||||||||||||||||
| Software and Technology Solutions | |||||||||||||||||||||||
| Revenue | $ | 55.9 | $ | 56.4 | $ | 113.0 | $ | 110.3 | |||||||||||||||
Platform compensation and benefits(a) |
$ | 47.1 | $ | 53.5 | $ | 92.6 | $ | 100.8 | |||||||||||||||
| Platform operating, administrative and other | 15.5 | 12.4 | 30.0 | 22.9 | |||||||||||||||||||
| Depreciation and amortization | 6.2 | 4.8 | 12.5 | 9.3 | |||||||||||||||||||
| Segment platform operating expenses | 68.8 | 70.7 | 135.1 | 133.0 | |||||||||||||||||||
Gross contract costs6 |
0.5 | 1.4 | 1.2 | 2.6 | |||||||||||||||||||
| Segment operating expenses | $ | 69.3 | $ | 72.1 | $ | 136.3 | $ | 135.6 | |||||||||||||||
| Segment operating loss | $ | (13.4) | $ | (15.7) | $ | (23.3) | $ | (25.3) | |||||||||||||||
| Add: | |||||||||||||||||||||||
| Depreciation and amortization | 6.2 | 4.8 | 12.5 | 9.3 | |||||||||||||||||||
| Other income | — | — | (0.2) | — | |||||||||||||||||||
| Net loss attributable to noncontrolling interest | 0.7 | — | 1.1 | — | |||||||||||||||||||
| Adjustments: | |||||||||||||||||||||||
| Credit losses on convertible note investments | 0.2 | — | 0.7 | — | |||||||||||||||||||
Adjusted EBITDA1 |
$ | (6.3) | $ | (10.9) | $ | (9.2) | $ | (16.0) | |||||||||||||||
| Equity losses | $ | (27.4) | $ | (9.0) | $ | (48.9) | $ | (10.0) | |||||||||||||||
(a) Included in Segment platform operating expenses is a carried interest benefit of $2.5 million and a carried interest expense of $2.2 million for the three months ended June 30, 2025 and 2024, respectively. The carried interest benefit is $4.9 million and carried interest expense is $2.1 million for the six months ended June 30, 2025 and 2024. Carried interest expense/benefit is associated with equity earnings/losses on Spark Venture Funds investments. | |||||||||||||||||||||||
| JONES LANG LASALLE INCORPORATED | ||||||||||||||||||||||||||
| Consolidated Statement of Cash Flows (Unaudited) | ||||||||||||||||||||||||||
| Six Months Ended June 30, | Six Months Ended June 30, | |||||||||||||||||||||||||
| (in millions) | 2025 | 2024 | 2025 | 2024 | ||||||||||||||||||||||
| Cash flows from operating activities: | Cash flows from investing activities: | |||||||||||||||||||||||||
| Net income | $ | 168.0 | $ | 150.1 | Net capital additions – property and equipment | $ | (88.9) | $ | (81.4) | |||||||||||||||||
| Business acquisitions, net of cash acquired | (6.1) | (39.3) | ||||||||||||||||||||||||
| Reconciliation of net income to net cash used in operating activities: | Capital contributions to investments | (132.1) | (41.0) | |||||||||||||||||||||||
| Depreciation and amortization | 139.3 | 123.3 | Distributions of capital from investments | 27.6 | 9.6 | |||||||||||||||||||||
| Equity losses | 53.0 | 19.1 | Other, net | (0.9) | (2.0) | |||||||||||||||||||||
| Distributions of earnings from investments | 9.1 | 7.2 | Net cash used in investing activities | (200.4) | (154.1) | |||||||||||||||||||||
| Provision for loss on receivables and other assets | 18.4 | 31.7 | Cash flows from financing activities: | |||||||||||||||||||||||
| Amortization of stock-based compensation | 66.0 | 56.8 | Proceeds from borrowings under credit facility | 5,483.0 | 4,713.0 | |||||||||||||||||||||
| Net non-cash mortgage servicing rights and mortgage banking derivative activity | 17.1 | 20.8 | Repayments of borrowings under credit facility | (5,203.0) | (4,063.0) | |||||||||||||||||||||
| Accretion of interest and amortization of debt issuance costs | 3.2 | 2.6 | Proceeds from issuance of commercial paper | 1,525.0 | — | |||||||||||||||||||||
| Other, net | (1.1) | (0.7) | Repayments of commercial paper | (1,035.0) | — | |||||||||||||||||||||
| Change in: | Net repayments of short-term borrowings | (47.9) | (15.4) | |||||||||||||||||||||||
| Receivables | 171.9 | 114.9 | Payments of deferred business acquisition obligations and earn-outs | (8.4) | (4.9) | |||||||||||||||||||||
| Reimbursable receivables and reimbursable payables | (150.9) | (79.3) | Repurchase of common stock | (59.9) | (40.4) | |||||||||||||||||||||
| Prepaid expenses and other assets | (26.1) | 16.2 | Noncontrolling interest (distributions) contributions, net | (2.3) | 3.3 | |||||||||||||||||||||
| Income taxes receivable, payable and deferred | (132.1) | (150.3) | Other, net | (34.0) | (26.0) | |||||||||||||||||||||
| Accounts payable, accrued liabilities and other liabilities | (82.1) | (139.4) | Net cash provided by financing activities | 617.5 | 566.6 | |||||||||||||||||||||
| Accrued compensation (including net deferred compensation) | (688.5) | (576.6) | Effect of currency exchange rate changes on cash, cash equivalents and restricted cash | 35.5 | (14.7) | |||||||||||||||||||||
| Net cash used in operating activities | $ | (434.8) | $ | (403.6) | Net change in cash, cash equivalents and restricted cash | $ | 17.8 | $ | (5.8) | |||||||||||||||||
| Cash, cash equivalents and restricted cash, beginning of the period | 652.7 | 663.4 | ||||||||||||||||||||||||
| Cash, cash equivalents and restricted cash, end of the period | $ | 670.5 | $ | 657.6 | ||||||||||||||||||||||
| . | ||||||||||||||||||||||||||
| Please reference accompanying financial statement notes. | ||||||||||||||||||||||||||
| JONES LANG LASALLE INCORPORATED | ||||||||||||||||||||||||||||||||||||||
| Consolidated Balance Sheets | ||||||||||||||||||||||||||||||||||||||
| June 30, | December 31, | June 30, | December 31, | |||||||||||||||||||||||||||||||||||
| (in millions, except share and per share data) | 2025 | 2024 | 2025 | 2024 | ||||||||||||||||||||||||||||||||||
| ASSETS | (Unaudited) | LIABILITIES AND EQUITY | (Unaudited) | |||||||||||||||||||||||||||||||||||
| Current assets: | Current liabilities: | |||||||||||||||||||||||||||||||||||||
| Cash and cash equivalents | $ | 401.4 | $ | 416.3 | Accounts payable and accrued liabilities | $ | 1,184.3 | $ | 1,322.7 | |||||||||||||||||||||||||||||
| Trade receivables, net of allowance | 2,047.2 | 2,153.5 | Reimbursable payables | 2,101.2 | 2,176.3 | |||||||||||||||||||||||||||||||||
| Notes and other receivables | 453.2 | 456.9 | Accrued compensation and benefits | 1,135.9 | 1,768.5 | |||||||||||||||||||||||||||||||||
| Reimbursable receivables | 2,791.3 | 2,695.0 | Short-term borrowings | 107.2 | 153.8 | |||||||||||||||||||||||||||||||||
| Warehouse receivables | 1,228.6 | 770.7 | Commercial paper, net of debt issuance costs | 689.2 | 199.3 | |||||||||||||||||||||||||||||||||
| Short-term contract assets, net of allowance | 309.1 | 334.8 | Short-term contract liability and deferred income | 230.2 | 203.8 | |||||||||||||||||||||||||||||||||
| Restricted cash, prepaid and other | 620.7 | 651.3 | Warehouse facilities | 1,223.5 | 841.0 | |||||||||||||||||||||||||||||||||
| Total current assets | 7,851.5 | 7,478.5 | Short-term operating lease liability | 165.1 | 157.2 | |||||||||||||||||||||||||||||||||
| Property and equipment, net of accumulated depreciation | 590.0 | 598.1 | Other | 329.6 | 321.9 | |||||||||||||||||||||||||||||||||
| Operating lease right-of-use asset | 715.8 | 743.1 | Total current liabilities | 7,166.2 | 7,144.5 | |||||||||||||||||||||||||||||||||
| Goodwill | 4,715.8 | 4,611.3 | Noncurrent liabilities: | |||||||||||||||||||||||||||||||||||
| Identified intangibles, net of accumulated amortization | 682.0 | 724.1 | Credit facility, net of debt issuance costs | 370.0 | 88.6 | |||||||||||||||||||||||||||||||||
| Investments | 878.8 | 812.7 | Long-term debt, net of debt issuance costs | 805.3 | 756.7 | |||||||||||||||||||||||||||||||||
| Long-term receivables | 411.1 | 394.7 | Long-term deferred tax liabilities, net | 48.9 | 45.6 | |||||||||||||||||||||||||||||||||
| Deferred tax assets, net | 576.0 | 518.2 | Deferred compensation | 664.1 | 665.4 | |||||||||||||||||||||||||||||||||
| Deferred compensation plans | 674.9 | 664.0 | Long-term operating lease liability | 750.3 | 748.8 | |||||||||||||||||||||||||||||||||
| Other | 244.6 | 219.1 | Other | 374.1 | 419.1 | |||||||||||||||||||||||||||||||||
| Total assets | $ | 17,340.5 | $ | 16,763.8 | Total liabilities | $ | 10,178.9 | $ | 9,868.7 | |||||||||||||||||||||||||||||
| Company shareholders' equity | ||||||||||||||||||||||||||||||||||||||
| Common stock | 0.5 | 0.5 | ||||||||||||||||||||||||||||||||||||
| Additional paid-in capital | 2,039.4 | 2,032.7 | ||||||||||||||||||||||||||||||||||||
| Retained earnings | 6,494.7 | 6,334.9 | ||||||||||||||||||||||||||||||||||||
| Treasury stock | (958.5) | (937.9) | ||||||||||||||||||||||||||||||||||||
| Shares held in trust | (12.0) | (11.8) | ||||||||||||||||||||||||||||||||||||
| Accumulated other comprehensive loss | (524.2) | (646.9) | ||||||||||||||||||||||||||||||||||||
| Total company shareholders' equity | 7,039.9 | 6,771.5 | ||||||||||||||||||||||||||||||||||||
| Noncontrolling interest | 121.7 | 123.6 | ||||||||||||||||||||||||||||||||||||
| Total equity | 7,161.6 | 6,895.1 | ||||||||||||||||||||||||||||||||||||
| Total liabilities and equity | $ | 17,340.5 | $ | 16,763.8 | ||||||||||||||||||||||||||||||||||
| Please reference accompanying financial statement notes. | ||||||||||||||||||||||||||||||||||||||
| Three Months Ended June 30, | Six Months Ended June 30, | ||||||||||||||||||||||
| (in millions) | 2025 | 2024 | 2025 | 2024 | |||||||||||||||||||
| Net income attributable to common shareholders | $ | 112.3 | $ | 84.4 | $ | 167.6 | $ | 150.5 | |||||||||||||||
| Add: | |||||||||||||||||||||||
| Interest expense, net of interest income | 35.3 | 41.7 | 59.9 | 72.2 | |||||||||||||||||||
| Income tax provision | 26.7 | 20.5 | 40.7 | 36.4 | |||||||||||||||||||
Depreciation and amortization(a) |
66.7 | 61.4 | 137.4 | 121.4 | |||||||||||||||||||
| Adjustments: | |||||||||||||||||||||||
Restructuring and acquisition charges5 |
21.3 | 11.5 | 41.0 | 13.2 | |||||||||||||||||||
| Net non-cash MSR and mortgage banking derivative activity | 4.2 | 11.8 | 17.1 | 20.8 | |||||||||||||||||||
| Interest on employee loans, net of forgiveness | (2.0) | (1.3) | (3.6) | (2.3) | |||||||||||||||||||
Equity losses - Investment Management and Software and Technology Solutions(a) |
27.0 | 16.3 | 55.7 | 21.2 | |||||||||||||||||||
Credit losses on convertible note investments |
0.2 | — | 0.7 | — | |||||||||||||||||||
| Adjusted EBITDA | $ | 291.7 | $ | 246.3 | $ | 516.5 | $ | 433.4 | |||||||||||||||
| Three Months Ended June 30, | Six Months Ended June 30, | ||||||||||||||||||||||
| (In millions, except share and per share data) | 2025 | 2024 | 2025 | 2024 | |||||||||||||||||||
| Net income attributable to common shareholders | $ | 112.3 | $ | 84.4 | $ | 167.6 | $ | 150.5 | |||||||||||||||
| Diluted shares (in thousands) | 48,334 | 48,317 | 48,372 | 48,302 | |||||||||||||||||||
| Diluted earnings per share | $ | 2.32 | $ | 1.75 | $ | 3.46 | $ | 3.12 | |||||||||||||||
| Net income attributable to common shareholders | $ | 112.3 | $ | 84.4 | $ | 167.6 | $ | 150.5 | |||||||||||||||
| Adjustments: | |||||||||||||||||||||||
Restructuring and acquisition charges5 |
21.3 | 11.5 | 41.0 | 13.2 | |||||||||||||||||||
| Net non-cash MSR and mortgage banking derivative activity | 4.2 | 11.8 | 17.1 | 20.8 | |||||||||||||||||||
Amortization of acquisition-related intangibles(a) |
16.0 | 15.8 | 32.1 | 31.0 | |||||||||||||||||||
| Interest on employee loans, net of forgiveness | (2.0) | (1.3) | (3.6) | (2.3) | |||||||||||||||||||
Equity losses - Investment Management and Software and Technology Solutions(a) |
27.0 | 16.3 | 55.7 | 21.2 | |||||||||||||||||||
Credit losses on convertible note investments |
0.2 | — | 0.7 | — | |||||||||||||||||||
Tax impact of adjusted items(b) |
(19.6) | (15.3) | (39.6) | (25.2) | |||||||||||||||||||
| Adjusted net income attributable to common shareholders | $ | 159.4 | $ | 123.2 | $ | 271.0 | $ | 209.2 | |||||||||||||||
| Diluted shares (in thousands) | 48,334 | 48,317 | 48,372 | 48,302 | |||||||||||||||||||
| Adjusted diluted earnings per share | $ | 3.30 | $ | 2.55 | $ | 5.60 | $ | 4.33 | |||||||||||||||
| Three Months Ended June 30, | Six Months Ended June 30, | ||||||||||||||||||||||
| ($ in millions) | 2025 | % Change | 2025 | % Change | |||||||||||||||||||
| Revenue: | |||||||||||||||||||||||
| At current period exchange rates | $ | 6,250.1 | 11 | % | $ | 11,996.5 | 12 | % | |||||||||||||||
| Impact of change in exchange rates | (39.2) | n/a | 21.2 | n/a | |||||||||||||||||||
| At comparative period exchange rates | $ | 6,210.9 | 10 | % | $ | 12,017.7 | 12 | % | |||||||||||||||
| Operating income: | |||||||||||||||||||||||
| At current period exchange rates | $ | 197.4 | 30 | % | $ | 317.4 | 19 | % | |||||||||||||||
| Impact of change in exchange rates | (2.0) | n/a | (3.3) | n/a | |||||||||||||||||||
| At comparative period exchange rates | $ | 195.4 | 28 | % | $ | 314.1 | 18 | % | |||||||||||||||
| Adjusted EBITDA: | |||||||||||||||||||||||
| At current period exchange rates | $ | 291.7 | 18 | % | $ | 516.5 | 19 | % | |||||||||||||||
| Impact of change in exchange rates | (2.4) | n/a | (2.9) | n/a | |||||||||||||||||||
| At comparative period exchange rates | $ | 289.3 | 17 | % | $ | 513.6 | 19 | % | |||||||||||||||
| Three Months Ended June 30, | Six Months Ended June 30, | ||||||||||||||||||||||
| (in millions) | 2025 | 2024 | 2025 | 2024 | |||||||||||||||||||
| Severance and other employment-related charges | $ | 18.0 | $ | 7.2 | $ | 25.4 | $ | 11.7 | |||||||||||||||
| Restructuring, pre-acquisition and post-acquisition charges | 10.7 | 6.4 | 19.1 | 14.1 | |||||||||||||||||||
| Fair value adjustments that resulted in a net (decrease) increase to earn-out liabilities from prior-period acquisition activity | (7.4) | (2.1) | (3.5) | (12.6) | |||||||||||||||||||
| Total Restructuring and acquisition charges | $ | 21.3 | $ | 11.5 | $ | 41.0 | $ | 13.2 | |||||||||||||||
| ($ in millions) | June 30, 2025 | March 31, 2025 | June 30, 2024 | ||||||||||||||
| Total debt | $ | 1,988.1 | $ | 2,186.4 | $ | 2,176.4 | |||||||||||
| Less: Cash and cash equivalents | 401.4 | 432.4 | $ | 424.4 | |||||||||||||
| Net Debt | $ | 1,586.7 | $ | 1,754.0 | $ | 1,752.0 | |||||||||||
| Divided by: Trailing twelve-month Adjusted EBITDA | $ | 1,269.4 | $ | 1,224.0 | $ | 1,033.8 | |||||||||||
| Net Leverage Ratio | 1.2x | 1.4x | 1.7x | ||||||||||||||
| Six Months Ended June 30, | |||||||||||
| (in millions) | 2025 | 2024 | |||||||||
| Net cash used in operating activities | $ | (434.8) | $ | (403.6) | |||||||
| Net capital additions - property and equipment | (88.9) | (81.4) | |||||||||
| Free Cash Flow | $ | (523.7) | $ | (485.0) | |||||||
| Three Months Ended June 30, 2025 | |||||||||||||||||||||||||||||||||||||||||||||||||||||||||||||||||||||||
| (in millions) | Real Estate Management Services | Leasing Advisory | Capital Markets Services | ||||||||||||||||||||||||||||||||||||||||||||||||||||||||||||||||||||
| Workplace Mgmt | Project Mgmt | Property Mgmt | Portfolio Services and Other | Total Real Estate Mgmt Services | Leasing | Advisory, Consulting and Other | Total Leasing Advisory | Invt Sales, Debt/Equity Advisory and Other | Value and Risk Advisory | Loan Servicing | Total Capital Markets Services | Investment Mgmt | Software and Tech Solutions | Total | |||||||||||||||||||||||||||||||||||||||||||||||||||||||||
Revenue(a) |
$ | 3,349.1 | 971.6 | 454.4 | 118.9 | $ | 4,894.0 | $ | 651.5 | 25.3 | $ | 676.8 | $ | 380.6 | 97.7 | 42.0 | $ | 520.3 | $ | 103.1 | $ | 55.9 | $ | 6,250.1 | |||||||||||||||||||||||||||||||||||||||||||||||
Gross contract costs6 |
$ | 3,100.4 | 700.2 | 315.7 | 56.7 | $ | 4,173.0 | $ | 2.0 | 1.3 | $ | 3.3 | $ | 0.8 | 0.9 | — | $ | 1.7 | $ | 8.3 | $ | 0.5 | $ | 4,186.8 | |||||||||||||||||||||||||||||||||||||||||||||||
| Platform operating expenses | $ | 643.5 | $ | 564.5 | $ | 486.6 | $ | 81.2 | $ | 68.8 | $ | 1,844.6 | |||||||||||||||||||||||||||||||||||||||||||||||||||||||||||
Adjusted EBITDA1 |
$ | 106.6 | $ | 120.4 | $ | 54.7 | $ | 16.3 | $ | (6.3) | $ | 291.7 | |||||||||||||||||||||||||||||||||||||||||||||||||||||||||||
| Three Months Ended June 30, 2024 | |||||||||||||||||||||||||||||||||||||||||||||||||||||||||||||||||||||||
| (in millions) | Real Estate Management Services | Leasing Advisory | Capital Markets Services | ||||||||||||||||||||||||||||||||||||||||||||||||||||||||||||||||||||
| Workplace Mgmt | Project Mgmt | Property Mgmt | Portfolio Services and Other | Total Real Estate Mgmt Services | Leasing | Advisory, Consulting and Other | Total Leasing Advisory | Invt Sales, Debt/Equity Advisory and Other | Value and Risk Advisory | Loan Servicing | Total Capital Markets Services | Investment Mgmt | Software and Tech Solutions | Total | |||||||||||||||||||||||||||||||||||||||||||||||||||||||||
Revenue(a) |
$ | 3,021.1 | 788.1 | 436.6 | 124.1 | $ | 4,369.9 | $ | 619.1 | 23.1 | $ | 642.2 | $ | 320.3 | 95.8 | 41.5 | $ | 457.6 | $ | 102.6 | $ | 56.4 | $ | 5,628.7 | |||||||||||||||||||||||||||||||||||||||||||||||
Gross contract costs6 |
$ | 2,793.4 | 555.2 | 304.4 | 64.1 | $ | 3,717.1 | $ | 5.9 | 2.4 | $ | 8.3 | $ | 8.6 | 3.2 | — | $ | 11.8 | $ | 8.8 | $ | 1.4 | $ | 3,747.4 | |||||||||||||||||||||||||||||||||||||||||||||||
| Platform operating expenses | $ | 592.5 | $ | 531.0 | $ | 441.7 | $ | 81.5 | $ | 70.7 | $ | 1,717.4 | |||||||||||||||||||||||||||||||||||||||||||||||||||||||||||
Adjusted EBITDA1 |
$ | 88.6 | $ | 112.1 | $ | 33.8 | $ | 22.7 | $ | (10.9) | $ | 246.3 | |||||||||||||||||||||||||||||||||||||||||||||||||||||||||||
| Six Months Ended June 30, 2025 | |||||||||||||||||||||||||||||||||||||||||||||||||||||||||||||||||||||||
| (in millions) | Real Estate Management Services | Leasing Advisory | Capital Markets Services | ||||||||||||||||||||||||||||||||||||||||||||||||||||||||||||||||||||
| Workplace Mgmt | Project Mgmt | Property Mgmt | Portfolio Services and Other | Total Real Estate Mgmt Services | Leasing | Advisory, Consulting and Other | Total Leasing Advisory | Invt Sales, Debt/Equity Advisory and Other | Value and Risk Advisory | Loan Servicing | Total Capital Markets Services | Investment Mgmt | Software and Tech Solutions | Total | |||||||||||||||||||||||||||||||||||||||||||||||||||||||||
Revenue(a) |
6,612.7 | $ | 1,719.1 | 900.0 | 231.6 | $ | 9,463.4 | $ | 1,217.6 | 45.3 | $ | 1,262.9 | $ | 693.2 | 179.3 | 83.1 | $ | 955.6 | $ | 201.6 | $ | 113.0 | $ | 11,996.5 | |||||||||||||||||||||||||||||||||||||||||||||||
Gross contract costs6 |
6,141.0 | $ | 1,220.2 | 628.1 | 114.0 | $ | 8,103.3 | $ | 3.2 | 2.1 | $ | 5.3 | $ | 1.3 | 1.5 | — | $ | 2.8 | $ | 16.5 | $ | 1.2 | $ | 8,129.1 | |||||||||||||||||||||||||||||||||||||||||||||||
| Platform operating expenses | $ | 1,245.8 | $ | 1,063.7 | $ | 905.7 | $ | 158.7 | $ | 135.1 | $ | 3,509.0 | |||||||||||||||||||||||||||||||||||||||||||||||||||||||||||
Adjusted EBITDA1 |
$ | 172.9 | $ | 217.4 | $ | 103.3 | $ | 32.1 | $ | (9.2) | $ | 516.5 | |||||||||||||||||||||||||||||||||||||||||||||||||||||||||||
| Six Months Ended June 30, 2024 | |||||||||||||||||||||||||||||||||||||||||||||||||||||||||||||||||||||||
| (in millions) | Real Estate Management Services | Leasing Advisory | Capital Markets Services | ||||||||||||||||||||||||||||||||||||||||||||||||||||||||||||||||||||
| Workplace Mgmt | Project Mgmt | Property Mgmt | Portfolio Services and Other | Total Real Estate Mgmt Services | Leasing | Advisory, Consulting and Other | Total Leasing Advisory | Invt Sales, Debt/Equity Advisory and Other | Value and Risk Advisory | Loan Servicing | Total Capital Markets Services | Investment Mgmt | Software and Tech Solutions | Total | |||||||||||||||||||||||||||||||||||||||||||||||||||||||||
Revenue(a) |
$ | 5,892.8 | $ | 1,444.5 | 866.3 | 235.5 | $ | 8,439.1 | $ | 1,116.4 | 46.2 | $ | 1,162.6 | $ | 579.0 | 176.0 | 80.2 | $ | 835.2 | $ | 206.0 | $ | 110.3 | $ | 10,753.2 | ||||||||||||||||||||||||||||||||||||||||||||||
Gross contract costs6 |
$ | 5,456.5 | $ | 1,001.1 | 602.9 | 125.7 | $ | 7,186.2 | $ | 10.1 | 4.6 | $ | 14.7 | $ | 19.7 | 5.7 | — | $ | 25.4 | $ | 17.2 | $ | 2.6 | $ | 7,246.1 | ||||||||||||||||||||||||||||||||||||||||||||||
| Platform operating expenses | $ | 1,150.6 | $ | 979.5 | $ | 806.5 | $ | 157.7 | $ | 133.0 | $ | 3,227.3 | |||||||||||||||||||||||||||||||||||||||||||||||||||||||||||
Adjusted EBITDA1 |
$ | 160.0 | $ | 186.9 | $ | 58.8 | $ | 43.7 | $ | (16.0) | $ | 433.4 | |||||||||||||||||||||||||||||||||||||||||||||||||||||||||||