
| Maryland | 001-13779 | 45-4549771 | |||||||||
| (State or other jurisdiction of incorporation) | (Commission File Number) | (IRS Employer Identification No.) | |||||||||
| One Manhattan West, 395 9th Avenue, 58th Floor | |||||||||||
| New York, | New York | 10001 | |||||||||
| (Address of principal executive offices) | (Zip Code) | ||||||||||
| Title of each class | Trading Symbol(s) | Name of each exchange on which registered | ||||||||||||
| Common Stock, $0.001 Par Value | WPC | New York Stock Exchange | ||||||||||||
| Exhibit No. | Description | |||||||
| 99.1 | ||||||||
| 99.2 | ||||||||
| 99.3 | ||||||||
| 104 | Cover Page Interactive Data File (embedded within the Inline XBRL document). | |||||||
| W. P. Carey Inc. | |||||||||||
| Date: | April 29, 2025 | By: | /s/ ToniAnn Sanzone | ||||||||
| ToniAnn Sanzone | |||||||||||
| Chief Financial Officer | |||||||||||

2025 First Quarter |
|||||
| Net income attributable to W. P. Carey (millions) | $125.8 | ||||
| Diluted earnings per share | $0.57 | ||||
| AFFO (millions) | $257.8 | ||||
| AFFO per diluted share | $1.17 | ||||
| March 31, 2025 | December 31, 2024 | ||||||||||
| Assets | |||||||||||
| Investments in real estate: | |||||||||||
| Land, buildings and improvements — net lease and other | $ | 13,114,194 | $ | 12,842,869 | |||||||
| Land, buildings and improvements — operating properties | 1,202,920 | 1,198,676 | |||||||||
| Net investments in finance leases and loans receivable | 866,949 | 798,259 | |||||||||
In-place lease intangible assets and other |
2,338,805 | 2,297,572 | |||||||||
Above-market rent intangible assets |
671,887 | 665,495 | |||||||||
| Investments in real estate | 18,194,755 | 17,802,871 | |||||||||
Accumulated depreciation and amortization (a) |
(3,367,408) | (3,222,396) | |||||||||
| Assets held for sale, net | 12,139 | — | |||||||||
| Net investments in real estate | 14,839,486 | 14,580,475 | |||||||||
| Equity method investments | 304,838 | 301,115 | |||||||||
| Cash and cash equivalents | 187,809 | 640,373 | |||||||||
| Other assets, net | 1,000,675 | 1,045,218 | |||||||||
| Goodwill | 974,497 | 967,843 | |||||||||
| Total assets | $ | 17,307,305 | $ | 17,535,024 | |||||||
| Liabilities and Equity | |||||||||||
| Debt: | |||||||||||
| Senior unsecured notes, net | $ | 6,211,918 | $ | 6,505,907 | |||||||
| Unsecured term loans, net | 1,113,910 | 1,075,826 | |||||||||
| Unsecured revolving credit facility | 205,129 | 55,448 | |||||||||
| Non-recourse mortgages, net | 335,345 | 401,821 | |||||||||
| Debt, net | 7,866,302 | 8,039,002 | |||||||||
| Accounts payable, accrued expenses and other liabilities | 605,618 | 596,994 | |||||||||
Below-market rent and other intangible liabilities, net |
114,414 | 119,831 | |||||||||
| Deferred income taxes | 154,888 | 147,461 | |||||||||
| Dividends payable | 199,160 | 197,612 | |||||||||
| Total liabilities | 8,940,382 | 9,100,900 | |||||||||
Preferred stock, $0.001 par value, 50,000,000 shares authorized; none issued |
— | — | |||||||||
Common stock, $0.001 par value, 450,000,000 shares authorized; 218,975,748 and 218,848,844 shares, respectively, issued and outstanding |
219 | 219 | |||||||||
| Additional paid-in capital | 11,792,420 | 11,805,179 | |||||||||
| Distributions in excess of accumulated earnings | (3,276,497) | (3,203,974) | |||||||||
| Deferred compensation obligation | 96,952 | 78,503 | |||||||||
| Accumulated other comprehensive loss | (250,731) | (250,232) | |||||||||
| Total stockholders’ equity | 8,362,363 | 8,429,695 | |||||||||
| Noncontrolling interests | 4,560 | 4,429 | |||||||||
| Total equity | 8,366,923 | 8,434,124 | |||||||||
| Total liabilities and equity | $ | 17,307,305 | $ | 17,535,024 | |||||||
| Three Months Ended | |||||||||||||||||
| March 31, 2025 | December 31, 2024 | March 31, 2024 | |||||||||||||||
| Revenues | |||||||||||||||||
| Real Estate: | |||||||||||||||||
| Lease revenues | $ | 353,768 | $ | 351,394 | $ | 322,251 | |||||||||||
| Income from finance leases and loans receivable | 17,458 | 16,796 | 25,793 | ||||||||||||||
| Operating property revenues | 33,094 | 34,132 | 36,643 | ||||||||||||||
| Other lease-related income | 3,121 | 1,329 | 2,155 | ||||||||||||||
| 407,441 | 403,651 | 386,842 | |||||||||||||||
| Investment Management: | |||||||||||||||||
| Asset management revenue | 1,350 | 1,461 | 1,893 | ||||||||||||||
| Other advisory income and reimbursements | 1,067 | 1,053 | 1,063 | ||||||||||||||
| 2,417 | 2,514 | 2,956 | |||||||||||||||
| 409,858 | 406,165 | 389,798 | |||||||||||||||
| Operating Expenses | |||||||||||||||||
| Depreciation and amortization | 129,607 | 115,770 | 118,768 | ||||||||||||||
| General and administrative | 26,967 | 24,254 | 27,868 | ||||||||||||||
| Reimbursable tenant costs | 17,092 | 15,661 | 12,973 | ||||||||||||||
| Operating property expenses | 16,544 | 16,586 | 17,950 | ||||||||||||||
| Property expenses, excluding reimbursable tenant costs | 11,706 | 12,580 | 12,173 | ||||||||||||||
| Stock-based compensation expense | 9,148 | 9,667 | 8,856 | ||||||||||||||
| Impairment charges — real estate | 6,854 | 27,843 | — | ||||||||||||||
| Merger and other expenses | 556 | (484) | 4,452 | ||||||||||||||
| 218,474 | 221,877 | 203,040 | |||||||||||||||
| Other Income and Expenses | |||||||||||||||||
| Interest expense | (68,804) | (70,883) | (68,651) | ||||||||||||||
| Gain on sale of real estate, net | 43,777 | 4,480 | 15,445 | ||||||||||||||
Other gains and (losses) (a) |
(42,197) | (77,224) | 13,839 | ||||||||||||||
Non-operating income (b) |
7,910 | 13,847 | 15,505 | ||||||||||||||
| Earnings from equity method investments | 5,378 | 302 | 4,864 | ||||||||||||||
| (53,936) | (129,478) | (18,998) | |||||||||||||||
| Income before income taxes | 137,448 | 54,810 | 167,760 | ||||||||||||||
| Provision for income taxes | (11,632) | (7,772) | (8,674) | ||||||||||||||
| Net Income | 125,816 | 47,038 | 159,086 | ||||||||||||||
| Net loss (income) attributable to noncontrolling interests | 8 | (15) | 137 | ||||||||||||||
| Net Income Attributable to W. P. Carey | $ | 125,824 | $ | 47,023 | $ | 159,223 | |||||||||||
| Basic Earnings Per Share | $ | 0.57 | $ | 0.21 | $ | 0.72 | |||||||||||
| Diluted Earnings Per Share | $ | 0.57 | $ | 0.21 | $ | 0.72 | |||||||||||
| Weighted-Average Shares Outstanding | |||||||||||||||||
| Basic | 220,401,156 | 220,223,239 | 220,031,597 | ||||||||||||||
| Diluted | 220,720,310 | 220,577,900 | 220,129,870 | ||||||||||||||
| Dividends Declared Per Share | $ | 0.890 | $ | 0.880 | $ | 0.865 | |||||||||||
| Three Months Ended | |||||||||||||||||
| March 31, 2025 | December 31, 2024 | March 31, 2024 | |||||||||||||||
| Net income attributable to W. P. Carey | $ | 125,824 | $ | 47,023 | $ | 159,223 | |||||||||||
| Adjustments: | |||||||||||||||||
| Depreciation and amortization of real property | 128,937 | 115,107 | 118,113 | ||||||||||||||
| Gain on sale of real estate, net | (43,777) | (4,480) | (15,445) | ||||||||||||||
| Impairment charges — real estate | 6,854 | 27,843 | — | ||||||||||||||
Proportionate share of adjustments to earnings from equity method investments (a) |
1,643 | 2,879 | 2,949 | ||||||||||||||
Proportionate share of adjustments for noncontrolling interests (b) |
(78) | (79) | (103) | ||||||||||||||
| Total adjustments | 93,579 | 141,270 | 105,514 | ||||||||||||||
FFO (as defined by NAREIT) Attributable to W. P. Carey (c) |
219,403 | 188,293 | 264,737 | ||||||||||||||
| Adjustments: | |||||||||||||||||
Other (gains) and losses (d) |
42,197 | 77,224 | (13,839) | ||||||||||||||
| Straight-line and other leasing and financing adjustments | (19,033) | (24,849) | (19,553) | ||||||||||||||
| Stock-based compensation | 9,148 | 9,667 | 8,856 | ||||||||||||||
| Amortization of deferred financing costs | 4,782 | 4,851 | 4,588 | ||||||||||||||
| Above- and below-market rent intangible lease amortization, net | 1,123 | 10,047 | 4,068 | ||||||||||||||
| Tax (benefit) expense – deferred and other | (782) | 96 | (1,373) | ||||||||||||||
| Other amortization and non-cash items | 560 | 557 | 579 | ||||||||||||||
| Merger and other expenses | 556 | (484) | 4,452 | ||||||||||||||
Proportionate share of adjustments to earnings from equity method investments (a) |
(86) | 2,266 | (519) | ||||||||||||||
Proportionate share of adjustments for noncontrolling interests (b) |
(48) | (62) | (104) | ||||||||||||||
| Total adjustments | 38,417 | 79,313 | (12,845) | ||||||||||||||
AFFO Attributable to W. P. Carey (c) |
$ | 257,820 | $ | 267,606 | $ | 251,892 | |||||||||||
| Summary | |||||||||||||||||
FFO (as defined by NAREIT) attributable to W. P. Carey (c) |
$ | 219,403 | $ | 188,293 | $ | 264,737 | |||||||||||
FFO (as defined by NAREIT) attributable to W. P. Carey per diluted share (c) |
$ | 0.99 | $ | 0.85 | $ | 1.20 | |||||||||||
AFFO attributable to W. P. Carey (c) |
$ | 257,820 | $ | 267,606 | $ | 251,892 | |||||||||||
AFFO attributable to W. P. Carey per diluted share (c) |
$ | 1.17 | $ | 1.21 | $ | 1.14 | |||||||||||
| Diluted weighted-average shares outstanding | 220,720,310 | 220,577,900 | 220,129,870 | ||||||||||||||

| REIT | Real estate investment trust | ||||
| U.S. | United States | ||||
| ABR | Contractual minimum annualized base rent | ||||
| ASC | Accounting Standards Codification | ||||
| NAREIT | National Association of Real Estate Investment Trusts (an industry trade group) | ||||
| EUR | Euro | ||||
| EURIBOR | Euro Interbank Offered Rate | ||||
| SOFR | Secured Overnight Financing Rate | ||||
| TIBOR | Tokyo Interbank Offered Rate | ||||
| Table of Contents | |||||
| Overview | |||||
| Financial Results | |||||
| Balance Sheets and Capitalization | |||||
| Real Estate | |||||
| Investment Activity | |||||
| Appendix | |||||
| Summary Metrics | |||||
| Financial Results | |||||||||||||||||||||||
| Revenues, including reimbursable costs – consolidated ($000s) | $ | 409,858 | |||||||||||||||||||||
| Net income attributable to W. P. Carey ($000s) | 125,824 | ||||||||||||||||||||||
| Net income attributable to W. P. Carey per diluted share | 0.57 | ||||||||||||||||||||||
Normalized pro rata cash NOI ($000s) (a) (b) |
352,072 | ||||||||||||||||||||||
Adjusted EBITDA ($000s) (a) (b) |
335,499 | ||||||||||||||||||||||
AFFO attributable to W. P. Carey ($000s) (a) (b) |
257,820 | ||||||||||||||||||||||
AFFO attributable to W. P. Carey per diluted share (a) (b) |
1.17 | ||||||||||||||||||||||
| Dividends declared per share – current quarter | 0.890 | ||||||||||||||||||||||
| Dividends declared per share – current quarter annualized | 3.560 | ||||||||||||||||||||||
| Dividend yield – annualized, based on quarter end share price of $63.11 | 5.6 | % | |||||||||||||||||||||
Dividend payout ratio – for the three months ended March 31, 2025 (c) |
76.1 | % | |||||||||||||||||||||
| Balance Sheet and Capitalization | |||||||||||||||||||||||
| Equity market capitalization – based on quarter end share price of $63.11 ($000s) | $ | 13,819,559 | |||||||||||||||||||||
Pro rata net debt ($000s) (d) |
7,833,309 | ||||||||||||||||||||||
| Enterprise value ($000s) | 21,652,868 | ||||||||||||||||||||||
| Total consolidated debt ($000s) | 7,866,302 | ||||||||||||||||||||||
Gross assets ($000s) (e) |
19,201,044 | ||||||||||||||||||||||
Liquidity ($000s) (f) |
1,977,784 | ||||||||||||||||||||||
Pro rata net debt to enterprise value (b) |
36.2 | % | |||||||||||||||||||||
Pro rata net debt to adjusted EBITDA (annualized) (a) (b) |
5.8x | ||||||||||||||||||||||
| Total consolidated debt to gross assets | 41.0 | % | |||||||||||||||||||||
| Total consolidated secured debt to gross assets | 1.7 | % | |||||||||||||||||||||
Cash interest expense coverage ratio (a) (b) |
5.1x | ||||||||||||||||||||||
Weighted-average interest rate – for the three months ended March 31, 2025 (b) |
3.2 | % | |||||||||||||||||||||
Weighted-average interest rate – as of March 31, 2025 (b) |
3.1 | % | |||||||||||||||||||||
Weighted-average debt maturity (years) (b) |
4.9 | ||||||||||||||||||||||
| Moody's Investors Service – issuer rating | Baa1 (stable) | ||||||||||||||||||||||
| Standard & Poor's Ratings Services – issuer rating | BBB+ (stable) | ||||||||||||||||||||||
| Real Estate Portfolio (Pro Rata) | |||||||||||||||||||||||
ABR – total portfolio ($000s) (g) |
$ | 1,399,283 | |||||||||||||||||||||
ABR – unencumbered portfolio (% / $000s) (g) (h) |
95.9% / |
$ | 1,341,837 | ||||||||||||||||||||
| Number of net-leased properties | 1,614 | ||||||||||||||||||||||
Number of operating properties (i) |
84 | ||||||||||||||||||||||
Number of tenants – net-leased properties |
366 | ||||||||||||||||||||||
| ABR from top ten tenants as a % of total ABR – net-leased properties | 19.2 | % | |||||||||||||||||||||
ABR from investment grade tenants as a % of total ABR – net-leased properties (j) |
23.9 | % | |||||||||||||||||||||
Contractual same-store growth (k) |
2.4 | % | |||||||||||||||||||||
| Net-leased properties – square footage (millions) | 176.7 | ||||||||||||||||||||||
| Occupancy – net-leased properties | 98.3 | % | |||||||||||||||||||||
| Weighted-average lease term (years) | 12.3 | ||||||||||||||||||||||
| Investment volume – current quarter ($000s) | $ | 275,144 | |||||||||||||||||||||
| Dispositions – current quarter ($000s) | 129,832 | ||||||||||||||||||||||
| Maximum commitment for capital investments and commitments expected to be completed during 2025 ($000s) | 117,102 | ||||||||||||||||||||||
 |
Investing for the Long Run® | 1 |
|||||||
|
Investing for the Long Run® | 2 |
|||||||
| Components of Net Asset Value | |||||
Normalized Pro Rata Cash NOI (a) (b) |
Three Months Ended Mar. 31, 2025 | ||||||||||||||||
| Net lease properties | $ | 335,492 | |||||||||||||||
Self-storage and other operating properties (c) |
16,580 | ||||||||||||||||
Total normalized pro rata cash NOI (a) (b) |
$ | 352,072 | |||||||||||||||
| Balance Sheet – Selected Information (Consolidated Unless Otherwise Stated) | As of Mar. 31, 2025 | ||||||||||||||||
| Assets | |||||||||||||||||
Book value of real estate excluded from normalized pro rata cash NOI (d) |
$ | 217,680 | |||||||||||||||
| Cash and cash equivalents | 187,809 | ||||||||||||||||
Las Vegas retail complex construction loan (e) |
243,884 | ||||||||||||||||
| Other secured loans receivable, net | 32,663 | ||||||||||||||||
| Other assets, net: | |||||||||||||||||
| Straight-line rent adjustments | $ | 405,874 | |||||||||||||||
Investment in shares of Lineage (a cold storage REIT) (f) |
270,848 | ||||||||||||||||
| Deferred charges | 76,068 | ||||||||||||||||
| Taxes receivable | 50,506 | ||||||||||||||||
| Office lease right-of-use assets, net | 50,438 | ||||||||||||||||
| Non-rent tenant and other receivables | 35,385 | ||||||||||||||||
| Restricted cash, including escrow | 29,820 | ||||||||||||||||
| Deferred income taxes | 20,997 | ||||||||||||||||
| Prepaid expenses | 19,526 | ||||||||||||||||
| Leasehold improvements, furniture and fixtures | 11,989 | ||||||||||||||||
| Securities and derivatives | 10,768 | ||||||||||||||||
Rent receivables (g) |
1,852 | ||||||||||||||||
| Due from affiliates | 1,012 | ||||||||||||||||
| Other | 15,592 | ||||||||||||||||
| Total other assets, net | $ | 1,000,675 | |||||||||||||||
| Liabilities | |||||||||||||||||
Total pro rata debt outstanding (b) (h) |
$ | 8,021,118 | |||||||||||||||
| Dividends payable | 199,160 | ||||||||||||||||
| Deferred income taxes | 154,888 | ||||||||||||||||
| Accounts payable, accrued expenses and other liabilities: | |||||||||||||||||
| Accounts payable and accrued expenses | $ | 174,595 | |||||||||||||||
| Prepaid and deferred rents | 157,043 | ||||||||||||||||
| Operating lease liabilities | 144,880 | ||||||||||||||||
| Tenant security deposits | 41,719 | ||||||||||||||||
| Accrued taxes payable | 41,090 | ||||||||||||||||
| Securities and derivatives | 2,293 | ||||||||||||||||
| Other | 43,998 | ||||||||||||||||
| Total accounts payable, accrued expenses and other liabilities | $ | 605,618 | |||||||||||||||
|
Investing for the Long Run® | 3 |
|||||||
|
Investing for the Long Run® | 4 |
|||||||

|
Investing for the Long Run® | 5 |
|||||||
| Consolidated Statements of Income – Last Five Quarters | |||||
| Three Months Ended | |||||||||||||||||||||||||||||
| Mar. 31, 2025 | Dec. 31, 2024 | Sep. 30, 2024 | Jun. 30, 2024 | Mar. 31, 2024 | |||||||||||||||||||||||||
| Revenues | |||||||||||||||||||||||||||||
| Real Estate: | |||||||||||||||||||||||||||||
| Lease revenues | $ | 353,768 | $ | 351,394 | $ | 334,039 | $ | 324,104 | $ | 322,251 | |||||||||||||||||||
| Income from finance leases and loans receivable | 17,458 | 16,796 | 15,712 | 14,961 | 25,793 | ||||||||||||||||||||||||
| Operating property revenues | 33,094 | 34,132 | 37,323 | 38,715 | 36,643 | ||||||||||||||||||||||||
| Other lease-related income | 3,121 | 1,329 | 7,701 | 9,149 | 2,155 | ||||||||||||||||||||||||
| 407,441 | 403,651 | 394,775 | 386,929 | 386,842 | |||||||||||||||||||||||||
| Investment Management: | |||||||||||||||||||||||||||||
| Asset management revenue | 1,350 | 1,461 | 1,557 | 1,686 | 1,893 | ||||||||||||||||||||||||
| Other advisory income and reimbursements | 1,067 | 1,053 | 1,051 | 1,057 | 1,063 | ||||||||||||||||||||||||
| 2,417 | 2,514 | 2,608 | 2,743 | 2,956 | |||||||||||||||||||||||||
| 409,858 | 406,165 | 397,383 | 389,672 | 389,798 | |||||||||||||||||||||||||
| Operating Expenses | |||||||||||||||||||||||||||||
| Depreciation and amortization | 129,607 | 115,770 | 115,705 | 137,481 | 118,768 | ||||||||||||||||||||||||
| General and administrative | 26,967 | 24,254 | 22,679 | 24,168 | 27,868 | ||||||||||||||||||||||||
| Reimbursable tenant costs | 17,092 | 15,661 | 13,337 | 14,004 | 12,973 | ||||||||||||||||||||||||
| Operating property expenses | 16,544 | 16,586 | 17,765 | 18,565 | 17,950 | ||||||||||||||||||||||||
| Property expenses, excluding reimbursable tenant costs | 11,706 | 12,580 | 10,993 | 13,931 | 12,173 | ||||||||||||||||||||||||
| Stock-based compensation expense | 9,148 | 9,667 | 13,468 | 8,903 | 8,856 | ||||||||||||||||||||||||
| Impairment charges — real estate | 6,854 | 27,843 | — | 15,752 | — | ||||||||||||||||||||||||
Merger and other expenses (a) |
556 | (484) | 283 | 206 | 4,452 | ||||||||||||||||||||||||
| 218,474 | 221,877 | 194,230 | 233,010 | 203,040 | |||||||||||||||||||||||||
| Other Income and Expenses | |||||||||||||||||||||||||||||
| Interest expense | (68,804) | (70,883) | (72,526) | (65,307) | (68,651) | ||||||||||||||||||||||||
| Gain on sale of real estate, net | 43,777 | 4,480 | 15,534 | 39,363 | 15,445 | ||||||||||||||||||||||||
Other gains and (losses) (b) |
(42,197) | (77,224) | (77,107) | 2,504 | 13,839 | ||||||||||||||||||||||||
Non-operating income (c) |
7,910 | 13,847 | 13,669 | 9,215 | 15,505 | ||||||||||||||||||||||||
| Earnings from equity method investments | 5,378 | 302 | 6,124 | 6,636 | 4,864 | ||||||||||||||||||||||||
Gain on change in control of interests (d) |
— | — | 31,849 | — | — | ||||||||||||||||||||||||
| (53,936) | (129,478) | (82,457) | (7,589) | (18,998) | |||||||||||||||||||||||||
| Income before income taxes | 137,448 | 54,810 | 120,696 | 149,073 | 167,760 | ||||||||||||||||||||||||
| Provision for income taxes | (11,632) | (7,772) | (9,044) | (6,219) | (8,674) | ||||||||||||||||||||||||
| Net Income | 125,816 | 47,038 | 111,652 | 142,854 | 159,086 | ||||||||||||||||||||||||
| Net loss (income) attributable to noncontrolling interests | 8 | (15) | 46 | 41 | 137 | ||||||||||||||||||||||||
| Net Income Attributable to W. P. Carey | $ | 125,824 | $ | 47,023 | $ | 111,698 | $ | 142,895 | $ | 159,223 | |||||||||||||||||||
| Basic Earnings Per Share | $ | 0.57 | $ | 0.21 | $ | 0.51 | $ | 0.65 | $ | 0.72 | |||||||||||||||||||
| Diluted Earnings Per Share | $ | 0.57 | $ | 0.21 | $ | 0.51 | $ | 0.65 | $ | 0.72 | |||||||||||||||||||
| Weighted-Average Shares Outstanding | |||||||||||||||||||||||||||||
| Basic | 220,401,156 | 220,223,239 | 220,221,366 | 220,195,910 | 220,031,597 | ||||||||||||||||||||||||
| Diluted | 220,720,310 | 220,577,900 | 220,404,149 | 220,214,118 | 220,129,870 | ||||||||||||||||||||||||
| Dividends Declared Per Share | $ | 0.890 | $ | 0.880 | $ | 0.875 | $ | 0.870 | $ | 0.865 | |||||||||||||||||||
|
Investing for the Long Run® | 6 |
|||||||
| FFO and AFFO, Consolidated – Last Five Quarters | |||||
| Three Months Ended | |||||||||||||||||||||||||||||
| Mar. 31, 2025 | Dec. 31, 2024 | Sep. 30, 2024 | Jun. 30, 2024 | Mar. 31, 2024 | |||||||||||||||||||||||||
| Net income attributable to W. P. Carey | $ | 125,824 | $ | 47,023 | $ | 111,698 | $ | 142,895 | $ | 159,223 | |||||||||||||||||||
| Adjustments: | |||||||||||||||||||||||||||||
| Depreciation and amortization of real property | 128,937 | 115,107 | 115,028 | 136,840 | 118,113 | ||||||||||||||||||||||||
| Gain on sale of real estate, net | (43,777) | (4,480) | (15,534) | (39,363) | (15,445) | ||||||||||||||||||||||||
| Impairment charges — real estate | 6,854 | 27,843 | — | 15,752 | — | ||||||||||||||||||||||||
Gain on change in control of interests (a) |
— | — | (31,849) | — | — | ||||||||||||||||||||||||
Proportionate share of adjustments to earnings from equity method investments (b) |
1,643 | 2,879 | 3,028 | 3,015 | 2,949 | ||||||||||||||||||||||||
Proportionate share of adjustments for noncontrolling interests (c) |
(78) | (79) | (96) | (101) | (103) | ||||||||||||||||||||||||
| Total adjustments | 93,579 | 141,270 | 70,577 | 116,143 | 105,514 | ||||||||||||||||||||||||
FFO (as defined by NAREIT) Attributable to W. P. Carey (d) |
219,403 | 188,293 | 182,275 | 259,038 | 264,737 | ||||||||||||||||||||||||
| Adjustments: | |||||||||||||||||||||||||||||
Other (gains) and losses (e) |
42,197 | 77,224 | 77,107 | (2,504) | (13,839) | ||||||||||||||||||||||||
| Straight-line and other leasing and financing adjustments | (19,033) | (24,849) | (21,187) | (15,310) | (19,553) | ||||||||||||||||||||||||
| Stock-based compensation | 9,148 | 9,667 | 13,468 | 8,903 | 8,856 | ||||||||||||||||||||||||
| Amortization of deferred financing costs | 4,782 | 4,851 | 4,851 | 4,555 | 4,588 | ||||||||||||||||||||||||
Above- and below-market rent intangible lease amortization, net |
1,123 | 10,047 | 6,263 | 5,766 | 4,068 | ||||||||||||||||||||||||
| Tax (benefit) expense – deferred and other | (782) | 96 | (1,576) | (1,392) | (1,373) | ||||||||||||||||||||||||
| Other amortization and non-cash items | 560 | 557 | 587 | 580 | 579 | ||||||||||||||||||||||||
Merger and other expenses (f) |
556 | (484) | 283 | 206 | 4,452 | ||||||||||||||||||||||||
Proportionate share of adjustments to earnings from equity method investments (b) |
(86) | 2,266 | (2,632) | (2,646) | (519) | ||||||||||||||||||||||||
Proportionate share of adjustments for noncontrolling interests (c) |
(48) | (62) | (91) | (97) | (104) | ||||||||||||||||||||||||
| Total adjustments | 38,417 | 79,313 | 77,073 | (1,939) | (12,845) | ||||||||||||||||||||||||
AFFO Attributable to W. P. Carey (d) |
$ | 257,820 | $ | 267,606 | $ | 259,348 | $ | 257,099 | $ | 251,892 | |||||||||||||||||||
| Summary | |||||||||||||||||||||||||||||
FFO (as defined by NAREIT) attributable to W. P. Carey (d) |
$ | 219,403 | $ | 188,293 | $ | 182,275 | $ | 259,038 | $ | 264,737 | |||||||||||||||||||
FFO (as defined by NAREIT) attributable to W. P. Carey per diluted share (d) |
$ | 0.99 | $ | 0.85 | $ | 0.83 | $ | 1.18 | $ | 1.20 | |||||||||||||||||||
AFFO attributable to W. P. Carey (d) |
$ | 257,820 | $ | 267,606 | $ | 259,348 | $ | 257,099 | $ | 251,892 | |||||||||||||||||||
AFFO attributable to W. P. Carey per diluted share (d) |
$ | 1.17 | $ | 1.21 | $ | 1.18 | $ | 1.17 | $ | 1.14 | |||||||||||||||||||
| Diluted weighted-average shares outstanding | 220,720,310 | 220,577,900 | 220,404,149 | 220,214,118 | 220,129,870 | ||||||||||||||||||||||||
|
Investing for the Long Run® | 7 |
|||||||
| Elements of Pro Rata Statement of Income and AFFO Adjustments | |||||
Equity Method Investments (a) |
Noncontrolling Interests (b) |
AFFO Adjustments | ||||||||||||||||||
| Revenues | ||||||||||||||||||||
| Real Estate: | ||||||||||||||||||||
Lease revenues |
$ | 4,672 | $ | (243) | $ | (18,523) | (c) |
|||||||||||||
| Income from finance leases and loans receivable | 33 | — | 562 | |||||||||||||||||
| Operating property revenues | — | — | ||||||||||||||||||
| Other lease-related income | 59 | — | — | |||||||||||||||||
Investment Management: |
||||||||||||||||||||
| Asset management revenue | — | — | — | |||||||||||||||||
| Other advisory income and reimbursements | — | — | — | |||||||||||||||||
| Operating Expenses | ||||||||||||||||||||
| Depreciation and amortization | 1,463 | (78) | (130,420) | (d) |
||||||||||||||||
| General and administrative | — | — | — | |||||||||||||||||
Reimbursable tenant costs |
436 | (56) | — | |||||||||||||||||
| Operating property expenses | — | — | (30) | (e) |
||||||||||||||||
Property expenses, excluding reimbursable tenant costs |
197 | (13) | (437) | (e) |
||||||||||||||||
Stock-based compensation expense |
— | — | (9,148) | (e) |
||||||||||||||||
| Impairment charges — real estate | — | — | (6,854) | (e) |
||||||||||||||||
| Merger and other expenses | — | — | (556) | |||||||||||||||||
| Other Income and Expenses | ||||||||||||||||||||
| Interest expense | (800) | 57 | 4,813 | (f) |
||||||||||||||||
| Gain on sale of real estate, net | — | — | (43,777) | |||||||||||||||||
| Other gains and (losses) | 19 | 41 | 42,137 | (g) |
||||||||||||||||
| Non-operating income | 65 | (1) | — | |||||||||||||||||
| Earnings from equity method investments | (1,714) | — | (133) | (h) |
||||||||||||||||
| Provision for income taxes | (238) | — | (528) | (i) |
||||||||||||||||
| Net loss attributable to noncontrolling interests | — | (1) | — | |||||||||||||||||
|
Investing for the Long Run® | 8 |
|||||||
| Capital Expenditures | |||||
Turnover Costs (a) |
|||||
| Tenant improvements | $ | 915 | |||
| Leasing costs | 1,632 | ||||
| Total Tenant Improvements and Leasing Costs | 2,547 | ||||
| Property improvements — net-lease properties | 285 | ||||
| Property improvements — operating properties | 232 | ||||
| Total Turnover Costs | $ | 3,064 | |||
| Maintenance Capital Expenditures | |||||
| Net-lease properties | $ | 2,094 | |||
| Operating properties | 634 | ||||
| Total Maintenance Capital Expenditures | $ | 2,728 | |||
|
Investing for the Long Run® | 9 |
|||||||
|
Investing for the Long Run® | 10 |
|||||||
| Consolidated Balance Sheets | |||||
| March 31, 2025 | December 31, 2024 | ||||||||||
| Assets | |||||||||||
| Investments in real estate: | |||||||||||
| Land, buildings and improvements — net lease and other | $ | 13,114,194 | $ | 12,842,869 | |||||||
| Land, buildings and improvements — operating properties | 1,202,920 | 1,198,676 | |||||||||
| Net investments in finance leases and loans receivable | 866,949 | 798,259 | |||||||||
In-place lease intangible assets and other |
2,338,805 | 2,297,572 | |||||||||
Above-market rent intangible assets |
671,887 | 665,495 | |||||||||
| Investments in real estate | 18,194,755 | 17,802,871 | |||||||||
Accumulated depreciation and amortization (a) |
(3,367,408) | (3,222,396) | |||||||||
| Assets held for sale, net | 12,139 | — | |||||||||
| Net investments in real estate | 14,839,486 | 14,580,475 | |||||||||
| Equity method investments | 304,838 | 301,115 | |||||||||
| Cash and cash equivalents | 187,809 | 640,373 | |||||||||
| Other assets, net | 1,000,675 | 1,045,218 | |||||||||
| Goodwill | 974,497 | 967,843 | |||||||||
| Total assets | $ | 17,307,305 | $ | 17,535,024 | |||||||
| Liabilities and Equity | |||||||||||
| Debt: | |||||||||||
| Senior unsecured notes, net | $ | 6,211,918 | $ | 6,505,907 | |||||||
| Unsecured term loans, net | 1,113,910 | 1,075,826 | |||||||||
| Unsecured revolving credit facility | 205,129 | 55,448 | |||||||||
| Non-recourse mortgages, net | 335,345 | 401,821 | |||||||||
| Debt, net | 7,866,302 | 8,039,002 | |||||||||
| Accounts payable, accrued expenses and other liabilities | 605,618 | 596,994 | |||||||||
Below-market rent and other intangible liabilities, net |
114,414 | 119,831 | |||||||||
| Deferred income taxes | 154,888 | 147,461 | |||||||||
| Dividends payable | 199,160 | 197,612 | |||||||||
| Total liabilities | 8,940,382 | 9,100,900 | |||||||||
Preferred stock, $0.001 par value, 50,000,000 shares authorized; none issued |
— | — | |||||||||
Common stock, $0.001 par value, 450,000,000 shares authorized; 218,975,748 and 218,848,844 shares, respectively, issued and outstanding |
219 | 219 | |||||||||
| Additional paid-in capital | 11,792,420 | 11,805,179 | |||||||||
| Distributions in excess of accumulated earnings | (3,276,497) | (3,203,974) | |||||||||
| Deferred compensation obligation | 96,952 | 78,503 | |||||||||
| Accumulated other comprehensive loss | (250,731) | (250,232) | |||||||||
| Total stockholders' equity | 8,362,363 | 8,429,695 | |||||||||
| Noncontrolling interests | 4,560 | 4,429 | |||||||||
| Total equity | 8,366,923 | 8,434,124 | |||||||||
| Total liabilities and equity | $ | 17,307,305 | $ | 17,535,024 | |||||||
|
Investing for the Long Run® | 11 |
|||||||
| Capitalization | |||||
| Description | Shares | Share Price | Market Value | |||||||||||||||||||||||
| Equity | ||||||||||||||||||||||||||
| Common equity | 218,975,748 | $ | 63.11 | $ | 13,819,559 | |||||||||||||||||||||
| Preferred equity | — | |||||||||||||||||||||||||
| Total Equity Market Capitalization | 13,819,559 | |||||||||||||||||||||||||
Outstanding Balance (a) |
||||||||||||||||||||||||||
| Pro Rata Debt | ||||||||||||||||||||||||||
| Non-recourse mortgages | 422,722 | |||||||||||||||||||||||||
| Unsecured term loans (due February 14, 2028) | 582,079 | |||||||||||||||||||||||||
| Unsecured term loan (due April 24, 2029) | 540,750 | |||||||||||||||||||||||||
| Unsecured revolving credit facility (due February 14, 2029) | 205,129 | |||||||||||||||||||||||||
| Senior unsecured notes: | ||||||||||||||||||||||||||
| Due April 9, 2026 (EUR) | 540,750 | |||||||||||||||||||||||||
| Due October 1, 2026 (USD) | 350,000 | |||||||||||||||||||||||||
| Due April 15, 2027 (EUR) | 540,750 | |||||||||||||||||||||||||
| Due April 15, 2028 (EUR) | 540,750 | |||||||||||||||||||||||||
| Due July 15, 2029 (USD) | 325,000 | |||||||||||||||||||||||||
| Due September 28, 2029 (EUR) | 162,225 | |||||||||||||||||||||||||
| Due June 1, 2030 (EUR) | 567,788 | |||||||||||||||||||||||||
| Due February 1, 2031 (USD) | 500,000 | |||||||||||||||||||||||||
| Due February 1, 2032 (USD) | 350,000 | |||||||||||||||||||||||||
| Due July 23, 2032 (EUR) | 702,975 | |||||||||||||||||||||||||
| Due September 28, 2032 (EUR) | 216,300 | |||||||||||||||||||||||||
| Due April 1, 2033 (USD) | 425,000 | |||||||||||||||||||||||||
| Due June 30, 2034 (USD) | 400,000 | |||||||||||||||||||||||||
| Due November 19, 2034 (EUR) | 648,900 | |||||||||||||||||||||||||
| Total Pro Rata Debt | 8,021,118 | |||||||||||||||||||||||||
| Total Capitalization | $ | 21,840,677 | ||||||||||||||||||||||||
|
Investing for the Long Run® | 12 |
|||||||
| Debt Overview | |||||
| USD-Denominated | EUR-Denominated | Other Currencies (a) |
Total | |||||||||||||||||||||||||||||||||||||||||||||||||||||||||||||||||
| Outstanding Balance | ||||||||||||||||||||||||||||||||||||||||||||||||||||||||||||||||||||
| Out-standing Balance (in USD) |
Weigh-ted Avg. Interest Rate |
Out-standing Balance (in USD) |
Weigh-ted Avg. Interest Rate |
Out-standing Balance (in USD) |
Weigh-ted Avg. Interest Rate |
Amount (in USD) |
% of Total | Weigh-ted Avg. Interest Rate |
Weigh-ted Avg. Maturity (Years) |
|||||||||||||||||||||||||||||||||||||||||||||||||||||||||||
Non-Recourse Debt (b) (c) |
||||||||||||||||||||||||||||||||||||||||||||||||||||||||||||||||||||
Fixed (d) |
$ | 252,102 | 4.7 | % | $ | 70,479 | 5.0 | % | $ | 66,710 | 4.3 | % | $ | 389,291 | 4.9 | % | 4.7 | % | 1.5 | |||||||||||||||||||||||||||||||||||||||||||||||||
| Floating | — | — | % | 33,431 | 4.6 | % | — | — | % | 33,431 | 0.4 | % | 4.6 | % | 1.1 | |||||||||||||||||||||||||||||||||||||||||||||||||||||
Total Pro Rata Non-Recourse Debt |
252,102 | 4.7 | % | 103,910 | 4.9 | % | 66,710 | 4.3 | % | 422,722 | 5.3 | % | 4.7 | % | 1.5 | |||||||||||||||||||||||||||||||||||||||||||||||||||||
Recourse Debt (b) (c) |
||||||||||||||||||||||||||||||||||||||||||||||||||||||||||||||||||||
| Fixed – Senior unsecured notes: | ||||||||||||||||||||||||||||||||||||||||||||||||||||||||||||||||||||
| Due April 9, 2026 | — | — | % | 540,750 | 2.3 | % | — | — | % | 540,750 | 6.7 | % | 2.3 | % | 1.0 | |||||||||||||||||||||||||||||||||||||||||||||||||||||
| Due October 1, 2026 | 350,000 | 4.3 | % | — | — | % | — | — | % | 350,000 | 4.4 | % | 4.3 | % | 1.5 | |||||||||||||||||||||||||||||||||||||||||||||||||||||
| Due April 15, 2027 | — | — | % | 540,750 | 2.1 | % | — | — | % | 540,750 | 6.7 | % | 2.1 | % | 2.0 | |||||||||||||||||||||||||||||||||||||||||||||||||||||
| Due April 15, 2028 | — | — | % | 540,750 | 1.4 | % | — | — | % | 540,750 | 6.7 | % | 1.4 | % | 3.0 | |||||||||||||||||||||||||||||||||||||||||||||||||||||
| Due July 15, 2029 | 325,000 | 3.9 | % | — | — | % | — | — | % | 325,000 | 4.1 | % | 3.9 | % | 4.3 | |||||||||||||||||||||||||||||||||||||||||||||||||||||
| Due September 28, 2029 | — | — | % | 162,225 | 3.4 | % | — | — | % | 162,225 | 2.0 | % | 3.4 | % | 4.5 | |||||||||||||||||||||||||||||||||||||||||||||||||||||
| Due June 1, 2030 | — | — | % | 567,788 | 1.0 | % | — | — | % | 567,788 | 7.1 | % | 1.0 | % | 5.2 | |||||||||||||||||||||||||||||||||||||||||||||||||||||
| Due February 1, 2031 | 500,000 | 2.4 | % | — | — | % | — | — | % | 500,000 | 6.2 | % | 2.4 | % | 5.8 | |||||||||||||||||||||||||||||||||||||||||||||||||||||
| Due February 1, 2032 | 350,000 | 2.5 | % | — | — | % | — | — | % | 350,000 | 4.4 | % | 2.5 | % | 6.8 | |||||||||||||||||||||||||||||||||||||||||||||||||||||
| Due July 23, 2032 | — | — | % | 702,975 | 4.3 | % | — | — | % | 702,975 | 8.8 | % | 4.3 | % | 7.3 | |||||||||||||||||||||||||||||||||||||||||||||||||||||
| Due September 28, 2032 | — | — | % | 216,300 | 3.7 | % | — | — | % | 216,300 | 2.7 | % | 3.7 | % | 7.5 | |||||||||||||||||||||||||||||||||||||||||||||||||||||
| Due April 1, 2033 | 425,000 | 2.3 | % | — | — | % | — | — | % | 425,000 | 5.3 | % | 2.3 | % | 8.0 | |||||||||||||||||||||||||||||||||||||||||||||||||||||
| Due June 30, 2034 | 400,000 | 5.4 | % | — | — | % | — | — | % | 400,000 | 5.0 | % | 5.4 | % | 9.3 | |||||||||||||||||||||||||||||||||||||||||||||||||||||
| Due November 19, 2034 | — | — | % | 648,900 | 3.7 | % | — | — | % | 648,900 | 8.1 | % | 3.7 | % | 9.6 | |||||||||||||||||||||||||||||||||||||||||||||||||||||
Total Senior Unsecured Notes |
2,350,000 | 3.4 | % | 3,920,438 | 2.6 | % | — | — | % | 6,270,438 | 78.2 | % | 2.9 | % | 5.5 | |||||||||||||||||||||||||||||||||||||||||||||||||||||
| Swapped to Fixed: | ||||||||||||||||||||||||||||||||||||||||||||||||||||||||||||||||||||
Unsecured term loan (due April 24, 2029) (e) |
— | — | % | 540,750 | 2.8 | % | — | — | % | 540,750 | 6.7 | % | 2.8 | % | 4.1 | |||||||||||||||||||||||||||||||||||||||||||||||||||||
Unsecured term loan (due February 14, 2028) (e) |
— | — | % | — | — | % | 349,557 | 4.7 | % | 349,557 | 4.4 | % | 4.7 | % | 2.9 | |||||||||||||||||||||||||||||||||||||||||||||||||||||
| Floating: | ||||||||||||||||||||||||||||||||||||||||||||||||||||||||||||||||||||
Unsecured term loan (due February 14, 2028) (f) |
— | — | % | 232,522 | 3.2 | % | — | — | % | 232,522 | 2.9 | % | 3.2 | % | 2.9 | |||||||||||||||||||||||||||||||||||||||||||||||||||||
Unsecured revolving credit facility (due February 14, 2029) (g) |
189,000 | 5.0 | % | — | — | % | 16,129 | 1.5 | % | 205,129 | 2.5 | % | 4.8 | % | 3.9 | |||||||||||||||||||||||||||||||||||||||||||||||||||||
| Total Recourse Debt | 2,539,000 | 3.5 | % | 4,693,710 | 2.7 | % | 365,686 | 4.6 | % | 7,598,396 | 94.7 | % | 3.0 | % | 5.1 | |||||||||||||||||||||||||||||||||||||||||||||||||||||
Total Pro Rata Debt Outstanding |
$ | 2,791,102 | 3.6 | % | $ | 4,797,620 | 2.7 | % | $ | 432,396 | 4.5 | % | $ | 8,021,118 | 100.0 | % | 3.1 | % | 4.9 | |||||||||||||||||||||||||||||||||||||||||||||||||
|
Investing for the Long Run® | 13 |
|||||||
| Debt Maturity | |||||
| Real Estate | Debt | |||||||||||||||||||||||||||||||||||||
Number of Properties (a) |
Weighted-Average Interest Rate | Total Outstanding Balance (b) (c) |
% of Total Outstanding Balance | |||||||||||||||||||||||||||||||||||
| Year of Maturity | ABR (a) |
Balloon | ||||||||||||||||||||||||||||||||||||
| Non-Recourse Debt | ||||||||||||||||||||||||||||||||||||||
| Remaining 2025 | 25 | $ | 11,274 | 4.4 | % | $ | 139,207 | $ | 139,884 | 1.7 | % | |||||||||||||||||||||||||||
| 2026 | 36 | 26,906 | 4.9 | % | 150,348 | 158,190 | 2.1 | % | ||||||||||||||||||||||||||||||
| 2027 | 3 | 1,247 | 4.2 | % | 28,221 | 28,634 | 0.4 | % | ||||||||||||||||||||||||||||||
| 2028 | 5 | 13,060 | 5.0 | % | 70,902 | 78,312 | 1.0 | % | ||||||||||||||||||||||||||||||
| 2029 | 3 | 1,435 | 4.0 | % | 10,931 | 11,921 | 0.1 | % | ||||||||||||||||||||||||||||||
| 2031 | 1 | 1,131 | 6.0 | % | 36 | 2,309 | — | % | ||||||||||||||||||||||||||||||
| 2033 | 1 | 2,393 | 5.6 | % | 1,671 | 3,472 | — | % | ||||||||||||||||||||||||||||||
Total Pro Rata Non-Recourse Debt |
74 | $ | 57,446 | 4.7 | % | $ | 401,316 | 422,722 | 5.3 | % | ||||||||||||||||||||||||||||
| Recourse Debt | ||||||||||||||||||||||||||||||||||||||
| Fixed – Senior unsecured notes: | ||||||||||||||||||||||||||||||||||||||
| Due April 9, 2026 (EUR) | 2.3 | % | 540,750 | 6.7 | % | |||||||||||||||||||||||||||||||||
| Due October 1, 2026 (USD) | 4.3 | % | 350,000 | 4.4 | % | |||||||||||||||||||||||||||||||||
| Due April 15, 2027 (EUR) | 2.1 | % | 540,750 | 6.7 | % | |||||||||||||||||||||||||||||||||
| Due April 15, 2028 (EUR) | 1.4 | % | 540,750 | 6.7 | % | |||||||||||||||||||||||||||||||||
| Due July 15, 2029 (USD) | 3.9 | % | 325,000 | 4.1 | % | |||||||||||||||||||||||||||||||||
| Due September 28, 2029 (EUR) | 3.4 | % | 162,225 | 2.0 | % | |||||||||||||||||||||||||||||||||
| Due June 1, 2030 (EUR) | 1.0 | % | 567,788 | 7.1 | % | |||||||||||||||||||||||||||||||||
| Due February 1, 2031 (USD) | 2.4 | % | 500,000 | 6.2 | % | |||||||||||||||||||||||||||||||||
| Due February 1, 2032 (USD) | 2.5 | % | 350,000 | 4.4 | % | |||||||||||||||||||||||||||||||||
| Due July 23, 2032 (EUR) | 4.3 | % | 702,975 | 8.8 | % | |||||||||||||||||||||||||||||||||
| Due September 28, 2032 (EUR) | 3.7 | % | 216,300 | 2.7 | % | |||||||||||||||||||||||||||||||||
| Due April 1, 2033 (USD) | 2.3 | % | 425,000 | 5.3 | % | |||||||||||||||||||||||||||||||||
| Due June 30, 2034 (USD) | 5.4 | % | 400,000 | 5.0 | % | |||||||||||||||||||||||||||||||||
| Due November 19, 2034 (EUR) | 3.7 | % | 648,900 | 8.1 | % | |||||||||||||||||||||||||||||||||
| Total Senior Unsecured Notes | 2.9 | % | 6,270,438 | 78.2 | % | |||||||||||||||||||||||||||||||||
| Swapped to Fixed: | ||||||||||||||||||||||||||||||||||||||
Unsecured term loan (due April 24, 2029) (d) |
2.8 | % | 540,750 | 6.7 | % | |||||||||||||||||||||||||||||||||
Unsecured term loan (due Feb 14, 2028) (d) |
4.7 | % | 349,557 | 4.4 | % | |||||||||||||||||||||||||||||||||
| Floating: | ||||||||||||||||||||||||||||||||||||||
Unsecured term loan (due February 14, 2028) (e) |
3.2 | % | 232,522 | 2.9 | % | |||||||||||||||||||||||||||||||||
Unsecured revolving credit facility (due February 14, 2029) (f) |
4.8 | % | 205,129 | 2.5 | % | |||||||||||||||||||||||||||||||||
| Total Recourse Debt | 3.0 | % | 7,598,396 | 94.7 | % | |||||||||||||||||||||||||||||||||
| Total Pro Rata Debt Outstanding | 3.1 | % | $ | 8,021,118 | 100.0 | % | ||||||||||||||||||||||||||||||||
|
Investing for the Long Run® | 14 |
|||||||
| Senior Unsecured Notes | |||||
| Issuer | Senior Unsecured Notes | |||||||||||||||||||
| Ratings Agency | Rating | Outlook | Rating | |||||||||||||||||
| Moody's | Baa1 | Stable | Baa1 | |||||||||||||||||
| Standard & Poor’s | BBB+ | Stable | BBB+ | |||||||||||||||||
| Covenant | Metric | Required | As of Mar. 31, 2025 |
|||||||||||||||||
| Limitation on the incurrence of debt | "Total Debt" / "Total Assets" |
≤ 60% | 39.7% | |||||||||||||||||
| Limitation on the incurrence of secured debt | "Secured Debt" / "Total Assets" |
≤ 40% | 1.7% | |||||||||||||||||
Limitation on the incurrence of debt based on consolidated EBITDA to annual debt service charge |
"Consolidated EBITDA" / "Annual Debt Service Charge" |
≥ 1.5x | 5.1x | |||||||||||||||||
| Maintenance of unencumbered asset value | "Unencumbered Assets" / "Total Unsecured Debt" | ≥ 150% | 244.8% | |||||||||||||||||
|
Investing for the Long Run® | 15 |
|||||||
|
Investing for the Long Run® | 16 |
|||||||
| Investment Activity – Investment Volume | |||||
| Property Type(s) | Closing Date / Asset Completion Date | Gross Investment Amount | Investment Type | Lease Term (Years) (a) |
Gross Square Footage | |||||||||||||||||||||||||||||||||||||||
| Tenant / Lease Guarantor | Property Location(s) | |||||||||||||||||||||||||||||||||||||||||||
| 1Q25 | ||||||||||||||||||||||||||||||||||||||||||||
| Reddy Ice LLC (59 properties) | Various, United States | Industrial, Warehouse | Feb-25 | $ | 136,022 | Sale-leaseback | 20 | 1,072,575 | ||||||||||||||||||||||||||||||||||||
| Las Vegas Retail Complex | Las Vegas, NV | Retail | Feb-25 | 5,000 | 47.5% Joint Venture Acquisition | 8 | 75,255 | |||||||||||||||||||||||||||||||||||||
| Dollar General Corporation (4 properties) | Various, United States | Retail | Mar-25 | 8,474 | Acquisition | 15 | 42,388 | |||||||||||||||||||||||||||||||||||||
| Ernest Health Holdings, LLC | Mishawaka, IN | Specialty (Healthcare) | Mar-25 | 31,762 | Acquisition | 15 | 55,210 | |||||||||||||||||||||||||||||||||||||
Majestic Steel USA, Inc. (b) |
Blytheville, AR | Industrial | Mar-25 | 91,910 | Sale-leaseback | 24 | 513,633 | |||||||||||||||||||||||||||||||||||||
| Year-to-Date Total | 273,168 | 16 | 1,759,061 | |||||||||||||||||||||||||||||||||||||||||
| Property Type | Loan Origination | Expected Funding Completion | Funding | Outstanding | Maximum Commitment | |||||||||||||||||||||||||||||||||||||||||||||
| Description | Property Location | Current Quarter | Year to Date | |||||||||||||||||||||||||||||||||||||||||||||||
| Construction Loan | ||||||||||||||||||||||||||||||||||||||||||||||||||
SW Corner of Las Vegas & Harmon (c) (d) |
Las Vegas, NV | Retail | Jun-21 | 2025 | $ | 1,170 | $ | 1,170 | $ | 243,884 | $ | 256,887 | ||||||||||||||||||||||||||||||||||||||
SE Corner of Las Vegas & Harmon (e) |
Las Vegas, NV | Retail | Nov-24 | 2025 | 45 | 45 | 16,856 | 23,449 | ||||||||||||||||||||||||||||||||||||||||||
SE Corner of Las Vegas & Elvis Presley (e) |
Las Vegas, NV | Retail | Nov-24 | 2025 | 761 | 761 | 15,807 | 25,000 | ||||||||||||||||||||||||||||||||||||||||||
| Total | 1,976 | 1,976 | 276,547 | 305,336 | ||||||||||||||||||||||||||||||||||||||||||||||
| Year-to-Date Total Investment Volume | $ | 275,144 | ||||||||||||||||||||||||||||||||||||||||||||||||
|
Investing for the Long Run® | 17 |
|||||||
Investment Activity – Capital Investments and Commitments (a) | |||||
| Primary Transaction Type | Property Type | Expected Completion / Closing Date | Additional Gross Square Footage | Lease Term (Years) (b) |
Funded During Three Months Ended Mar. 31, 2025 (c) |
Total Funded Through Mar. 31, 2025 | Maximum Commitment / Gross Investment Amount | |||||||||||||||||||||||||||||||||||||||||||||||||||||||
| Tenant | Location | Remaining | Total | |||||||||||||||||||||||||||||||||||||||||||||||||||||||||||
Tidal Wave Auto Spa (d) |
New Hartford, NY | Purchase Commitment | Retail (Car Wash) | Q2 2025 | 3,600 | 19 | $ | — | $ | — | $ | 5,077 | $ | 5,077 | ||||||||||||||||||||||||||||||||||||||||||||||||
ABC Technologies Holdings Inc. (e) |
Galeras, Mexico | Expansion | Industrial | Q2 2025 | 60,181 | 18 | 1,270 | 3,212 | 1,631 | 4,900 | ||||||||||||||||||||||||||||||||||||||||||||||||||||
| Sumitomo Heavy Industries, LTD. | Bedford, MA | Redevelopment | Research and Development | Q3 2025 | N/A | 15 | 3,127 | 16,935 | 27,205 | 44,140 | ||||||||||||||||||||||||||||||||||||||||||||||||||||
Janus International Group, Inc. (e) |
Surprise, AZ | Build-to-Suit | Industrial | Q3 2025 | 131,753 | 20 | 5,097 | 9,924 | 11,649 | 21,713 | ||||||||||||||||||||||||||||||||||||||||||||||||||||
Hedin Mobility Group AB (f) |
Amsterdam, The Netherlands | Renovation | Retail | Q4 2025 | 39,826 | 22 | — | — | 16,223 | 16,223 | ||||||||||||||||||||||||||||||||||||||||||||||||||||
EOS Fitness OPCO Holdings, LLC (e) |
Surprise, AZ | Build-to-Suit | Retail | Q4 2025 | 40,000 | 20 | 2,593 | 2,593 | 9,396 | 12,000 | ||||||||||||||||||||||||||||||||||||||||||||||||||||
Fraikin SAS (f) |
Various, France | Renovation | Industrial | Q4 2025 | N/A | 17 | 1,179 | 3,254 | 4,208 | 7,462 | ||||||||||||||||||||||||||||||||||||||||||||||||||||
| Various | Various, United States | Solar Projects | Various | Various | N/A | N/A | 3,133 | 4,000 | 1,587 | 5,587 | ||||||||||||||||||||||||||||||||||||||||||||||||||||
| Expected Completion Date 2025 Total | 275,360 | 18 | 16,399 | 39,918 | 76,976 | 117,102 | ||||||||||||||||||||||||||||||||||||||||||||||||||||||||
Scania CV AB (f) |
Oskarshamn, Sweden | Build-to-Suit | Warehouse | Q1 2026 | 204,645 | 15 | 2 | 13 | 16,097 | 16,110 | ||||||||||||||||||||||||||||||||||||||||||||||||||||
| Bear Holdings, LP | Billings, MT | Build-to-Suit | Education | Q2 2026 | 57,000 | 25 | — | 2,508 | 22,492 | 25,000 | ||||||||||||||||||||||||||||||||||||||||||||||||||||
ABC Technologies Holdings Inc. (f) (g) |
Brampton, Canada | Build-to-Suit | Industrial | Q4 2026 | 110,456 | 20 | — | — | 17,091 | 17,091 | ||||||||||||||||||||||||||||||||||||||||||||||||||||
| Expected Completion Date 2026 Total | 372,101 | 21 | 2 | 2,521 | 55,680 | 58,201 | ||||||||||||||||||||||||||||||||||||||||||||||||||||||||
| Capital Investments and Commitments Total | 647,461 | 19 | $ | 16,401 | $ | 42,439 | $ | 132,656 | $ | 175,303 | ||||||||||||||||||||||||||||||||||||||||||||||||||||
|
Investing for the Long Run® | 18 |
|||||||
| Investment Activity – Dispositions | |||||
| Tenant / Lease Guarantor | Property Location(s) | Gross Sale Price | Closing Date | Property Type(s) | Gross Square Footage | |||||||||||||||||||||||||||
| 1Q25 | ||||||||||||||||||||||||||||||||
Hedin Mobility Group AB (2 properties) (a) |
Eindhoven and Amsterdam, The Netherlands | $ | 16,593 | Jan-25 | Retail | 136,465 | ||||||||||||||||||||||||||
Pendragon PLC (a) |
Derby, United Kingdom | 2,158 | Jan-25 | Retail | 34,764 | |||||||||||||||||||||||||||
Pendragon PLC (a) |
Newport, United Kingdom | 752 | Jan-25 | Retail | 3,868 | |||||||||||||||||||||||||||
Vacant (formerly Pendragon PLC) (a) |
Milton Keynes, United Kingdom | 6,560 | Feb-25 | Retail | 25,942 | |||||||||||||||||||||||||||
Pendragon PLC (a) |
Portsmouth, United Kingdom | 1,506 | Feb-25 | Retail | 28,638 | |||||||||||||||||||||||||||
| Vacant (former Prima Wawona Packing Co., LLC) | Reedley, CA | 21,500 | Mar-25 | Warehouse | 325,981 | |||||||||||||||||||||||||||
Hellweg Die Profi-Baumärkte GmbH & Co. KG (a) |
Gronau, Germany | 3,569 | Mar-25 | Retail | 45,876 | |||||||||||||||||||||||||||
| Belk, Inc. | Jonesville, SC | 77,194 | Mar-25 | Warehouse | 861,141 | |||||||||||||||||||||||||||
| Year-to-Date Total Dispositions | $ | 129,832 | 1,462,675 | |||||||||||||||||||||||||||||
|
Investing for the Long Run® | 19 |
|||||||
| Joint Ventures | |||||
| Joint Venture or JV (Principal Tenant) | JV Partnership | Consolidated | Pro Rata (a) |
|||||||||||||||||||||||||||||||||||
| Asset Type | WPC % | Debt Outstanding (b) |
ABR | Debt Outstanding (c) |
ABR | |||||||||||||||||||||||||||||||||
Unconsolidated Joint Venture (Equity Method Investment) (d) |
||||||||||||||||||||||||||||||||||||||
Las Vegas Retail Complex (e) |
Net lease | 47.50% | $ | 243,884 | $ | 22,144 | $ | 115,845 | $ | 10,519 | ||||||||||||||||||||||||||||
| Harmon Retail Corner | Common equity interest | 15.00% | 143,000 | — | 21,450 | — | ||||||||||||||||||||||||||||||||
Kesko Senukai (f) |
Net lease | 70.00% | 95,518 | 16,664 | 66,862 | 11,665 | ||||||||||||||||||||||||||||||||
| Total Unconsolidated Joint Ventures | 482,402 | 38,808 | 204,157 | 22,184 | ||||||||||||||||||||||||||||||||||
| Consolidated Joint Ventures | ||||||||||||||||||||||||||||||||||||||
COOP Ost SA (f) |
Net lease | 90.10% | 51,644 | 6,683 | 46,532 | 6,022 | ||||||||||||||||||||||||||||||||
Fentonir Trading & Investments Limited (f) |
Net lease | 94.90% | — | 2,641 | — | 2,506 | ||||||||||||||||||||||||||||||||
| McCoy-Rockford, Inc. | Net lease | 90.00% | — | 972 | — | 875 | ||||||||||||||||||||||||||||||||
| State of Iowa Board of Regents | Net lease | 90.00% | — | 643 | — | 578 | ||||||||||||||||||||||||||||||||
| Total Consolidated Joint Ventures | 51,644 | 10,939 | 46,532 | 9,981 | ||||||||||||||||||||||||||||||||||
Total Unconsolidated and Consolidated Joint Ventures |
$ | 534,046 | $ | 49,747 | $ | 250,689 | $ | 32,165 | ||||||||||||||||||||||||||||||
|
Investing for the Long Run® | 20 |
|||||||
| Top 25 Tenants | |||||
| Tenant / Lease Guarantor | Description | Number of Properties | ABR | ABR % | Weighted-Average Lease Term (Years) | |||||||||||||||||||||||||||
| Extra Space Storage, Inc. | Net lease self-storage properties in the U.S. leased to publicly traded self-storage REIT | 39 | $ | 37,640 | 2.7 | % | 24.4 | |||||||||||||||||||||||||
Apotex Pharmaceutical Holdings Inc. (a) |
Pharmaceutical R&D and manufacturing properties in the Greater Toronto Area leased to generic drug manufacturer | 11 | 32,473 | 2.3 | % | 18.0 | ||||||||||||||||||||||||||
Metro Cash & Carry Italia S.p.A. (b) |
Business-to-business retail stores in Italy leased to cash and carry wholesaler | 19 | 28,391 | 2.0 | % | 4.9 | ||||||||||||||||||||||||||
Fortenova Grupa d.d. (b) |
Grocery stores and one warehouse in Croatia leased to European food retailer | 19 | 26,144 | 1.9 | % | 9.1 | ||||||||||||||||||||||||||
Hellweg Die Profi-Baumärkte GmbH & Co. KG (b) (c) |
Retail properties in Germany leased to German DIY retailer | 34 | 25,798 | 1.8 | % | 18.9 | ||||||||||||||||||||||||||
OBI Group (b) |
Retail properties in Poland leased to German DIY retailer | 26 | 25,258 | 1.8 | % | 6.1 | ||||||||||||||||||||||||||
ABC Technologies Holdings Inc. (a) (d) |
Automotive parts manufacturing properties in the U.S., Canada and Mexico leased to OEM supplier | 23 | 24,978 | 1.8 | % | 18.1 | ||||||||||||||||||||||||||
Fedrigoni S.p.A (b) |
Industrial and warehouse facilities in Germany, Italy and Spain leased to global manufacturer of premium packaging and labels | 16 | 23,100 | 1.7 | % | 18.7 | ||||||||||||||||||||||||||
| Nord Anglia Education, Inc. | K-12 private schools in Orlando, Miami and Houston leased to international day and boarding school operator | 3 | 22,963 | 1.6 | % | 18.5 | ||||||||||||||||||||||||||
Eroski Sociedad Cooperative (b) |
Grocery stores and warehouses in Spain leased to Spanish food retailer | 63 | 21,972 | 1.6 | % | 11.0 | ||||||||||||||||||||||||||
| Top 10 Total | 253 | 268,717 | 19.2 | % | 15.2 | |||||||||||||||||||||||||||
Quikrete Holdings, Inc. (b) |
Industrial facilities in the U.S. and Canada leased to concrete and building products manufacturer | 27 | 20,209 | 1.4 | % | 18.2 | ||||||||||||||||||||||||||
| Berry Global Inc. | Manufacturing facilities in the U.S. leased to international producer and supplier of packaging solutions | 8 | 19,920 | 1.4 | % | 13.5 | ||||||||||||||||||||||||||
| Advance Auto Parts, Inc. | Distribution facilities in the U.S. leased to automotive aftermarket parts provider | 28 | 18,980 | 1.4 | % | 7.8 | ||||||||||||||||||||||||||
| Do It Best Corp. (formerly True Value Company, LLC) | Distribution facilities and manufacturing facility in the U.S. leased to global hardware wholesaler | 9 | 18,868 | 1.4 | % | 13.3 | ||||||||||||||||||||||||||
Kesko Senukai (b) |
Distribution facilities and retail properties in Lithuania, Estonia and Latvia leased to European DIY retailer | 20 | 18,316 | 1.3 | % | 6.9 | ||||||||||||||||||||||||||
Pendragon PLC (b) |
Dealerships in the United Kingdom leased to automotive retailer | 47 | 18,046 | 1.3 | % | 13.4 | ||||||||||||||||||||||||||
| Hearthside Food Solutions LLC | Production, packaging and distribution facilities in the U.S. leased to North American contract food manufacturer | 18 | 17,206 | 1.2 | % | 17.3 | ||||||||||||||||||||||||||
Koninklijke Jumbo Food Groep B.V (b) |
Logistics and cold storage warehouse facilities in the Netherlands leased to European supermarket chain | 5 | 15,548 | 1.1 | % | 6.8 | ||||||||||||||||||||||||||
| Dollar General Corporation | Retail properties in the U.S. leased to discount retailer | 110 | 14,836 | 1.1 | % | 14.1 | ||||||||||||||||||||||||||
Danske Fragtmaend Ejendomme A/S (b) |
Distribution facilities in Denmark leased to Danish freight company | 15 | 13,909 | 1.0 | % | 11.9 | ||||||||||||||||||||||||||
| Top 20 Total | 540 | 444,555 | 31.8 | % | 14.1 | |||||||||||||||||||||||||||
| Dick’s Sporting Goods, Inc. | Retail properties and single distribution facility in the U.S. leased to sporting goods retailer | 9 | 13,616 | 1.0 | % | 6.4 | ||||||||||||||||||||||||||
Intergamma Bouwmarkten B.V. (b) |
Retail properties in the Netherlands leased to European DIY retailer | 36 | 13,297 | 1.0 | % | 8.3 | ||||||||||||||||||||||||||
| Lineage | Cold storage warehouse facilities in the Los Angeles and San Francisco areas leased to publicly traded cold storage REIT | 4 | 11,862 | 0.8 | % | 5.7 | ||||||||||||||||||||||||||
| Henkel AG & Co. KGaA | Distribution facility in Kentucky leased to global provider of consumer products and adhesives | 1 | 11,624 | 0.8 | % | 17.1 | ||||||||||||||||||||||||||
| Orgill, Inc. | Distribution facilities in the U.S. leased to global hardware distributor | 4 | 10,987 | 0.8 | % | 17.2 | ||||||||||||||||||||||||||
Top 25 Total (e) |
594 | $ | 505,941 | 36.2 | % | 13.7 | ||||||||||||||||||||||||||
|
Investing for the Long Run® | 21 |
|||||||
| Diversification by Property Type | |||||
| Total Net-Lease Portfolio | ||||||||||||||||||||||||||
| Property Type | ABR | ABR % | Square Footage (a) |
Square Footage % | ||||||||||||||||||||||
| U.S. | ||||||||||||||||||||||||||
| Industrial | $ | 358,431 | 25.6 | % | 56,827 | 32.2 | % | |||||||||||||||||||
| Warehouse | 225,199 | 16.1 | % | 43,374 | 24.5 | % | ||||||||||||||||||||
Retail (b) |
109,319 | 7.8 | % | 5,056 | 2.9 | % | ||||||||||||||||||||
Other (c) |
162,682 | 11.6 | % | 9,223 | 5.2 | % | ||||||||||||||||||||
| U.S. Total | 855,631 | 61.1 | % | 114,480 | 64.8 | % | ||||||||||||||||||||
| International | ||||||||||||||||||||||||||
| Industrial | 153,631 | 11.0 | % | 20,587 | 11.6 | % | ||||||||||||||||||||
| Warehouse | 145,321 | 10.4 | % | 22,211 | 12.6 | % | ||||||||||||||||||||
Retail (b) |
205,086 | 14.7 | % | 17,331 | 9.8 | % | ||||||||||||||||||||
Other (c) |
39,614 | 2.8 | % | 2,130 | 1.2 | % | ||||||||||||||||||||
| International Total | 543,652 | 38.9 | % | 62,259 | 35.2 | % | ||||||||||||||||||||
| Total | ||||||||||||||||||||||||||
| Industrial | 512,062 | 36.6 | % | 77,414 | 43.8 | % | ||||||||||||||||||||
| Warehouse | 370,520 | 26.5 | % | 65,585 | 37.1 | % | ||||||||||||||||||||
Retail (b) |
314,405 | 22.5 | % | 22,387 | 12.7 | % | ||||||||||||||||||||
Other (c) |
202,296 | 14.4 | % | 11,353 | 6.4 | % | ||||||||||||||||||||
Total (d) |
$ | 1,399,283 | 100.0 | % | 176,739 | 100.0 | % | |||||||||||||||||||
|
Investing for the Long Run® | 22 |
|||||||
| Diversification by Tenant Industry | |||||
| Total Net-Lease Portfolio | ||||||||||||||||||||||||||
Industry Type (a) |
ABR | ABR % | Square Footage | Square Footage % | ||||||||||||||||||||||
| Food Retail | $ | 139,931 | 10.0 | % | 11,744 | 6.7 | % | |||||||||||||||||||
| Packaged Foods & Meats | 113,745 | 8.1 | % | 14,962 | 8.5 | % | ||||||||||||||||||||
| Home Improvement Retail | 99,412 | 7.1 | % | 13,021 | 7.4 | % | ||||||||||||||||||||
| Auto Parts & Equipment | 78,286 | 5.6 | % | 11,941 | 6.8 | % | ||||||||||||||||||||
| Automotive Retail | 74,617 | 5.3 | % | 7,038 | 4.0 | % | ||||||||||||||||||||
| Education Services | 59,066 | 4.2 | % | 2,778 | 1.6 | % | ||||||||||||||||||||
| Pharmaceuticals | 46,863 | 3.3 | % | 3,076 | 1.7 | % | ||||||||||||||||||||
| Air Freight & Logistics | 42,850 | 3.1 | % | 7,075 | 4.0 | % | ||||||||||||||||||||
| Trading Companies & Distributors | 42,526 | 3.0 | % | 9,780 | 5.5 | % | ||||||||||||||||||||
| Self-Storage REITs | 37,640 | 2.7 | % | 2,824 | 1.6 | % | ||||||||||||||||||||
| Diversified Support Services | 35,475 | 2.5 | % | 3,266 | 1.9 | % | ||||||||||||||||||||
| Building Products | 35,011 | 2.5 | % | 7,643 | 4.3 | % | ||||||||||||||||||||
| Other Specialty Retail | 31,710 | 2.3 | % | 3,936 | 2.2 | % | ||||||||||||||||||||
| Industrial Machinery | 31,181 | 2.2 | % | 5,045 | 2.9 | % | ||||||||||||||||||||
| Metal & Glass Containers | 30,208 | 2.2 | % | 4,301 | 2.4 | % | ||||||||||||||||||||
| Construction Materials | 23,123 | 1.7 | % | 3,781 | 2.1 | % | ||||||||||||||||||||
| Paper Products | 23,100 | 1.7 | % | 4,458 | 2.5 | % | ||||||||||||||||||||
| Construction Machinery | 18,405 | 1.3 | % | 2,528 | 1.4 | % | ||||||||||||||||||||
| Leisure Facilities | 17,583 | 1.3 | % | 645 | 0.4 | % | ||||||||||||||||||||
| Diversified Metals | 16,992 | 1.2 | % | 3,622 | 2.1 | % | ||||||||||||||||||||
| Consumer Staples Merchandise Retail | 16,924 | 1.2 | % | 1,456 | 0.8 | % | ||||||||||||||||||||
| Specialized Consumer Services | 16,305 | 1.2 | % | 571 | 0.3 | % | ||||||||||||||||||||
| Commodity Chemicals | 16,133 | 1.2 | % | 2,493 | 1.4 | % | ||||||||||||||||||||
| Specialty Chemicals | 15,773 | 1.1 | % | 2,725 | 1.5 | % | ||||||||||||||||||||
| Hotels & Resorts | 15,473 | 1.1 | % | 1,073 | 0.6 | % | ||||||||||||||||||||
Other (62 industries, each <1% ABR) (b) |
320,951 | 22.9 | % | 44,957 | 25.4 | % | ||||||||||||||||||||
Total (c) |
$ | 1,399,283 | 100.0 | % | 176,739 | 100.0 | % | |||||||||||||||||||
|
Investing for the Long Run® | 23 |
|||||||
| Diversification by Geography | |||||
| Total Net-Lease Portfolio | ||||||||||||||||||||||||||
| Region | ABR | ABR % | Square Footage (a) |
Square Footage % | ||||||||||||||||||||||
| U.S. | ||||||||||||||||||||||||||
| Midwest | ||||||||||||||||||||||||||
| Illinois | $ | 62,855 | 4.5 | % | 9,945 | 5.6 | % | |||||||||||||||||||
| Ohio | 42,707 | 3.0 | % | 8,396 | 4.8 | % | ||||||||||||||||||||
| Indiana | 39,507 | 2.8 | % | 6,162 | 3.5 | % | ||||||||||||||||||||
| Michigan | 28,024 | 2.0 | % | 4,600 | 2.6 | % | ||||||||||||||||||||
| Wisconsin | 19,568 | 1.4 | % | 3,340 | 1.9 | % | ||||||||||||||||||||
Other (b) |
51,326 | 3.7 | % | 7,227 | 4.1 | % | ||||||||||||||||||||
| Total Midwest | 243,987 | 17.4 | % | 39,670 | 22.5 | % | ||||||||||||||||||||
| South | ||||||||||||||||||||||||||
| Texas | 85,530 | 6.1 | % | 10,780 | 6.1 | % | ||||||||||||||||||||
| Florida | 39,702 | 2.8 | % | 3,426 | 1.9 | % | ||||||||||||||||||||
| Georgia | 25,279 | 1.8 | % | 4,378 | 2.5 | % | ||||||||||||||||||||
| Tennessee | 24,602 | 1.8 | % | 4,004 | 2.3 | % | ||||||||||||||||||||
| Alabama | 23,966 | 1.7 | % | 3,504 | 2.0 | % | ||||||||||||||||||||
Other (b) |
26,374 | 1.9 | % | 3,025 | 1.7 | % | ||||||||||||||||||||
| Total South | 225,453 | 16.1 | % | 29,117 | 16.5 | % | ||||||||||||||||||||
| East | ||||||||||||||||||||||||||
| North Carolina | 42,775 | 3.0 | % | 8,858 | 5.0 | % | ||||||||||||||||||||
| Pennsylvania | 32,412 | 2.3 | % | 3,416 | 1.9 | % | ||||||||||||||||||||
| Kentucky | 29,225 | 2.1 | % | 4,485 | 2.5 | % | ||||||||||||||||||||
| New York | 22,555 | 1.6 | % | 2,284 | 1.3 | % | ||||||||||||||||||||
| South Carolina | 19,694 | 1.4 | % | 4,485 | 2.5 | % | ||||||||||||||||||||
| New Jersey | 19,053 | 1.4 | % | 955 | 0.6 | % | ||||||||||||||||||||
| Massachusetts | 16,623 | 1.2 | % | 1,188 | 0.7 | % | ||||||||||||||||||||
Other (b) |
34,782 | 2.5 | % | 5,287 | 3.0 | % | ||||||||||||||||||||
| Total East | 217,119 | 15.5 | % | 30,958 | 17.5 | % | ||||||||||||||||||||
| West | ||||||||||||||||||||||||||
| California | 63,109 | 4.5 | % | 5,137 | 2.9 | % | ||||||||||||||||||||
| Arizona | 22,114 | 1.6 | % | 2,372 | 1.3 | % | ||||||||||||||||||||
| Nevada | 17,578 | 1.3 | % | 485 | 0.3 | % | ||||||||||||||||||||
| Utah | 14,700 | 1.0 | % | 2,021 | 1.1 | % | ||||||||||||||||||||
Other (b) |
51,571 | 3.7 | % | 4,720 | 2.7 | % | ||||||||||||||||||||
| Total West | 169,072 | 12.1 | % | 14,735 | 8.3 | % | ||||||||||||||||||||
| U.S. Total | 855,631 | 61.1 | % | 114,480 | 64.8 | % | ||||||||||||||||||||
| International | ||||||||||||||||||||||||||
| The Netherlands | 62,349 | 4.5 | % | 6,917 | 3.9 | % | ||||||||||||||||||||
| Poland | 60,778 | 4.3 | % | 8,460 | 4.8 | % | ||||||||||||||||||||
| Italy | 59,871 | 4.3 | % | 8,183 | 4.6 | % | ||||||||||||||||||||
Canada (c) |
54,144 | 3.9 | % | 5,449 | 3.1 | % | ||||||||||||||||||||
| Germany | 50,872 | 3.6 | % | 5,795 | 3.3 | % | ||||||||||||||||||||
| United Kingdom | 50,768 | 3.6 | % | 4,412 | 2.5 | % | ||||||||||||||||||||
| Spain | 36,375 | 2.6 | % | 3,073 | 1.7 | % | ||||||||||||||||||||
| Croatia | 26,992 | 1.9 | % | 2,063 | 1.2 | % | ||||||||||||||||||||
| Denmark | 25,433 | 1.8 | % | 3,002 | 1.7 | % | ||||||||||||||||||||
| France | 23,043 | 1.7 | % | 1,679 | 1.0 | % | ||||||||||||||||||||
Mexico (d) |
21,716 | 1.6 | % | 3,604 | 2.0 | % | ||||||||||||||||||||
Other (e) |
71,311 | 5.1 | % | 9,622 | 5.4 | % | ||||||||||||||||||||
| International Total | 543,652 | 38.9 | % | 62,259 | 35.2 | % | ||||||||||||||||||||
Total (f) |
$ | 1,399,283 | 100.0 | % | 176,739 | 100.0 | % | |||||||||||||||||||
|
Investing for the Long Run® | 24 |
|||||||
| Contractual Rent Increases | |||||
| Total Net-Lease Portfolio | ||||||||||||||||||||||||||
| Rent Adjustment Measure | ABR | ABR % | Square Footage | Square Footage % | ||||||||||||||||||||||
| Uncapped CPI | $ | 432,914 | 30.9 | % | 43,414 | 24.5 | % | |||||||||||||||||||
| Capped CPI | 264,271 | 18.9 | % | 38,342 | 21.7 | % | ||||||||||||||||||||
| CPI-linked | 697,185 | 49.8 | % | 81,756 | 46.2 | % | ||||||||||||||||||||
| Fixed | 650,719 | 46.5 | % | 88,496 | 50.1 | % | ||||||||||||||||||||
Other (a) |
45,350 | 3.3 | % | 3,252 | 1.8 | % | ||||||||||||||||||||
| None | 6,029 | 0.4 | % | 298 | 0.2 | % | ||||||||||||||||||||
| Vacant | — | — | % | 2,937 | 1.7 | % | ||||||||||||||||||||
Total (b) |
$ | 1,399,283 | 100.0 | % | 176,739 | 100.0 | % | |||||||||||||||||||
|
Investing for the Long Run® | 25 |
|||||||
| Same-Store Analysis | |||||
| ABR | |||||||||||||||||||||||
| As of | |||||||||||||||||||||||
| Mar. 31, 2025 | Mar. 31, 2024 | Increase | % Increase | ||||||||||||||||||||
| Property Type | |||||||||||||||||||||||
| Industrial | $ | 431,521 | $ | 420,510 | $ | 11,011 | 2.6 | % | |||||||||||||||
| Warehouse | 335,566 | 328,906 | 6,660 | 2.0 | % | ||||||||||||||||||
Retail (a) |
270,602 | 264,352 | 6,250 | 2.4 | % | ||||||||||||||||||
Other (b) |
145,744 | 141,774 | 3,970 | 2.8 | % | ||||||||||||||||||
| Total | $ | 1,183,433 | $ | 1,155,542 | $ | 27,891 | 2.4 | % | |||||||||||||||
| Rent Adjustment Measure | |||||||||||||||||||||||
| Uncapped CPI | $ | 405,319 | $ | 393,478 | $ | 11,841 | 3.0 | % | |||||||||||||||
| Capped CPI | 251,519 | 246,225 | 5,294 | 2.2 | % | ||||||||||||||||||
| CPI-linked | 656,838 | 639,703 | 17,135 | 2.7 | % | ||||||||||||||||||
| Fixed | 514,617 | 503,861 | 10,756 | 2.1 | % | ||||||||||||||||||
Other (c) |
7,545 | 7,545 | — | — | % | ||||||||||||||||||
| None | 4,433 | 4,433 | — | — | % | ||||||||||||||||||
| Total | $ | 1,183,433 | $ | 1,155,542 | $ | 27,891 | 2.4 | % | |||||||||||||||
| Geography | |||||||||||||||||||||||
| U.S. | $ | 675,809 | $ | 660,421 | $ | 15,388 | 2.3 | % | |||||||||||||||
| Europe | 435,188 | 424,668 | 10,520 | 2.5 | % | ||||||||||||||||||
Other International (d) |
72,436 | 70,453 | 1,983 | 2.8 | % | ||||||||||||||||||
| Total | $ | 1,183,433 | $ | 1,155,542 | $ | 27,891 | 2.4 | % | |||||||||||||||
| Same-Store Portfolio Summary | |||||||||||||||||||||||
| Number of properties | 1,141 | ||||||||||||||||||||||
| Square footage (in thousands) | 149,880 | ||||||||||||||||||||||
|
Investing for the Long Run® | 26 |
|||||||
| Same-Store Pro Rata Rental Income | |||||||||||||||||||||||
| Three Months Ended | |||||||||||||||||||||||
| Mar. 31, 2025 | Mar. 31, 2024 | Increase | % Increase | ||||||||||||||||||||
| Property Type | |||||||||||||||||||||||
| Industrial | $ | 109,400 | $ | 105,832 | $ | 3,568 | 3.4 | % | |||||||||||||||
| Warehouse | 86,033 | 84,545 | 1,488 | 1.8 | % | ||||||||||||||||||
Retail (a) |
68,549 | 61,514 | 7,035 | 11.4 | % | ||||||||||||||||||
Other (b) |
41,756 | 40,653 | 1,103 | 2.7 | % | ||||||||||||||||||
| Total | $ | 305,738 | $ | 292,544 | $ | 13,194 | 4.5 | % | |||||||||||||||
| Rent Adjustment Measure | |||||||||||||||||||||||
| Uncapped CPI | $ | 103,677 | $ | 95,359 | $ | 8,318 | 8.7 | % | |||||||||||||||
| Capped CPI | 58,309 | 57,134 | 1,175 | 2.1 | % | ||||||||||||||||||
| CPI-linked | 161,986 | 152,493 | 9,493 | 6.2 | % | ||||||||||||||||||
| Fixed | 134,010 | 130,915 | 3,095 | 2.4 | % | ||||||||||||||||||
Other (c) |
8,304 | 7,766 | 538 | 6.9 | % | ||||||||||||||||||
| None | 1,438 | 1,370 | 68 | 5.0 | % | ||||||||||||||||||
| Total | $ | 305,738 | $ | 292,544 | $ | 13,194 | 4.5 | % | |||||||||||||||
| Geography | |||||||||||||||||||||||
| U.S. | $ | 184,737 | $ | 178,774 | $ | 5,963 | 3.3 | % | |||||||||||||||
| Europe | 103,065 | 96,280 | 6,785 | 7.0 | % | ||||||||||||||||||
Other International (d) |
17,936 | 17,490 | 446 | 2.6 | % | ||||||||||||||||||
| Total | $ | 305,738 | $ | 292,544 | $ | 13,194 | 4.5 | % | |||||||||||||||
| Same-Store Portfolio Summary | |||||||||||||||||||||||
| Number of properties | 1,208 | ||||||||||||||||||||||
| Square footage (in thousands) | 159,009 | ||||||||||||||||||||||
|
Investing for the Long Run® | 27 |
|||||||
| Three Months Ended | |||||||||||
| Mar. 31, 2025 | Mar. 31, 2024 | ||||||||||
| Consolidated Lease Revenues | |||||||||||
| Total lease revenues – as reported | $ | 353,768 | $ | 322,251 | |||||||
| Income from finance leases and loans receivable | 17,458 | 25,793 | |||||||||
| Less: Reimbursable tenant costs – as reported | (17,092) | (12,973) | |||||||||
| Less: Income from secured loans receivable | (607) | (1,965) | |||||||||
| 353,527 | 333,106 | ||||||||||
| Adjustments for Pro Rata Ownership of Real Estate Joint Ventures: | |||||||||||
| Add: Pro rata share of adjustments from equity method investments | 4,236 | 2,952 | |||||||||
| Less: Pro rata share of adjustments for noncontrolling interests | (188) | (184) | |||||||||
| 4,048 | 2,768 | ||||||||||
| Adjustments for Pro Rata Non-Cash Items: | |||||||||||
| Less: Straight-line and other leasing and financing adjustments | (19,033) | (19,553) | |||||||||
| Add: Above- and below-market rent intangible lease amortization | 1,123 | 4,068 | |||||||||
| Less: Adjustments for pro rata ownership | (50) | (434) | |||||||||
| (17,960) | (15,919) | ||||||||||
Adjustment to normalize for (i) properties not continuously owned since January 1, 2024 and (ii) constant currency presentation for prior year quarter (e) |
(33,877) | (27,411) | |||||||||
| Same-Store Pro Rata Rental Income | $ | 305,738 | $ | 292,544 | |||||||
|
Investing for the Long Run® | 28 |
|||||||
| Leasing Activity | |||||
Lease Renewals and Extensions (a) |
Property and Tenant Improvements (c) |
Leasing Commissions | ||||||||||||||||||||||||||||||||||||||||||||||||
| ABR | ||||||||||||||||||||||||||||||||||||||||||||||||||
| Property Type | Square Feet | Number of Leases | Prior Lease | New Lease (b) |
Rent Recapture | Incremental Lease Term | ||||||||||||||||||||||||||||||||||||||||||||
| Industrial | 755,354 | 3 | $ | 2,660 | $ | 3,300 | 124.1 | % | $ | 2,300 | $ | — | 10.1 years | |||||||||||||||||||||||||||||||||||||
| Warehouse | 2,462,080 | 7 | 15,161 | 15,513 | 102.3 | % | 1,500 | 299 | 5.6 years | |||||||||||||||||||||||||||||||||||||||||
| Retail | 732,939 | 6 | 7,241 | 7,104 | 98.1 | % | — | — | 5.7 years | |||||||||||||||||||||||||||||||||||||||||
| Other | — | — | — | — | — | % | — | — | N/A | |||||||||||||||||||||||||||||||||||||||||
| Total / Weighted Average | 3,950,373 | 16 | $ | 25,062 | $ | 25,917 | 103.4 | % | $ | 3,800 | $ | 299 | 6.2 years | |||||||||||||||||||||||||||||||||||||
| Q1 Summary | ||||||||||||||||||||||||||||||||||||||||||||||||||
Prior Lease ABR (% of Total Portfolio) |
1.8 | % | ||||||||||||||||||||||||||||||||||||||||||||||||
| New Leases | Property and Tenant Improvements (c) |
Leasing Commissions | ||||||||||||||||||||||||||||||||||||
| ABR | ||||||||||||||||||||||||||||||||||||||
| Property Type | Square Feet | Number of Leases | New Lease (b) |
New Lease Term | ||||||||||||||||||||||||||||||||||
| Industrial | — | — | $ | — | $ | — | $ | — | N/A | |||||||||||||||||||||||||||||
| Warehouse | — | — | — | — | — | N/A | ||||||||||||||||||||||||||||||||
| Retail | 6,365 | 1 | 81 | — | — | 7.0 years | ||||||||||||||||||||||||||||||||
| Other | — | — | — | — | — | N/A | ||||||||||||||||||||||||||||||||
Total / Weighted Average (d) |
6,365 | 1 | $ | 81 | $ | — | $ | — | 7.0 years | |||||||||||||||||||||||||||||
|
Investing for the Long Run® | 29 |
|||||||
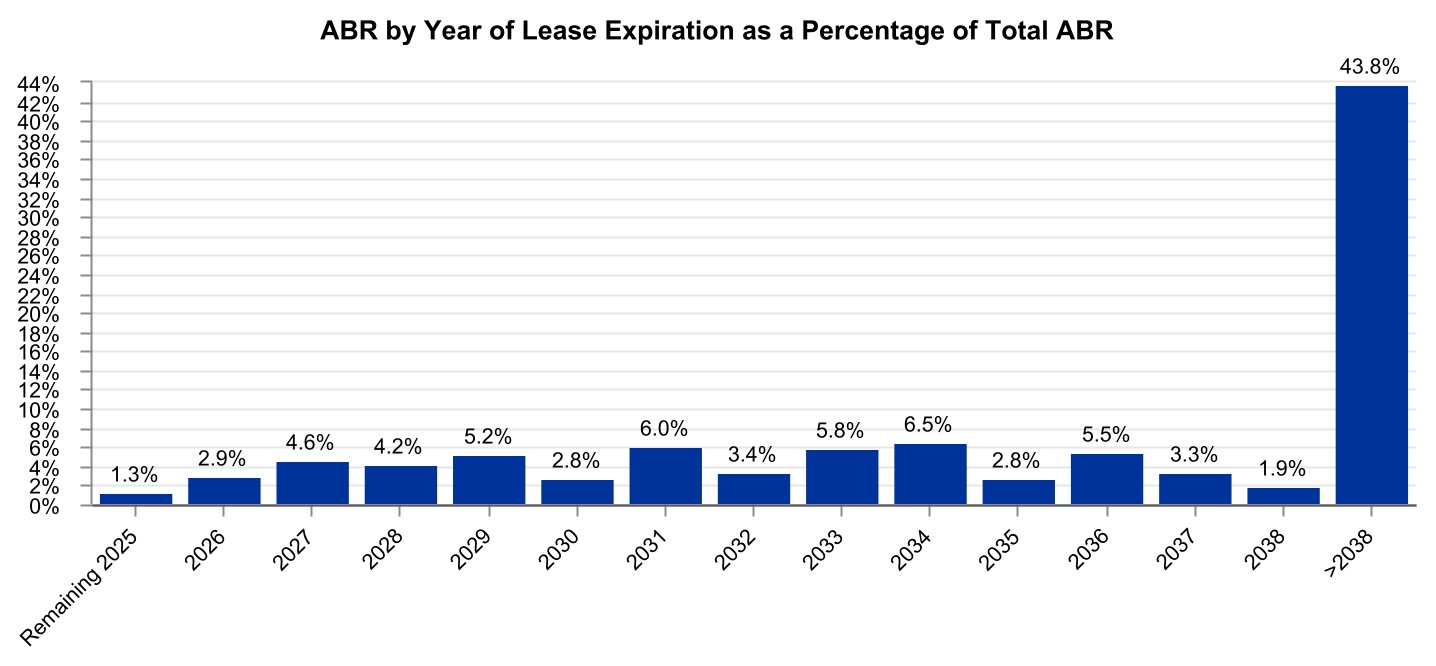
| Lease Expirations | |||||
Year of Lease Expiration (a) |
Number of Leases Expiring | Number of Tenants with Leases Expiring | ABR | ABR % | Square Footage | Square Footage % | ||||||||||||||||||||||||||||||||
| Remaining 2025 | 14 | 12 | $ | 17,456 | 1.3 | % | 2,458 | 1.4 | % | |||||||||||||||||||||||||||||
| 2026 | 25 | 24 | 40,847 | 2.9 | % | 5,959 | 3.4 | % | ||||||||||||||||||||||||||||||
| 2027 | 45 | 28 | 63,900 | 4.6 | % | 7,236 | 4.1 | % | ||||||||||||||||||||||||||||||
| 2028 | 44 | 27 | 59,162 | 4.2 | % | 5,340 | 3.0 | % | ||||||||||||||||||||||||||||||
| 2029 | 59 | 32 | 73,378 | 5.2 | % | 8,484 | 4.8 | % | ||||||||||||||||||||||||||||||
| 2030 | 35 | 30 | 38,875 | 2.8 | % | 3,874 | 2.2 | % | ||||||||||||||||||||||||||||||
| 2031 | 44 | 25 | 83,715 | 6.0 | % | 10,112 | 5.7 | % | ||||||||||||||||||||||||||||||
| 2032 | 45 | 24 | 47,809 | 3.4 | % | 6,080 | 3.4 | % | ||||||||||||||||||||||||||||||
| 2033 | 32 | 25 | 81,215 | 5.8 | % | 11,790 | 6.7 | % | ||||||||||||||||||||||||||||||
| 2034 | 59 | 27 | 90,878 | 6.5 | % | 9,464 | 5.3 | % | ||||||||||||||||||||||||||||||
| 2035 | 22 | 18 | 39,787 | 2.8 | % | 7,045 | 4.0 | % | ||||||||||||||||||||||||||||||
| 2036 | 45 | 20 | 76,370 | 5.5 | % | 10,865 | 6.1 | % | ||||||||||||||||||||||||||||||
| 2037 | 41 | 18 | 45,625 | 3.3 | % | 6,826 | 3.9 | % | ||||||||||||||||||||||||||||||
| 2038 | 47 | 14 | 26,883 | 1.9 | % | 2,806 | 1.6 | % | ||||||||||||||||||||||||||||||
| Thereafter (>2038) | 351 | 122 | 613,383 | 43.8 | % | 75,463 | 42.7 | % | ||||||||||||||||||||||||||||||
| Vacant | — | — | — | — | % | 2,937 | 1.7 | % | ||||||||||||||||||||||||||||||
Total (b) |
908 | $ | 1,399,283 | 100.0 | % | 176,739 | 100.0 | % | ||||||||||||||||||||||||||||||
|
Investing for the Long Run® | 30 |
|||||||
| Self-Storage Operating Properties Portfolio | |||||
State / District |
Number of Properties | Number of Units | Square Footage | Square Footage % | Period End Occupancy | |||||||||||||||||||||||||||
| Florida | 20 | 14,750 | 1,594 | 28.0 | % | 89.3 | % | |||||||||||||||||||||||||
| Texas | 14 | 8,000 | 995 | 17.4 | % | 84.4 | % | |||||||||||||||||||||||||
| Illinois | 10 | 4,822 | 666 | 11.7 | % | 89.9 | % | |||||||||||||||||||||||||
| California | 8 | 5,440 | 677 | 11.9 | % | 94.5 | % | |||||||||||||||||||||||||
| Georgia | 5 | 2,060 | 250 | 4.4 | % | 87.9 | % | |||||||||||||||||||||||||
| Nevada | 3 | 2,423 | 243 | 4.3 | % | 86.1 | % | |||||||||||||||||||||||||
| Delaware | 3 | 1,678 | 241 | 4.2 | % | 92.8 | % | |||||||||||||||||||||||||
| Hawaii | 2 | 956 | 95 | 1.7 | % | 93.2 | % | |||||||||||||||||||||||||
| Tennessee | 2 | 886 | 122 | 2.1 | % | 91.2 | % | |||||||||||||||||||||||||
| North Carolina | 1 | 947 | 121 | 2.1 | % | 93.5 | % | |||||||||||||||||||||||||
| Washington, DC | 1 | 880 | 67 | 1.2 | % | 93.3 | % | |||||||||||||||||||||||||
| Arkansas | 1 | 843 | 115 | 2.0 | % | 67.3 | % | |||||||||||||||||||||||||
| New York | 1 | 793 | 61 | 1.1 | % | 76.7 | % | |||||||||||||||||||||||||
| Kentucky | 1 | 762 | 121 | 2.1 | % | 94.6 | % | |||||||||||||||||||||||||
| Ohio | 1 | 598 | 73 | 1.3 | % | 88.2 | % | |||||||||||||||||||||||||
| Louisiana | 1 | 541 | 59 | 1.0 | % | 89.1 | % | |||||||||||||||||||||||||
| South Carolina | 1 | 490 | 63 | 1.1 | % | 95.4 | % | |||||||||||||||||||||||||
| Massachusetts | 1 | 482 | 58 | 1.0 | % | 90.9 | % | |||||||||||||||||||||||||
| Oregon | 1 | 442 | 40 | 0.7 | % | 95.2 | % | |||||||||||||||||||||||||
| Missouri | 1 | 329 | 41 | 0.7 | % | 95.4 | % | |||||||||||||||||||||||||
Total (a) |
78 | 48,122 | 5,702 | 100.0 | % | 89.0 | % | |||||||||||||||||||||||||
|
Investing for the Long Run® | 31 |
|||||||
|
Investing for the Long Run® | 32 |
|||||||
| Normalized Pro Rata Cash NOI | |||||
| Three Months Ended Mar. 31, 2025 | |||||
| Consolidated Lease Revenues | |||||
| Total lease revenues – as reported | $ | 353,768 | |||
| Income from finance leases and loans receivable – as reported | 17,458 | ||||
| Less: Income from secured loans receivable | (607) | ||||
| Less: Consolidated Reimbursable and Non-Reimbursable Property Expenses | |||||
| Reimbursable property expenses – as reported | 17,092 | ||||
| Non-reimbursable property expenses – as reported | 11,706 | ||||
| 341,821 | |||||
| Plus: NOI from Operating Properties | |||||
| Self-storage revenues | 21,689 | ||||
| Self-storage expenses | (8,110) | ||||
| 13,579 | |||||
| Hotel revenues | 8,181 | ||||
| Hotel expenses | (6,997) | ||||
| 1,184 | |||||
| Student housing and other revenues | 3,224 | ||||
| Student housing and other expenses | (1,407) | ||||
| 1,817 | |||||
| 358,401 | |||||
| Adjustments for Pro Rata Ownership of Real Estate Joint Ventures: | |||||
| Add: Pro rata share of NOI from equity method investments | 4,122 | ||||
| Less: Pro rata share of NOI attributable to noncontrolling interests | (184) | ||||
| 3,938 | |||||
| 362,339 | |||||
| Adjustments for Pro Rata Non-Cash Items: | |||||
| Less: Straight-line and other leasing and financing adjustments | (19,033) | ||||
| Add: Above- and below-market rent intangible lease amortization | 1,123 | ||||
| Add: Other non-cash items | 511 | ||||
| (17,399) | |||||
Pro Rata Cash NOI (a) |
344,940 | ||||
Adjustment to normalize for investments and dispositions (b) |
7,132 | ||||
Normalized Pro Rata Cash NOI (a) |
$ | 352,072 | |||
|
Investing for the Long Run® | 33 |
|||||||
| Three Months Ended Mar. 31, 2025 | |||||
| Net Income Attributable to W. P. Carey | |||||
| Net income attributable to W. P. Carey – as reported | $ | 125,824 | |||
| Adjustments for Consolidated Operating Expenses | |||||
| Add: Operating expenses – as reported | 218,474 | ||||
| Less: Operating property expenses – as reported | (16,544) | ||||
| Less: Property expenses, excluding reimbursable tenant costs – as reported | (11,706) | ||||
| 190,224 | |||||
| Adjustments for Other Consolidated Revenues and Expenses: | |||||
| Add: Other income and (expenses) – as reported | 53,936 | ||||
| Less: Reimbursable property expenses – as reported | (17,092) | ||||
| Add: Provision for income taxes – as reported | 11,632 | ||||
| Less: Other lease-related income – as reported | (3,121) | ||||
| Less: Asset management fees revenue – as reported | (1,350) | ||||
| Less: Other advisory income and reimbursements – as reported | (1,067) | ||||
| 42,938 | |||||
| Other Adjustments: | |||||
| Less: Straight-line and other leasing and financing adjustments | (19,033) | ||||
Adjustment to normalize for investments and dispositions (b) |
7,132 | ||||
| Add: Adjustments for pro rata ownership | 3,955 | ||||
| Add: Above- and below-market rent intangible lease amortization | 1,123 | ||||
| Less: Income from secured loans receivable | (607) | ||||
| Add: Property expenses, excluding reimbursable tenant costs, non-cash | 516 | ||||
| (6,914) | |||||
Normalized Pro Rata Cash NOI (a) |
$ | 352,072 | |||
|
Investing for the Long Run® | 34 |
|||||||
| Adjusted EBITDA – Last Five Quarters | |||||
| Three Months Ended | |||||||||||||||||||||||||||||
| Mar. 31, 2025 | Dec. 31, 2024 | Sep. 30, 2024 | Jun. 30, 2024 | Mar. 31, 2024 | |||||||||||||||||||||||||
| Net income | $ | 125,816 | $ | 47,038 | $ | 111,652 | $ | 142,854 | $ | 159,086 | |||||||||||||||||||
Adjustments to Derive Adjusted EBITDA (a) |
|||||||||||||||||||||||||||||
| Depreciation and amortization | 129,607 | 115,770 | 115,705 | 137,481 | 118,768 | ||||||||||||||||||||||||
| Interest expense | 68,804 | 70,883 | 72,526 | 65,307 | 68,651 | ||||||||||||||||||||||||
| Gain on sale of real estate, net | (43,777) | (4,480) | (15,534) | (39,363) | (15,445) | ||||||||||||||||||||||||
Other (gains) and losses (b) |
42,197 | 77,224 | 77,107 | (2,504) | (13,839) | ||||||||||||||||||||||||
Straight-line and other leasing and financing adjustments (c) |
(19,033) | (24,849) | (21,187) | (15,310) | (19,553) | ||||||||||||||||||||||||
| Provision for income taxes | 11,632 | 7,772 | 9,044 | 6,219 | 8,674 | ||||||||||||||||||||||||
| Stock-based compensation expense | 9,148 | 9,667 | 13,468 | 8,903 | 8,856 | ||||||||||||||||||||||||
| Impairment charges — real estate | 6,854 | 27,843 | — | 15,752 | — | ||||||||||||||||||||||||
| Above- and below-market rent intangible lease amortization | 1,123 | 10,047 | 6,263 | 5,766 | 4,068 | ||||||||||||||||||||||||
Merger and other expenses (d) |
556 | (484) | 283 | 206 | 4,452 | ||||||||||||||||||||||||
| Other amortization and non-cash charges | 442 | 436 | 459 | 454 | 448 | ||||||||||||||||||||||||
Gain on change in control of interests (e) |
— | — | (31,849) | — | — | ||||||||||||||||||||||||
| 207,553 | 289,829 | 226,285 | 182,911 | 165,080 | |||||||||||||||||||||||||
| Adjustments for Pro Rata Ownership | |||||||||||||||||||||||||||||
| Real Estate Joint Ventures: | |||||||||||||||||||||||||||||
| Add: Pro rata share of adjustments for equity method investments | 2,309 | 5,975 | 1,312 | 1,242 | 2,814 | ||||||||||||||||||||||||
| Less: Pro rata share of adjustments for amounts attributable to noncontrolling interests | (179) | (214) | (213) | (234) | (154) | ||||||||||||||||||||||||
| 2,130 | 5,761 | 1,099 | 1,008 | 2,660 | |||||||||||||||||||||||||
Adjusted EBITDA (f) |
$ | 335,499 | $ | 342,628 | $ | 339,036 | $ | 326,773 | $ | 326,826 | |||||||||||||||||||
|
Investing for the Long Run® | 35 |
|||||||
| Disclosures Regarding Non-GAAP and Other Metrics | |||||
|
Investing for the Long Run® | 36 |
|||||||
|
Investing for the Long Run® | 37 |
|||||||


