UNITED STATES
SECURITIES AND EXCHANGE COMMISSION
WASHINGTON, D.C. 20549
FORM 8-K
CURRENT REPORT
Pursuant to Section 13 or 15(d) of the Securities Exchange Act of 1934
Date of Report (Date of earliest event reported): March 19, 2025 |
FrontView REIT, Inc.
(Exact name of Registrant as Specified in Its Charter)
Maryland |
001-42301 |
93-2133671 |
||
(State or Other Jurisdiction |
(Commission File Number) |
(IRS Employer |
||
|
|
|
|
|
|
3131 McKinney Avenue Suite L10 |
|
|||
Dallas, Texas |
|
75204 |
||
(Address of Principal Executive Offices) |
|
(Zip Code) |
||
Registrant’s Telephone Number, Including Area Code: 214 796-2445 |
|
(Former Name or Former Address, if Changed Since Last Report)
Check the appropriate box below if the Form 8-K filing is intended to simultaneously satisfy the filing obligation of the registrant under any of the following provisions:
Securities registered pursuant to Section 12(b) of the Act:
|
|
Trading |
|
|
Common stock $0.01 par value per share |
|
FVR |
|
New York Stock Exchange |
Indicate by check mark whether the registrant is an emerging growth company as defined in Rule 405 of the Securities Act of 1933 (§ 230.405 of this chapter) or Rule 12b-2 of the Securities Exchange Act of 1934 (§ 240.12b-2 of this chapter).
Emerging growth company ☒
If an emerging growth company, indicate by check mark if the registrant has elected not to use the extended transition period for complying with any new or revised financial accounting standards provided pursuant to Section 13(a) of the Exchange Act. ☐
Item 2.02 Results of Operations and Financial Condition.
On March 19, 2025, FrontView REIT, Inc. (the “Company”) issued a press release announcing its financial results for the quarter and year ended December 31, 2024. A copy of the press release is attached hereto as Exhibit 99.1 and is incorporated herein by reference. The press release is also available on the Company’s website.
Item 7.01 – Regulation FD Disclosure
On March 19, 2025, the Company made available on its website an updated presentation containing quarterly supplemental information pertaining to its operations and financial results for the quarter and year ended December 31, 2024. A copy of the quarterly supplemental information is attached hereto as Exhibit 99.2 and is incorporated herein by reference.
The information contained in Item 2.02 and 7.01 hereof, including the information contained in Exhibit 99.1 and quarterly supplemental information attached as Exhibit 99.2, are being “furnished” and shall not be deemed to be “filed” for purposes of Section 18 of the Securities Exchange Act of 1934, as amended (the “Exchange Act”), or otherwise subject to the liabilities of that section, nor shall such information be deemed to be incorporated by reference in any filing under the Securities Act of 1933, as amended, or the Exchange Act, except as shall be expressly set forth by specific reference in such filing. References to the Company’s website in this Current Report on Form 8-K and in the attached Exhibit 99.1 and Exhibit 99.2 do not incorporate by reference the information on such website into this Current Report on Form 8-K and the Company disclaims any such incorporation by reference.
Item 9.01 Financial Statements and Exhibits.
(d) Exhibits
INDEX TO EXHIBITS
Exhibit No. |
Description |
99.1 |
|
99.2 |
Quarterly Supplemental Information for the Quarter Ended December 31, 2024 |
104 |
Cover Page Interactive Data File - the cover page XBRL tags are embedded within the Inline XBRL document |
SIGNATURES
Pursuant to the requirements of the Securities Exchange Act of 1934, the registrant has duly caused this report to be signed on its behalf by the undersigned hereunto duly authorized.
|
|
|
FrontView REIT, Inc. |
|
|
|
|
Date: |
March 19, 2025 |
By: |
/s/ Timothy Dieffenbacher |
|
|
|
Timothy Dieffenbacher |
EXHIBIT 99.1
For Immediate Release
March 19, 2025
|
FrontView REIT Announces Fourth Quarter and Full Year 2024 Results and Initiates 2025 Guidance
Dallas, TX – FrontView REIT, Inc. (NYSE: FVR) (the “Company”, “FrontView”, “we”, “our”, or “us”), today announced its operating results for the quarter and year ended December 31, 2024.
MANAGEMENT COMMENTARY
Stephen Preston, Co-CEO, Co-President, and Chairman, commented, "We are pleased to report a very successful first quarter as a public company, demonstrating our ability to drive growth by acquiring over $100 million in high-quality assets at above-market cap rates. Our differentiated sourcing strategy and focus on transacting outside of the competitive public peer landscape—where we instead compete with less sophisticated buyers—continue to pay off. Unlike many public peers facing increased competition, we are benefiting from elevated cap rates in our niche market, partially driven by the stickiness of interest rates for players in the space. This dynamic, coupled with our disciplined approach, enabled us to already lock in forecasted Q1 2025 acquisitions at attractive yields. We are initiating 2025 AFFO per share guidance of $1.20 to $1.26 and remain focused on delivering superior risk-adjusted returns for our shareholders.”
FOURTH QUARTER 2024 HIGHLIGHTS
INVESTMENT ACTIVITY |
•
During the fourth quarter, we acquired 29 new properties for $103.4 million at a weighted average cash capitalization rate of 7.9% and a weighted average lease term of 11 years. The acquisitions were spread across 7 industries, 17 tenants, and 16 states, including 12 new tenants and 4 new states
•
Subsequent to quarter end and through the date of this release, we acquired 15 new properties for $37.9 million at a weighted average cash capitalization rate of 7.8% and a weighted average lease term of 12.5 years. The acquisitions were spread across 7 industries, 11 tenants, and 11 states, including 5 new tenants and 2 new states.
•
As of the date of this release, we have an additional $18.2 million of properties under signed PSA that have a weighted average cash capitalization rate of 8.2%. The properties are spread across 4 industries, 4 tenants, and 3 states.
•
During the fourth quarter, we sold 1 property for gross proceeds of $2.1 million at a 6.9% cash capitalization rate, recognizing a $0.05 million gain over our original purchase price.
|
|
OPERATING RESULTS |
•
Generated net loss of $21.5 million, or $0.78 per share.
•
Generated adjusted funds from operations (“AFFO”) of $9.1 million, or $0.33 per share.
•
Generated pro forma adjusted AFFO of $7.4 million, or $0.27 per pro forma share.
•
Incurred $2.9 million of general and administrative expenses, inclusive of $0.6 million of stock-based compensation and $0.1 million of property and asset management fees that were incurred during the first two days of the quarter prior to our initial public offering ("IPO").
•
Portfolio was approximately 98% leased based on number of properties, with seven of our 307 properties vacant and not subject to a lease at quarter end.
|
CAPITAL MARKETS ACTIVITY |
•
As of December 31, 2024, we had total outstanding debt of $268.5 million, Net Debt of $263.4 million, and a Net Debt to Annualized Adjusted EBITDAre ratio of 5.2x.
•
During the quarter, we completed our IPO, selling 14.3 million shares of our common stock for gross proceeds of $271.5 million, prior to underwriting discounts and inclusive of the underwriters' additional purchase of 1.09 million shares.
•
We used the proceeds from our IPO to repay our prior CIBC revolving credit facility and CIBC term loan, and retained $82.3 million of cash to be used for acquisitions and general corporate purposes. We fully invested the proceeds by the end of the quarter.
|
1
|
•
Concurrent with our IPO, we closed on a new $250.0 million revolving credit facility ("Revolving Credit Facility") and a new $200.0 million term loan ("Term Loan"). We drew down the term loan, in full, on December 30, 2024. The new loans have a five-year duration after consideration of extension options and bear interest at adjusted SOFR plus 1.2%. We used the term loan and borrowings under our revolving credit facility to repay, in full, our fixed-rate $253 million ABS notes that matured on December 30, 2024.
•
Declared a quarterly dividend of $0.215 per share and OP unit to holders of record as of March 31, 2025, payable on or before April 15, 2025.
•
Subsequent to quarter end, on March 4, 2025 we entered into $200 million in interest rate swap notional to fix our Term Loan at an all-in rate of 4.96%.
|
SUMMARIZED FINANCIAL RESULTS
|
|
For the three months ended December 31, |
|
|
|
For the year ended December 31, |
|
||||||||||||||||||||||
|
|
Pro Forma |
|
|
|
Historical |
|
|
|
Historical |
|
|
|
Pro Forma |
|
|
|
Historical |
|
|
|
Historical |
|
||||||
(in thousands, except per share data) |
|
2024 |
|
|
|
2024 |
|
|
|
2023 |
|
|
|
2024 |
|
|
|
2024 |
|
|
|
2023 |
|
||||||
Revenues |
|
$ |
16,868 |
|
|
|
$ |
15,514 |
|
|
|
$ |
14,343 |
|
|
|
$ |
66,685 |
|
|
|
$ |
59,917 |
|
|
|
$ |
48,266 |
|
|
|
|
|
|
|
|
|
|
|
|
|
|
|
|
|
|
|
|
|
|
|
|
|
||||||
Net (loss) income, including non-controlling interest |
|
$ |
(22,009 |
) |
|
|
$ |
(21,488 |
) |
|
|
$ |
8,429 |
|
|
|
$ |
(26,613 |
) |
|
|
$ |
(31,209 |
) |
|
|
$ |
(1,524 |
) |
Net (loss) income per share |
|
|
(0.79 |
) |
|
|
|
(0.78 |
) |
|
|
|
— |
|
|
|
|
(0.96 |
) |
|
|
|
— |
|
|
|
|
— |
|
|
|
|
|
|
|
|
|
|
|
|
|
|
|
|
|
|
|
|
|
|
|
|
|
||||||
FFO |
|
$ |
(9,708 |
) |
|
|
$ |
(9,963 |
) |
|
|
$ |
2,322 |
|
|
|
$ |
11,226 |
|
|
|
$ |
1,985 |
|
|
|
$ |
11,438 |
|
FFO per share |
|
|
(0.35 |
) |
|
|
|
(0.36 |
) |
|
|
|
— |
|
|
|
|
0.40 |
|
|
|
|
— |
|
|
|
|
— |
|
|
|
|
|
|
|
|
|
|
|
|
|
|
|
|
|
|
|
|
|
|
|
|
|
||||||
AFFO |
|
$ |
7,404 |
|
|
|
$ |
9,055 |
|
|
|
$ |
4,844 |
|
|
|
$ |
30,337 |
|
|
|
$ |
23,543 |
|
|
|
$ |
21,055 |
|
AFFO per share |
|
|
0.27 |
|
|
|
|
0.33 |
|
|
|
|
— |
|
|
|
|
1.09 |
|
|
|
|
— |
|
|
|
|
— |
|
|
|
|
|
|
|
|
|
|
|
|
|
|
|
|
|
|
|
|
|
|
|
|
|
||||||
Diluted Weighted Average Shares Outstanding |
|
|
27,823 |
|
|
|
|
27,578 |
|
|
|
|
— |
|
|
|
|
27,823 |
|
|
|
|
— |
|
|
|
|
— |
|
FFO, AFFO, and Pro Forma AFFO are measures that are not calculated in accordance with accounting principles generally accepted in the United States of America (“GAAP”). See the Reconciliation of Non-GAAP Measures later in this press release.
REAL ESTATE PORTFOLIO
As of December 31, 2024, we owned a diversified portfolio of 307 individual net leased commercial properties, comprising approximately 2.4 million rentable square feet of operational space. As of December 31, 2024, all but seven of our properties were subject to a lease, and our properties were occupied by 320 different commercial tenants, with no single tenant accounting for more than 2.9% of our annualized base rent (“ABR”). Properties subject to a lease represent 97.7% of the number of properties in our portfolio. The ABR weighted average lease term, pursuant to leases on properties in the portfolio as of December 31, 2024, was 7.2 years.
DISTRIBUTIONS
On March 18, 2025, our board of directors declared a quarterly dividend of $0.215 per common share and OP unit to holders of record as of March 31, 2025, payable on or before April 15, 2025.
2
2025 GUIDANCE
For 2025, FrontView expects to report AFFO of between $1.20 and $1.26 per diluted share.
The guidance is based on the following key assumptions:
Our per share results are sensitive to both the timing and amount of real estate investments, property dispositions, and capital markets activities that occur throughout the quarter.
We do not provide guidance for the most comparable GAAP financial measure, net income, or a reconciliation of the forward-looking non-GAAP financial measure of AFFO to net income computed in accordance with GAAP, because we are unable to reasonably predict, without unreasonable efforts, certain items that would be contained in the GAAP measure, including items that are not indicative of our ongoing operations, including, without limitation, potential impairments of real estate assets, net gain/loss on dispositions of real estate assets, changes in allowance for credit losses, and stock-based compensation expense. These items are uncertain, depend on various factors, and could have a material impact on our GAAP results for the guidance periods.
CONFERENCE CALL AND WEBCAST
The Company will host its fourth quarter earnings conference call and audio webcast on Thursday, March 20, 2025, at 10:00 a.m. Central Time.
To access the live webcast, which will be available in listen-only mode, please visit: https://events.q4inc.com/attendee/968397175. If you prefer to listen via phone, U.S. participants may dial: 1-800-549-8228 (toll free) or 646-564-2877 (local), conference ID 76353.
A replay of the conference call webcast will be available approximately one hour after the conclusion of the live broadcast. To listen to a replay of the call via the web, which will be available for one year, please visit: https://www.frontviewreit.com.
About FrontView REIT, Inc.
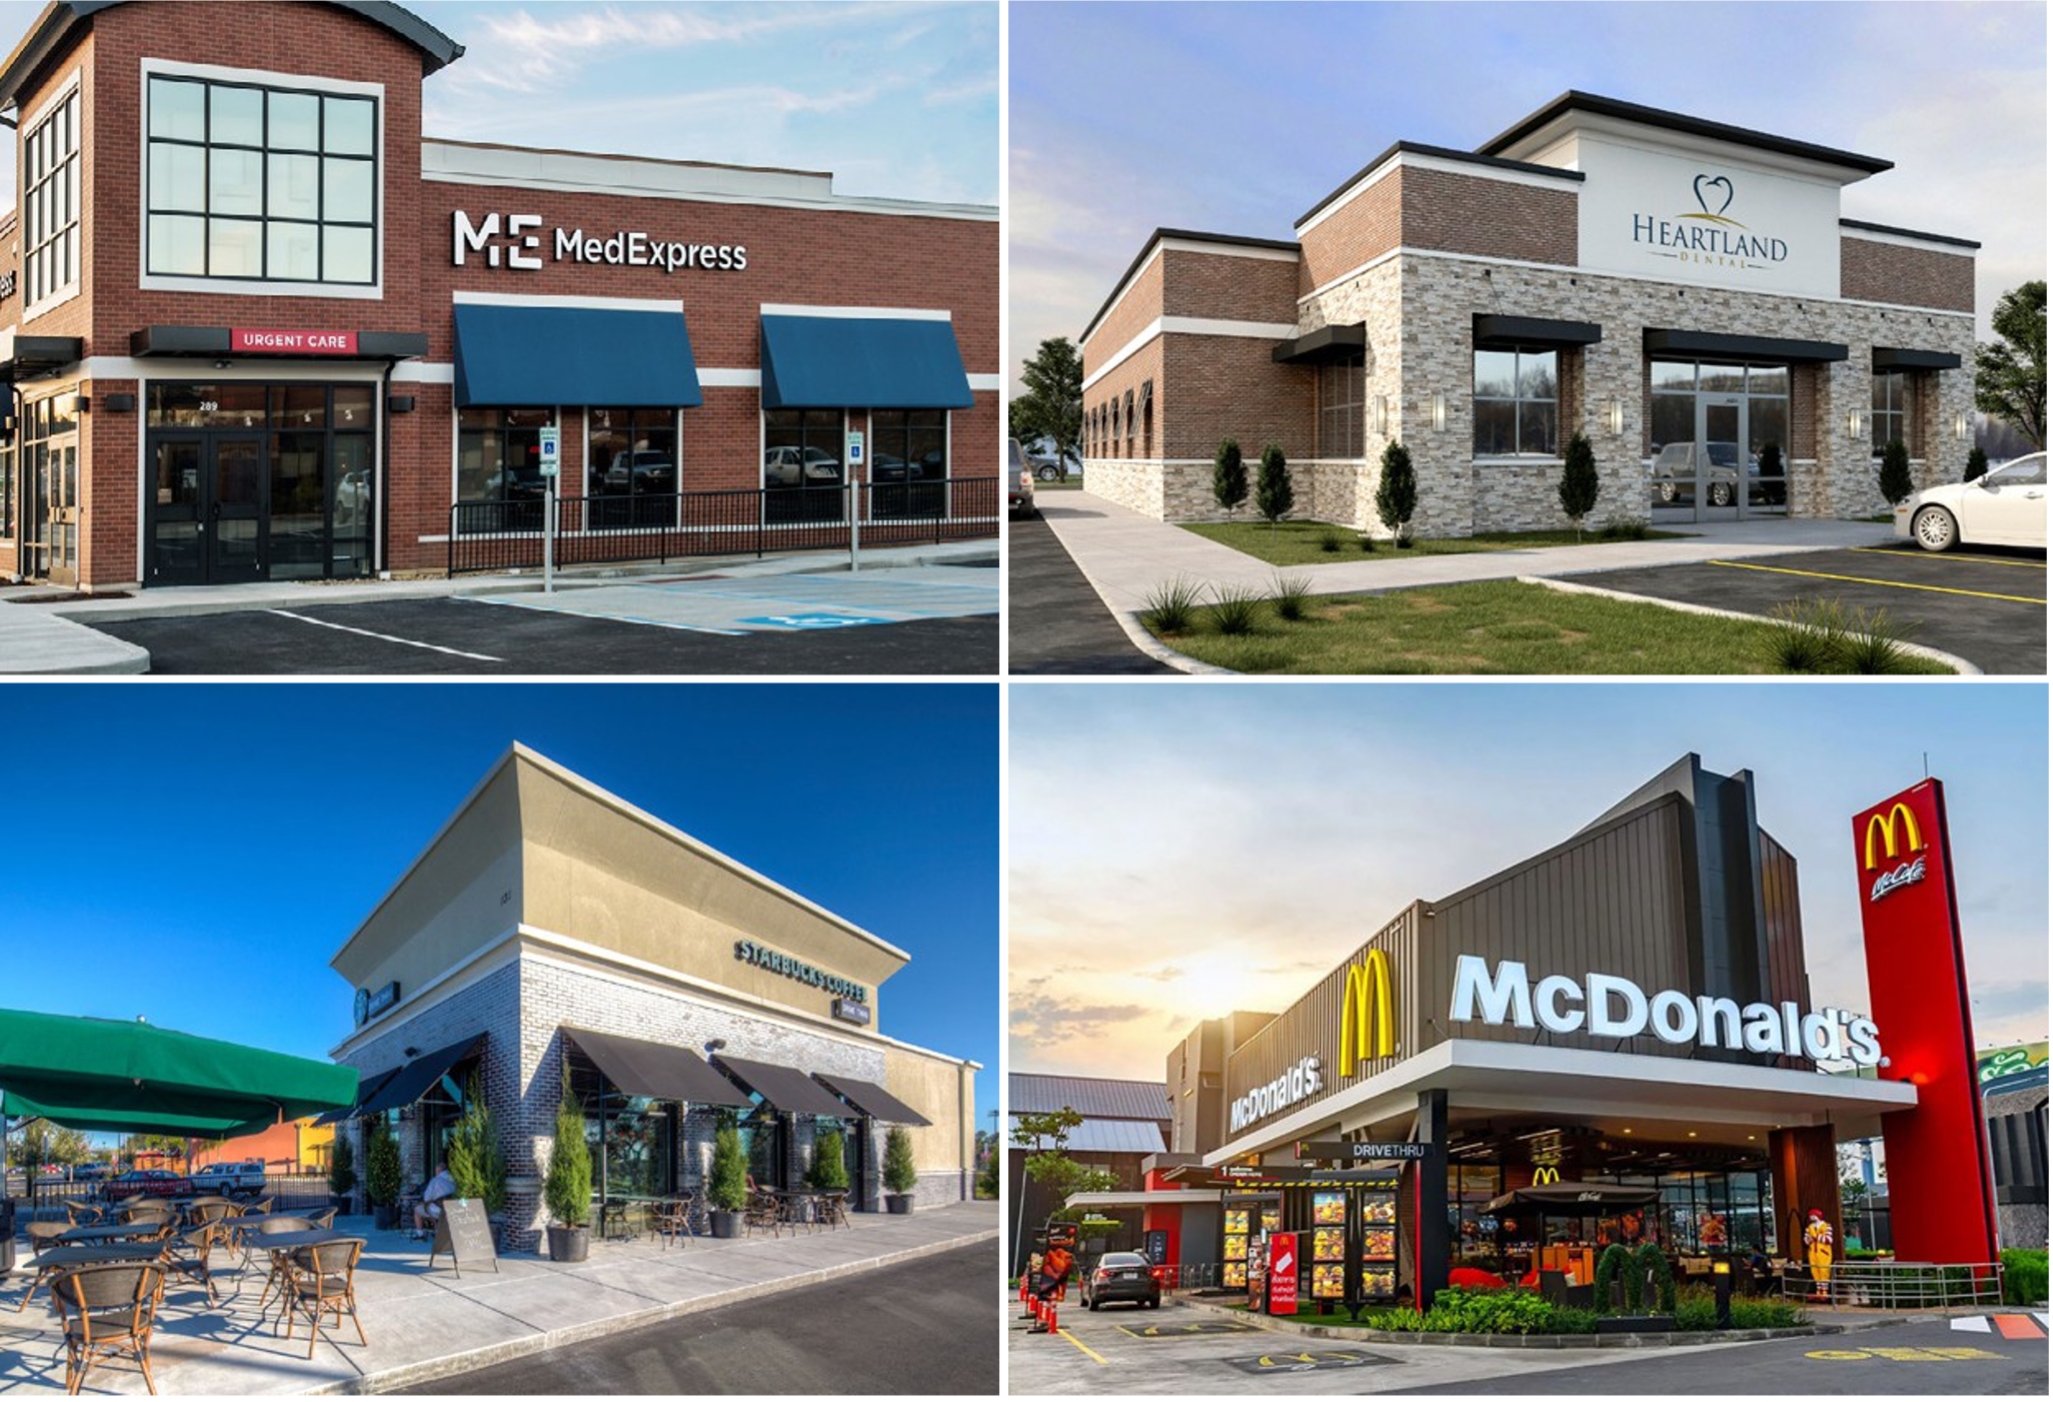
FrontView is an internally-managed net-lease REIT that acquires, owns and manages primarily properties with frontage that are net leased to a diversified group of tenants. FrontView is differentiated by an investment approach focused on properties that are in prominent locations with direct frontage on high-traffic roads that are highly visible to consumers. As of December 31, 2024, FrontView owned a well-diversified portfolio of 307 properties with direct frontage across 35 U.S. states. FrontView’s focuses on service-oriented tenants, including quick-service restaurants, cellular stores, financial institutions, automotive stores and dealers, medical and dental providers, convenience and gas stores, car washes, home improvement stores, grocery stores, fitness operators, professional services as well as general retail tenants.
Forward-Looking Statements
This press release contains “forward-looking” statements within the meaning of Section 27A of the Securities Act of 1933, as amended, and Section 21E of the Securities Exchange Act of 1934, as amended, regarding, among other things, our plans, strategies, and prospects, both business and financial. Such forward-looking statements can generally be identified by our use of forward-looking terminology such as “outlook,” “potential,” “may,” “will,” “should,” “could,” “seeks,” “approximately,” “projects,” “predicts,” “expect,” “intends,” “anticipates,” “estimates,” “plans,” “would be,” “believes,” “continues,” or the negative version of these words or other comparable words. Forward-looking statements, including our 2025 guidance and assumptions, involve known and unknown risks and uncertainties, which may cause FVR’s actual future results to differ materially from expected results, including, without limitation, risks and uncertainties related to general economic conditions, including but not limited to increases in the rate of inflation and/or interest rates, local real estate conditions, tenant financial health, property investments and acquisitions, and the timing and uncertainty of completing these property investments and acquisitions, and uncertainties regarding future distributions to our stockholders. These and other risks, assumptions, and uncertainties are described in Item 1A. “Risk Factors” of the Company’s Annual Report on Form 10-K for the fiscal year ended December 31, 2024, which the Company expects to file with the SEC on March 20, 2025, which you are encouraged to read, and will be available on the SEC’s website at www.sec.gov. Should one or more of these risks or uncertainties materialize, or should underlying assumptions prove incorrect, actual results may vary materially from those indicated or anticipated by such forward-looking statements. Accordingly, you are cautioned not to place undue reliance on these forward-looking statements, which speak only as of the date they are made. The Company assumes no obligation to, and does not currently intend to, update any forward-looking statements after the date of this press release, whether as a result of new information, future events, changes in assumptions, or otherwise.
3
Notice Regarding Non-GAAP Financial Measures
In addition to our reported results and net earnings per diluted share, which are financial measures presented in accordance with GAAP, this press release contains and may refer to certain non-GAAP financial measures, including Funds from Operations (“FFO”), AFFO, Pro Forma AFFO, Net Debt, Net Debt to Annualized Adjusted EBITDAre, and Pro Forma Net Debt to Annualized Adjusted EBITDAre. We believe the use of FFO, AFFO, and Pro Forma AFFO are useful to investors because they are widely accepted industry measures used by analysts and investors to compare the operating performance of REITs. FFO, AFFO, and Pro Forma AFFO should not be considered alternatives to net income as a performance measure or to cash flows from operations, as reported on our statement of cash flows, or as a liquidity measure, and should be considered in addition to, and not in lieu of, GAAP financial measures. We believe presenting Pro Forma Net Debt to Annualized Adjusted EBITDAre is useful to investors because it provides information about gross debt less cash and cash equivalents, which could be used to repay debt, compared to our performance as measured using Annualized Adjusted EBITDAre. You should not consider our Annualized Adjusted EBITDAre as an alternative to net income or cash flows from operating activities determined in accordance with GAAP. A reconciliation of non-GAAP measures to the most directly comparable GAAP financial measure and statements of why management believes these measures are useful to investors are included below.
Company Contact
media@frontviewreit.com
4
FRONTVIEW REIT INC.
CONSOLIDATED BALANCE SHEETS
(in thousands, except per share amounts)
|
|
Successor |
|
|
Predecessor |
|
||
|
|
December 31, |
|
|
December 31, |
|
||
ASSETS |
|
|
|
|
|
|
||
Real estate held for investment, at cost |
|
|
|
|
|
|
||
Land |
|
$ |
332,944 |
|
|
$ |
314,748 |
|
Buildings and improvements |
|
|
386,462 |
|
|
|
332,432 |
|
Total real estate held for investment, at cost |
|
|
719,406 |
|
|
|
647,180 |
|
Less accumulated depreciation |
|
|
(40,398 |
) |
|
|
(28,734 |
) |
Real estate held for investment, net |
|
|
679,008 |
|
|
|
618,446 |
|
Assets held for sale |
|
|
5,898 |
|
|
|
2,859 |
|
Cash, cash equivalents and restricted cash |
|
|
5,094 |
|
|
|
17,129 |
|
Intangible lease assets, net |
|
|
114,868 |
|
|
|
119,432 |
|
Other assets |
|
|
16,941 |
|
|
|
14,141 |
|
Total assets |
|
$ |
821,809 |
|
|
$ |
772,007 |
|
LIABILITIES, CONVERTIBLE NON-CONTROLLING PREFERRED |
|
|
|
|
|
|
||
Liabilities |
|
|
|
|
|
|
||
Debt, net |
|
$ |
266,538 |
|
|
$ |
436,452 |
|
Intangible lease liabilities, net |
|
|
14,735 |
|
|
|
17,416 |
|
Accounts payable and accrued liabilities |
|
|
17,858 |
|
|
|
17,452 |
|
Total liabilities |
|
|
299,131 |
|
|
|
471,320 |
|
|
|
|
|
|
|
|
||
Convertible non-controlling preferred interests |
|
|
— |
|
|
|
103,616 |
|
|
|
|
|
|
|
|
||
Equity |
|
|
|
|
|
|
||
Partners' capital |
|
|
— |
|
|
|
197,071 |
|
FrontView REIT, Inc. equity |
|
|
|
|
|
|
||
Common Stock, $0.01 par value 450,000 shares authorized, 17,291 shares |
|
|
173 |
|
|
|
— |
|
Additional paid-in capital |
|
|
331,482 |
|
|
|
— |
|
Accumulated deficit |
|
|
(6,834 |
) |
|
|
— |
|
Total FrontView REIT, Inc. equity |
|
|
324,821 |
|
|
|
— |
|
Non-controlling interests |
|
|
197,857 |
|
|
|
— |
|
Total equity |
|
|
522,678 |
|
|
|
— |
|
Total liabilities, convertible non-controlling preferred interests and equity |
|
$ |
821,809 |
|
|
$ |
772,007 |
|
5
FRONTVIEW REIT INC.
CONSOLIDATED STATEMENT OF INCOME (LOSS)
(in thousands, except per share amounts)
|
Combined Successor and Predecessor |
|
|
Predecessor |
|
|
Successor |
|
|
Predecessor |
|
|
Predecessor |
|
|||||
|
Three Months Ended |
|
|
Three Months Ended |
|
|
Period from |
|
|
Period from |
|
|
Year Ended |
|
|||||
Revenues |
|
|
|
|
|
|
|
|
|
|
|
|
|
|
|||||
Rental revenues |
$ |
15,514 |
|
|
$ |
14,343 |
|
|
$ |
15,177 |
|
|
$ |
44,740 |
|
|
$ |
48,266 |
|
|
|
|
|
|
|
|
|
|
|
|
|
|
|
|
|||||
Operating expenses |
|
|
|
|
|
|
|
|
|
|
|
|
|
|
|||||
Depreciation and amortization |
|
7,634 |
|
|
|
7,415 |
|
|
|
7,468 |
|
|
|
21,581 |
|
|
|
24,730 |
|
Property operating expenses |
|
2,218 |
|
|
|
1,884 |
|
|
|
2,170 |
|
|
|
5,742 |
|
|
|
5,825 |
|
Property management fees |
|
60 |
|
|
|
494 |
|
|
|
— |
|
|
|
1,561 |
|
|
|
1,616 |
|
Asset management fees |
|
22 |
|
|
|
1,034 |
|
|
|
— |
|
|
|
3,124 |
|
|
|
4,139 |
|
General and administrative expenses |
|
2,850 |
|
|
|
2,026 |
|
|
|
2,787 |
|
|
|
2,122 |
|
|
|
8,055 |
|
Total operating expenses |
|
12,784 |
|
|
|
12,853 |
|
|
|
12,425 |
|
|
|
34,130 |
|
|
|
44,365 |
|
|
|
|
|
|
|
|
|
|
|
|
|
|
|
|
|||||
Other expenses (income) |
|
|
|
|
|
|
|
|
|
|
|
|
|
|
|||||
Interest expense |
|
3,593 |
|
|
|
6,498 |
|
|
|
3,452 |
|
|
|
19,896 |
|
|
|
18,377 |
|
Gain on sale of real estate |
|
— |
|
|
|
(1,057 |
) |
|
|
— |
|
|
|
(337 |
) |
|
|
(725 |
) |
Impairment loss |
|
3,891 |
|
|
|
407 |
|
|
|
3,891 |
|
|
|
591 |
|
|
|
407 |
|
Income taxes |
|
236 |
|
|
|
110 |
|
|
|
231 |
|
|
|
349 |
|
|
|
316 |
|
Total other expenses |
|
7,720 |
|
|
|
5,958 |
|
|
|
7,574 |
|
|
|
20,499 |
|
|
|
18,375 |
|
Operating loss |
|
(4,990 |
) |
|
|
(4,468 |
) |
|
|
(4,822 |
) |
|
|
(9,889 |
) |
|
|
(14,474 |
) |
Internalization expense |
|
(16,498 |
) |
|
|
— |
|
|
|
— |
|
|
|
(16,498 |
) |
|
|
— |
|
Gain from acquisition of equity method investment |
|
— |
|
|
|
12,988 |
|
|
|
— |
|
|
|
— |
|
|
|
12,988 |
|
Equity loss from investment in an |
|
— |
|
|
|
(91 |
) |
|
|
— |
|
|
|
— |
|
|
|
(38 |
) |
Net (loss) income |
|
(21,488 |
) |
|
|
8,429 |
|
|
|
(4,822 |
) |
|
|
(26,387 |
) |
|
|
(1,524 |
) |
Less: Net loss (income) attributable to convertible non- |
|
4,519 |
|
|
|
(2,274 |
) |
|
|
— |
|
|
|
7,171 |
|
|
|
424 |
|
Less: Net loss attributable to non-controlling interests |
|
1,825 |
|
|
|
— |
|
|
|
1,825 |
|
|
|
— |
|
|
|
— |
|
Net (loss) income attributable to NADG NNN Property Fund LP (Predecessor) and to FrontView REIT, Inc. (Successor) |
$ |
(15,144 |
) |
|
$ |
6,155 |
|
|
$ |
(2,997 |
) |
|
$ |
(19,216 |
) |
|
$ |
(1,100 |
) |
|
|
|
|
|
|
|
|
|
|
|
|
|
|
|
|||||
Weighted average number of common shares outstanding |
|
|
|
|
|
|
|
|
|
|
|
|
|
|
|||||
Basic |
|
— |
|
|
|
— |
|
|
|
16,259 |
|
|
|
— |
|
|
|
— |
|
Diluted |
|
— |
|
|
|
— |
|
|
|
27,578 |
|
|
|
— |
|
|
|
— |
|
Net loss per share attributable to Common Stock holders |
|
|
|
|
|
|
|
|
|
|
|
|
|
|
|||||
Basic |
$ |
— |
|
|
$ |
— |
|
|
$ |
(0.19 |
) |
|
$ |
— |
|
|
$ |
— |
|
Diluted |
$ |
— |
|
|
$ |
— |
|
|
$ |
(0.19 |
) |
|
$ |
— |
|
|
$ |
— |
|
6
Reconciliation of Non-GAAP Measures
The following is a reconciliation of historical and pro forma net income to FFO and AFFO for the following periods:
|
|
Successor |
|
|
Successor |
|
|
Predecessor |
|
|
Predecessor |
|
||||
|
|
Pro Forma |
|
|
Historical |
|
|
Historical |
|
|
Historical |
|
||||
(in thousands) |
|
Year Ended |
|
|
Period from |
|
|
Period from |
|
|
Year Ended |
|
||||
Net loss |
|
$ |
(26,613 |
) |
|
$ |
(4,822 |
) |
|
$ |
(26,387 |
) |
|
$ |
(1,524 |
) |
Depreciation on real property and amortization of real estate intangibles |
|
|
33,357 |
|
|
|
7,468 |
|
|
|
21,581 |
|
|
|
24,730 |
|
Share of 50/50 Joint Venture's depreciation on real property and amortization of real estate intangibles |
|
|
— |
|
|
|
— |
|
|
|
— |
|
|
|
1,798 |
|
Gain on sale of real estate |
|
|
— |
|
|
|
— |
|
|
|
(337 |
) |
|
|
(725 |
) |
Share of 50/50 Joint Venture's gain on sale of real estate |
|
|
— |
|
|
|
— |
|
|
|
— |
|
|
|
(260 |
) |
Impairment loss on real estate held for investment |
|
|
4,482 |
|
|
|
3,891 |
|
|
|
591 |
|
|
|
407 |
|
Gain from acquisition of equity method |
|
|
— |
|
|
|
— |
|
|
|
— |
|
|
|
(12,988 |
) |
FFO |
|
$ |
11,226 |
|
|
$ |
6,537 |
|
|
$ |
(4,552 |
) |
|
$ |
11,438 |
|
Straight-line rent adjustments |
|
|
(1,806 |
) |
|
|
(322 |
) |
|
|
(971 |
) |
|
|
(1,350 |
) |
Share of 50/50 Joint Venture's straight-line rent adjustments |
|
|
— |
|
|
|
— |
|
|
|
— |
|
|
|
(43 |
) |
Amortization of financing transaction and discount costs |
|
|
1,601 |
|
|
|
1,588 |
|
|
|
3,145 |
|
|
|
2,792 |
|
Share of 50/50 Joint Venture's amortization of debt issuance cost |
|
|
— |
|
|
|
— |
|
|
|
— |
|
|
|
226 |
|
Amortization of above/below market lease intangibles |
|
|
2,048 |
|
|
|
164 |
|
|
|
1,341 |
|
|
|
1,469 |
|
Share of 50/50 Joint Venture's amortization of above/below market lease intangibles |
|
|
— |
|
|
|
— |
|
|
|
— |
|
|
|
90 |
|
Stock-based compensation |
|
|
2,496 |
|
|
|
608 |
|
|
|
— |
|
|
|
— |
|
Lease termination fees |
|
|
(1,726 |
) |
|
|
(342 |
) |
|
|
(1,384 |
) |
|
|
— |
|
Adjustment for structuring and public company readiness costs |
|
|
— |
|
|
|
662 |
|
|
|
487 |
|
|
|
4,092 |
|
Adjustment for Internalization expenses |
|
|
16,498 |
|
|
|
— |
|
|
|
16,498 |
|
|
|
2,169 |
|
Other non-recurring expenses |
|
|
— |
|
|
|
84 |
|
|
|
— |
|
|
|
172 |
|
AFFO |
|
$ |
30,337 |
|
|
$ |
8,979 |
|
|
$ |
14,564 |
|
|
$ |
21,055 |
|
Our reported results and net earnings per diluted share are presented in accordance with GAAP. We also disclose FFO and AFFO, each of which are non-GAAP measures. We believe these non-GAAP financial measures are industry measures used by analysts and investors to compare the operating performance of REITs. FFO and AFFO should not be considered alternatives to net income as a performance measure or to cash flows from operations, as reported on our statement of cash flows, or as a liquidity measure, and should be considered in addition to, and not in lieu of, GAAP financial measures.
We compute FFO in accordance with the standards established by the Board of Governors of Nareit. Nareit defines FFO as GAAP net income or loss adjusted to exclude net gains (losses) from sales of certain depreciated real estate assets, depreciation and amortization expense from real estate assets, gains and losses from change in control, and impairment charges related to certain previously depreciated real estate assets. FFO is used by management, investors, and analysts to facilitate meaningful comparisons of operating performance between periods and among our peers, primarily because it excludes the effect of real estate depreciation and amortization and net gains on sales, which are based on historical costs and implicitly assume that the value of real estate diminishes predictably over time, rather than fluctuating based on existing market conditions. To derive AFFO, we modify the Nareit computation of FFO to include other adjustments to GAAP net income related to certain non-cash or non-recurring revenues and expenses, including straight-line rents, cost of debt extinguishments, amortization of lease intangibles, amortization of debt issuance costs, amortization of net mortgage premiums, (gain) loss on interest rate swaps and other non-cash interest expense, realized gains or losses on foreign currency transactions, Internalization expenses, structuring and public company readiness costs, extraordinary items, and other specified non-cash items. We believe that such items are not a result of normal operations and thus we believe excluding such items assists management and investors in distinguishing whether changes in our operations are due to growth or decline of operations at our properties or from other factors. We use AFFO as a measure of our performance when we formulate corporate goals. We believe that AFFO is a useful supplemental measure for investors to consider because it will help them to better assess our operating performance without the distortions created by one-time cash and non-cash revenues or expenses.
7
Our leases typically include cash rents that increase through lease escalations over the term of the lease. Our leases do not typically include significant front-loading or back-loading of payments, or significant rent-free periods. Therefore, we find it useful to evaluate rent on a contractual basis as it allows for comparison of existing rental rates to market rental rates. We further exclude costs or gains recorded on the extinguishment of debt, non-cash interest expense and gains, the amortization of debt issuance costs, net mortgage premiums, and lease intangibles, realized gains and losses on foreign currency transactions, Internalization expenses, and structuring and public company readiness costs, as these items are not indicative of ongoing operational results.
FFO and AFFO may not be comparable to similarly titled measures employed by other REITs, and comparisons of our FFO and AFFO with the same or similar measures disclosed by other REITs may not be meaningful.
Neither the SEC nor any other regulatory body has passed judgment on the acceptability of the adjustments to FFO that we use to calculate AFFO. In the future, the SEC, Nareit or another regulatory body may decide to standardize the allowable adjustments across the REIT industry and in response to such standardization we may have to adjust our calculation and characterization of AFFO accordingly.
The following is a reconciliation of historical and pro forma net income to EBITDA, EBITDAre, and Adjusted EBITDAre, debt to Net Debt and Net Debt to Annualized Adjusted EBITDAre as of and for the three months ended December 31, 2024 and 2023:
|
|
Successor |
|
|
Combined Successor and Predecessor |
|
|
Predecessor |
|
|||
|
|
Pro Forma |
|
|
Historical |
|
|
Historical |
|
|||
(unaudited, in thousands) |
|
Three Months Ended December 31, 2024 |
|
|
Three Months Ended December 31, 2024 |
|
|
Three Months Ended December 31, 2023 |
|
|||
Net (loss) income |
|
$ |
(22,009 |
) |
|
$ |
(21,488 |
) |
|
$ |
8,429 |
|
Depreciation and amortization |
|
|
8,410 |
|
|
|
7,634 |
|
|
|
7,993 |
|
Share of 50/50 Joint Venture's depreciation and |
|
|
— |
|
|
|
— |
|
|
|
122 |
|
Interest expense |
|
|
4,517 |
|
|
|
3,593 |
|
|
|
6,498 |
|
Share of 50/50 Joint Venture's interest expense |
|
|
— |
|
|
|
— |
|
|
|
130 |
|
Income taxes |
|
|
236 |
|
|
|
236 |
|
|
|
110 |
|
Share of 50/50 Joint Venture's income taxes |
|
|
— |
|
|
|
— |
|
|
|
2 |
|
EBITDA |
|
$ |
(8,846 |
) |
|
$ |
(10,025 |
) |
|
$ |
23,283 |
|
Gain on sale of real estate |
|
|
— |
|
|
|
— |
|
|
|
(1,057 |
) |
Impairment loss on real estate held for investment |
|
|
3,891 |
|
|
|
3,891 |
|
|
|
407 |
|
Gain from acquisition of equity method investment |
|
|
— |
|
|
|
— |
|
|
|
(12,988 |
) |
EBITDAre |
|
$ |
(4,955 |
) |
|
$ |
(6,134 |
) |
|
$ |
9,645 |
|
Adjustment for current period investment activity (1) |
|
|
— |
|
|
|
1,354 |
|
|
|
— |
|
Adjustment for current period disposition activity (2) |
|
|
— |
|
|
|
— |
|
|
|
(36 |
) |
Adjustment for non-cash compensation expense (3) |
|
|
624 |
|
|
|
608 |
|
|
|
— |
|
Adjustment to exclude non-recurring (income) expenses (4) |
|
|
16,238 |
|
|
|
16,760 |
|
|
|
1,361 |
|
Adjustment to exclude net write-offs of accrued rental income |
|
|
63 |
|
|
|
63 |
|
|
|
— |
|
Adjusted EBITDAre |
|
|
11,970 |
|
|
|
12,651 |
|
|
|
10,970 |
|
Annualized EBITDAre |
|
|
(19,820 |
) |
|
|
(24,536 |
) |
|
|
38,580 |
|
Annualized adjusted EBITDAre |
|
$ |
47,880 |
|
|
$ |
50,604 |
|
|
$ |
43,880 |
|
(1) |
Reflects an adjustment to give effect to all acquisitions during the period as if they had been acquired as of the beginning of the period. |
(2) |
Reflects an adjustment to give effect to all dispositions during the period as if they had been sold as of the beginning of the period. |
(3) |
Reflects an adjustment to exclude non-cash stock-based compensation expense. |
(4) |
Reflects an adjustment to exclude non-recurring expenses including IPO costs, lease termination fees and non-recurring income or expenses. |
8
|
|
December 31, |
|
|||||||||
|
|
Pro Forma |
|
|
Historical |
|
|
Historical |
|
|||
(in thousands) |
|
2024 |
|
|
2024 |
|
|
2023 |
|
|||
Debt |
|
|
|
|
|
|
|
|
|
|||
Term Loan |
|
$ |
200,000 |
|
|
$ |
200,000 |
|
|
$ |
— |
|
Revolving Credit Facility |
|
|
68,500 |
|
|
|
68,500 |
|
|
|
— |
|
ABS Notes |
|
|
— |
|
|
|
— |
|
|
|
254,489 |
|
CIBC Revolving Credit Facility |
|
|
— |
|
|
|
— |
|
|
|
168,890 |
|
CIBC Term Loan |
|
|
— |
|
|
|
— |
|
|
|
17,000 |
|
Gross Debt |
|
|
268,500 |
|
|
|
268,500 |
|
|
|
440,379 |
|
Cash, cash equivalents and restricted cash |
|
|
(5,094 |
) |
|
|
(5,094 |
) |
|
|
(17,129 |
) |
Net Debt |
|
$ |
263,406 |
|
|
$ |
263,406 |
|
|
$ |
423,250 |
|
Leverage Ratios: |
|
|
|
|
|
|
|
|
|
|||
Net Debt to Annualized EBITDAre |
|
|
(13.3 |
) |
|
|
(10.7 |
) |
|
|
11.0 |
|
Net Debt to Annualized Adjusted EBITDAre |
|
|
5.5 |
|
|
|
5.2 |
|
|
|
9.6 |
|
Net Debt is a non-GAAP financial measure. We define Net Debt as our total debt less cash, cash equivalents and restricted cash. The ratios of Net Debt to EBITDAre and Net Debt to Annualized Adjusted EBITDAre represent Net Debt as of the end of the applicable period divided by EBITDAre or Annualized Adjusted EBITDAre for the period, respectively. We believe that these ratios are useful to investors and analysts because they provide information about Gross Debt less cash and cash equivalents, which could be useful to repay debt, compared to our performance as measured using EBITDAre and Annualized Adjusted EBITDAre.
We compute EBITDA as earnings before interest, income taxes and depreciation and amortization. EBITDA is a measure commonly used in our industry. We believe that this ratio provides investors and analysts with a measure of our leverage that includes our operating results unaffected by the differences in capital structures, capital investment cycles and useful life of related assets compared to other companies in our industry. In 2017, Nareit issued a white paper recommending that companies that report EBITDA also report EBITDAre in financial reports. We compute EBITDAre in accordance with the definition adopted by Nareit. Nareit defines EBITDAre as EBITDA (as defined above) excluding gains (loss) from the sales of depreciable property and provisions for impairment on investment in real estate. We believe EBITDA and EBITDAre are useful to investors and analysts because they provide important supplemental information about our operating performance exclusive of certain non-cash and other costs. EBITDA and EBITDAre are not measures of financial performance under GAAP, and our EBITDA and EBITDAre may not be comparable to similarly titled measures of other companies. You should not consider our EBITDA and EBITDAre as alternatives to net income or cash flows from operating activities determined in accordance with GAAP.
We compute adjusted EBITDAre as EBITDAre for the applicable quarter, as adjusted to (i) reflect all investment and disposition activity that took place during the applicable quarter as if each transaction had been completed on the first day of the quarter, (ii) exclude certain GAAP income and expense amounts that we believe are infrequent and unusual in nature because they relate to unique circumstances or transactions that had not previously occurred and which we do not anticipate occurring in the future, (iii) eliminate the impact of lease termination fees from certain of our tenants, and (iv) exclude non-cash stock-based compensation expense.
Annualized adjusted EBITDAre is calculated by multiplying adjusted EBITDAre for the applicable quarter by four, which we believe provides a meaningful estimate of our current run rate for all of our investments as of the end of the most recently completed quarter given the contractual nature of our long term net leases. You should not unduly rely on this measure as it is based on assumptions and estimates that may prove to be inaccurate. Our actual reported EBITDAre for future periods may be significantly different from our annualized adjusted EBITDAre. Our actual reported EBITDAre for future periods may be significantly different from our Annualized Adjusted EBITDAre.
Adjusted EBITDAre and Annualized Adjusted EBITDAre are not measurements of performance under GAAP, and our Adjusted EBITDAre and Annualized Adjusted EBITDAre may not be comparable to similarly titled measures of other companies. You should not consider our Adjusted EBITDAre and Annualized Adjusted EBITDAre as alternatives to net income or cash flows from operating activities determined in accordance with GAAP.
9
EXHIBIT 99.2

Q4 2024 QUARTERLY SUPPLEMENTAL INFORMATION |
FrontView REIT, Inc. (NYSE: FVR) is a real estate investment trust (REIT) that invests in single-tenant commercial real estate properties with frontage that are net leased on a long-term basis to a diversified group of tenants. |
www.frontviewreit.com
Table of Contents
Section |
Page |
|
|
3 |
|
||
4 |
|
||
5 |
|
||
6 |
|
||
7 |
|
||
Funds From Operations (FFO) and Adjusted |
8 |
|
|
9 |
|
||
10 |
|
||
11 |
|
||
12 |
|
||
13 |
|
||
14 |
|
||
15 |
|
||
16 |
|
||
17 |
|
||
18 |
|
||
19 |
|
||
20 |
|
||
21 |
|
||
|
|
|
|
|
|
|
|
|
|
|
|
|
|
|
|
|
|
|
|
|
|
|
|
|
|
|
|
|
|
|
|
|
|
|
|
|
|
|
|
|
|
|
|
|
|
|
|
|
|
|
|
|
|
|
|
|
|
|
|
|
|
|
FrontView REIT, Inc. | www.frontviewreit.com | 2025 FrontView REIT, Inc. All rights reserved. |
2 |
About the Data
This data and other information described herein are as of and for the three months ended December 31, 2024, unless otherwise indicated. Future performance may not be consistent with past performance and is subject to change and inherent risks and uncertainties. This information should be read in conjunction with FrontView’s Annual Report Form 10-K as of and for the period ended December 31, 2024, including the financial statements and the management’s discussion and analysis of financial condition and results of operations sections.
Forward Looking Statements
Information set forth herein contains forward-looking statements, which reflect our current views regarding our business, financial performance, growth prospects and strategies, market opportunities, and market trends. Forward-looking statements include all statements that are not historical facts. In some cases, you can identify these forward-looking statements by the use of words such as “outlook,” “believes,” “expects,” “potential,” “continues,” “may,” “will,” “should,” “could,” “would be,” “seeks,” “approximately,” “projects,” “predicts,” “intends,” “plans,” “estimates,” “anticipates,” or the negative version of these words or other comparable words. All of the forward-looking statements herein are subject to various risks and uncertainties. Assumptions relating to the foregoing involve judgments with respect to, among other things, future economic, competitive and market conditions, and future business decisions, all of which are difficult or impossible to predict accurately and many of which are beyond our control. Although we believe that the expectations reflected in such forward-looking statements are based on reasonable assumptions, our actual results, performance, and achievements could differ materially from those expressed in or by the forward-looking statements and may be affected by a variety of risks and other factors. Accordingly, there are or will be important factors that could cause actual outcomes or results to differ materially from such forward-looking statements. These factors include, but are not limited to, risks and uncertainties related to general economic conditions, including but not limited to increases in the rate of inflation and/or interest rates, local real estate conditions, tenant financial health, and property acquisitions and the timing of these investments and acquisitions. These and other risks, assumptions, and uncertainties are described in our filings with the SEC, which are available on the SEC’s website at www.sec.gov.
You are cautioned not to place undue reliance on any forward-looking statements included herein. All forward-looking statements are made as of the date of this document and the risk that actual results, performance, and achievements will differ materially from the expectations expressed or referenced herein will increase with the passage of time. We undertake no obligation to publicly update or review any forward-looking statement, whether as a result of new information, future developments, or otherwise, except as required by law.
IP Disclaimer
This document contains references to copyrights, trademarks, trade names, and service marks that belong to other companies. FrontView REIT, Inc. is not affiliated or associated with, and is not endorsed by and does not endorse, such companies or their products or services.
FrontView REIT, Inc. | www.frontviewreit.com | 2025 FrontView REIT, Inc. All rights reserved. |
3 |
Company Overview
FrontView REIT, Inc. (NYSE:FVR) (the “Company”, “FrontView”, “FVR”, “us”, “our”, and “we”) is an internally-managed net-lease REIT that acquires, owns and manages primarily properties with frontage that are net leased to a diversified group of tenants. The Company is differentiated by an investment approach focused on properties that are in prominent locations with direct frontage on high-traffic roads that are highly visible to consumers. As of December 31, 2024, the Company owned a well-diversified portfolio of 307 properties with direct frontage across 35 U.S. states. The Company's tenants include service-oriented businesses, such as restaurants, cellular stores, financial institutions, automotive stores and dealers, medical and dental providers, pharmacies, convenience and gas stores, car washes, home improvement stores, grocery stores, fitness operators, professional services as well as general retail tenants.
|
Executive Team Stephen Preston Chairman of the Board, Co-Chief Executive Officer, and Co- President Randall Starr Co-Chief Executive Officer, Co-President, and Director Timothy Dieffenbacher Chief Financial Officer, Treasurer, and Secretary Drew Ireland Chief Operating Officer |
|
Board of Directors Stephen Preston Chairman of the Board Randall Starr Director Robert Green Director Daniel Swanstrom Independent Director Elizabeth Frank Independent Director Ernesto Perez Independent Director Noelle LeVeaux Independent Director |
Company Contact Information
Rob Shelton
Director, Finance
media@frontviewreit.com
FrontView REIT, Inc. | www.frontviewreit.com | 2025 FrontView REIT, Inc. All rights reserved. |
4 |
Quarterly Financial Summary
(unaudited, in thousands except per share data)
|
|
December 31, |
|
|
December 31, |
|
|
September 30, |
|
|
June 30, |
|
|
March 31, |
|
|
December 31, |
|
||||||
|
|
Pro Forma |
|
|
Historical |
|
|
Historical |
|
|
Historical |
|
|
Historical |
|
|
Historical |
|
||||||
Financial Summary |
|
|
|
|
|
|
|
|
|
|
|
|
|
|
|
|
|
|
||||||
Total real estate held for investment, at cost |
|
$ |
719,406 |
|
|
$ |
719,406 |
|
|
$ |
640,264 |
|
|
$ |
640,264 |
|
|
$ |
642,398 |
|
|
$ |
647,180 |
|
Less: accumulated depreciation |
|
|
(40,398 |
) |
|
|
(40,398 |
) |
|
|
(37,277 |
) |
|
|
(34,356 |
) |
|
|
(31,471 |
) |
|
|
(28,734 |
) |
Real estate held for investment, net |
|
|
679,008 |
|
|
|
679,008 |
|
|
|
602,987 |
|
|
|
605,908 |
|
|
|
610,927 |
|
|
|
618,446 |
|
Assets held for sale |
|
|
5,898 |
|
|
|
5,898 |
|
|
|
— |
|
|
— |
|
|
|
953 |
|
|
|
2,859 |
|
|
Cash, cash equivalents and restricted cash |
|
|
5,094 |
|
|
|
5,094 |
|
|
|
9,895 |
|
|
|
16,620 |
|
|
|
13,197 |
|
|
|
17,129 |
|
Total assets |
|
|
821,809 |
|
|
|
821,809 |
|
|
|
733,070 |
|
|
|
745,466 |
|
|
|
752,708 |
|
|
|
772,007 |
|
Debt, net |
|
|
266,538 |
|
|
|
266,538 |
|
|
|
418,268 |
|
|
|
427,435 |
|
|
|
427,773 |
|
|
|
436,452 |
|
Total liabilities |
|
|
299,131 |
|
|
|
299,131 |
|
|
|
448,372 |
|
|
|
455,791 |
|
|
|
456,902 |
|
|
|
471,320 |
|
Convertible non-controlling preferred interests |
|
|
— |
|
|
|
— |
|
|
|
103,724 |
|
|
|
103,724 |
|
|
|
103,724 |
|
|
|
103,616 |
|
Partners' capital |
|
|
— |
|
|
|
— |
|
|
|
180,974 |
|
|
|
185,951 |
|
|
|
192,082 |
|
|
|
197,071 |
|
Total FrontView REIT, Inc. equity |
|
|
324,821 |
|
|
|
324,821 |
|
|
|
— |
|
|
|
— |
|
|
|
— |
|
|
|
— |
|
Non-controlling interests |
|
|
197,857 |
|
|
|
197,857 |
|
|
|
— |
|
|
|
— |
|
|
|
— |
|
|
|
— |
|
Total equity (book value) |
|
|
522,678 |
|
|
|
522,678 |
|
|
|
284,698 |
|
|
|
289,675 |
|
|
|
295,806 |
|
|
|
300,687 |
|
|
|
|
|
|
|
|
|
|
|
|
|
|
|
|
|
|
|
|
||||||
Revenues |
|
|
16,868 |
|
|
|
15,514 |
|
|
|
14,534 |
|
|
|
14,607 |
|
|
|
15,259 |
|
|
|
14,343 |
|
General and administrative expenses(1) |
|
|
3,107 |
|
|
|
2,932 |
|
|
|
2,225 |
|
|
|
2,171 |
|
|
|
2,262 |
|
|
|
3,554 |
|
Total operating expenses |
|
|
13,735 |
|
|
|
12,784 |
|
|
|
11,347 |
|
|
|
10,853 |
|
|
|
11,568 |
|
|
|
12,853 |
|
Interest expense |
|
|
4,517 |
|
|
|
3,593 |
|
|
|
6,463 |
|
|
|
6,597 |
|
|
|
6,695 |
|
|
|
6,498 |
|
Net (loss) income |
|
|
(22,009 |
) |
|
|
(21,488 |
) |
|
|
(3,339 |
) |
|
|
(3,013 |
) |
|
|
(3,369 |
) |
|
|
8,429 |
|
Net earnings per common share, diluted |
|
$ |
(0.79 |
) |
|
$ |
(0.78 |
) |
|
$ |
— |
|
|
$ |
— |
|
|
$ |
— |
|
|
$ |
— |
|
|
|
|
|
|
|
|
|
|
|
|
|
|
|
|
|
|
|
|
||||||
FFO |
|
|
(9,708 |
) |
|
|
(9,963 |
) |
|
|
3,780 |
|
|
|
4,010 |
|
|
|
4,159 |
|
|
|
2,322 |
|
FFO per share, diluted |
|
$ |
(0.35 |
) |
|
$ |
(0.36 |
) |
|
$ |
— |
|
|
$ |
— |
|
|
$ |
— |
|
|
$ |
— |
|
AFFO |
|
|
7,404 |
|
|
|
9,055 |
|
|
|
4,776 |
|
|
|
4,892 |
|
|
|
4,989 |
|
|
|
4,844 |
|
AFFO per share, diluted |
|
$ |
0.27 |
|
|
$ |
0.33 |
|
|
$ |
— |
|
|
$ |
— |
|
|
$ |
— |
|
|
$ |
— |
|
|
|
|
|
|
|
|
|
|
|
|
|
|
|
|
|
|
|
|
||||||
Net cash provided by operating activities |
|
|
— |
|
|
|
5,257 |
|
|
|
7,552 |
|
|
|
5,130 |
|
|
|
2,590 |
|
|
|
1,635 |
|
Net cash (used in) provided by investing activities |
|
|
— |
|
|
|
(105,103 |
) |
|
|
(597 |
) |
|
|
2,876 |
|
|
|
5,655 |
|
|
|
(21,609 |
) |
Net cash provided by (used in) financing activities |
|
|
— |
|
|
|
95,045 |
|
|
|
(13,680 |
) |
|
|
(4,583 |
) |
|
|
(12,177 |
) |
|
|
21,931 |
|
Dividend declared |
|
|
— |
|
|
|
6,101 |
|
|
|
— |
|
|
|
— |
|
|
|
— |
|
|
|
— |
|
Dividend declared per diluted share |
|
$ |
— |
|
|
$ |
0.215 |
|
|
$ |
— |
|
|
$ |
— |
|
|
$ |
— |
|
|
$ |
— |
|
(1) |
For the Historical periods presented, general and administrative expenses includes property management fees, asset management fees, and general and administrative expenses. |
FrontView REIT, Inc. | www.frontviewreit.com | 2025 FrontView REIT, Inc. All rights reserved. |
5 |
Balance Sheet
(unaudited, in thousands)
|
|
December 31, |
|
|
December 31, |
|
|
September 30, |
|
|
June 30, |
|
|
March 31, |
|
|
December 31, |
|
||||||
|
|
Pro Forma |
|
|
Historical |
|
|
Historical |
|
|
Historical |
|
|
Historical |
|
|
Historical |
|
||||||
ASSETS |
|
|
|
|
|
|
|
|
|
|
|
|
|
|
|
|
|
|
||||||
Real estate held for investment, at cost |
|
|
|
|
|
|
|
|
|
|
|
|
|
|
|
|
|
|
||||||
Land |
|
$ |
332,944 |
|
|
$ |
332,944 |
|
|
$ |
312,143 |
|
|
$ |
312,143 |
|
|
$ |
313,160 |
|
|
$ |
314,748 |
|
Buildings and improvements |
|
|
386,462 |
|
|
|
386,462 |
|
|
|
328,121 |
|
|
|
328,121 |
|
|
|
329,238 |
|
|
|
332,432 |
|
Total real estate held for investment, at cost |
|
|
719,406 |
|
|
|
719,406 |
|
|
|
640,264 |
|
|
|
640,264 |
|
|
|
642,398 |
|
|
|
647,180 |
|
Less accumulated depreciation |
|
|
(40,398 |
) |
|
|
(40,398 |
) |
|
|
(37,277 |
) |
|
|
(34,356 |
) |
|
|
(31,471 |
) |
|
|
(28,734 |
) |
Real estate held for investment, net |
|
|
679,008 |
|
|
|
679,008 |
|
|
|
602,987 |
|
|
|
605,908 |
|
|
|
610,927 |
|
|
|
618,446 |
|
Assets held for sale |
|
|
5,898 |
|
|
|
5,898 |
|
|
|
— |
|
|
— |
|
|
|
953 |
|
|
|
2,859 |
|
|
Cash, cash equivalents and restricted cash |
|
|
5,094 |
|
|
|
5,094 |
|
|
|
9,895 |
|
|
|
16,620 |
|
|
|
13,197 |
|
|
|
17,129 |
|
Intangible lease assets, net |
|
|
114,868 |
|
|
|
114,868 |
|
|
|
103,109 |
|
|
|
108,281 |
|
|
|
113,357 |
|
|
|
119,432 |
|
Other assets |
|
|
16,941 |
|
|
|
16,941 |
|
|
|
17,079 |
|
|
|
14,657 |
|
|
|
14,274 |
|
|
|
14,141 |
|
Total assets |
|
$ |
821,809 |
|
|
$ |
821,809 |
|
|
$ |
733,070 |
|
|
$ |
745,466 |
|
|
$ |
752,708 |
|
|
$ |
772,007 |
|
LIABILITIES, CONVERTIBLE NON-CONTROLLING PREFERRED |
|
|
|
|
|
|
|
|
|
|
|
|
|
|
|
|
|
|
||||||
Liabilities |
|
|
|
|
|
|
|
|
|
|
|
|
|
|
|
|
|
|
||||||
Debt, net |
|
$ |
266,538 |
|
|
$ |
266,538 |
|
|
$ |
418,268 |
|
|
$ |
427,435 |
|
|
$ |
427,773 |
|
|
$ |
436,452 |
|
Intangible lease liabilities, net |
|
|
14,735 |
|
|
|
14,735 |
|
|
|
14,242 |
|
|
|
14,997 |
|
|
|
15,745 |
|
|
|
17,416 |
|
Accounts payable and accrued liabilities |
|
|
17,858 |
|
|
|
17,858 |
|
|
|
15,862 |
|
|
|
13,359 |
|
|
|
13,384 |
|
|
|
17,452 |
|
Total liabilities |
|
|
299,131 |
|
|
|
299,131 |
|
|
|
448,372 |
|
|
|
455,791 |
|
|
|
456,902 |
|
|
|
471,320 |
|
|
|
|
|
|
|
|
|
|
|
|
|
|
|
|
|
|
|
|
||||||
Convertible non-controlling preferred interests |
|
|
— |
|
|
|
— |
|
|
|
103,724 |
|
|
|
103,724 |
|
|
|
103,724 |
|
|
|
103,616 |
|
|
|
|
|
|
|
|
|
|
|
|
|
|
|
|
|
|
|
|
||||||
Equity |
|
|
|
|
|
|
|
|
|
|
|
|
|
|
|
|
|
|
||||||
Partners' capital |
|
|
— |
|
|
|
— |
|
|
|
180,974 |
|
|
|
185,951 |
|
|
|
192,082 |
|
|
|
197,071 |
|
Common Stock, par value $0.01 per share |
|
|
173 |
|
|
|
173 |
|
|
|
— |
|
|
|
— |
|
|
|
— |
|
|
|
— |
|
Additional paid-in capital |
|
|
331,482 |
|
|
|
331,482 |
|
|
|
— |
|
|
|
— |
|
|
|
— |
|
|
|
— |
|
Accumulated deficit |
|
|
(6,834 |
) |
|
|
(6,834 |
) |
|
|
— |
|
|
|
— |
|
|
|
— |
|
|
|
— |
|
Non-controlling interests in the OP |
|
|
197,857 |
|
|
|
197,857 |
|
|
|
— |
|
|
|
— |
|
|
|
— |
|
|
|
— |
|
Total equity |
|
|
522,678 |
|
|
|
522,678 |
|
|
|
180,974 |
|
|
|
185,951 |
|
|
|
192,082 |
|
|
|
197,071 |
|
Total liabilities, convertible non-controlling preferred interests and equity |
|
$ |
821,809 |
|
|
$ |
821,809 |
|
|
$ |
733,070 |
|
|
$ |
745,466 |
|
|
$ |
752,708 |
|
|
$ |
772,007 |
|
FrontView REIT, Inc. | www.frontviewreit.com | 2025 FrontView REIT, Inc. All rights reserved. |
6 |
Income Statement Summary
(unaudited, in thousands except per share amounts)
|
For the three months ended |
|
|||||||||||||||||||||
|
December 31, |
|
|
December 31, |
|
|
September 30, |
|
|
June 30, |
|
|
March 31, |
|
|
December 31, |
|
||||||
|
Pro Forma |
|
|
Historical |
|
|
Historical |
|
|
Historical |
|
|
Historical |
|
|
Historical |
|
||||||
Revenues |
|
|
|
|
|
|
|
|
|
|
|
|
|
|
|
|
|
||||||
Rental revenues |
$ |
16,868 |
|
|
$ |
15,514 |
|
|
$ |
14,534 |
|
|
$ |
14,607 |
|
|
$ |
15,259 |
|
|
$ |
14,343 |
|
|
|
|
|
|
|
|
|
|
|
|
|
|
|
|
|
|
|
||||||
Operating expenses |
|
|
|
|
|
|
|
|
|
|
|
|
|
|
|
|
|
||||||
Depreciation and amortization |
|
8,410 |
|
|
|
7,634 |
|
|
|
7,119 |
|
|
|
6,972 |
|
|
|
7,325 |
|
|
|
7,415 |
|
Property operating expenses |
|
2,218 |
|
|
|
2,218 |
|
|
|
2,003 |
|
|
|
1,710 |
|
|
|
1,981 |
|
|
|
1,884 |
|
Property management fees |
|
— |
|
|
|
60 |
|
|
|
494 |
|
|
|
497 |
|
|
|
510 |
|
|
|
494 |
|
Asset management fees |
|
— |
|
|
|
22 |
|
|
|
1,034 |
|
|
|
1,034 |
|
|
|
1,034 |
|
|
|
1,034 |
|
General and administrative expenses |
|
3,107 |
|
|
|
2,850 |
|
|
|
697 |
|
|
|
640 |
|
|
|
718 |
|
|
|
2,026 |
|
Total operating expenses |
|
13,735 |
|
|
|
12,784 |
|
|
|
11,347 |
|
|
|
10,853 |
|
|
|
11,568 |
|
|
|
12,853 |
|
|
|
|
|
|
|
|
|
|
|
|
|
|
|
|
|
|
|
||||||
Other expenses (income) |
|
|
|
|
|
|
|
|
|
|
|
|
|
|
|
|
|
||||||
Interest expense |
|
4,517 |
|
|
|
3,593 |
|
|
|
6,463 |
|
|
|
6,597 |
|
|
|
6,695 |
|
|
|
6,498 |
|
Loss (gain) on sale of real estate |
|
— |
|
|
|
— |
|
|
|
— |
|
|
|
51 |
|
|
|
(388 |
) |
|
|
(1,057 |
) |
Impairment loss |
|
3,891 |
|
|
|
3,891 |
|
|
|
— |
|
|
|
— |
|
|
|
591 |
|
|
|
407 |
|
Income taxes |
|
236 |
|
|
|
236 |
|
|
|
63 |
|
|
|
119 |
|
|
|
162 |
|
|
|
110 |
|
Total other expenses |
|
8,644 |
|
|
|
7,720 |
|
|
|
6,526 |
|
|
|
6,767 |
|
|
|
7,060 |
|
|
|
5,958 |
|
Operating loss |
|
(5,511 |
) |
|
|
(4,990 |
) |
|
|
(3,339 |
) |
|
|
(3,013 |
) |
|
|
(3,369 |
) |
|
|
(4,468 |
) |
Internalization expense |
|
(16,498 |
) |
|
|
(16,498 |
) |
|
|
— |
|
|
|
— |
|
|
|
— |
|
|
|
— |
|
Gain from acquisition of equity method |
|
— |
|
|
|
— |
|
|
|
— |
|
|
|
— |
|
|
|
— |
|
|
|
12,988 |
|
Equity loss from investment in an |
|
— |
|
|
|
— |
|
|
|
— |
|
|
|
— |
|
|
|
— |
|
|
|
(91 |
) |
Net (loss) income |
|
(22,009 |
) |
|
|
(21,488 |
) |
|
|
(3,339 |
) |
|
|
(3,013 |
) |
|
|
(3,369 |
) |
|
|
8,429 |
|
Less: Net loss (income) attributable to |
|
— |
|
|
|
4,519 |
|
|
|
908 |
|
|
|
827 |
|
|
|
917 |
|
|
|
(2,274 |
) |
Less: Net loss attributable to non-controlling interests |
|
8,331 |
|
|
|
1,825 |
|
|
|
— |
|
|
|
— |
|
|
|
— |
|
|
|
— |
|
Net income (loss) attributable to NADG NNN Property Fund LP (Predecessor) and to FrontView REIT, Inc. (Successor) |
$ |
(13,678 |
) |
|
$ |
(15,144 |
) |
|
$ |
(2,431 |
) |
|
$ |
(2,186 |
) |
|
$ |
(2,452 |
) |
|
$ |
6,155 |
|
FrontView REIT, Inc. | www.frontviewreit.com | 2025 FrontView REIT, Inc. All rights reserved. |
7 |
Funds From Operations (FFO) and Adjusted Funds From Operations (AFFO)
(unaudited, in thousands)
|
|
For the three months ended |
|
|||||||||||||||||||||
|
|
December 31, |
|
|
December 31, |
|
|
September 30, |
|
|
June 30, |
|
|
March 31, |
|
|
December 31, |
|
||||||
|
|
Pro Forma |
|
|
Historical |
|
|
Historical |
|
|
Historical |
|
|
Historical |
|
|
Historical |
|
||||||
Net (loss) income |
|
$ |
(22,009 |
) |
|
$ |
(21,488 |
) |
|
$ |
(3,339 |
) |
|
$ |
(3,013 |
) |
|
$ |
(3,369 |
) |
|
$ |
8,429 |
|
Depreciation on real property and amortization of real estate intangibles |
|
|
8,410 |
|
|
|
7,634 |
|
|
|
7,119 |
|
|
|
6,972 |
|
|
|
7,325 |
|
|
$ |
7,415 |
|
Share of 50/50 Joint Venture's depreciation on real property and amortization of real estate intangibles |
|
|
— |
|
|
|
— |
|
|
|
— |
|
|
|
— |
|
|
|
— |
|
|
$ |
116 |
|
Loss (gain) on sale of real estate |
|
|
— |
|
|
|
— |
|
|
|
— |
|
|
|
51 |
|
|
|
(388 |
) |
|
$ |
(1,057 |
) |
Impairment loss on real estate held for investment |
|
|
3,891 |
|
|
|
3,891 |
|
|
|
— |
|
|
|
— |
|
|
|
591 |
|
|
$ |
407 |
|
Gain from acquisition of equity method |
|
|
— |
|
|
|
— |
|
|
|
— |
|
|
|
— |
|
|
|
— |
|
|
$ |
(12,988 |
) |
FFO |
|
$ |
(9,708 |
) |
|
$ |
(9,963 |
) |
|
$ |
3,780 |
|
|
$ |
4,010 |
|
|
$ |
4,159 |
|
|
$ |
2,322 |
|
Straight-line rent adjustments |
|
|
(428 |
) |
|
|
(329 |
) |
|
|
(187 |
) |
|
|
(446 |
) |
|
|
(331 |
) |
|
|
(449 |
) |
Share of 50/50 Joint Venture's straight-line rent adjustments |
|
|
— |
|
|
|
— |
|
|
|
— |
|
|
|
— |
|
|
|
— |
|
|
|
(8 |
) |
Amortization of financing transactions and discount costs |
|
|
413 |
|
|
|
1,588 |
|
|
|
1,053 |
|
|
|
1,036 |
|
|
|
1,056 |
|
|
|
1,018 |
|
Share of 50/50 Joint Venture's amortization of debt issuance cost |
|
|
— |
|
|
|
— |
|
|
|
— |
|
|
|
— |
|
|
|
— |
|
|
|
16 |
|
Amortization of above/below market lease intangibles |
|
|
265 |
|
|
|
167 |
|
|
|
423 |
|
|
|
476 |
|
|
|
439 |
|
|
|
578 |
|
Share of 50/50 Joint Venture's amortization of above/below market lease intangibles |
|
|
— |
|
|
|
— |
|
|
|
— |
|
|
|
— |
|
|
|
— |
|
|
|
6 |
|
Stock-based compensation |
|
|
624 |
|
|
|
608 |
|
|
|
— |
|
|
|
— |
|
|
|
— |
|
|
|
— |
|
Lease termination fees |
|
|
(342 |
) |
|
|
(342 |
) |
|
|
(747 |
) |
|
|
(223 |
) |
|
|
(414 |
) |
|
|
— |
|
Adjustment for structuring and public company readiness costs |
|
|
— |
|
|
|
662 |
|
|
|
440 |
|
|
|
23 |
|
|
|
51 |
|
|
|
979 |
|
Adjustment for Internalization expenses |
|
|
16,580 |
|
|
|
16,580 |
|
|
|
— |
|
|
|
— |
|
|
|
— |
|
|
|
382 |
|
Other non-recurring expenses |
|
|
— |
|
|
|
84 |
|
|
|
14 |
|
|
|
16 |
|
|
|
29 |
|
|
|
— |
|
AFFO |
|
$ |
7,404 |
|
|
$ |
9,055 |
|
|
$ |
4,776 |
|
|
$ |
4,892 |
|
|
$ |
4,989 |
|
|
$ |
4,844 |
|
FrontView REIT, Inc. | www.frontviewreit.com | 2025 FrontView REIT, Inc. All rights reserved. |
8 |
Lease Revenues Detail
(unaudited, in thousands)
|
|
For the three months ended |
|
|||||||||||||||||||||
|
|
December 31, |
|
|
December 31, |
|
|
September 30, |
|
|
June 30, |
|
|
March 31, |
|
|
December 31, |
|
||||||
|
|
Pro Forma |
|
|
Historical |
|
|
Historical |
|
|
Historical |
|
|
Historical |
|
|
Historical |
|
||||||
Revenues: |
|
|
|
|
|
|
|
|
|
|
|
|
|
|
|
|
|
|
||||||
Contractual rental amounts billed |
|
$ |
14,547 |
|
|
$ |
13,194 |
|
|
$ |
12,678 |
|
|
$ |
12,980 |
|
|
$ |
12,911 |
|
|
$ |
12,618 |
|
Recovery income |
|
|
1,760 |
|
|
|
1,760 |
|
|
|
1,293 |
|
|
|
1,218 |
|
|
|
1,907 |
|
|
|
1,773 |
|
Adjustment to recognize contractual rental amounts on a straight-line basis |
|
|
428 |
|
|
|
329 |
|
|
|
187 |
|
|
|
446 |
|
|
|
331 |
|
|
|
449 |
|
Variable rental amounts earned |
|
|
386 |
|
|
|
386 |
|
|
|
798 |
|
|
|
306 |
|
|
|
443 |
|
|
|
3 |
|
Above/below market lease amortization, net |
|
|
(265 |
) |
|
|
(167 |
) |
|
|
(423 |
) |
|
|
(476 |
) |
|
|
(439 |
) |
|
|
(578 |
) |
Other income |
|
|
12 |
|
|
|
12 |
|
|
|
1 |
|
|
|
133 |
|
|
|
106 |
|
|
|
78 |
|
Total rental revenues |
|
$ |
16,868 |
|
|
$ |
15,514 |
|
|
$ |
14,534 |
|
|
$ |
14,607 |
|
|
$ |
15,259 |
|
|
$ |
14,343 |
|
FrontView REIT, Inc. | www.frontviewreit.com | 2025 FrontView REIT, Inc. All rights reserved. |
9 |
Capital Structure
(in thousands, except percentages)
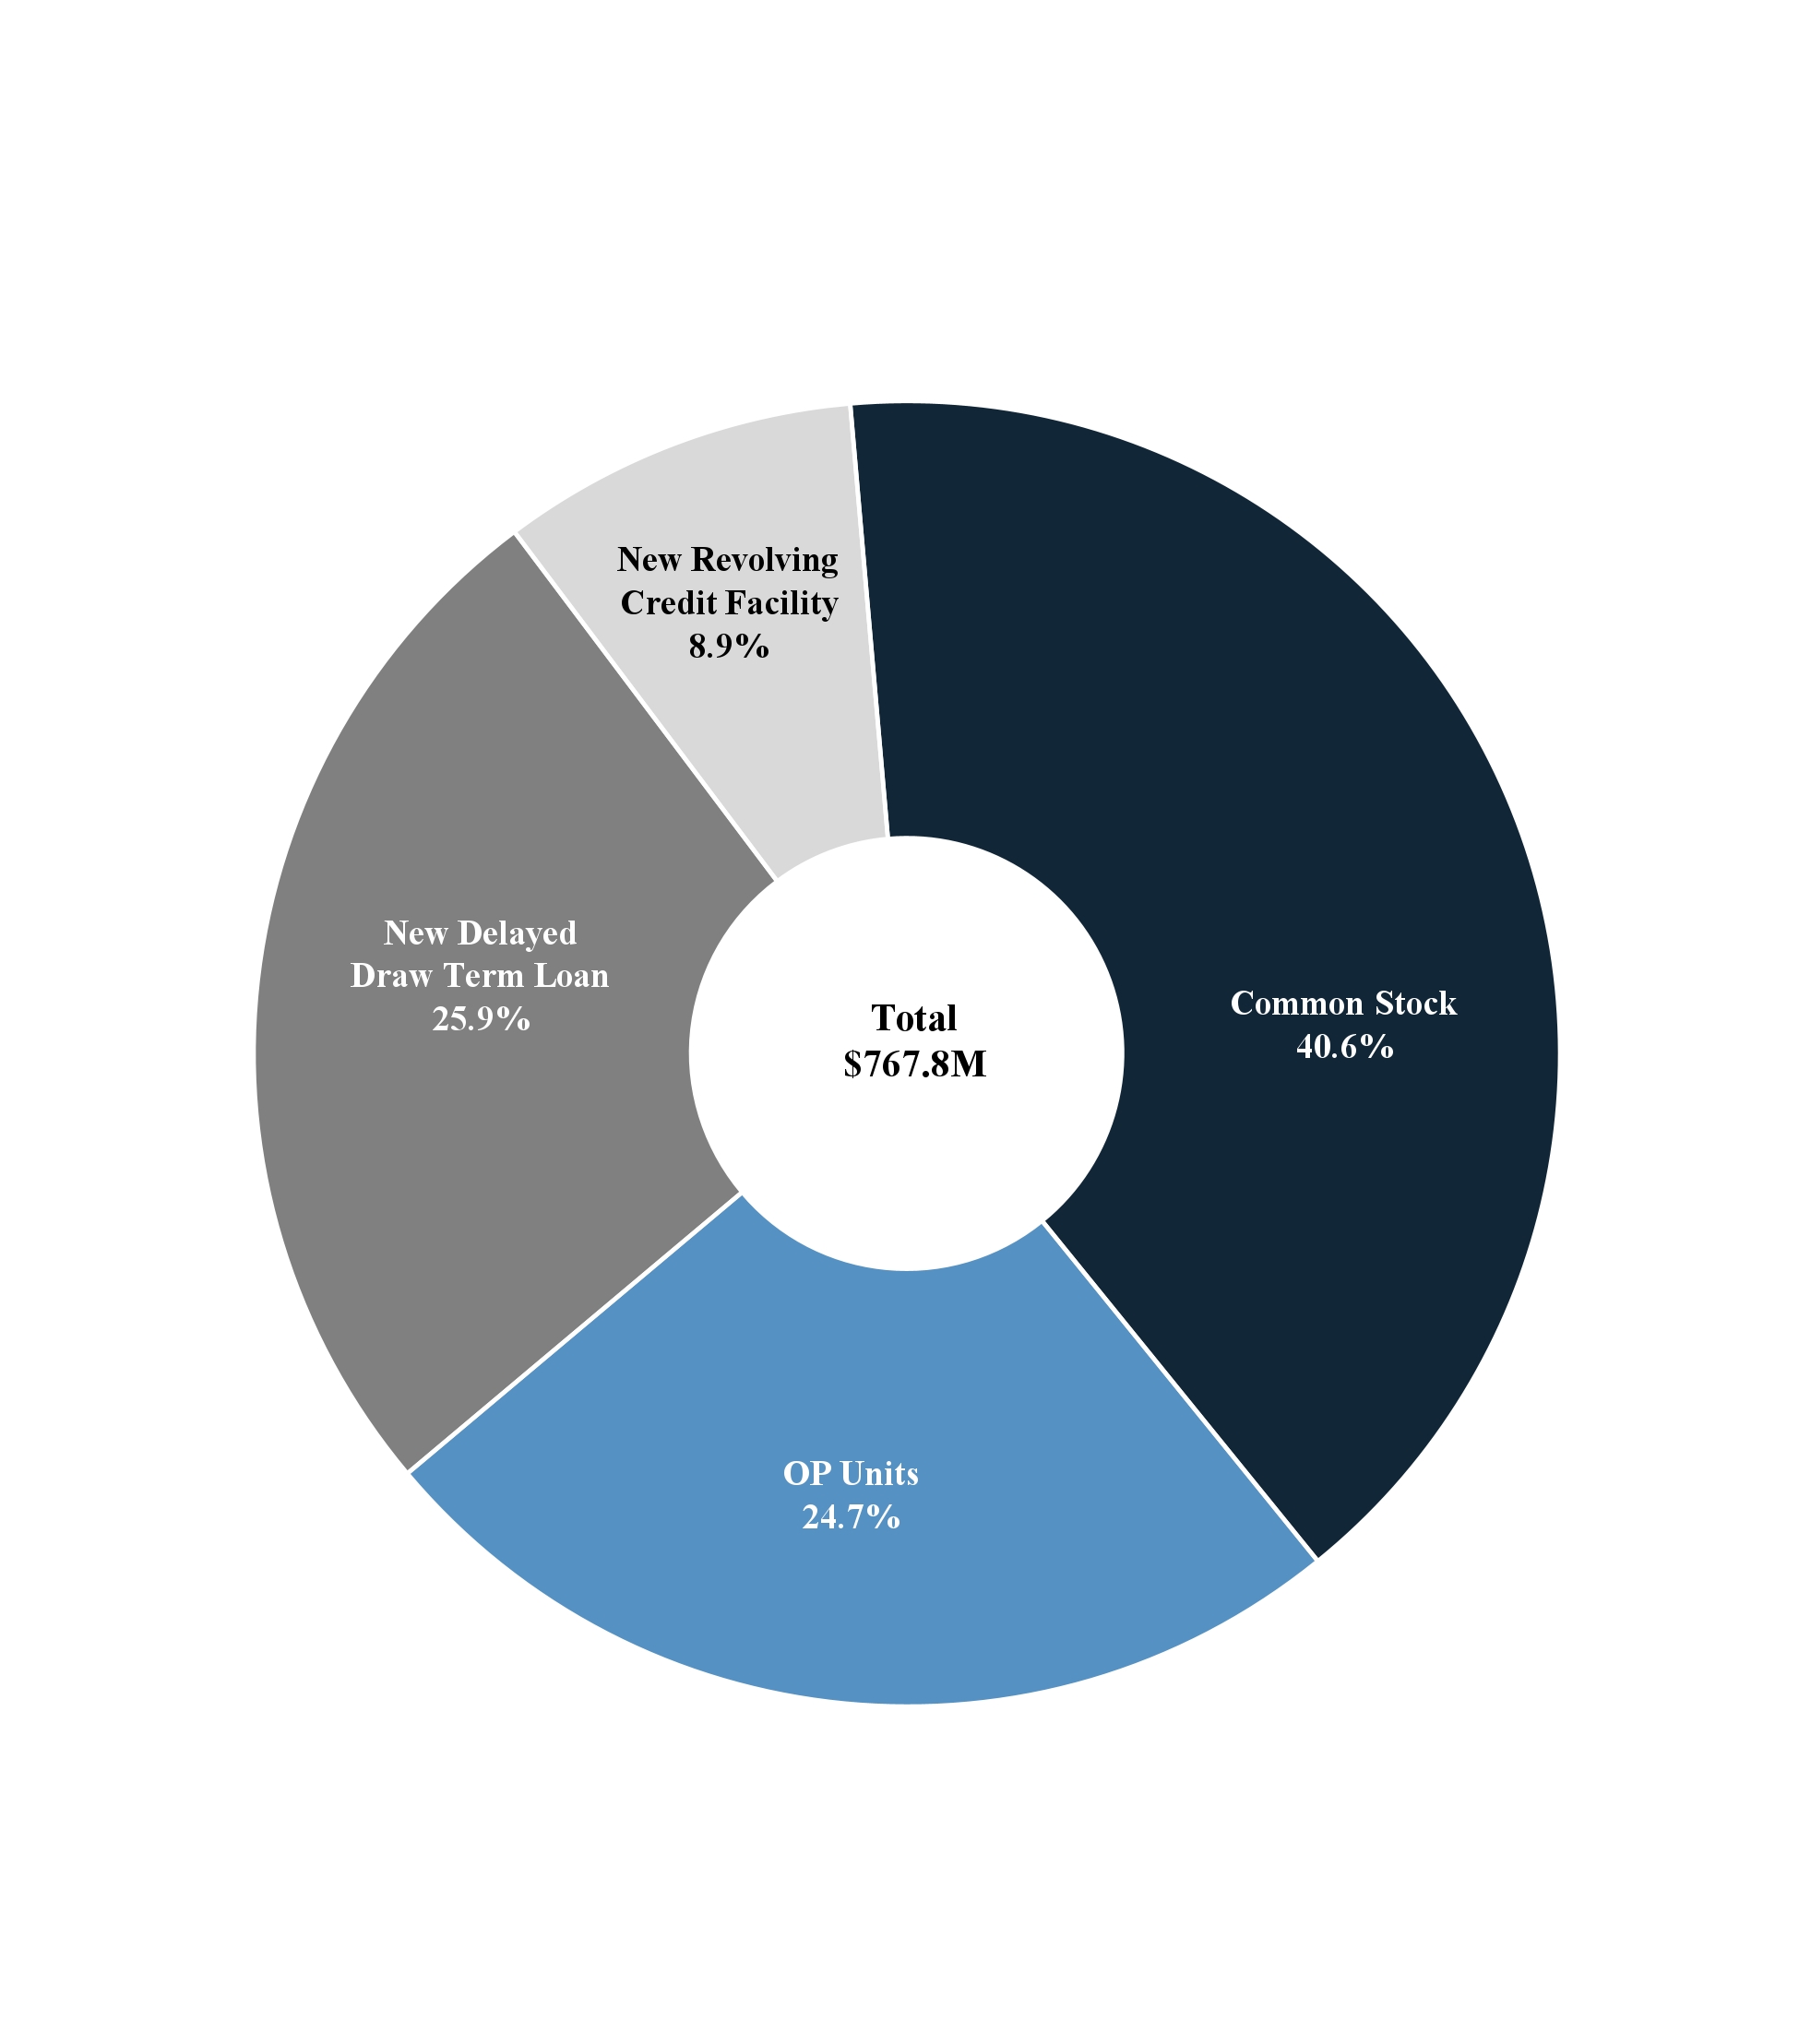
|
December 31, 2024 |
|
|
|
Historical |
|
|
Equity |
|
|
|
Shares of Common Stock |
|
17,291 |
|
OP Units |
|
10,532 |
|
Common Stock & OP Units |
|
27,823 |
|
Price Per Share / Unit as of closing day of trading |
$ |
18.13 |
|
Implied Equity Market Capitalization |
$ |
504,431 |
|
% of Total Capitalization |
|
65.3 |
% |
|
|
|
|
Debt |
|
|
|
Term Loan |
$ |
200,000 |
|
Revolving Credit Facility |
|
68,500 |
|
Total Debt |
$ |
268,500 |
|
% of Total Capitalization |
|
34.7 |
% |
|
|
|
|
Total Capitalization |
$ |
772,931 |
|
Less: Cash, cash equivalents and restricted cash |
|
(5,094 |
) |
Enterprise Value |
$ |
767,837 |
|
FrontView REIT, Inc. | www.frontviewreit.com | 2025 FrontView REIT, Inc. All rights reserved. |
10 |
Debt Outstanding
(in thousands)
|
|
Outstanding Balance |
|
|
|
|||||||
|
|
December 31, 2024 |
|
|
December 31, 2023 |
|
|
|
|
|
||
|
|
Historical |
|
|
Historical |
|
|
Interest Rate |
|
Maturity Date |
||
Term Loan |
|
$ |
200,000 |
|
|
$ |
— |
|
|
Adjusted SOFR + 1.20% (2) |
|
3-Oct-27 (1) |
Revolving Credit Facility |
|
|
68,500 |
|
|
|
— |
|
|
Adjusted SOFR + 1.20% (2) |
|
3-Oct-27 (1) |
ABS Notes |
|
|
— |
|
|
|
254,489 |
|
|
3.37% |
|
28-Dec-24 |
CIBC Revolving Credit Facility |
|
|
— |
|
|
|
168,890 |
|
|
Adjusted Term SOFR + 2.25% (3) |
|
8-Mar-25 |
CIBC Term Loan |
|
|
— |
|
|
|
17,000 |
|
|
Term SOFR + 1.80% (4) |
|
31-Mar-27 |
Gross Debt |
|
$ |
268,500 |
|
|
$ |
440,379 |
|
|
|
|
|
(1) |
The loans each contain two 12 month extension options, subject to a 0.125% extension fee. |
(2) |
The approximate one-month SOFR rate at December 31, 2024 was 4.37%, plus a 10 basis point adjustment "(Adjusted SOFR"). |
(3) |
The approximate one-month Term SOFR rate at December 31, 2023 was 5.38%, plus a 10 basis point adjustment ("Adjusted Term SOFR"). |
(4) |
The approximate one-month Term SOFR rate at December 31, 2023 was 5.38%. |
Equity Rollforward
(in thousands)
|
|
Shares of Common Stock |
|
|
OP Units |
|
|
Total Diluted Shares |
|
|||
Balance, October 3, 2024 |
|
|
16,068 |
|
|
|
11,755 |
|
|
|
27,823 |
|
Conversion of OP unit to Common Stock |
|
|
1,223 |
|
|
|
(1,223 |
) |
|
|
— |
|
Balance, December 31, 2024 |
|
|
17,291 |
|
|
|
10,532 |
|
|
|
27,823 |
|
FrontView REIT, Inc. | www.frontviewreit.com | 2025 FrontView REIT, Inc. All rights reserved. |
11 |
EBITDA, EBITDAre, and Other-Non GAAP Operating Metrics
(unaudited, in thousands)
|
|
For the three months ended |
|
|||||||||||||||||||||
|
|
December 31, |
|
|
December 31, |
|
|
September 30, |
|
|
June 30, |
|
|
March 31, |
|
|
December 31, |
|
||||||
|
|
Pro Forma |
|
|
Historical |
|
|
Historical |
|
|
Historical |
|
|
Historical |
|
|
Historical |
|
||||||
Net (loss) income |
|
$ |
(22,009 |
) |
|
$ |
(21,488 |
) |
|
$ |
(3,339 |
) |
|
$ |
(3,012 |
) |
|
$ |
(3,369 |
) |
|
$ |
8,429 |
|
Depreciation and amortization |
|
|
8,410 |
|
|
|
7,634 |
|
|
|
7,542 |
|
|
|
7,448 |
|
|
|
7,763 |
|
|
|
7,993 |
|
Share of 50/50 Joint Venture's depreciation and amortization |
|
|
— |
|
|
|
— |
|
|
|
— |
|
|
|
— |
|
|
|
— |
|
|
|
122 |
|
Interest expense |
|
|
4,517 |
|
|
|
3,593 |
|
|
|
6,463 |
|
|
|
6,597 |
|
|
|
6,695 |
|
|
|
6,498 |
|
Share of 50/50 Joint Venture's interest expense |
|
|
— |
|
|
|
— |
|
|
|
— |
|
|
|
— |
|
|
|
— |
|
|
|
130 |
|
Income taxes |
|
|
236 |
|
|
|
236 |
|
|
|
63 |
|
|
|
119 |
|
|
|
162 |
|
|
|
110 |
|
Share of 50/50 Joint Venture's income taxes |
|
|
— |
|
|
|
— |
|
|
|
— |
|
|
|
— |
|
|
|
— |
|
|
|
2 |
|
EBITDA |
|
$ |
(8,846 |
) |
|
$ |
(10,025 |
) |
|
$ |
10,729 |
|
|
$ |
11,152 |
|
|
$ |
11,251 |
|
|
$ |
23,283 |
|
Gain on sale of real estate |
|
|
— |
|
|
|
— |
|
|
|
— |
|
|
|
— |
|
|
|
(388 |
) |
|
|
(1,057 |
) |
Impairment loss on real estate held for investment |
|
|
3,891 |
|
|
|
3,891 |
|
|
|
— |
|
|
|
— |
|
|
|
591 |
|
|
|
407 |
|
Gain from acquisition of equity method investment |
|
|
— |
|
|
|
— |
|
|
|
— |
|
|
|
— |
|
|
|
— |
|
|
|
(12,988 |
) |
EBITDAre |
|
$ |
(4,955 |
) |
|
$ |
(6,134 |
) |
|
$ |
10,729 |
|
|
$ |
11,152 |
|
|
$ |
11,454 |
|
|
$ |
9,645 |
|
Adjustment for current period investment activity (1) |
|
|
— |
|
|
|
1,354 |
|
|
|
— |
|
|
|
— |
|
|
|
— |
|
|
|
— |
|
Adjustment for current period disposition activity (2) |
|
|
— |
|
|
|
— |
|
|
|
— |
|
|
|
(244 |
) |
|
|
(392 |
) |
|
|
(36 |
) |
Adjustment for non-cash compensation expense (3) |
|
|
624 |
|
|
|
608 |
|
|
|
— |
|
|
|
— |
|
|
|
— |
|
|
|
— |
|
Adjustment to exclude non-recurring (income) expenses (4) |
|
|
16,238 |
|
|
|
16,760 |
|
|
|
(307 |
) |
|
|
(200 |
) |
|
|
(363 |
) |
|
|
1,361 |
|
Adjustment to exclude net write-offs of accrued rental income |
|
|
63 |
|
|
|
63 |
|
|
|
176 |
|
|
|
— |
|
|
|
— |
|
|
|
— |
|
Adjusted EBITDAre |
|
|
11,970 |
|
|
|
12,651 |
|
|
|
10,598 |
|
|
|
10,708 |
|
|
|
10,699 |
|
|
|
10,970 |
|
Annualized EBITDAre |
|
|
(19,820 |
) |
|
|
(24,536 |
) |
|
|
42,916 |
|
|
|
44,608 |
|
|
|
45,816 |
|
|
|
38,580 |
|
Annualized adjusted EBITDAre |
|
$ |
47,880 |
|
|
$ |
50,604 |
|
|
$ |
42,392 |
|
|
$ |
42,832 |
|
|
$ |
42,796 |
|
|
$ |
43,880 |
|
|
|
|
|
|
|
|
|
|
|
|
|
|
|
|
|
|
|
|
||||||
|
|
|
|
|
|
|
|
|
|
|
|
|
|
|
|
|
|
|
||||||
(1) |
Reflects an adjustment to give effect to all investments during the quarter as if they had been acquired as of the beginning of the quarter. |
(2) |
Reflects an adjustment to give effect to all dispositions during the quarter as if they had been sold as of the beginning of the quarter. |
(3) |
Reflects an adjustment to exclude non-cash stock-based compensation expense. |
(4) |
Reflects an adjustment to exclude non-recurring expenses including IPO costs, lease termination fees and non-recurring income or expense. |
FrontView REIT, Inc. | www.frontviewreit.com | 2025 FrontView REIT, Inc. All rights reserved. |
12 |
Net Debt Metrics
(in thousands)
|
|
December 31, |
|
|
December 31, |
|
|
September 30, |
|
|
June 30, |
|
|
March 31, |
|
|
December 31, |
|
||||||
|
|
Pro Forma |
|
|
Historical |
|
|
Historical |
|
|
Historical |
|
|
Historical |
|
|
Historical |
|
||||||
Debt |
|
|
|
|
|
|
|
|
|
|
|
|
|
|
|
|
|
|
||||||
Term Loan |
|
$ |
200,000 |
|
|
$ |
200,000 |
|
|
$ |
— |
|
|
$ |
— |
|
|
$ |
— |
|
|
$ |
— |
|
Revolving Credit Facility |
|
|
68,500 |
|
|
|
68,500 |
|
|
|
— |
|
|
|
— |
|
|
|
— |
|
|
|
— |
|
ABS Notes |
|
|
— |
|
|
|
— |
|
|
|
253,499 |
|
|
|
253,829 |
|
|
|
254,159 |
|
|
|
254,489 |
|
CIBC Revolving Credit Facility |
|
|
— |
|
|
|
— |
|
|
|
150,000 |
|
|
|
159,890 |
|
|
|
159,890 |
|
|
|
168,890 |
|
CIBC Term Loan |
|
|
— |
|
|
|
— |
|
|
|
15,967 |
|
|
|
15,967 |
|
|
|
17,000 |
|
|
|
17,000 |
|
Gross Debt |
|
|
268,500 |
|
|
|
268,500 |
|
|
|
419,466 |
|
|
|
429,686 |
|
|
|
431,049 |
|
|
|
440,379 |
|
Cash, cash equivalents and restricted cash |
|
|
(5,094 |
) |
|
|
(5,094 |
) |
|
|
(9,895 |
) |
|
|
(16,620 |
) |
|
|
(13,197 |
) |
|
|
(17,129 |
) |
Net Debt |
|
$ |
263,406 |
|
|
$ |
263,406 |
|
|
$ |
409,571 |
|
|
$ |
413,066 |
|
|
$ |
417,852 |
|
|
$ |
423,250 |
|
Net Debt to Annualized EBITDAre |
|
|
(13.3 |
) |
|
|
(10.7 |
) |
|
|
9.5 |
|
|
|
9.3 |
|
|
|
9.1 |
|
|
|
11.0 |
|
Net Debt to Annualized Adjusted EBITDAre |
|
|
5.5 |
|
|
|
5.2 |
|
|
|
9.7 |
|
|
|
9.6 |
|
|
|
9.8 |
|
|
|
9.6 |
|
Covenants
The following is a summary of key financial covenants for the Company’s unsecured debt instruments. The covenants associated with the Revolving Credit Facility are reported to the respective lenders via quarterly covenant reporting packages. These calculations, which are not based on U.S. GAAP measurements, are presented to investors to show that as of December 31, 2024, the Company believes it is in compliance with the covenants.
Covenants |
|
Required |
|
Revolving Credit Facility |
Total Leverage Ratio |
|
≤ 60% |
|
35.5% |
Adjusted EBITDA to Fixed Charges Ratio |
|
≥ 1.50 to 1.00 |
|
2.0x |
Secured Leverage Ratio(1) |
|
≤ 40% |
|
0.0% |
Unencumbered NOI to Unsecured Interest Expense Ratio |
|
≥ 1.75 to 1.00 |
|
3.5x |
Unsecured Leverage Ratio |
|
≤ 60% |
|
35.5% |
Tangible Net Worth |
|
≥ sum of 75% of the Tangible Net Worth on completion of this offering plus 70% of equity issuance proceeds |
|
(2) |
(1) |
IPO Proceeds used to payoff debt such that no secured borrowings. |
(2) |
Prospective Covenant. |
FrontView REIT, Inc. | www.frontviewreit.com | 2025 FrontView REIT, Inc. All rights reserved. |
13 |
Dispositions
(in thousands, except # of properties)
The following table summarizes the Company’s property disposition activity during 2024.
Property |
|
# of Properties |
|
Original Purchase Price |
|
|
Sale Price |
|
|
Lease Termination Fee(1) |
|
|
Gain over Original Purchase Price |
|
||||
Occupied(2) |
|
4 |
|
$ |
9,148 |
|
|
$ |
9,616 |
|
|
$ |
475 |
|
|
$ |
943 |
|
Vacant(3) |
|
1 |
|
$ |
1,154 |
|
|
$ |
1,157 |
|
|
$ |
- |
|
|
$ |
3 |
|
Total Dispositions |
|
5 |
|
$ |
10,302 |
|
|
$ |
10,773 |
|
|
$ |
475 |
|
|
$ |
946 |
|
(1) |
Includes lease termination fees paid to FrontView REIT, Inc at closing. |
(2) |
Three occupied properties were sold in Q1 2024, and one occupied property was sold in Q2 2024. |
(3) |
One vacant property was sold in Q2 2024. |
Portfolio at a Glance: Key Metrics
|
|
December 31, 2024 |
|
September 30, 2024 |
|
June 30, 2024 |
Properties |
|
307 |
|
278 |
|
278 |
U.S. States |
|
35 |
|
31 |
|
31 |
Total Annualized Base Rent |
|
$58.8M |
|
$52.1M |
|
$52.0M |
Total Rentable Sq. Footage |
|
2.4M |
|
2.1M |
|
2.1M |
Tenants |
|
320 |
|
293 |
|
292 |
Brands |
|
150 |
|
137 |
|
137 |
Industries |
|
15 |
|
15 |
|
15 |
Occupancy |
|
97.7% |
|
98.9% |
|
98.9% |
Top 10 Tenant Concentration |
|
21.8% |
|
23.3% |
|
23.3% |
Top 20 Tenant Concentration |
|
37.0% |
|
38.5% |
|
38.5% |
Investment Grade (tenant/guarantor) |
|
33.1% |
|
38.0% |
|
40.4% |
Financial Reporting Coverage(1) |
|
79.4% |
|
81.6% |
|
81.6% |
Weighted Average Remaining Lease Term |
|
7.2 Years |
|
6.7 Years |
|
7.0 Years |
(1) |
Includes tenants not required to provide financial information under the terms of our lease, but whose financial statements are available publicly at December 31, 2024. |
FrontView REIT, Inc. | www.frontviewreit.com | 2025 FrontView REIT, Inc. All rights reserved. |
14 |
Diversification: Top 20 Tenants
(in thousands, except for percentages and # of properties)
Tenant Brand |
|
# of Properties(1) |
|
|
Square Feet |
|
|
ABR |
|
|
% of ABR |
|
% of Square Feet |
|||
Fast Pace Urgent Care |
|
|
8 |
|
|
|
29 |
|
|
$ |
1,723 |
|
|
2.9% |
|
1.2% |
Verizon |
|
|
8 |
|
|
|
35 |
|
|
|
1,581 |
|
|
2.7% |
|
1.5% |
Adams Auto Group |
|
|
3 |
|
|
|
29 |
|
|
|
1,412 |
|
|
2.4% |
|
1.3% |
Oak Street Health |
|
|
5.5 |
|
|
|
66 |
|
|
|
1,314 |
|
|
2.2% |
|
2.8% |
IHOP |
|
|
6 |
|
|
|
33 |
|
|
|
1,213 |
|
|
2.1% |
|
1.4% |
Mammoth Car Wash |
|
|
6 |
|
|
|
22 |
|
|
|
1,205 |
|
|
2.0% |
|
0.9% |
Raising Canes |
|
|
6 |
|
|
|
21 |
|
|
|
1,202 |
|
|
2.0% |
|
0.9% |
Dollar Tree |
|
|
8 |
|
|
|
95 |
|
|
|
1,096 |
|
|
1.9% |
|
4.0% |
CVS |
|
|
4 |
|
|
|
42 |
|
|
|
1,081 |
|
|
1.8% |
|
1.7% |
AT&T |
|
|
4 |
|
|
|
24 |
|
|
|
1,063 |
|
|
1.8% |
|
1.0% |
T-Mobile |
|
|
7.5 |
|
|
|
26 |
|
|
|
1,031 |
|
|
1.8% |
|
1.1% |
Chili's |
|
|
3 |
|
|
|
18 |
|
|
|
973 |
|
|
1.7% |
|
0.7% |
Bank of America |
|
|
4 |
|
|
|
21 |
|
|
|
966 |
|
|
1.6% |
|
0.9% |
Wendy's |
|
|
7 |
|
|
|
21 |
|
|
|
942 |
|
|
1.6% |
|
0.9% |
Wells Fargo |
|
|
2.5 |
|
|
|
13 |
|
|
|
871 |
|
|
1.5% |
|
0.5% |
Advance Auto Parts |
|
|
7 |
|
|
|
66 |
|
|
|
857 |
|
|
1.5% |
|
2.7% |
Walgreens |
|
|
3 |
|
|
|
38 |
|
|
|
854 |
|
|
1.5% |
|
1.6% |
St. Joseph Hospice |
|
|
2 |
|
|
|
37 |
|
|
|
832 |
|
|
1.4% |
|
1.5% |
Heartland Dental |
|
|
5 |
|
|
|
20 |
|
|
|
792 |
|
|
1.3% |
|
0.8% |
Burger King |
|
|
5 |
|
|
|
20 |
|
|
|
762 |
|
|
1.3% |
|
0.8% |
Other |
|
|
202.5 |
|
|
|
1725 |
|
|
|
37,073 |
|
|
63.0% |
|
71.8% |
Total |
|
|
307 |
|
|
|
2,401 |
|
|
$ |
58,843 |
|
|
100.0% |
|
100.0% |
(1) |
Includes two-tenant properties. |
FrontView REIT, Inc. | www.frontviewreit.com | 2025 FrontView REIT, Inc. All rights reserved. |
15 |
Diversification: Tenant Industry
(rent percentages based on ABR)
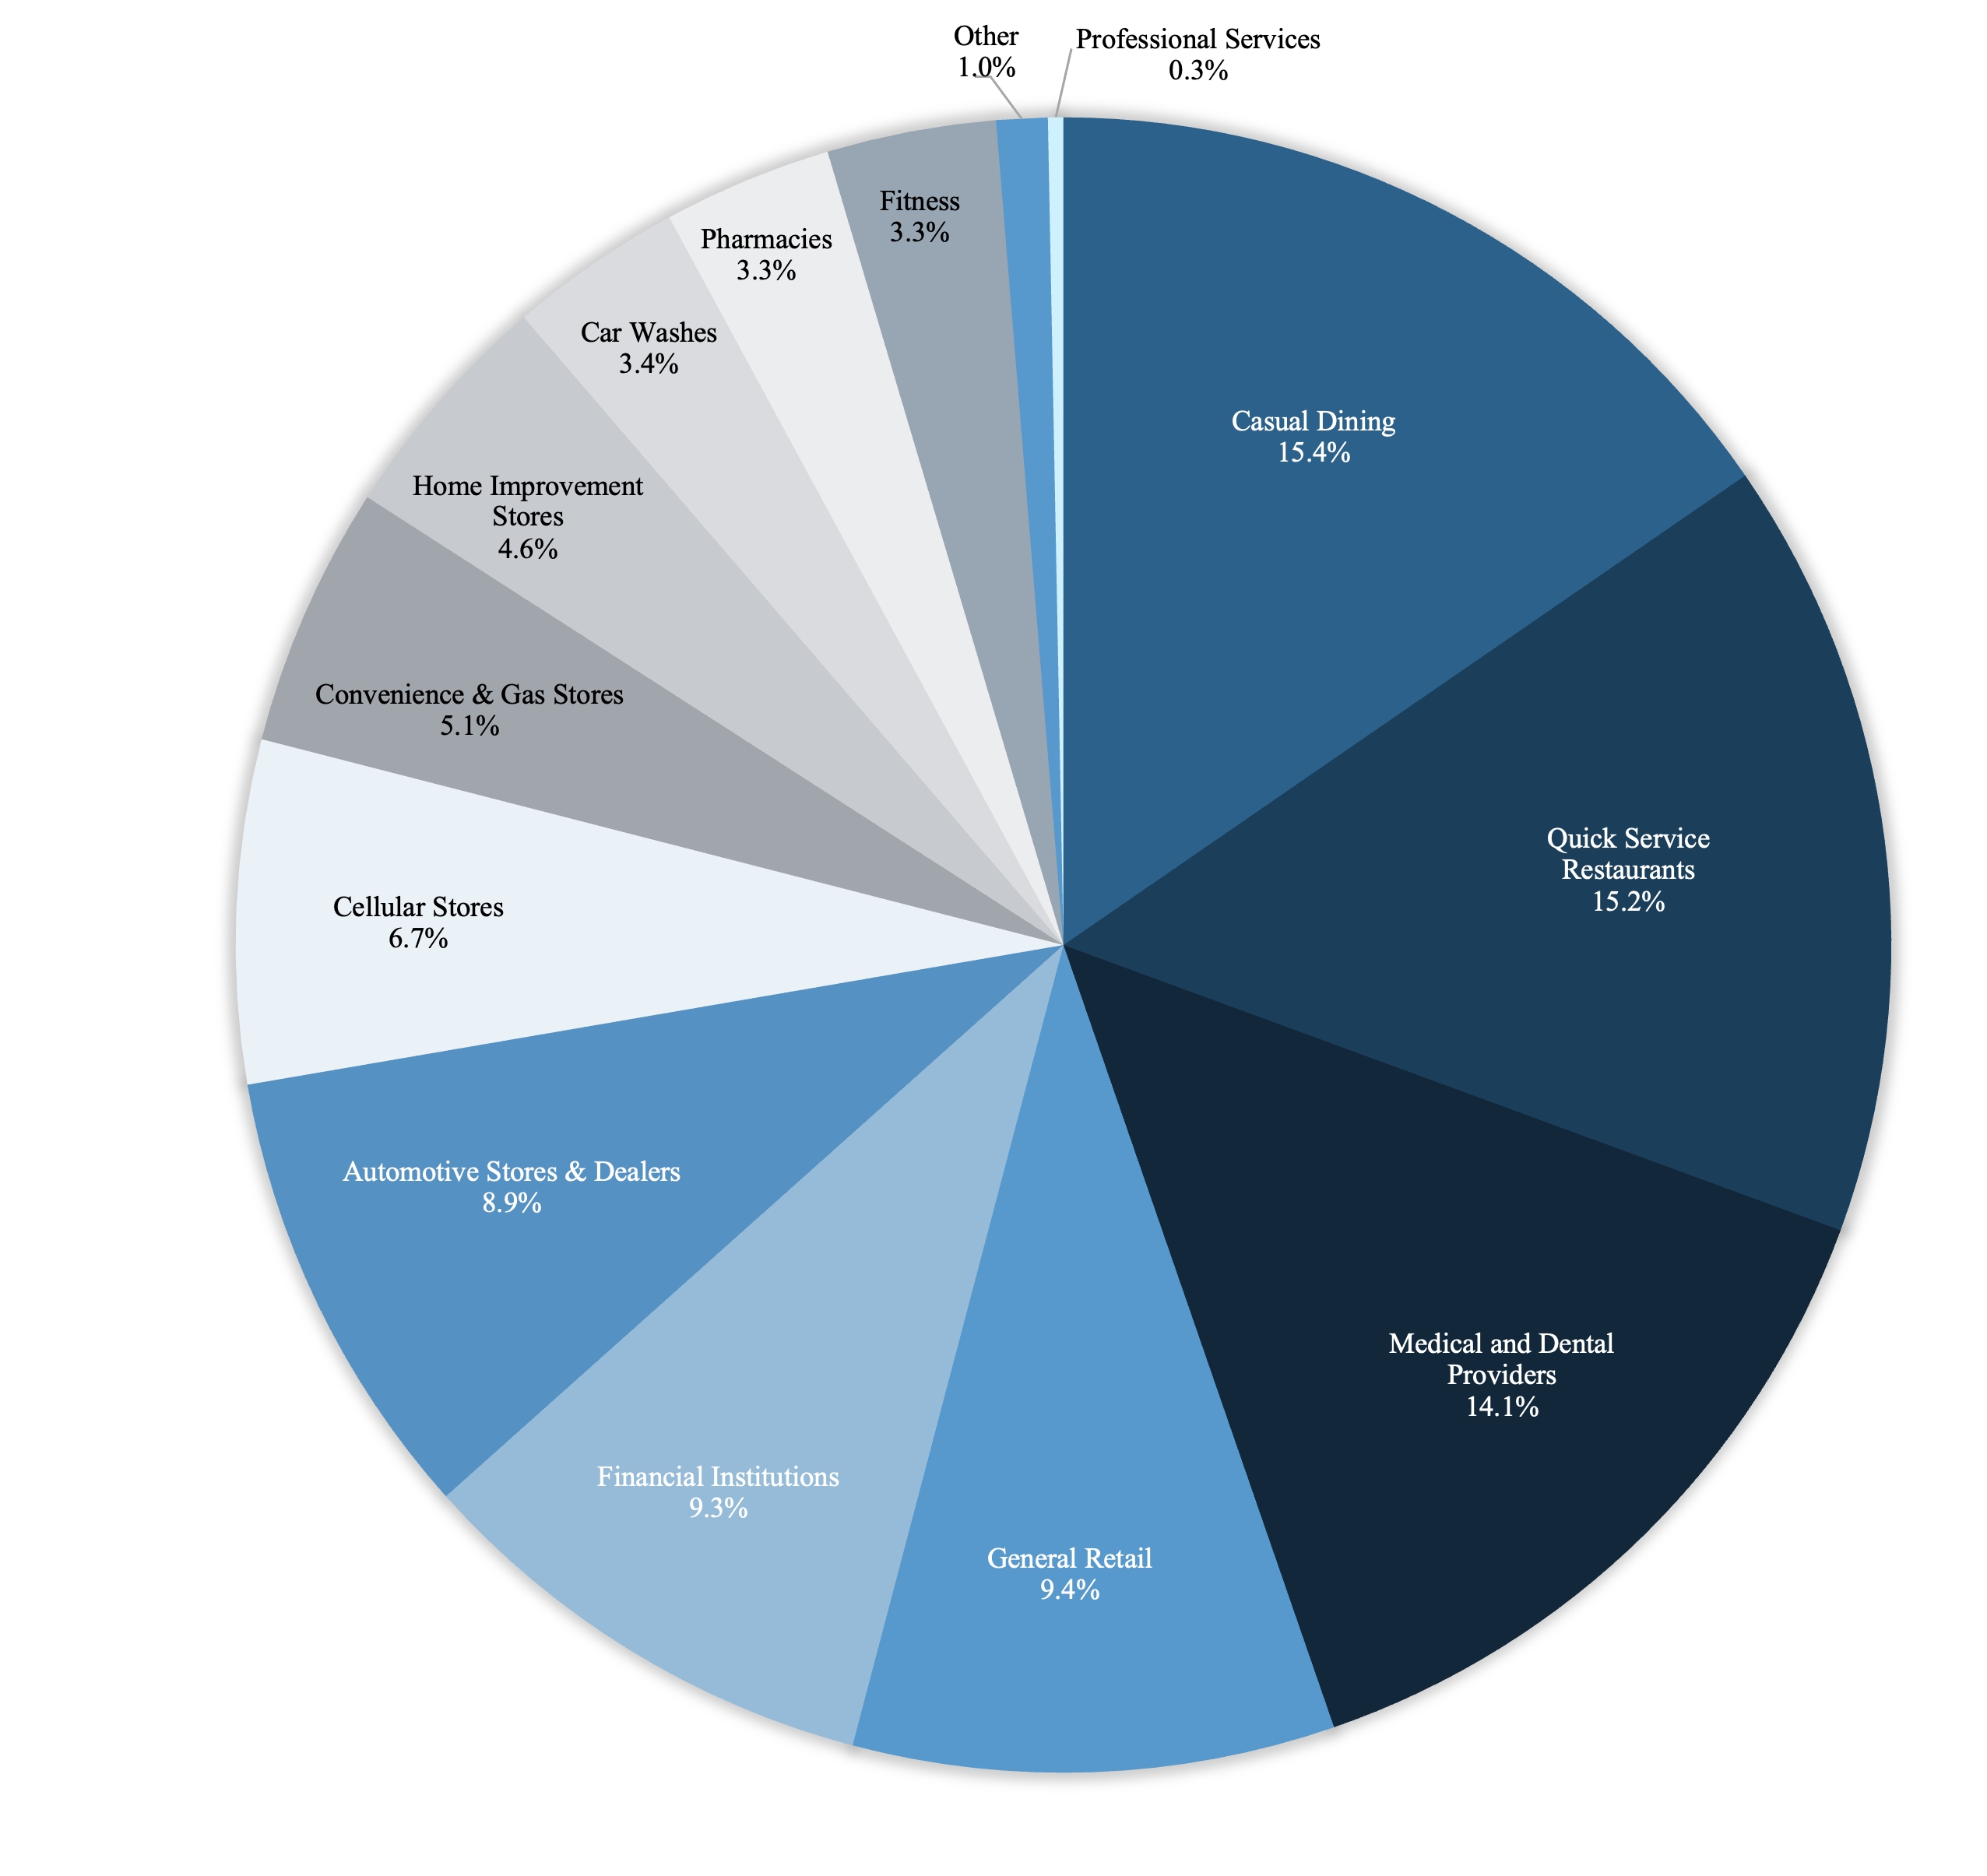
FrontView REIT, Inc. | www.frontviewreit.com | 2025 FrontView REIT, Inc. All rights reserved. |
16 |
Diversification: Tenant Industry (continued)
(in thousands, except for percentages and # of properties)
Industry |
|
# of Properties(1) |
|
|
ABR |
|
|
% of ABR |
|
Square Feet |
|
|
% of Square Feet |
|||
Casual Dining |
|
|
44 |
|
|
$ |
9,040 |
|
|
15.4% |
|
|
282 |
|
|
11.7% |
Quick Service Restaurants |
|
|
62.5 |
|
|
|
8,953 |
|
|
15.2% |
|
|
206 |
|
|
8.6% |
Medical and Dental Providers |
|
|
41 |
|
|
|
8,297 |
|
|
14.1% |
|
|
256 |
|
|
10.7% |
General Retail |
|
|
26 |
|
|
|
5,544 |
|
|
9.4% |
|
|
503 |
|
|
20.9% |
Financial Institutions |
|
|
24 |
|
|
|
5,496 |
|
|
9.3% |
|
|
138 |
|
|
5.7% |
Automotive Stores & Dealers |
|
|
30 |
|
|
|
5,231 |
|
|
8.9% |
|
|
246 |
|
|
10.2% |
Cellular Stores |
|
|
21 |
|
|
|
3,969 |
|
|
6.7% |
|
|
96 |
|
|
4.0% |
Convenience & Gas Stores |
|
|
16 |
|
|
|
2,983 |
|
|
5.1% |
|
|
43 |
|
|
1.8% |
Home Improvement Stores |
|
|
8 |
|
|
|
2,701 |
|
|
4.6% |
|
|
323 |
|
|
13.5% |
Car Washes |
|
|
10 |
|
|
|
2,022 |
|
|
3.4% |
|
|
33 |
|
|
1.4% |
Pharmacies |
|
|
7 |
|
|
|
1,935 |
|
|
3.3% |
|
|
81 |
|
|
3.4% |
Fitness |
|
|
4 |
|
|
|
1,918 |
|
|
3.3% |
|
|
118 |
|
|
4.9% |
Other |
|
|
12.5 |
|
|
|
581 |
|
|
1.0% |
|
|
72 |
|
|
3.0% |
Professional Services |
|
|
1 |
|
|
|
173 |
|
|
0.3% |
|
|
4 |
|
|
0.2% |
Total |
|
|
307 |
|
|
$ |
58,843 |
|
|
100.0% |
|
|
2,401 |
|
|
100.0% |
(1) |
Includes two-tenant properties. |
FrontView REIT, Inc. | www.frontviewreit.com | 2025 FrontView REIT, Inc. All rights reserved. |
17 |
Diversification: Property Map
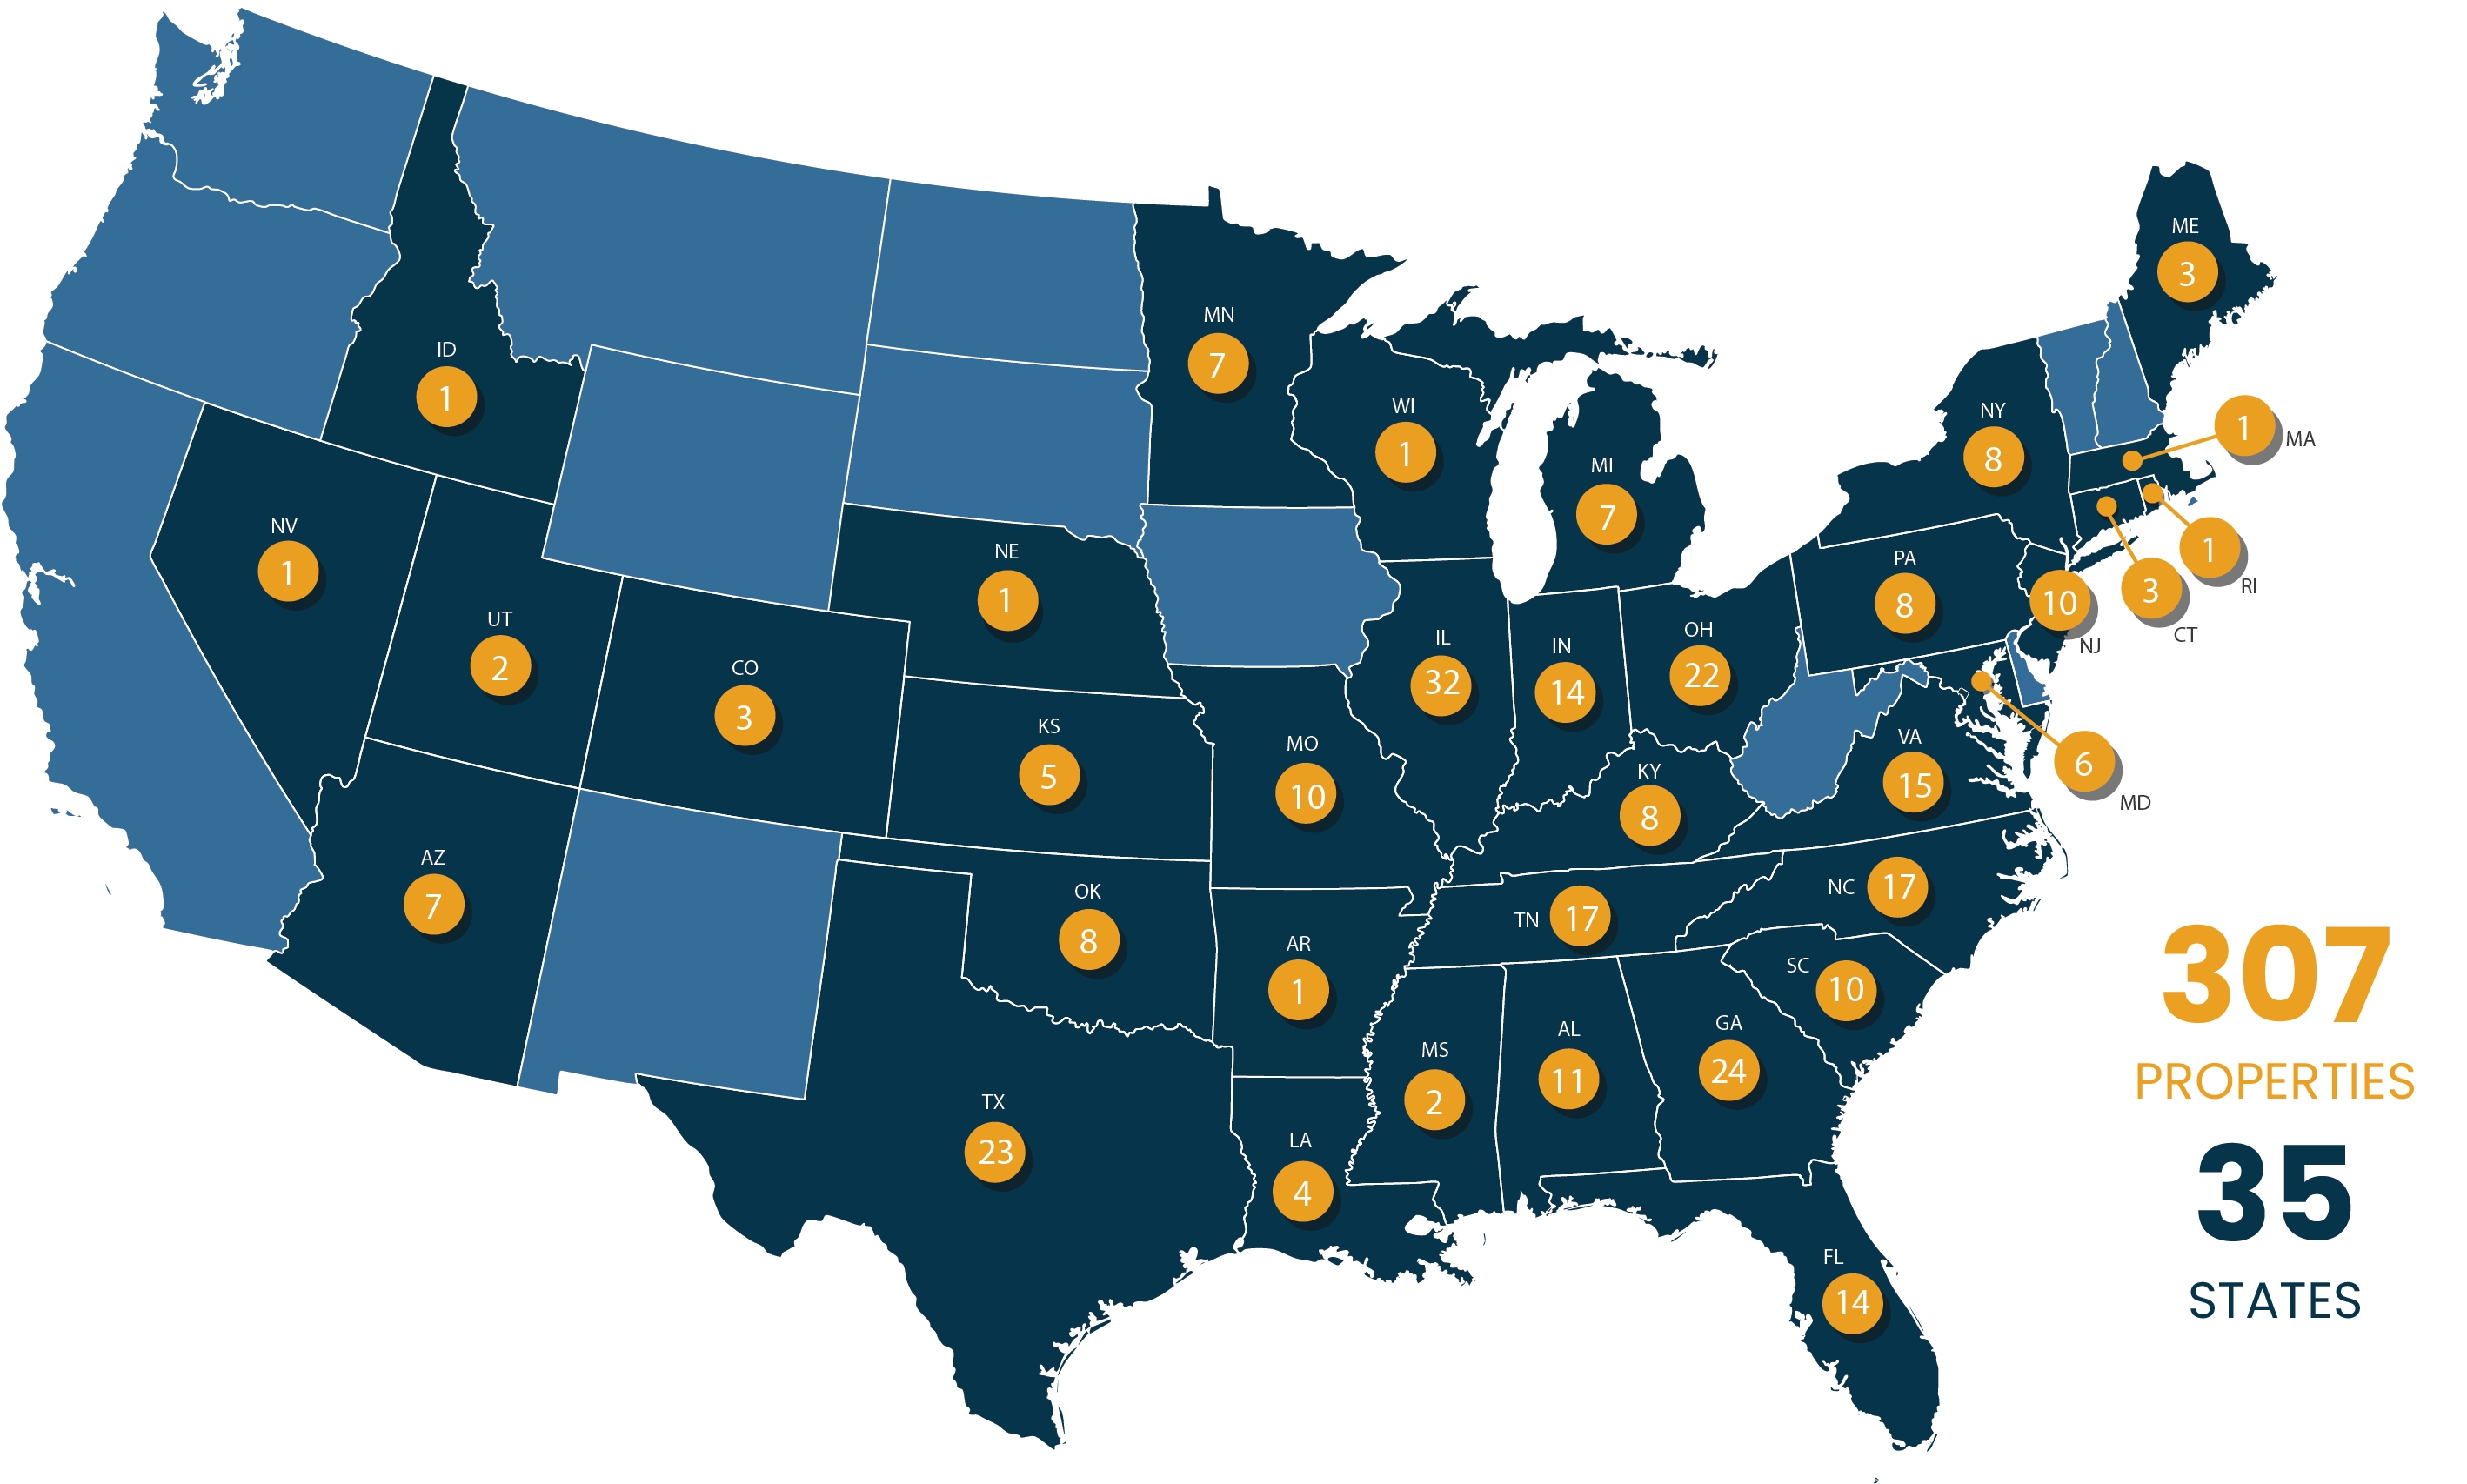
FrontView REIT, Inc. | www.frontviewreit.com | 2025 FrontView REIT, Inc. All rights reserved. |
18 |
Diversification: Geography
(in thousands, except for percentages and # of properties)
State |
|
# of Properties(1) |
|
|
Square Feet |
|
|
ABR |
|
|
% of Square Feet |
|
% of ABR |
|||
IL |
|
|
32 |
|
|
|
313 |
|
|
$ |
7,794 |
|
|
13.0% |
|
13.2% |
TX |
|
|
23 |
|
|
|
131 |
|
|
|
4,748 |
|
|
5.5% |
|
8.1% |
GA |
|
|
24 |
|
|
|
150 |
|
|
|
4,425 |
|
|
6.3% |
|
7.6% |
NC |
|
|
17 |
|
|
|
94 |
|
|
|
3,350 |
|
|
4.0% |
|
5.7% |
OH |
|
|
22 |
|
|
|
129 |
|
|
|
3,163 |
|
|
5.4% |
|
5.4% |
TN |
|
|
17 |
|
|
|
93 |
|
|
|
3,125 |
|
|
3.9% |
|
5.4% |
PA |
|
|
8 |
|
|
|
145 |
|
|
|
2,494 |
|
|
6.0% |
|
4.3% |
VA |
|
|
15 |
|
|
|
76 |
|
|
|
2,382 |
|
|
3.2% |
|
4.1% |
IN |
|
|
14 |
|
|
|
77 |
|
|
|
2,338 |
|
|
3.2% |
|
4.0% |
FL |
|
|
14 |
|
|
|
96 |
|
|
|
2,087 |
|
|
4.0% |
|
3.5% |
NY |
|
|
8 |
|
|
|
242 |
|
|
|
2,082 |
|
|
10.1% |
|
3.5% |
MO |
|
|
10 |
|
|
|
60 |
|
|
|
1,872 |
|
|
2.5% |
|
3.2% |
AL |
|
|
11 |
|
|
|
49 |
|
|
|
1,776 |
|
|
2.0% |
|
3.0% |
NJ |
|
|
10 |
|
|
|
55 |
|
|
|
1,658 |
|
|
2.3% |
|
2.8% |
SC |
|
|
10 |
|
|
|
73 |
|
|
|
1,588 |
|
|
3.0% |
|
2.7% |
OK |
|
|
8 |
|
|
|
38 |
|
|
|
1,543 |
|
|
1.6% |
|
2.6% |
AZ |
|
|
7 |
|
|
|
43 |
|
|
|
1,490 |
|
|
1.8% |
|
2.5% |
MN |
|
|
7 |
|
|
|
72 |
|
|
|
1,445 |
|
|
3.0% |
|
2.5% |
MD |
|
|
6 |
|
|
|
46 |
|
|
|
1,313 |
|
|
1.9% |
|
2.2% |
LA |
|
|
4 |
|
|
|
47 |
|
|
|
1,193 |
|
|
2.0% |
|
2.0% |
KY |
|
|
8 |
|
|
|
40 |
|
|
|
1,067 |
|
|
1.7% |
|
1.8% |
MI |
|
|
7 |
|
|
|
34 |
|
|
|
1,051 |
|
|
1.4% |
|
1.8% |
ME |
|
|
3 |
|
|
|
186 |
|
|
|
907 |
|
|
7.7% |
|
1.5% |
KS |
|
|
5 |
|
|
|
25 |
|
|
|
668 |
|
|
1.0% |
|
1.1% |
CT |
|
|
3 |
|
|
|
9 |
|
|
|
590 |
|
|
0.4% |
|
1.0% |
CO |
|
|
3 |
|
|
|
13 |
|
|
|
469 |
|
|
0.5% |
|
0.8% |
ID |
|
|
1 |
|
|
|
6 |
|
|
|
424 |
|
|
0.2% |
|
0.7% |
MS |
|
|
2 |
|
|
|
13 |
|
|
|
417 |
|
|
0.5% |
|
0.7% |
UT |
|
|
2 |
|
|
|
22 |
|
|
|
336 |
|
|
0.9% |
|
0.6% |
NV |
|
|
1 |
|
|
|
4 |
|
|
|
246 |
|
|
0.2% |
|
0.4% |
AR |
|
|
1 |
|
|
|
3 |
|
|
|
218 |
|
|
0.1% |
|
0.4% |
RI |
|
|
1 |
|
|
|
1 |
|
|
|
182 |
|
|
0.0% |
|
0.3% |
NE |
|
|
1 |
|
|
|
9 |
|
|
|
144 |
|
|
0.4% |
|
0.2% |
MA |
|
|
1 |
|
|
|
2 |
|
|
|
143 |
|
|
0.1% |
|
0.2% |
WI |
|
|
1 |
|
|
|
5 |
|
|
|
115 |
|
|
0.2% |
|
0.2% |
Total |
|
|
307 |
|
|
|
2,401 |
|
|
$ |
58,843 |
|
|
100.0% |
|
100.0% |
(1) |
Includes two-tenant properties. |
FrontView REIT, Inc. | www.frontviewreit.com | 2025 FrontView REIT, Inc. All rights reserved. |
19 |
Lease Expirations
(in thousands; based on ABR)

Year |
|
ABR |
|
|
% of ABR |
|
Square Feet |
|
|
% of Square Feet |
||
2024 |
|
$ |
159 |
|
|
0.2% |
|
|
3 |
|
|
0.1% |
2025 |
|
|
1,631 |
|
|
2.8% |
|
|
43 |
|
|
1.8% |
2026 |
|
|
3,198 |
|
|
5.4% |
|
|
108 |
|
|
4.5% |
2027 |
|
|
6,875 |
|
|
11.7% |
|
|
382 |
|
|
16.0% |
2028 |
|
|
4,587 |
|
|
7.8% |
|
|
159 |
|
|
6.6% |
2029 |
|
|
6,048 |
|
|
10.3% |
|
|
210 |
|
|
8.7% |
2030 |
|
|
5,885 |
|
|
10.0% |
|
|
194 |
|
|
8.1% |
2031 |
|
|
4,729 |
|
|
8.0% |
|
|
149 |
|
|
6.2% |
2032 |
|
|
5,344 |
|
|
9.1% |
|
|
415 |
|
|
17.3% |
2033 |
|
|
2,786 |
|
|
4.7% |
|
|
85 |
|
|
3.5% |
2034 |
|
|
3,623 |
|
|
6.2% |
|
|
133 |
|
|
5.5% |
2035 |
|
|
894 |
|
|
1.5% |
|
|
49 |
|
|
2.0% |
2036 |
|
|
1,645 |
|
|
2.8% |
|
|
46 |
|
|
1.9% |
2037 |
|
|
2,160 |
|
|
3.7% |
|
|
88 |
|
|
3.7% |
2038 |
|
|
2,939 |
|
|
5.0% |
|
|
167 |
|
|
7.0% |
2039 |
|
|
1,954 |
|
|
3.3% |
|
|
39 |
|
|
1.6% |
Thereafter |
|
|
4,386 |
|
|
7.5% |
|
|
104 |
|
|
4.4% |
Untenanted Properties |
|
|
0 |
|
|
0.0% |
|
|
27 |
|
|
1.1% |
Total |
|
$ |
58,843 |
|
|
100.0% |
|
|
2,401 |
|
|
100.0% |
FrontView REIT, Inc. | www.frontviewreit.com | 2025 FrontView REIT, Inc. All rights reserved. |
20 |
Definitions and Explanations
Adjusted Secured Overnight Financing Rate (SOFR): We define Adjusted SOFR as the current one month term SOFR plus an adjustment of 0.10% per the terms of our credit facilities.
Annualized Base Rent (ABR): We define ABR as the annualized contractual cash rent due for the last month of the reporting period, and adjusted to remove rent from properties sold during the month and to include a full month of contractual cash rent for properties acquired during the last month of the reporting period
EBITDA, EBITDAre, Adjusted EBITDAre, and Annualized Adjusted EBITDAre: EBITDA, EBITDAre, Adjusted EBITDAre, and Annualized Adjusted EBITDAre are non-GAAP financial measures. We compute EBITDA as earnings before interest, income taxes and depreciation and amortization. EBITDA is a measure commonly used in our industry. We believe that this ratio provides investors and analysts with a measure of our leverage that includes our operating results unaffected by the differences in capital structures, capital investment cycles and useful life of related assets compared to other companies in our industry. In 2017, Nareit issued a white paper recommending that companies that report EBITDA also report EBITDAre in financial reports. We compute EBITDAre in accordance with the definition adopted by Nareit. Nareit defines EBITDAre as EBITDA (as defined above) excluding gains (loss) from the sales of depreciable property and provisions for impairment on investment in real estate. We also exclude the gain from acquisition of equity method investment as the gain represents a one-time transaction for the purchase of the 50% interest held by our predecessor’s sole partner in the 50/50 Joint Venture. As the gain will not recur in the future, it is excluded from EBITDAre. We believe EBITDA and EBITDAre are useful to investors and analysts because they provide important supplemental information about our operating performance exclusive of certain non-cash and other costs. We compute adjusted EBITDAre as EBITDAre for the applicable quarter, as adjusted to (i) reflect all investment and disposition activity that took place during the applicable quarter as if each transaction had been completed on the first day of the quarter, (ii) exclude certain GAAP income and expense amounts that we believe are infrequent and unusual in nature because they relate to unique circumstances or transactions that had not previously occurred and which we do not anticipate occurring in the future, (iii) eliminate the impact of lease termination fees from certain of our tenants, and (iv) exclude non-cash stock-based compensation expense. Annualized adjusted EBITDAre is calculated by multiplying adjusted EBITDAre for the applicable quarter by four, which we believe provides a meaningful estimate of our current run rate for all of our investments as of the end of the most recently completed quarter given the contractual nature of our long-term net leases. You should not unduly rely on this measure as it is based on assumptions and estimates that may prove to be inaccurate. Our actual reported EBITDAre for future periods may be significantly different from our annualized adjusted EBITDAre. Our reported EBITDA, EBITDAre, Adjusted EBITDAre, and Annualized Adjusted EBITDAre may not be comparable to similarly titled measures of other companies. You should not consider these measures as alternatives to net income or cash flows from operating activities determined in accordance with GAAP.
Funds From Operations (FFO) and Adjusted Funds From Operations (AFFO): FFO and AFFO are non-GAAP measures. We believe the use of FFO and AFFO are useful to investors because they are widely accepted industry measures used by analysts and investors to compare the operating performance of REITs. FFO and AFFO should not be considered alternatives to net income as a performance measure or to cash flows from operations, as reported on our statement of cash flows, or as a liquidity measure and should be considered in addition to, and not in lieu of, GAAP financial measures. We compute FFO in accordance with the standards established by the Board of Governors of Nareit. Nareit defines FFO as GAAP net income or loss adjusted to exclude net gains (losses) from sales of certain depreciated real estate assets, depreciation and amortization expense from real estate assets, gains and losses from change in control, and impairment charges related to certain previously depreciated real estate assets. We also exclude the gain from acquisition of equity method investment as the gain represents a one-time transaction for the purchase of the 50% interest held by our predecessor’s sole partner in the 50/50 Joint Venture. As the gain will not recur in the future, it is excluded from FFO. To derive AFFO, we modify the Nareit computation of FFO to include other adjustments to GAAP net income related to certain non-cash or non-recurring revenues and expenses, including straight-line rents, cost of debt extinguishments, amortization of lease intangibles, amortization of debt issuance costs, amortization of net mortgage premiums, (gain) loss on interest rate swaps and other non-cash interest expense, realized gains or losses on foreign currency transactions, Internalization expenses, structuring and public company readiness costs, extraordinary items, and other specified non-cash items. We believe that such items are not a result of normal operations and thus we believe excluding such items assists management and investors in distinguishing whether changes in our operations are due to growth or decline of operations at our properties or from other factors.
Gross Debt: We define Gross Debt as total debt, net plus debt issuance costs and original issuance discount.
Net Debt: Net Debt is a non-GAAP financial measure. We define Net Debt as our Debt less cash and cash equivalents and restricted cash.
Occupancy: Occupancy or a specified percentage of our portfolio that is “occupied” or “leased” means as of a specified date (i) the number of properties that are subject to a signed lease divided by (ii) the total number of properties in our portfolio.
FrontView REIT, Inc. | www.frontviewreit.com | 2025 FrontView REIT, Inc. All rights reserved. |
21 |


