UNITED STATES
SECURITIES AND EXCHANGE COMMISSION
Washington, D.C. 20549
FORM 10-K
(Mark One)
☒ |
ANNUAL REPORT PURSUANT TO SECTION 13 OR 15(d) OF THE SECURITIES EXCHANGE ACT OF 1934 |
For the fiscal year ended April 30, 2022
OR
☐ |
TRANSITION REPORT PURSUANT TO SECTION 13 OR 15(d) OF THE SECURITIES EXCHANGE ACT OF 1934 FOR THE TRANSITION PERIOD FROM TO |
Commission File Number 001-33731
METHODE ELECTRONICS, INC.
(Exact name of Registrant as specified in its charter)
Delaware |
36-2090085 |
(State or other jurisdiction of |
(IRS Employer |
incorporation or organization) |
Identification No.) |
8750 West Bryn Mawr Avenue, Suite 1000 |
|
Chicago, Illinois |
60631-3518 |
(Address of Principal Executive Offices) |
(Zip Code) |
Registrant’s telephone number (including area code): (708) 867-6777
Securities registered pursuant to Section 12(b) of the Act:
|
|
Name of each exchange |
Title of each Class |
Trading Symbol(s) |
on which registered |
Common Stock, $0.50 Par Value |
MEI |
New York Stock Exchange |
Securities registered pursuant to Section 12(g) of the Act: None
Indicate by check mark if the Registrant is a well-known seasoned issuer, as defined in Rule 405 of the Securities Act. Yes ☒ No ☐
Indicate by check mark if the Registrant is not required to file reports pursuant to Section 13 or Section 15(d) of the Act. Yes ☐ No ☒
Indicate by check mark whether the Registrant (1) has filed all reports required to be filed by Section 13 or 15 (d) of the Securities Exchange Act of 1934 during the preceding 12 months (or for such shorter period that the Registrant was required to file such reports), and (2) has been subject to such filing requirements for the past 90 days. Yes ☒ No ☐
Indicate by check mark whether the registrant has submitted electronically every Interactive Data File required to be submitted pursuant to Rule 405 of Regulation S-T during the preceding 12 months (or for such shorter period that the registrant was required to submit such files). Yes ☒ No ☐
Indicate by check mark whether the registrant is a large accelerated filer, an accelerated filer, a non-accelerated filer, a smaller reporting company, or an emerging growth company. See the definitions of “large accelerated filer,” “accelerated filer,” “smaller reporting company,” and “emerging growth company” in Rule 12b-2 of the Exchange Act.
Large Accelerated filer ☒ |
|
Accelerated filer ☐ |
Non-accelerated filer ☐ |
|
Smaller reporting company ☐ |
Emerging Growth Company ☐ |
|
|
If an emerging growth company, indicate by check mark if the registrant has elected not to use the extended transition period for complying with any new or revised financial accounting standards provided pursuant to Section 13(a) of the Exchange Act. ☐
Indicate by check mark whether the registrant has filed a report on and attestation to its management’s assessment of the effectiveness of its internal control over financial reporting under Section 404(b) of the Sarbanes-Oxley Act (15 U.S.C. 7262(b)) by the registered public accounting firm that prepared or issued its audit report. ☒
Indicate by check mark whether the registrant is a shell company (as defined in Rule 12b-2 of the Act). Yes ☐ No ☒
The aggregate market value of common stock held by non-affiliates of the Registrant on October 29, 2021, based upon the closing price on that date as reported by the New York Stock Exchange, was $1.1 billion.
Registrant had 38,303,809 shares of its common stock outstanding as of June 15, 2022.
DOCUMENTS INCORPORATED BY REFERENCE
Portions of the registrant’s definitive Proxy Statement for the 2022 annual shareholders' meeting to be held on September 14, 2022 are incorporated by reference into Part III of this Form 10-K.
METHODE ELECTRONICS, INC.
FORM 10-K
TABLE OF CONTENTS
Item 1. |
2 |
|
Item 1A. |
5 |
|
Item 1B. |
13 |
|
Item 2. |
13 |
|
Item 3. |
14 |
|
Item 4. |
14 |
|
|
|
|
Item 5. |
15 |
|
Item 6. |
[Reserved] |
16 |
Item 7. |
Management’s Discussion and Analysis of Financial Condition and Results of Operations |
17 |
Item 7A. |
26 |
|
Item 8. |
26 |
|
Item 9. |
Changes in and Disagreements with Accountants on Accounting and Financial Disclosure |
26 |
Item 9A. |
27 |
|
Item 9B. |
27 |
|
Item 9C. |
Disclosure Regarding Foreign Jurisdictions that Prevent Inspections |
27 |
|
|
|
Item 10. |
28 |
|
Item 11. |
28 |
|
Item 12. |
Security Ownership of Certain Beneficial Owners and Management and Related Stockholder Matters |
28 |
Item 13. |
Certain Relationships and Related Transactions, and Director Independence |
28 |
Item 14. |
28 |
|
|
|
|
Item 15. |
29 |
|
Item 16. |
30 |
|
PART I
As used herein, “we,” “us,” “our,” the “Company” or “Methode” means Methode Electronics, Inc. and its subsidiaries.
CAUTIONARY STATEMENT REGARDING FORWARD-LOOKING STATEMENTS
This Annual Report on Form 10-K (“this Annual Report”) includes forward-looking statements within the meaning of the Private Securities Litigation Reform Act of 1995 that reflect, when made, our current views with respect to current events and financial performance. Such forward-looking statements are subject to many risks, uncertainties and factors relating to our operations and business environment, which may cause our actual results to be materially different from any future results, expressed or implied, by such forward-looking statements. All statements that address future operating, financial or business performance or our strategies or expectations are forward-looking statements. In some cases, you can identify these statements by forward-looking words such as “may,” “might,” “will,” “should,” “expects,” “plans,” “intends,” “anticipates,” “believes,” “estimates,” “predicts,” “projects,” “potential,” “outlook” or “continue,” and other comparable terminology. Factors that could cause actual results to differ materially from these forward-looking statements include, but are not limited to, the following:
Additional details and factors are discussed under the caption “Risk Factors” in this Annual Report. New risks and uncertainties arise from time to time, and it is impossible for us to predict these events or how they may affect us. Any forward-looking statements made by us speak only as of the date on which they are made. We are under no obligation to, and expressly disclaim any obligation to, update or alter our forward-looking statements, whether as a result of new information, subsequent events or otherwise.
1
Item 1. Business
Description of Business
We are a leading global supplier of custom engineered solutions with sales, engineering and manufacturing locations in North America, Europe, Middle East and Asia. We design, engineer and produce mechatronic products for Original Equipment Manufacturers (“OEMs”) utilizing our broad range of technologies for user interface, light-emitting diode (“LED”) lighting system, power distribution and sensor applications.
Our solutions are found in the end markets of transportation (including automotive, commercial vehicle, e-bike, aerospace, bus and rail), cloud computing infrastructure, construction equipment, consumer appliance and medical devices.
Fiscal Year
We maintain our financial records on the basis of a 52 or 53-week fiscal year ending on the Saturday closest to April 30. Fiscal 2022 ended on April 30, 2022 and fiscal 2021 ended on May 1, 2021, which represented 52 weeks of results for each year. Fiscal 2020 ended on May 2, 2020, which represented 53 weeks of results.
Operating Segments
Our business is managed, and our financial results are reported, based on the following four segments: Automotive, Industrial, Interface and Medical. See Note 15, “Segment Information and Geographic Area Information” to our consolidated financial statements in this Annual Report for further information.
The Automotive segment supplies electronic and electro-mechanical devices and related products to automobile OEMs, either directly or through their tiered suppliers. Our products include integrated center consoles, hidden switches, ergonomic switches, transmission lead-frames, LED-based lighting, and sensors which incorporate magneto-elastic sensing and other technologies that monitor the operation or status of a component or system.
The Industrial segment manufactures external lighting solutions, industrial safety radio remote controls, braided flexible cables, current-carrying laminated busbars and devices, custom power-product assemblies, such as our PowerRail® solution, high-current low-voltage flexible power cabling systems and powder-coated busbars that are used in various markets and applications, including aerospace, cloud computing, commercial vehicles, industrial, military, power conversion and transportation.
The Interface segment provides a variety of copper-based transceivers and related accessories for the cloud computing hardware equipment and telecommunications broadband equipment markets, user interface solutions for the appliance, commercial food service, and point-of-sale equipment markets, and fluid-level sensors for the marine/recreational vehicle and sump pump markets.
The Medical segment is made up of our medical device business, Dabir Surfaces, Inc. (“Dabir Surfaces”), our surface support technology aimed at pressure injury prevention. Dabir Surfaces has developed the technology for use by patients who are immobilized or otherwise at risk for pressure injuries, including patients undergoing long-duration surgical procedures.
The following table reflects the percentage of net sales by segment for the last three fiscal years.
|
|
Fiscal Year Ended |
|
|||||||||
|
|
April 30, 2022 |
|
|
May 1, 2021 |
|
|
May 2, 2020 |
|
|||
Automotive |
|
|
67.2 |
% |
|
|
69.4 |
% |
|
|
69.5 |
% |
Industrial |
|
|
27.3 |
% |
|
|
24.6 |
% |
|
|
24.6 |
% |
Interface |
|
|
5.1 |
% |
|
|
5.7 |
% |
|
|
5.7 |
% |
Medical |
|
|
0.4 |
% |
|
|
0.3 |
% |
|
|
0.2 |
% |
Sales and Marketing
The majority of our sales activities are directed by sales managers who are supported by field application engineers and other technical personnel who work with customers to design our products into their systems. Our field application engineers also help us identify emerging markets and new products. Our products are primarily sold through our in-house sales staff. We also utilize independent manufacturers’ representatives with offices throughout the world. Information about our sales and operations in different geographic regions is summarized in Note 15, “Segment Information and Geographic Area Information” to our consolidated financial statements in this Annual Report. Sales are made primarily to OEMs, either directly or through their tiered suppliers, as well as to selling partners and distributors.
2
Sources and Availability of Materials
The principal materials that we purchase include application-specific integrated circuits, coil and bar stock, ferrous and copper alloy sheets, glass, LED displays, plastic molding resins, capacitors and resistors, precious metals, and silicon die castings. All of these items are available from several suppliers and we generally rely on more than one supplier for each item.
Refer to Item 1A. “Risk Factors” in this Annual Report for risks related to the current supply chain issues, including the worldwide semiconductor supply shortage.
Intellectual Property
We generally rely on patents, trade secrets, trademarks, licenses, and non-disclosure agreements to protect our intellectual property and proprietary products. We have been granted a number of patents in the U.S., Europe and Asia and have additional domestic and international patent applications pending related to our products. Our existing patents expire on various dates between 2022 and 2041. We seek patents in order to protect our interest in unique and critical products and technologies, including our field-effect touch technology, magneto-elastic torque/force sensing, current sensing, displacement sensing, medical devices and radio-type products. We do not believe any single patent is material to our business, nor would the expiration or invalidity of any patent have a material adverse effect on our business or our ability to compete.
Seasonality
A significant portion of our business is dependent upon the automotive and commercial vehicle industries. Consequently, our Automotive and Industrial segments may experience seasonal fluctuations based on the sales and the production schedules of our customers.
Major Customers
During fiscal 2022, our five largest customers accounted for approximately 50% of our consolidated net sales, with sales to General Motors Corporation (“GM”) and its tiered suppliers representing 23.3% of consolidated net sales. In general, the sales to GM were for component parts used in particular GM vehicle models. Typically, our GM supply arrangement for each component part includes a blanket purchase order and production releases. In general, a blanket purchase order is issued for each GM part as identified by the customer part number. Each blanket purchase order includes standard terms and conditions, including price. In certain circumstances, we supply GM the requirements for a particular customer vehicle model for the life of the model, which can vary from three to seven years. GM orders parts using production releases approved under the relevant blanket purchase order. The production releases are submitted by the various GM plants and include information regarding part quantities and delivery specifications.
Backlog
We manufacture products based on a combination of specific order requirements and forecasts of our customers’ demand. For many of our OEM customers, especially in the automotive and commercial vehicle markets, we have long-term supply arrangements where there is an expectation that we will supply products in future periods. However, these arrangements do not necessarily constitute firm orders and these OEM customers are not required to purchase any minimum amount of products from us. Firm orders are generally limited to authorized customer purchase orders which are typically based on customer release schedules. We fulfill these purchase orders as promptly as possible. The dollar amount of such purchase order releases on hand and not processed at any point in time is not believed to be significant based upon the time frame involved. Accordingly, backlog at any given time might not be a meaningful indicator of future revenue.
Competition
The markets in which we operate are highly competitive and characterized by rapid changes due to technological improvements and developments. We compete with a large number of other manufacturers in each of our product areas and many of these competitors have greater resources and sales. Price, service and product performance are significant elements of competition in the sale of our products.
Research and Development
We maintain a research and development program involving a number of professional employees who devote a majority of their time to the enhancement of existing products and to the development of new products and processes. Research and development costs primarily relate to product engineering and design and development expenses and are classified as a component of costs of products sold on our consolidated statements of income. Expenditures for such activities amounted to $35.7 million for fiscal 2022, $37.1 million for fiscal 2021 and $34.9 million for fiscal 2020.
3
Government Regulations
Our worldwide business activities are subject to various laws, rules, and regulations of the United States as well as of foreign governments. Compliance with these laws, rules, and regulations has not had a material effect upon our capital expenditures, results of operations, or competitive position, and we do not currently anticipate material capital expenditures for environmental control facilities. Nevertheless, compliance with existing or future governmental regulations, including, but not limited to, those pertaining to international operations, environmental matters (including climate change), export controls, business acquisitions, consumer and data protection, employee health and safety, and regional quarantine requirements, could have a material impact on our business in subsequent periods. Refer to Item 1A. “Risk Factors” in this Annual Report for a discussion of these potential impacts.
Human Capital
As of April 30, 2022, we employed approximately 7,000 employees worldwide, substantially all of whom were employed full time with approximately 94% of these employees located outside the U.S. Our U.S. employees are not subject to any collective bargaining agreements although certain international employees are covered by national or local labor agreements.
Our corporate culture is committed to doing business with integrity, teamwork, and performance excellence. Our management team and all our employees are expected to exhibit the principles of fairness, honesty, and integrity in the actions we undertake. Our employees must adhere to our Code of Conduct that addresses topics such as anti-corruption, discrimination, harassment, privacy, appropriate use of company assets and protecting confidential information. Our employees participate in annual training on preventing, identifying, reporting, and stopping any type of unlawful discrimination or unethical actions.
Talent Acquisition, Development and Succession Planning
Our talent strategy is focused on attracting the best talent, recognizing, and rewarding their performance while continually developing, engaging, and retaining them. We focus significant attention on attracting and retaining talented and experienced individuals to manage and support our operations. When we hire new employees, we focus not just on the skills required for current positions, but the ever-changing complex skills and competencies that will be required as we move forward.
We have a global talent review and succession planning process designed to align our talent plans with the current and future strategies of the business. This includes the identification of key positions, assessment of internal talent and potential successors and plans for talent development. Our teams meet with leaders and team members across the company to develop action plans and goals focused on both personal and professional development.
Diversity and Inclusion
As highlighted in our Diversity & Inclusion Statement, available on our corporate website, we believe that diversity and inclusion are business imperatives that will enable us to build and empower our future workforce. We strive to maintain a diverse and inclusive workforce that reflects our global customer base and the communities that we serve. We embrace the diversity of our employees, including their unique backgrounds, experiences, thoughts, and talents. Employees are valued and appreciated for their distinct contributions to the growth and sustainability of our business. We also strive for diversity in leadership, which has the power to drive innovation and to encompass a wide variety of perspectives in company decision-making. We believe that diversity and inclusion will make us a more desirable workplace and will lead to improved business performance.
Health and Safety
The success of our business is fundamentally connected to the well-being of our employees. We maintain a work environment with a safety culture grounded on the premise of eliminating workplace incidents, risks, and hazards. We have created and implemented processes to help eliminate safety events and reduce their frequency and severity. The safety of our employees is a top priority and vital to our success. Our employees are regularly trained on safety-related topics and we monitor and measure our effectiveness at all our locations.
It is always a top priority, but employee health and safety continue to be of paramount importance during the COVID-19 global pandemic. In fiscal 2022, we continued to maintain extensive safety measures, including conducting temperature and health screenings and contract tracing, providing PPE, distanced workstations and plexiglass barriers, adopting enhanced cleaning and disinfection protocols, requiring employees to be vaccinated if legally permissible and instituting other measures aimed at minimizing the transmission of COVID-19 while sustaining production and related services. Our safety measures are aligned with the recommendations of U.S. and global health organizations and have continued into fiscal 2023.
4
Benefits and Compensation
As part of our efforts to attract and motivate our employees, we offer competitive compensation and benefits that may vary by region and employee-type. We provide compensation packages that include base salary/wages, and short and long-term incentives. We also provide employee benefits such as life, disability, and health (medical, dental, and vision) insurance, a 401(k) plan with a company match, paid time off, tuition reimbursement, military leave, and holiday pay. We believe those benefits are competitive within our industry.
The Human Resources function at Methode is an active and visible partner to the business at all levels. Our Chief Human Resources Officer reports directly to the Chief Executive Officer and interacts frequently with our Board of Directors. In fiscal 2023, our human capital focus will be on employee health and safety, employee and leadership development, and communications.
Available Information
Through our internet website at www.methode.com, we make available, free of charge, copies of our Annual Report on Form 10-K, quarterly reports on Form 10-Q, current reports on Form 8-K, amendments to those reports, and other filings with the Securities and Exchange Commission (“SEC”), as soon as reasonably practicable after they are filed or furnished to the SEC. Our filings are also available on the SEC’s website at www.sec.gov. Also posted on our website are our Corporate Governance Guidelines, Code of Business Conduct, Anti-Corruption Policy, Insider Trading Policy, Diversity & Inclusion Statement, Conflict Minerals Policy, Supplier Code of Conduct and the charters of the Audit Committee, Compensation Committee, Medical Products Committee, Nominating and Governance Committee and Technology Committee. Copies of these documents are also available free of charge by sending a request to Methode Electronics, Inc., 8750 West Bryn Mawr Avenue, Suite 1000, Chicago, Illinois 60631, Attention: Investor Relations Department. The references in this Annual Report to our website address or any third party’s website address, including but not limited to the SEC’s website, do not constitute incorporation by reference of the information contained in those websites and should not be considered part of this document unless otherwise expressly stated.
Item 1A. Risk Factors
Our business, financial condition and results of operations are subject to various risks, including, but not limited to, those set forth below, which could cause actual results to vary materially from recent results or from anticipated future results. These risk factors should be considered together with information included elsewhere in this Annual Report.
Operational and Industry Risks
The inability of our supply chain, or the supply chain of our customers, to deliver key components, such as semiconductors, could materially adversely affect our business, financial condition and results of operations and cause us to incur significant cost increases.
Our products contain a significant number of components that we source globally. If our supply chain fails to deliver products to us, or to our customers, in sufficient quality and quantity on a timely basis, we will be challenged to meet our production schedules or could incur significant additional expenses for expedited freight and other related costs. Similarly, many of our customers are dependent on an ever-greater number of global suppliers to manufacture their products. These global supply chains have been, and may continue to be, adversely impacted by events outside of our control, including macroeconomic events, trade restrictions, economic recessions, political crises, labor relations issues, liquidity constraints, or natural occurrences, such as the ongoing disruptions from the COVID-19 pandemic. Any significant disruptions to such supply chains could materially adversely affect our business, financial condition and results of operations.
Many of the industries we supply, including the automotive and commercial vehicle industries, are reliant on semiconductors. Globally, there is an ongoing significant shortage of semiconductors. The semiconductor supply chain is complex, with capacity constraints occurring throughout. There is significant competition within the automotive and commercial vehicle supply chains and with other industries to satisfy current and near-term requirements for semiconductors. We have worked and will continue to work closely with our suppliers and customers to minimize any potential adverse impacts of the semiconductor supply shortage and monitor the availability of semiconductor microchips and other component parts and raw materials, customer production schedules and any other supply chain inefficiencies that may arise. However, if we are not able to mitigate the semiconductor shortage impact, any direct or indirect supply chain disruptions may have a material adverse impact on our business, financial condition and results of operations.
We have experienced and may in the future experience supplier price increases that could negatively affect our business, financial condition and results of operations. The price increases are often driven by raw material pricing and availability, component or part availability, manufacturing capacity, industry allocations, logistics capacity, military conflicts, natural disasters or pandemics, and significant changes in the financial or business condition of our suppliers.
5
The COVID-19 pandemic has adversely affected, and may continue to adversely affect, our business, financial condition and results of operations. The extent of the effects of the COVID-19 pandemic on our business depends on future events that continue to be highly uncertain and beyond our control.
The COVID-19 pandemic has had, and continues to have, a significant impact on our business, financial condition and results of operations. The COVID-19 pandemic and the ongoing measures to reduce its spread have negatively impacted the global economy, disrupted consumer and customer demand and global supply chains, and created significant volatility and disruption of financial markets. Although vaccines have been introduced that are expected to reduce the effect of COVID-19, governmental authorities throughout the world continue to implement numerous measures aimed at containing and mitigating the effects of the COVID-19 pandemic, including renewed travel bans and restrictions, quarantines, social distancing orders, “lock-down” orders and shutdowns of non-essential activities. Most recently, the COVID-19 lock-downs in China have impacted our manufacturing operations, customer production schedules and supply chains.
The extent of the impact on our business will depend on a number of evolving factors, all of which remain uncertain, including the duration and spread of the pandemic, actions taken by governmental authorities to restrict business operations and social activity and impose travel restrictions, shifting consumer demand, the ability of our supply chain to deliver in a timely and cost-effective manner, the ability of our employees and manufacturing facilities to operate efficiently and effectively, the continued viability and financial stability of our customers and suppliers and future access to capital.
We have implemented numerous actions in order to effectively manage the unprecedented challenges and uncertainties of the COVID-19 pandemic on a global basis, such as implementing new workplace hygiene and disinfection protocols, redesigning production processes, leveraging our global purchasing power to secure PPE for our entire workforce, adopting processes to continuously monitor and strengthen our supply chain and consolidating operations. We may be required to take additional actions in response to evolving conditions, such as renewed travel restrictions, quarantines and stay-at-home orders. A prolonged extension of the disruptions resulting directly or indirectly from the COVID-19 pandemic could have a material adverse impact on our business, financial condition and results of operations.
The COVID-19 pandemic and the ongoing measures to reduce its spread may also impact many of our other risk factors discussed in this Annual Report, including customer demand, supply chain disruptions, availability of financing sources and risks of international operations. The ultimate significance of the COVID-19 pandemic on our business will depend on events that are beyond our control and that we cannot predict. Additional risks and uncertainties not presently known to us or that we currently deem immaterial may also affect our business, financial condition and results of operations.
We are susceptible to trends and factors affecting the automotive and commercial vehicle industries.
We derive a substantial portion of our revenues from customers in the automotive and commercial vehicle industries. Factors negatively affecting these industries also negatively affect our business, financial condition and results of operations. Automotive sales and production are highly cyclical and, in addition to general economic conditions, also depend on other factors, such as consumer confidence and consumer preferences. Any adverse occurrence, including industry slowdowns, recession, rising interest rates, rising fuel costs, political instability, costly or constraining regulations, armed hostilities, terrorism, excessive inflation, prolonged disruptions in one or more of our customers’ production schedules or labor disturbances or work stoppages, that results in a significant decline in sales volumes in these industries, or in an overall downturn in the business and operations of our customers in these industries, could materially adversely affect our business, financial condition and results of operations.
The COVID-19 pandemic has significantly disrupted, and may continue to significantly disrupt, the global automotive and commercial vehicle industries and customer sales, production volumes and purchases of vehicles by consumers. In addition, the spread of COVID-19 has created a significant disruption in the manufacturing operations, delivery systems and overall supply chains of automobile and commercial vehicle manufacturers and suppliers. Further, the COVID-19 pandemic resulted in a temporary shutdown of substantially all of the major OEMs in our markets at various times in fiscal 2021 and fiscal 2022, which impacted our sales volumes. The elevated COVID-19 rates in China have led to widespread lock-downs during the fourth quarter of fiscal 2022, and continued into the first quarter of fiscal 2023, negatively impacting OEMs in that region, along with creating further supply chain disruptions. Although automotive and commercial vehicle production has resumed, customer sales and production volumes may significantly decrease or may be very volatile due to supply chain issues or other global economic impacts and uncertainties which could materially adversely affect our business, financial condition and results of operations.
Our business, financial condition and results of operations may be adversely impacted by the effects of inflation.
Inflation has the potential to adversely affect our business, financial condition and results of operations by increasing our overall cost structure, particularly if we are unable to achieve commensurate increases in the prices we charge our customers. There have been recent significant inflationary trends in the cost of components, materials, labor, freight costs and other expenses. These inflationary pressures could affect wages, the cost and availability of components and materials, and our ability to meet customer demand. Inflation may further exacerbate other risk factors discussed in this Annual Report, including customer demand, supply chain disruptions, availability of financing sources, and risks of international operations and the recruitment and retention of talent.
6
The loss or insolvency of our major customers, or a significant decline in the volume of products purchased by these customers, would adversely affect our future results.
Our five largest customers accounted for approximately 50% of our consolidated net sales in fiscal 2022, with sales to GM and its tiered suppliers representing 23.3% of our consolidated net sales. In certain cases, the sales to these customers are concentrated in a single product. For GM, the sales primarily consisted of integrated center consoles produced for use in light trucks and SUV’s. The arrangements with GM and our other major customers generally provide for supplying its requirements for particular models, rather than for manufacturing a specific quantity of products. Such supply arrangements cover a period from one year to the life of the model, which is generally three to seven years. The loss of GM or any of our other major customers, or a decline in the production levels of these customers or particular models, could reduce our sales and thereby adversely affect our financial condition, operating results and cash flows. We also compete to supply products for successor models for our major customers and are subject to the risk that the customer will not select us to produce products on any such successor model, which could have a material adverse impact on our financial condition, operating results and cash flows.
Our inability to attract or retain key employees and a highly skilled workforce may have an adverse effect on our business, financial condition and results of operations.
Our success depends upon the continued contributions of our executive officers and other key employees, many of whom have many years of experience with us and would be extremely difficult to replace. We must also attract and retain experienced and highly skilled engineering, sales and marketing and managerial personnel. Competition for qualified personnel is intense in our industries, and we may not be successful in hiring and retaining these people. If we lost the services of our executive officers or our other highly qualified and experienced employees or cannot attract and retain other qualified personnel, our business could suffer due to less effective management or less successful products due to a reduced ability to design, manufacture and market our products.
The global nature of our operations subjects us to political, economic and social risks that could adversely affect our business, financial condition and results of operations.
Sales to customers outside of the U.S. represented a substantial portion of our fiscal 2022 net sales. We expect our net sales in international markets to continue to represent a significant portion of our consolidated net sales. In addition, we have significant personnel, property, equipment and operations in a number of countries outside of the U.S., including Belgium, Canada, China, Egypt, India, Malta, Mexico, the Netherlands and the United Kingdom. As of April 30, 2022, approximately 94% of our employees were located outside of the U.S. Our international operations subject us to a variety of political, economic, social and other risks, including:
Many of the laws and regulations listed above are complex and often difficult to interpret and violations could result in significant criminal penalties or sanctions. Any of these factors may have an adverse effect on our international operations which could have a material adverse effect on our business, financial condition and results of operations.
We are dependent on the availability and price of raw materials.
We require substantial amounts of materials, including application-specific integrated circuits, coil and bar stock, ferrous and copper alloy sheets, extrusions, glass, LED displays, plastic molding resins, precious metals, silicon die castings and wire. The availability and prices of materials may be subject to curtailment or change due to, among other things, inflation, new laws or regulations, suppliers’ allocations to other purchasers, supply chain disruptions, changes in exchange rates and worldwide price levels. Any change in the availability of, lead times for, or price for, these materials could materially adversely affect our business, financial condition and results of operations.
7
Our inability, or our customers’ inability, to effectively manage the timing, quality and cost of new program launches could adversely affect our financial performance.
In connection with the awarding of new business, we obligate ourselves to deliver new products that are subject to our customers' timing, performance and quality demands. Additionally, we must effectively coordinate the activities of numerous suppliers and our and our customers’ personnel in order for the program launches of certain of our products to be successful. Given the complexity of new program launches, we may experience difficulties managing product quality, timeliness and associated costs. In addition, new program launches require a significant ramp up of costs; however, our sales related to these new programs generally are dependent upon the timing and success of our customers' introduction of new products. Our inability, or our customers' inability, to effectively manage the timing, quality and costs of these new program launches could adversely affect our financial condition and results of operations.
Our businesses and the markets in which we operate are highly competitive. If we are unable to compete effectively, our sales and profitability could decline.
The markets in which we operate are highly competitive. We compete with a large number of other manufacturers in each of our product areas and many of these competitors have greater resources and sales. Price, service and product performance are significant elements of competition in the sale of our products. Competition may intensify further if more companies enter the markets in which we operate. Our failure to compete effectively could have a material adverse effect on our business, financial condition and results of operations.
Future price reductions and increased quality standards may reduce our profitability and have a material adverse effect on our business, financial condition and results of operations.
Our supply arrangements with our customers typically require us to provide our products at predetermined prices. In some cases, these prices decline over the course of the arrangement and may require us to meet certain productivity and cost reduction targets. In addition, our customers may require us to share productivity savings in excess of our cost reduction targets. The costs that we incur in fulfilling these orders may vary substantially from our initial estimates. Unanticipated cost increases or the inability to meet certain cost reduction targets may occur as a result of several factors, including increases in the costs of labor, components or materials. In some cases, we are permitted to pass on to our customers the cost increases associated with specific materials. However, cost overruns that we cannot pass on to our customers could adversely affect our business, financial condition and results of operations.
Certain of our customers have exerted and continue to exert considerable pressure on us to reduce prices and costs, improve quality and provide additional design and engineering capabilities. We may be unable to generate sufficient production cost savings in the future to offset required price reductions. Future price reductions, increased quality standards and the cost of adding additional engineering capabilities may reduce our profitability and have a material adverse effect on our business, financial condition and results of operations.
Our ability to market our automotive and commercial vehicle products is subject to a lengthy sales cycle, which requires significant investment prior to reporting significant sales revenues, and there is no assurance that our products will be implemented in any particular vehicle.
The sales cycles for our automotive and commercial vehicle products are lengthy because the manufacturers must develop high degrees of assurance that the products they buy will meet their needs, interface correctly with the other parts of a vehicle and with the manufacturer’s production and assembly process, and have minimal warranty, safety and service problems. While we currently have active development programs with various OEMs for a variety of our products, no assurance can be given that our products will be implemented in any particular vehicles. If our products are not selected after a lengthy development process, our business, financial condition and results of operations could be adversely affected.
Our inability to capitalize on prior or future acquisitions or any decision to strategically divest one or more current businesses may adversely affect our business, financial condition and results of operations.
We have completed acquisitions and divestitures in the past and we intend to continue to seek acquisitions to grow our businesses and may divest operations to focus on our core businesses. We may fail to derive significant benefits from such transactions. Also, if we fail to achieve sufficient financial performance from an acquisition, certain long-lived assets, such as property, plant and equipment and intangible assets, could become impaired and result in the recognition of an impairment loss.
The success of our acquisitions depends on our ability to:
8
Integration of acquisitions may take longer than we expect and may never be achieved to the extent originally anticipated. Acquisitions may also increase our debt levels. This could result in lower than expected business growth or higher than anticipated costs. In addition, acquisitions or strategic divestitures may:
Our profitability will suffer if we are unable to successfully integrate an acquisition, if the acquisition does not further our business strategy as we expected or if we do not achieve sufficient revenue to offset the increased expenses associated with any acquisition. We may overpay for, or otherwise not realize the expected return on, our investments, which could adversely affect our operating results and potentially cause impairments to assets that we record as a part of an acquisition including intangible assets and goodwill.
Our customers may cancel their orders, change production quantities or locations or delay production.
We generally receive volume estimates, but not firm volume commitments from our customers, and may experience reduced or extended lead times in customer orders. Customers may cancel orders, change production quantities and delay production for a number of reasons. Cancellations, reductions or delays by a significant customer or by a number of customers may harm our results of operations by reducing the volumes of products we manufacture and sell, as well as by causing a delay in the recovery of our expenditures for inventory in preparation for customer orders, or by reducing our asset utilization, resulting in lower profitability.
In addition, we make key decisions based on our estimates of customer requirements, including determining the levels of orders that we will seek and accept, production schedules, component procurement commitments, personnel needs and other resource requirements. Changes in demand for our customers’ products may reduce our ability to estimate future customer requirements accurately. This may make it difficult to schedule production and maximize utilization of our manufacturing capacity. Anticipated orders may not materialize and delivery schedules may be deferred as a result of changes in demand for our products or our customers’ products. We often increase staffing and capacity and incur other expenses to meet the anticipated demand of our customers. On occasion, customers may require rapid increases in production, which may stress our resources. Any significant decrease or delay in customer orders could have a material adverse effect on our business, financial condition and results of operations.
A catastrophic event or other significant business interruption at any of our facilities could adversely affect our business, financial condition and results of operations.
Weather conditions, natural disasters or other catastrophic events could cause significant disruptions at our manufacturing facilities or those of our major suppliers or customers. In such event, losses could be incurred and significant recovery time could be required to resume operations and our business, financial condition and results of operations could be materially adversely affected.
War, terrorism, geopolitical uncertainties (including the military conflict between Russia and Ukraine), public health issues (such as the COVID-19 pandemic), and other business interruptions have caused and could cause damage or disruption to international commerce and the global economy, and thus could have a strong negative effect on us, our suppliers, logistics providers, and customers. Our business operations could be subject to interruption by power shortages, terrorist attacks and other hostile acts, labor disputes, population lockdowns and other events beyond our control. Such events could decrease demand for our products or make it difficult or impossible for us to produce and deliver products to our customers, or to receive components from our suppliers. Should major public health issues, including pandemics, arise, we could be negatively affected by shutdowns, shelter in place orders, more stringent travel restrictions, additional limitations in freight services, governmental actions limiting the movement of products between regions, and disruptions in the operations of our manufacturing partners and component suppliers. Any such business interruptions could materially affect our business, financial condition and results of operations.
Russia’s invasion of Ukraine and the resulting economic sanctions imposed by the international community have impacted the global economy and given rise to potential global security issues that may adversely affect international business and economic conditions. Although we have no operations in Russia or Ukraine, certain of our customers and suppliers have been negatively impacted by these events, which in turn has impacted markets where we do business, including Europe and Asia. These events have caused additional disruption in the supply chains, which are already experiencing disruption due to the impacts of the COVID-19 pandemic and may continue to impact demand for our products. The continuation of this military conflict between Russia and Ukraine could lead to other supply chain disruptions, increased inflationary pressures, and volatility in global markets and industries that could negatively impact our operations.
9
Technology and Intellectual Property Risks
Our operations could be negatively impacted by IT service interruptions, data corruption or misuse, cyber-based attacks, or network security breaches.
We face certain security threats relating to the confidentiality and integrity of our information technology (“IT”) systems. Despite implementation of security measures, our IT systems may be vulnerable to damage from computer viruses, cyber-attacks and other unauthorized access, and these security breaches could result in a disruption to our operations. A material network breach of our IT systems could involve the theft of our and our customers' intellectual property or trade secrets which may be used by competitors to develop competing products. To the extent that any security breach results in a loss or damage to data, or inappropriate disclosure of confidential or proprietary information, it could cause significant damage to our reputation, affect our customer relations, lead to claims against us, increase our costs to protect against future damage and could result in a material adverse effect on our business, financial condition and results of operations.
Further, the recent military conflict between Russia and Ukraine could result in cyberattacks that could directly or indirectly impact us, including the potential for retaliatory acts of cyberwarfare from Russia against U.S. companies in response to increasing sanctions on Russia. The impact of any one or more of these or other factors could adversely affect our business, financial condition and results of operations.
Any such disruption or security breach, as well as any action by us or our employees or contractors that might be inconsistent with the rapidly evolving data privacy and security laws and regulations applicable within the U.S. and elsewhere where we conduct business, could result in enforcement actions by U.S. states, the U.S. Federal government or foreign governments, liability or sanctions under data privacy laws that protect personally identifiable information, regulatory penalties, other legal proceedings such as but not limited to private litigation, the incurrence of significant remediation costs, disruptions to our development programs, business operations and collaborations, diversion of management efforts and damage to our reputation, which could harm our business and operations. Because of the rapidly changing nature of technology and the increasing sophistication of cybersecurity threats, our measures to prevent, respond to and minimize such risks may be unsuccessful. While we have secured cyber insurance to potentially cover certain risks associated with cyber incidents, there can be no assurance it will be sufficient to cover any such liability.
In particular, the General Data Privacy Regulation (“GDPR”) of the European Union creates a range of compliance obligations applicable to the collection, use, retention, security, processing and transfer of personal data in the European Union. The GDPR, which is wide-ranging in scope, imposes several requirements relating to the consent of the individuals to whom the personal data relates, the information provided to the individuals, the security and confidentiality of the personal data, data breach notification and the use of third-party processors in connection with the processing of the personal data. The GDPR also imposes strict rules on the transfer of personal data out of the European Union to countries such as the U.S., enhances enforcement authority and imposes large penalties for noncompliance.
We may be unable to keep pace with rapid technological changes, which could adversely affect our business, financial condition and results of operations.
The technologies relating to some of our products have undergone, and are continuing to undergo, rapid and significant changes. Specifically, end-markets for electronic components and assemblies are characterized by technological change, frequent new product introductions and enhancements, changes in customer requirements and emerging industry standards. These changes could render our existing products unmarketable before we can recover any or all of our research, development and other expenses. Furthermore, the life cycles of our products vary, may change and are sometimes difficult to estimate. If we are unable, for technological or other reasons, to develop and market new products or product enhancements in a timely and cost-effective manner, our business, financial condition and results of operations could be materially adversely affected.
If we are unable to protect our intellectual property or we infringe, or are alleged to infringe, on another person’s intellectual property, our competitive position and results of operations may be adversely impacted.
We have numerous U.S. and foreign patents, trade secrets and license agreements covering certain of our products and manufacturing processes. Our ability to compete effectively with other companies depends, in part, on our ability to maintain the proprietary nature of our technology. Although we have been awarded, have filed applications for, or have been licensed under numerous patents in the U.S. and other countries, there can be no assurance concerning the degree of protection afforded by these patents or the likelihood that pending patents will be issued. The loss of certain patents and trade secrets could adversely affect our sales, margins or profitability.
10
We have and may become involved in litigation in the future to protect our intellectual property or because others may allege that we infringe on their intellectual property. These claims and any resulting lawsuit could subject us to liability for damages and invalidate our intellectual property rights. If an infringement claim is successfully asserted by a holder of intellectual property rights, we may be required to cease marketing or selling certain products, pay a penalty for past infringement and spend significant time and money to develop a non-infringing product or process or to obtain licenses for the technology, process or information from the holder. We may not be successful in the development of a non-infringing alternative, or licenses may not be available on commercially acceptable terms, if at all, in which case we may lose sales and profits. In addition, any litigation could be lengthy and costly and could materially adversely affect us even if we are successful in the litigation.
Legal, Regulatory and Compliance Risks
We are subject to government regulations, including environmental, health, and safety laws and regulations, that expose us to potential financial liability.
Our operations are regulated by a number of federal, state, local and international government regulations, including those pertaining to environmental, health, and safety (“EHS”) that govern, among other things, air and water emissions, worker protection, and the handling, storage and disposal of hazardous materials. If we violate EHS laws and regulations, we could be liable for substantial fines, penalties, and costs of mandated remedial actions. Our environmental permits could also be revoked or modified, which could require us to cease or limit production at one or more of our facilities, thereby materially adversely affecting our business, financial condition and results of operations. EHS laws and regulations have generally become more stringent over time and could continue to do so in response to climate change concerns, imposing greater compliance costs and increasing risks and penalties associated with any violation, which also could materially adversely affect our business, financial condition and results of operations.
We operate our business on a global basis and changes to trade policy, including tariffs and customs regulations, could have a material and adverse effect on our business.
We manufacture and sell our products globally and rely on a global supply chain to deliver the required raw materials, components, and parts, as well as the final products to our customers. Existing free trade laws and regulations, such as the United States-Mexico-Canada Agreement, provide certain duties and tariffs for qualifying imports and exports, subject to compliance with the applicable classification and other requirements. Changes in laws or policies governing the terms of foreign trade, and in particular increased trade restrictions, tariffs or taxes on imports from countries where we manufacture products, such as China, Egypt and Mexico, could have a material adverse effect on our business, financial condition and operating results. For instance, beginning in 2018, the U.S. and Chinese governments have imposed a series of significant incremental retaliatory tariffs to certain imported products. Most notably with respect to the automotive and commercial vehicle industries, the U.S. imposed tariffs on imports of certain steel, aluminum and automotive components, and China imposed retaliatory tariffs on imports of U.S. vehicles and certain automotive components. Depending upon their duration and implementation, as well as our ability to mitigate their impact, these tariffs and other regulatory actions could materially affect our business, including in the form of an increase in cost of goods sold, decreased margins, increased pricing for customers, and reduced sales.
Climate change and climate change regulations could adversely impact our business and results of operations.
Increased public awareness and concern regarding environmental risks, including global climate change, may result in more international, regional and/or federal requirements or industry standards to reduce or mitigate global warming and other environmental risks. These regulations or standards could mandate more restrictive requirements, such as stricter limits on greenhouse gas emissions and production of single use plastics, and could increase costs relating to monitoring and reporting emissions data. In addition, the risks of climate change may impact manufacturing, product demand, the availability and cost of materials and natural resources, and sources and supply of energy, and could increase insurance and other operating costs. If environmental laws or regulations or industry standards are either changed or adopted and impose significant operational restrictions and compliance requirements upon us, our operations or products, or our operations are disrupted due to physical impacts of climate change, our business, financial condition and results of operations could be materially adversely affected.
Products we manufacture may contain design or manufacturing defects that could result in reduced demand for our products or services and liability claims against us.
Despite our quality control and quality assurance efforts, defects may occur in the products we manufacture due to a variety of factors, including design or manufacturing errors, component failure or counterfeit parts. Product defects may result in delayed shipments and reduced demand for our products. We may be subject to increased costs due to warranty claims on defective products. Product defects may result in product liability claims against us where defects cause, or are alleged to cause, property damage, bodily injury or death. We may be required to participate in a recall involving products that are, or are alleged to be, defective. We carry insurance for certain legal matters involving product liability, however, we do not have coverage for all costs related to product defects or recalls and the costs of such claims, including costs of defense and settlement, may exceed our available coverage. Any such product defects or product liability claims could materially adversely affect our business, financial condition and results of operations.
11
Financial Risks
We have significant goodwill and other intangible assets, and future impairment of these assets could have a material adverse impact on our financial condition and results of operations.
A significant portion of our long-term assets consists of goodwill and other intangible assets recorded as a result of past acquisitions. We do not amortize goodwill and indefinite-lived intangible assets, but rather review them for impairment on an annual basis or more frequently whenever events or changes in circumstances indicate that their carrying value may not be recoverable. In the event that we determine that our goodwill or other intangible assets are impaired, we may be required to record a significant charge to earnings that could adversely affect our financial condition and results of operations.
We have incurred indebtedness and our level of indebtedness and restrictions under our indebtedness could adversely affect our operations and liquidity.
Our primary sources of liquidity are cash generated from operations and availability under our revolving credit facility. Our senior unsecured credit agreement consists of a $200.0 million revolving credit facility and a $250.0 million term loan. As of April 30, 2022, $206.3 million in principal was outstanding under these financing arrangements and we had $199.9 million of availability remaining under the revolving credit facility. The term loan matures in September 2023 and requires quarterly principal payments of $3.1 million over the five-year term, with the remaining balance due upon maturity. The senior unsecured credit agreement provides for variable rates of interest based on the type of borrowing and our debt to EBITDA financial ratio and contains customary representations and warranties, financial covenants, restrictive covenants and events of default.
Our senior unsecured credit agreement provides an option to increase the size of our revolving credit facility and term loan by an additional $200.0 million, subject to customary conditions and approval of the lenders providing the new commitments. There can be no assurance that lenders will approve additional commitments under current circumstances.
Our senior unsecured credit agreement imposes various restrictions and covenants regarding the operation of our business, including covenants that require us to obtain the lenders’ consent before we can, among other things and subject to certain exceptions: (i) incur additional indebtedness or additional liens on our property; (ii) consummate certain acquisitions, dispositions, mergers or consolidations; (iii) make any material change in the nature of our business; (iv) enter into certain transactions with our affiliates; or (v) repurchase or redeem any outstanding shares of our common stock or pay cash dividends to our stockholders when a default exists or certain financial covenants are not maintained.
The amount of our outstanding indebtedness could have an adverse effect on our operations and liquidity, including by, among other things: (i) making it more difficult for us to pay or refinance our debts as they become due during adverse economic and industry conditions, because we may not have sufficient cash flows to make our scheduled debt payments; (ii) causing us to use a larger portion of our cash flows to fund interest and principal payments, thereby reducing the availability of cash to fund working capital, product development, capital expenditures and other business activities; (iii) making it more difficult for us to take advantage of significant business opportunities, such as acquisition opportunities or other strategic transactions, and to react to changes in market or industry conditions; and (iv) limiting our ability to borrow additional monies in the future to fund the activities and expenditures described above and for other general corporate purposes as and when needed, which could force us to suspend, delay or curtail business prospects, strategies or operations.
A significant fluctuation between the U.S. dollar and other currencies could adversely impact our business, results of operations and financial condition.
We transact business in various foreign countries. We present our consolidated financial statements in U.S. dollars, but a portion of our revenues and expenditures are transacted in other currencies. As a result, we are exposed to fluctuations in foreign currencies. Additionally, we have currency fluctuation exposure arising from funds held in local currencies in foreign countries. Volatility in the exchange rates between the foreign currencies and the U.S. dollar could have an adverse effect on our business, financial condition and results of operations.
Performance-based awards under our long-term incentive plan may require significant adjustments to compensation expense which could have a material adverse impact on our results of operations.
Compensation expense for the performance-based restricted stock awards (“RSAs”) and performance units (“Performance Units”) awarded under our five-year long-term incentive program will be recognized over the vesting period based on the projected probability of achieving the relevant performance goals for fiscal 2025. As of April 30, 2022, we have not recorded any compensation expense for the RSAs or the Performance Units based on the probability assessment required under the accounting rules and regulations. Each quarter, we will assess the probability of vesting for the RSAs and the Performance Units and will adjust the compensation expense as necessary. At such time, we may be required to record compensation expense relating to prior periods, and such compensation expense adjustment could be material to our results of operations. In the past, we have taken actions to restructure and optimize our production and manufacturing capabilities and efficiencies through relocations, consolidations, facility closings or asset sales.
12
Restructuring activities may lead to additional costs and material adverse effects.
In the future, we may take additional restructuring actions including the consolidating, closing or selling of additional facilities. These actions could result in impairment charges and various charges for such items as idle capacity, disposition costs and severance costs, in addition to normal or attendant risks and uncertainties. We may be unsuccessful in any of our current or future efforts to restructure or consolidate our business. Plans to minimize or eliminate any loss of revenues during restructuring or consolidation may not be achieved. These activities may have a material adverse effect on our business, financial condition and results of operations.
Changes in our effective tax rate may adversely impact our results of operations.
A number of factors may increase our effective tax rate, which could reduce our net income, including:
Our judgments regarding the accounting for tax positions and the resolution of tax disputes may impact our results of operations and financial condition.
Significant judgment is required to determine our effective tax rate and evaluate our tax positions. We provide for uncertain tax positions when such tax positions do not meet the recognition thresholds or measurement criteria prescribed by applicable accounting standards. Fluctuations in federal, state and foreign taxes or a change to uncertain tax positions, including related interest and penalties, may impact our effective tax rate and results of operations. Additionally, we are subject to audits in the various taxing jurisdictions in which we conduct business. Based on the status of these audits and the protocol of finalizing audits by the relevant tax authorities, it is not possible to estimate the impact of changes, if any, to previously recorded uncertain tax positions. Any negative or unexpected outcomes of these examinations and audits could have a material adverse impact on our results of operations and financial condition.
Item 1B. Unresolved Staff Comments
None.
Item 2. Properties
Our corporate headquarters is located in Chicago, Illinois. As of April 30, 2022, we leased or owned 32 operating facilities. We believe our space is in good condition and adequate to meet our current and reasonably anticipated future needs. The following table provides details regarding our significant properties as of April 30, 2022:
Location |
|
Segment(s) |
|
Use |
|
Owned/ |
|
Approximate |
|
|
Lontzen, Belgium |
|
Automotive |
|
Manufacturing and Warehousing |
|
Owned |
|
|
124,000 |
|
Dongguan, China |
|
Automotive and Industrial |
|
Manufacturing |
|
Leased |
|
|
197,000 |
|
Shanghai, China |
|
Automotive and Industrial |
|
Manufacturing |
|
Leased |
|
|
147,000 |
|
Suzhou, China |
|
Automotive and Industrial |
|
Manufacturing |
|
Leased |
|
|
318,000 |
|
Cairo, Egypt |
|
Automotive and Industrial |
|
Manufacturing |
|
Leased |
|
|
272,328 |
|
Mriehel, Malta |
|
Automotive and Industrial |
|
Manufacturing |
|
Leased |
|
|
299,000 |
|
Monterrey, Mexico |
|
Automotive, Industrial and Interface |
|
Manufacturing |
|
Leased |
|
|
292,000 |
|
Santa Catarina Nuevo Léon, Mexico |
|
Automotive |
|
Manufacturing |
|
Leased |
|
|
158,000 |
|
13
Item 3. Legal Proceedings
From time to time, we have and may become involved in various litigation matters, including administrative proceedings, regulatory proceedings, environmental matters, and commercial disputes. The impact and outcome of litigation is subject to inherent uncertainties, and an adverse result in these or other matters may arise from time to time that could harm our business. We are not currently aware of any legal proceedings or claims to which we are a party or to which our property is subject that we believe will have, individually or in the aggregate, a material adverse effect on our business, financial condition or results of operations.
Item 4. Mine Safety Disclosures
Not applicable.
Supplementary Item: Information about our Executive Officers
Name |
|
Age |
|
|
Offices and Positions Held and Length of Service as Officer |
|
Donald W. Duda |
|
|
66 |
|
|
Chief Executive Officer since 2004 and President and Director since 2001. |
Ronald L.G. Tsoumas |
|
|
61 |
|
|
Chief Financial Officer of the Company since 2018; prior thereto, served as Controller of the Company from 2007 to 2018. |
Andrea J. Barry |
|
|
59 |
|
|
Chief Administrative Officer of the Company since January 2022 and Chief Human Resources Officer of the Company since 2017; served as CHRO for Wirtz Beverage Group from 2013 to 2016. |
Timothy R. Glandon |
|
|
58 |
|
|
Vice President since 2006; General Manager, North American Automotive, from 2006 to 2015. |
Joseph E. Khoury |
|
|
58 |
|
|
Chief Operating Officer of the Company since 2018; prior thereto, served as Senior Vice President since 2015, and as Vice President and General Manager of European Operations from 2004 to 2015. |
Kevin M. Martin |
|
|
56 |
|
|
Vice President, North America since 2020; prior thereto, Vice President and General Manager, North America Automotive, from 2019 to 2020, General Manager, North America Automotive in 2018, and Director of Sales, North America Automotive from 2014 to 2017. |
Anil V. Shetty |
|
|
56 |
|
|
President, Dabir Surfaces since 2018; prior thereto, Vice President and General Manager, Asia, from 2015, and Executive Managing Director, Asia from 2011 to 2015. |
All executive officers are elected by the Board of Directors and serve a term of one year or until their successors are duly elected and qualified.
14
PART II
Item 5. Market for Registrant’s Common Equity, Related Stockholder Matters and Issuer Purchases of Equity Securities
Market Information
Our common stock is traded on the New York Stock Exchange under the symbol “MEI”. As of June 15, 2022, we had 366 holders of record of our common stock. This does not include persons whose stock is in nominee or “street name” accounts held by banks, brokers and other nominees.
Dividends
While we currently expect that quarterly cash dividends will continue to be paid in the future, such payments are at the discretion of our Board of Directors and will depend upon many factors, including our results of operations, liquidity position and compliance with debt covenants. In the first quarter of fiscal 2022, we increased our quarterly dividend from $0.11 per share to $0.14 per share.
Issuer Purchases of Equity Securities
On March 31, 2021, the Board of Directors authorized the purchase of up to $100.0 million of our common stock, expiring on March 31, 2023. Purchases under this program may be made on the open market, in private transactions or pursuant to purchase plans designed to comply with Rule 10b5-1 of the Securities Exchange Act of 1934. We did not purchase any shares of our common stock under this program during the quarter ended April 30, 2022. As of April 30, 2022, a total of 1,593,139 shares have been purchased at a cost of $71.2 million since the commencement of the share buyback program.
On June 16, 2022, the Board of Directors authorized an increase in our existing share buyback program under which we may purchase up to an additional $100.0 million of our outstanding common stock, and also extended the expiration from March 31, 2023 to June 14, 2024.
Securities Authorized for Issuance Under Equity Compensation Plans
See Item 12, “Security Ownership of Certain Beneficial Owners and Management and Related Stockholder Matters,” of this Annual Report for certain information relating to our equity compensation plans.
15
Stock Performance
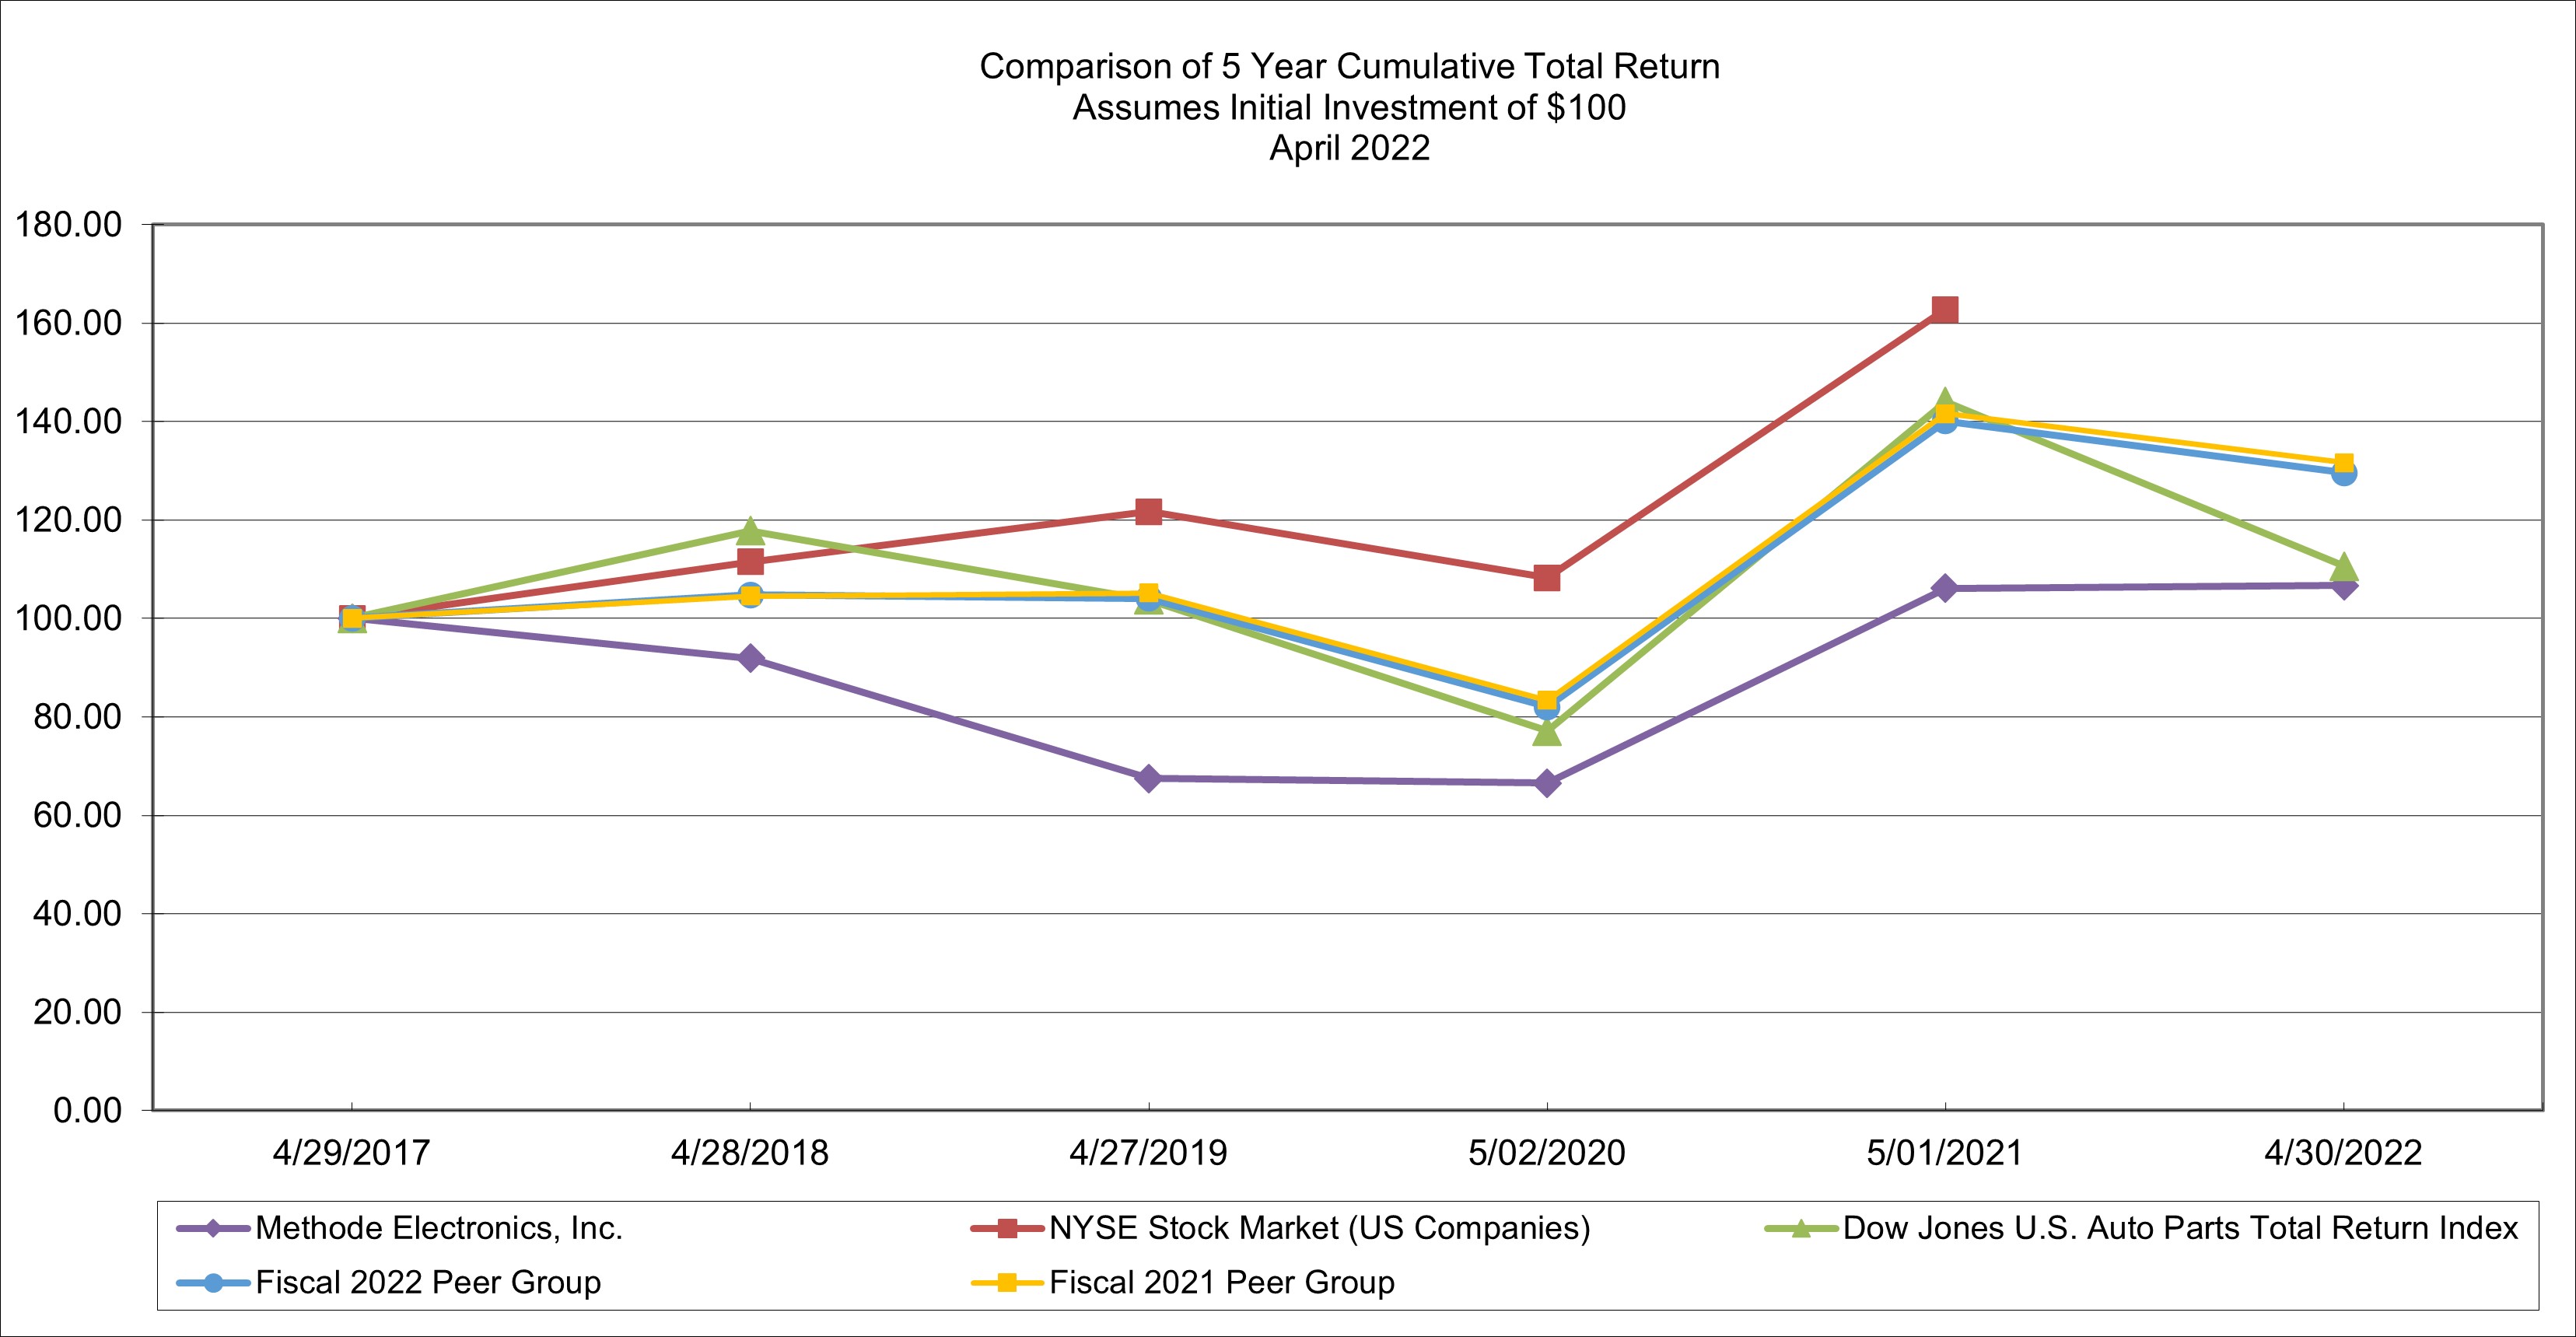
The following graph shows the cumulative total stockholder return on our common stock over the period spanning April 29, 2017 to April 30, 2022, as compared with that of the Dow Jones U.S. Auto Parts Total Return Index, our Fiscal 2021 Peer Group and our Fiscal 2022 Peer Group. We have assumed that dividends have been reinvested and that $100 was invested on April 29, 2017. The stock price performance included in this graph is historical and not necessarily indicative of future stock price performance. The Dow Jones U.S. Auto Parts Total Return Index replaces the CRSP NYSE Stock Market (US Companies) Index in this analysis and going forward, as the CRSP Index data is no longer accessible. The CRSP index has been included with data through May 1, 2021.
Company/Index |
|
April 29, 2017 |
|
|
April 28, 2018 |
|
|
April 27, 2019 |
|
|
May 2, |
|
|
May 1, |
|
|
April 30, 2022 |
|
||||||
Methode Electronics, Inc. |
|
$ |
100.00 |
|
|
$ |
91.91 |
|
|
$ |
67.45 |
|
|
$ |
66.56 |
|
|
$ |
106.14 |
|
|
$ |
106.69 |
|
NYSE Stock Market (US Companies) |
|
|
100.00 |
|
|
|
111.51 |
|
|
|
121.66 |
|
|
|
108.22 |
|
|
|
162.74 |
|
|
|
|
|
Dow Jones U.S. Auto Parts Total Return Index |
|
|
100.00 |
|
|
|
117.84 |
|
|
|
103.77 |
|
|
|
77.16 |
|
|
|
144.05 |
|
|
|
110.63 |
|
Fiscal 2022 Peer Group |
|
|
100.00 |
|
|
|
104.81 |
|
|
|
104.05 |
|
|
|
82.04 |
|
|
|
140.09 |
|
|
|
129.57 |
|
Fiscal 2021 Peer Group |
|
|
100.00 |
|
|
|
104.57 |
|
|
|
105.16 |
|
|
|
83.37 |
|
|
|
141.61 |
|
|
|
131.61 |
|
The Fiscal 2022 Peer Group consists of the following fifteen public companies:
Belden Corporation |
Franklin Electric Company. Inc |
Patrick Industries, Inc. |
Benchmark Electronics, Inc. |
Gentherm Incorporated |
Rogers Corporation |
Cooper-Standard Holdings Inc |
LCI Industries |
Stoneridge, Inc. |
CTS Corporation |
Littelfuse, Inc. |
TTM Technologies, Inc. |
Fabrinet |
OSI Systems, Inc. |
Visteon Corporation |
The Compensation Committee of the Board of Directors reviews the peer group annually and from time to time changes the composition of the peer group where changes are appropriate. In fiscal 2022, the Compensation Committee added Cooper-Standard Holdings Inc., Fabrinet and Patrick Industries, Inc. based on our revenue, market capitalization and industry criteria for the peer group. Delphi Technologies PLC, Kemet Corporation and MTS Systems Corporation were all acquired in fiscal 2021 and were excluded from the peer group.
Item 6. [Reserved]
Not applicable.
16
Item 7. Management’s Discussion and Analysis of Financial Condition and Results of Operations
Management’s Discussion and Analysis of Financial Condition and Results of Operations is based upon our consolidated financial statements, which have been prepared in accordance with U.S. GAAP. You should read the following discussion and analysis in conjunction with our consolidated financial statements and related notes included in this Annual Report. This discussion and analysis of our financial condition and results of operations also contains forward-looking statements that involve risks, uncertainties, and assumptions. Our actual results may differ materially from those anticipated in these forward-looking statements because of a variety of factors, including those set forth under Item 1A. “Risk Factors” of this Annual Report. We undertake no duty to update any such forward-looking statements to conform to actual results or changes in our expectations.
Overview
We are a leading global supplier of custom engineered solutions with sales, engineering and manufacturing locations in North America, Europe, Middle East and Asia. We design, engineer and produce mechatronic products for OEMs utilizing our broad range of technologies for user interface, LED lighting system, power distribution and sensor applications.
Our solutions are found in the end markets of transportation (including automotive, commercial vehicle, e-bike, aerospace, bus and rail), cloud computing infrastructure, construction equipment, consumer appliance and medical devices. Our business is managed on a segment basis, with our four segments being Automotive, Industrial, Interface and Medical. For more information regarding the business and products of these segments, see Item 1. “Business” of this Annual Report.
Impact of the COVID-19 Pandemic
The COVID-19 pandemic and the ongoing measures to reduce its spread have negatively impacted the global economy, disrupted consumer and customer demand and global supply chains, and resulted in manufacturing inefficiencies and increased freight costs due to global capacity constraints. We expect that the global health crisis caused by the COVID-19 pandemic will continue to negatively impact our business and results of operations for the foreseeable future. The extent of the impact will depend on a number of evolving and uncertain factors, including the duration and spread of COVID-19 (and its variants), the rate of vaccinations, actions taken by governmental authorities to further restrict business operations and social activity and impose travel restrictions, shifting consumer demand, the ability of our supply chain to deliver in a timely and cost-effective manner, the ability of our employees and manufacturing facilities to operate efficiently and effectively, the continued viability and financial stability of our customers and suppliers and future access to capital.
We continue to focus on effectively managing the unprecedented challenges and uncertainties of the pandemic on a global basis. Management has prioritized the health and safety of our employees and their families. We adopted numerous safety procedures at our global facilities, including hygiene and disinfection protocols, testing and contact tracing, social distancing and wearing personal protective equipment. We share best practices throughout our global facilities, resulting in effective and standardized safety guidelines and procedures, updated on a regular basis, promoting the health and safety of our employees.
Global Supply Chain Disruptions
We continue to experience business interruptions, including customer shutdowns and increased material and logistics costs, labor shortages, and most significantly, impacts from the worldwide semiconductor supply shortage. The semiconductor supply shortage is due, in part, to increased demand across multiple industries, including the automotive industry, resulting in a slowdown in their production schedules. The semiconductor supply shortage is also impacting our supply chain and our ability to meet demand at some of our non-automotive customers. We expect this semiconductor shortage to have a continued impact on our operating results and financial condition in fiscal 2023.
Restructuring Actions
In fiscal 2022, we initiated a restructuring plan to consolidate one of our operations within the Industrial segment in response to logistics issues and tariffs. This action resulted in a facility shutdown and consolidation of activities into an existing location. In fiscal 2022, we recognized $3.6 million of restructuring costs. We may take additional restructuring actions in future periods based upon market conditions and industry trends.
As a result of the COVID-19 pandemic, we initiated certain restructuring actions in fiscal 2021 to rationalize our operations, lower our costs and improve financial performance and long-term cash flow generation. These actions included plant consolidations and workforce reductions in the Automotive, Industrial and Interface segments. In fiscal 2021, we recognized $8.2 million of restructuring costs.
17
Impacts of Macroeconomic and Geopolitical Conditions
Adverse macroeconomic conditions, including but not limited to inflation, slower growth or recession, new or increased tariffs, changes to fiscal and monetary policy, higher interest rates and currency fluctuations could adversely affect demand for our products. In addition, in February 2022, Russia invaded Ukraine resulting in, among other things, economic sanctions imposed by the international community which have impacted the global economy and given rise to potential global security issues that may adversely affect international business and economic conditions. Although we have no operations in Russia or Ukraine, certain of our customers and suppliers have been negatively impacted by these events, which in turn has impacted markets where we do business, including Europe and Asia. The economic sanctions imposed on Russia has further increased existing global supply chain, logistics, and inflationary challenges.
Consolidated Results of Operations
We maintain our financial records on the basis of a 52 or 53-week fiscal year ending on the Saturday closest to April 30. Fiscal 2022 ended on April 30, 2022 and fiscal 2021 ended on May 1, 2021, which represented 52 weeks of results for each year. Fiscal 2020 ended on May 2, 2020, which represented 53 weeks of results. The following discussions of comparative results among periods should be reviewed in this context.
A detailed comparison of our results of operations between fiscal 2021 and fiscal 2020 can be found in Item 7, “Management’s Discussion and Analysis of Financial Condition and Results of Operations” in our fiscal 2021 Annual Report on Form 10-K filed with the SEC on June 24, 2021.
The table below compares our results of operations between fiscal 2022 and fiscal 2021:
|
|
Fiscal Year Ended |
|
|||||
(in millions) |
|
April 30, 2022 |
|
|
May 1, 2021 |
|
||
Net sales |
|
$ |
1,163.6 |
|
|
$ |
1,088.0 |
|
Cost of products sold |
|
|
898.7 |
|
|
|
813.9 |
|
Gross profit |
|
|
264.9 |
|
|
|
274.1 |
|
Selling and administrative expenses |
|
|
134.1 |
|
|
|
126.9 |
|
Amortization of intangibles |
|
|
19.1 |
|
|
|
19.3 |
|
Interest expense, net |
|
|
3.5 |
|
|
|
5.2 |
|
Other income, net |
|
|
(10.3 |
) |
|
|
(12.2 |
) |
Income tax expense |
|
|
16.3 |
|
|
|
12.6 |
|
Net income |
|
$ |
102.2 |
|
|
$ |
122.3 |
|
Net sales
Net sales increased $75.6 million, or 6.9%, to $1,163.6 million in fiscal 2022, compared to $1,088.0 million in fiscal 2021. The increase was primarily due to higher sales in the Automotive and Industrial segments. The COVID-19 pandemic negatively impacted net sales in the first quarter of fiscal 2021. Net sales were favorably impacted by foreign currency translation of $5.5 million, primarily due to the strengthening of the Chinese renminbi relative to the U.S. dollar in fiscal 2022. Net sales were also favorably impacted by customer recoveries for spot buys of materials and premium freight costs of $22.1 million. Without the impact of foreign currency translation and customer cost recoveries, net sales increased $48.0 million, or 4.4%.
Cost of products sold
Cost of products sold increased $84.8 million, or 10.4%, to $898.7 million (77.2% of net sales) in fiscal 2022, compared to $813.9 million (74.8% of net sales) in fiscal 2021. The increase was primarily due to higher material, logistics and other operating costs of $88.3 million as a result of higher sales volumes and the impact of global supply chain disruptions and factory inefficiencies. Excluding foreign currency translation, cost of products sold increased $81.4 million. Labor costs were higher in fiscal 2022 as fiscal 2021 included the impact of temporary salary reductions and four-day work weeks in response to the COVID-19 pandemic. This was partially offset by lower restructuring costs of $3.5 million. Restructuring costs included within cost of products sold were $1.3 million in fiscal 2022, compared to $4.8 million in fiscal 2021. Material costs were also impacted by product sales mix.
Gross profit margin
Gross profit margin was 22.8% of net sales in fiscal 2022, compared to 25.2% of net sales in fiscal 2021. The decrease was due to higher material, logistics and other operating costs associated with global supply chain disruptions and factory inefficiencies, higher labor costs and product mix, partially offset by higher sales volumes.
18
Selling and administrative expenses
Selling and administrative expenses increased $7.2 million, or 5.7%, to $134.1 million (11.5% of net sales) in fiscal 2022, compared to $126.9 million (11.7% of net sales) in fiscal 2021. The increase was primarily due to higher stock-based compensation expense, salary expense and travel expense, partially offset by lower restructuring costs and professional fees.
Stock-based compensation expense increased $5.0 million as our long-term incentive plan was not introduced until the second quarter of fiscal 2021. Salary and travel expense was lower in fiscal 2021 as a result of actions we took in response to the COVID-19 pandemic which included temporary salary reductions and four-day work weeks (which ended in the second quarter of fiscal 2021) and the elimination of most business travel. Restructuring costs included within selling and administrative expenses were $2.3 million in fiscal 2022, compared to $3.4 million in fiscal 2021. Professional fees decreased $1.8 million mainly due to lower Hetronic-related legal fees.
Amortization of intangibles
Amortization of intangibles decreased $0.2 million, or 1.0%, to $19.1 million in fiscal 2022, compared to $19.3 million in fiscal 2021.
Interest expense, net
Interest expense, net was $3.5 million in fiscal 2022, compared to $5.2 million in fiscal 2021. The decrease was primarily due to lower average borrowings. Average borrowings were higher in fiscal 2021 due to the precautionary $100.0 million draw-down under our revolving credit facility in March 2020, which was fully repaid in the third quarter of fiscal 2021.
Other income, net
Other income, net decreased $1.9 million to $10.3 million in fiscal 2022, compared to $12.2 million in fiscal 2021. Net foreign exchange losses were $1.9 million in fiscal 2022, compared to $0.3 million in fiscal 2021. In fiscal 2022, we received $10.0 million of government assistance at certain of our international locations with respect to the COVID-19 pandemic, compared to $11.1 million in fiscal 2021. In addition, we received an international government grant of $1.1 million in fiscal 2022.
Income tax expense
Income tax expense increased $3.7 million, or 29.4%, to $16.3 million in fiscal 2022, compared to $12.6 million in fiscal 2021. Our effective tax rate increased to 13.8% in fiscal 2022, compared to 9.3% in fiscal 2021. In fiscal 2022, the effective income tax rate was favorably impacted by the amount of income earned in foreign jurisdictions with lower tax rates, the release of a valuation allowance of approximately $2.0 million due to a tax law change, and less U.S. tax on foreign income of $1.7 million attributable to lower earnings in non-U.S. jurisdictions, partially offset with non-deductible compensation of $2.1 million. In fiscal 2021, the effective income tax rate was favorably impacted by the amount of income earned in foreign jurisdictions with lower tax rates, tax credits and various deductions allowed in foreign jurisdictions. In addition, the Company received a benefit of approximately $7.2 million related to a favorable tax ruling in a foreign jurisdiction.
Net income
Net income decreased $20.1 million, or 16.4%, to $102.2 million in fiscal 2022, compared to $122.3 million in fiscal 2021. The impact of foreign currency translation increased net income by $1.1 million. Excluding foreign currency translation, net income decreased $21.2 million as a result of the reasons described above.
Operating Segments
Automotive
|
|
Fiscal Year Ended |
|
|||||
(in millions) |
|
April 30, 2022 |
|
|
May 1, 2021 |
|
||
Net sales |
|
|
|
|
|
|
||
North America |
|
$ |
400.9 |
|
|
$ |
406.4 |
|
EMEA |
|
$ |
216.5 |
|
|
$ |
212.3 |
|
Asia |
|
$ |
164.1 |
|
|
$ |
137.0 |
|
Net sales |
|
$ |
781.5 |
|
|
$ |
755.7 |
|
Gross profit |
|
$ |
150.0 |
|
|
$ |
163.4 |
|
As a percent of net sales |
|
|
19.2 |
% |
|
|
21.6 |
% |
Income from operations |
|
$ |
92.6 |
|
|
$ |
107.6 |
|
As a percent of net sales |
|
|
11.8 |
% |
|
|
14.2 |
% |
19
Net sales
Automotive segment net sales increased $25.8 million, or 3.4%, to $781.5 million in fiscal 2022, compared to $755.7 million in fiscal 2021. Sales volumes in fiscal 2021 were negatively impacted from the COVID-19 pandemic. Fiscal 2022 net sales benefitted from customer recoveries from spot buys of materials and premium freight costs of $13.2 million (primarily in North America). Excluding foreign currency translation and customer cost recoveries, net sales increased $9.4 million, or 1.2%.
Net sales in North America decreased $5.5 million, or 1.4%, to $400.9 million in fiscal 2022, compared to $406.4 million in fiscal 2021. The decrease was primarily due to lower lighting product sales volumes. Net sales in EMEA increased $4.2 million, or 2.0%, to $216.5 million in fiscal 2022, compared to $212.3 million in fiscal 2021. The weaker euro, relative to the U.S. dollar, decreased net sales in EMEA by $4.5 million. Excluding the impact of foreign currency translation, net sales in EMEA increased $8.7 million primarily due to higher sensor product sales. Net sales in Asia increased $27.1 million, or 19.8%, to $164.1 million in fiscal 2022, compared to $137.0 million in fiscal 2021. The stronger Chinese renminbi, relative to the U.S. dollar, increased net sales in Asia by $7.6 million. Excluding the impact of foreign currency translation, net sales in Asia increased $19.5 million primarily due to higher electric vehicle product sales volumes, partially offset by lower touchscreen sales volumes.
Gross profit
Automotive segment gross profit decreased $13.4 million, or 8.2%, to $150.0 million in fiscal 2022, compared to $163.4 million in fiscal 2021. Excluding the impact of foreign currency translation, gross profit decreased $14.3 million. Gross profit margins decreased to 19.2% in fiscal 2022, from 21.6% in fiscal 2021. The decrease in gross profit margins was primarily due to higher material and other costs associated with supply chain disruptions and product mix, partially offset by higher sales volumes and lower restructuring costs. In fiscal 2022, we recognized $0.1 million of restructuring costs in this segment, compared to $4.8 million in fiscal 2021.
Income from operations
Automotive segment income from operations decreased $15.0 million, or 13.9%, to $92.6 million in fiscal 2022, compared to $107.6 million in fiscal 2021. Excluding the impact of foreign currency translation, income from operations decreased $16.2 million. The decrease was primarily due to lower gross profit and higher selling and administrative expenses. Selling and administrative expenses increased due to higher salary expense, partially offset by lower restructuring costs. Salary expense was lower in fiscal 2021 due to the impact of salary reductions and other cost saving measures in response to the COVID-19 pandemic. Restructuring costs in this segment's selling and administrative expenses were $0.1 million in fiscal 2022, compared to $1.4 million in fiscal 2021.
Industrial
|
|
Fiscal Year Ended |
|
|||||
(in millions) |
|
April 30, 2022 |
|
|
May 1, 2021 |
|
||
Net sales |
|
$ |
318.1 |
|
|
$ |
267.9 |
|
Gross profit |
|
$ |
101.5 |
|
|
$ |
98.1 |
|
As a percent of net sales |
|
|
31.9 |
% |
|
|
36.6 |
% |
Income from operations |
|
$ |
67.1 |
|
|
$ |
64.3 |
|
As a percent of net sales |
|
|
21.1 |
% |
|
|
24.0 |
% |
Net sales
Industrial segment net sales increased $50.2 million, or 18.7%, to $318.1 million in fiscal 2022, compared to $267.9 million in fiscal 2021. Fiscal 2022 net sales included $7.6 million of customer cost recoveries of premium freight costs. Excluding the impact of foreign currency translation and customer cost recoveries, net sales increased $40.3 million, or 15.0%, due to higher sales volumes of all product categories in the Industrial segment. Sales volumes in fiscal 2021 were negatively impacted by the COVID-19 pandemic.
Gross profit
Industrial segment gross profit increased $3.4 million, or 3.5%, to $101.5 million in fiscal 2022, compared to $98.1 million in fiscal 2021. Excluding the impact of foreign currency translation, gross profit increased $2.3 million. Gross profit margin decreased to 31.9% in fiscal 2022, from 36.6% in fiscal 2021. The decrease in gross profit margins was due to lower gross profit margins from busbar products and commercial vehicle products and the recognition of $1.2 million of restructuring costs in this segment in fiscal 2022.
Income from operations
Industrial segment income from operations increased $2.8 million, or 4.4%, to $67.1 million in fiscal 2022, compared to $64.3 million in fiscal 2021. Excluding the impact of foreign currency translation, income from operations increased $2.0 million. The increase was primarily due to higher gross profit, partially offset by higher selling and administrative costs. Selling and administrative expenses were higher primarily due to $2.2 million of restructuring costs in this segment in fiscal 2022, compared to $1.0 million in fiscal 2021.
20
Interface
|
|
Fiscal Year Ended |
|
|||||
(in millions) |
|
April 30, 2022 |
|
|
May 1, 2021 |
|
||
Net sales |
|
$ |
59.8 |
|
|
$ |
61.6 |
|
Gross profit |
|
$ |
12.6 |
|
|
$ |
12.3 |
|
As a percent of net sales |
|
|
21.1 |
% |
|
|
20.0 |
% |
Income from operations |
|
$ |
9.9 |
|
|
$ |
8.9 |
|
As a percent of net sales |
|
|
16.6 |
% |
|
|
14.4 |
% |
Net sales
Interface segment net sales decreased $1.8 million, or 2.9%, to $59.8 million in fiscal 2022, compared to $61.6 million in fiscal 2021. Fiscal 2022 net sales benefitted from customer recoveries from spot buys of materials and premium freight costs of $1.3 million. Excluding customer cost recoveries, net sales decreased $3.1 million, or 5.0%. The decrease was primarily due to lower sales volumes of appliance products which were negatively impacted by a shortage of semiconductor chips, partially offset by higher sales volumes of legacy data solutions products.
Gross profit
Interface segment gross profit increased $0.3 million, or 2.4%, to $12.6 million in fiscal 2022, compared to $12.3 million in fiscal 2021. Gross profit margin increased to 21.1% in fiscal 2022, from 20.0% in fiscal 2021. The increase was due to higher sales volumes of legacy data solutions products.
Income from operations
Interface segment income from operations increased $1.0 million, or 11.2%, to $9.9 million in fiscal 2022, compared to $8.9 million in fiscal 2021. The increase was primarily due to higher gross profit and lower selling and administrative expenses. Selling and administrative expenses were lower due to restructuring costs of $0.7 million recognized in this segment in fiscal 2021.
Medical
|
|
Fiscal Year Ended |
|
|||||
(in millions) |
|
April 30, 2022 |
|
|
May 1, 2021 |
|
||
Net sales |
|
$ |
4.2 |
|
|
$ |
2.8 |
|
Gross profit |
|
$ |
(0.4 |
) |
|
$ |
(0.3 |
) |
Loss from operations |
|
$ |
(5.5 |
) |
|
$ |
(4.6 |
) |
Net sales
Medical segment net sales increased $1.4 million, or 50.0%, to $4.2 million in fiscal 2022, compared to $2.8 million in fiscal 2021. The increase was due to higher product demand.
Gross profit
Medical segment gross profit was a loss of $0.4 million in fiscal 2022, compared to a loss of $0.3 million in fiscal 2021. Gross profit was impacted by higher material costs and unfavorable sales mix, which offset the increase in net sales.
Loss from operations
Medical segment loss from operations increased $0.9 million, or 19.6%, to $5.5 million in fiscal 2022, compared to $4.6 million in fiscal 2021. The increase in the loss was due to higher selling and administrative expenses, primarily higher advertising expenses and professional fees.
Financial Condition, Liquidity and Capital Resources
Our liquidity requirements are primarily to fund our business operations, including capital expenditures and working capital requirements, as well as to fund debt service requirements, dividends and stock repurchases. Our primary sources of liquidity are cash flows from operations, existing cash balances and borrowings under our senior unsecured credit agreement. We believe our liquidity position will be sufficient to fund our existing operations and current commitments for at least the next twelve months. However, if economic conditions remain impacted for longer than we expect due to the COVID-19 pandemic and other geopolitical risks, including the Russia-Ukraine war and the lockdowns in China, our liquidity position could be severely impacted.
At April 30, 2022, we had $172.0 million of cash and cash equivalents, of which $107.0 million was held in subsidiaries outside the U.S. Cash held by these subsidiaries is used to fund operational activities and can be repatriated, primarily through the payment of dividends and the repayment of intercompany loans, without creating material additional income tax expense.
21
Share Buyback Program
On March 31, 2021, the Board of Directors authorized the purchase of up to $100.0 million of our common stock. Such purchases may be made on the open market, in private transactions or pursuant to purchase plans designed to comply with Rule 10b5-1 of the Securities Exchange Act of 1934. As of April 30, 2022, a total of 1,593,139 shares have been purchased at a total cost of $71.2 million since the commencement of the share buyback program. As of April 30, 2022, the dollar value of shares that remained available to be purchased under this share buyback program was approximately $28.8 million.
On June 16, 2022, the Board of Directors authorized an increase in our existing share buyback program under which we may purchase up to an additional $100.0 million of our outstanding common stock, and also extended the expiration from March 31, 2023 to June 14, 2024.
Credit Agreement
Our senior unsecured credit agreement provides for a $200.0 million revolving credit facility and a $250.0 million term loan. As of April 30, 2022, no principal was outstanding under the revolving credit facility and we have $199.9 million of availability under the revolving credit facility. As of April 30, 2022, $206.3 million in principal was outstanding under the term loan. The term loan matures in September 2023 and requires quarterly principal payments of $3.1 million over the five-year term, with the remaining balance due upon maturity. We were in compliance with all covenants under the Credit Agreement as of April 30, 2022. For further information, see Note 10, “Debt” to the consolidated financial statements included in this Annual Report.
On December 10, 2021, we entered into a First Amendment to the Credit Agreement (“First Amendment”). The First Amendment amended and restated the Credit Agreement to provide, among other things, that upon the occurrence of certain events, the interest rate calculation method will generally transition from the London Interbank Offered Rate (“LIBOR”) to an alternate reference rate, including the Secured Overnight Financing Rate (“SOFR”) for U.S. dollar denominated borrowings. The consequences of the discontinuance of LIBOR cannot be entirely predicted but could result in an increase in our cost of borrowing.
Our senior unsecured credit agreement provides an option to increase the size of our revolving credit facility and term loan by an additional $200.0 million, subject to customary conditions and approval of the lenders providing the new commitments. There can be no assurance that lenders will approve additional commitments under current circumstances. We may seek to raise additional capital and our access to, and cost of, financing will depend on, among other things, global economic conditions, conditions in the global financing markets, the availability of sufficient amounts of financing, and our future prospects.
Cash Flows
|
|
Fiscal Year Ended |
|
|||||
(in millions) |
|
April 30, 2022 |
|
|
May 1, 2021 |
|
||
Operating activities: |
|
|
|
|
|
|
||
Net income |
|
$ |
102.2 |
|
|
$ |
122.3 |
|
Non-cash items |
|
|
66.4 |
|
|
|
50.7 |
|
Changes in operating assets and liabilities |
|
|
(69.8 |
) |
|
|
6.8 |
|
Net cash provided by operating activities |
|
|
98.8 |
|
|
|
179.8 |
|
Net cash used in investing activities |
|
|
(37.4 |
) |
|
|
(24.8 |
) |
Net cash used in financing activities |
|
|
(114.6 |
) |
|
|
(142.9 |
) |
Effect of foreign currency exchange rate changes on cash and cash equivalents |
|
|
(8.0 |
) |
|
|
3.8 |
|
(Decrease) increase in cash and cash equivalents |
|
|
(61.2 |
) |
|
|
15.9 |
|
Cash and cash equivalents at beginning of the period |
|
|
233.2 |
|
|
|
217.3 |
|
Cash and cash equivalents at end of the period |
|
$ |
172.0 |
|
|
$ |
233.2 |
|
Operating activities
Net cash provided by operating activities decreased $81.0 million to $98.8 million in fiscal 2022, compared to $179.8 million in fiscal 2021. The decrease was due to higher cash outflows related to changes in operating assets and liabilities. The $69.8 million of cash outflows for operating assets and liabilities in fiscal 2022 was primarily due to higher inventory (as a result of global supply chain and logistics disruptions) and lower accounts payable and other liabilities.
Investing activities
Net cash used in investing activities was $37.4 million in fiscal 2022, compared to $24.8 million in fiscal 2021. The activity primarily represents capital expenditures in both fiscal years. We received $0.6 million of cash from the sale of property, plant and equipment in fiscal 2022.
22
Financing activities
Net cash used in financing activities was $114.6 million in fiscal 2022, compared to $142.9 million in fiscal 2021. In fiscal 2022, we used $64.5 million of cash for the purchase of shares under our share buyback program, compared to $6.7 million in fiscal 2021. We paid cash dividends of $20.4 million in fiscal 2022, compared to $17.4 million in fiscal 2021. We increased our quarterly dividend from $0.11 per share to $0.14 per share in the first quarter of fiscal 2022. In fiscal 2022, we paid $0.3 million in taxes related to the net share settlement of equity awards compared to $3.9 million in fiscal 2021. In fiscal 2022, we had net repayments on our borrowings of $29.2 million. In fiscal 2021, we had net repayments on our borrowings of $115.2 million, which included the repayment of the $100.0 million precautionary draw-down on our revolving credit facility from March 2020.
Contractual Obligations
The following table summarizes our significant contractual obligations and commercial commitments as of April 30, 2022:
|
|
Payments Due By Period |
|
|||||||||||||||||
(in millions) |
|
Total |
|
|
Less than |
|
|
1-3 years |
|
|
3-5 years |
|
|
More than |
|
|||||
Finance leases |
|
$ |
0.8 |
|
|
$ |
0.4 |
|
|
$ |
0.3 |
|
|
$ |
0.1 |
|
|
$ |
— |
|
Operating leases |
|
|
24.0 |
|
|
|
6.5 |
|
|
|
7.3 |
|
|
|
3.2 |
|
|
|
7.0 |
|
Debt (1) |
|
|
211.4 |
|
|
|
13.0 |
|
|
|
197.1 |
|
|
|
0.4 |
|
|
|
0.9 |
|
Estimated interest on debt (2) |
|
|
5.6 |
|
|
|
3.7 |
|
|
|
1.7 |
|
|
|
0.1 |
|
|
|
0.1 |
|
Deferred compensation |
|
|
8.0 |
|
|
|
1.6 |
|
|
|
1.9 |
|
|
|
1.8 |
|
|
|
2.7 |
|
Total |
|
$ |
249.8 |
|
|
$ |
25.2 |
|
|
$ |
208.3 |
|
|
$ |
5.6 |
|
|
$ |
10.7 |
|
Off-Balance Sheet Arrangements
We do not have any off-balance sheet arrangements as defined under SEC rules.
Legal Matters
For several years, Hetronic Germany-GmbH and Hydronic-Steuersysteme-GmbH (the “Fuchs companies”) served as our distributors for Germany, Austria and other central and eastern European countries pursuant to their respective intellectual property licenses and distribution and assembly agreements. We became aware that the Fuchs companies and their managing director, Albert Fuchs, had materially violated those agreements. As a result, we terminated all of our agreements with the Fuchs companies. On June 20, 2014, we filed a lawsuit against the Fuchs companies in the Federal District Court for the Western District of Oklahoma alleging material breaches of the distribution and assembly agreements and seeking damages, as well as various forms of injunctive relief. The defendants filed counterclaims alleging breach of contract, interference with business relations and business slander. On April 2, 2015, we amended our complaint against the Fuchs companies to add additional unfair competition and Lanham Act claims and to add additional affiliated parties.
A trial with respect to the matter began in February 2020. During the trial, the defendants dismissed their one remaining counterclaim with prejudice. On March 2, 2020, the jury returned a verdict in favor of the Company. The verdict included approximately $102 million in compensatory damages and $11 million in punitive damages. On April 22, 2020, the Court entered a permanent injunction barring defendants from selling infringing products and ordering them to return Hetronic’s confidential information. Defendants appealed entry of the permanent injunction. On May 29, 2020, the Court held defendants in contempt for violating the permanent injunction and entered the final judgment. Defendants appealed entry of the final monetary judgment as well. The appeal of the permanent injunction and the appeal of the final judgment were consolidated into a single appeal before the U.S. Court of Appeals for the Tenth Circuit. On August 24, 2021, the Tenth Circuit issued a decision affirming the lower court’s ruling with the exception that it instructed the District Court to modify the injunction from the entire world to all of the countries in which Hetronic sells its products. On April 20 and 21, 2022, the District Court held a hearing related to modifying the injunction pursuant to the Tenth Circuit’s opinion, and the parties currently are preparing post-hearing briefs. The defendants also filed a petition for certiorari with the United States Supreme Court seeking to further appeal the extraterritorial application of the Lanham Act in this case. Hetronic has opposed that petition. The Supreme Court has requested the views of the Solicitor General on the petition for certiorari. Like any judgment, particularly any judgment involving defendants outside of the United States, there is no guarantee that we will be able to collect all or any portion of the judgment.
We incurred legal fees of $3.3 million, $5.7 million and $5.4 million in fiscal 2022, fiscal 2021 and fiscal 2020, respectively, related to the lawsuits. These amounts are included in the selling and administrative expenses and as part of the Industrial segment.
23
Critical Accounting Policies and Estimates
The preparation of financial statements in conformity with GAAP requires that we make estimates and assumptions that can affect amounts reported in the consolidated financial statements and notes. In preparing our consolidated financial statements, we have made our best estimates and judgments of certain amounts included in the consolidated financial statements. We base our estimates on historical experience and on various other assumptions that we believe to be reasonable. To the extent that there are differences between these estimates and actual results, our consolidated financial statements may be materially affected. Below are the estimates that we believe are critical to the understanding of our results of operations and financial condition. Other accounting policies are described in Note 1, “Description of Business and Summary of Significant Accounting Policies” to the consolidated financial statements included in this Annual Report.
The full impact of the COVID-19 pandemic is unknown and cannot be reasonably estimated for these key estimates and assumptions. However, we made appropriate accounting estimates based on the facts and circumstances available as of the reporting date.
Revenue recognition. Most of our revenue is recognized at a point in time. We have determined that the most definitive demonstration that control has transferred to a customer is physical shipment or delivery, depending on the contractual shipping terms, except for consignment transactions. Consignment transactions are arrangements where we transfer products to a customer location but retain ownership and control of such product until it is used by the customer. Revenue for consignment arrangements is recognized upon the customer’s usage.
Revenue associated with products which we believe have no alternative use, and where we have an enforceable right to payment, are recognized on an over time basis. Revenue is recognized based on progress to date, which is typically even over the production process through transfer of control to the customer.
In addition, from time to time, customers may negotiate annual price downs. Management has evaluated these price downs and determined that in some instances, these price downs give rise to a material right. In instances that a material right exists, a portion of the transaction price is allocated to the material right and recognized over the life of the contract.
Allowance for excess and obsolete inventory. Inventories are valued at the lower of cost or net realizable value and have been reduced by allowances for excess and obsolete inventories. The estimated allowances are based on our review of inventories on hand compared to estimated future usage and sales, using assumptions about future product life cycles, product demand and market conditions. If actual product life cycles, product demand and market conditions are less favorable than those projected by us, inventory write-downs may be required.
Goodwill. Goodwill is not amortized but is tested for impairment on at least an annual basis. Goodwill is evaluated at the reporting unit level by comparing the fair value of the reporting unit to its carrying amount including goodwill. An impairment of goodwill exists if the carrying amount of the reporting unit exceeds its fair value. The impairment loss is the amount by which the carrying amount exceeds the reporting unit’s fair value, limited to the total amount of goodwill allocated to that reporting unit. In performing the goodwill impairment test, we have the option to first assess qualitative factors to determine whether the existence of events or circumstances leads to a determination that it is more likely than not that the estimated fair value of a reporting unit is less than its carrying amount.
Qualitative factors include, but are not limited to, the results of prior year fair value calculations, the movement of our share price and market capitalization, the reporting unit and overall financial performance, and macroeconomic and industry conditions. We consider the qualitative factors and weight of the evidence obtained to determine if it is more likely than not that a reporting unit’s fair value is less than the carrying amount. If, after assessing the qualitative factors, we were to determine that it is more likely than not that the fair value of a reporting unit is less than its carrying value, then a quantitative assessment is performed. We may also elect to proceed directly to the quantitative assessment without considering such qualitative factors.
For the quantitative assessment, we utilize either, or a combination of, the income approach and market approach to estimate the fair value of the reporting unit. The income approach uses a discounted cash flow method and the market approach uses appropriate valuation multiples observed for the reporting unit’s guideline public companies. The determination of discounted cash flows is based on our long-range forecasts and requires assumptions related to revenue and operating income growth, asset-related expenditures, working capital levels, and other market participant assumptions. The revenue growth rates included in the forecasts are our best estimates based on current and anticipated market conditions, and the profitability assumptions are projected based on current and anticipated cost structures. Long-range forecasting involves uncertainty which increases with each successive period. Key assumptions, such as revenue growth rates and profitability, especially in the outer years, involve a greater degree of uncertainty.
24
Impairment of long-lived assets. We evaluate whether events and circumstances have occurred which indicate that the remaining estimated useful lives of our intangible assets, excluding goodwill, and other long-lived assets, may warrant revision or that the remaining balance of such assets may not be recoverable. If impairment indicators exist, we perform an impairment analysis by comparing the undiscounted cash flows resulting from the use of the asset group to the carrying amount. If the carrying amount exceeds the undiscounted cash flows, an impairment loss is recognized based on the excess of the asset’s carrying amount over its fair value.
Income taxes. Our income tax expense and deferred tax assets and liabilities reflect management’s best assessment of estimated current and future taxes to be paid. We are subject to income taxes in the U.S. and numerous foreign jurisdictions. Significant judgments and estimates are required in determining the consolidated income tax provision and in evaluating income tax uncertainties.
The amount of income taxes we pay is subject to ongoing audits by federal, state and foreign tax authorities. Our estimate of the potential outcome of any uncertain tax issue is subject to management’s assessment of relevant risks, facts, and circumstances existing at that time. We use a more-likely-than-not threshold for financial statement recognition and measurement of tax positions taken or expected to be taken in a tax return. We record a liability for the difference between the benefit recognized and measured and tax position taken or expected to be taken on our tax return. To the extent that our assessment of such tax positions changes, the change in estimate is recorded in the period in which the determination is made. We report tax-related interest and penalties as a component of income tax expense.
Our deferred tax assets and liabilities reflect temporary differences between the amount of assets and liabilities for financial and tax reporting purposes. We adjust these amounts to reflect changes in tax rates expected to be in effect when the temporary differences reverse. We record a valuation allowance to reduce our deferred tax assets to the amount that is more likely than not to be realized. We evaluate our ability to realize the tax benefits associated with deferred tax assets by assessing the adequacy of future expected taxable income, including the reversal of existing temporary differences, historical and projected operating results, and the availability of prudent and feasible tax planning strategies. The realization of tax benefits is evaluated by jurisdiction and the realizability of these assets can vary based on the character of the tax attribute and the carryforward periods specific to each jurisdiction. In the event we were to determine that we would be able to realize our deferred tax assets in the future in excess of its net recorded amount, an adjustment to the deferred tax asset would decrease income tax expense in the period a determination was made. Likewise, should we determine that we would not be able to realize all or part of our net deferred tax asset in the future, an adjustment to the deferred tax asset would be recorded to income tax expense in the period such determination was made.
We provide for taxes that may be payable if undistributed earnings of overseas subsidiaries were to be remitted to the U.S., except for those earnings that we consider to be permanently reinvested. Future sales of foreign subsidiaries are not exempt from capital gains tax in the U.S. We have no plans to dispose of any of our foreign subsidiaries and are not recording deferred taxes on outside basis differences in foreign subsidiaries for the sale of a foreign subsidiary.
Contingencies. We are subject to various investigations, claims and legal and administrative proceedings covering a wide range of matters that arise in the ordinary course of business activities. A significant amount of judgment and use of estimates is required to quantify our ultimate exposure in these matters. For those matters that we can estimate a range of loss, we have established reserves at levels within that range to provide for the most likely scenario based upon available information. The valuation of reserves for contingencies is reviewed on a quarterly basis to ensure that we are properly reserved. Reserve balances are adjusted to account for changes in circumstances for ongoing issues and the establishment of additional reserves for emerging issues. While we believe that the current level of reserves is adequate, changes in the future could impact these determinations.
New Accounting Pronouncements
For more information regarding new applicable accounting pronouncements, see Note 1, “Description of Business and Summary of Significant Accounting Policies” to the consolidated financial statements included in this Annual Report.
25
Item 7A. Quantitative and Qualitative Disclosures About Market Risk
We are exposed to market risks from foreign currency exchange, interest rates, and commodity prices, which could affect our operating results, financial position and cash flows. We manage a portion of these risks through use of derivative financial instruments in accordance with our policies. We do not enter into derivative financial instruments for speculative or trading purposes.
Foreign currency risk
We are exposed to foreign currency risk on sales, costs and assets and liabilities denominated in currencies other than the U.S. dollar. We seek to manage our foreign exchange risk largely through operational means, including matching revenue with same-currency costs and assets with same-currency liabilities. We currently transact business in eight primary currencies worldwide, of which the most significant are the U.S. dollar, the euro, the Mexican peso, and the Chinese renminbi.
A portion of our balance sheet is exposed to foreign currency exchange rate fluctuations, which may result in non-operating foreign currency exchange gains or losses upon remeasurement. In fiscal 2022, we reported foreign currency exchange losses of approximately $1.9 million, which were primarily attributed to the remeasurement of net monetary assets and liabilities denominated in currencies other than the functional currencies of our subsidiaries. In January 2021, we began to use foreign currency forward contracts to provide an economic hedge against balance sheet exposure to certain monetary assets and liabilities denominated in currencies other than the functional currency of the subsidiary. The forward contracts have a maturity of less than three months and are not designated as hedging instruments. As of April 30, 2022, the notional value of these outstanding contracts was $38.6 million, and the net unrealized loss was $0.2 million. The impact of a change in the foreign currency exchange rates on our foreign currency forward contracts will generally be offset against the gain or loss from the re-measurement of the underlying balance sheet exposure.
The translation of the assets and liabilities of our international subsidiaries is made using the foreign currency exchange rates as of the end of the reporting period. Translation adjustments are not included in determining net income but are included in accumulated other comprehensive income (loss) within shareholders’ equity on the consolidated balance sheets until a sale or substantially complete liquidation of the net investment in the international subsidiary takes place. As of April 30, 2022, the cumulative net currency translation adjustments decreased shareholders’ equity by $30.5 million. We have outstanding a euro denominated cross-currency swap which is treated as a net investment hedge to reduce our exposure to translational exchange risk. As of April 30, 2022, we recorded a deferred gain, net of tax, of $1.5 million related to the cross-currency swap.
Interest rate risk
We are exposed to interest rate risk on borrowings under our senior unsecured credit agreement which is based on LIBOR. As of April 30, 2022, we had $206.3 million of borrowings under our senior unsecured credit agreement. In April 2021, we began to manage our interest rate exposures through the use of interest rate swaps to effectively convert a portion of our variable-rate debt to a fixed rate. The notional amount of our interest rate swaps was $100.0 million as of April 30, 2022. Based on borrowings outstanding under our senior unsecured credit agreement at April 30, 2022, net of the interest rate swaps, we estimate that a 1% increase in interest rates would result in increased annual interest expense of $1.1 million.
Commodity price risk
We are exposed to commodity price risk primarily on our raw material purchases. These raw materials are not rare or unique to our industry. The cost of copper, resins, and other commodities, such as fuel and energy, has fluctuated in recent years due to changes in global supply and demand. The cost of copper increased significantly in fiscal 2022. Our gross margins could be affected if these types of costs continue to fluctuate. We actively manage these raw material costs through global sourcing initiatives and price increases on our products where possible. However, in the short-term, further increases in raw material costs can be very difficult to fully offset with price increases because of contractual agreements with our customers, which would unfavorably impact our gross margins.
Item 8. Financial Statements and Supplementary Data
The consolidated financial statements and supplementary data are filed within this Annual Report under Item 15, “Exhibits, Financial Statement Schedules.”
Item 9. Changes in and Disagreements with Accountants on Accounting and Financial Disclosure Item 9A.
None.
26
Controls and Procedures
Evaluation of Disclosure Controls and Procedures
Our management, under the supervision and with the participation of our Chief Executive Officer and our Chief Financial Officer, performed an evaluation of the effectiveness of the design and operation of our disclosure controls and procedures as of April 30, 2022. As defined in Rules 13a-15(e) under the Exchange Act, disclosure controls and procedures are controls and procedures designed to provide reasonable assurance that the information required to be disclosed by us in the reports that we file or submit under the Exchange Act is recorded, processed, summarized and reported within the time periods specified in the SEC’s applicable rules and forms. Based upon this evaluation, our Chief Executive Officer and Chief Financial Officer have concluded that our disclosure controls and procedures were effective at the reasonable assurance level as of April 30, 2022.
Management’s Report on Internal Control over Financial Reporting
Management is responsible for establishing and maintaining adequate internal control over financial reporting, as such term is defined in Exchange Act Rules 13a-15(f) and 15d-15(f). Under the supervision of our Chief Executive Officer and Chief Financial Officer, management conducted an evaluation of the effectiveness of our internal control over financial reporting as of April 30, 2022 based on the guidelines established in Internal Control — Integrated Framework (2013 Framework) issued by the Committee of Sponsoring Organizations of the Treadway Commission (“COSO”). Our internal control over financial reporting includes policies and procedures that provide reasonable assurance regarding the reliability of financial reporting and the preparation of financial statements for external reporting purposes in accordance with U.S. GAAP.
Based upon this evaluation, our management concluded that our internal control over financial reporting was effective as of April 30, 2022. Management reviewed the results of its assessment with the Audit Committee. Our independent registered public accounting firm, Ernst & Young LLP, has issued an attestation report on our internal control over financial reporting. This report is included on page F-4 of this Annual Report.
Changes in Internal Control over Financial Reporting
There were no changes in our internal control over financial reporting identified in connection with the evaluation required by paragraph (d) of Exchange Act Rules 13a-15 or 15d-15 that was conducted during the last fiscal quarter that have materially affected, or are reasonably likely to materially affect, our internal control over financial reporting.
Inherent Limitations on Effectiveness of Controls
Our management, including our Chief Executive Officer and Chief Financial Officer, do not expect that our disclosure controls or our internal control over financial reporting will prevent all errors and all fraud. A control system, no matter how well conceived and operated, can provide only reasonable, not absolute, assurance that the objectives of the control system are met. Further, the design of a control system must reflect the fact that there are resource constraints, and the benefits of controls must be considered relative to their costs. Because of the inherent limitations in all control systems, no evaluation of controls can provide absolute assurance that all control issues and instances of fraud, if any, within the Company have been detected. These inherent limitations include the realities that judgments in decision-making can be faulty, and that breakdowns can occur because of a simple error or mistake. Additionally, controls can be circumvented by the individual acts of some persons, by collusion of two or more people or by a management override of the controls. The design of any system of controls also is based in part upon certain assumptions about the likelihood of future events, and there can be no assurance that any design will succeed in achieving its stated goals under all potential future conditions; over time, controls may become inadequate because of changes in conditions, or the degree of compliance with policies or procedures may deteriorate. Because of the inherent limitations in a cost-effective control system, misstatements due to error or fraud may occur and not be detected.
Item 9B. Other Information
None.
Item 9C. Disclosure Regarding Foreign Jurisdictions that Prevent Inspections
Not applicable.
27
PART III
Item 10. Directors, Executive Officers and Corporate Governance
The information required by this item regarding our directors and corporate governance matters is incorporated by reference herein to the definitive proxy statement for our 2022 annual meeting under the captions “Proposal One Election of Directors” and “Corporate Governance.” The information required by this item regarding our executive officers appears as a supplementary item following Item 4 under Part I of this Annual Report. The information required by this item regarding compliance with Section 16(a) of the Exchange Act and information regarding our Audit Committee is incorporated by reference herein to the definitive proxy statement for our 2022 annual meeting under the captions “Delinquent Section 16(a) Reports” and “Audit Committee Matters,” respectively.
We have adopted a Code of Business Conduct (the “Code”) that applies to our directors, our principal executive officer, principal financial officer, principal accounting officer or controller and persons performing similar functions, as well as other employees. The Code is publicly available on our website at www.methode.com. If we make any substantive amendments to the Code or grant any waiver, including any implicit waiver, from a provision of the Code to our principal executive officer, principal financial officer, principal accounting officer or controller or persons performing similar functions, we will disclose the nature of such amendment or waiver on our website or in a report on Form 8-K in accordance with applicable rules and regulations. The information contained on our website is not incorporated by reference into this Annual Report.
Item 11. Executive Compensation
The information required by this item is incorporated by reference herein to the definitive proxy statement for our 2022 annual meeting under the captions “Compensation Discussion and Analysis”, “Compensation Committee Report”, “CEO Pay Ratio”, “Executive Compensation Tables” and “Director Compensation.”
Item 12. Security Ownership of Certain Beneficial Owners and Management and Related Stockholder Matters
Except as set forth herein, the information required by this item is incorporated by reference herein to the definitive proxy statement for our 2022 annual meeting under the caption “Security Ownership.”
Equity Compensation Plan Information
The following table provides information about our equity compensation plans as of April 30, 2022. All outstanding awards relate to our common stock. Shares issued under all of the following plans may be from our treasury, newly issued or both.
Plan category |
|
Number of |
|
|
Weighted- |
|
|
Number of |
|
|||
Equity compensation plans approved by security holders |
|
|
1,955,759 |
|
|
37.01(1) |
|
|
|
112,255 |
|
|
Equity compensation plans not approved by security holders |
|
|
— |
|
|
|
— |
|
|
|
— |
|
Total |
|
|
1,955,759 |
|
|
$ |
37.01 |
|
|
|
112,255 |
|
The information required by this item is incorporated by reference herein to the definitive proxy statement for our 2022 annual meeting under the captions “Corporate Governance” and “Other Information.”
Item 14. Principal Accountant Fees and Services
The information required by this item is incorporated by reference herein to the definitive proxy statement for our 2022 annual meeting under the caption “Audit Committee Matters.”
28
PART IV
Item 15. Exhibits, Financial Statement Schedules
Reference is made to the Index to Consolidated Financial Statements on Page F-1.
(2) Consolidated Financial Statement Schedule.
Reference is made to the Index to Financial Statement Schedule on Page F-1.
(3) Exhibits.
EXHIBIT INDEX
|
Exhibit Number |
|
Description |
3.1 |
|
|
3.2 |
|
|
4.1 |
|
|
4.2 |
|
|
10.1* |
|
|
10.2* |
|
|
10.3* |
|
|
10.4* |
|
|
10.5* |
|
|
10.6* |
|
|
10.7* |
|
|
10.8* |
|
|
10.9* |
|
|
10.10* |
|
|
10.11* |
|
|
10.12* |
|
|
10.13* |
|
29
10.14 |
|
|
10.15* |
|
|
10.16* |
|
|
10.17* |
|
|
10.18* |
|
|
10.19* |
|
|
10.20* |
|
|
10.21* |
|
|
10.22* |
|
|
10.23* |
|
|
10.24* |
|
|
10.25* |
|
|
10.26 |
|
|
10.27* |
|
|
10.28* |
|
|
21 |
|
|
23 |
|
|
31.1 |
|
Rule 13a-14(a)/15d-14(a) Certification of Principal Executive Officer. |
31.2 |
|
Rule 13a-14(a)/15d-14(a) Certification of Principal Financial Officer. |
32** |
|
Certification of Periodic Financial Report Pursuant to 18 U.S.C. Section 1350. |
101.INS |
|
Inline XBRL Instance Document – the instance document does not appear in the Interactive Data File because XBRL tags are embedded within the Inline XBRL Document |
101.SCH |
|
Inline XBRL Taxonomy Extension Schema Document |
101.CAL |
|
Inline XBRL Taxonomy Extension Calculation Linkbase Document |
101.LAB |
|
Inline XBRL Taxonomy Extension Label Linkbase Document |
101.PRE |
|
Inline XBRL Taxonomy Extension Presentation Linkbase Document |
101.DEF |
|
Inline XBRL Taxonomy Extension Definition Linkbase Document |
104 |
|
Cover Page Interactive Data File (embedded within the Inline XBRL Document) |
* Management Compensatory Plan
** Indicates that the exhibit is being furnished with this report and not filed as part of it.
Item 16.
None.
30
SIGNATURES
Form 10-K Summary Pursuant to the requirements of Section 13 or 15 (d) of the Securities Exchange Act of 1934, the Registrant has duly caused this annual report on Form 10-K to be signed on its behalf by the undersigned, thereunto duly authorized.
|
METHODE ELECTRONICS, INC. |
|
|
(Registrant) |
|
|
|
|
|
By: |
/s/ RONALD L.G. TSOUMAS |
|
Ronald L.G. Tsoumas |
|
|
Chief Financial Officer |
|
|
(Principal Financial Officer) |
|
Dated: June 23, 2022
31
Pursuant to the requirements of the Securities Exchange Act of 1934, this annual report on Form 10-K has been signed below by the following persons on behalf of the Registrant and in the capacities and on the dates indicated.
Signature |
|
Title |
|
Date |
|
|
|
|
|
/s/ WALTER J. ASPATORE |
|
Chairman of the Board |
|
June 23, 2022 |
|
Walter J. Aspatore
|
|
|
|
|
|
|
|
|
|
/s/ LAWRENCE B. SKATOFF |
|
Vice Chairman of the Board |
|
June 23, 2022 |
|
Lawrence B. Skatoff
|
|
|
|
|
|
|
|
|
|
/s/ DONALD W. DUDA |
|
Chief Executive Officer, President & Director |
|
June 23, 2022 |
|
Donald W. Duda
|
|
(Principal Executive Officer) |
|
|
|
|
|
|
|
/s/ RONALD L.G. TSOUMAS |
|
Chief Financial Officer |
|
June 23, 2022 |
|
Ronald L.G. Tsoumas
|
|
(Principal Financial Officer) |
|
|
|
|
|
|
|
/s/ AMIT N. PATEL |
|
Chief Accounting Officer |
|
June 23, 2022 |
|
Amit N. Patel
|
|
(Principal Accounting Officer) |
|
|
|
|
|
|
|
/s/ DAVID P. BLOM |
|
Director |
|
June 23, 2022 |
|
David P. Blom
|
|
|
|
|
|
|
|
|
|
/s/ THERESE M. BOBEK |
|
Director |
|
June 23, 2022 |
|
Therese M. Bobek
|
|
|
|
|
|
|
|
|
|
/s/ BRIAN J. CADWALLADER |
|
Director |
|
June 23, 2022 |
|
Brian J. Cadwallader
|
|
|
|
|
|
|
|
|
|
/s/ BRUCE K. CROWTHER |
|
Director |
|
June 23, 2022 |
|
Bruce K. Crowther
|
|
|
|
|
|
|
|
|
|
/s/ DARREN M. DAWSON |
|
Director |
|
June 23, 2022 |
|
Darren M. Dawson
|
|
|
|
|
|
|
|
|
|
/s/ JANIE GODDARD |
|
Director |
|
June 23, 2022 |
|
Janie Goddard
|
|
|
|
|
|
|
|
|
|
/s/ MARY A. LINDSEY |
|
Director |
|
June 23, 2022 |
|
Mary A. Lindsey
|
|
|
|
|
|
|
|
|
|
/s/ ANGELO V. PANTALEO |
|
Director |
|
June 23, 2022 |
|
Angelo V. Pantaleo
|
|
|
|
|
|
/s/ MARK D. SCHWABERO |
|
Director |
|
June 23, 2022 |
Mark D. Schwabero |
|
|
|
|
|
|
|
|
|
32
METHODE ELECTRONICS, INC. AND SUBSIDIARIES
INDEX TO CONSOLIDATED FINANCIAL STATEMENTS
AND FINANCIAL STATEMENT SCHEDULE
|
Consolidated Financial Statements: |
Page |
|
|
|
|
Report of Independent Registered Public Accounting Firm (PCAOB ID: 42) |
F-2 |
|
|
|
|
Consolidated Balance Sheets — April 30, 2022 and May 1, 2021 |
F-5 |
|
|
|
|
Consolidated Statements of Income — Years Ended April 30, 2022, May 1, 2021 and May 2, 2020 |
F-6 |
|
|
|
|
F-7 |
|
|
|
|
|
F-8 |
|
|
|
|
|
Consolidated Statements of Cash Flows — Years Ended April 30, 2022, May 1, 2021 and May 2, 2020 |
F-9 |
|
|
|
|
F-10 |
|
|
|
|
|
Consolidated Financial Statement Schedule: |
|
|
|
|
|
F-34 |
All other schedules for which provision is made in the applicable accounting regulation of the Securities and Exchange Commission are not required under the related instructions or are immaterial and, therefore, have been omitted.
F-1
Report of Independent Registered Public Accounting Firm
To the Shareholders and the Board of Directors of Methode Electronics, Inc.
Opinion on the Financial Statements
We have audited the accompanying consolidated balance sheets of Methode Electronics, Inc. and subsidiaries (the Company) as of April 30, 2022 and May 1, 2021, the related consolidated statements of income, comprehensive income, shareholders' equity and cash flows for each of the three years in the period ended April 30, 2022, and the related notes and financial statement schedule listed in the Index at Item 15(a)(2) (collectively referred to as the “consolidated financial statements”). In our opinion, the consolidated financial statements present fairly, in all material respects, the financial position of the Company at April 30, 2022 and May 1, 2021, and the results of its operations and its cash flows for each of the three years in the period ended April 30, 2022, in conformity with U.S. generally accepted accounting principles.
We also have audited, in accordance with the standards of the Public Company Accounting Oversight Board (United States) (PCAOB), the Company's internal control over financial reporting as of April 30, 2022, based on criteria established in Internal Control-Integrated Framework issued by the Committee of Sponsoring Organizations of the Treadway Commission (2013 framework) and our report dated June 23, 2022 expressed an unqualified opinion thereon.
Basis for Opinion
These financial statements are the responsibility of the Company's management. Our responsibility is to express an opinion on the Company’s financial statements based on our audits. We are a public accounting firm registered with the PCAOB and are required to be independent with respect to the Company in accordance with the U.S. federal securities laws and the applicable rules and regulations of the Securities and Exchange Commission and the PCAOB.
We conducted our audits in accordance with the standards of the PCAOB. Those standards require that we plan and perform the audit to obtain reasonable assurance about whether the financial statements are free of material misstatement, whether due to error or fraud. Our audits included performing procedures to assess the risks of material misstatement of the financial statements, whether due to error or fraud, and performing procedures that respond to those risks. Such procedures included examining, on a test basis, evidence regarding the amounts and disclosures in the financial statements. Our audits also included evaluating the accounting principles used and significant estimates made by management, as well as evaluating the overall presentation of the financial statements. We believe that our audits provide a reasonable basis for our opinion.
Critical Audit Matter
The critical audit matter communicated below is a matter arising from the current period audit of the consolidated financial statements that was communicated or required to be communicated to the audit committee and that: (1) relates to accounts or disclosures that are material to the consolidated financial statements and (2) involved our especially challenging, subjective or complex judgments. The communication of the critical audit matter does not alter in any way our opinion on the consolidated financial statements, taken as a whole, and we are not, by communicating the critical audit matter below, providing a separate opinion on the critical audit matter or on the account or disclosure to which it relates.
Goodwill Impairment Assessment
Description of the Matter |
|
At April 30, 2022, the balance of the Company’s goodwill was $233.0 million. As discussed in Note 7 to the consolidated financial statements, goodwill is tested for impairment at least annually or when impairment indicators are present at the reporting unit. Auditing management’s assessment of goodwill impairment requires judgment to evaluate the effects of macroeconomic and industry conditions on the fair value of the reporting units. The fair value estimate can be sensitive to significant assumptions such as revenue growth rates, gross profit, and the discount rate. The estimate also includes assumptions related to the terminal growth rate, capital expenditures, working capital levels, and other market participant assumptions.
|
F-2
How We Addressed the Matter in Our Audit |
|
We obtained an understanding, evaluated the design and tested the operating effectiveness of controls over the Company’s goodwill impairment assessment process. This included testing controls over management’s assessment of qualitative factors and review of the prospective financial information and other key assumptions used in the valuation model as well as controls over the carrying value of the reporting units. To test the goodwill impairment assessment, our audit procedures included, among others, considering existing events and circumstances in evaluating the Company’s assessment of qualitative factors, evaluating the Company's use of the income approach, testing the significant assumptions described above used to develop the prospective financial information, and testing the completeness and accuracy of the underlying data. For example, we compared certain qualitative assessment considerations and significant assumptions to current industry, market and economic trends. We also compared significant assumptions to historical performance, and other guideline companies within the same industry. We performed a sensitivity analysis of the significant assumptions when necessary to evaluate the change in the fair value of the reporting units resulting from changes in the assumptions. We also assessed the historical accuracy of management’s forecasting process and involved our valuation specialists to assist in testing certain significant assumptions in the fair value estimate.
|
/s/ Ernst & Young LLP
We have served as the Company’s auditor since 1966.
Chicago, Illinois
June 23, 2022
F-3
Report of Independent Registered Public Accounting Firm
To the Shareholders and the Board of Directors of Methode Electronics, Inc.
Opinion on Internal Control over Financial Reporting
We have audited Methode Electronics, Inc. and subsidiaries’ internal control over financial reporting as of April 30, 2022, based on criteria established in Internal Control-Integrated Framework issued by the Committee of Sponsoring Organizations of the Treadway Commission (2013 framework) (the COSO criteria). In our opinion, Methode Electronics, Inc. and subsidiaries (the Company) maintained, in all material respects, effective internal control over financial reporting as of April 30, 2022, based on the COSO criteria.
We also have audited, in accordance with the standards of the Public Company Accounting Oversight Board (United States) (PCAOB), the 2021 consolidated financial statements of the Company and our report dated June 23, 2022 expressed an unqualified opinion thereon.
Basis for Opinion
The Company's management is responsible for maintaining effective internal control over financial reporting and for its assessment of the effectiveness of internal control over financial reporting included in the accompanying Management's Report on Internal Control over Financial Reporting. Our responsibility is to express an opinion on the Company's internal control over financial reporting based on our audit. We are a public accounting firm registered with the PCAOB and are required to be independent with respect to the Company in accordance with the U.S. federal securities laws and the applicable rules and regulations of the Securities and Exchange Commission and the PCAOB.
We conducted our audit in accordance with the standards of the PCAOB. Those standards require that we plan and perform the audit to obtain reasonable assurance about whether effective internal control over financial reporting was maintained in all material respects.
Our audit included obtaining an understanding of internal control over financial reporting, assessing the risk that a material weakness exists, testing and evaluating the design and operating effectiveness of internal control based on the assessed risk, and performing such other procedures as we considered necessary in the circumstances. We believe that our audit provides a reasonable basis for our opinion.
Definition and Limitations of Internal Control Over Financial Reporting
A company's internal control over financial reporting is a process designed to provide reasonable assurance regarding the reliability of financial reporting and the preparation of financial statements for external purposes in accordance with generally accepted accounting principles. A company's internal control over financial reporting includes those policies and procedures that (1) pertain to the maintenance of records that, in reasonable detail, accurately and fairly reflect the transactions and dispositions of the assets of the company; (2) provide reasonable assurance that transactions are recorded as necessary to permit preparation of financial statements in accordance with generally accepted accounting principles, and that receipts and expenditures of the company are being made only in accordance with authorizations of management and directors of the company; and (3) provide reasonable assurance regarding prevention or timely detection of unauthorized acquisition, use, or disposition of the company's assets that could have a material effect on the financial statements.
Because of its inherent limitations, internal control over financial reporting may not prevent or detect misstatements. Also, projections of any evaluation of effectiveness to future periods are subject to the risk that controls may become inadequate because of changes in conditions, or that the degree of compliance with the policies or procedures may deteriorate.
/s/ Ernst & Young LLP
Chicago, Illinois
June 23, 2022
F-4
METHODE ELECTRONICS, INC. AND SUBSIDIARIES
CONSOLIDATED BALANCE SHEETS
(in millions, except share and per share data)
|
|
April 30, 2022 |
|
|
May 1, 2021 |
|
||
ASSETS |
|
|
|
|
|
|
||
Current assets: |
|
|
|
|
|
|
||
Cash and cash equivalents |
|
$ |
172.0 |
|
|
$ |
233.2 |
|
Accounts receivable, net |
|
|
273.3 |
|
|
|
282.5 |
|
Inventories |
|
|
158.5 |
|
|
|
124.2 |
|
Income taxes receivable |
|
|
8.3 |
|
|
|
11.5 |
|
Prepaid expenses and other current assets |
|
|
16.9 |
|
|
|
22.6 |
|
Total current assets |
|
|
629.0 |
|
|
|
674.0 |
|
Long-term assets: |
|
|
|
|
|
|
||
Property, plant and equipment, net |
|
|
197.0 |
|
|
|
204.0 |
|
Goodwill |
|
|
233.0 |
|
|
|
235.6 |
|
Other intangible assets, net |
|
|
207.7 |
|
|
|
229.4 |
|
Operating lease right-of-use assets, net |
|
|
20.0 |
|
|
|
22.3 |
|
Deferred tax assets |
|
|
36.8 |
|
|
|
41.2 |
|
Pre-production costs |
|
|
27.2 |
|
|
|
25.0 |
|
Other long-term assets |
|
|
38.4 |
|
|
|
35.5 |
|
Total long-term assets |
|
|
760.1 |
|
|
|
793.0 |
|
Total assets |
|
$ |
1,389.1 |
|
|
$ |
1,467.0 |
|
|
|
|
|
|
|
|
||
LIABILITIES AND SHAREHOLDERS' EQUITY |
|
|
|
|
|
|
||
Current liabilities: |
|
|
|
|
|
|
||
Accounts payable |
|
$ |
108.5 |
|
|
$ |
122.9 |
|
Accrued employee liabilities |
|
|
30.0 |
|
|
|
33.5 |
|
Other accrued liabilities |
|
|
24.5 |
|
|
|
25.0 |
|
Short-term operating lease liabilities |
|
|
6.0 |
|
|
|
6.1 |
|
Short-term debt |
|
|
13.0 |
|
|
|
14.9 |
|
Income tax payable |
|
|
6.6 |
|
|
|
20.3 |
|
Total current liabilities |
|
|
188.6 |
|
|
|
222.7 |
|
Long-term liabilities: |
|
|
|
|
|
|
||
Long-term debt |
|
|
197.5 |
|
|
|
225.2 |
|
Long-term operating lease liabilities |
|
|
14.8 |
|
|
|
17.5 |
|
Long-term income taxes payable |
|
|
22.1 |
|
|
|
24.8 |
|
Other long-term liabilities |
|
|
14.0 |
|
|
|
20.5 |
|
Deferred tax liabilities |
|
|
38.3 |
|
|
|
38.3 |
|
Total long-term liabilities |
|
|
286.7 |
|
|
|
326.3 |
|
Total liabilities |
|
|
475.3 |
|
|
|
549.0 |
|
Shareholders' equity: |
|
|
|
|
|
|
||
Common stock, $0.50 par value, 100,000,000 shares authorized, 38,276,968 shares and 39,644,913 shares issued as of April 30, 2022 and May 1, 2021, respectively |
|
|
19.2 |
|
|
|
19.8 |
|
Additional paid-in capital |
|
|
169.0 |
|
|
|
157.6 |
|
Accumulated other comprehensive (loss) income |
|
|
(26.8 |
) |
|
|
6.1 |
|
Treasury stock, 1,346,624 shares as of April 30, 2022 and May 1, 2021 |
|
|
(11.5 |
) |
|
|
(11.5 |
) |
Retained earnings |
|
|
763.9 |
|
|
|
746.0 |
|
Total shareholders' equity |
|
|
913.8 |
|
|
|
918.0 |
|
Total liabilities and shareholders' equity |
|
$ |
1,389.1 |
|
|
$ |
1,467.0 |
|
See notes to consolidated financial statements.
F-5
METHODE ELECTRONICS, INC. AND SUBSIDIARIES
CONSOLIDATED STATEMENTS OF INCOME
(in millions, except per share data)
|
|
Fiscal Year Ended |
|
|||||||||
|
|
April 30, 2022 |
|
|
May 1, 2021 |
|
|
May 2, 2020 |
|
|||
|
|
(52 Weeks) |
|
|
(52 Weeks) |
|
|
(53 Weeks) |
|
|||
Net sales |
|
$ |
1,163.6 |
|
|
$ |
1,088.0 |
|
|
$ |
1,023.9 |
|
|
|
|
|
|
|
|
|
|
|
|||
Cost of products sold |
|
|
898.7 |
|
|
|
813.9 |
|
|
|
741.0 |
|
|
|
|
|
|
|
|
|
|
|
|||
Gross profit |
|
|
264.9 |
|
|
|
274.1 |
|
|
|
282.9 |
|
|
|
|
|
|
|
|
|
|
|
|||
Selling and administrative expenses |
|
|
134.1 |
|
|
|
126.9 |
|
|
|
116.8 |
|
Amortization of intangibles |
|
|
19.1 |
|
|
|
19.3 |
|
|
|
19.0 |
|
|
|
|
|
|
|
|
|
|
|
|||
Income from operations |
|
|
111.7 |
|
|
|
127.9 |
|
|
|
147.1 |
|
|
|
|
|
|
|
|
|
|
|
|||
Interest expense, net |
|
|
3.5 |
|
|
|
5.2 |
|
|
|
10.1 |
|
Other income, net |
|
|
(10.3 |
) |
|
|
(12.2 |
) |
|
|
(11.7 |
) |
|
|
|
|
|
|
|
|
|
|
|||
Income before income taxes |
|
|
118.5 |
|
|
|
134.9 |
|
|
|
148.7 |
|
|
|
|
|
|
|
|
|
|
|
|||
Income tax expense |
|
|
16.3 |
|
|
|
12.6 |
|
|
|
25.3 |
|
|
|
|
|
|
|
|
|
|
|
|||
Net income |
|
$ |
102.2 |
|
|
$ |
122.3 |
|
|
$ |
123.4 |
|
|
|
|
|
|
|
|
|
|
|
|||
Basic and diluted income per share: |
|
|
|
|
|
|
|
|
|
|||
Basic |
|
$ |
2.74 |
|
|
$ |
3.22 |
|
|
$ |
3.28 |
|
Diluted |
|
$ |
2.70 |
|
|
$ |
3.19 |
|
|
$ |
3.26 |
|
|
|
|
|
|
|
|
|
|
|
|||
Cash dividends per share |
|
$ |
0.56 |
|
|
$ |
0.44 |
|
|
$ |
0.44 |
|
See notes to consolidated financial statements.
F-6
METHODE ELECTRONICS, INC. AND SUBSIDIARIES
CONSOLIDATED STATEMENTS OF COMPREHENSIVE INCOME
(in millions)
|
|
Fiscal Year Ended |
|
|||||||||
|
|
April 30, 2022 |
|
|
May 1, 2021 |
|
|
May 2, 2020 |
|
|||
|
|
(52 Weeks) |
|
|
(52 Weeks) |
|
|
(53 Weeks) |
|
|||
Net income |
|
$ |
102.2 |
|
|
$ |
122.3 |
|
|
$ |
123.4 |
|
|
|
|
|
|
|
|
|
|
|
|||
Other comprehensive income (loss), net of tax: |
|
|
|
|
|
|
|
|
|
|||
Foreign currency translation adjustments |
|
|
(42.0 |
) |
|
|
37.4 |
|
|
|
(12.3 |
) |
Derivative financial instruments |
|
|
9.1 |
|
|
|
(4.4 |
) |
|
|
(1.0 |
) |
Total comprehensive income |
|
$ |
69.3 |
|
|
$ |
155.3 |
|
|
$ |
110.1 |
|
See notes to consolidated financial statements.
F-7
METHODE ELECTRONICS, INC. AND SUBSIDIARIES
(in millions, except share data)
|
|
Common |
|
|
Common |
|
|
Additional |
|
|
Accumulated |
|
|
Treasury |
|
|
Retained |
|
|
Total |
|
|||||||
Balance as of April 27, 2019 |
|
|
38,333,576 |
|
|
$ |
19.2 |
|
|
$ |
150.4 |
|
|
$ |
(13.6 |
) |
|
$ |
(11.5 |
) |
|
$ |
545.2 |
|
|
$ |
689.7 |
|
Issuance of restricted stock, net of tax withholding |
|
|
104,535 |
|
|
|
— |
|
|
|
— |
|
|
|
— |
|
|
|
— |
|
|
|
(0.4 |
) |
|
|
(0.4 |
) |
Stock-based compensation expense |
|
|
— |
|
|
|
— |
|
|
|
0.3 |
|
|
|
— |
|
|
|
— |
|
|
|
— |
|
|
|
0.3 |
|
Other comprehensive loss |
|
|
— |
|
|
|
— |
|
|
|
— |
|
|
|
(13.3 |
) |
|
|
— |
|
|
|
— |
|
|
|
(13.3 |
) |
Net income |
|
|
— |
|
|
|
— |
|
|
|
— |
|
|
|
— |
|
|
|
— |
|
|
|
123.4 |
|
|
|
123.4 |
|
Dividends on common stock |
|
|
— |
|
|
|
— |
|
|
|
— |
|
|
|
— |
|
|
|
— |
|
|
|
(16.3 |
) |
|
|
(16.3 |
) |
Balance as of May 2, 2020 |
|
|
38,438,111 |
|
|
|
19.2 |
|
|
|
150.7 |
|
|
|
(26.9 |
) |
|
|
(11.5 |
) |
|
|
651.9 |
|
|
|
783.4 |
|
Issuance of restricted stock, net of tax withholding |
|
|
1,350,251 |
|
|
|
0.7 |
|
|
|
(0.7 |
) |
|
|
— |
|
|
|
— |
|
|
|
(3.9 |
) |
|
|
(3.9 |
) |
Stock-based compensation expense |
|
|
— |
|
|
|
— |
|
|
|
6.8 |
|
|
|
— |
|
|
|
— |
|
|
|
— |
|
|
|
6.8 |
|
Exercise of stock options |
|
|
24,500 |
|
|
|
— |
|
|
|
0.8 |
|
|
|
— |
|
|
|
— |
|
|
|
— |
|
|
|
0.8 |
|
Purchases of common stock |
|
|
(167,949 |
) |
|
|
(0.1 |
) |
|
|
— |
|
|
|
— |
|
|
|
— |
|
|
|
(7.4 |
) |
|
|
(7.5 |
) |
Other comprehensive income |
|
|
— |
|
|
|
— |
|
|
|
— |
|
|
|
33.0 |
|
|
|
— |
|
|
|
— |
|
|
|
33.0 |
|
Net income |
|
|
— |
|
|
|
— |
|
|
|
— |
|
|
|
— |
|
|
|
— |
|
|
|
122.3 |
|
|
|
122.3 |
|
Dividends on common stock |
|
|
— |
|
|
|
— |
|
|
|
— |
|
|
|
— |
|
|
|
— |
|
|
|
(16.9 |
) |
|
|
(16.9 |
) |
Balance as of May 1, 2021 |
|
|
39,644,913 |
|
|
|
19.8 |
|
|
|
157.6 |
|
|
|
6.1 |
|
|
|
(11.5 |
) |
|
|
746.0 |
|
|
|
918.0 |
|
Issuance of restricted stock, net of tax withholding |
|
|
44,245 |
|
|
|
0.1 |
|
|
|
(0.1 |
) |
|
|
— |
|
|
|
— |
|
|
|
(0.3 |
) |
|
|
(0.3 |
) |
Stock-based compensation expense |
|
|
— |
|
|
|
— |
|
|
|
11.0 |
|
|
|
— |
|
|
|
— |
|
|
|
— |
|
|
|
11.0 |
|
Exercise of stock options |
|
|
13,000 |
|
|
|
— |
|
|
|
0.5 |
|
|
|
— |
|
|
|
— |
|
|
|
— |
|
|
|
0.5 |
|
Purchases of common stock |
|
|
(1,425,190 |
) |
|
|
(0.7 |
) |
|
|
— |
|
|
|
— |
|
|
|
— |
|
|
|
(63.0 |
) |
|
|
(63.7 |
) |
Other comprehensive loss |
|
|
— |
|
|
|
— |
|
|
|
— |
|
|
|
(32.9 |
) |
|
|
— |
|
|
|
— |
|
|
|
(32.9 |
) |
Net income |
|
|
— |
|
|
|
— |
|
|
|
— |
|
|
|
— |
|
|
|
— |
|
|
|
102.2 |
|
|
|
102.2 |
|
Dividends on common stock |
|
|
— |
|
|
|
— |
|
|
|
— |
|
|
|
— |
|
|
|
— |
|
|
|
(21.0 |
) |
|
|
(21.0 |
) |
Balance as of April 30, 2022 |
|
|
38,276,968 |
|
|
$ |
19.2 |
|
|
$ |
169.0 |
|
|
$ |
(26.8 |
) |
|
$ |
(11.5 |
) |
|
$ |
763.9 |
|
|
$ |
913.8 |
|
See notes to consolidated financial statements.
F-8
METHODE ELECTRONICS, INC. AND SUBSIDIARIES
CONSOLIDATED STATEMENTS OF CASH FLOWS
(in millions)
|
|
Fiscal Year Ended |
|
|||||||||
|
|
April 30, 2022 |
|
|
May 1, 2021 |
|
|
May 2, 2020 |
|
|||
|
|
(52 Weeks) |
|
|
(52 Weeks) |
|
|
(53 Weeks) |
|
|||
Operating activities: |
|
|
|
|
|
|
|
|
|
|||
Net income |
|
$ |
102.2 |
|
|
$ |
122.3 |
|
|
$ |
123.4 |
|
Adjustments to reconcile net income to net cash provided by operating activities: |
|
|
|
|
|
|
|
|
|
|||
Depreciation and amortization |
|
|
52.6 |
|
|
|
51.5 |
|
|
|
48.3 |
|
Stock-based compensation expense |
|
|
11.8 |
|
|
|
6.8 |
|
|
|
0.3 |
|
Change in cash surrender value of life insurance |
|
|
0.1 |
|
|
|
(2.0 |
) |
|
|
— |
|
Amortization of debt issuance costs |
|
|
0.7 |
|
|
|
0.7 |
|
|
|
0.7 |
|
(Gain) loss on sale of business/investment/property |
|
|
(0.3 |
) |
|
|
1.3 |
|
|
|
(0.4 |
) |
Impairment of long-lived assets |
|
|
3.1 |
|
|
|
— |
|
|
|
— |
|
Change in deferred income taxes |
|
|
(2.1 |
) |
|
|
(9.6 |
) |
|
|
8.0 |
|
Other |
|
|
0.5 |
|
|
|
2.0 |
|
|
|
(0.2 |
) |
Changes in operating assets and liabilities: |
|
|
|
|
|
|
|
|
|
|||
Accounts receivable |
|
|
(2.0 |
) |
|
|
(81.9 |
) |
|
|
27.4 |
|
Inventories |
|
|
(39.3 |
) |
|
|
11.3 |
|
|
|
(15.8 |
) |
Prepaid expenses and other assets |
|
|
1.5 |
|
|
|
17.9 |
|
|
|
(3.6 |
) |
Accounts payable |
|
|
(8.7 |
) |
|
|
44.0 |
|
|
|
(15.5 |
) |
Other liabilities |
|
|
(21.3 |
) |
|
|
15.5 |
|
|
|
(32.0 |
) |
Net cash provided by operating activities |
|
|
98.8 |
|
|
|
179.8 |
|
|
|
140.6 |
|
|
|
|
|
|
|
|
|
|
|
|||
Investing activities: |
|
|
|
|
|
|
|
|
|
|||
Purchases of property, plant and equipment |
|
|
(38.0 |
) |
|
|
(24.9 |
) |
|
|
(45.1 |
) |
Sale of business/investment/property |
|
|
0.6 |
|
|
|
0.1 |
|
|
|
0.6 |
|
Net cash used in investing activities |
|
|
(37.4 |
) |
|
|
(24.8 |
) |
|
|
(44.5 |
) |
|
|
|
|
|
|
|
|
|
|
|||
Financing activities: |
|
|
|
|
|
|
|
|
|
|||
Taxes paid related to net share settlement of equity awards |
|
|
(0.3 |
) |
|
|
(3.9 |
) |
|
|
(0.4 |
) |
Repayments of finance leases |
|
|
(0.7 |
) |
|
|
(0.5 |
) |
|
|
(0.7 |
) |
Proceeds from exercise of stock options |
|
|
0.5 |
|
|
|
0.8 |
|
|
|
— |
|
Purchases of common stock |
|
|
(64.5 |
) |
|
|
(6.7 |
) |
|
|
— |
|
Cash dividends |
|
|
(20.4 |
) |
|
|
(17.4 |
) |
|
|
(16.3 |
) |
Proceeds from borrowings |
|
|
— |
|
|
|
1.5 |
|
|
|
157.5 |
|
Repayments of borrowings |
|
|
(29.2 |
) |
|
|
(116.7 |
) |
|
|
(98.4 |
) |
Net cash (used in) provided by financing activities |
|
|
(114.6 |
) |
|
|
(142.9 |
) |
|
|
41.7 |
|
Effect of foreign currency exchange rate changes on cash and cash equivalents |
|
|
(8.0 |
) |
|
|
3.8 |
|
|
|
(3.7 |
) |
(Decrease) increase in cash and cash equivalents |
|
|
(61.2 |
) |
|
|
15.9 |
|
|
|
134.1 |
|
Cash and cash equivalents at beginning of the year |
|
|
233.2 |
|
|
|
217.3 |
|
|
|
83.2 |
|
Cash and cash equivalents at end of the year |
|
$ |
172.0 |
|
|
$ |
233.2 |
|
|
$ |
217.3 |
|
|
|
|
|
|
|
|
|
|
|
|||
Supplemental cash flow information: |
|
|
|
|
|
|
|
|
|
|||
Cash paid during the period for: |
|
|
|
|
|
|
|
|
|
|||
Interest |
|
$ |
3.6 |
|
|
$ |
5.3 |
|
|
$ |
9.9 |
|
Income taxes, net of refunds |
|
$ |
32.3 |
|
|
$ |
16.0 |
|
|
$ |
21.1 |
|
See notes to consolidated financial statements.
F-9
METHODE ELECTRONICS, INC. AND SUBSIDIARIES
NOTES TO CONSOLIDATED FINANCIAL STATEMENTS
Note 1. Description of Business and Summary of Significant Accounting Policies
Methode Electronics, Inc. (the “Company” or “Methode”) is a leading global supplier of custom engineered solutions with sales, engineering and manufacturing locations in North America, Europe, Middle East and Asia. The Company designs, engineers and produces mechatronic products for Original Equipment Manufacturers (“OEMs”) utilizing its broad range of technologies for user interface, light-emitting diode (“LED”) lighting system, power distribution and sensor applications.
The Company’s solutions are found in the end markets of transportation (including automotive, commercial vehicle, e-bike, aerospace, bus and rail), cloud computing infrastructure, construction equipment, consumer appliance and medical devices.
Financial reporting periods. The Company maintains its financial records on the basis of a 52 or 53-week fiscal year ending on the Saturday closest to April 30. Fiscal 2022 and 2021 represented 52 weeks and ended on April 30, 2022 and May 1, 2021, respectively. Fiscal 2020 represented 53 weeks and ended on May 2, 2020. The following discussions of comparative results among periods should be reviewed in that context.
Impact of the COVID-19 pandemic. The COVID-19 pandemic and the ongoing measures to reduce its spread have negatively impacted the global economy, disrupted consumer and customer demand and global supply chains, and resulted in manufacturing inefficiencies and increased freight costs due to global capacity constraints. The Company expects that the global health crisis caused by the COVID-19 pandemic will continue to negatively impact its business and results of operations for the foreseeable future. The extent of the impact will depend on a number of evolving and uncertain factors, including the duration and spread of COVID-19 (and its variants), the rate of vaccinations, actions taken by governmental authorities to further restrict business operations and social activity and impose travel restrictions, shifting consumer demand, the ability of the Company’s supply chain to deliver in a timely and cost-effective manner, the ability of the Company’s employees and manufacturing facilities to operate efficiently and effectively, the continued viability and financial stability of the Company’s customers and suppliers and future access to capital.
The Company continues to experience business interruptions, including customer shutdowns and increased material and logistics costs, labor shortages, and most significantly, impacts from the worldwide semiconductor supply shortage. The semiconductor supply shortage is due, in part, to increased demand across multiple industries, including the automotive industry, resulting in a slowdown in their production schedules. The semiconductor supply shortage is also impacting the Company’s supply chain and its ability to meet demand at some of its non-automotive customers. The Company expects this semiconductor shortage will have a continued impact on its operating results and financial condition in fiscal 2023.
Various government programs have been enacted to provide assistance to businesses impacted by the COVID-19 pandemic. The amount of assistance the Company received was $10.0 million, $11.1 million and $1.7 million in fiscal 2022, fiscal 2021 and fiscal 2020, respectively, and has been reported in other income, net in the consolidated statements of income.
The Company assessed certain accounting matters that require consideration of forecasted financial information, including, but not limited to, its allowance for credit losses, the carrying value of the Company’s goodwill, identifiable intangible assets and other long-lived assets, and valuation allowances in context with the information reasonably available to the Company and the unknown future impacts of the COVID-19 pandemic as of April 30, 2022 and through the date of this report. As a result of these assessments, the Company concluded that there were no impairments or material increases in credit allowances or valuation allowances that impacted the Company’s consolidated financial statements as of April 30, 2022 and for the year ended April 30, 2022. However, the Company’s future assessment of the magnitude and duration of the COVID-19 pandemic, as well as other factors, could result in material impacts to its consolidated financial statements in future reporting periods.
Basis of presentation. The Company’s consolidated financial statements have been prepared in conformity with accounting principles generally accepted in the United States (“GAAP”).
Principles of consolidation. The consolidated financial statements include the accounts and operations of the Company and its subsidiaries. All significant intercompany balances and transactions have been eliminated in consolidation.
Use of estimates. The preparation of financial statements in conformity with GAAP requires management to make estimates and assumptions that affect the amounts reported in the consolidated financial statements and accompanying notes. Actual results could differ from those estimates.
Cash and cash equivalents. Cash and cash equivalents consist of cash and highly liquid investments with a maturity of three months or less. Highly liquid investments include money market funds which are classified within Level 1 of the fair value hierarchy. As of April 30, 2022, the Company had a balance of $40.0 million in money market accounts. The Company did not have any money market accounts as of May 1, 2021.
F-10
METHODE ELECTRONICS, INC. AND SUBSIDIARIES
NOTES TO CONSOLIDATED FINANCIAL STATEMENTS
Accounts receivable and allowance for doubtful accounts. Accounts receivable are customer obligations due under normal trade terms and are presented net of an allowance for doubtful accounts. The Company establishes an allowance for doubtful accounts based on the current expected credit loss impairment model. The Company applies a historical loss rate based on historic write-offs to aging categories. The historical loss rate is adjusted for current conditions and reasonable and supportable forecasts of future losses as necessary. The Company may also record a specific reserve for individual accounts when it becomes aware of specific customer circumstances, such as in the case of a bankruptcy filing or deterioration in the customer’s operating results or financial position. The allowance for doubtful accounts balance was $1.0 million and $0.7 million as of April 30, 2022 and May 1, 2021, respectively.
Concentration of credit risk. Financial assets that subject the Company to concentration of credit risk consist primarily of cash equivalents, derivative contracts, and accounts receivable. The Company’s counterparties for cash equivalents and derivative contracts are banks and financial institutions that meet the Company’s requirement of high credit standing. For accounts receivable, the Company generally does not require collateral. Sales to General Motors Company (“GM”) in the Automotive segment, either directly or through its tiered suppliers, represented a significant portion of the Company's business. As of April 30, 2022 and May 1, 2021, accounts receivable from GM (including tiered suppliers) were approximately $42.0 million and $54.9 million, respectively.
Inventories. Inventories are stated at the lower-of-cost or net realizable value. Cost is determined using the first-in, first-out method. Finished products and work-in-process inventories include direct material costs and direct and indirect manufacturing costs. The Company records reserves for inventory that may be obsolete or in excess of current and future market demand. See Note 5, “Inventory” for additional information.
Property, plant and equipment. Property, plant and equipment are recorded at cost less accumulated depreciation, with the exception of assets acquired through acquisitions, which are initially recorded at fair value. Equipment acquired under a finance lease is recorded at the present value of the future minimum lease payments. Depreciation is computed using the straight-line method over the estimated useful lives of 5 to 40 years for buildings and building improvements and 3 to 15 years for machinery and equipment. Costs of additions and major improvements are capitalized, whereas maintenance and repairs that do not improve or extend the life of the asset are charged to expense as incurred. See Note 6, “Property, Plant and Equipment” for additional information.
Business combinations. The Company accounts for business combinations using the acquisition method. The purchase price of an acquired business is allocated to its identifiable assets and liabilities based on estimated fair values. Determining the fair values of assets acquired and liabilities assumed requires management’s judgment, the utilization of independent appraisal firms and often involves the use of significant estimates and assumptions with respect to the timing and amount of future cash flows, market rate assumptions, actuarial assumptions, and appropriate discount rates, among other items. Goodwill represents the excess of the purchase price over the fair value of net assets acquired, including the amount assigned to identifiable intangible assets. Identifiable intangible assets with finite lives are amortized over their useful lives. Acquisition-related costs are expensed in the periods in which the costs are incurred. The results of operations of acquired businesses are included in the consolidated financial statements from the acquisition date.
Goodwill. Goodwill is not amortized but is tested for impairment on at least an annual basis. Goodwill is evaluated at the reporting unit level by comparing the fair value of the reporting unit with its carrying amount including goodwill. An impairment of goodwill exists if the carrying amount of the reporting unit exceeds its fair value. The impairment loss is the amount by which the carrying amount exceeds the reporting unit’s fair value, limited to the total amount of goodwill allocated to that reporting unit.
In performing the goodwill impairment test, the Company may first assess qualitative factors to determine whether it is more likely than not that the estimated fair value of a reporting unit is less than its carrying amount. If it is more likely than not that a reporting unit’s fair value is less than its carrying amount, or if the Company elects not to perform a qualitative assessment of a reporting unit, the Company then compares the fair value of the reporting unit to the related net book value. See Note 7, “Goodwill and Other Intangible Assets” for additional information regarding the Company’s goodwill impairment assessment for fiscal 2022.
Amortizable intangible assets. Amortizable intangible assets consist primarily of fair values assigned to customer relationships and trade names. Amortization is recognized over the useful lives of the intangible assets, generally up to 20 years, using the straight-line method. See Note 7, “Goodwill and Other Intangible Assets” for additional information.
Impairment of long-lived assets. The Company evaluates whether events and circumstances have occurred which indicate that the remaining estimated useful lives of its intangible assets, excluding goodwill, and other long-lived assets, may warrant revision or that the remaining balance of such assets may not be recoverable. If impairment indicators exist, the Company performs an impairment analysis by comparing the undiscounted cash flows resulting from the use of the asset group to the carrying amount. If the carrying amount exceeds the undiscounted cash flows, an impairment loss is recognized based on the excess of the asset’s carrying amount over its fair value.
F-11
METHODE ELECTRONICS, INC. AND SUBSIDIARIES
NOTES TO CONSOLIDATED FINANCIAL STATEMENTS
Pre-production costs related to long-term supply arrangements. The Company incurs pre-production tooling costs related to products produced for its customers under long-term supply arrangements. Engineering, testing and other costs incurred in the design and development of production parts are expensed as incurred, unless the costs are reimbursable by the customer. As of April 30, 2022 and May 1, 2021, the Company had $27.2 million and $25.0 million, respectively, of pre-production tooling costs related to customer-owned tools for which reimbursement is contractually guaranteed by the customer or for which the customer has provided a non-cancelable right to use the tooling.
Costs for molds, dies and other tools used in products produced for its customers under long-term supply arrangements for which the Company has title are capitalized in property, plant and equipment and amortized over the shorter of the life of the arrangement or over the estimated useful life of the assets. Company owned tooling was $14.6 million and $17.0 million as of April 30, 2022 and May 1, 2021, respectively.
Leases. The Company determines if an arrangement is a lease at inception. Right-of-use (“ROU”) assets represent the Company’s right to use an underlying asset for the lease term, and lease liabilities represent its obligation to make lease payments arising from the lease. Operating lease ROU assets and liabilities are recognized at commencement date based on the present value of lease payments over the lease term. As most of the Company’s leases do not provide an implicit rate, the Company estimates the incremental borrowing rate to discount the lease payments based on information available at lease commencement. The Company’s lease terms may include options to extend or terminate the lease when it is reasonably certain that the Company will exercise such options. The Company utilizes certain practical expedients, including the election not to reassess its prior conclusions about lease identification, lease classification and initial direct costs, as well as the election not to separate lease and non-lease components for arrangements where the Company is a lessee. The Company elects to recognize a right-of-use asset and related lease liability for leases with a lease term of 12 months or less for all classes of underlying assets. Lease expense is recognized on a straight-line basis over the lease term. See Note 3, “Leases” for additional information.
Derivative financial instruments. The Company uses derivative financial instruments, including swaps and forward contracts, to manage exposures to changes in currency exchange rates and interest rates. The Company does not enter into or hold derivative financial instruments for trading or speculative purposes. See Note 8, “Derivative Financial Instruments and Hedging Activities” for additional information.
Income taxes. Income taxes are calculated using the asset and liability method, under which deferred tax assets and liabilities are determined based on temporary differences between the financial statement amounts and the tax basis of assets and liabilities using enacted tax rates in effect in the years in which the differences are expected to reverse. In assessing the realizability of deferred tax assets, the Company considers whether it is more likely than not that some portion or all of the deferred tax assets will not be realized. The ultimate realization of deferred tax assets is primarily dependent upon the generation of future taxable income. In determining whether an uncertain tax position exists, the Company determines, based solely on its technical merits, whether the tax position is more likely than not to be sustained upon examination, and if so, a tax benefit is measured on a cumulative probability basis that is more likely than not to be realized upon the ultimate settlement. In determining the provision for income taxes for financial statement purposes, the Company makes certain estimates and judgments which affect its evaluation of the carrying value of its deferred tax assets, as well as its calculation of certain tax liabilities. See Note 11, “Income Taxes” for additional information.
Revenue recognition. Revenue is recognized in accordance with Accounting Standards Codification (“ASC”) 606, “Revenue from Contracts with Customers.” Revenue is measured based on consideration specified in a contract with a customer. The Company recognizes revenue when it satisfies a performance obligation by transferring control over a product or service to a customer. From time to time, customers may negotiate annual price downs. Management has evaluated these price downs and determined that in some instances, these price downs give rise to a material right. In instances that a material right exists, a portion of the transaction price is allocated to the material right and recognized over the life of the contract.
Across all products, the amount of revenue recognized corresponds to the related purchase order and is adjusted for variable consideration (such as discounts). Sales and other taxes collected concurrent with revenue-producing activities are excluded from revenue.
The Company’s performance obligations are typically short-term in nature. As a result, the Company has elected the practical expedient that provides an exemption from the disclosure requirements regarding information about remaining performance obligations on contracts that have original expected durations of one year or less. See Note 2, “Revenue” for further information.
Shipping and handling fees and costs. Shipping and handling fees billed to customers are included in net sales, and the related costs are included in cost of products sold.
F-12
METHODE ELECTRONICS, INC. AND SUBSIDIARIES
NOTES TO CONSOLIDATED FINANCIAL STATEMENTS
Restructuring expense. Restructuring expense includes costs directly associated with exit or disposal activities. Such costs include employee severance and termination benefits, asset impairment charges, contract termination fees, and other exit or disposal costs. Employee termination benefits are accrued upon the commitment to a termination plan and when the benefit arrangement is communicated to affected employees, or when liabilities are determined to be probable and estimable. Asset impairment charges relate to the impairment of ROU lease assets and equipment. Contract termination costs are recorded when notification of termination is given to the other party. See Note 4, “Restructuring” for additional information.
Foreign currency translation. The functional currencies of the majority of the Company’s foreign subsidiaries are their local currencies. The results of operations of these foreign subsidiaries are translated into U.S. dollars using average monthly rates, while the assets and liabilities are translated using period-end exchange rates. The resulting translation adjustments are recorded as a component of accumulated other comprehensive income (loss) (“AOCI”). Gains and losses arising from transactions denominated in a currency other than the functional currency, except certain long-term intercompany transactions, are included in the consolidated statements of income in other income, net.
Government grants. The Company recognizes grant income in other income, net in the consolidated statements of income when it is considered that there is reasonable assurance that the grant will be received and the necessary qualifying conditions, as stated in the grant agreement, are met. The international government grants are generally paid over a period of years and are recorded at amortized cost on the Company’s consolidated balance sheets. As of April 30, 2022 and May 1, 2021, grant receivables outstanding were $12.7 million and $18.6 million, respectively. The short-term and long-term portion of grant receivables are recorded on the consolidated balance sheets within accounts receivable, net and other long-term assets, respectively. Additionally, as of April 30, 2022 and May 1, 2021, the Company has no deferred grant income.
Research and development costs. Costs associated with the enhancement of existing products and the development of new products are charged to expense when incurred. Research and development expenses primarily relate to product engineering and design and development expenses and are classified as a component of cost of goods sold on the consolidated statements of income. Research and development costs were $35.7 million, $37.1 million and $34.9 million for fiscal 2022, fiscal 2021 and fiscal 2020, respectively.
Stock-based compensation. The Company recognizes compensation expense for the cost of awards of equity compensation using a fair value method in accordance with ASC 718, “Stock-based Compensation.” See Note 13, “Shareholders’ Equity” for additional information.
Product warranty. The Company’s warranties are standard, assurance-type warranties only. The Company does not offer any additional service or extended term warranties to its customers. As such, warranty obligations are accrued when its probable that a liability has been incurred and the related amounts are reasonably estimable.
Fair value measurement. ASC 820, “Fair Value Measurement,” provides a framework for measuring fair value, which is defined as the price that would be received to sell an asset or paid to transfer a liability in an orderly transaction between market participants at the measurement date. The fair value hierarchy under ASC 820 requires an entity to maximize the use of observable inputs. The Company groups assets and liabilities at fair value in three levels as follows:
Assets and liabilities are classified based on the lowest level of input that is significant to the fair value measurements. The Company reviews the fair value hierarchy classification on a quarterly basis. Changes to the observability of valuation inputs may result in a reclassification of levels for certain securities within the fair value hierarchy.
The carrying values of the Company’s short-term financial instruments, including cash and cash equivalents, accounts receivable and accounts payable, approximate their fair values because of the short maturity of these instruments.
F-13
METHODE ELECTRONICS, INC. AND SUBSIDIARIES
NOTES TO CONSOLIDATED FINANCIAL STATEMENTS
Recently Adopted Accounting Pronouncements
In December 2019, the Financial Accounting Standards Board (“FASB”) issued Accounting Standards Update (“ASU”) 2019-12, “Income Taxes - Simplifying the Accounting for Income Taxes (Topic 740),” which simplifies the accounting for income taxes. The new guidance removes certain exceptions to the general principles in ASC 740, such as recognizing deferred taxes for equity investments, the incremental approach to performing intraperiod tax allocation and calculating income taxes in interim periods. The standard also simplifies accounting for income taxes under GAAP by clarifying and amending existing guidance, including the recognition of deferred taxes for goodwill, the allocation of taxes to members of a consolidated group and requiring that an entity reflect the effect of enacted changes in tax laws or rates in the annual effective tax rate computation in the interim period that includes the enactment date. The Company adopted ASU 2019-12 as of May 2, 2021, and the impact on its consolidated financial statements was not material.
In March 2020, the FASB issued ASU 2020-04, “Reference Rate Reform (Topic 848): Facilitation of the Effects of Reference Rate Reform on Financial Reporting.” ASU 2020-04 provides optional expedients and exceptions for applying GAAP to contract modifications and hedging relationships that reference LIBOR or another rate that is expected to be discontinued, subject to meeting certain criteria. ASU 2020-04 was effective upon issuance and the adoption of this update did not have a material impact on the Company's consolidated financial statements.
New Accounting Pronouncements Not Yet Adopted
In November 2021, the FASB issued ASU 2021-10, “Government Assistance (Topic 832),” which requires business entities to disclose information about transactions with a government that are accounted for by applying a grant or contribution model by analogy (for example, International Financial Reporting Standards guidance in International Accounting Standard 20 or guidance on contributions for not-for-profit entities in ASC 958-605). For transactions in the scope of the new standard, business entities will need to provide information about the nature of the transaction, including significant terms and conditions, as well as the amounts and specific financial statement line items affected by the transaction. The new guidance is effective for all entities for annual reporting periods beginning after December 15, 2021. The Company does not expect that the adoption of this standard will have an impact on its consolidated financial statements; however the Company expects to increase its disclosures with respect to government assistance beginning in fiscal 2023.
Note 2. Revenue
The Company generates revenue from manufacturing of products for customers in diversified global markets. The majority of the Company’s revenue is recognized at a point in time. The Company has determined that the most definitive demonstration that control has transferred to a customer is physical shipment or delivery, depending on the contractual shipping terms, except for consignment transactions. Consignment transactions are arrangements where the Company transfers product to a customer location but retains ownership and control of such product until it is used by the customer. Revenue for consignment arrangements is recognized upon the customer’s usage.
Revenue associated with products which the Company believes have no alternative use (such as highly customized parts), and where the Company has an enforceable right to payment, are recognized on an over time basis. Revenue is recognized based on progress to date, which is typically even over the production process through transfer of control to the customer.
Estimating total contract revenue may require judgment as certain contracts contain pricing discount structures, early payment discounts or other provisions that can impact the transaction price. The Company generally estimates variable consideration utilizing the most likely amount to which it expects to be entitled. When the contract provides the customer with the right to return eligible products, the Company reduces revenue at the point of sale using current facts and historical experience by using an estimate for expected product returns. The Company adjusts these estimates at the earlier of when the most likely amount of consideration that is expected to be received changes or when the consideration becomes fixed. Accordingly, an increase or decrease to revenue is recognized at that time. The Company’s payment terms with its customers are typically 30-45 days from the time control transfers. As the Company’s standard payment terms are less than one year, the Company has elected the practical expedient under ASC 606 to not assess whether a contract has a significant financing component.
F-14
METHODE ELECTRONICS, INC. AND SUBSIDIARIES
NOTES TO CONSOLIDATED FINANCIAL STATEMENTS
Costs to fulfill/obtain a contract
The Company incurs pre-production tooling costs related to products produced for customers under long-term supply arrangements. These costs are capitalized and recognized into income upon acceptance. The Company concluded that pre-production tooling and engineering costs do not represent a promised good or service under ASC 606, and as such, reimbursements received are accounted for as a reimbursement of the expense, not revenue.
The Company has not historically incurred material costs to obtain a contract. In the instances that costs to obtain contracts are incurred, the Company will capitalize and amortize those over the life of the contract.
Contract balances
The Company receives payment from customers based on the contractual billing schedule and specific performance requirements established in the contract. Billings are recorded as accounts receivable when an unconditional right to the contractual consideration exists. A contract asset is an entity’s right to consideration in exchange for goods or services that the entity has transferred to a customer. A contract liability exists when the Company has received consideration, or the amount is due from the customer in advance of revenue recognition. Contract assets and contract liabilities are recognized in other current assets and other liabilities, respectively, in the Company's consolidated balance sheets.
Unbilled receivables (contract assets) - Pursuant to the over-time revenue recognition model, revenue may be recognized prior to the customer being invoiced. An unbilled receivable is recorded to reflect revenue that is recognized over time. Unbilled receivables were $0.4 million and $0.6 million as of April 30, 2022 and May 1, 2021, respectively. During fiscal 2022, $0.6 million of previously unbilled receivables were recorded into accounts receivable. There were no impairments of contract assets as of April 30, 2022.
Deferred revenue (contract liabilities) - For certain of the price reductions offered by the Company, the amount of the reduction cannot be attributed entirely to production efficiencies gained. In these cases, the annual price-downs are considered to be material rights as the customer, as part of their current contract, are purchasing an option that they would not have received without the contract to purchase future product. When a contract contains a material right, a portion of the transaction price is allocated to the material right for which revenue recognition is deferred until the customer exercises its option. Deferred revenue was $0.2 million and $0.3 million as of April 30, 2022 and May 1, 2021, respectively. Previously deferred revenue of $0.1 million was recorded into revenue during fiscal 2022.
Disaggregated revenue information
The following table represents a disaggregation of revenue from contracts with customers by segment and geographical location. Net sales are attributed to regions based on the location of production. Though revenue recognition patterns and contracts are generally consistent, the amount, timing and uncertainty of revenue and cash flows may vary in each reportable segment due to geographic and economic factors.
F-15
METHODE ELECTRONICS, INC. AND SUBSIDIARIES
NOTES TO CONSOLIDATED FINANCIAL STATEMENTS
|
|
Fiscal Year Ended April 30, 2022 |
|
|||||||||||||||||
(in millions) |
|
Automotive |
|
|
Industrial |
|
|
Interface |
|
|
Medical |
|
|
Total |
|
|||||
Geographic net sales: |
|
|
|
|
|
|
|
|
|
|
|
|
|
|
|
|||||
North America |
|
$ |
400.9 |
|
|
$ |
177.2 |
|
|
$ |
59.3 |
|
|
$ |
4.1 |
|
|
$ |
641.5 |
|
EMEA |
|
|
216.5 |
|
|
|
80.8 |
|
|
|
— |
|
|
|
— |
|
|
|
297.3 |
|
Asia |
|
|
164.1 |
|
|
|
60.1 |
|
|
|
0.5 |
|
|
|
0.1 |
|
|
|
224.8 |
|
Total net sales |
|
$ |
781.5 |
|
|
$ |
318.1 |
|
|
$ |
59.8 |
|
|
$ |
4.2 |
|
|
$ |
1,163.6 |
|
Timing of revenue recognition: |
|
|
|
|
|
|
|
|
|
|
|
|
|
|
|
|||||
Goods transferred at a point in time |
|
$ |
758.4 |
|
|
$ |
318.1 |
|
|
$ |
59.8 |
|
|
$ |
4.2 |
|
|
$ |
1,140.5 |
|
Goods transferred over time |
|
|
23.1 |
|
|
|
— |
|
|
|
— |
|
|
|
— |
|
|
|
23.1 |
|
Total net sales |
|
$ |
781.5 |
|
|
$ |
318.1 |
|
|
$ |
59.8 |
|
|
$ |
4.2 |
|
|
$ |
1,163.6 |
|
|
|
|
|
|
|
|
|
|
|
|
|
|
|
|
|
|||||
|
|
Fiscal Year Ended May 1, 2021 |
|
|||||||||||||||||
(in millions) |
|
Automotive |
|
|
Industrial |
|
|
Interface |
|
|
Medical |
|
|
Total |
|
|||||
Geographic net sales: |
|
|
|
|
|
|
|
|
|
|
|
|
|
|
|
|||||
North America |
|
$ |
406.4 |
|
|
$ |
142.9 |
|
|
$ |
61.0 |
|
|
$ |
2.7 |
|
|
$ |
613.0 |
|
EMEA |
|
|
212.3 |
|
|
|
68.2 |
|
|
|
— |
|
|
|
— |
|
|
|
280.5 |
|
Asia |
|
|
137.0 |
|
|
|
56.8 |
|
|
|
0.6 |
|
|
|
0.1 |
|
|
|
194.5 |
|
Total net sales |
|
$ |
755.7 |
|
|
$ |
267.9 |
|
|
$ |
61.6 |
|
|
$ |
2.8 |
|
|
$ |
1,088.0 |
|
Timing of revenue recognition: |
|
|
|
|
|
|
|
|
|
|
|
|
|
|
|
|||||
Goods transferred at a point in time |
|
$ |
722.1 |
|
|
$ |
267.9 |
|
|
$ |
61.6 |
|
|
$ |
2.8 |
|
|
$ |
1,054.4 |
|
Goods transferred over time |
|
|
33.6 |
|
|
|
— |
|
|
|
— |
|
|
|
— |
|
|
|
33.6 |
|
Total net sales |
|
$ |
755.7 |
|
|
$ |
267.9 |
|
|
$ |
61.6 |
|
|
$ |
2.8 |
|
|
$ |
1,088.0 |
|
Customer Concentration
Sales to GM in the Automotive segment, either directly or through its tiered suppliers, are shown below.
|
|
Fiscal Year Ended |
|
|||||||||
|
|
April 30, 2022 |
|
|
May 1, 2021 |
|
|
May 2, 2020 |
|
|||
Percentage of net sales: |
|
|
|
|
|
|
|
|
|
|||
GM |
|
|
23.3 |
% |
|
|
27.5 |
% |
|
|
26.8 |
% |
Note 3. Leases
The Company leases real estate, automobiles and certain equipment under both operating and finance leases. The Company does not have any significant arrangements where it is the lessor. The majority of the Company's global lease portfolio represents leases of real estate, such as manufacturing facilities, warehouses and buildings. As of April 30, 2022, the Company's leases have remaining lease terms of up to 10.3 years, some of which include optional renewals or terminations, which are considered in the Company’s assessments when such options are reasonably certain to be exercised. Any variable payments related to the lease will be recorded as lease expense when and as incurred. The Company’s lease payments are largely fixed. As of April 30, 2022, the operating leases that the Company has signed but have not yet commenced are immaterial.
In addition to the operating lease assets presented on the consolidated balance sheets, assets under finance leases of $0.7 million and $0.7 million are included in property, plant and equipment, net on the consolidated balance sheets as of April 30, 2022 and May 1, 2021, respectively. Finance lease obligations were $0.8 million and $1.0 million as of April 30, 2022 and May 1, 2021, respectively, and are split between other accrued expenses for the short-term portion and other long-term liabilities for the long-term portion on the consolidated balance sheets. The Company had an immaterial amount of finance lease expense in the years ended April 30, 2022 and May 1, 2021.
The components of lease expense were as follows:
|
|
Fiscal Year Ended |
|
|||||||||
|
|
April 30, 2022 |
|
|
May 1, 2021 |
|
|
May 2, 2020 |
|
|||
(in millions) |
|
(52 Weeks) |
|
|
(52 Weeks) |
|
|
(53 Weeks) |
|
|||
Lease cost: |
|
|
|
|
|
|
|
|
|
|||
Operating lease cost |
|
$ |
8.9 |
|
|
$ |
8.4 |
|
|
$ |
9.0 |
|
Variable lease cost |
|
|
1.6 |
|
|
|
1.6 |
|
|
|
1.3 |
|
Total lease cost |
|
$ |
10.5 |
|
|
$ |
10.0 |
|
|
$ |
10.3 |
|
F-16
METHODE ELECTRONICS, INC. AND SUBSIDIARIES
NOTES TO CONSOLIDATED FINANCIAL STATEMENTS
Supplemental cash flow and other information related to operating leases was as follows:
|
|
Fiscal Year Ended |
|
|||||||||
|
|
April 30, 2022 |
|
|
May 1, 2021 |
|
|
May 2, 2020 |
|
|||
(in millions) |
|
(52 Weeks) |
|
|
(52 Weeks) |
|
|
(53 Weeks) |
|
|||
Operating cash flows: |
|
|
|
|
|
|
|
|
|
|||
Cash paid related to operating lease obligations, including lease termination payment |
|
$ |
10.8 |
|
|
$ |
9.3 |
|
|
$ |
8.7 |
|
Non-cash activity: |
|
|
|
|
|
|
|
|
|
|||
Right-of-use assets obtained in exchange for lease obligations |
|
$ |
7.7 |
|
|
$ |
5.7 |
|
|
$ |
5.5 |
|
Weighted-average remaining lease term |
|
5.3 years |
|
|
5.0 years |
|
|
5.7 years |
|
|||
Weighted-average discount rate |
|
|
4.4 |
% |
|
|
4.6 |
% |
|
|
4.7 |
% |
Maturities of operating lease liabilities as of April 30, 2022, are shown below:
(in millions) |
|
|
|
|
Fiscal Year: |
|
|
|
|
2023 |
|
$ |
6.5 |
|
2024 |
|
|
4.8 |
|
2025 |
|
|
2.5 |
|
2026 |
|
|
1.7 |
|
2027 |
|
|
1.5 |
|
Thereafter |
|
|
7.0 |
|
Total lease payments |
|
|
24.0 |
|
Less: imputed interest |
|
|
(3.2 |
) |
Present value of lease liabilities |
|
$ |
20.8 |
|
Note 4. Restructuring
The Company continually monitors market factors and industry trends and takes restructuring actions to reduce overall costs and improve future operational profitability as appropriate. Restructuring actions generally result in charges for employee termination benefits, plant closures, asset impairments and contract termination costs.
In fiscal 2022, the Company initiated a restructuring plan to consolidate one of its operations within the Industrial segment in response to logistics and tariff issues. This action resulted in a facility shutdown and consolidation of activities into an existing location. In fiscal 2022, the Company recognized $3.6 million of restructuring costs, of which $1.3 million was recorded in cost of products sold and $2.3 million was recorded in selling and administrative expenses.
In fiscal 2021, the Company initiated certain restructuring actions in response to the adverse impacts from the COVID-19 pandemic. These actions included plant consolidations and workforce reductions in the Automotive, Industrial and Interface segments. In fiscal 2021, the Company recognized $8.2 million of restructuring costs, of which $4.8 million was recorded in cost of products sold and $3.4 million was recorded in selling and administrative expenses.
Employee termination benefits are accrued upon the commitment to a termination plan and when the benefit arrangement is communicated to affected employees, or when liabilities are determined to be probable and estimable. Asset impairment charges relate to the impairment of ROU lease assets and equipment. Contract termination costs are recorded when notification of termination is given to the other party. The following is a rollforward of the Company’s restructuring activity in fiscal 2022:
|
|
|
|
|
|
|
|
Utilization |
|
|
|
|
||||||||
(in millions) |
|
Accrual as of |
|
|
YTD charges |
|
|
Cash |
|
|
Non-cash |
|
|
Accrual as of |
|
|||||
Employee termination benefits |
|
$ |
0.7 |
|
|
$ |
0.4 |
|
|
$ |
(1.0 |
) |
|
$ |
— |
|
|
$ |
0.1 |
|
Asset impairment charges |
|
|
— |
|
|
|
3.1 |
|
|
|
— |
|
|
|
(3.1 |
) |
|
|
— |
|
Contract termination costs |
|
|
0.5 |
|
|
|
0.1 |
|
|
|
(0.6 |
) |
|
|
— |
|
|
|
— |
|
Total |
|
$ |
1.2 |
|
|
$ |
3.6 |
|
|
$ |
(1.6 |
) |
|
$ |
(3.1 |
) |
|
$ |
0.1 |
|
F-17
METHODE ELECTRONICS, INC. AND SUBSIDIARIES
NOTES TO CONSOLIDATED FINANCIAL STATEMENTS
The table below presents restructuring costs by reportable segment:
|
|
Fiscal Year Ended |
|
|||||
(in millions) |
|
April 30, 2022 |
|
|
May 1, 2021 |
|
||
Automotive |
|
$ |
0.2 |
|
|
$ |
6.2 |
|
Industrial |
|
|
3.4 |
|
|
|
1.0 |
|
Interface |
|
|
— |
|
|
|
0.7 |
|
Medical |
|
|
— |
|
|
|
— |
|
Eliminations/Corporate |
|
|
— |
|
|
|
0.3 |
|
Total restructuring costs |
|
$ |
3.6 |
|
|
$ |
8.2 |
|
Estimates of restructuring costs are based on information available at the time such charges are recorded. Due to the inherent uncertainty involved in estimating restructuring costs, actual amounts paid for such activities may differ from amounts initially recorded. Accordingly, the Company may record revisions of previous estimates by adjusting previously established accruals. The Company may take additional restructuring actions in future periods based upon market conditions and industry trends.
Note 5. Inventory
A summary of inventories is shown below:
(in millions) |
|
April 30, 2022 |
|
|
May 1, 2021 |
|
||
Finished products |
|
$ |
31.8 |
|
|
$ |
24.8 |
|
Work in process |
|
|
12.9 |
|
|
|
14.0 |
|
Raw materials |
|
|
113.8 |
|
|
|
85.4 |
|
Total inventories |
|
$ |
158.5 |
|
|
$ |
124.2 |
|
Note 6. Property, Plant and Equipment
A summary of property, plant and equipment is shown below:
(in millions) |
|
April 30, 2022 |
|
|
May 1, 2021 |
|
||
Land |
|
$ |
3.3 |
|
|
$ |
3.3 |
|
Buildings and building improvements |
|
|
89.2 |
|
|
|
88.9 |
|
Machinery and equipment |
|
|
407.5 |
|
|
|
408.0 |
|
Construction in progress |
|
|
21.5 |
|
|
|
24.8 |
|
Total property, plant and equipment, gross |
|
|
521.5 |
|
|
|
525.0 |
|
Less: accumulated depreciation |
|
|
(324.5 |
) |
|
|
(321.0 |
) |
Property, plant and equipment, net |
|
$ |
197.0 |
|
|
$ |
204.0 |
|
Depreciation expense was $33.5 million, $32.2 million and $29.3 million in fiscal 2022, fiscal 2021 and fiscal 2020, respectively. As of April 30, 2022 and May 1, 2021, capital expenditures recorded in accounts payable totaled $4.4 million and $5.5 million, respectively.
Note 7. Goodwill and Other Intangible Assets
Goodwill
The Company tests goodwill for impairment on an annual basis as of the beginning of the fourth quarter each year, or more frequently if indicators of potential impairment exist. Goodwill impairment testing is conducted at the reporting unit level, which is generally defined as an operating segment or one level below an operating segment (also known as a reporting unit), for which discrete financial information is available and segment management regularly reviews the operating results of that reporting unit.
At the beginning of the fourth quarter of fiscal 2022, the annual goodwill impairment assessment was completed. The Company performed a qualitative assessment for each reporting unit except for two within the Automotive segment where a quantitative assessment was performed. The qualitative assessments indicated that it was more likely than not that the fair value of each reporting unit exceeded its respective carrying value.
For the quantitative assessment, the Company utilized the income approach to estimate the fair value of the reporting units. Cash flow projections were based on management’s estimates of revenue growth rates and earnings before interest, taxes, depreciation and amortization (“EBITDA”) margins, taking into consideration business and market conditions for the countries and markets in which the reporting unit operates. The Company calculates the discount rate based on a market-participant, risk-adjusted weighted average cost of capital, which considers industry specific rates of return on debt and equity capital for a target industry capital structure, adjusted for risks associated with business size, geography and other factors specific to the reporting unit.
F-18
METHODE ELECTRONICS, INC. AND SUBSIDIARIES
NOTES TO CONSOLIDATED FINANCIAL STATEMENTS
The quantitative assessment of the reporting units indicated that the fair value exceeded the carrying value. The Company does not believe that any of its reporting units are at risk for impairment. While the Company considered the impact the COVID-19 pandemic may have on its future cash flows when preparing its annual goodwill impairment test, the full extent of the impact that the COVID-19 pandemic, the semiconductor supply shortage and inflationary impact on materials, labor and freight costs will have on the Company’s business, operations and financial condition is currently unknown. The Company will continue to assess its goodwill for impairment as events and circumstances change. Any deterioration in the Company’s forecasted revenue and EBITDA margins, could result in an impairment of a portion or all of its goodwill. The amount of such impairment would be recognized as an expense in the period the goodwill is impaired.
A summary of the changes in goodwill by reportable segment is as follows:
(in millions) |
|
Automotive |
|
|
Industrial |
|
|
Total |
|
|||
Balance as of April 27, 2019 |
|
$ |
106.3 |
|
|
$ |
127.0 |
|
|
$ |
233.3 |
|
Acquisitions |
|
|
— |
|
|
|
(0.2 |
) |
|
|
(0.2 |
) |
Foreign currency translation |
|
|
(0.1 |
) |
|
|
(1.4 |
) |
|
|
(1.5 |
) |
Balance as of May 2, 2020 |
|
|
106.2 |
|
|
|
125.4 |
|
|
|
231.6 |
|
Foreign currency translation |
|
|
0.5 |
|
|
|
3.5 |
|
|
|
4.0 |
|
Balance as of May 1, 2021 |
|
|
106.7 |
|
|
|
128.9 |
|
|
|
235.6 |
|
Foreign currency translation |
|
|
(0.8 |
) |
|
|
(1.8 |
) |
|
|
(2.6 |
) |
Balance as of April 30, 2022 |
|
$ |
105.9 |
|
|
$ |
127.1 |
|
|
$ |
233.0 |
|
A summary of goodwill by reporting unit is as follows:
(in millions) |
|
April 30, 2022 |
|
|
May 1, 2021 |
|
||
Grakon Industrial |
|
$ |
125.5 |
|
|
$ |
127.2 |
|
North American Automotive |
|
|
99.8 |
|
|
|
99.8 |
|
European Automotive |
|
|
6.1 |
|
|
|
6.9 |
|
Other |
|
|
1.6 |
|
|
|
1.7 |
|
Total |
|
$ |
233.0 |
|
|
$ |
235.6 |
|
Other intangible assets, net
Details of identifiable intangible assets are shown below:
|
|
As of April 30, 2022 |
|
|||||||||||||
(in millions) |
|
Gross |
|
|
Accumulated |
|
|
Net |
|
|
Weighted |
|
||||
Amortized intangible assets: |
|
|
|
|
|
|
|
|
|
|
|
|
||||
Customer relationships and agreements |
|
$ |
232.3 |
|
|
$ |
(55.1 |
) |
|
$ |
177.2 |
|
|
|
14.7 |
|
Trade names, patents and technology licenses |
|
|
58.0 |
|
|
|
(29.3 |
) |
|
|
28.7 |
|
|
|
6.2 |
|
Total amortized intangible assets |
|
|
290.3 |
|
|
|
(84.4 |
) |
|
|
205.9 |
|
|
|
|
|
Unamortized trade name |
|
|
1.8 |
|
|
|
— |
|
|
|
1.8 |
|
|
|
|
|
Total other intangible assets |
|
$ |
292.1 |
|
|
$ |
(84.4 |
) |
|
$ |
207.7 |
|
|
|
|
|
|
|
As of May 1, 2021 |
|
|||||||||||||
(in millions) |
|
Gross |
|
|
Accumulated |
|
|
Net |
|
|
Weighted |
|
||||
Amortized intangible assets: |
|
|
|
|
|
|
|
|
|
|
|
|
||||
Customer relationships and agreements |
|
$ |
235.3 |
|
|
$ |
(42.7 |
) |
|
$ |
192.6 |
|
|
|
15.6 |
|
Trade names, patents and technology licenses |
|
|
58.7 |
|
|
|
(23.7 |
) |
|
|
35.0 |
|
|
|
7.0 |
|
Total amortized intangible assets |
|
|
294.0 |
|
|
|
(66.4 |
) |
|
|
227.6 |
|
|
|
|
|
Unamortized trade name |
|
|
1.8 |
|
|
|
— |
|
|
|
1.8 |
|
|
|
|
|
Total other intangible assets |
|
$ |
295.8 |
|
|
$ |
(66.4 |
) |
|
$ |
229.4 |
|
|
|
|
|
F-19
METHODE ELECTRONICS, INC. AND SUBSIDIARIES
NOTES TO CONSOLIDATED FINANCIAL STATEMENTS
The Company performed an impairment test for its indefinite-lived trade name intangible asset and determined that no impairment existed as of April 30, 2022. Based on the current amount of intangible assets subject to amortization, the estimated aggregate amortization expense for each of the five succeeding fiscal years and thereafter is as follows:
(in millions) |
|
|
|
|
Fiscal Year: |
|
|
|
|
2023 |
|
$ |
18.9 |
|
2024 |
|
|
18.5 |
|
2025 |
|
|
17.9 |
|
2026 |
|
|
17.1 |
|
2027 |
|
|
16.4 |
|
Thereafter |
|
|
117.1 |
|
Total |
|
$ |
205.9 |
|
Note 8. Derivative Financial Instruments and Hedging Activities
The Company is exposed to various market risks including, but not limited to, foreign currency exchange rates and market interest rates. The Company strives to control its exposure to these risks through our normal operating activities and, where appropriate, through the use of derivative financial instruments. Derivative financial instruments are measured at fair value on a recurring basis.
For a designated cash flow hedge, the effective portion of the change in the fair value of the derivative financial instrument is recorded in AOCI in the consolidated balance sheets. When the underlying hedged transaction is realized, the gain or loss previously included in AOCI is recorded in earnings and reflected in the consolidated statements of income on the same line as the gain or loss on the hedged item attributable to the hedged risk. The gain or loss associated with changes in the fair value of derivatives not designated as hedges are recorded immediately in the consolidated statements of income on the same line as the associated risk. For a designated net investment hedge, the effective portion of the change in the fair value of the derivative financial instrument is recorded as a cumulative translation adjustment in AOCI in the consolidated balance sheets.
Net investment hedges
The Company has a variable-rate, cross-currency swap, maturing on August 31, 2023, with a notional value of $60.0 million (€54.8 million). The Company entered into the cross-currency swap to mitigate changes in net assets due to changes in U.S. dollar-euro spot exchange rates. The cross-currency swap is designated as a hedge of the Company’s net investment in a euro-based
subsidiary.
Hedge effectiveness is assessed at the inception of the hedging relationship and quarterly thereafter, under the spot-to-spot method. The Company recognizes the impact of all other changes in fair value of the derivative through interest expense, which was not material in either fiscal 2022 or fiscal 2021.
Interest rate swaps
In April 2021, the Company entered into interest rate swaps, maturing on August 31, 2023, with a notional value of $100.0 million, to manage its exposure and to mitigate the impact of interest rate variability. The interest rate swaps are designated as cash flow hedges.
Hedge effectiveness is assessed at the inception of the hedging relationship and quarterly thereafter. The effective portion of the periodic changes in fair value is recognized in AOCI. Subsequently, the accumulated gains and losses recorded in equity are reclassified to income in the period during which the hedged cash flow impacts earnings, which are expected to be immaterial over the next 12 months. No ineffectiveness was recognized in fiscal 2022 or fiscal 2021.
Derivatives not designated as hedges
The Company uses short-term foreign currency forward contracts to reduce the earnings impact that exchange rate fluctuations have on non-functional currency balance sheet exposures. These forward contracts are not designated as hedging instruments. Gains and losses on these forward contracts are recognized in other income, net, along with the foreign currency gains and losses on monetary assets and liabilities in the consolidated statements of income.
As of April 30, 2022 and May 1, 2021, the Company held foreign currency forward contracts with a notional value of $38.6 million and $14.8 million, respectively. In fiscal 2022 and fiscal 2021, gains of $0.1 million and losses of $0.1 million, respectively, were recorded in earnings within other income, net in the consolidated statements of income.
F-20
METHODE ELECTRONICS, INC. AND SUBSIDIARIES
NOTES TO CONSOLIDATED FINANCIAL STATEMENTS
Fair value of derivative instruments on the balance sheet
The fair value of derivative instruments are classified as Level 2 within the fair value hierarchy and are recorded in the balance sheets as follows:
|
|
Asset/(Liability) |
|
|||||
(in millions) |
Financial Statement Caption |
April 30, 2022 |
|
|
May 1, 2021 |
|
||
Derivatives designated as hedging instruments: |
|
|
|
|
|
|
||
Net investment hedges |
Other long-term liabilities |
$ |
— |
|
|
$ |
(6.8 |
) |
Net investment hedges |
Other long-term assets |
$ |
1.9 |
|
|
$ |
— |
|
Interest rate swaps |
Other long-term liabilities |
$ |
— |
|
|
$ |
(0.2 |
) |
Interest rate swaps |
Other long-term assets |
$ |
3.0 |
|
|
$ |
— |
|
Derivatives not designated as hedging instruments: |
|
|
|
|
|
|
||
Foreign currency forward contracts |
Other accrued liabilities |
$ |
(0.2 |
) |
|
$ |
— |
|
Note 9. Retirement Benefits
Defined contribution plans
The Company has an employee 401(k) Savings Plan covering substantially all U.S. employees to which it makes contributions equal to 3% of eligible compensation. In addition, certain of the Company’s foreign subsidiaries also have defined contribution savings plans. Company contributions to these plans were $1.2 million, $1.2 million and $1.7 million, in fiscal 2022, fiscal 2021 and fiscal 2020, respectively.
Non-qualified deferred compensation plan
The Company maintains a non-qualified deferred compensation plan (“NQDC Plan”) for certain eligible employees and members of the Board of Directors. Under the NQDC Plan, employees may elect to defer up to 75% of their annual base salary and 100% of their annual cash incentive compensation, with an aggregate minimum deferral of $3,000. Directors may defer all or a portion of their annual directors’ fees or annual stock awards. The minimum period of deferral is three years. Participants are immediately 100% vested. The Company does not make any contributions to the NQDC Plan.
The deferred compensation liability for the NDQC Plan was $7.6 million and $6.5 million as of April 30, 2022 and May 1, 2021, respectively. The Company has purchased life insurance policies on certain employees, which are held in a Rabbi trust, to potentially offset these unsecured obligations. These life insurance policies are recorded at their cash surrender value of $7.8 million and $8.3 million as of April 30, 2022 and May 1, 2021, respectively, and are included in other long-term assets in the consolidated balance sheets.
The Company also owns and is the beneficiary of a number of life insurance policies on the lives of former key executives that are unrestricted as to use. These life insurance policies are recorded at their cash surrender value of $9.9 million and $9.5 million as of April 30, 2022 and May 1, 2021, respectively, and are included in other long-term assets in the consolidated balance sheets.
The cash surrender value of the life insurance policies approximates its fair value and is classified within Level 2 of the fair value hierarchy.
F-21
METHODE ELECTRONICS, INC. AND SUBSIDIARIES
NOTES TO CONSOLIDATED FINANCIAL STATEMENTS
Note 10. Debt
A summary of debt is shown below:
(in millions) |
|
April 30, 2022 |
|
|
May 1, 2021 |
|
||
Revolving credit facility |
|
$ |
— |
|
|
$ |
9.9 |
|
Term loan |
|
|
206.3 |
|
|
|
218.7 |
|
Other debt |
|
|
5.1 |
|
|
|
13.0 |
|
Unamortized debt issuance costs |
|
|
(0.9 |
) |
|
|
(1.5 |
) |
Total debt |
|
|
210.5 |
|
|
|
240.1 |
|
Less: current maturities |
|
|
(13.0 |
) |
|
|
(14.9 |
) |
Total long-term debt |
|
$ |
197.5 |
|
|
$ |
225.2 |
|
Revolving credit facility/term loan
The Company is a party to an Amended and Restated Credit Agreement (“Credit Agreement”) with Bank of America, N.A., as Administrative Agent, and Wells Fargo Bank, N.A. The Credit Agreement terminates in September 2023 and consists of a senior unsecured revolving credit facility (“Revolving Credit Facility”) of $200.0 million and a senior unsecured term loan (“Term Loan”) of $250.0 million. In addition, the Company has an option to increase the size of the Revolving Credit Facility and Term Loan by up to an additional $200.0 million, subject to customary conditions and approval of the lenders providing new commitments. The Credit Agreement is guaranteed by the Company’s wholly-owned U.S. subsidiaries. For the Term Loan, the Company is required to make quarterly principal payments of 1.25% of the original Term Loan ($3.1 million) through maturity, with the remaining balance due on September 12, 2023.
On December 10, 2021, the Company entered into a First Amendment to the Credit Agreement (“First Amendment”). The First Amendment amended and restated the Credit Agreement to provide, among other things, that upon the occurrence of certain events, the interest rate calculation method will generally transition from the London Interbank Offered Rate (“LIBOR”) to an alternate reference rate, including the Secured Overnight Financing Rate (“SOFR”) for U.S. dollar denominated borrowings.
Outstanding borrowings under the Credit Agreement bear interest at variable rates based on the type of borrowing and the Company’s debt to EBITDA financial ratio, as defined in the Credit Agreement. The weighted-average interest rate on outstanding borrowings under the Credit Agreement was approximately 2.0% as of April 30, 2022. The Credit Agreement contains customary representations and warranties, financial covenants, restrictive covenants and events of default. As of April 30, 2022, the Company was in compliance with all the covenants in the Credit Agreement. The fair value of borrowings under the Credit Agreement approximates book value because the interest rate is variable.
Other debt
One of the Company’s European subsidiaries has debt that consists of 3 notes with maturities ranging from 2023 to 2031. The weighted-average interest rate was approximately 1.4% as of April 30, 2022 and $0.5 million of the debt was classified as short-term. The fair value of other debt was $4.7 million at April 30, 2022 and was based on Level 2 inputs on a non-recurring basis.
Scheduled maturities
As of April 30, 2022, scheduled principal payments of debt are as follows:
(in millions) |
|
|
|
|
Fiscal Year: |
|
|
|
|
2023 |
|
$ |
13.0 |
|
2024 |
|
|
196.9 |
|
2025 |
|
|
0.2 |
|
2026 |
|
|
0.2 |
|
2027 |
|
|
0.2 |
|
Thereafter |
|
|
0.9 |
|
Total |
|
$ |
211.4 |
|
F-22
METHODE ELECTRONICS, INC. AND SUBSIDIARIES
NOTES TO CONSOLIDATED FINANCIAL STATEMENTS
Note 11. Income Taxes
Income tax provision
The U.S. and foreign components of income before income taxes and the provision for income taxes are as follows:
|
|
Fiscal Year Ended |
|
|||||||||
|
|
April 30, 2022 |
|
|
May 1, 2021 |
|
|
May 2, 2020 |
|
|||
(in millions) |
|
(52 Weeks) |
|
|
(52 Weeks) |
|
|
(53 Weeks) |
|
|||
Income before income taxes: |
|
|
|
|
|
|
|
|
|
|||
U.S. |
|
$ |
31.2 |
|
|
$ |
28.3 |
|
|
$ |
47.3 |
|
Foreign |
|
|
87.3 |
|
|
|
106.6 |
|
|
|
101.4 |
|
Total income before income taxes |
|
$ |
118.5 |
|
|
$ |
134.9 |
|
|
$ |
148.7 |
|
Income tax expense: |
|
|
|
|
|
|
|
|
|
|||
Current: |
|
|
|
|
|
|
|
|
|
|||
U.S. (federal and state) |
|
$ |
5.2 |
|
|
$ |
5.8 |
|
|
$ |
5.1 |
|
Foreign |
|
|
13.5 |
|
|
|
15.9 |
|
|
|
12.8 |
|
Total current expense |
|
|
18.7 |
|
|
|
21.7 |
|
|
|
17.9 |
|
Deferred: |
|
|
|
|
|
|
|
|
|
|||
U.S. (federal and state) |
|
|
0.2 |
|
|
|
1.3 |
|
|
|
6.1 |
|
Foreign |
|
|
(2.6 |
) |
|
|
(10.4 |
) |
|
|
1.3 |
|
Total deferred (benefit) expense |
|
|
(2.4 |
) |
|
|
(9.1 |
) |
|
|
7.4 |
|
Total income tax expense |
|
$ |
16.3 |
|
|
$ |
12.6 |
|
|
$ |
25.3 |
|
A reconciliation of income tax expense to the U.S. statutory federal income tax rate of 21% is as follows:
|
|
Fiscal Year Ended |
|
|||||||||
(in millions) |
|
April 30, 2022 |
|
|
May 1, 2021 |
|
|
May 2, 2020 |
|
|||
Income tax at statutory rate |
|
$ |
24.9 |
|
|
$ |
28.3 |
|
|
$ |
31.2 |
|
Effect of: |
|
|
|
|
|
|
|
|
|
|||
State income taxes, net of federal benefit |
|
|
0.6 |
|
|
|
0.1 |
|
|
|
1.5 |
|
Withholding taxes |
|
|
2.5 |
|
|
|
2.7 |
|
|
|
2.3 |
|
Non-deductible compensation |
|
|
2.1 |
|
|
|
0.5 |
|
|
|
0.2 |
|
Foreign tax differential |
|
|
(8.1 |
) |
|
|
(10.8 |
) |
|
|
(8.3 |
) |
U.S. tax on foreign income |
|
|
(1.7 |
) |
|
|
2.8 |
|
|
|
(1.0 |
) |
Foreign investment tax credit |
|
|
— |
|
|
|
(7.2 |
) |
|
|
(0.8 |
) |
Research and development |
|
|
(2.6 |
) |
|
|
(2.2 |
) |
|
|
(0.6 |
) |
Change in tax reserve |
|
|
(0.1 |
) |
|
|
0.1 |
|
|
|
2.2 |
|
Change in valuation allowance |
|
|
(2.0 |
) |
|
|
1.8 |
|
|
|
0.8 |
|
Tax rate change, foreign |
|
|
0.1 |
|
|
|
(0.1 |
) |
|
|
(0.1 |
) |
Other, net |
|
|
0.6 |
|
|
|
(3.4 |
) |
|
|
(2.1 |
) |
Income tax expense |
|
$ |
16.3 |
|
|
$ |
12.6 |
|
|
$ |
25.3 |
|
Effective income tax rate |
|
|
13.8 |
% |
|
|
9.3 |
% |
|
|
17.0 |
% |
In fiscal 2022, the effective income tax rate was favorably impacted by the amount of income earned in foreign jurisdictions with lower tax rates and the release of a valuation allowance of $2.0 million due to a tax law change. In addition, the Company benefited from less U.S. tax on foreign income of $1.7 million attributable to lower earnings in non-U.S. jurisdictions which was partially offset with non-deductible compensation of $2.1 million.
In fiscal 2021, the effective income tax rate was favorably impacted by the amount of income earned in foreign jurisdictions with lower tax rates, tax credits and various deductions allowed in foreign jurisdictions. The Company received a benefit of approximately $7.2 million related to a favorable tax ruling in a foreign jurisdiction.
In fiscal 2020, the effective income tax rate was primarily affected by the amount of income earned in foreign jurisdictions with lower tax rates, the amount of tax credits earned, withholding taxes, tax reserves, and the current taxation of foreign earnings. The Company had a favorable impact from operations in foreign countries with tax rates lower than the U.S. statutory tax rate. The Company earned $0.8 million in investment tax credits primarily related to an investment in qualified expenditures. This was offset by a change in tax reserves of $2.2 million and foreign withholding taxes of $2.3 million.
F-23
METHODE ELECTRONICS, INC. AND SUBSIDIARIES
NOTES TO CONSOLIDATED FINANCIAL STATEMENTS
On March 27, 2020, the Coronavirus Aid, Relief, and Economic Security Act (“CARES Act”) was enacted in response to the COVID-19 pandemic. The CARES Act, among other things, includes various income and payroll tax provisions, modifications to federal net operating loss rules, business interest deduction limitations, and bonus depreciation eligibility for qualified improvement property. The CARES Act did not significantly impact the fiscal 2021 consolidated financial statements.
Deferred income taxes and valuation allowances
Significant components of the Company's deferred income tax assets and liabilities were as follows:
(in millions) |
|
April 30, 2022 |
|
|
May 1, 2021 |
|
||
Deferred tax liabilities: |
|
|
|
|
|
|
||
Fixed assets |
|
$ |
(4.3 |
) |
|
$ |
(2.9 |
) |
Amortization |
|
|
(48.1 |
) |
|
|
(49.1 |
) |
Foreign tax |
|
|
(3.1 |
) |
|
|
(2.0 |
) |
Lease assets |
|
|
(4.5 |
) |
|
|
(4.9 |
) |
Derivative financial instruments |
|
|
(1.1 |
) |
|
|
— |
|
Other liabilities |
|
|
(0.6 |
) |
|
|
(0.4 |
) |
Deferred tax liabilities, gross |
|
|
(61.7 |
) |
|
|
(59.3 |
) |
Deferred tax assets: |
|
|
|
|
|
|
||
Deferred compensation and stock award amortization |
|
|
6.9 |
|
|
|
6.9 |
|
Inventory |
|
|
3.5 |
|
|
|
2.7 |
|
Lease liabilities |
|
|
4.7 |
|
|
|
5.3 |
|
Derivative financial instruments |
|
|
— |
|
|
|
1.6 |
|
Foreign investment tax credit |
|
|
29.8 |
|
|
|
34.7 |
|
Net operating loss carryforwards |
|
|
17.4 |
|
|
|
15.6 |
|
Foreign tax credits |
|
|
1.3 |
|
|
|
1.4 |
|
Other |
|
|
3.4 |
|
|
|
3.3 |
|
Deferred tax assets, gross |
|
|
67.0 |
|
|
|
71.5 |
|
Less valuation allowance |
|
|
(6.8 |
) |
|
|
(9.3 |
) |
Deferred tax assets, net of valuation allowance |
|
|
60.2 |
|
|
|
62.2 |
|
Net deferred tax (liability) asset |
|
$ |
(1.5 |
) |
|
$ |
2.9 |
|
Balance sheet classification: |
|
|
|
|
|
|
||
Long-term asset |
|
|
36.8 |
|
|
|
41.2 |
|
Long-term liability |
|
|
(38.3 |
) |
|
|
(38.3 |
) |
Net deferred tax (liability) asset |
|
$ |
(1.5 |
) |
|
$ |
2.9 |
|
The Company recorded a net deferred tax liability for U.S. and foreign income taxes of $1.5 million for fiscal 2022 and a net deferred tax asset of $2.9 million for fiscal 2021. In assessing the realizability of the deferred tax assets, the Company considers whether it is more likely than not that some portion or the entire deferred tax asset will be realized. Ultimately, the realization of the deferred tax asset is dependent upon the generation of sufficient earnings in future periods in which these temporary items can be utilized. In that regard, the Company has a valuation allowance of $6.8 million related to federal, state, and foreign net operating loss carryovers and other credits and determined that these deferred tax assets did not reach the more likely than not realizable standard.
As of April 30, 2022, the Company had available $36.3 million of federal, $68.9 million of state and $14.9 million of foreign gross operating loss carryforwards with a valuation allowance of $24.2 million for federal, $24.1 million for state and $0 for foreign. The U.S. federal net operating loss carryforwards will substantially start to expire in 2026 and beyond. The state net operating loss carryforwards will substantially start to expire in 2032 and beyond.
Total unused credits are $31.2 million as of April 30, 2022, the majority of which can be carried forward indefinitely.
Indefinite reinvestment
The Company has not provided for deferred income taxes on the undistributed earnings of foreign subsidiaries except for certain identified amounts. The amount the Company expects to repatriate is based on a variety of factors including current year earnings of the foreign subsidiaries, foreign investment needs, and U.S. cash flow considerations. The Company considers the remaining undistributed foreign earnings that are not specifically identified to be indefinitely reinvested of $354.3 million. It is not practicable to determine the amount of deferred tax liability on such foreign earnings as the actual tax liability is dependent on circumstances that exist when the remittance occurs.
F-24
METHODE ELECTRONICS, INC. AND SUBSIDIARIES
NOTES TO CONSOLIDATED FINANCIAL STATEMENTS
Unrecognized tax benefits
The Company operates in multiple jurisdictions throughout the world and the income tax returns of its subsidiaries in various jurisdictions are subject to periodic examination by the tax authorities. The Company regularly assesses the status of these examinations and the various outcomes to determine the adequacy of its provision for income taxes. The amount of gross unrecognized tax benefits totaled $5.1 million and $5.3 million as of April 30, 2022 and May 1, 2021, respectively. These amounts represent the amount of unrecognized benefits that, if recognized, would favorably impact the effective tax rate if resolved in the Company’s favor. The Company recognizes interest and penalties related to income tax uncertainties in income tax expense. Accrued interest and penalties were $0.2 million at both April 30, 2022 and May 1, 2021.
The following table presents a reconciliation of the beginning and ending amounts of unrecognized tax benefits:
(in millions) |
|
April 30, 2022 |
|
|
May 1, 2021 |
|
||
Balance at beginning of period |
|
$ |
5.3 |
|
|
$ |
5.2 |
|
Increases for positions related to the current year |
|
|
— |
|
|
|
0.2 |
|
Lapsing of statutes of limitations |
|
|
(0.2 |
) |
|
|
(0.1 |
) |
Balance at end of period |
|
$ |
5.1 |
|
|
$ |
5.3 |
|
At April 30, 2022, it is not possible to reasonably estimate the expected change to the total amount of unrecognized tax benefits in the next twelve months.
The U.S. federal statute of limitations remains open for fiscal years ended on or after 2019 and for state tax purposes on or after fiscal year 2013. Tax authorities may have the ability to review and adjust net operating losses or tax credits that were generated prior to these fiscal years. In the major foreign jurisdictions, fiscal 2014 and subsequent periods remain open and subject to examination by taxing authorities.
Note 12. Commitments and Contingencies
Environmental matters
The Company is not aware of any potential unasserted environmental claims that may be brought against us. The Company is involved in environmental investigations and/or remediation at two of its United Sates plant sites no longer used for operations. The Company uses environmental consultants to assist us in evaluating its environmental liabilities in order to establish appropriate accruals in its consolidated financial statements. Accruals are recorded when environmental remediation is probable and the costs can be reasonably estimated. A number of factors affect the cost of environmental remediation, including the determination of the extent of contamination, the length of time remediation may require, the complexity of environmental regulations and the advancement of remediation technology. Considering these factors, the Company has estimated (without discounting) the costs of remediation, which will be incurred over a period of several years. Recovery from insurance or other third parties is not anticipated. The Company is not yet able to determine when such remediation activity will be complete, but estimates for certain remediation efforts are projected through fiscal 2023.
As of April 30, 2022 and May 1, 2021, the Company had accruals, primarily based upon independent estimates, for environmental matters of $1.0 million and $0.9 million, respectively. The accrual as of April 30, 2022 consists of $0.7 million classified in other accrued expenses and the remainder was included in other long-term liabilities on the consolidated balance sheet. The accrual as of May 1, 2021 consists of $0.6 million classified in other accrued expenses and the remainder was included in other long-term liabilities on the consolidated balance sheet. The Company believes the provisions made for environmental matters are adequate to satisfy liabilities relating to such matters, however it is reasonably possible that costs could exceed accrued amounts if the selected methods of remediation do not reduce the contaminates at the sites to levels acceptable to federal and state regulatory agencies.
In each of fiscal 2022, fiscal 2021 and fiscal 2020, the Company spent $0.5 million on remediation cleanups and related studies. The costs associated with environmental matters as they relate to day-to-day activities were not material in fiscal 2022, fiscal 2021 or fiscal 2020.
F-25
METHODE ELECTRONICS, INC. AND SUBSIDIARIES
NOTES TO CONSOLIDATED FINANCIAL STATEMENTS
Litigation
The Company, from time to time, is subject to various legal actions and claims incidental to our business, including those arising out of alleged defects, breach of contracts, patent infringement claims, employment-related matters and environmental matters. The Company considers insurance coverage and third party indemnification when determining required accruals for pending litigation and claims. Although the outcome of potential legal actions and claims cannot be determined, it is the opinion of the Company's management, based on the information available, that the Company has adequate reserves for these liabilities and that the ultimate resolution of these matters will not have a material adverse effect on the Company's consolidated financial statements.
Hetronic Germany-GmbH Matters
For several years, Hetronic Germany-GmbH and Hydronic-Steuersysteme-GmbH (the “Fuchs companies”) served as our distributors for Germany, Austria and other central and eastern European countries pursuant to their respective intellectual property licenses and distribution and assembly agreements. The Company became aware that the Fuchs companies and their managing director, Albert Fuchs, had materially violated those agreements. As a result, the Company terminated all of its agreements with the Fuchs companies. On June 20, 2014, the Company filed a lawsuit against the Fuchs companies in the Federal District Court for the Western District of Oklahoma alleging material breaches of the distribution and assembly agreements and seeking damages, as well as various forms of injunctive relief. The defendants filed counterclaims alleging breach of contract, interference with business relations and business slander. On April 2, 2015, the Company amended its complaint against the Fuchs companies to add additional unfair competition and Lanham Act claims and to add additional affiliated parties.
A trial with respect to the matter began in February 2020. During the trial, the defendants dismissed their one remaining counterclaim with prejudice. On March 2, 2020, the jury returned a verdict in favor of the Company. The verdict included approximately $102 million in compensatory damages and $11 million in punitive damages. On April 22, 2020, the Court entered a permanent injunction barring defendants from selling infringing products and ordering them to return Hetronic’s confidential information. Defendants appealed entry of the permanent injunction. On May 29, 2020, the Court held defendants in contempt for violating the permanent injunction and entered the final judgment. Defendants appealed entry of the final monetary judgment as well. The appeal of the permanent injunction and the appeal of the final judgment were consolidated into a single appeal before the U.S. Court of Appeals for the Tenth Circuit. On August 24, 2021, the Tenth Circuit issued a decision affirming the lower court’s ruling with the exception that it instructed the District Court to modify the injunction from the entire world to all of the countries in which Hetronic sells its products. On April 20 and 21, 2022, the District Court held a hearing related to modifying the injunction pursuant to the Tenth Circuit’s opinion, and the parties currently are preparing post-hearing briefs. The defendants also filed a petition for certiorari with the United States Supreme Court seeking to further appeal the extraterritorial application of the Lanham Act in this case. Hetronic has opposed that petition. The Supreme Court has requested the views of the Solicitor General on the petition for certiorari. Like any judgment, particularly any judgment involving defendants outside of the United States, there is no guarantee that the Company will be able to collect all or any portion of the judgment.
Note 13. Shareholders’ Equity
Share buyback program
On March 31, 2021, the Board of Directors authorized the purchase of up to $100.0 million of the Company’s outstanding common stock through March 31, 2023. Such purchases may be made on the open market, in private transactions or pursuant to purchase plans designed to comply with Rule 10b5-1 of the Securities Exchange Act of 1934. The following table summarizes the Company’s stock buyback activity under this share buyback program:
|
|
Fiscal Year Ended |
|
|||||
(in millions, except share and per share data) |
|
April 30, 2022 |
|
|
May 1, 2021 |
|
||
Shares purchased |
|
|
1,425,190 |
|
|
|
167,949 |
|
Average price per share |
|
$ |
44.73 |
|
|
$ |
44.66 |
|
Total cost |
|
$ |
63.7 |
|
|
$ |
7.5 |
|
As of April 30, 2022, a total of 1,593,139 shares have been purchased at a total cost of $71.2 million since the commencement of the share buyback program. All purchased shares were retired and are reflected as a reduction of common stock for the par value of shares, with the excess applied as a reduction to retained earnings. As of April 30, 2022, the dollar value of shares that remained available to be purchased by the Company under this share buyback program was approximately $28.8 million.
On June 16, 2022, the Board of Directors authorized an increase in the existing share buyback program under which the Company may purchase up to an additional $100.0 million of its outstanding common stock, and also extended the expiration from March 31, 2023 to June 14, 2024.
F-26
METHODE ELECTRONICS, INC. AND SUBSIDIARIES
NOTES TO CONSOLIDATED FINANCIAL STATEMENTS
Dividends
The Company paid dividends totaling $20.4 million in fiscal 2022, $17.4 million in fiscal 2021 and $16.3 million in fiscal 2020. Dividends paid in fiscal 2021 includes $0.9 million of dividends on restricted stock that vested during the period. The Company increased its quarterly dividend from $0.11 per share to $0.14 per share beginning in the three months ended July 31, 2021.
Accumulated other comprehensive income (loss)
Comprehensive income (loss) is defined as the change in equity of a business enterprise during a period from transactions and other events and circumstances from non-owner sources. A summary of changes in accumulated other comprehensive income (loss), net of tax is shown below:
(in millions) |
|
Currency Translation Adjustments |
|
|
Derivative Instruments |
|
|
Total |
|
|||
Balance as of April 27, 2019 |
|
$ |
(13.6 |
) |
|
$ |
- |
|
|
$ |
(13.6 |
) |
Other comprehensive loss |
|
|
(12.9 |
) |
|
|
(1.3 |
) |
|
|
(14.2 |
) |
Tax benefit |
|
|
0.6 |
|
|
|
0.3 |
|
|
|
0.9 |
|
Net current period other comprehensive loss |
|
|
(12.3 |
) |
|
|
(1.0 |
) |
|
|
(13.3 |
) |
Balance as of May 2, 2020 |
|
|
(25.9 |
) |
|
|
(1.0 |
) |
|
|
(26.9 |
) |
Other comprehensive income (loss) |
|
|
38.6 |
|
|
|
(5.7 |
) |
|
|
32.9 |
|
Tax (expense) benefit |
|
|
(1.2 |
) |
|
|
1.3 |
|
|
|
0.1 |
|
Net current period other comprehensive income (loss) |
|
|
37.4 |
|
|
|
(4.4 |
) |
|
|
33.0 |
|
Balance as of May 1, 2021 |
|
|
11.5 |
|
|
|
(5.4 |
) |
|
|
6.1 |
|
Other comprehensive income (loss) |
|
|
(42.4 |
) |
|
|
11.9 |
|
|
|
(30.5 |
) |
Tax (expense) benefit |
|
|
0.4 |
|
|
|
(2.8 |
) |
|
|
(2.4 |
) |
Net current period other comprehensive income (loss) |
|
|
(42.0 |
) |
|
|
9.1 |
|
|
|
(32.9 |
) |
Balance as of April 30, 2022 |
|
$ |
(30.5 |
) |
|
$ |
3.7 |
|
|
$ |
(26.8 |
) |
Stock-based compensation
The Company has granted stock options, restricted stock awards (“RSAs”), restricted stock units (“RSUs”) and stock awards to employees and non-employee directors under the Methode Electronics, Inc. 2014 Omnibus Incentive Plan (“2014 Plan”), the Methode Electronics, Inc. 2010 Stock Plan (“2010 Plan”), the Methode Electronics, Inc. 2007 Stock Plan (“2007 Plan”) and the Methode Electronics, Inc. 2004 Stock Plan (“2004 Plan”). The Company’s stockholders approved the 2014 Plan in September 2014. The Company can no longer make grants under the 2010 Plan, 2007 Plan and 2004 Plan. The number of shares of common stock originally authorized under the 2014 Plan is 3,000,000. As of April 30, 2022, there were 112,255 shares available for award under the 2014 Plan.
Stock-based compensation expense
All stock-based payments to employees and directors are recognized in selling and administrative expenses on the consolidated statements of income. Awards subject to graded vesting are recognized using the accelerated recognition method over the requisite service period. The table below summarizes the stock-based compensation expense (benefit) related to the equity awards:
|
|
Fiscal Year Ended |
|
|||||||||
|
|
April 30, 2022 |
|
|
May 1, 2021 |
|
|
May 2, 2020 |
|
|||
(in millions) |
|
(52 Weeks) |
|
|
(52 Weeks) |
|
|
(53 Weeks) |
|
|||
RSAs |
|
$ |
— |
|
|
$ |
— |
|
|
$ |
(2.1 |
) |
RSUs |
|
|
10.3 |
|
|
|
5.9 |
|
|
|
1.5 |
|
Deferred director awards |
|
|
0.8 |
|
|
|
— |
|
|
|
— |
|
Director awards |
|
|
0.7 |
|
|
|
0.9 |
|
|
|
0.9 |
|
Total stock-based compensation expense |
|
$ |
11.8 |
|
|
$ |
6.8 |
|
|
$ |
0.3 |
|
2014 Plan
The 2014 Plan provides for discretionary grants of stock options, stock appreciation rights, RSAs, RSUs and performance units to key employees and directors. The 2014 Plan is intended to promote the success of the Company and to increase stockholder value by providing an additional means to attract, motivate, retain and reward selected employees and eligible directors through the grant of equity awards.
F-27
METHODE ELECTRONICS, INC. AND SUBSIDIARIES
NOTES TO CONSOLIDATED FINANCIAL STATEMENTS
Restricted stock awards and performance units
As of April 30, 2022, the Company had 928,412 RSAs outstanding which will be earned based on the achievement of an earnings before net interest, taxes, fixed asset depreciation and intangible asset amortization (“EBITDA”) measure for fiscal 2025. The RSAs will vest ranging from 0% (for performance below threshold) to 100% (target performance) based on the achievement of the EBITDA performance measure and continued employment. In addition, if the target performance is exceeded, an additional 464,206 PUs can be earned that will be settled in cash. At the discretion of the Compensation Committee, the PUs may be settled in shares of common stock
The fair value of the RSAs was based on the closing stock price on the date of grant and earn dividend equivalents during the vesting period, which are forfeitable if the RSAs do not vest. Compensation expense for RSAs are recognized when it is probable the minimum threshold performance criteria will be achieved. Compensation expense for the PUs are recognized when it is probable that the target performance criteria will be exceeded. The Company assesses the probability of vesting at each balance sheet date and adjusts compensation costs based on the probability assessment. The cash-settled PUs represent a non-equity unit with a conversion value equal to the fair market value of a share of the Company’s common stock on the vesting date. The PUs are classified as liability awards due to the cash settlement feature and are re-measured at each balance sheet date. In accordance with ASC 718, based on projections of the Company’s current business portfolio, compensation expense has not been recognized for the RSAs or PUs in fiscal 2022, as the performance conditions are not probable of being met. Unrecognized stock-based compensation expense for RSAs at target level of performance is $26.5 million as of April 30, 2022.
In fiscal 2020, previously granted performance-based RSAs vested at 69% of target, which was determined in the fourth quarter of fiscal 2020. The target hurdle was not achieved because of among other factors, the impact of the COVID-19 pandemic. The result was a reversal of previously recognized stock-based compensation expense related to prior years of $5.2 million. Stock-based compensation expense for these awards in fiscal 2020 was a credit of $2.1 million.
The following table summarizes the RSA activity under the 2014 Incentive Plan:
|
|
Restricted Stock |
|
|
Weighted |
|
||
Non-vested at April 27, 2019 |
|
|
1,031,408 |
|
|
$ |
34.09 |
|
Awarded |
|
|
— |
|
|
$ |
— |
|
Vested |
|
|
(455,750 |
) |
|
$ |
33.89 |
|
Forfeited |
|
|
(575,658 |
) |
|
$ |
34.25 |
|
Non-vested at May 2, 2020 |
|
|
— |
|
|
$ |
— |
|
Awarded |
|
|
928,412 |
|
|
$ |
28.50 |
|
Vested |
|
|
— |
|
|
$ |
— |
|
Forfeited |
|
|
— |
|
|
$ |
— |
|
Non-vested at May 1, 2021 |
|
|
928,412 |
|
|
$ |
28.50 |
|
Awarded |
|
|
— |
|
|
$ |
— |
|
Vested |
|
|
— |
|
|
$ |
— |
|
Forfeited |
|
|
— |
|
|
$ |
— |
|
Non-vested at April 30, 2022 |
|
|
928,412 |
|
|
$ |
28.50 |
|
Restricted stock units
RSUs granted under the 2014 Plan vest over a pre-determined period of time, up to five years from the date of grant. The fair value of RSUs granted was based on the closing stock price on the date of grant. RSUs granted in fiscal 2021 and fiscal 2022 earn dividend equivalents during the vesting period, which are forfeitable if the RSUs do not vest.
F-28
METHODE ELECTRONICS, INC. AND SUBSIDIARIES
NOTES TO CONSOLIDATED FINANCIAL STATEMENTS
The following table summarizes RSU activity granted under the 2014 Plan:
|
|
Restricted Stock |
|
|
Weighted |
|
||
Non-vested at April 27, 2019 |
|
|
187,844 |
|
|
$ |
34.55 |
|
Awarded |
|
|
— |
|
|
$ |
— |
|
Vested |
|
|
(176,994 |
) |
|
$ |
34.25 |
|
Forfeited |
|
|
(7,750 |
) |
|
$ |
38.75 |
|
Non-vested at May 2, 2020 |
|
|
3,100 |
|
|
$ |
41.20 |
|
Awarded |
|
|
949,712 |
|
|
$ |
28.49 |
|
Vested |
|
|
(25,201 |
) |
|
$ |
29.87 |
|
Forfeited |
|
|
— |
|
|
$ |
— |
|
Non-vested at May 1, 2021 |
|
|
927,611 |
|
|
$ |
28.50 |
|
Awarded |
|
|
46,300 |
|
|
$ |
48.41 |
|
Vested |
|
|
(37,520 |
) |
|
$ |
36.55 |
|
Forfeited |
|
|
— |
|
|
$ |
— |
|
Non-vested at April 30, 2022 |
|
|
936,391 |
|
|
$ |
29.16 |
|
As of April 30, 2022, there were 37,520 RSUs that were vested for which shares were issued in the first quarter of fiscal 2023. As of April 30, 2022, unrecognized share-based compensation expense for RSUs was $13.2 million which will be recognized over a weighted-average amortization period of 1.8 years.
Director awards
The Company grants stock awards to its non-employee directors as a component of their compensation. The stock awards vest immediately upon grant. Non-employee directors may elect to defer receipt of their shares under the Company’s non-qualified deferred compensation plan. In fiscal 2022, the Company granted 32,505 shares, of which 17,730 shares were deferred. All dividends on deferred shares are reinvested into additional deferred shares based on the closing price of the Company’s common stock on the dividend payment date. Deferred shares will be settled with shares of common stock upon each director’s retirement from the Company’s Board of Directors. As of April 30, 2022, there were 17,956 deferred shares outstanding. During fiscal 2021 and fiscal 2020, the Company issued 33,000 shares and 30,000 shares, respectively, of common stock to its independent directors, all of which vested immediately upon grant.
Stock options
The following table summarizes combined stock option activity under the 2010 Plan and 2007 Plan:
|
|
Shares |
|
|
Weighted average exercise price |
|
|
Weighted- |
|
|
Aggregate |
|
||||
Outstanding and exercisable at April 27, 2019 |
|
|
106,668 |
|
|
$ |
35.76 |
|
|
|
5.0 |
|
|
$ |
0.1 |
|
Exercised |
|
|
— |
|
|
$ |
— |
|
|
|
|
|
|
|
||
Forfeited |
|
|
— |
|
|
$ |
— |
|
|
|
|
|
|
|
||
Outstanding and exercisable at May 2, 2020 |
|
|
106,668 |
|
|
$ |
35.76 |
|
|
|
4.0 |
|
|
$ |
0.1 |
|
Exercised |
|
|
(24,500 |
) |
|
$ |
31.61 |
|
|
|
|
|
|
|
||
Forfeited |
|
|
(9,168 |
) |
|
$ |
37.01 |
|
|
|
|
|
|
|
||
Outstanding and exercisable at May 1, 2021 |
|
|
73,000 |
|
|
$ |
37.01 |
|
|
|
3.2 |
|
|
$ |
0.6 |
|
Exercised |
|
|
(13,000 |
) |
|
$ |
37.01 |
|
|
|
|
|
|
|
||
Forfeited |
|
|
— |
|
|
$ |
— |
|
|
|
|
|
|
|
||
Outstanding and exercisable at April 30, 2022 |
|
|
60,000 |
|
|
$ |
37.01 |
|
|
|
2.2 |
|
|
$ |
0.5 |
|
The aggregate intrinsic value represents the total pre-tax intrinsic value (the difference between the Company's closing stock price on the last trading day of the fiscal year and the exercise price, multiplied by the number of in-the-money options) that would have been received by the option holders had all option holders exercised their options on that date. The total intrinsic value of options exercised in fiscal 2022 was $0.2 million.
F-29
METHODE ELECTRONICS, INC. AND SUBSIDIARIES
NOTES TO CONSOLIDATED FINANCIAL STATEMENTS
Deferred RSUs
Under the 2014 Plan and 2010 Plan, RSUs that have vested for certain executives, including the Company’s CEO, will not be delivered in common stock until after the executive terminates employment from the Company or upon a change of control. As of April 30, 2022, shares to be delivered to these executives were 121,200 shares under the 2014 Plan and 180,000 shares under the 2010 Plan.
Under the 2004 Plan, 225,000 shares of common stock subject to performance based RSAs granted to the Company’s CEO in fiscal 2006 and 2007 were converted to RSUs. The shares of common stock underlying the RSUs will not be issued and delivered until the earlier of: (1) thirty days after the CEO’s date of termination of employment with the Company and all of its subsidiaries and affiliates; or (2) the last day of the Company’s fiscal year in which the payment of common stock in satisfaction of the RSUs becomes deductible to the Company under Section 162(m) of the Code. As of April 30, 2022, 29,945 shares have been delivered in connection with these RSUs with a remaining balance to be delivered of 195,055 shares.
The RSUs are not entitled to voting rights or dividends, however a bonus in lieu of dividends are paid. The vested deferred RSUs are considered outstanding for earnings per share calculations.
Note 14. Income Per Share
Basic income per share is calculated by dividing net income by the number of weighted average common shares outstanding for the applicable period. The weighted average number of common shares used in the diluted income per share calculation is determined using the treasury stock method which includes the effect of all potential dilutive common shares outstanding during the period.
The following table sets forth the computation of basic and diluted income per share:
|
|
Fiscal Year Ended |
|
|||||||||
|
|
April 30, 2022 |
|
|
May 1, 2021 |
|
|
May 2, 2020 |
|
|||
|
|
(52 Weeks) |
|
|
(52 Weeks) |
|
|
(53 Weeks) |
|
|||
Numerator: |
|
|
|
|
|
|
|
|
|
|||
Net income (in millions) |
|
$ |
102.2 |
|
|
$ |
122.3 |
|
|
$ |
123.4 |
|
|
|
|
|
|
|
|
|
|
|
|||
Denominator: |
|
|
|
|
|
|
|
|
|
|||
Denominator for basic income per share - weighted average shares outstanding and vested/unissued RSUs |
|
|
37,234,086 |
|
|
|
38,038,615 |
|
|
|
37,574,671 |
|
Dilutive potential common shares - stock options, RSAs and RSUs |
|
|
583,360 |
|
|
|
267,671 |
|
|
|
269,799 |
|
Denominator for diluted income per share |
|
|
37,817,446 |
|
|
|
38,306,286 |
|
|
|
37,844,470 |
|
|
|
|
|
|
|
|
|
|
|
|||
Basic and diluted income per share: |
|
|
|
|
|
|
|
|
|
|||
Basic income per share |
|
$ |
2.74 |
|
|
$ |
3.22 |
|
|
$ |
3.28 |
|
Diluted income per share |
|
$ |
2.70 |
|
|
$ |
3.19 |
|
|
$ |
3.26 |
|
|
|
|
|
|
|
|
|
|
|
|||
Number of anti-dilutive potentially issuable shares excluded from diluted common shares outstanding |
|
|
928,412 |
|
|
|
738,167 |
|
|
|
566,620 |
|
Note 15. Segment Information and Geographic Area Information
An operating segment is defined as a component of an enterprise that engages in business activities from which it may earn revenues and incur expenses, and about which separate financial information is regularly evaluated by the Chief Operating Decision Maker (“CODM”) in deciding how to allocate resources. The CODM is the Company’s President and Chief Executive Officer (“CEO”).
The Automotive segment supplies electronic and electro-mechanical devices and related products to automobile OEMs, either directly or through their tiered suppliers. Products include integrated center consoles, hidden switches, ergonomic switches, transmission lead-frames, LED-based lighting, and sensors which incorporate magneto-elastic sensing and other technologies that monitor the operation or status of a component or system.
The Industrial segment manufactures lighting solutions, industrial safety radio remote controls, braided flexible cables, current-carrying laminated busbars and devices, custom power-product assemblies (such as our PowerRail® solution), high-current low-voltage flexible power cabling systems and powder-coated busbars that are used in various markets and applications, including aerospace, computers, industrial, power conversion, military, telecommunications and transportation.
F-30
METHODE ELECTRONICS, INC. AND SUBSIDIARIES
NOTES TO CONSOLIDATED FINANCIAL STATEMENTS
The Interface segment provides a variety of copper-based transceivers and related accessories for the cloud computing hardware equipment and telecommunications broadband equipment markets, user interface solutions for the appliance, commercial food service, and point-of-sale equipment markets, and fluid-level sensors for the marine/recreational vehicle and sump pump markets.
The Medical segment is made up of the Company’s medical device business, Dabir Surfaces, with its surface support technology aimed at pressure injury prevention. Methode has developed the technology for use by patients who are immobilized or otherwise at risk for pressure injuries, including patients undergoing long-duration surgical procedures.
The accounting policies of the segments are the same as those described in the summary of significant accounting policies in Note 1, “Description of Business and Summary of Significant Accounting Policies.” The CODM allocates resources to and evaluates the performance of each operating segments based on operating income. Transfers between segments are recorded using internal transfer prices set by the Company.
The tables below present information about the Company’s reportable segments.
|
|
Fiscal Year Ended April 30, 2022 (52 Weeks) |
|
|||||||||||||||||||||
(in millions) |
|
Automotive |
|
|
Industrial |
|
|
Interface |
|
|
Medical |
|
|
Eliminations/ |
|
|
Consolidated |
|
||||||
Net sales |
|
$ |
786.3 |
|
|
$ |
325.7 |
|
|
$ |
59.8 |
|
|
$ |
4.2 |
|
|
$ |
(12.4 |
) |
|
$ |
1,163.6 |
|
Transfers between segments |
|
|
(4.8 |
) |
|
|
(7.6 |
) |
|
|
— |
|
|
|
— |
|
|
|
12.4 |
|
|
|
— |
|
Net sales to unaffiliated customers |
|
$ |
781.5 |
|
|
$ |
318.1 |
|
|
$ |
59.8 |
|
|
$ |
4.2 |
|
|
$ |
— |
|
|
$ |
1,163.6 |
|
|
|
|
|
|
|
|
|
|
|
|
|
|
|
|
|
|
|
|
||||||
Income (loss) from operations |
|
$ |
92.6 |
|
|
$ |
67.1 |
|
|
$ |
9.9 |
|
|
$ |
(5.5 |
) |
|
$ |
(52.4 |
) |
|
$ |
111.7 |
|
Interest expense, net |
|
|
|
|
|
|
|
|
|
|
|
|
|
|
|
|
|
3.5 |
|
|||||
Other income, net |
|
|
|
|
|
|
|
|
|
|
|
|
|
|
|
|
|
(10.3 |
) |
|||||
Income before income taxes |
|
|
|
|
|
|
|
|
|
|
|
|
|
|
|
|
$ |
118.5 |
|
|||||
|
|
|
|
|
|
|
|
|
|
|
|
|
|
|
|
|
|
|
||||||
Purchases of property, plant and equipment |
|
$ |
27.4 |
|
|
$ |
2.4 |
|
|
$ |
— |
|
|
$ |
0.2 |
|
|
$ |
8.0 |
|
|
$ |
38.0 |
|
|
|
|
|
|
|
|
|
|
|
|
|
|
|
|
|
|
|
|
||||||
Depreciation and amortization |
|
$ |
34.4 |
|
|
$ |
14.9 |
|
|
$ |
0.2 |
|
|
$ |
1.0 |
|
|
$ |
2.1 |
|
|
$ |
52.6 |
|
|
|
|
|
|
|
|
|
|
|
|
|
|
|
|
|
|
|
|
||||||
Identifiable assets |
|
$ |
689.8 |
|
|
$ |
455.3 |
|
|
$ |
108.1 |
|
|
$ |
7.9 |
|
|
$ |
128.0 |
|
|
$ |
1,389.1 |
|
|
|
Fiscal Year Ended May 1, 2021 (52 Weeks) |
|
|||||||||||||||||||||
(in millions) |
|
Automotive |
|
|
Industrial |
|
|
Interface |
|
|
Medical |
|
|
Eliminations/ |
|
|
Consolidated |
|
||||||
Net sales |
|
$ |
761.8 |
|
|
$ |
273.2 |
|
|
$ |
61.6 |
|
|
$ |
2.8 |
|
|
$ |
(11.4 |
) |
|
$ |
1,088.0 |
|
Transfers between segments |
|
|
(6.1 |
) |
|
|
(5.3 |
) |
|
|
— |
|
|
|
— |
|
|
|
11.4 |
|
|
|
— |
|
Net sales to unaffiliated customers |
|
$ |
755.7 |
|
|
$ |
267.9 |
|
|
$ |
61.6 |
|
|
$ |
2.8 |
|
|
$ |
— |
|
|
$ |
1,088.0 |
|
|
|
|
|
|
|
|
|
|
|
|
|
|
|
|
|
|
|
|
||||||
Income (loss) from operations |
|
$ |
107.6 |
|
|
$ |
64.3 |
|
|
$ |
8.9 |
|
|
$ |
(4.6 |
) |
|
$ |
(48.3 |
) |
|
$ |
127.9 |
|
Interest expense, net |
|
|
|
|
|
|
|
|
|
|
|
|
|
|
|
|
|
5.2 |
|
|||||
Other income, net |
|
|
|
|
|
|
|
|
|
|
|
|
|
|
|
|
|
(12.2 |
) |
|||||
Income before income taxes |
|
|
|
|
|
|
|
|
|
|
|
|
|
|
|
|
$ |
134.9 |
|
|||||
|
|
|
|
|
|
|
|
|
|
|
|
|
|
|
|
|
|
|
||||||
Purchases of property, plant and equipment |
|
$ |
22.5 |
|
|
$ |
2.1 |
|
|
$ |
— |
|
|
$ |
— |
|
|
$ |
0.3 |
|
|
$ |
24.9 |
|
|
|
|
|
|
|
|
|
|
|
|
|
|
|
|
|
|
|
|
||||||
Depreciation and amortization |
|
$ |
34.3 |
|
|
$ |
14.3 |
|
|
$ |
0.3 |
|
|
$ |
0.9 |
|
|
$ |
1.7 |
|
|
$ |
51.5 |
|
|
|
|
|
|
|
|
|
|
|
|
|
|
|
|
|
|
|
|
||||||
Identifiable assets |
|
$ |
739.5 |
|
|
$ |
461.6 |
|
|
$ |
90.4 |
|
|
$ |
7.6 |
|
|
$ |
167.9 |
|
|
$ |
1,467.0 |
|
F-31
METHODE ELECTRONICS, INC. AND SUBSIDIARIES
NOTES TO CONSOLIDATED FINANCIAL STATEMENTS
|
|
Fiscal Year Ended May 2, 2020 (53 Weeks) |
|
|||||||||||||||||||||
(in millions) |
|
Automotive |
|
|
Industrial |
|
|
Interface |
|
|
Medical |
|
|
Eliminations/ |
|
|
Consolidated |
|
||||||
Net sales |
|
$ |
716.8 |
|
|
$ |
253.9 |
|
|
$ |
58.9 |
|
|
$ |
1.6 |
|
|
$ |
(7.3 |
) |
|
$ |
1,023.9 |
|
Transfers between segments |
|
|
(4.7 |
) |
|
|
(2.5 |
) |
|
|
(0.1 |
) |
|
|
— |
|
|
|
7.3 |
|
|
|
— |
|
Net sales to unaffiliated customers |
|
$ |
712.1 |
|
|
$ |
251.4 |
|
|
$ |
58.8 |
|
|
$ |
1.6 |
|
|
$ |
— |
|
|
$ |
1,023.9 |
|
|
|
|
|
|
|
|
|
|
|
|
|
|
|
|
|
|
|
|
||||||
Income (loss) from operations |
|
$ |
124.4 |
|
|
$ |
59.4 |
|
|
$ |
5.6 |
|
|
$ |
(6.0 |
) |
|
$ |
(36.3 |
) |
|
$ |
147.1 |
|
Interest expense, net |
|
|
|
|
|
|
|
|
|
|
|
|
|
|
|
|
|
10.1 |
|
|||||
Other income, net |
|
|
|
|
|
|
|
|
|
|
|
|
|
|
|
|
|
(11.7 |
) |
|||||
Income before income taxes |
|
|
|
|
|
|
|
|
|
|
|
|
|
|
|
|
$ |
148.7 |
|
|||||
|
|
|
|
|
|
|
|
|
|
|
|
|
|
|
|
|
|
|
||||||
Purchases of property, plant and equipment |
|
$ |
37.5 |
|
|
$ |
5.7 |
|
|
$ |
0.3 |
|
|
$ |
0.7 |
|
|
$ |
0.9 |
|
|
$ |
45.1 |
|
|
|
|
|
|
|
|
|
|
|
|
|
|
|
|
|
|
|
|
||||||
Depreciation and amortization |
|
$ |
31.0 |
|
|
$ |
13.7 |
|
|
$ |
0.9 |
|
|
$ |
1.1 |
|
|
$ |
1.6 |
|
|
$ |
48.3 |
|
|
|
|
|
|
|
|
|
|
|
|
|
|
|
|
|
|
|
|
||||||
Identifiable assets |
|
$ |
670.9 |
|
|
$ |
421.8 |
|
|
$ |
71.0 |
|
|
$ |
8.8 |
|
|
$ |
198.1 |
|
|
$ |
1,370.6 |
|
The following tables set forth net sales and tangible long-lived assets by geographic area where the Company operates. Tangible long-lived assets include property, plant and equipment and operating lease assets.
|
|
Fiscal Year Ended |
|
|||||||||
|
|
April 30, 2022 |
|
|
May 1, 2021 |
|
|
May 2, 2020 |
|
|||
(in millions) |
|
(52 Weeks) |
|
|
(52 Weeks) |
|
|
(53 Weeks) |
|
|||
Net sales: |
|
|
|
|
|
|
|
|
|
|||
U.S. |
|
$ |
547.4 |
|
|
$ |
510.8 |
|
|
$ |
531.5 |
|
China |
|
|
224.3 |
|
|
|
193.7 |
|
|
|
116.9 |
|
Malta |
|
|
178.4 |
|
|
|
173.5 |
|
|
|
143.9 |
|
Mexico |
|
|
76.2 |
|
|
|
87.4 |
|
|
|
104.7 |
|
Egypt |
|
|
67.2 |
|
|
|
58.4 |
|
|
|
60.0 |
|
Other |
|
|
70.1 |
|
|
|
64.2 |
|
|
|
66.9 |
|
Total net sales |
|
$ |
1,163.6 |
|
|
$ |
1,088.0 |
|
|
$ |
1,023.9 |
|
|
|
|
|
|
|
|
|
|
|
|||
(in millions) |
|
April 30, 2022 |
|
|
May 1, 2021 |
|
|
|
|
|||
Tangible long-lived assets, net: |
|
|
|
|
|
|
|
|
|
|||
U.S. |
|
$ |
74.2 |
|
|
$ |
75.0 |
|
|
|
|
|
Malta |
|
|
38.6 |
|
|
|
43.0 |
|
|
|
|
|
China |
|
|
30.1 |
|
|
|
27.2 |
|
|
|
|
|
Egypt |
|
|
22.8 |
|
|
|
20.1 |
|
|
|
|
|
Mexico |
|
|
21.0 |
|
|
|
24.6 |
|
|
|
|
|
Belgium |
|
|
20.2 |
|
|
|
24.8 |
|
|
|
|
|
Other |
|
|
10.1 |
|
|
|
11.6 |
|
|
|
|
|
Total tangible long-lived assets, net |
|
$ |
217.0 |
|
|
$ |
226.3 |
|
|
|
|
|
F-32
METHODE ELECTRONICS, INC. AND SUBSIDIARIES
NOTES TO CONSOLIDATED FINANCIAL STATEMENTS
Note 16. Summary of Quarterly Results of Operations (Unaudited)
The following is a summary of unaudited quarterly results of operations for fiscal 2022 and fiscal 2021:
|
|
Fiscal 2022 |
|
|||||||||||||
|
|
Quarter Ended |
|
|||||||||||||
(in millions, except per share data) |
|
July 31, 2021 |
|
|
October 30, 2021 |
|
|
January 29, 2022 |
|
|
April 30, 2022 |
|
||||
Net sales |
|
$ |
287.8 |
|
|
$ |
295.5 |
|
|
$ |
291.6 |
|
|
$ |
288.7 |
|
Gross profit |
|
$ |
71.7 |
|
|
$ |
69.2 |
|
|
$ |
69.1 |
|
|
$ |
54.9 |
|
Net income |
|
$ |
29.1 |
|
|
$ |
27.5 |
|
|
$ |
29.4 |
|
|
$ |
16.2 |
|
Net income per basic common share |
|
$ |
0.77 |
|
|
$ |
0.73 |
|
|
$ |
0.80 |
|
|
$ |
0.44 |
|
Net income per diluted common share |
|
$ |
0.76 |
|
|
$ |
0.72 |
|
|
$ |
0.78 |
|
|
$ |
0.43 |
|
|
|
Fiscal 2021 |
|
|||||||||||||
|
|
Quarter Ended |
|
|||||||||||||
(in millions, except per share data) |
|
August 1, 2020 |
|
|
October 31, 2020 |
|
|
January 30, 2021 |
|
|
May 1, 2021 |
|
||||
Net sales |
|
$ |
190.9 |
|
|
$ |
300.8 |
|
|
$ |
295.3 |
|
|
$ |
301.0 |
|
Gross profit |
|
$ |
45.1 |
|
|
$ |
80.8 |
|
|
$ |
72.6 |
|
|
$ |
75.6 |
|
Net income |
|
$ |
20.7 |
|
|
$ |
38.6 |
|
|
$ |
31.9 |
|
|
$ |
31.1 |
|
Net income per basic common share |
|
$ |
0.55 |
|
|
$ |
1.01 |
|
|
$ |
0.84 |
|
|
$ |
0.82 |
|
Net income per diluted common share |
|
$ |
0.54 |
|
|
$ |
1.01 |
|
|
$ |
0.83 |
|
|
$ |
0.81 |
|
F-33
SCHEDULE II—VALUATION AND QUALIFYING ACCOUNTS
METHODE ELECTRONICS, INC. AND SUBSIDIARIES
(in millions)
Description |
|
Balance at |
|
|
(Benefits)/ |
|
|
Deductions |
|
|
|
Other |
|
|
|
Balance at |
|
|||||
Year Ended April 30, 2022 |
|
|
|
|
|
|
|
|
|
|
|
|
|
|
|
|
|
|||||
Allowance for uncollectible accounts |
|
$ |
0.7 |
|
|
$ |
0.3 |
|
|
$ |
— |
|
|
|
$ |
— |
|
|
|
$ |
1.0 |
|
Deferred tax valuation allowance |
|
$ |
9.3 |
|
|
$ |
(2.5 |
) |
|
$ |
— |
|
|
|
$ |
— |
|
|
|
$ |
6.8 |
|
|
|
|
|
|
|
|
|
|
|
|
|
|
|
|
|
|
|
|||||
Year Ended May 1, 2021 |
|
|
|
|
|
|
|
|
|
|
|
|
|
|
|
|
|
|||||
Allowance for uncollectible accounts |
|
$ |
0.7 |
|
|
$ |
— |
|
|
$ |
— |
|
|
|
$ |
— |
|
|
|
$ |
0.7 |
|
Deferred tax valuation allowance |
|
$ |
7.5 |
|
|
$ |
1.8 |
|
|
$ |
— |
|
|
|
$ |
— |
|
|
|
$ |
9.3 |
|
|
|
|
|
|
|
|
|
|
|
|
|
|
|
|
|
|
|
|||||
Year Ended May 2, 2020 |
|
|
|
|
|
|
|
|
|
|
|
|
|
|
|
|
|
|||||
Allowance for uncollectible accounts |
|
$ |
0.9 |
|
|
$ |
(0.2 |
) |
|
$ |
— |
|
|
|
$ |
— |
|
|
|
$ |
0.7 |
|
Deferred tax valuation allowance |
|
$ |
6.6 |
|
|
$ |
0.9 |
|
|
$ |
— |
|
|
|
$ |
— |
|
|
|
$ |
7.5 |
|
F-34