|
Nevada
|
81-0422894
|
|
|
(State or other jurisdiction of incorporation)
|
(IRS Employer
Identification No.)
|
|
Title of each class
|
Trading symbol(s)
|
Name of each exchange on which registered
|
|
Common Stock, $.001 par value
|
LNW
|
The NASDAQ Stock Market
|
|
Preferred Stock Purchase Rights
|
The NASDAQ Stock Market
|
|
Exhibit No.
|
Description
|
|
104
|
Cover Page Interactive Data File (embedded within the Inline XBRL document).
|
|
Date: May 17, 2022
|
LIGHT & WONDER, INC.
|
||
|
|
By:
|
/s/ Constance P. James
|
|
|
|
|
Name:
|
Constance P. James
|
|
|
|
Title:
|
Executive Vice President, Chief Financial
Officer, Treasurer and Corporate Secretary |


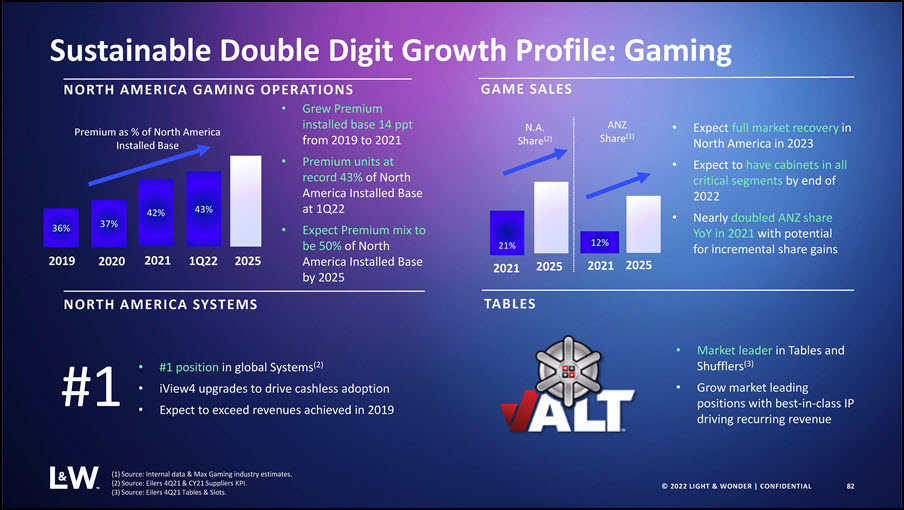
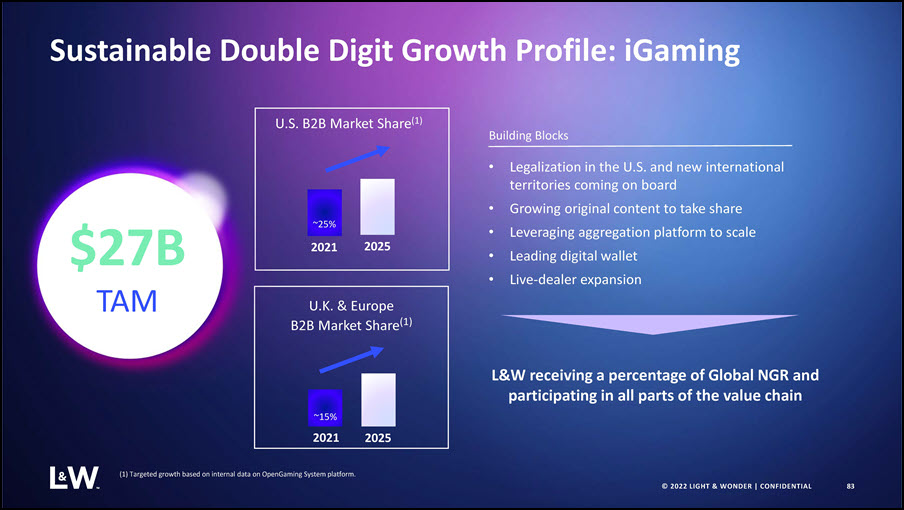
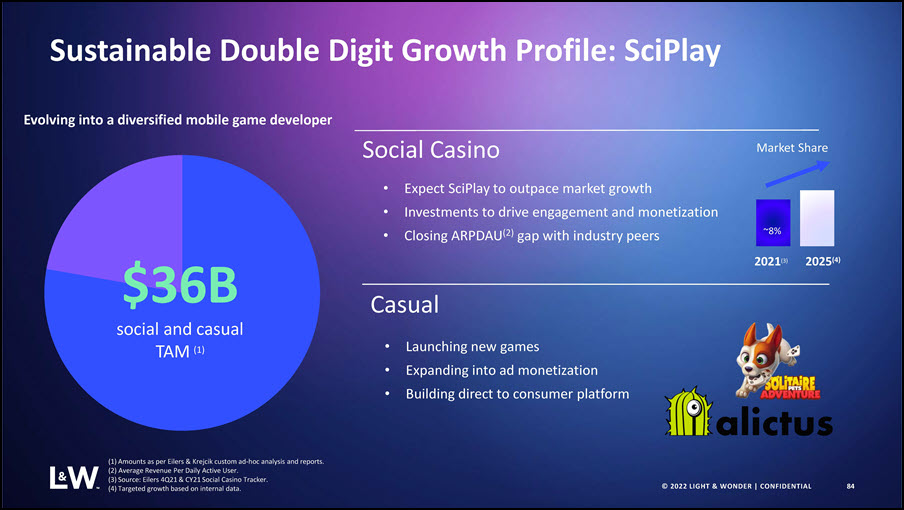
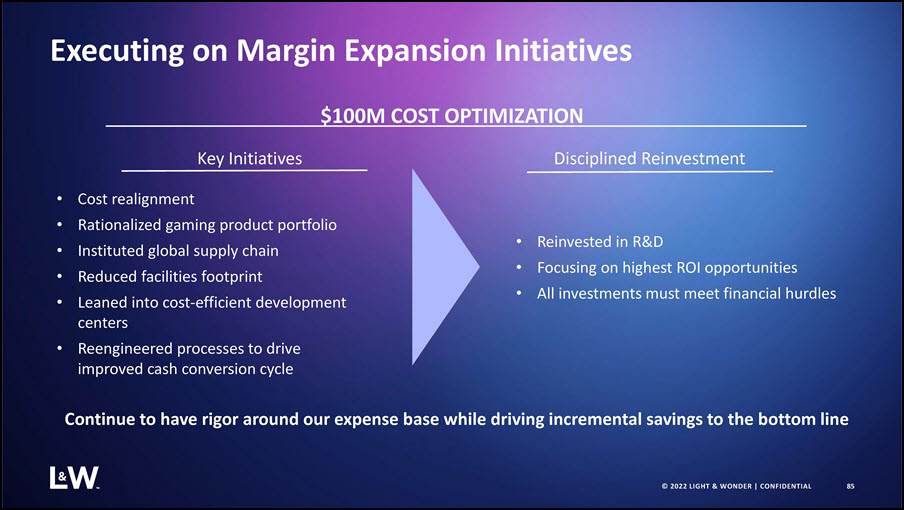


| LNW Investor Day Highlights Press Release |
|
|
● |
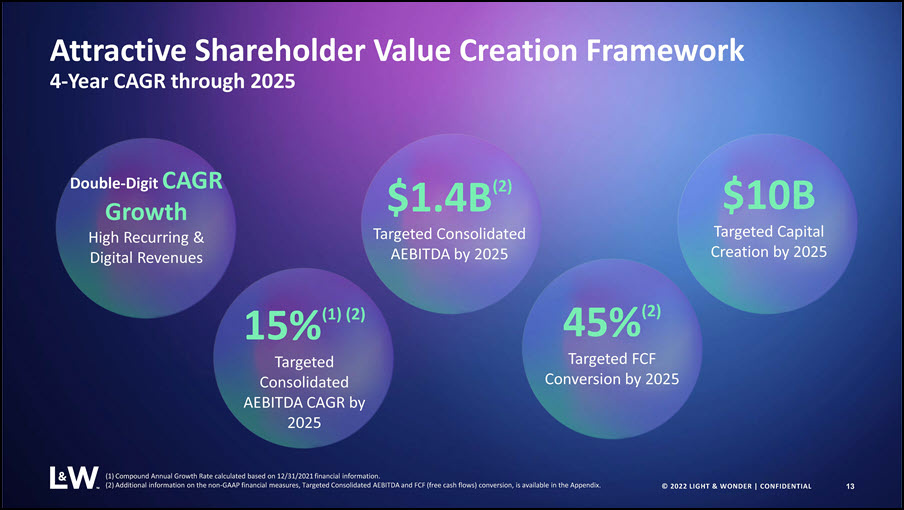
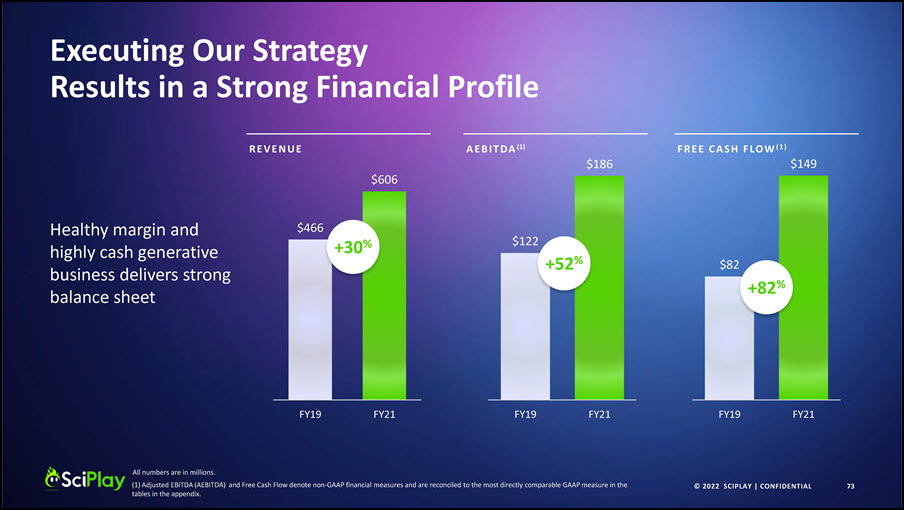
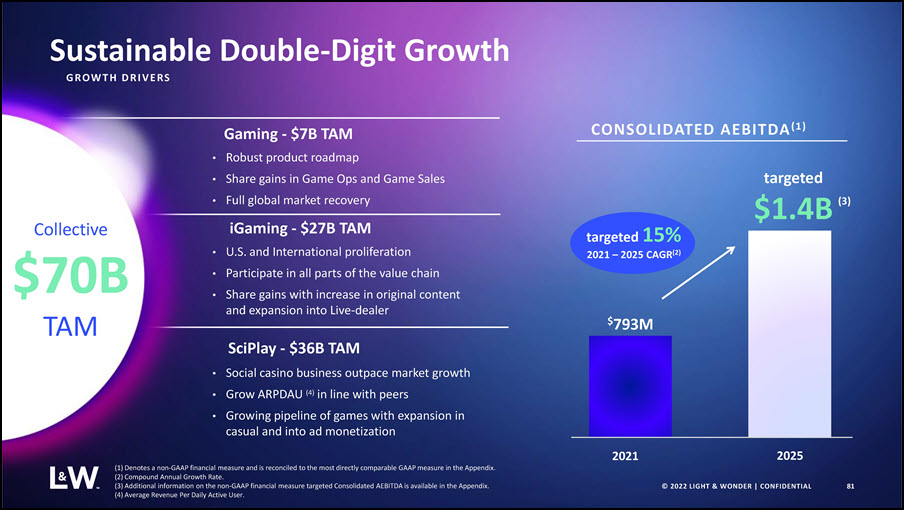
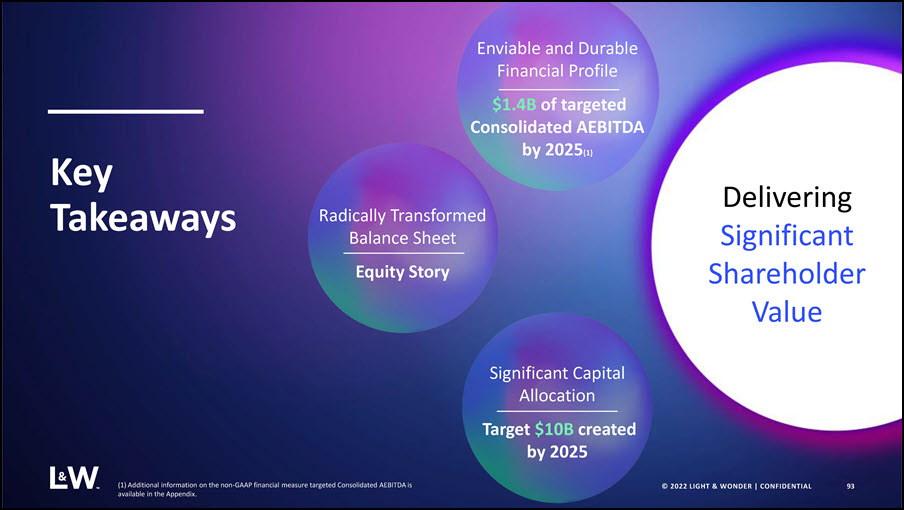
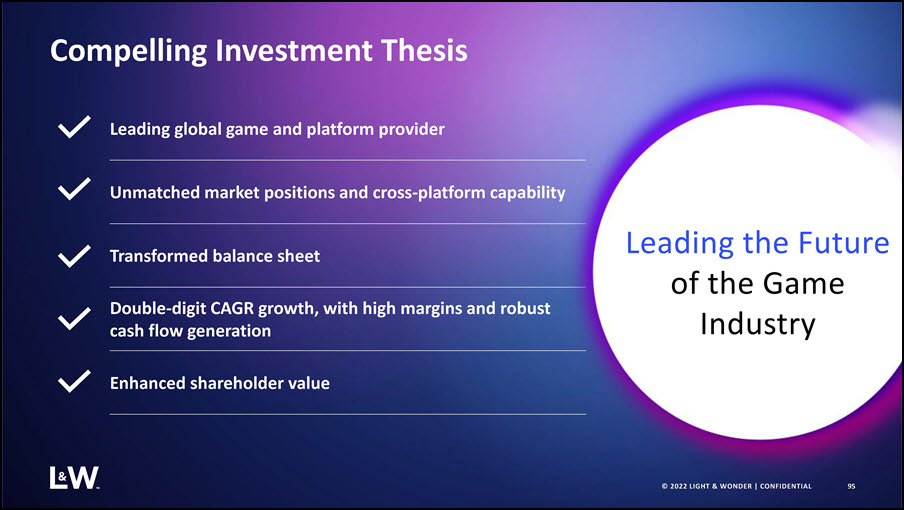
Double-digit growth with targeted 2025 Consolidated AEBITDA(1) of $1.4 billion or a CAGR(3) of 15%.
|
|
|
● |
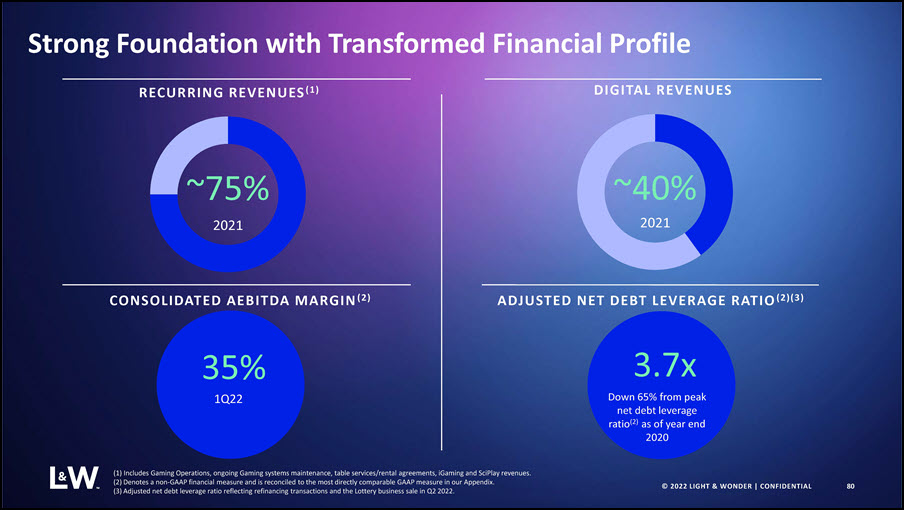
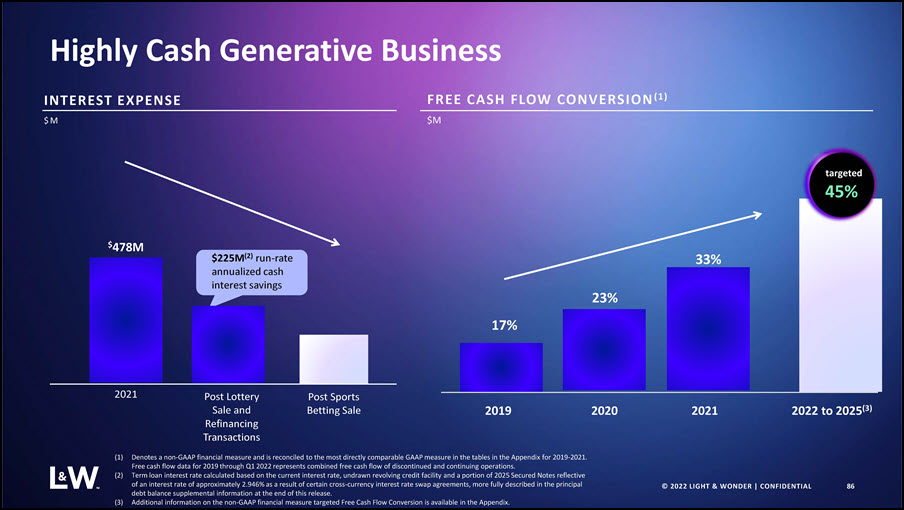
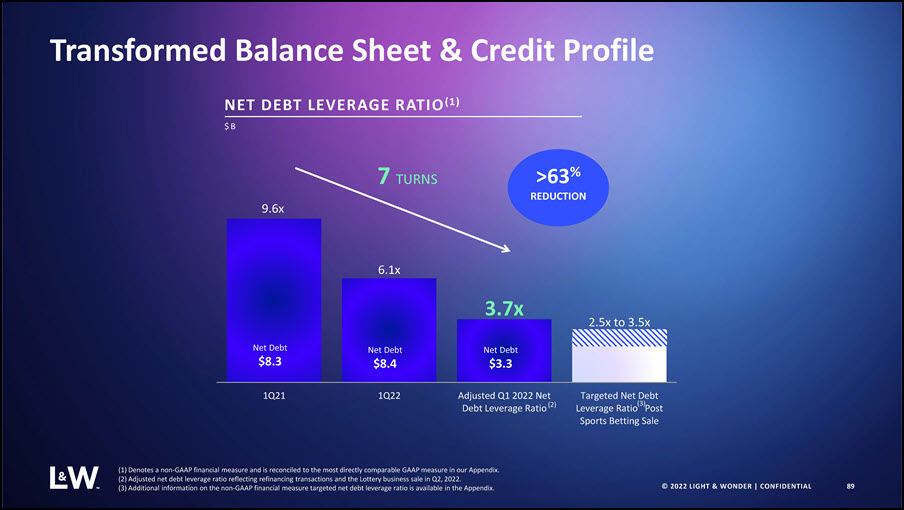
Reaffirmed its targeted net debt leverage ratio range(1) of 2.5x to 3.5x, further strengthening the Company’s balance sheet and credit profile.
|
|
|
● |
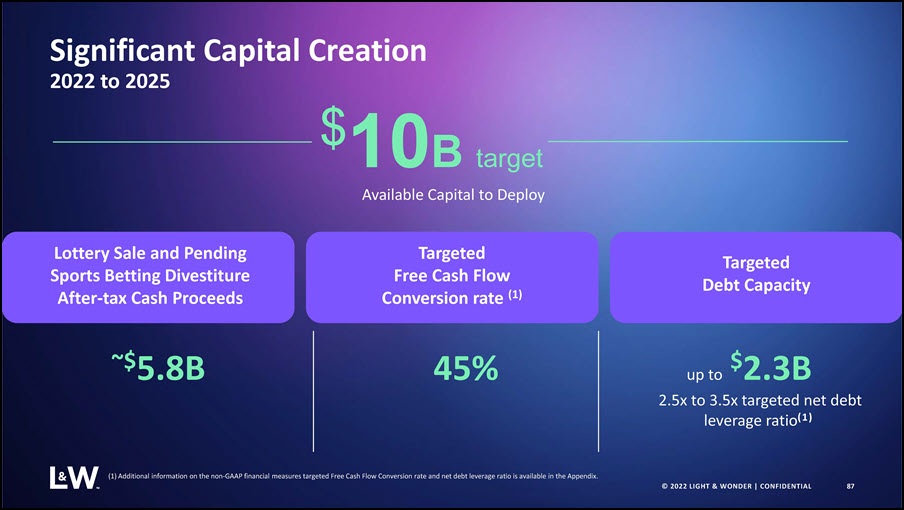
Significant cash flow generation, reflecting a targeted free cash flow conversion rate(1) of 45% by 2025.
|
|
|
● |
Targeting a total of $10 billion of available capital to deploy through the Company’s balanced and opportunistic capital allocation priorities.
|
|
|
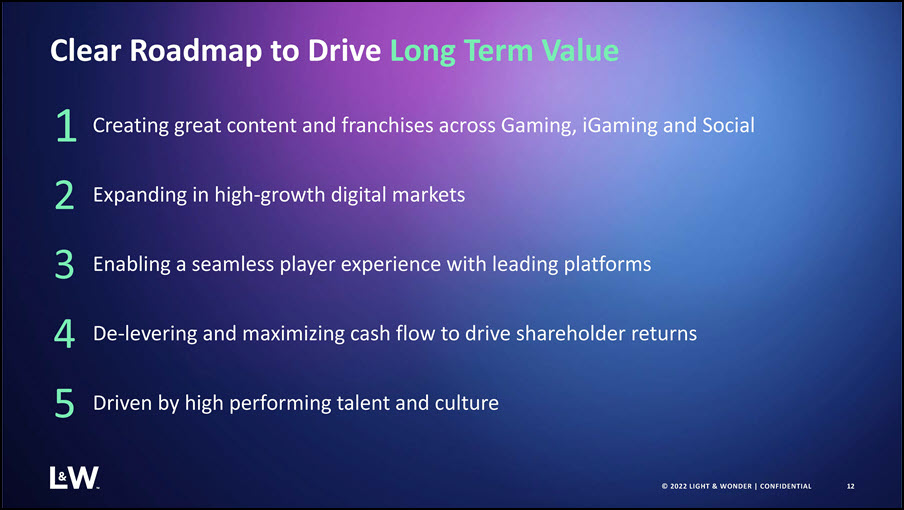
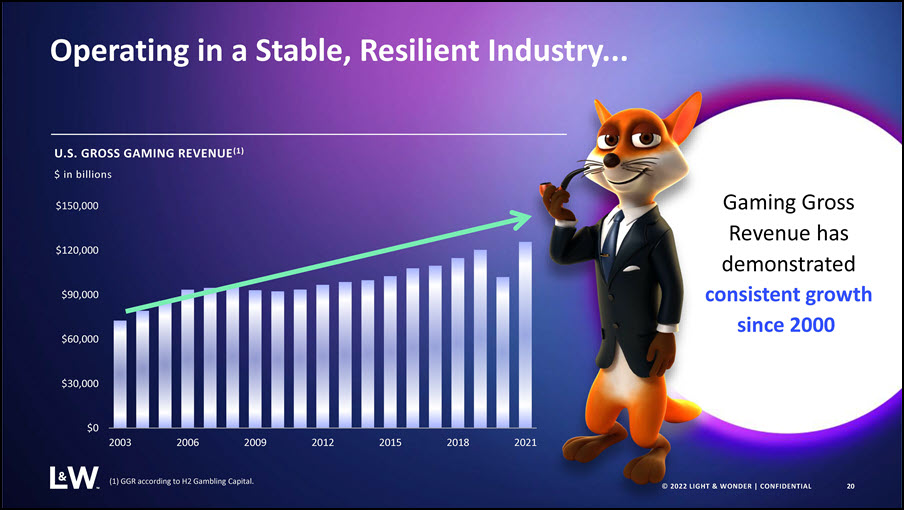
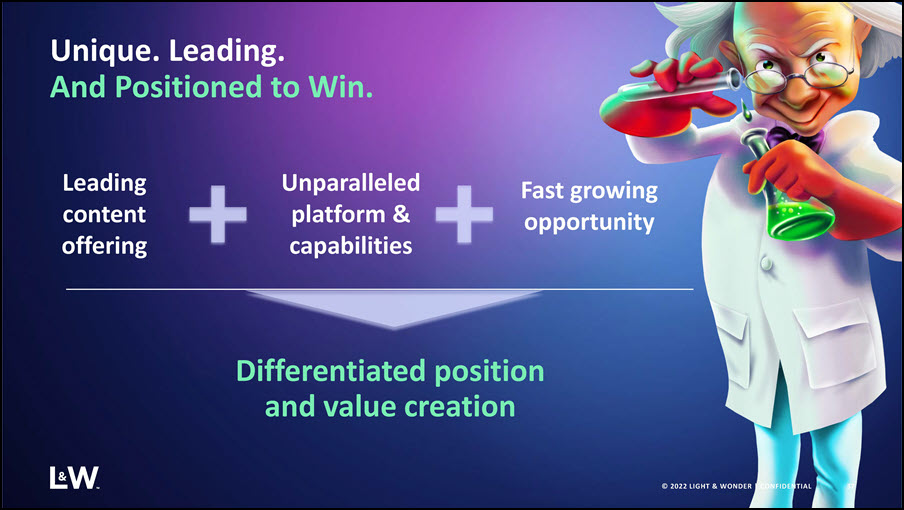
● |
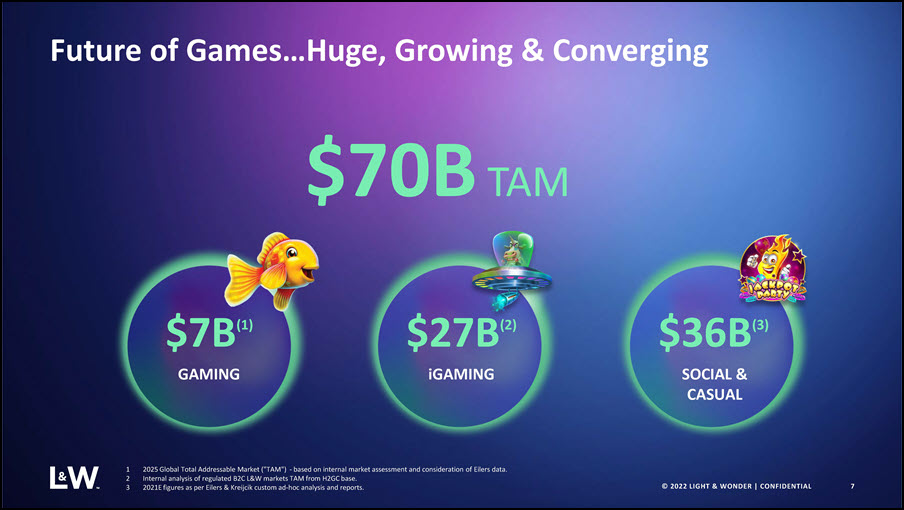
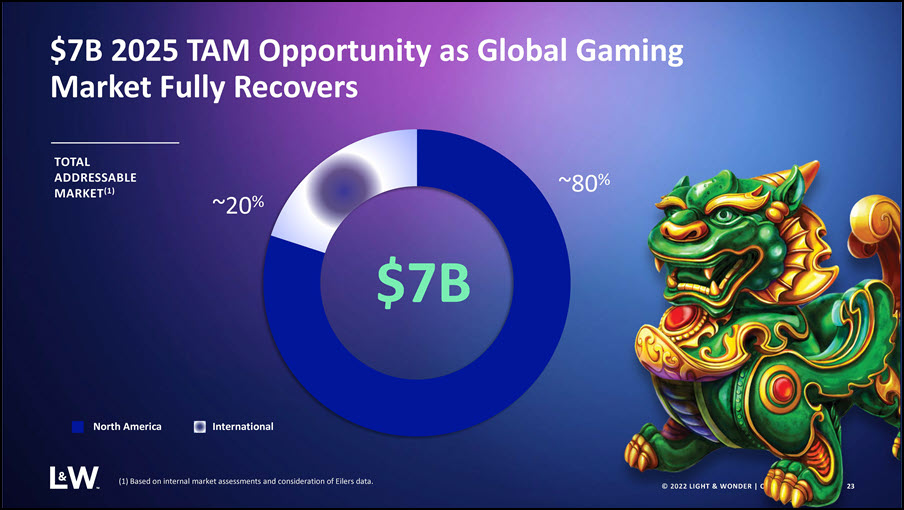
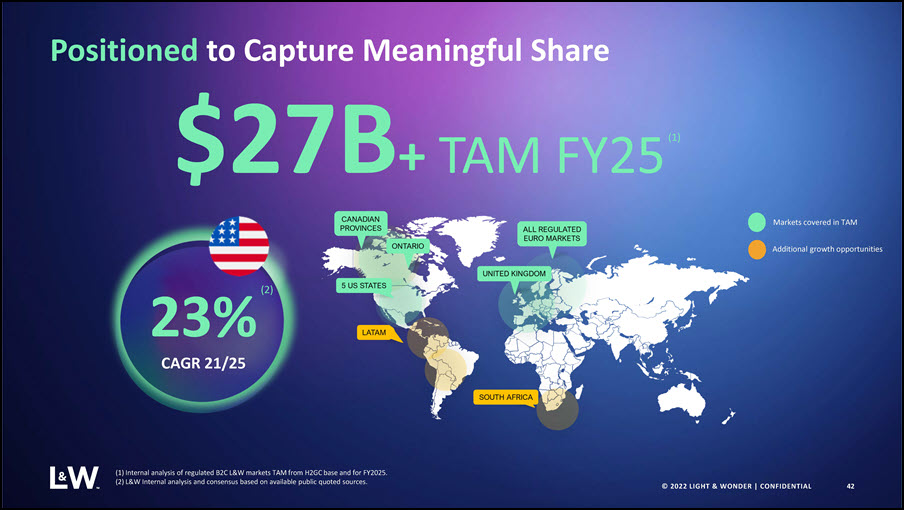
Uniquely positioned to take advantage of estimated $70 billion game market TAM opportunity with a clear roadmap and strategy to win in a converging gaming world
|
|
|
o |
Best talent in the industry creating hit games and franchises that players can enjoy anywhere provides a sustainable differentiation and a competitive advantage.
|
|
|
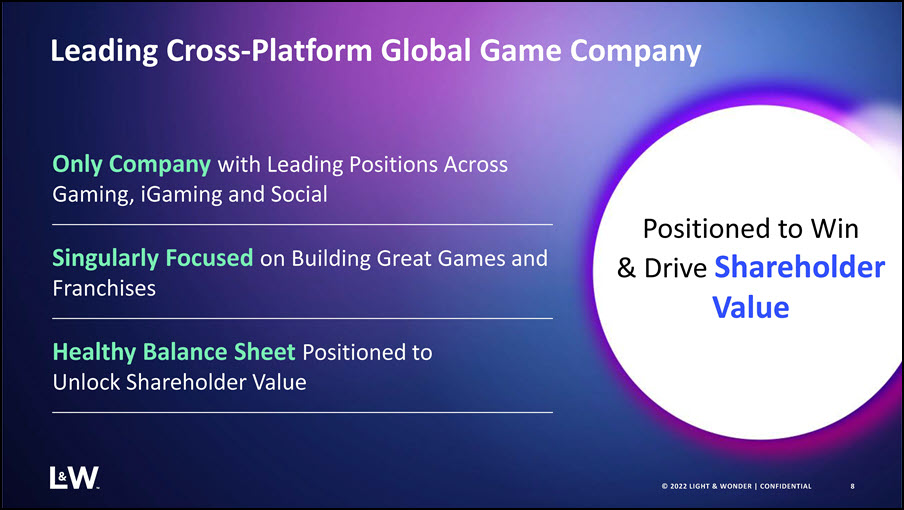
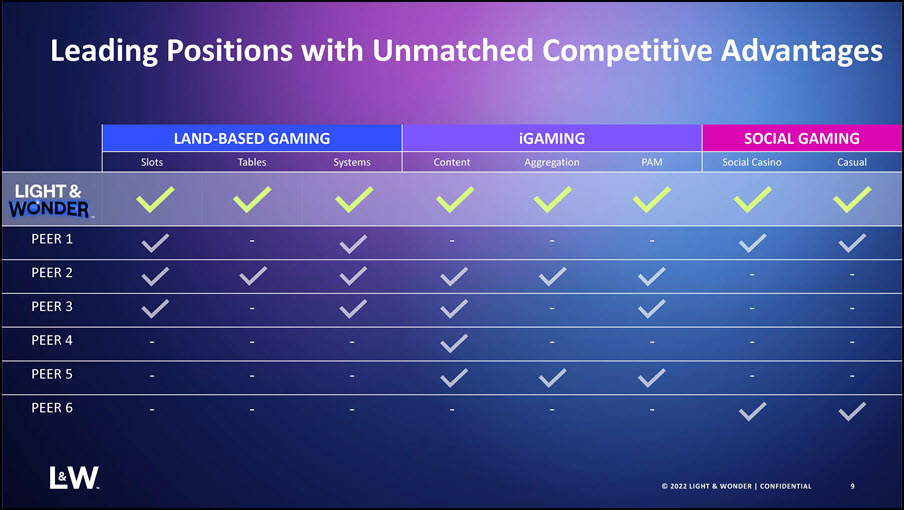
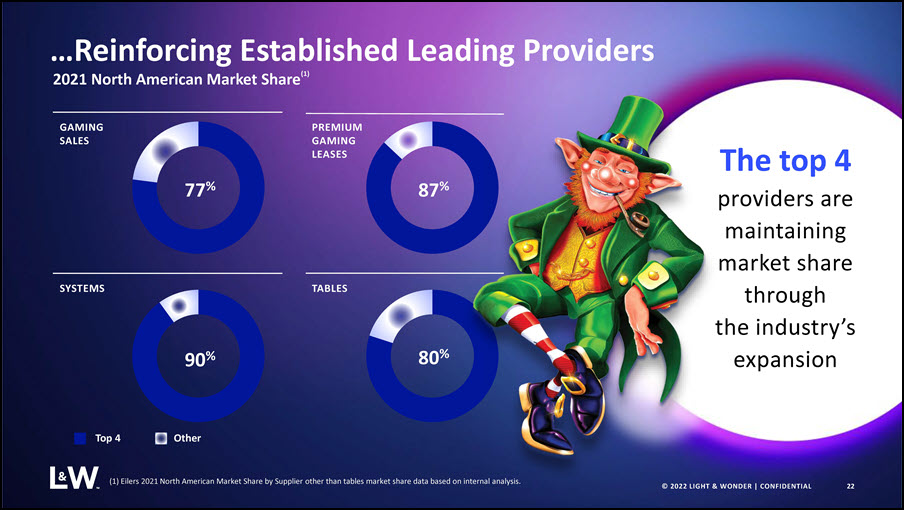
o |
Only company with leadership positions across land-based, iGaming and social, with content that can be delivered anywhere.
|
|
|
o |
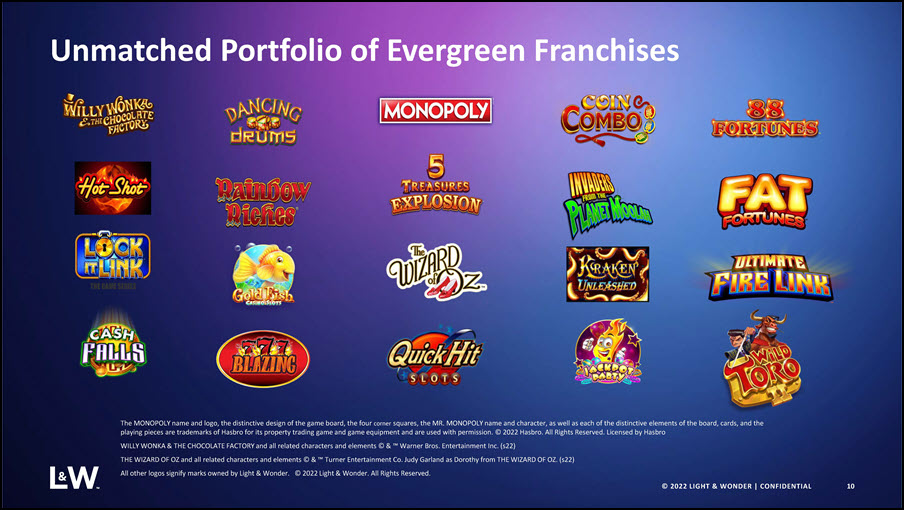
Greatest collection of IP and content, highlighting the breadth of Light & Wonder’s evergreen franchises.
|
|
|
o |
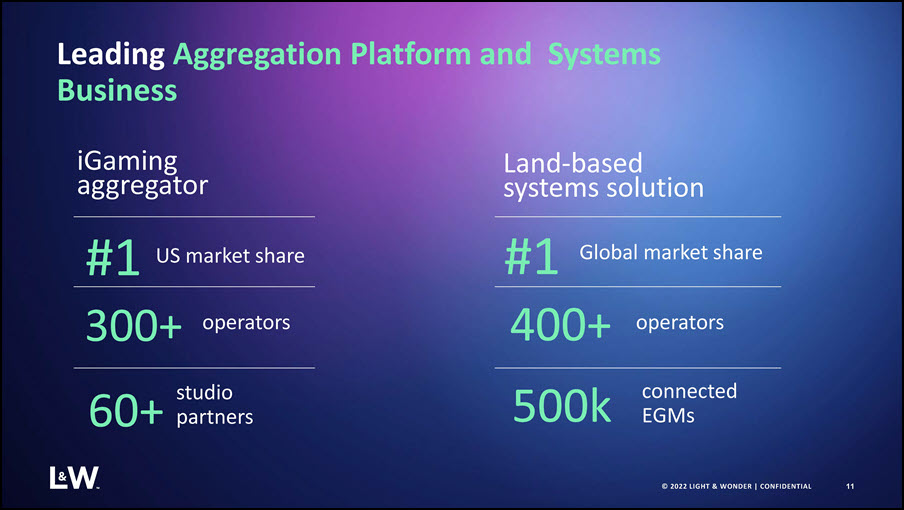
Unrivaled aggregation platform and industry leading insights on players.
|
|
|
o |
Deep relationship with operators, players and studios positions the Company to disproportionately benefit by connecting players across land-based and digital to create a seamless player
experience.
|
|
|
o |
Expanding into high-growth digital markets investing organically and inorganically.
|
|
|
● |
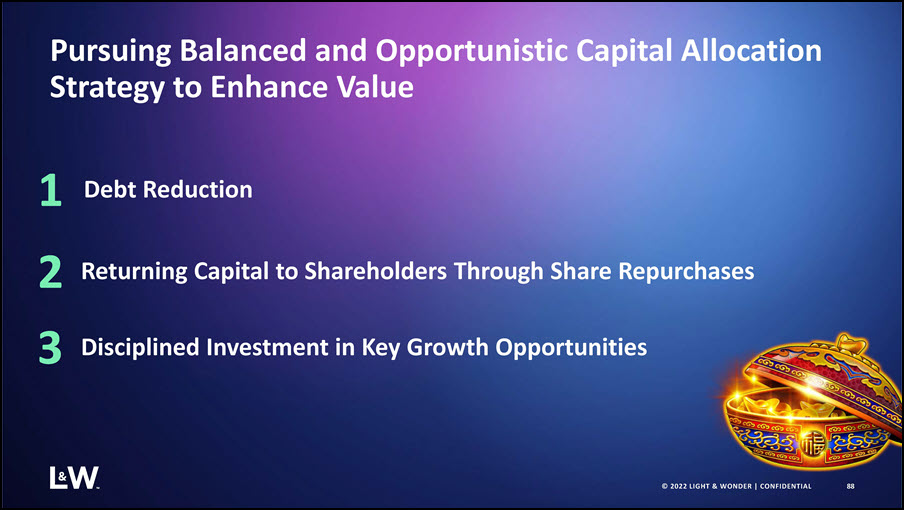
Executing a balanced and opportunistic capital allocation strategy to unlock value
|
|
|
o |
Paying down debt with the proceeds of the Lottery business sale and pending Sports Betting business divestiture to further strengthen Light & Wonder’s financial profile and transform Light
& Wonder into an equity story.
|
|
|
o |
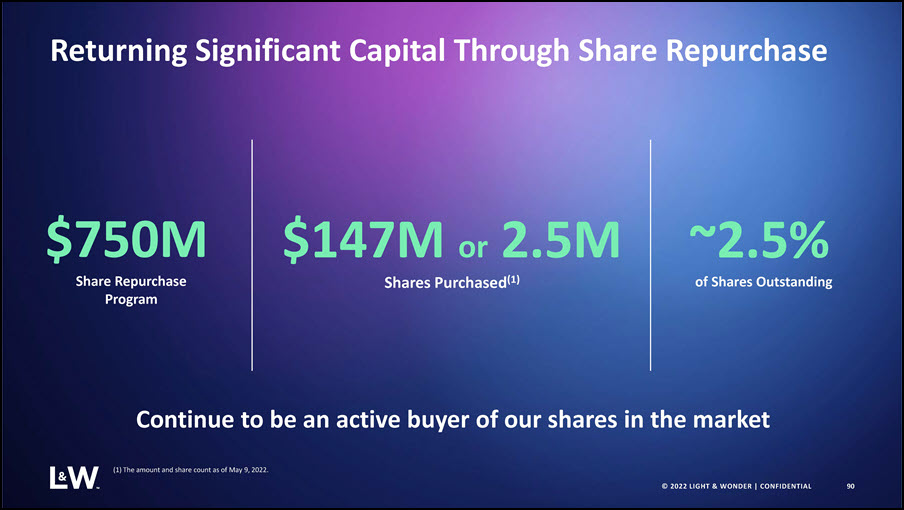
Returning substantial capital to shareholders by actively repurchasing shares under the Company’s $750 million share repurchase authorization.
|
|
|
o |
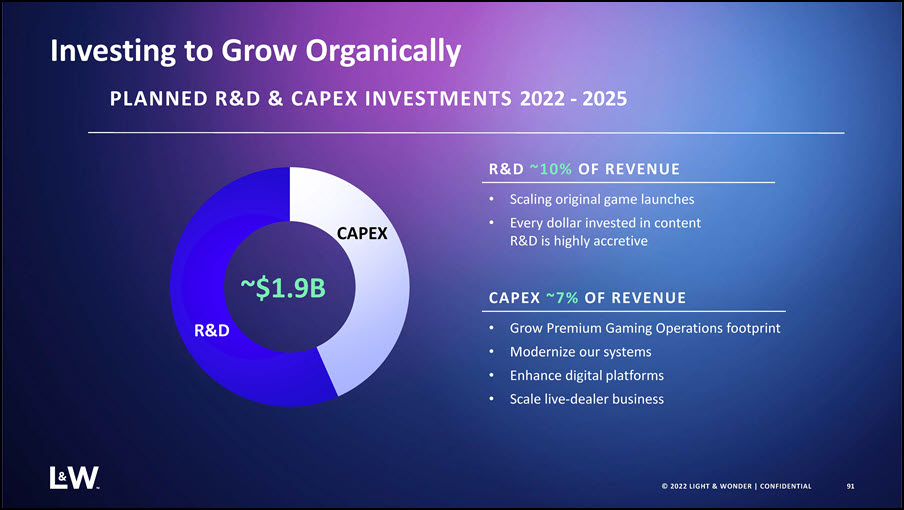
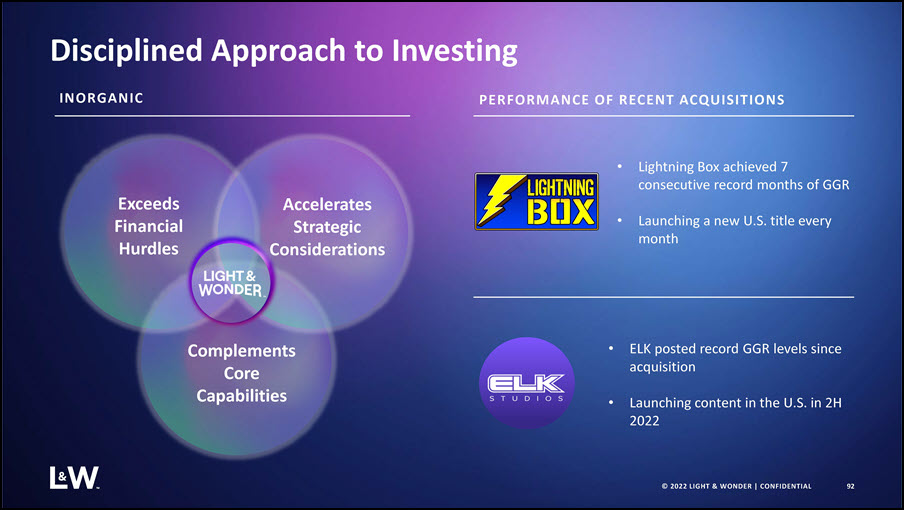
Investing in key growth opportunities, prioritizing organic investments and taking a disciplined approach to M&A that delivers significant long-term value.
|
|
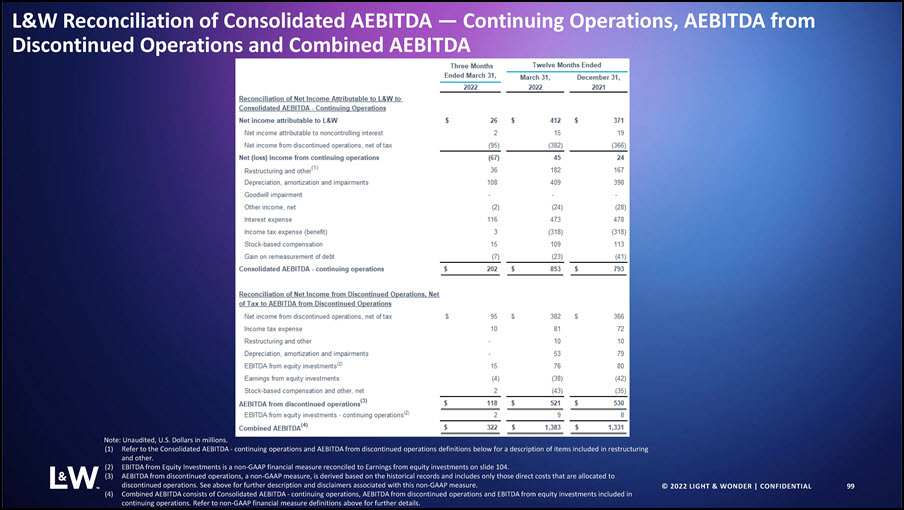
Twelve Months Ended
|
||||
|
March 31, 2022
|
||||
|
Net income attributable to L&W
|
$
|
412
|
||
|
Net income attributable to noncontrolling interest
|
15
|
|||
|
Net income from discontinued operations, net of tax
|
(382
|
)
|
||
|
Net income from continuing operations
|
45
|
|||
|
Restructuring and other
|
182
|
|||
|
Depreciation, amortization and impairments
|
409
|
|||
|
Other income, net
|
(24
|
)
|
||
|
Interest expense
|
473
|
|||
|
Income tax benefit
|
(318
|
)
|
||
|
Stock-based compensation
|
109
|
|||
|
Gain on remeasurement of debt and other
|
(23
|
)
|
||
|
Consolidated AEBITDA - continuing operations
|
$
|
853
|
||
|
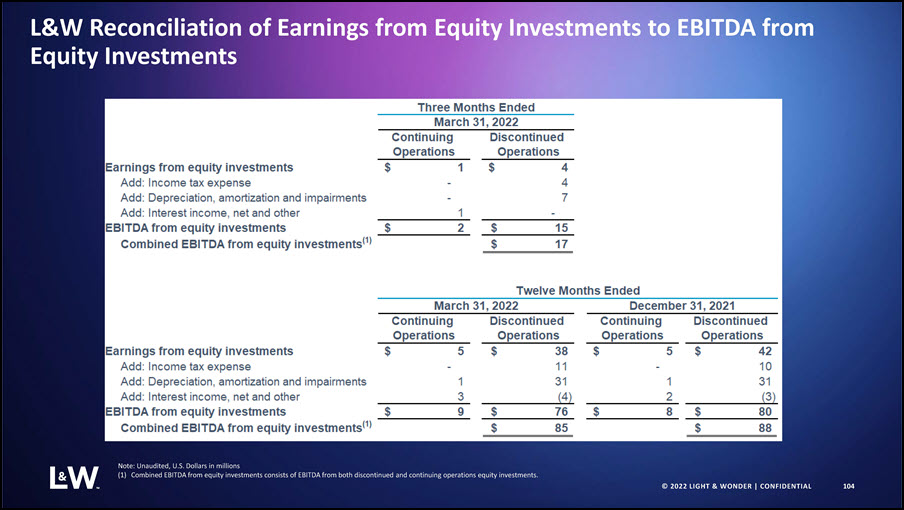
Twelve Months Ended
|
||||
|
March 31, 2022
|
||||
|
Net income from discontinued operations, net of tax
|
$
|
382
|
||
|
Income tax expense
|
81
|
|||
|
Restructuring and other
|
10
|
|||
|
Depreciation, amortization and impairments
|
53
|
|||
|
EBITDA from equity investments
|
76
|
|||
|
Earnings from equity investments
|
(38
|
)
|
||
|
Stock-based compensation and other, net
|
(43
|
)
|
||
|
AEBITDA from discontinued operations(1)
|
$
|
521
|
||
|
EBITDA from equity investments - continuing operations(2)
|
9
|
|||
|
Combined AEBITDA(2)
|
$
|
1,383
|
||
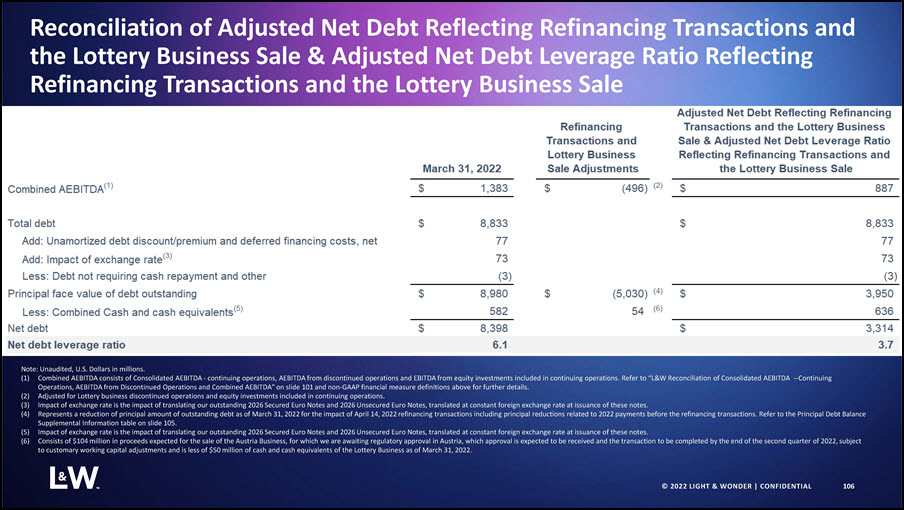
|
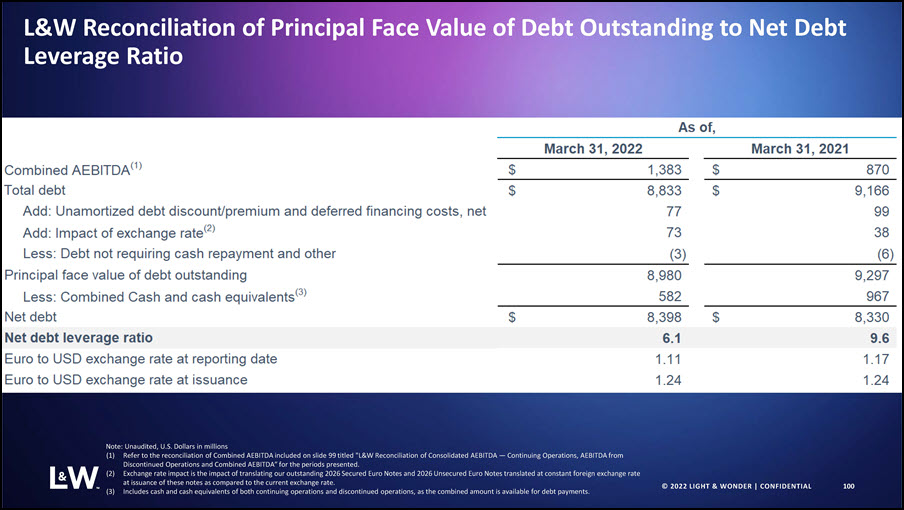
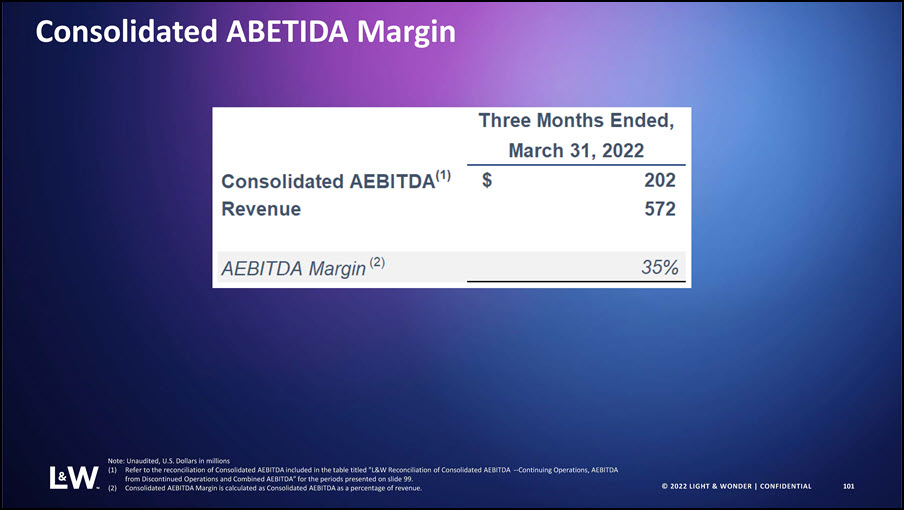
As of
|
||||
|
March 31, 2022
|
||||
|
Combined AEBITDA(2)
|
$
|
1,383
|
||
|
Total debt
|
$
|
8,833
|
||
|
Add: Unamortized debt discount/premium and deferred financing costs, net
|
77
|
|||
|
Add: Impact of exchange rate(3)
|
73
|
|||
|
Less: Debt not requiring cash repayment and other
|
(3
|
)
|
||
|
Principal face value of debt outstanding
|
8,980
|
|||
|
Less: Combined Cash and cash equivalents(4)
|
582
|
|||
|
Net debt
|
$
|
8,398
|
||
|
Net debt leverage ratio
|
6.1
|
|||
|
Twelve Months Ended
|
||||||||
|
March 31, 2022
|
||||||||
|
Continuing Operations
|
Discontinued Operations
|
|||||||
|
Earnings from equity investments
|
$
|
5
|
$
|
38
|
||||
|
Add: Income tax expense
|
–
|
11
|
||||||
|
Add: Depreciation, amortization and impairments
|
1
|
31
|
||||||
|
Add: Interest income, net and other
|
3
|
(4
|
)
|
|||||
|
EBITDA from equity investments
|
$
|
9
|
$
|
76
|
||||
|
Combined EBITDA from equity investments(1)
|
$
|
85
|
||||||
|
March 31, 2022
|
Refinancing Transactions and Lottery Business Sale Adjustments
|
Adjusted Net Debt Reflecting Refinancing Transactions and the Lottery Business Sale & Adjusted Net Debt Leverage Ratio
Reflecting Refinancing Transactions and the Lottery Business Sale
|
|||||||||||
|
Combined AEBITDA(1)
|
$
|
1,383
|
$
|
(496
|
)
|
(2) |
|
$
|
887
|
||||
|
Total debt
|
$
|
8,833
|
$
|
8,833
|
|||||||||
|
Add: Unamortized debt discount/premium and deferred financing costs, net
|
77
|
77
|
|||||||||||
|
Add: Impact of exchange rate(3)
|
73
|
73
|
|||||||||||
|
Less: Debt not requiring cash repayment and other
|
(3
|
)
|
(3
|
)
|
|||||||||
|
Principal face value of debt outstanding
|
$
|
8,980
|
$
|
(5,030
|
)
|
(4) |
|
$
|
3,950
|
||||
|
Less: Combined Cash and cash equivalents(5)
|
582
|
54
|
(6) |
|
636
|
||||||||
|
Net debt
|
$
|
8,398
|
$
|
3,314
|
|||||||||
|
Net debt leverage ratio
|
6.1
|
3.7
|
|||||||||||
|
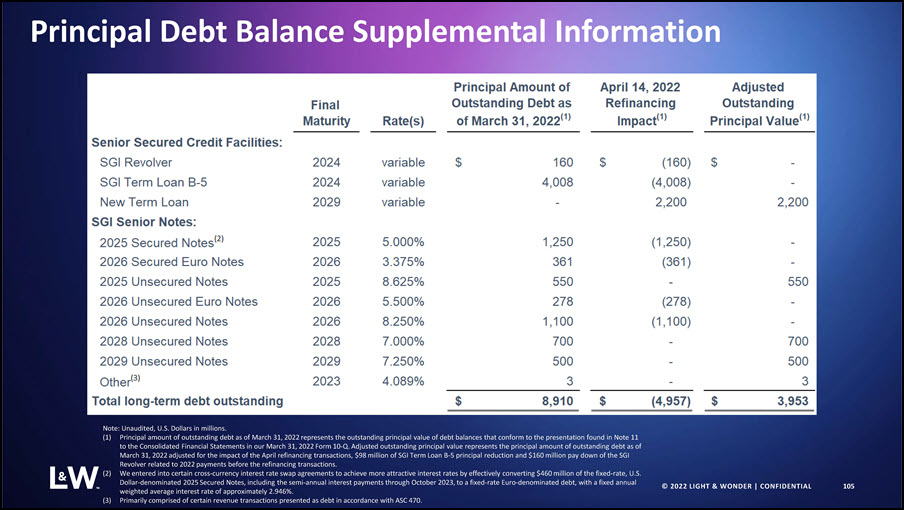
|
Final
Maturity
|
Rate(s)
|
Principal Amount of Outstanding Debt as of March 31, 2022(1)
|
April 14, 2022 Refinancing Impact(1)
|
Adjusted Outstanding Principal Value(1)
|
||||||||||||
|
Senior Secured Credit Facilities:
|
|||||||||||||||||
|
SGI Revolver
|
2024
|
variable
|
$
|
160
|
$
|
(160
|
)
|
$
|
–
|
||||||||
|
SGI Term Loan B-5
|
2024
|
variable
|
4,008
|
(4,008
|
)
|
–
|
|||||||||||
|
New Term Loan
|
2029
|
variable
|
–
|
2,200
|
2,200
|
||||||||||||
|
SGI Senior Notes:
|
|||||||||||||||||
|
2025 Secured Notes(2)
|
2025
|
5.000%
|
|
1,250
|
(1,250
|
)
|
–
|
||||||||||
|
2026 Secured Euro Notes
|
2026
|
3.375%
|
|
361
|
(361
|
)
|
–
|
||||||||||
|
2025 Unsecured Notes
|
2025
|
8.625%
|
|
550
|
–
|
550
|
|||||||||||
|
2026 Unsecured Euro Notes
|
2026
|
5.500%
|
|
278
|
(278
|
)
|
–
|
||||||||||
|
2026 Unsecured Notes
|
2026
|
8.250%
|
|
1,100
|
(1,100
|
)
|
–
|
||||||||||
|
2028 Unsecured Notes
|
2028
|
7.000%
|
|
700
|
–
|
700
|
|||||||||||
|
2029 Unsecured Notes
|
2029
|
7.250%
|
|
500
|
–
|
500
|
|||||||||||
|
Other(3)
|
2023
|
4.089%
|
|
3
|
–
|
3
|
|||||||||||
|
Total long-term debt outstanding
|
|
$
|
8,910
|
$
|
(4,957
|
)
|
$
|
3,953
|
|||||||||