| Maryland | No. | 001-11954 | No. | 22-1657560 | ||||||||||||||||
| (State or Other | (Commission | (IRS Employer | ||||||||||||||||||
| Jurisdiction of Incorporation) | File Number) | Identification No.) | ||||||||||||||||||
| Delaware | No. | 001-34482 | No. | 13-3925979 | ||||||||||||||||
| (State or Other | (Commission | (IRS Employer | ||||||||||||||||||
| Jurisdiction of Incorporation) | File Number) | Identification No.) | ||||||||||||||||||
| 888 Seventh Avenue | |||||||||||
| New York, | New York | 10019 | |||||||||
| (Address of Principal Executive offices) | (Zip Code) | ||||||||||
| ☐ | Written communications pursuant to Rule 425 under the Securities Act (17 CFR 230.425) | ||||
| ☐ | Soliciting material pursuant to Rule 14a-12 under the Exchange Act (17 CFR 240.14a-12) | ||||
| ☐ | Pre-commencement communications pursuant to Rule 14d-2(b) under the Exchange Act (17 CFR 240.14d-2(b)) | ||||
| ☐ | Pre-commencement communications pursuant to Rule 13e-4(c) under the Exchange Act (17 CFR 240.13e-4(c)) | ||||
Registrant |
Title of each class |
Trading Symbol(s) |
Name of each exchange on which registered |
|||||||||||||||||
Vornado Realty Trust |
Common Shares of beneficial interest, $.04 par value per share |
VNO |
New York Stock Exchange |
|||||||||||||||||
Cumulative Redeemable Preferred Shares of beneficial interest, liquidation preference $25.00 per share: |
||||||||||||||||||||
Vornado Realty Trust |
5.40% Series L |
VNO/PL |
New York Stock Exchange |
|||||||||||||||||
Vornado Realty Trust |
5.25% Series M |
VNO/PM |
New York Stock Exchange |
|||||||||||||||||
Vornado Realty Trust |
5.25% Series N |
VNO/PN |
New York Stock Exchange |
|||||||||||||||||
Vornado Realty Trust |
4.45% Series O | VNO/PO | New York Stock Exchange |
|||||||||||||||||
| (d) | Exhibits. | ||||||||||
| The following exhibits are being furnished as part of this Current Report on Form 8-K: | |||||||||||
| Vornado Realty Trust press release dated May 5, 2025 | |||||||||||
| Vornado Realty Trust supplemental operating and financial data for the quarter ended March 31, 2025 | |||||||||||
| Vornado Realty Trust supplemental fixed income data for the quarter ended March 31, 2025 | |||||||||||
| 104 | Cover Page Interactive Data File (embedded within the Inline XBRL document) | ||||||||||
| VORNADO REALTY TRUST | ||||||||
| (Registrant) | ||||||||
| By: | /s/ Deirdre Maddock | |||||||
| Name: | Deirdre Maddock | |||||||
| Title: | Chief Accounting Officer (duly authorized officer and principal accounting officer) | |||||||
| VORNADO REALTY L.P. | ||||||||
| (Registrant) | ||||||||
| By: | VORNADO REALTY TRUST, | |||||||
| Sole General Partner | ||||||||
| By: | /s/ Deirdre Maddock | |||||||
| Name: | Deirdre Maddock | |||||||
| Title: | Chief Accounting Officer of Vornado Realty Trust, sole General Partner of Vornado Realty L.P. (duly authorized officer and principal accounting officer) |
|||||||

| (Amounts in thousands, except per share amounts) | For the Three Months Ended March 31, |
||||||||||
| 2025 | 2024 | ||||||||||
FFO attributable to common shareholders plus assumed conversions (non-GAAP)(1) |
$ | 135,039 | $ | 104,129 | |||||||
| Per diluted share (non-GAAP) | $ | 0.67 | $ | 0.53 | |||||||
| Certain (income) expense items that impact FFO attributable to common shareholders plus assumed conversions: | |||||||||||
| After-tax net gain on sale of 220 Central Park South ("220 CPS") condominium units and ancillary amenities | $ | (11,028) | $ | — | |||||||
| Deferred tax liability on our investment in the Farley Building (held through a taxable REIT subsidiary) | 3,205 | 4,134 | |||||||||
| Other | (1,735) | 1,009 | |||||||||
| (9,558) | 5,143 | ||||||||||
| Noncontrolling interests' share of above adjustments on a dilutive basis | 764 | (425) | |||||||||
| Total of certain (income) expense items that impact FFO attributable to common shareholders plus assumed conversions, net | $ | (8,794) | $ | 4,718 | |||||||
| Per diluted share (non-GAAP) | $ | (0.04) | $ | 0.02 | |||||||
| FFO attributable to common shareholders plus assumed conversions, as adjusted (non-GAAP) | $ | 126,245 | $ | 108,847 | |||||||
| Per diluted share (non-GAAP) | $ | 0.63 | $ | 0.55 | |||||||
| NYSE: VNO | WWW.VNO.COM | PAGE 1 OF 14
|
|||||||
| (Amounts in millions, except per share amounts) | FFO, as Adjusted | ||||||||||
| Amount | Per Share | ||||||||||
| FFO attributable to common shareholders plus assumed conversions, as adjusted (non-GAAP) for the three months ended March 31, 2024 | $ | 108.8 | $ | 0.55 | |||||||
| Increase / (decrease) in FFO, as adjusted due to: | |||||||||||
| Impact of PENN 1 ground rent reset determination (including a $17.2 reversal of rent expense that was accrued in prior periods) | 20.0 | ||||||||||
| Lower interest income | (5.6) | ||||||||||
| Variable businesses (primarily signage) | 2.4 | ||||||||||
| Rent commencements, net of lease expirations and other tenant related items | 2.1 | ||||||||||
| Other, net | (0.5) | ||||||||||
| 18.4 | |||||||||||
| Noncontrolling interests' share of above items and impact of assumed conversions of convertible securities | (1.0) | ||||||||||
| Net increase | 17.4 | 0.08 | |||||||||
| FFO attributable to common shareholders plus assumed conversions, as adjusted (non-GAAP) for the three months ended March 31, 2025 | $ | 126.2 | $ | 0.63 | |||||||
| NYSE: VNO | WWW.VNO.COM | PAGE 2 OF 14
|
|||||||
| NYSE: VNO | WWW.VNO.COM | PAGE 3 OF 14
|
|||||||
| (Square feet in thousands) | New York | 555 California Street |
||||||||||||||||||||||||
| Office | Retail | THE MART | ||||||||||||||||||||||||
| Three Months Ended March 31, 2025 | ||||||||||||||||||||||||||
| Total square feet leased | 709 | 25 | 83 | 222 | ||||||||||||||||||||||
| Our share of square feet leased: | 685 | 18 | 83 | 155 | ||||||||||||||||||||||
Initial rent(1) |
$ | 95.53 | $ | 222.20 | $ | 51.33 | $ | 120.65 | ||||||||||||||||||
| Weighted average lease term (years) | 14.7 | 14.3 | 8.0 | 13.1 | ||||||||||||||||||||||
| Second generation relet space: | ||||||||||||||||||||||||||
| Square feet | 254 | 10 | 42 | 155 | ||||||||||||||||||||||
| GAAP basis: | ||||||||||||||||||||||||||
Straight-line rent(2) |
$ | 80.23 | $ | 139.99 | $ | 51.80 | $ | 132.08 | ||||||||||||||||||
| Prior straight-line rent | $ | 73.25 | $ | 108.59 | $ | 54.68 | $ | 110.28 | ||||||||||||||||||
| Percentage increase (decrease) | 9.5 | % | 28.9 | % | (5.3) | % | 19.8 | % | ||||||||||||||||||
| Cash basis (non-GAAP): | ||||||||||||||||||||||||||
Initial rent(1) |
$ | 84.72 | $ | 139.40 | $ | 51.67 | $ | 121.04 | ||||||||||||||||||
| Prior escalated rent | $ | 79.56 | $ | 112.57 | $ | 60.43 | $ | 117.37 | ||||||||||||||||||
| Percentage increase (decrease) | 6.5 | % | 23.8 | % | (14.5) | % | 3.1 | % | ||||||||||||||||||
| Tenant improvements and leasing commissions: | ||||||||||||||||||||||||||
| Per square foot | $ | 168.88 | $ | 377.61 | $ | 90.82 | $ | 229.71 | ||||||||||||||||||
| Per square foot per annum | $ | 11.49 | $ | 26.41 | $ | 11.35 | $ | 17.54 | ||||||||||||||||||
| Percentage of initial rent | 12.0 | % | 11.9 | % | 22.1 | % | 14.5 | % | ||||||||||||||||||
| (At Vornado's share) | New York | THE MART | 555 California Street | ||||||||||||||||||||||||||
| Total | Office(1) |
Retail | |||||||||||||||||||||||||||
| Occupancy as of March 31, 2025 | 83.5 | % | 84.4 | % | 72.2 | % | 78.2 | % | 92.3 | % | |||||||||||||||||||
| NYSE: VNO | WWW.VNO.COM | PAGE 4 OF 14
|
|||||||
Same Store Net Operating Income ("NOI") (non-GAAP) At Share: |
Total | New York | THE MART(3) |
555 California Street | |||||||||||||||||||
Same store NOI at share % increase (decrease)(1): |
|||||||||||||||||||||||
| Three months ended March 31, 2025 compared to March 31, 2024 | 3.5 | % | 3.0 | % | (2) | 9.7 | % | 5.2 | % | ||||||||||||||
| Three months ended March 31, 2025 compared to December 31, 2024 | (1.5) | % | (6.3) | % | (2) | 160.8 | % | 10.5 | % | ||||||||||||||
Same store NOI at share - cash basis % increase (decrease)(1): |
|||||||||||||||||||||||
| Three months ended March 31, 2025 compared to March 31, 2024 | 0.9 | % | (0.7) | % | 16.7 | % | 7.1 | % | |||||||||||||||
| Three months ended March 31, 2025 compared to December 31, 2024 | (1.5) | % | (4.8) | % | 66.9 | % | 0.8 | % | |||||||||||||||
| (Amounts in thousands) | For the Three Months Ended | ||||||||||||||||
| March 31, | December 31, 2024 | ||||||||||||||||
| 2025 | 2024 | ||||||||||||||||
| NOI at share: | |||||||||||||||||
| New York: | |||||||||||||||||
Office(1) |
$ | 191,501 | $ | 167,988 | $ | 193,215 | |||||||||||
| Retail | 46,115 | 47,466 | 48,238 | ||||||||||||||
| Residential | 6,192 | 5,968 | 6,072 | ||||||||||||||
| Alexander's | 9,509 | 11,707 | 9,515 | ||||||||||||||
| Total New York | 253,317 | 233,129 | 257,040 | ||||||||||||||
| Other: | |||||||||||||||||
THE MART(2) |
15,916 | 14,486 | 6,168 | ||||||||||||||
| 555 California Street | 17,843 | 16,529 | 15,854 | ||||||||||||||
| Other investments | 6,214 | 4,980 | 5,904 | ||||||||||||||
| Total Other | 39,973 | 35,995 | 27,926 | ||||||||||||||
| NOI at share | $ | 293,290 | $ | 269,124 | $ | 284,966 | |||||||||||
| NOI at share - cash basis: | |||||||||||||||||
| New York: | |||||||||||||||||
Office(1) |
$ | 167,457 | $ | 166,370 | $ | 181,438 | |||||||||||
| Retail | 43,727 | 43,873 | 44,130 | ||||||||||||||
| Residential | 5,848 | 5,690 | 5,750 | ||||||||||||||
| Alexander's | 10,538 | 14,861 | 10,615 | ||||||||||||||
| Total New York | 227,570 | 230,794 | 241,933 | ||||||||||||||
| Other: | |||||||||||||||||
| THE MART | 17,517 | 14,949 | 10,550 | ||||||||||||||
| 555 California Street | 18,137 | 16,938 | 18,138 | ||||||||||||||
| Other investments | 6,147 | 4,932 | 5,967 | ||||||||||||||
| Total Other | 41,801 | 36,819 | 34,655 | ||||||||||||||
| NOI at share - cash basis | $ | 269,371 | $ | 267,613 | $ | 276,588 | |||||||||||
| NYSE: VNO | WWW.VNO.COM | PAGE 5 OF 14
|
|||||||
| (Amounts in thousands, except square feet) | ||||||||||||||||||||||||||||||||||||||||||||
| (at Vornado’s share) | Projected Incremental Cash Yield |
|||||||||||||||||||||||||||||||||||||||||||
|
New York segment:
|
Property Rentable Sq. Ft. |
Budget | Cash Amount Expended |
Remaining Expenditures | Stabilization Year |
|||||||||||||||||||||||||||||||||||||||
| PENN District: | ||||||||||||||||||||||||||||||||||||||||||||
| PENN 2 | 1,815,000 | $ | 750,000 | $ | 708,267 | $ | 41,733 | 2026 | 10.2% | |||||||||||||||||||||||||||||||||||
| Districtwide Improvements | N/A | 100,000 | 75,189 | 24,811 | N/A | N/A | ||||||||||||||||||||||||||||||||||||||
| Total PENN District | 850,000 | (1) |
783,456 | 66,544 | ||||||||||||||||||||||||||||||||||||||||
| Sunset Pier 94 Studios (49.9% interest) | 266,000 | 125,000 | (2) |
66,551 | 58,449 | 2026 | 10.3% | |||||||||||||||||||||||||||||||||||||
| Total Active Development Projects | $ | 975,000 | $ | 850,007 | $ | 124,993 | ||||||||||||||||||||||||||||||||||||||
| NYSE: VNO | WWW.VNO.COM | PAGE 6 OF 14
|
|||||||
| (Amounts in thousands) | As of | Increase (Decrease) |
|||||||||||||||
| March 31, 2025 | December 31, 2024 | ||||||||||||||||
| ASSETS | |||||||||||||||||
| Real estate, at cost: | |||||||||||||||||
| Land | $ | 2,434,209 | $ | 2,434,209 | $ | — | |||||||||||
| Buildings and improvements | 10,719,995 | 10,439,113 | 280,882 | ||||||||||||||
| Development costs and construction in progress | 879,601 | 1,097,395 | (217,794) | ||||||||||||||
| Leasehold improvements and equipment | 111,983 | 120,915 | (8,932) | ||||||||||||||
| Total | 14,145,788 | 14,091,632 | 54,156 | ||||||||||||||
| Less accumulated depreciation and amortization | (4,105,413) | (4,025,349) | (80,064) | ||||||||||||||
| Real estate, net | 10,040,375 | 10,066,283 | (25,908) | ||||||||||||||
| Right-of-use assets | 677,312 | 678,804 | (1,492) | ||||||||||||||
| Cash, cash equivalents, and restricted cash | |||||||||||||||||
| Cash and cash equivalents | 568,861 | 733,947 | (165,086) | ||||||||||||||
| Restricted cash | 238,027 | 215,672 | 22,355 | ||||||||||||||
| Total | 806,888 | 949,619 | (142,731) | ||||||||||||||
| Tenant and other receivables | 70,920 | 58,853 | 12,067 | ||||||||||||||
| Investments in partially owned entities | 2,421,283 | 2,691,478 | (270,195) | ||||||||||||||
| Receivable arising from the straight-lining of rents | 711,334 | 707,020 | 4,314 | ||||||||||||||
| Deferred leasing costs, net | 385,658 | 354,882 | 30,776 | ||||||||||||||
| Identified intangible assets, net | 116,280 | 118,215 | (1,935) | ||||||||||||||
| Other assets | 369,182 | 373,454 | (4,272) | ||||||||||||||
| Total assets | $ | 15,599,232 | $ | 15,998,608 | $ | (399,376) | |||||||||||
| LIABILITIES, REDEEMABLE NONCONTROLLING INTERESTS AND EQUITY | |||||||||||||||||
| Liabilities: | |||||||||||||||||
| Mortgages payable, net | $ | 5,674,519 | $ | 5,676,014 | $ | (1,495) | |||||||||||
| Senior unsecured notes, net | 746,282 | 1,195,914 | (449,632) | ||||||||||||||
| Unsecured term loan, net | 796,295 | 795,948 | 347 | ||||||||||||||
| Unsecured revolving credit facilities | 575,000 | 575,000 | — | ||||||||||||||
| Lease liabilities | 734,123 | 749,759 | (15,636) | ||||||||||||||
| Accounts payable and accrued expenses | 387,898 | 374,013 | 13,885 | ||||||||||||||
| Deferred compensation plan | 111,144 | 114,580 | (3,436) | ||||||||||||||
| Other liabilities | 345,778 | 345,511 | 267 | ||||||||||||||
| Total liabilities | 9,371,039 | 9,826,739 | (455,700) | ||||||||||||||
| Redeemable noncontrolling interests | 738,224 | 834,658 | (96,434) | ||||||||||||||
| Shareholders' equity | 5,314,118 | 5,158,242 | 155,876 | ||||||||||||||
| Noncontrolling interests in consolidated subsidiaries | 175,851 | 178,969 | (3,118) | ||||||||||||||
| Total liabilities, redeemable noncontrolling interests and equity | $ | 15,599,232 | $ | 15,998,608 | $ | (399,376) | |||||||||||
| NYSE: VNO | WWW.VNO.COM | PAGE 7 OF 14
|
|||||||
| (Amounts in thousands, except per share amounts) | For the Three Months Ended March 31, |
||||||||||
| 2025 | 2024 | ||||||||||
| Revenues | $ | 461,579 | $ | 436,375 | |||||||
| Net income (loss) | $ | 99,824 | $ | (6,273) | |||||||
| Less net loss (income) attributable to noncontrolling interests in: | |||||||||||
| Consolidated subsidiaries | 10,433 | 11,982 | |||||||||
| Operating Partnership | (7,889) | 786 | |||||||||
| Net income attributable to Vornado | 102,368 | 6,495 | |||||||||
| Preferred share dividends | (15,526) | (15,529) | |||||||||
| Net income (loss) attributable to common shareholders | $ | 86,842 | $ | (9,034) | |||||||
| Income (loss) per common share - basic: | |||||||||||
| Net income (loss) per common share | $ | 0.45 | $ | (0.05) | |||||||
| Weighted average shares outstanding | 191,371 | 190,429 | |||||||||
| Income (loss) per common share - diluted: | |||||||||||
| Net income (loss) per common share | $ | 0.43 | $ | (0.05) | |||||||
| Weighted average shares outstanding | 200,735 | 190,429 | |||||||||
| FFO attributable to common shareholders plus assumed conversions (non-GAAP) | $ | 135,039 | $ | 104,129 | |||||||
| Per diluted share (non-GAAP) | $ | 0.67 | $ | 0.53 | |||||||
| FFO attributable to common shareholders plus assumed conversions, as adjusted (non-GAAP) | $ | 126,245 | $ | 108,847 | |||||||
| Per diluted share (non-GAAP) | $ | 0.63 | $ | 0.55 | |||||||
| Weighted average shares used in determining FFO attributable to common shareholders plus assumed conversions per diluted share | 200,784 | 196,481 | |||||||||
| NYSE: VNO | WWW.VNO.COM | PAGE 8 OF 14
|
|||||||
| (Amounts in thousands, except per share amounts) | For the Three Months Ended March 31, |
||||||||||
| 2025 | 2024 | ||||||||||
| Net income (loss) attributable to common shareholders | $ | 86,842 | $ | (9,034) | |||||||
| Per diluted share | $ | 0.43 | $ | (0.05) | |||||||
| FFO adjustments: | |||||||||||
| Depreciation and amortization of real property | $ | 104,257 | $ | 96,783 | |||||||
| Our share of partially owned entities: | |||||||||||
| Net gain on sale of real estate | (77,008) | — | |||||||||
| Depreciation and amortization of real property | 24,525 | 26,163 | |||||||||
| FFO adjustments, net | 51,774 | 122,946 | |||||||||
| Impact of assumed conversion of dilutive convertible securities | 310 | 388 | |||||||||
| Noncontrolling interests' share of above adjustments on a dilutive basis | (3,887) | (10,171) | |||||||||
| FFO attributable to common shareholders plus assumed conversions (non-GAAP) | $ | 135,039 | $ | 104,129 | |||||||
| Per diluted share | $ | 0.67 | $ | 0.53 | |||||||
| Reconciliation of weighted average shares outstanding: | |||||||||||
| Weighted average common shares outstanding | 191,371 | 190,429 | |||||||||
| Effect of dilutive securities: | |||||||||||
| Share-based payment awards | 8,161 | 4,204 | |||||||||
| Convertible securities | 1,252 | 1,848 | |||||||||
| Denominator for FFO per diluted share | 200,784 | 196,481 | |||||||||
| NYSE: VNO | WWW.VNO.COM | PAGE 9 OF 14
|
|||||||
| (Amounts in thousands) | For the Three Months Ended | ||||||||||||||||
| March 31, | December 31, 2024 | ||||||||||||||||
| 2025 | 2024 | ||||||||||||||||
| Net income (loss) | $ | 99,824 | $ | (6,273) | $ | 5,758 | |||||||||||
| Depreciation and amortization expense | 116,155 | 108,659 | 113,061 | ||||||||||||||
| General and administrative expense | 38,597 | 37,897 | 36,637 | ||||||||||||||
| Transaction related costs and other | 43 | 653 | 1,341 | ||||||||||||||
| Income from partially owned entities | (96,977) | (16,279) | (30,007) | ||||||||||||||
| Interest and other investment income, net | (8,261) | (11,724) | (11,348) | ||||||||||||||
| Interest and debt expense | 95,816 | 90,478 | 100,483 | ||||||||||||||
| Net gains on disposition of wholly owned and partially owned assets | (15,551) | — | — | ||||||||||||||
| Income tax expense | 7,193 | 6,740 | 5,822 | ||||||||||||||
| NOI from partially owned entities | 67,111 | 70,369 | 73,270 | ||||||||||||||
| NOI attributable to noncontrolling interests in consolidated subsidiaries | (10,660) | (11,396) | (10,051) | ||||||||||||||
| NOI at share | 293,290 | 269,124 | 284,966 | ||||||||||||||
| Non-cash adjustments for straight-line rents, amortization of acquired below-market leases, net, and other | (23,919) | (1,511) | (8,378) | ||||||||||||||
| NOI at share - cash basis | $ | 269,371 | $ | 267,613 | $ | 276,588 | |||||||||||
| NYSE: VNO | WWW.VNO.COM | PAGE 10 OF 14
|
|||||||
| (Amounts in thousands) | Total | New York | THE MART | 555 California Street | Other | ||||||||||||||||||||||||
| NOI at share for the three months ended March 31, 2025 | $ | 293,290 | $ | 253,317 | $ | 15,916 | $ | 17,843 | $ | 6,214 | |||||||||||||||||||
| Less NOI at share from: | |||||||||||||||||||||||||||||
| Dispositions | (221) | (153) | (68) | — | — | ||||||||||||||||||||||||
| Development properties | (6,730) | (6,730) | — | — | — | ||||||||||||||||||||||||
| Other non-same store income, net | (27,536) | (20,866) | — | (456) | (6,214) | ||||||||||||||||||||||||
| Same store NOI at share for the three months ended March 31, 2025 | $ | 258,803 | $ | 225,568 | $ | 15,848 | $ | 17,387 | $ | — | |||||||||||||||||||
| NOI at share for the three months ended March 31, 2024 | $ | 269,124 | $ | 233,129 | $ | 14,486 | $ | 16,529 | $ | 4,980 | |||||||||||||||||||
| Less NOI at share from: | |||||||||||||||||||||||||||||
| Dispositions | (3,408) | (3,374) | (34) | — | — | ||||||||||||||||||||||||
| Development properties | (9,727) | (9,727) | — | — | — | ||||||||||||||||||||||||
| Other non-same store income, net | (6,029) | (1,049) | — | — | (4,980) | ||||||||||||||||||||||||
| Same store NOI at share for the three months ended March 31, 2024 | $ | 249,960 | $ | 218,979 | $ | 14,452 | $ | 16,529 | $ | — | |||||||||||||||||||
| Increase in same store NOI at share | $ | 8,843 | $ | 6,589 | $ | 1,396 | $ | 858 | $ | — | |||||||||||||||||||
| % increase in same store NOI at share | 3.5 | % | 3.0 | % | 9.7 | % | 5.2 | % | 0.0 | % | |||||||||||||||||||
| NYSE: VNO | WWW.VNO.COM | PAGE 11 OF 14
|
|||||||
| (Amounts in thousands) | Total | New York | THE MART | 555 California Street | Other | ||||||||||||||||||||||||
| NOI at share - cash basis for the three months ended March 31, 2025 | $ | 269,371 | $ | 227,570 | $ | 17,517 | $ | 18,137 | $ | 6,147 | |||||||||||||||||||
| Less NOI at share - cash basis from: | |||||||||||||||||||||||||||||
| Dispositions | (223) | (153) | (70) | — | — | ||||||||||||||||||||||||
| Development properties | (6,489) | (6,489) | — | — | — | ||||||||||||||||||||||||
| Other non-same store income, net | (11,631) | (5,484) | — | — | (6,147) | ||||||||||||||||||||||||
| Same store NOI at share - cash basis for the three months ended March 31, 2025 | $ | 251,028 | $ | 215,444 | $ | 17,447 | $ | 18,137 | $ | — | |||||||||||||||||||
| NOI at share - cash basis for the three months ended March 31, 2024 | $ | 267,613 | $ | 230,794 | $ | 14,949 | $ | 16,938 | $ | 4,932 | |||||||||||||||||||
| Less NOI at share - cash basis from: | |||||||||||||||||||||||||||||
| Dispositions | (2,894) | (2,895) | 1 | — | — | ||||||||||||||||||||||||
| Development properties | (9,244) | (9,244) | — | — | — | ||||||||||||||||||||||||
| Other non-same store income, net | (6,598) | (1,666) | — | — | (4,932) | ||||||||||||||||||||||||
| Same store NOI at share - cash basis for the three months ended March 31, 2024 | $ | 248,877 | $ | 216,989 | $ | 14,950 | $ | 16,938 | $ | — | |||||||||||||||||||
| Increase (decrease) in same store NOI at share - cash basis | $ | 2,151 | $ | (1,545) | $ | 2,497 | $ | 1,199 | $ | — | |||||||||||||||||||
| % increase (decrease) in same store NOI at share - cash basis | 0.9 | % | (0.7) | % | 16.7 | % | 7.1 | % | 0.0 | % | |||||||||||||||||||
| NYSE: VNO | WWW.VNO.COM | PAGE 12 OF 14
|
|||||||
| (Amounts in thousands) | Total | New York | THE MART | 555 California Street | Other | ||||||||||||||||||||||||
| NOI at share for the three months ended March 31, 2025 | $ | 293,290 | $ | 253,317 | $ | 15,916 | $ | 17,843 | $ | 6,214 | |||||||||||||||||||
| Less NOI at share from: | |||||||||||||||||||||||||||||
| Dispositions | (221) | (153) | (68) | — | — | ||||||||||||||||||||||||
| Development properties | (6,196) | (6,196) | — | — | — | ||||||||||||||||||||||||
| Other non-same store income, net | (26,946) | (20,276) | — | (456) | (6,214) | ||||||||||||||||||||||||
| Same store NOI at share for the three months ended March 31, 2025 | $ | 259,927 | $ | 226,692 | $ | 15,848 | $ | 17,387 | $ | — | |||||||||||||||||||
| NOI at share for the three months ended December 31, 2024 | $ | 284,966 | $ | 257,040 | $ | 6,168 | $ | 15,854 | $ | 5,904 | |||||||||||||||||||
| Less NOI at share from: | |||||||||||||||||||||||||||||
| Dispositions | (3,610) | (3,518) | (92) | — | — | ||||||||||||||||||||||||
| Development properties | (5,627) | (5,627) | — | — | — | ||||||||||||||||||||||||
| Other non-same store income, net | (11,880) | (5,850) | — | (126) | (5,904) | ||||||||||||||||||||||||
| Same store NOI at share for the three months ended December 31, 2024 | $ | 263,849 | $ | 242,045 | $ | 6,076 | $ | 15,728 | $ | — | |||||||||||||||||||
| (Decrease) increase in same store NOI at share | $ | (3,922) | $ | (15,353) | $ | 9,772 | $ | 1,659 | $ | — | |||||||||||||||||||
| % (decrease) increase in same store NOI at share | (1.5) | % | (6.3) | % | 160.8 | % | 10.5 | % | 0.0 | % | |||||||||||||||||||
| NYSE: VNO | WWW.VNO.COM | PAGE 13 OF 14
|
|||||||
| (Amounts in thousands) | Total | New York | THE MART | 555 California Street | Other | ||||||||||||||||||||||||
| NOI at share - cash basis for the three months ended March 31, 2025 | $ | 269,371 | $ | 227,570 | $ | 17,517 | $ | 18,137 | $ | 6,147 | |||||||||||||||||||
| Less NOI at share - cash basis from: | |||||||||||||||||||||||||||||
| Dispositions | (223) | (153) | (70) | — | — | ||||||||||||||||||||||||
| Development properties | 137 | 137 | — | — | — | ||||||||||||||||||||||||
| Other non-same store income, net | (10,995) | (4,848) | — | — | (6,147) | ||||||||||||||||||||||||
| Same store NOI at share - cash basis for the three months ended March 31, 2025 | $ | 258,290 | $ | 222,706 | $ | 17,447 | $ | 18,137 | $ | — | |||||||||||||||||||
| NOI at share - cash basis for the three months ended December 31, 2024 | $ | 276,588 | $ | 241,933 | $ | 10,550 | $ | 18,138 | $ | 5,967 | |||||||||||||||||||
| Less NOI at share - cash basis from: | |||||||||||||||||||||||||||||
| Dispositions | (2,312) | (2,218) | (94) | — | — | ||||||||||||||||||||||||
| Development properties | (1,664) | (1,664) | — | — | — | ||||||||||||||||||||||||
| Other non-same store income, net | (10,263) | (4,153) | — | (143) | (5,967) | ||||||||||||||||||||||||
| Same store NOI at share - cash basis for the three months ended December 31, 2024 | $ | 262,349 | $ | 233,898 | $ | 10,456 | $ | 17,995 | $ | — | |||||||||||||||||||
| (Decrease) increase in same store NOI at share - cash basis | $ | (4,059) | $ | (11,192) | $ | 6,991 | $ | 142 | $ | — | |||||||||||||||||||
| % (decrease) increase in same store NOI at share - cash basis | (1.5) | % | (4.8) | % | 66.9 | % | 0.8 | % | 0.0 | % | |||||||||||||||||||
| NYSE: VNO | WWW.VNO.COM | PAGE 14 OF 14
|
|||||||


| INDEX | |||||||||||||||||
| Page | |||||||||||||||||
| BUSINESS DEVELOPMENTS | |||||||||||||||||
| FINANCIAL INFORMATION | |||||||||||||||||
| Financial Highlights | |||||||||||||||||
| FFO, As Adjusted Bridge | |||||||||||||||||
| Consolidated Balance Sheets | |||||||||||||||||
| Net Income (Loss) Attributable to Common Shareholders (Consolidated and by Segment) | - | ||||||||||||||||
| Net Operating Income at Share and Net Operating Income at Share - Cash Basis (by Segment and by Subsegment) | - | ||||||||||||||||
| Same Store NOI at Share and Same Store NOI at Share - Cash Basis | |||||||||||||||||
| DEVELOPMENT/REDEVELOPMENT - ACTIVE PROJECTS AND FUTURE OPPORTUNITIES | |||||||||||||||||
| LEASING ACTIVITY AND LEASE EXPIRATIONS | |||||||||||||||||
| Leasing Activity | |||||||||||||||||
| Lease Expirations | - | ||||||||||||||||
| CAPITAL EXPENDITURES, TENANT IMPROVEMENTS AND LEASING COMMISSIONS | |||||||||||||||||
| UNCONSOLIDATED JOINT VENTURES | - | ||||||||||||||||
| DEBT AND CAPITALIZATION | |||||||||||||||||
| Capital Structure | |||||||||||||||||
| Common Shares Data | |||||||||||||||||
| Debt Analysis | |||||||||||||||||
| Hedging Instruments | |||||||||||||||||
| Consolidated Debt Maturities | |||||||||||||||||
| PROPERTY STATISTICS | |||||||||||||||||
| Top 30 Tenants | |||||||||||||||||
| Square Footage | |||||||||||||||||
| Occupancy and Residential Statistics | |||||||||||||||||
| Ground Leases | |||||||||||||||||
| Property Table | - | ||||||||||||||||
| EXECUTIVE OFFICERS AND RESEARCH COVERAGE | |||||||||||||||||
| APPENDIX: DEFINITIONS AND NON-GAAP RECONCILIATIONS | |||||||||||||||||
| Definitions | |||||||||||||||||
| Reconciliations | - | ||||||||||||||||
| BUSINESS DEVELOPMENTS | ||||||||||||||
| FINANCIAL HIGHLIGHTS (unaudited) | |||||||||||||||||
| (Amounts in thousands, except per share amounts) | |||||||||||||||||
| For the Three Months Ended | |||||||||||||||||
| March 31, | December 31, 2024 | ||||||||||||||||
| 2025 | 2024 | ||||||||||||||||
| Total revenues | $ | 461,579 | $ | 436,375 | $ | 457,790 | |||||||||||
| Net income (loss) attributable to common shareholders | $ | 86,842 | $ | (9,034) | $ | 1,203 | |||||||||||
| Per common share: | |||||||||||||||||
| Basic | $ | 0.45 | $ | (0.05) | $ | 0.01 | |||||||||||
| Diluted | $ | 0.43 | $ | (0.05) | $ | 0.01 | |||||||||||
| FFO attributable to common shareholders plus assumed conversions, as adjusted (non-GAAP) | $ | 126,245 | $ | 108,847 | $ | 122,212 | |||||||||||
| Per diluted share (non-GAAP) | $ | 0.63 | $ | 0.55 | $ | 0.61 | |||||||||||
| FFO attributable to common shareholders plus assumed conversions (non-GAAP) | $ | 135,039 | $ | 104,129 | $ | 117,085 | |||||||||||
| FFO - Operating Partnership ("OP") basis (non-GAAP) | $ | 146,786 | $ | 113,485 | $ | 126,975 | |||||||||||
| Per diluted share (non-GAAP) | $ | 0.67 | $ | 0.53 | $ | 0.58 | |||||||||||
| Dividends per common share | N/A | N/A | $ | 0.74 | |||||||||||||
FFO payout ratio (based on FFO attributable to common shareholders plus assumed conversions, as adjusted)(1) |
N/A | N/A | N/A | ||||||||||||||
FAD payout ratio(1) |
N/A | N/A | N/A | ||||||||||||||
| Weighted average VNO common shares outstanding | 191,371 | 190,429 | 190,679 | ||||||||||||||
| Redeemable Class A units and LTIP Unit awards | 17,323 | 17,174 | 16,996 | ||||||||||||||
| Weighted average VRLP Class A units outstanding | 208,694 | 207,603 | 207,675 | ||||||||||||||
| Dilutive share-based equity awards | 8,161 | 4,204 | 9,405 | ||||||||||||||
| Redeemable preferred units - common share equivalents | 1,252 | 1,875 | 1,197 | ||||||||||||||
| Weighted average VRLP Class A units outstanding - diluted | 218,107 | 213,682 | 218,277 | ||||||||||||||
| FFO, AS ADJUSTED BRIDGE - Q1 2025 VS. Q1 2024 (unaudited) | ||
| (Amounts in millions, except per share amounts) | FFO, as Adjusted | ||||||||||
| Amount | Per Share | ||||||||||
| FFO attributable to common shareholders plus assumed conversions, as adjusted (non-GAAP) for the three months ended March 31, 2024 | $ | 108.8 | $ | 0.55 | |||||||
| Increase / (decrease) in FFO, as adjusted due to: | |||||||||||
| Impact of PENN 1 ground rent reset determination (including a $17.2 reversal of rent expense that was accrued in prior periods) | 20.0 | ||||||||||
| Lower interest income | (5.6) | ||||||||||
| Variable businesses (primarily signage) | 2.4 | ||||||||||
| Rent commencements, net of lease expirations and other tenant related items | 2.1 | ||||||||||
| Other, net | (0.5) | ||||||||||
| 18.4 | |||||||||||
| Noncontrolling interests' share of above items and impact of assumed conversions of convertible securities | (1.0) | ||||||||||
| Net increase | 17.4 | 0.08 | |||||||||
| FFO attributable to common shareholders plus assumed conversions, as adjusted (non-GAAP) for the three months ended March 31, 2025 | $ | 126.2 | $ | 0.63 | |||||||
| CONSOLIDATED BALANCE SHEETS (unaudited) | |||||||||||||||||
| (Amounts in thousands) | |||||||||||||||||
| As of | Increase (Decrease) |
||||||||||||||||
| March 31, 2025 | December 31, 2024 | ||||||||||||||||
| ASSETS | |||||||||||||||||
| Real estate, at cost: | |||||||||||||||||
| Land | $ | 2,434,209 | $ | 2,434,209 | $ | — | |||||||||||
| Buildings and improvements | 10,719,995 | 10,439,113 | 280,882 | ||||||||||||||
| Development costs and construction in progress | 879,601 | 1,097,395 | (217,794) | ||||||||||||||
| Leasehold improvements and equipment | 111,983 | 120,915 | (8,932) | ||||||||||||||
| Total | 14,145,788 | 14,091,632 | 54,156 | ||||||||||||||
| Less accumulated depreciation and amortization | (4,105,413) | (4,025,349) | (80,064) | ||||||||||||||
| Real estate, net | 10,040,375 | 10,066,283 | (25,908) | ||||||||||||||
| Right-of-use assets | 677,312 | 678,804 | (1,492) | ||||||||||||||
| Cash, cash equivalents, and restricted cash | |||||||||||||||||
| Cash and cash equivalents | 568,861 | 733,947 | (165,086) | ||||||||||||||
| Restricted cash | 238,027 | 215,672 | 22,355 | ||||||||||||||
| Total | 806,888 | 949,619 | (142,731) | ||||||||||||||
| Tenant and other receivables | 70,920 | 58,853 | 12,067 | ||||||||||||||
| Investments in partially owned entities | 2,421,283 | 2,691,478 | (270,195) | ||||||||||||||
| Receivable arising from the straight-lining of rents | 711,334 | 707,020 | 4,314 | ||||||||||||||
| Deferred leasing costs, net | 385,658 | 354,882 | 30,776 | ||||||||||||||
| Identified intangible assets, net | 116,280 | 118,215 | (1,935) | ||||||||||||||
| Other assets | 369,182 | 373,454 | (4,272) | ||||||||||||||
| Total assets | $ | 15,599,232 | $ | 15,998,608 | $ | (399,376) | |||||||||||
| LIABILITIES, REDEEMABLE NONCONTROLLING INTERESTS AND EQUITY | |||||||||||||||||
| Liabilities: | |||||||||||||||||
| Mortgages payable, net | $ | 5,674,519 | $ | 5,676,014 | $ | (1,495) | |||||||||||
| Senior unsecured notes, net | 746,282 | 1,195,914 | (449,632) | ||||||||||||||
| Unsecured term loan, net | 796,295 | 795,948 | 347 | ||||||||||||||
| Unsecured revolving credit facilities | 575,000 | 575,000 | — | ||||||||||||||
| Lease liabilities | 734,123 | 749,759 | (15,636) | ||||||||||||||
| Accounts payable and accrued expenses | 387,898 | 374,013 | 13,885 | ||||||||||||||
| Deferred compensation plan | 111,144 | 114,580 | (3,436) | ||||||||||||||
| Other liabilities | 345,778 | 345,511 | 267 | ||||||||||||||
| Total liabilities | 9,371,039 | 9,826,739 | (455,700) | ||||||||||||||
| Redeemable noncontrolling interests | 738,224 | 834,658 | (96,434) | ||||||||||||||
| Shareholders' equity | 5,314,118 | 5,158,242 | 155,876 | ||||||||||||||
| Noncontrolling interests in consolidated subsidiaries | 175,851 | 178,969 | (3,118) | ||||||||||||||
| Total liabilities, redeemable noncontrolling interests and equity | $ | 15,599,232 | $ | 15,998,608 | $ | (399,376) | |||||||||||
| CONSOLIDATED NET INCOME (LOSS) ATTRIBUTABLE TO COMMON SHAREHOLDERS (unaudited) | |||||||||||||||||||||||
| (Amounts in thousands) | |||||||||||||||||||||||
| For the Three Months Ended | |||||||||||||||||||||||
| March 31, | December 31, 2024 | ||||||||||||||||||||||
| 2025 | 2024 | Variance | |||||||||||||||||||||
Property rentals(1) |
$ | 348,385 | $ | 337,376 | $ | 11,009 | $ | 345,005 | |||||||||||||||
Tenant expense reimbursements(1) |
51,983 | 46,638 | 5,345 | 45,229 | |||||||||||||||||||
| Amortization of acquired below-market leases, net | 88 | 693 | (605) | 193 | |||||||||||||||||||
| Straight-lining of rents | 4,299 | 4,571 | (272) | 8,036 | |||||||||||||||||||
| Total rental revenues | 404,755 | 389,278 | 15,477 | 398,463 | |||||||||||||||||||
| Fee and other income: | |||||||||||||||||||||||
| Building Maintenance Services ("BMS") cleaning fees | 36,476 | 35,780 | 696 | 37,208 | |||||||||||||||||||
| Management and leasing fees | 3,030 | 2,611 | 419 | 2,519 | |||||||||||||||||||
| Other income | 17,318 | 8,706 | 8,612 | 19,600 | |||||||||||||||||||
| Total revenues | 461,579 | 436,375 | 25,204 | 457,790 | |||||||||||||||||||
| Operating expenses | (224,740) | (226,224) | 1,484 | (236,043) | |||||||||||||||||||
| Depreciation and amortization | (116,155) | (108,659) | (7,496) | (113,061) | |||||||||||||||||||
| General and administrative | (38,597) | (37,897) | (700) | (36,637) | |||||||||||||||||||
| Income (expense) from deferred compensation plan liability | 1,089 | (4,520) | 5,609 | (1,549) | |||||||||||||||||||
| Transaction related costs and other | (43) | (653) | 610 | (1,341) | |||||||||||||||||||
| Total expenses | (378,446) | (377,953) | (493) | (388,631) | |||||||||||||||||||
| Income from partially owned entities | 96,977 | 16,279 | 80,698 | 30,007 | |||||||||||||||||||
| Interest and other investment income, net | 8,261 | 11,724 | (3,463) | 11,348 | |||||||||||||||||||
| (Expense) income from deferred compensation plan assets | (1,089) | 4,520 | (5,609) | 1,549 | |||||||||||||||||||
| Interest and debt expense | (95,816) | (90,478) | (5,338) | (100,483) | |||||||||||||||||||
| Net gains on disposition of wholly owned and partially owned assets | 15,551 | — | 15,551 | — | |||||||||||||||||||
| Income before income taxes | 107,017 | 467 | 106,550 | 11,580 | |||||||||||||||||||
| Income tax expense | (7,193) | (6,740) | (453) | (5,822) | |||||||||||||||||||
| Net income (loss) | 99,824 | (6,273) | 106,097 | 5,758 | |||||||||||||||||||
| Less net loss (income) attributable to noncontrolling interests in: | |||||||||||||||||||||||
| Consolidated subsidiaries | 10,433 | 11,982 | (1,549) | 11,107 | |||||||||||||||||||
| Operating Partnership | (7,889) | 786 | (8,675) | (136) | |||||||||||||||||||
| Net income attributable to Vornado | 102,368 | 6,495 | 95,873 | 16,729 | |||||||||||||||||||
| Preferred share dividends | (15,526) | (15,529) | 3 | (15,526) | |||||||||||||||||||
| Net income (loss) attributable to common shareholders | $ | 86,842 | $ | (9,034) | $ | 95,876 | $ | 1,203 | |||||||||||||||
| Capitalized expenditures: | |||||||||||||||||||||||
| Interest and debt expense | $ | 10,868 | $ | 12,564 | $ | (1,696) | $ | 12,417 | |||||||||||||||
| Development payroll | 1,101 | 2,499 | (1,398) | 990 | |||||||||||||||||||
| NET INCOME (LOSS) ATTRIBUTABLE TO COMMON SHAREHOLDERS BY SEGMENT (unaudited) | ||
| (Amounts in thousands) | ||
| For the Three Months Ended March 31, 2025 | |||||||||||||||||
| Total | New York | Other | |||||||||||||||
Property rentals(1) |
$ | 348,385 | $ | 279,691 | $ | 68,694 | |||||||||||
Tenant expense reimbursements(1) |
51,983 | 38,992 | 12,991 | ||||||||||||||
| Amortization of acquired below-market leases, net | 88 | 31 | 57 | ||||||||||||||
| Straight-lining of rents | 4,299 | 5,585 | (1,286) | ||||||||||||||
| Total rental revenues | 404,755 | 324,299 | 80,456 | ||||||||||||||
| Fee and other income: | |||||||||||||||||
| BMS cleaning fees | 36,476 | 38,497 | (2,021) | ||||||||||||||
| Management and leasing fees | 3,030 | 3,205 | (175) | ||||||||||||||
| Other income | 17,318 | 10,205 | 7,113 | ||||||||||||||
| Total revenues | 461,579 | 376,206 | 85,373 | ||||||||||||||
| Operating expenses | (224,740) | (183,640) | (41,100) | ||||||||||||||
| Depreciation and amortization | (116,155) | (92,365) | (23,790) | ||||||||||||||
| General and administrative | (38,597) | (13,415) | (25,182) | ||||||||||||||
| Income from deferred compensation plan liability | 1,089 | — | 1,089 | ||||||||||||||
| Transaction related costs and other | (43) | — | (43) | ||||||||||||||
| Total expenses | (378,446) | (289,420) | (89,026) | ||||||||||||||
| Income from partially owned entities | 96,977 | 94,276 | 2,701 | ||||||||||||||
| Interest and other investment income, net | 8,261 | 3,474 | 4,787 | ||||||||||||||
| Expense from deferred compensation plan assets | (1,089) | — | (1,089) | ||||||||||||||
| Interest and debt expense | (95,816) | (50,394) | (45,422) | ||||||||||||||
| Net gains on disposition of wholly owned and partially owned assets | 15,551 | 1,975 | 13,576 | ||||||||||||||
| Income (loss) before income taxes | 107,017 | 136,117 | (29,100) | ||||||||||||||
| Income tax expense | (7,193) | (1,302) | (5,891) | ||||||||||||||
| Net income (loss) | 99,824 | 134,815 | (34,991) | ||||||||||||||
| Less net loss attributable to noncontrolling interests in consolidated subsidiaries | 10,433 | 9,160 | 1,273 | ||||||||||||||
| Net income (loss) attributable to Vornado Realty L.P. | 110,257 | $ | 143,975 | $ | (33,718) | ||||||||||||
| Less net income attributable to noncontrolling interests in the Operating Partnership | (7,860) | ||||||||||||||||
| Preferred unit distributions | (15,555) | ||||||||||||||||
| Net income attributable to common shareholders | $ | 86,842 | |||||||||||||||
| For the three months ended March 31, 2024 | |||||||||||||||||
| Net income (loss) attributable to Vornado Realty L.P. | $ | 5,709 | $ | 59,917 | $ | (54,208) | |||||||||||
| Net loss attributable to common shareholders | $ | (9,034) | |||||||||||||||
| NET OPERATING INCOME AT SHARE AND NET OPERATING INCOME AT SHARE - CASH BASIS BY SEGMENT (NON-GAAP) (unaudited) | |||||||||||||||||||||||||||||||||||||||||||||||||||||||||||
| (Amounts in thousands) | |||||||||||||||||||||||||||||||||||||||||||||||||||||||||||
| For the Three Months Ended March 31, 2025 | |||||||||||||||||
| Total | New York | Other | |||||||||||||||
| Total revenues | $ | 461,579 | $ | 376,206 | $ | 85,373 | |||||||||||
| Operating expenses | (224,740) | (183,640) | (41,100) | ||||||||||||||
| NOI - consolidated | 236,839 | 192,566 | 44,273 | ||||||||||||||
| Deduct: NOI attributable to noncontrolling interests in consolidated subsidiaries | (10,660) | (3,347) | (7,313) | ||||||||||||||
| Add: Our share of NOI from partially owned entities | 67,111 | 64,098 | 3,013 | ||||||||||||||
| NOI at share | 293,290 | 253,317 | 39,973 | ||||||||||||||
| Non-cash adjustments for straight-line rents, amortization of acquired below-market leases, net, and other | (23,919) | (25,747) | 1,828 | ||||||||||||||
| NOI at share - cash basis | $ | 269,371 | $ | 227,570 | $ | 41,801 | |||||||||||
| For the Three Months Ended March 31, 2024 | |||||||||||||||||
| Total | New York | Other | |||||||||||||||
| Total revenues | $ | 436,375 | $ | 358,234 | $ | 78,141 | |||||||||||
| Operating expenses | (226,224) | (188,278) | (37,946) | ||||||||||||||
| NOI - consolidated | 210,151 | 169,956 | 40,195 | ||||||||||||||
| Deduct: NOI attributable to noncontrolling interests in consolidated subsidiaries | (11,396) | (4,536) | (6,860) | ||||||||||||||
| Add: Our share of NOI from partially owned entities | 70,369 | 67,709 | 2,660 | ||||||||||||||
| NOI at share | 269,124 | 233,129 | 35,995 | ||||||||||||||
| Non-cash adjustments for straight-line rents, amortization of acquired below-market leases, net, and other | (1,511) | (2,335) | 824 | ||||||||||||||
| NOI at share - cash basis | $ | 267,613 | $ | 230,794 | $ | 36,819 | |||||||||||
| For the Three Months Ended December 31, 2024 | |||||||||||||||||
| Total | New York | Other | |||||||||||||||
| Total revenues | $ | 457,790 | $ | 383,702 | $ | 74,088 | |||||||||||
| Operating expenses | (236,043) | (194,195) | (41,848) | ||||||||||||||
| NOI - consolidated | 221,747 | 189,507 | 32,240 | ||||||||||||||
| Deduct: NOI attributable to noncontrolling interests in consolidated subsidiaries | (10,051) | (3,644) | (6,407) | ||||||||||||||
| Add: Our share of NOI from partially owned entities | 73,270 | 71,177 | 2,093 | ||||||||||||||
| NOI at share | 284,966 | 257,040 | 27,926 | ||||||||||||||
| Non-cash adjustments for straight-line rents, amortization of acquired below-market leases, net, and other | (8,378) | (15,107) | 6,729 | ||||||||||||||
| NOI at share - cash basis | $ | 276,588 | $ | 241,933 | $ | 34,655 | |||||||||||
| NET OPERATING INCOME AT SHARE AND NET OPERATING INCOME AT SHARE - CASH BASIS BY SEGMENT AND SUBSEGMENT (NON-GAAP) (unaudited) | |||||||||||||||||||||||||||||||||||||||||||||||||||||||||||
| (Amounts in thousands) | |||||||||||||||||||||||||||||||||||||||||||||||||||||||||||
| For the Three Months Ended | |||||||||||||||||
| March 31, | December 31, 2024 | ||||||||||||||||
| 2025 | 2024 | ||||||||||||||||
| NOI at share: | |||||||||||||||||
| New York: | |||||||||||||||||
Office(1) |
$ | 191,501 | $ | 167,988 | $ | 193,215 | |||||||||||
| Retail | 46,115 | 47,466 | 48,238 | ||||||||||||||
| Residential | 6,192 | 5,968 | 6,072 | ||||||||||||||
| Alexander’s | 9,509 | 11,707 | 9,515 | ||||||||||||||
| Total New York | 253,317 | 233,129 | 257,040 | ||||||||||||||
| Other: | |||||||||||||||||
THE MART(2) |
15,916 | 14,486 | 6,168 | ||||||||||||||
| 555 California Street | 17,843 | 16,529 | 15,854 | ||||||||||||||
| Other investments | 6,214 | 4,980 | 5,904 | ||||||||||||||
| Total Other | 39,973 | 35,995 | 27,926 | ||||||||||||||
| NOI at share | $ | 293,290 | $ | 269,124 | $ | 284,966 | |||||||||||
| NOI at share - cash basis: | |||||||||||||||||
| New York: | |||||||||||||||||
Office(1) |
$ | 167,457 | $ | 166,370 | $ | 181,438 | |||||||||||
| Retail | 43,727 | 43,873 | 44,130 | ||||||||||||||
| Residential | 5,848 | 5,690 | 5,750 | ||||||||||||||
| Alexander's | 10,538 | 14,861 | 10,615 | ||||||||||||||
| Total New York | 227,570 | 230,794 | 241,933 | ||||||||||||||
| Other: | |||||||||||||||||
| THE MART | 17,517 | 14,949 | 10,550 | ||||||||||||||
| 555 California Street | 18,137 | 16,938 | 18,138 | ||||||||||||||
| Other investments | 6,147 | 4,932 | 5,967 | ||||||||||||||
| Total Other | 41,801 | 36,819 | 34,655 | ||||||||||||||
| NOI at share - cash basis | $ | 269,371 | $ | 267,613 | $ | 276,588 | |||||||||||
| SAME STORE NOI AT SHARE AND SAME STORE NOI AT SHARE - CASH BASIS (NON-GAAP) (unaudited) | ||||||||||||||||||||
| Total | New York | THE MART(3) |
555 California Street | |||||||||||||||||||||||
Same store NOI at share % increase (decrease)(1): |
||||||||||||||||||||||||||
| Three months ended March 31, 2025 compared to March 31, 2024 | 3.5 | % | 3.0 | % | (2) | 9.7 | % | 5.2 | % | |||||||||||||||||
| Three months ended March 31, 2025 compared to December 31, 2024 | (1.5) | % | (6.3) | % | (2) | 160.8 | % | 10.5 | % | |||||||||||||||||
Same store NOI at share - cash basis % increase (decrease)(1): |
||||||||||||||||||||||||||
| Three months ended March 31, 2025 compared to March 31, 2024 | 0.9 | % | (0.7) | % | 16.7 | % | 7.1 | % | ||||||||||||||||||
| Three months ended March 31, 2025 compared to December 31, 2024 | (1.5) | % | (4.8) | % | 66.9 | % | 0.8 | % | ||||||||||||||||||
| DEVELOPMENT/REDEVELOPMENT - ACTIVE PROJECTS AND FUTURE OPPORTUNITIES | ||||||||||||||||||||||||||||||||||||||||||||
| (Amounts in thousands, except square feet) | ||||||||||||||||||||||||||||||||||||||||||||
| (at Vornado’s share) | Projected Incremental Cash Yield |
|||||||||||||||||||||||||||||||||||||||||||
|
Active Development Projects:
New York segment:
|
Property Rentable Sq. Ft. |
Budget | Cash Amount Expended |
Remaining Expenditures | Stabilization Year |
|||||||||||||||||||||||||||||||||||||||
| PENN District: | ||||||||||||||||||||||||||||||||||||||||||||
| PENN 2 | 1,815,000 | $ | 750,000 | $ | 708,267 | $ | 41,733 | 2026 | 10.2% | |||||||||||||||||||||||||||||||||||
| Districtwide Improvements | N/A | 100,000 | 75,189 | 24,811 | N/A | N/A | ||||||||||||||||||||||||||||||||||||||
| Total PENN District | 850,000 | (1) |
783,456 | 66,544 | ||||||||||||||||||||||||||||||||||||||||
Sunset Pier 94 Studios (49.9% interest)(2) |
266,000 | 125,000 | (3) |
66,551 | 58,449 | 2026 | 10.3% | |||||||||||||||||||||||||||||||||||||
| Total Active Development Projects | $ | 975,000 | $ | 850,007 | $ | 124,993 | ||||||||||||||||||||||||||||||||||||||
|
Future Opportunities:
New York segment:
|
Zoning Sq. Ft. | |||||||||||||||||||||||||||||||||||||||||||
| PENN District: | ||||||||||||||||||||||||||||||||||||||||||||
| Hotel Pennsylvania site (PENN 15) | 2,052,000 | |||||||||||||||||||||||||||||||||||||||||||
| Eighth Avenue and 34th Street land | 105,000 | |||||||||||||||||||||||||||||||||||||||||||
| Multiple other opportunities - office/residential/retail | ||||||||||||||||||||||||||||||||||||||||||||
| Total PENN District | 2,157,000 | |||||||||||||||||||||||||||||||||||||||||||
350 Park Avenue assemblage (the “350 Park Site”)(4) |
1,389,000 | |||||||||||||||||||||||||||||||||||||||||||
260 Eleventh Avenue - office(2) |
280,000 | |||||||||||||||||||||||||||||||||||||||||||
| 57th Street land (50% interest) | 150,000 | |||||||||||||||||||||||||||||||||||||||||||
| Other segment: | ||||||||||||||||||||||||||||||||||||||||||||
| 527 West Kinzie land, Chicago | 330,000 | |||||||||||||||||||||||||||||||||||||||||||
| Total Future Opportunities | 4,306,000 | |||||||||||||||||||||||||||||||||||||||||||
| LEASING ACTIVITY (unaudited) | ||
| (Square feet in thousands) | ||
| New York | 555 California Street |
|||||||||||||||||||||||||
| Office | Retail | THE MART | ||||||||||||||||||||||||
| Three Months Ended March 31, 2025 | ||||||||||||||||||||||||||
| Total square feet leased | 709 | 25 | 83 | 222 | ||||||||||||||||||||||
| Our share of square feet leased: | 685 | 18 | 83 | 155 | ||||||||||||||||||||||
Initial rent(1) |
$ | 95.53 | $ | 222.20 | $ | 51.33 | $ | 120.65 | ||||||||||||||||||
| Weighted average lease term (years) | 14.7 | 14.3 | 8.0 | 13.1 | ||||||||||||||||||||||
| Second generation relet space: | ||||||||||||||||||||||||||
| Square feet | 254 | 10 | 42 | 155 | ||||||||||||||||||||||
| GAAP basis: | ||||||||||||||||||||||||||
Straight-line rent(2) |
$ | 80.23 | $ | 139.99 | $ | 51.80 | $ | 132.08 | ||||||||||||||||||
| Prior straight-line rent | $ | 73.25 | $ | 108.59 | $ | 54.68 | $ | 110.28 | ||||||||||||||||||
| Percentage increase (decrease) | 9.5 | % | 28.9 | % | (5.3) | % | 19.8 | % | ||||||||||||||||||
| Cash basis (non-GAAP): | ||||||||||||||||||||||||||
Initial rent(1) |
$ | 84.72 | $ | 139.40 | $ | 51.67 | $ | 121.04 | ||||||||||||||||||
| Prior escalated rent | $ | 79.56 | $ | 112.57 | $ | 60.43 | $ | 117.37 | ||||||||||||||||||
| Percentage increase (decrease) | 6.5 | % | 23.8 | % | (14.5) | % | 3.1 | % | ||||||||||||||||||
| Tenant improvements and leasing commissions: | ||||||||||||||||||||||||||
| Per square foot | $ | 168.88 | $ | 377.61 | $ | 90.82 | $ | 229.71 | ||||||||||||||||||
| Per square foot per annum | $ | 11.49 | $ | 26.41 | $ | 11.35 | $ | 17.54 | ||||||||||||||||||
| Percentage of initial rent | 12.0 | % | 11.9 | % | 22.1 | % | 14.5 | % | ||||||||||||||||||
| LEASE EXPIRATIONS (unaudited) NEW YORK SEGMENT | |||||||||||||||||||||||||||||
| Period of Lease Expiration |
Our Share of
Square Feet
of Expiring
Leases(1)
|
Annualized Escalated Rents of Expiring Leases |
Percentage of Annualized Escalated Rent |
||||||||||||||||||||||||||
| Total | Per Sq. Ft. | ||||||||||||||||||||||||||||
| Office: | First Quarter 2025(2) |
26,000 | $ | 1,883,000 | $ | 72.42 | 0.1 | % | |||||||||||||||||||||
| Second Quarter 2025 | 282,000 | 21,362,000 | 75.75 | 1.7 | % | ||||||||||||||||||||||||
| Third Quarter 2025 | 64,000 | 3,618,000 | 56.53 | 0.3 | % | ||||||||||||||||||||||||
| Fourth Quarter 2025 | 49,000 | 4,123,000 | 84.14 | 0.3 | % | ||||||||||||||||||||||||
| Remaining 2025 | 395,000 | 29,103,000 | 73.68 | 2.3 | % | ||||||||||||||||||||||||
| First Quarter 2026 | 118,000 | 11,276,000 | 95.56 | 0.9 | % | ||||||||||||||||||||||||
| Remaining 2026 | 950,000 | 78,729,000 | 82.87 | 6.3 | % | ||||||||||||||||||||||||
| 2027 | 1,357,000 | 108,759,000 | 80.15 | 8.7 | % | ||||||||||||||||||||||||
| 2028 | 1,082,000 | 88,213,000 | 81.53 | 7.0 | % | ||||||||||||||||||||||||
| 2029 | 1,289,000 | 106,397,000 | 82.54 | 8.5 | % | ||||||||||||||||||||||||
| 2030 | 713,000 | 60,526,000 | 84.89 | 4.8 | % | ||||||||||||||||||||||||
| 2031 | 783,000 | 71,186,000 | 90.91 | 5.7 | % | ||||||||||||||||||||||||
| 2032 | 1,039,000 | 101,715,000 | 97.90 | 8.1 | % | ||||||||||||||||||||||||
| 2033 | 548,000 | 47,660,000 | 86.97 | 3.8 | % | ||||||||||||||||||||||||
| 2034 | 748,000 | 78,753,000 | 105.28 | 6.3 | % | ||||||||||||||||||||||||
| 2035 | 970,000 | 76,821,000 | 79.20 | 6.1 | % | ||||||||||||||||||||||||
| Thereafter | 4,500,000 | (3) |
395,657,000 | 87.92 | 31.4 | % | |||||||||||||||||||||||
| Retail: | First Quarter 2025(2) |
— | $ | — | $ | — | 0.0 | % | |||||||||||||||||||||
| Second Quarter 2025 | 120,000 | 7,533,000 | 62.78 | 2.8 | % | ||||||||||||||||||||||||
| Third Quarter 2025 | 11,000 | 2,137,000 | 194.27 | 0.8 | % | ||||||||||||||||||||||||
| Fourth Quarter 2025 | 52,000 | 3,568,000 | 68.62 | 1.3 | % | ||||||||||||||||||||||||
| Remaining 2025 | 183,000 | 13,238,000 | 72.34 | 4.9 | % | ||||||||||||||||||||||||
| First Quarter 2026 | 17,000 | 6,756,000 | 397.41 | 2.6 | % | ||||||||||||||||||||||||
| Remaining 2026 | 4,000 | 3,794,000 | 948.50 | 1.4 | % | ||||||||||||||||||||||||
| 2027 | 52,000 | 22,313,000 | 429.10 | 8.4 | % | ||||||||||||||||||||||||
| 2028 | 26,000 | 10,359,000 | 398.42 | 3.9 | % | ||||||||||||||||||||||||
| 2029 | 53,000 | 23,578,000 | 444.87 | 8.9 | % | ||||||||||||||||||||||||
| 2030 | 146,000 | 24,540,000 | 168.08 | 9.3 | % | ||||||||||||||||||||||||
| 2031 | 68,000 | 30,987,000 | 455.69 | 11.7 | % | ||||||||||||||||||||||||
| 2032 | 52,000 | 29,710,000 | 571.35 | 11.2 | % | ||||||||||||||||||||||||
| 2033 | 39,000 | 12,718,000 | 326.10 | 4.8 | % | ||||||||||||||||||||||||
| 2034 | 147,000 | 20,598,000 | 140.12 | 7.8 | % | ||||||||||||||||||||||||
| 2035 | 33,000 | 11,693,000 | 354.33 | 4.4 | % | ||||||||||||||||||||||||
| Thereafter | 436,000 | 54,550,000 | 125.11 | 20.7 | % | ||||||||||||||||||||||||
| LEASE EXPIRATIONS (unaudited) THE MART | |||||||||||||||||||||||||||||
| Period of Lease Expiration |
Our Share of
Square Feet
of Expiring
Leases(1)
|
Annualized Escalated Rents of Expiring Leases |
Percentage of Annualized Escalated Rent |
||||||||||||||||||||||||||
| Total | Per Sq. Ft. | ||||||||||||||||||||||||||||
| Office / Showroom / Retail: | First Quarter 2025(2) |
6,000 | $ | 487,000 | $ | 81.17 | 0.3 | % | |||||||||||||||||||||
| Second Quarter 2025 | 22,000 | 1,562,000 | 71.00 | 1.0 | % | ||||||||||||||||||||||||
| Third Quarter 2025 | 31,000 | 1,771,000 | 57.13 | 1.2 | % | ||||||||||||||||||||||||
| Fourth Quarter 2025 | 38,000 | 2,428,000 | 63.89 | 1.6 | % | ||||||||||||||||||||||||
| Remaining 2025 | 91,000 | 5,761,000 | 63.31 | 3.8 | % | ||||||||||||||||||||||||
| First Quarter 2026 | 32,000 | 2,261,000 | 70.66 | 1.5 | % | ||||||||||||||||||||||||
| Remaining 2026 | 252,000 | 15,016,000 | 59.59 | 9.9 | % | ||||||||||||||||||||||||
| 2027 | 199,000 | 11,593,000 | 58.26 | 7.6 | % | ||||||||||||||||||||||||
| 2028 | 712,000 | 37,725,000 | 52.98 | 24.8 | % | ||||||||||||||||||||||||
| 2029 | 187,000 | 10,595,000 | 56.66 | 7.0 | % | ||||||||||||||||||||||||
| 2030 | 94,000 | 5,575,000 | 59.31 | 3.7 | % | ||||||||||||||||||||||||
| 2031 | 227,000 | 11,904,000 | 52.44 | 7.8 | % | ||||||||||||||||||||||||
| 2032 | 508,000 | 25,426,000 | 50.05 | 16.7 | % | ||||||||||||||||||||||||
| 2033 | 54,000 | 2,807,000 | 51.98 | 1.8 | % | ||||||||||||||||||||||||
| 2034 | 51,000 | 2,652,000 | 52.00 | 1.7 | % | ||||||||||||||||||||||||
| 2035 | 48,000 | 2,555,000 | 53.23 | 1.7 | % | ||||||||||||||||||||||||
| Thereafter | 376,000 | 17,762,000 | 47.24 | 11.7 | % | ||||||||||||||||||||||||
| LEASE EXPIRATIONS (unaudited) 555 California Street | |||||||||||||||||||||||||||||
| Period of Lease Expiration |
Our Share of
Square Feet
of Expiring
Leases(1)
|
Annualized Escalated Rents of Expiring Leases |
Percentage of Annualized Escalated Rent |
||||||||||||||||||||||||||
| Total | Per Sq. Ft. | ||||||||||||||||||||||||||||
| Office / Retail: | First Quarter 2025(2) |
— | $ | — | $ | — | 0.0 | % | |||||||||||||||||||||
| Second Quarter 2025 | 10,000 | 1,141,000 | 114.10 | 1.0 | % | ||||||||||||||||||||||||
| Third Quarter 2025 | 81,000 | 7,364,000 | 90.91 | 6.5 | % | ||||||||||||||||||||||||
| Fourth Quarter 2025 | 32,000 | 3,274,000 | 102.31 | 2.9 | % | ||||||||||||||||||||||||
| Remaining 2025 | 123,000 | 11,779,000 | 95.76 | 10.4 | % | ||||||||||||||||||||||||
| First Quarter 2026 | 100,000 | 8,976,000 | 89.76 | 7.9 | % | ||||||||||||||||||||||||
| Remaining 2026 | 60,000 | 6,847,000 | 114.12 | 6.1 | % | ||||||||||||||||||||||||
| 2027 | 86,000 | 8,241,000 | 95.83 | 7.3 | % | ||||||||||||||||||||||||
| 2028 | 112,000 | 10,940,000 | 97.68 | 9.7 | % | ||||||||||||||||||||||||
| 2029 | 143,000 | 15,458,000 | 108.10 | 13.7 | % | ||||||||||||||||||||||||
| 2030 | 85,000 | 8,079,000 | 95.05 | 7.1 | % | ||||||||||||||||||||||||
| 2031 | 29,000 | 2,210,000 | 76.21 | 2.0 | % | ||||||||||||||||||||||||
| 2032 | 13,000 | 1,423,000 | 109.46 | 1.3 | % | ||||||||||||||||||||||||
| 2033 | 15,000 | 1,815,000 | 121.00 | 1.6 | % | ||||||||||||||||||||||||
| 2034 | — | — | — | 0.0 | % | ||||||||||||||||||||||||
| 2035 | 210,000 | 18,530,000 | 88.24 | 16.4 | % | ||||||||||||||||||||||||
| Thereafter | 177,000 | 18,813,000 | 106.29 | 16.5 | % | ||||||||||||||||||||||||
| CAPITAL EXPENDITURES, TENANT IMPROVEMENTS AND LEASING COMMISSIONS (unaudited) | ||||||||||||||||||||||||||||||||
| CONSOLIDATED | ||||||||||||||||||||||||||||||||
| (Amounts in thousands) | ||||||||||||||||||||||||||||||||
| For the Three Months Ended March 31, 2025 | ||||||||||||||||||||||||||||||||
| Total Company | New York | THE MART | 555 California Street | Other | ||||||||||||||||||||||||||||
| Capital expenditures: | ||||||||||||||||||||||||||||||||
| Expenditures to maintain assets | $ | 12,114 | $ | 9,203 | $ | 2,278 | $ | 616 | $ | 17 | ||||||||||||||||||||||
| Tenant improvements | 15,933 | 11,889 | 4,044 | — | — | |||||||||||||||||||||||||||
| Leasing commissions | 13,132 | 7,222 | 296 | 5,614 | — | |||||||||||||||||||||||||||
| Recurring tenant improvements, leasing commissions and other capital expenditures | 41,179 | 28,314 | 6,618 | 6,230 | 17 | |||||||||||||||||||||||||||
Non-recurring capital expenditures(1) |
14,168 | 6,544 | 7,565 | — | 59 | |||||||||||||||||||||||||||
| Total capital expenditures and leasing commissions | $ | 55,347 | $ | 34,858 | $ | 14,183 | $ | 6,230 | $ | 76 | ||||||||||||||||||||||
Development and redevelopment expenditures(2): |
||||||||||||||||||||||||||||||||
| PENN 2 | $ | 23,575 | $ | 23,575 | $ | — | $ | — | $ | — | ||||||||||||||||||||||
| Hotel Pennsylvania site (PENN 15) | 4,830 | 4,830 | — | — | — | |||||||||||||||||||||||||||
| PENN Districtwide improvements | 4,375 | 4,375 | — | — | — | |||||||||||||||||||||||||||
| Other | 8,154 | 7,895 | — | — | 259 | |||||||||||||||||||||||||||
| $ | 40,934 | $ | 40,675 | $ | — | $ | — | $ | 259 | |||||||||||||||||||||||
| UNCONSOLIDATED JOINT VENTURES (unaudited) | ||||||||||||||||||||||||||||||||||||||||||||||||||
| (Amounts in thousands) | ||||||||||||||||||||||||||||||||||||||||||||||||||
| As of March 31, 2025 | ||||||||||||||||||||||||||||||||||||||||||||||||||
| Joint Venture Name | Asset Category |
Percentage Ownership | Company's Carrying Amount |
Company's
Pro rata
Share of Debt(1)
|
100% of
Joint Venture Debt(1)
|
Maturity Date(2) |
Spread over SOFR | Interest Rate(3) |
||||||||||||||||||||||||||||||||||||||||||
| Fifth Avenue and Times Square JV | Retail/Office | 51.5% | $ | 1,965,973 | $ | 364,863 | $ | 751,136 | Various | Various | Various | |||||||||||||||||||||||||||||||||||||||
| Alexander's | Office/Retail | 32.4% | 64,677 | 322,624 | 995,754 | Various | Various | Various | ||||||||||||||||||||||||||||||||||||||||||
| Partially owned office buildings/land: | ||||||||||||||||||||||||||||||||||||||||||||||||||
| 280 Park Avenue | Office/Retail | 50.0% | 107,049 | 537,500 | 1,075,000 | 09/27 | N/A | 5.84% | ||||||||||||||||||||||||||||||||||||||||||
| West 57th Street properties | Office/Retail/Land | 50.0% | 42,371 | — | — | N/A | N/A | N/A | ||||||||||||||||||||||||||||||||||||||||||
| 512 West 22nd Street | Office/Retail | 55.0% | 29,571 | 68,581 | 124,693 | 06/25 | S+235 | 6.67% | ||||||||||||||||||||||||||||||||||||||||||
| 825 Seventh Avenue | Office | 50.0% | 6,318 | 27,000 | 54,000 | 01/26 | S+275 | 7.07% | ||||||||||||||||||||||||||||||||||||||||||
| 61 Ninth Avenue | Office/Retail | 45.1% | 649 | 75,543 | 167,500 | 01/26 | S+146 | 5.79% | ||||||||||||||||||||||||||||||||||||||||||
| 650 Madison Avenue | Office/Retail | 20.1% | — | 161,024 | 800,000 | 12/29 | N/A | 3.49% | ||||||||||||||||||||||||||||||||||||||||||
| Other investments: | ||||||||||||||||||||||||||||||||||||||||||||||||||
| Sunset Pier 94 Studios | Studio Campus | 49.9% | 86,914 | 30,164 | 60,449 | 09/26 | S+476 | 9.08% | ||||||||||||||||||||||||||||||||||||||||||
| Independence Plaza | Residential/Retail | 50.1% | 62,628 | 338,175 | 675,000 | 07/25 | N/A | 4.25% | ||||||||||||||||||||||||||||||||||||||||||
| Rosslyn Plaza | Office/Residential | 43.7% to 50.4% | 35,230 | 12,603 | 25,000 | 04/26 | S+200 | 6.32% | ||||||||||||||||||||||||||||||||||||||||||
| Other | Various | Various | 19,903 | 78,152 | 573,404 | Various | Various | Various | ||||||||||||||||||||||||||||||||||||||||||
| $ | 2,421,283 | $ | 2,016,229 | $ | 5,301,936 | |||||||||||||||||||||||||||||||||||||||||||||
Investments in partially owned entities included in other liabilities(4): |
||||||||||||||||||||||||||||||||||||||||||||||||||
| 7 West 34th Street | Office/Retail | 53.0% | $ | (67,656) | $ | 159,000 | $ | 300,000 | 06/26 | N/A | 3.65% | |||||||||||||||||||||||||||||||||||||||
| 85 Tenth Avenue | Office/Retail | 49.9% | (20,939) | 311,875 | 625,000 | 12/26 | N/A | 4.55% | ||||||||||||||||||||||||||||||||||||||||||
| $ | (88,595) | $ | 470,875 | $ | 925,000 | |||||||||||||||||||||||||||||||||||||||||||||
| UNCONSOLIDATED JOINT VENTURES (unaudited) | |||||||||||||||||||||||||||||
| (Amounts in thousands) | |||||||||||||||||||||||||||||
| Percentage Ownership at March 31, 2025 |
Our Share of Net Income (Loss) for the
Three Months Ended March 31,
|
Our Share of NOI (non-GAAP) for the Three Months Ended March 31, | |||||||||||||||||||||||||||
| 2025 | 2024 | 2025 | 2024 | ||||||||||||||||||||||||||
| Joint Venture Name | |||||||||||||||||||||||||||||
| New York: | |||||||||||||||||||||||||||||
| Fifth Avenue and Times Square JV: | |||||||||||||||||||||||||||||
| Equity in net income | 51.5% | $ | 5,837 | $ | 9,291 | $ | 23,577 | $ | 28,102 | ||||||||||||||||||||
| Return on preferred equity, net of our share of the expense | 8,543 | 9,328 | — | — | |||||||||||||||||||||||||
| Net gain on sale | 76,162 | (1) |
— | — | — | ||||||||||||||||||||||||
| 90,542 | 18,619 | 23,577 | 28,102 | ||||||||||||||||||||||||||
| 280 Park Avenue | 50.0% | (4,469) | (8,042) | 8,294 | 8,340 | ||||||||||||||||||||||||
| Alexander's | 32.4% | 3,923 | 5,154 | 9,509 | 11,707 | ||||||||||||||||||||||||
| 7 West 34th Street | 53.0% | 2,979 | 1,139 | 5,852 | 3,623 | ||||||||||||||||||||||||
| 85 Tenth Avenue | 49.9% | (1,962) | (2,522) | 3,493 | 3,075 | ||||||||||||||||||||||||
| Independence Plaza | 50.1% | 1,011 | (427) | 6,192 | 5,169 | ||||||||||||||||||||||||
| West 57th Street properties | 50.0% | (183) | (200) | 18 | (7) | ||||||||||||||||||||||||
| 512 West 22nd Street | 55.0% | (124) | (529) | 1,871 | 1,664 | ||||||||||||||||||||||||
| 61 Ninth Avenue | 45.1% | 59 | (80) | 1,944 | 1,908 | ||||||||||||||||||||||||
| Other, net | Various | 2,500 | 2,119 | 3,348 | 4,128 | ||||||||||||||||||||||||
| 94,276 | 15,231 | 64,098 | 67,709 | ||||||||||||||||||||||||||
| Other: | |||||||||||||||||||||||||||||
| Alexander's corporate fee income | 32.4% | 1,633 | 1,180 | 1,010 | 658 | ||||||||||||||||||||||||
| Rosslyn Plaza | 43.7% to 50.4% | (44) | (105) | 439 | 523 | ||||||||||||||||||||||||
| Other, net | Various | 1,112 | (27) | 1,564 | 1,479 | ||||||||||||||||||||||||
| 2,701 | 1,048 | 3,013 | 2,660 | ||||||||||||||||||||||||||
| Total | $ | 96,977 | $ | 16,279 | $ | 67,111 | $ | 70,369 | |||||||||||||||||||||
| CAPITAL STRUCTURE (unaudited) | ||||||||||||||||||||
| (Amounts in thousands, except per share and per unit amounts) | ||||||||||||||||||||
| As of March 31, 2025 | ||||||||||||||||||||
| Debt (contractual balances): | ||||||||||||||||||||
Consolidated debt(1): |
||||||||||||||||||||
| Mortgages payable | $ | 5,702,807 | ||||||||||||||||||
| Senior unsecured notes | 750,000 | |||||||||||||||||||
| $800 Million unsecured term loan | 800,000 | |||||||||||||||||||
| $2.2 Billion unsecured revolving credit facilities | 575,000 | |||||||||||||||||||
| 7,827,807 | ||||||||||||||||||||
| Pro rata share of debt of non-consolidated entities | 2,487,104 | |||||||||||||||||||
| Less: Noncontrolling interests' share of consolidated debt (primarily 1290 Avenue of the Americas and 555 California Street) | (682,059) | |||||||||||||||||||
| 9,632,852 | (A) | |||||||||||||||||||
| Shares/Units | Liquidation Preference | |||||||||||||||||||
| Perpetual Preferred: | ||||||||||||||||||||
| 3.25% preferred units (D-17) (141,400 units @ $25.00 per unit) | 3,535 | |||||||||||||||||||
| 5.40% Series L preferred shares | 12,000 | $ | 25.00 | 300,000 | ||||||||||||||||
| 5.25% Series M preferred shares | 12,780 | 25.00 | 319,500 | |||||||||||||||||
| 5.25% Series N preferred shares | 12,000 | 25.00 | 300,000 | |||||||||||||||||
| 4.45% Series O preferred shares | 12,000 | 25.00 | 300,000 | |||||||||||||||||
| 1,223,035 | (B) | |||||||||||||||||||
|
Converted
Shares(2)
|
March 31, 2025 Common Share Price | |||||||||||||||||||
| Equity: | ||||||||||||||||||||
| Common shares | 191,949 | $ | 36.99 | 7,100,194 | ||||||||||||||||
| Redeemable Class A units and LTIP Unit awards | 16,745 | 36.99 | 619,398 | |||||||||||||||||
| Convertible share equivalents: | ||||||||||||||||||||
| Series D-13 preferred units | 1,262 | 36.99 | 46,681 | |||||||||||||||||
| Series G-1 through G-4 preferred units | 76 | 36.99 | 2,811 | |||||||||||||||||
Series A preferred shares |
18 | 36.99 | 666 | |||||||||||||||||
| 210,050 | 7,769,750 | (C) | ||||||||||||||||||
| Total Market Capitalization (A+B+C) | $ | 18,625,637 | ||||||||||||||||||
| COMMON SHARES DATA (NYSE: VNO) (unaudited) | ||
| First Quarter | Fourth Quarter | Third Quarter | Second Quarter | ||||||||||||||||||||
| 2025 | 2024 | 2024 | 2024 | ||||||||||||||||||||
| High price | $ | 45.37 | $ | 46.63 | $ | 39.91 | $ | 30.02 | |||||||||||||||
| Low price | $ | 34.91 | $ | 37.88 | $ | 25.36 | $ | 22.42 | |||||||||||||||
| Closing price - end of quarter | $ | 36.99 | $ | 42.04 | $ | 39.40 | $ | 26.29 | |||||||||||||||
| Outstanding shares, Class A units and convertible preferred units as converted (in thousands) | 210,050 | 208,897 | 208,949 | 209,573 | |||||||||||||||||||
| Closing market value of outstanding shares, Class A units and convertible preferred units as converted | $ | 7.8 | Billion | $ | 8.8 | Billion | $ | 8.2 | Billion | $ | 5.5 | Billion | |||||||||||
| DEBT ANALYSIS (unaudited) | |||||||||||||||||||||||||||||||||||
| (Amounts in thousands) | |||||||||||||||||||||||||||||||||||
| As of March 31, 2025 | |||||||||||||||||||||||||||||||||||
| Total | Variable | Fixed(1) |
|||||||||||||||||||||||||||||||||
| (Contractual debt balances) | Amount | Weighted Average Interest Rate | Amount | Weighted Average Interest Rate | Amount | Weighted Average Interest Rate | |||||||||||||||||||||||||||||
Consolidated debt(2) |
$ | 7,827,807 | 4.61% | $ | 1,307,807 | 5.92%(3) |
$ | 6,520,000 | 4.34% | ||||||||||||||||||||||||||
| Pro rata share of debt of non-consolidated entities | 2,487,104 | 5.13% | 458,282 | 6.39% | 2,028,822 | 4.85% | |||||||||||||||||||||||||||||
| Total | 10,314,911 | 4.73% | 1,766,089 | 6.04% | 8,548,822 | 4.46% | |||||||||||||||||||||||||||||
| Less: Noncontrolling interests' share of consolidated debt (primarily 1290 Avenue of the Americas and 555 California Street) | (682,059) | (397,059) | (285,000) | ||||||||||||||||||||||||||||||||
| Company's pro rata share of total debt | $ | 9,632,852 | 4.73% | $ | 1,369,030 | 5.95% | $ | 8,263,822 | 4.53% | ||||||||||||||||||||||||||
| Senior Unsecured Notes Due 2026 and 2031 |
Unsecured Revolving Credit Facilities and Unsecured Term Loan | ||||||||||||||||||||||||||||||||||
Debt Covenant Ratios(4): |
Required | Actual | Required | Actual | |||||||||||||||||||||||||||||||
| Total outstanding debt/total assets | Less than 65% | 48% | (5) |
Less than 60% | 39% | (6) |
|||||||||||||||||||||||||||||
| Secured debt/total assets | Less than 50% | 35% | (5) |
Less than 50% | 30% | (6) |
|||||||||||||||||||||||||||||
| Interest coverage ratio (annualized combined EBITDA to annualized interest expense) | Greater than 1.50 | 1.87 | N/A | ||||||||||||||||||||||||||||||||
| Fixed charge coverage | N/A | Greater than 1.40 | 1.96 | ||||||||||||||||||||||||||||||||
| Unencumbered assets/unsecured debt | Greater than 150% | 470% | N/A | ||||||||||||||||||||||||||||||||
| Unsecured debt/cap value of unencumbered assets | N/A | Less than 60% | 17% | ||||||||||||||||||||||||||||||||
| Unencumbered coverage ratio | N/A | Greater than 1.75 | 8.01 | ||||||||||||||||||||||||||||||||
Consolidated Unencumbered EBITDA (non-GAAP): |
Q1 2025 Annualized |
||||
| New York | $ | 313,860 | |||
| Other | 84,440 | ||||
| Total | $ | 398,300 | |||
| HEDGING INSTRUMENTS AS OF MARCH 31, 2025 (unaudited) | |||||||||||||||||||||||||||||||||||||||||||||||||||||||||||||||||
| (Amounts in thousands) | |||||||||||||||||||||||||||||||||||||||||||||||||||||||||||||||||
| Debt Information | Swap / Cap Information | ||||||||||||||||||||||||||||||||||||||||||||||||||||||||||||||||
| Balance at Share | Maturity Date(1) |
Variable Rate Spread | Notional Amount at Share | Expiration Date | All-In Swapped Rate | ||||||||||||||||||||||||||||||||||||||||||||||||||||||||||||
| Interest Rate Swaps: | |||||||||||||||||||||||||||||||||||||||||||||||||||||||||||||||||
| Consolidated: | |||||||||||||||||||||||||||||||||||||||||||||||||||||||||||||||||
| 555 California Street mortgage loan | $ | 840,000 | 05/28 | S+205 | $ | 840,000 | 05/26 | 6.03% | |||||||||||||||||||||||||||||||||||||||||||||||||||||||||
| 770 Broadway mortgage loan | 700,000 | 07/27 | S+225 | 700,000 | 07/27 | 4.98% | |||||||||||||||||||||||||||||||||||||||||||||||||||||||||||
| PENN 11 mortgage loan | 500,000 | 10/25 | S+206 | 500,000 | 10/25 | 6.28% | |||||||||||||||||||||||||||||||||||||||||||||||||||||||||||
| Unsecured revolving credit facility | 575,000 | 12/27 | S+115 | 575,000 | 08/27 | 3.88% | |||||||||||||||||||||||||||||||||||||||||||||||||||||||||||
| Unsecured term loan | 800,000 | 12/27 | S+130 | ||||||||||||||||||||||||||||||||||||||||||||||||||||||||||||||
| Through 07/25 | 700,000 | 07/25 | 4.53% | ||||||||||||||||||||||||||||||||||||||||||||||||||||||||||||||
| 07/25 through 10/26 | 550,000 | 10/26 | 4.36% | ||||||||||||||||||||||||||||||||||||||||||||||||||||||||||||||
| 10/26 through 8/27 | 50,000 | 08/27 | 4.04% | ||||||||||||||||||||||||||||||||||||||||||||||||||||||||||||||
| 100 West 33rd Street mortgage loan | 480,000 | 06/27 | S+185 | 480,000 | 06/27 | 5.26% | |||||||||||||||||||||||||||||||||||||||||||||||||||||||||||
| 888 Seventh Avenue mortgage loan | 253,688 | 12/25 | S+180 | 200,000 | 09/27 | 4.76% | |||||||||||||||||||||||||||||||||||||||||||||||||||||||||||
| 435 Seventh Avenue mortgage loan | 75,000 | 04/28 | S+210 | 75,000 | 04/26 | 6.96% | |||||||||||||||||||||||||||||||||||||||||||||||||||||||||||
| Unconsolidated: | |||||||||||||||||||||||||||||||||||||||||||||||||||||||||||||||||
| 280 Park Avenue mortgage loan | 537,500 | 09/27 | S+178 | 537,500 | 09/28 | 5.84% | |||||||||||||||||||||||||||||||||||||||||||||||||||||||||||
| 731 Lexington Avenue - retail condominium mortgage loan | 97,200 | 08/25 | S+151 | 97,200 | 05/25 | 1.76% | |||||||||||||||||||||||||||||||||||||||||||||||||||||||||||
| Interest Rate Caps: | Index Strike Rate | Cash Interest Rate(2) |
Effective Interest Rate(3) |
||||||||||||||||||||||||||||||||||||||||||||||||||||||||||||||
| Consolidated: | |||||||||||||||||||||||||||||||||||||||||||||||||||||||||||||||||
| 1290 Avenue of the Americas mortgage loan | $ | 665,000 | 11/28 | S+162 | $ | 665,000 | 11/25 | 1.00% | 2.62% | 5.94% | |||||||||||||||||||||||||||||||||||||||||||||||||||||||
| One Park Avenue mortgage loan | 525,000 | 03/26 | S+122 | 525,000 | 03/26 | 4.39% | 5.54% | 5.60% | |||||||||||||||||||||||||||||||||||||||||||||||||||||||||
| 150 West 34th Street mortgage loan | 75,000 | 02/28 | S+215 | 75,000 | 02/26 | 5.00% | 6.46% | 7.06% | |||||||||||||||||||||||||||||||||||||||||||||||||||||||||
| Unconsolidated: | |||||||||||||||||||||||||||||||||||||||||||||||||||||||||||||||||
| 61 Ninth Avenue mortgage loan | 75,543 | 01/26 | S+146 | 75,543 | 01/26 | 4.39% | 5.79% | 6.24% | |||||||||||||||||||||||||||||||||||||||||||||||||||||||||
| 512 West 22nd Street mortgage loan | 68,581 | 06/25 | S+235 | 68,581 | 06/25 | 4.50% | 6.67% | 6.98% | |||||||||||||||||||||||||||||||||||||||||||||||||||||||||
| Rego Park II mortgage loan | 65,368 | 12/25 | S+145 | 65,368 | 12/25 | 4.15% | 5.60% | 5.93% | |||||||||||||||||||||||||||||||||||||||||||||||||||||||||
| Fashion Centre Mall/Washington Tower mortgage loan | 34,125 | 05/26 | S+305 | 34,125 | 05/25 | 3.00% | 6.05% | 7.61% | |||||||||||||||||||||||||||||||||||||||||||||||||||||||||
| Debt subject to interest rate swaps and subject to a 1.00% SOFR interest rate cap | $ | 5,369,700 | |||||||||||||||||||||||||||||||||||||||||||||||||||||||||||||||
| Variable rate debt subject to interest rate caps | 843,617 | ||||||||||||||||||||||||||||||||||||||||||||||||||||||||||||||||
| Fixed rate debt per loan agreements | 2,894,122 | ||||||||||||||||||||||||||||||||||||||||||||||||||||||||||||||||
| Variable rate debt not subject to interest rate swaps or caps | 525,413 | (4) |
|||||||||||||||||||||||||||||||||||||||||||||||||||||||||||||||
| Total debt at share | $ | 9,632,852 | |||||||||||||||||||||||||||||||||||||||||||||||||||||||||||||||
| CONSOLIDATED DEBT MATURITIES AT 100% (CONTRACTUAL BALANCES) (unaudited) | ||||||||||||||||||||||||||||||||||||||||||||||||||||||||||||||||||||
| (Amounts in thousands) | ||||||||||||||||||||||||||||||||||||||||||||||||||||||||||||||||||||
| Property | Maturity Date(1) |
Spread over SOFR | Interest Rate(2) |
2025 | 2026 | 2027 | 2028 | 2029 | Thereafter | Total | ||||||||||||||||||||||||||||||||||||||||||||||||||||||||||
| Secured Debt: | ||||||||||||||||||||||||||||||||||||||||||||||||||||||||||||||||||||
| 606 Broadway (50.0% interest) | (3) | S+191 | 6.24% | (4) |
$ | 74,119 | $ | — | $ | — | $ | — | $ | — | $ | — | $ | 74,119 | ||||||||||||||||||||||||||||||||||||||||||||||||||
| 4 Union Square South | 08/25 | S+150 | 5.82% | 120,000 | — | — | — | — | — | 120,000 | ||||||||||||||||||||||||||||||||||||||||||||||||||||||||||
| PENN 11 | 10/25 | 6.28% | 500,000 | — | — | — | — | — | 500,000 | |||||||||||||||||||||||||||||||||||||||||||||||||||||||||||
| 888 Seventh Avenue | 12/25 | S+180 | (5) |
5.05% | 253,688 | — | — | — | — | — | 253,688 | |||||||||||||||||||||||||||||||||||||||||||||||||||||||||
| One Park Avenue | 03/26 | S+122 | 5.54% | — | 525,000 | — | — | — | — | 525,000 | ||||||||||||||||||||||||||||||||||||||||||||||||||||||||||
| 350 Park Avenue | 01/27 | 3.92% | — | — | 400,000 | — | — | — | 400,000 | |||||||||||||||||||||||||||||||||||||||||||||||||||||||||||
| 100 West 33rd Street | 06/27 | 5.26% | — | — | 480,000 | — | — | — | 480,000 | |||||||||||||||||||||||||||||||||||||||||||||||||||||||||||
| 770 Broadway | 07/27 | 4.98% | — | — | 700,000 | — | — | — | 700,000 | |||||||||||||||||||||||||||||||||||||||||||||||||||||||||||
| 150 West 34th Street | 02/28 | S+215 | 6.46% | — | — | — | 75,000 | — | — | 75,000 | ||||||||||||||||||||||||||||||||||||||||||||||||||||||||||
| 435 Seventh Avenue | 04/28 | 6.96% | — | — | — | 75,000 | — | — | 75,000 | |||||||||||||||||||||||||||||||||||||||||||||||||||||||||||
| 555 California Street (70.0% interest) | 05/28 | S+205 | (5) |
6.13% | — | — | — | 1,200,000 | — | — | 1,200,000 | |||||||||||||||||||||||||||||||||||||||||||||||||||||||||
| 1290 Avenue of the Americas (70.0% interest) | 11/28 | 2.62% | — | — | — | 950,000 | — | — | 950,000 | |||||||||||||||||||||||||||||||||||||||||||||||||||||||||||
| 909 Third Avenue | 04/31 | 3.23% | — | — | — | — | — | 350,000 | 350,000 | |||||||||||||||||||||||||||||||||||||||||||||||||||||||||||
| Total Secured Debt | 947,807 | 525,000 | 1,580,000 | 2,300,000 | — | 350,000 | 5,702,807 | |||||||||||||||||||||||||||||||||||||||||||||||||||||||||||||
| Unsecured Debt: | ||||||||||||||||||||||||||||||||||||||||||||||||||||||||||||||||||||
| Senior unsecured notes due 2026 | 06/26 | 2.15% | — | 400,000 | — | — | — | — | 400,000 | |||||||||||||||||||||||||||||||||||||||||||||||||||||||||||
| $1.25 Billion unsecured revolving credit facility | 12/27 | 3.88% | (6) |
— | — | 575,000 | — | — | — | 575,000 | ||||||||||||||||||||||||||||||||||||||||||||||||||||||||||
| $800 Million unsecured term loan | 12/27 | S+130 | (5) |
4.66% | (6) |
— | — | 800,000 | — | — | — | 800,000 | ||||||||||||||||||||||||||||||||||||||||||||||||||||||||
| $915 Million unsecured revolving credit facility | 04/29 | S+120 | — | — | — | — | — | — | — | — | ||||||||||||||||||||||||||||||||||||||||||||||||||||||||||
| Senior unsecured notes due 2031 | 06/31 | 3.40% | — | — | — | — | — | 350,000 | 350,000 | |||||||||||||||||||||||||||||||||||||||||||||||||||||||||||
| Total Unsecured Debt | — | 400,000 | 1,375,000 | — | — | 350,000 | 2,125,000 | |||||||||||||||||||||||||||||||||||||||||||||||||||||||||||||
| Total Debt | $ | 947,807 | $ | 925,000 | $ | 2,955,000 | $ | 2,300,000 | $ | — | $ | 700,000 | $ | 7,827,807 | ||||||||||||||||||||||||||||||||||||||||||||||||||||||
| Weighted average rate | 5.89% | 4.07% | 4.58% | 4.72% | 0.00% | 3.32% | 4.61% | |||||||||||||||||||||||||||||||||||||||||||||||||||||||||||||
Fixed rate debt(7) |
$ | 700,000 | $ | 400,000 | $ | 2,855,000 | $ | 1,865,000 | $ | — | $ | 700,000 | $ | 6,520,000 | ||||||||||||||||||||||||||||||||||||||||||||||||||||||
| Fixed weighted average rate expiring | 5.84% | 2.15% | 4.54% | 4.33% | 0.00% | 3.32% | 4.34% | |||||||||||||||||||||||||||||||||||||||||||||||||||||||||||||
| Floating rate debt | $ | 247,807 | $ | 525,000 | $ | 100,000 | $ | 435,000 | $ | — | $ | — | $ | 1,307,807 | ||||||||||||||||||||||||||||||||||||||||||||||||||||||
| Floating weighted average rate expiring | 6.01% | 5.54% | 5.62% | 6.38% | 0.00% | 0.00% | 5.92% | |||||||||||||||||||||||||||||||||||||||||||||||||||||||||||||
| TOP 30 TENANTS (unaudited) | |||||||||||||||||||||||
| (Amounts in thousands, except square feet) | |||||||||||||||||||||||
| Tenants |
Square
Footage
At Share
|
Annualized
Escalated Rents
At Share(1)
|
% of Total Annualized Escalated Rents At Share |
|||||||||||||||||
| Meta Platforms, Inc. | 1,176,828 | $ | 141,813 | 7.6 | % | |||||||||||||||
| IPG and affiliates | 955,211 | 63,844 | 3.5 | % | ||||||||||||||||
| Citadel | 585,460 | 62,498 | 3.4 | % | ||||||||||||||||
| New York University | 685,290 | 48,998 | 2.6 | % | ||||||||||||||||
| Madison Square Garden & Affiliates | 449,053 | 45,451 | 2.4 | % | ||||||||||||||||
| Bloomberg L.P. | 306,768 | 43,867 | 2.3 | % | ||||||||||||||||
| Google/Motorola Mobility (guaranteed by Google) | 759,446 | 43,355 | 2.3 | % | ||||||||||||||||
| UMG Recordings, Inc, | 336,700 | 35,411 | 1.9 | % | ||||||||||||||||
| Amazon (including its Whole Foods subsidiary) | 312,694 | 31,044 | 1.6 | % | ||||||||||||||||
| Neuberger Berman Group LLC | 306,612 | 28,363 | 1.5 | % | ||||||||||||||||
| Bank of America | 247,615 | 27,452 | 1.5 | % | ||||||||||||||||
| Apple Inc. | 473,311 | 26,948 | 1.4 | % | ||||||||||||||||
| LVMH Brands | 65,060 | 26,786 | 1.4 | % | ||||||||||||||||
| AMC Networks, Inc. | 326,717 | 26,183 | 1.4 | % | ||||||||||||||||
| WeWork | 303,741 | 25,818 | 1.4 | % | ||||||||||||||||
| Swatch Group USA | 8,499 | 24,150 | 1.3 | % | ||||||||||||||||
| Victoria's Secret | 33,156 | 20,690 | 1.1 | % | ||||||||||||||||
| PJT Partners Holdings | 134,953 | 19,379 | 1.0 | % | ||||||||||||||||
| PwC | 241,196 | 19,368 | 1.0 | % | ||||||||||||||||
| Macy's | 181,698 | 19,100 | 1.0 | % | ||||||||||||||||
| The City of New York | 232,010 | 12,351 | 0.7 | % | ||||||||||||||||
| King & Spalding | 122,859 | 11,979 | 0.6 | % | ||||||||||||||||
| WSP USA | 172,666 | 11,291 | 0.6 | % | ||||||||||||||||
| Dodge & Cox | 107,925 | 11,276 | 0.6 | % | ||||||||||||||||
| Major League Soccer LLC | 125,013 | 11,251 | 0.6 | % | ||||||||||||||||
| AbbVie Inc. | 168,673 | 11,239 | 0.6 | % | ||||||||||||||||
| Axon Capital | 93,127 | 11,022 | 0.6 | % | ||||||||||||||||
| Alston & Bird LLP | 126,872 | 10,865 | 0.6 | % | ||||||||||||||||
| Burlington Coat Factory | 108,844 | 10,863 | 0.6 | % | ||||||||||||||||
| Aetna Life Insurance Company | 64,196 | 10,303 | 0.5 | % | ||||||||||||||||
| 47.6 | % | |||||||||||||||||||
| SQUARE FOOTAGE (unaudited) | |||||||||||||||||||||||||||||||||||||||||
| (Square feet in thousands) | |||||||||||||||||||||||||||||||||||||||||
| At Vornado's Share | |||||||||||||||||||||||||||||||||||||||||
| At 100% |
Under Development or Not Available for Lease | In Service | |||||||||||||||||||||||||||||||||||||||
| Total | Office | Retail | Showroom | Other | |||||||||||||||||||||||||||||||||||||
| Segment: | |||||||||||||||||||||||||||||||||||||||||
| New York: | |||||||||||||||||||||||||||||||||||||||||
| Office | 20,352 | 17,532 | 133 | 17,216 | — | 183 | — | ||||||||||||||||||||||||||||||||||
| Retail | 2,347 | 1,945 | 4 | — | 1,941 | — | — | ||||||||||||||||||||||||||||||||||
| Residential - 1,330 units | 1,212 | 620 | 16 | — | — | — | 604 | ||||||||||||||||||||||||||||||||||
| Alexander's (32.4% interest), including 312 residential units | 2,455 | 796 | 126 | 308 | 279 | — | 83 | ||||||||||||||||||||||||||||||||||
| 26,366 | 20,893 | 279 | 17,524 | 2,220 | 183 | 687 | |||||||||||||||||||||||||||||||||||
| Other: | |||||||||||||||||||||||||||||||||||||||||
| THE MART | 3,696 | 3,694 | — | 2,098 | 93 | 1,256 | 247 | ||||||||||||||||||||||||||||||||||
| 555 California Street (70% interest) | 1,822 | 1,275 | — | 1,240 | 35 | — | — | ||||||||||||||||||||||||||||||||||
| Other | 2,845 | 1,346 | 144 | 212 | 879 | — | 111 | ||||||||||||||||||||||||||||||||||
| 8,363 | 6,315 | 144 | 3,550 | 1,007 | 1,256 | 358 | |||||||||||||||||||||||||||||||||||
| Total square feet at March 31, 2025 | 34,729 | 27,208 | 423 | 21,074 | 3,227 | 1,439 | 1,045 | ||||||||||||||||||||||||||||||||||
| Total square feet at December 31, 2024 | 34,803 | 27,231 | 1,819 | 19,690 | 3,238 | 1,439 | 1,045 | ||||||||||||||||||||||||||||||||||
| At 100% | |||||||||||||||||||||||||||||||||||||||||
| Parking Garages (not included above): | Square Feet | Number of Garages |
Number of Spaces |
||||||||||||||||||||||||||||||||||||||
| New York | 1,635 | 9 | 4,685 | ||||||||||||||||||||||||||||||||||||||
| THE MART | 341 | 3 | 1,076 | ||||||||||||||||||||||||||||||||||||||
| 555 California Street | 168 | 1 | 461 | ||||||||||||||||||||||||||||||||||||||
| Rosslyn Plaza | 411 | 4 | 1,094 | ||||||||||||||||||||||||||||||||||||||
| Total at March 31, 2025 | 2,555 | 17 | 7,316 | ||||||||||||||||||||||||||||||||||||||
| OCCUPANCY (unaudited) | |||||||||||||||||||||||
| New York | THE MART | 555 California Street |
|||||||||||||||||||||
| Occupancy rate at: | |||||||||||||||||||||||
| March 31, 2025 | 83.5 | % | (1) |
78.2 | % | 92.3 | % | ||||||||||||||||
| December 31, 2024 | 87.6 | % | 80.1 | % | 92.0 | % | |||||||||||||||||
| March 31, 2024 | 88.2 | % | 77.6 | % | 94.5 | % | |||||||||||||||||
| RESIDENTIAL STATISTICS (unaudited) | |||||||||||||||||||||||
| Vornado's Ownership Interest | |||||||||||||||||||||||
Number of Units |
Number of Units |
Occupancy Rate |
Average Monthly Rent Per Unit |
||||||||||||||||||||
| New York: | |||||||||||||||||||||||
| March 31, 2025 | 1,642 | 769 | 96.5% | $4,814 | |||||||||||||||||||
December 31, 2024 |
1,642 | 769 | 96.6% | $4,713 | |||||||||||||||||||
| March 31, 2024 | 1,974 | 939 | 97.5% | $4,163 | |||||||||||||||||||
| GROUND LEASES (unaudited) | ||||||||||||||||||||||||||||||||
| (Amounts in thousands, except square feet) | ||||||||||||||||||||||||||||||||
| Property | Current Annual Rent at Share |
Next Option Renewal Date | Fully Extended Lease Expiration |
Rent Increases and Other Information | ||||||||||||||||||||||||||||
| Consolidated: | ||||||||||||||||||||||||||||||||
| New York: | ||||||||||||||||||||||||||||||||
| The Farley Building (95% interest) | $ | 4,750 | None | 2116 | None | |||||||||||||||||||||||||||
| PENN 1: | ||||||||||||||||||||||||||||||||
| Land | 15,000 | (1) |
2073 | 2098 | One 25-year renewal option at fair market value (“FMV”). | |||||||||||||||||||||||||||
Long Island Railroad Concourse Retail |
1,379 | 2048 | 2098 | Two 25-year renewal options. Base rent increases every 10 years, with the next rent increase in 2028, based on the increase in gross income reduced by the increase in real estate taxes and operating expenses. In addition, percentage rent is payable based on gross annual income above a specified threshold. Base and percentage rent are reduced by a rent credit calculated as a percentage of development costs funded by Vornado. |
||||||||||||||||||||||||||||
| 260 Eleventh Avenue | 4,515 | None | 2114 | Rent increases annually by the lesser of CPI or 1.5% compounded. We have a purchase option exercisable at a future date for $110,000 increased annually by the lesser of CPI or 1.5% compounded. | ||||||||||||||||||||||||||||
| 888 Seventh Avenue | 3,350 | 2028 | 2067 | Two 20-year renewal options at FMV. | ||||||||||||||||||||||||||||
| 330 West 34th Street - 65.2% ground leased
|
10,265 | 2051 | 2149 | Two 30-year and one 39-year renewal option at FMV. | ||||||||||||||||||||||||||||
| 909 Third Avenue | 1,600 | 2041 | 2063 | One 22-year renewal option at current annual rent. | ||||||||||||||||||||||||||||
| 962 Third Avenue (the Annex building to 150 East 58th Street) - 50.0% ground leased | 666 | None | 2118 | Rent resets every 10 years to FMV. |
||||||||||||||||||||||||||||
| Other: | ||||||||||||||||||||||||||||||||
| Wayne Town Center | 6,038 | 2035 | 2064 | Two 10-year renewal options and one 9-year renewal option. Rent increases annually by the greater of CPI or 6%. | ||||||||||||||||||||||||||||
| Annapolis | 650 | None | 2042 | Fixed rent increases to $750 per annum in 2032. | ||||||||||||||||||||||||||||
| Unconsolidated: | ||||||||||||||||||||||||||||||||
|
Sunset Pier 94 Studios
(49.9% interest)
|
449 | 2060 | 2110 | Five 10-year renewal options. Fixed rent increases in 2028 and every five years thereafter. Beginning in September 2028, additional rent is payable in an amount equal to 6% of gross revenue less the base rent. | ||||||||||||||||||||||||||||
|
61 Ninth Avenue
(45.1% interest)
|
3,635 | None | 2115 | Rent increases every three years based on CPI, subject to a cap. In 2051, 2071 and 2096, rent resets based on the increase in the property's gross revenue net of real estate taxes, if greater than the CPI reset. | ||||||||||||||||||||||||||||
|
Flushing (Alexander's)
(32.4% interest)
|
259 | None | 2037 | 10-year renewal option at 90% of FMV effective 2027 was exercised in March 2025. FMV to be determined. | ||||||||||||||||||||||||||||
| NEW YORK SEGMENT | ||||||||||||||||||||||||||||||||||||||||||||||||||||||||
| PROPERTY TABLE | ||||||||||||||||||||||||||||||||||||||||||||||||||||||||
| (Annualized escalated rent amounts in thousands) | % Ownership |
% Occupancy |
Weighted
Average Escalated
Annual Rent
PSF(1)
|
Annualized Escalated Rent(2) |
Square Feet |
Encumbrances
(non-GAAP)
(in thousands)(3)
|
Major Tenants | |||||||||||||||||||||||||||||||||||||||||||||||||
| Property | Total Property |
In Service | Under Development or Not Available for Lease |
|||||||||||||||||||||||||||||||||||||||||||||||||||||
| NEW YORK: | ||||||||||||||||||||||||||||||||||||||||||||||||||||||||
| PENN District: | ||||||||||||||||||||||||||||||||||||||||||||||||||||||||
| PENN 1 | ||||||||||||||||||||||||||||||||||||||||||||||||||||||||
| (ground leased through 2098)** | Cisco, Hartford Fire Insurance, Empire Healthchoice Assurance, Inc., United | |||||||||||||||||||||||||||||||||||||||||||||||||||||||
| Healthcare Services, Inc., Siemens Mobility, WSP USA, Gusto Inc., Samsung, | ||||||||||||||||||||||||||||||||||||||||||||||||||||||||
| -Office | 100.0 | % | 88.2 | % | $ | 85.07 | 2,249,000 | 2,249,000 | — | Canaccord Genuity LLC, Roivant Sciences Inc.* | ||||||||||||||||||||||||||||||||||||||||||||||
| -Retail | 100.0 | % | 61.3 | % | 225.55 | 302,000 | 302,000 | — | Bank of America, Starbucks, Blue Bottle Coffee Inc., Shake Shack, Roberta’s, | |||||||||||||||||||||||||||||||||||||||||||||||
| 100.0 | % | 85.2 | % | 96.49 | $ | 208,000 | 2,551,000 | 2,551,000 | — | $ | — | Anita La Mamma Del Gelato | ||||||||||||||||||||||||||||||||||||||||||||
| PENN 2 | ||||||||||||||||||||||||||||||||||||||||||||||||||||||||
| -Office | 100.0 | % | 48.5 | % | 102.99 | 1,749,000 | 1,749,000 | — | Madison Square Garden, Major League Soccer LLC*, UMG Recordings, Inc.* | |||||||||||||||||||||||||||||||||||||||||||||||
| -Retail | 100.0 | % | 56.3 | % | 199.19 | 66,000 | 66,000 | — | JPMorgan Chase | |||||||||||||||||||||||||||||||||||||||||||||||
| 100.0 | % | 48.8 | % | 107.02 | 94,500 | 1,815,000 | 1,815,000 | — | 575,000 | (4) |
||||||||||||||||||||||||||||||||||||||||||||||
|
The Farley Building
(ground and building leased through 2116)**
|
||||||||||||||||||||||||||||||||||||||||||||||||||||||||
| -Office | 95.0 | % | 100.0 | % | 118.86 | 730,000 | 730,000 | — | Meta Platforms, Inc. | |||||||||||||||||||||||||||||||||||||||||||||||
| -Retail | 95.0 | % | 37.1 | % | 320.40 | 116,000 | 116,000 | — | Duane Reade, Magnolia Bakery, Starbucks, Birch Coffee, H&H Bagels, | |||||||||||||||||||||||||||||||||||||||||||||||
| 95.0 | % | 91.5 | % | 129.85 | 100,400 | 846,000 | 846,000 | — | — | Avra Prime* | ||||||||||||||||||||||||||||||||||||||||||||||
| PENN 11 | ||||||||||||||||||||||||||||||||||||||||||||||||||||||||
| -Office | 100.0 | % | 100.0 | % | 75.41 | 1,115,000 | 1,115,000 | — | Apple Inc., Madison Square Garden, AMC Networks, Inc., Macy's | |||||||||||||||||||||||||||||||||||||||||||||||
| -Retail | 100.0 | % | 90.7 | % | 150.91 | 39,000 | 39,000 | — | PNC Bank National Association, Starbucks | |||||||||||||||||||||||||||||||||||||||||||||||
| 100.0 | % | 99.6 | % | 77.65 | 82,800 | 1,154,000 | 1,154,000 | — | 500,000 | |||||||||||||||||||||||||||||||||||||||||||||||
| 100 West 33rd Street | ||||||||||||||||||||||||||||||||||||||||||||||||||||||||
| -Office | 100.0 | % | 89.5 | % | 69.23 | 858,000 | 858,000 | — | IPG and affiliates | |||||||||||||||||||||||||||||||||||||||||||||||
| -Retail | 100.0 | % | 15.6 | % | 77.35 | 257,000 | 257,000 | — | Aeropostale | |||||||||||||||||||||||||||||||||||||||||||||||
| 100.0 | % | 73.1 | % | 69.61 | 55,800 | 1,115,000 | 1,115,000 | — | 480,000 | |||||||||||||||||||||||||||||||||||||||||||||||
| 330 West 34th Street | ||||||||||||||||||||||||||||||||||||||||||||||||||||||||
| (65.2% ground leased through 2149)** | ||||||||||||||||||||||||||||||||||||||||||||||||||||||||
| -Office | 100.0 | % | 76.9 | % | 82.51 | 702,000 | 702,000 | — | Structure Tone, Deutsch, Inc., HomeAdvisor, Inc., WeWork | |||||||||||||||||||||||||||||||||||||||||||||||
| -Retail | 100.0 | % | 85.5 | % | 113.26 | 24,000 | 24,000 | — | Starbucks | |||||||||||||||||||||||||||||||||||||||||||||||
| 100.0 | % | 77.1 | % | 83.44 | 45,200 | 726,000 | 726,000 | — | 100,000 | (5) |
||||||||||||||||||||||||||||||||||||||||||||||
| 435 Seventh Avenue | ||||||||||||||||||||||||||||||||||||||||||||||||||||||||
| -Retail | 100.0 | % | 100.0 | % | 46.95 | 2,000 | 43,000 | 43,000 | — | 75,000 | Forever 21 | |||||||||||||||||||||||||||||||||||||||||||||
| 7 West 34th Street | ||||||||||||||||||||||||||||||||||||||||||||||||||||||||
| -Office | 53.0 | % | 100.0 | % | 82.74 | 458,000 | 458,000 | — | Amazon | |||||||||||||||||||||||||||||||||||||||||||||||
| -Retail | 53.0 | % | 89.6 | % | 336.41 | 19,000 | 19,000 | — | Amazon, Lindt | |||||||||||||||||||||||||||||||||||||||||||||||
| 53.0 | % | 99.6 | % | 92.38 | 43,000 | 477,000 | 477,000 | — | 300,000 | |||||||||||||||||||||||||||||||||||||||||||||||
| 431 Seventh Avenue | ||||||||||||||||||||||||||||||||||||||||||||||||||||||||
| -Retail | 100.0 | % | 100.0 | % | 265.93 | 600 | 9,000 | 9,000 | — | — | Essen | |||||||||||||||||||||||||||||||||||||||||||||
| 138-142 West 32nd Street | ||||||||||||||||||||||||||||||||||||||||||||||||||||||||
| -Retail | 100.0 | % | 80.3 | % | 127.73 | 400 | 8,000 | 8,000 | — | — | ||||||||||||||||||||||||||||||||||||||||||||||
| 150 West 34th Street | ||||||||||||||||||||||||||||||||||||||||||||||||||||||||
| -Retail | 100.0 | % | 100.0 | % | 63.48 | 5,000 | 79,000 | 79,000 | — | 75,000 | Primark* | |||||||||||||||||||||||||||||||||||||||||||||
| NEW YORK SEGMENT | ||||||||||||||||||||||||||||||||||||||||||||||||||||||||
| PROPERTY TABLE | ||||||||||||||||||||||||||||||||||||||||||||||||||||||||
| (Annualized escalated rent amounts in thousands) | % Ownership |
% Occupancy |
Weighted
Average Escalated
Annual Rent
PSF(1)
|
Annualized Escalated Rent(2) |
Square Feet |
Encumbrances
(non-GAAP)
(in thousands)(3)
|
Major Tenants | |||||||||||||||||||||||||||||||||||||||||||||||||
| Property | Total Property |
In Service | Under Development or Not Available for Lease |
|||||||||||||||||||||||||||||||||||||||||||||||||||||
| NEW YORK (Continued): | ||||||||||||||||||||||||||||||||||||||||||||||||||||||||
| PENN District (Continued): | ||||||||||||||||||||||||||||||||||||||||||||||||||||||||
| 137 West 33rd Street | ||||||||||||||||||||||||||||||||||||||||||||||||||||||||
| -Retail | 100.0 | % | 100.0 | % | $ | 96.85 | $ | 300 | 3,000 | 3,000 | — | $ | — | Celtic Rail | ||||||||||||||||||||||||||||||||||||||||||
| 131-135 West 33rd Street | ||||||||||||||||||||||||||||||||||||||||||||||||||||||||
| -Retail | 100.0 | % | 100.0 | % | 64.65 | 1,500 | 23,000 | 23,000 | — | — | Fat Annies’s Inc., Stout Inc. | |||||||||||||||||||||||||||||||||||||||||||||
| Other (3 buildings) | ||||||||||||||||||||||||||||||||||||||||||||||||||||||||
| -Retail | 100.0 | % | 100.0 | % | 157.71 | 2,100 | 16,000 | 16,000 | — | — | ||||||||||||||||||||||||||||||||||||||||||||||
| Total PENN District | 641,600 | 8,865,000 | 8,865,000 | — | 2,105,000 | |||||||||||||||||||||||||||||||||||||||||||||||||||
| Midtown East: | ||||||||||||||||||||||||||||||||||||||||||||||||||||||||
| 909 Third Avenue | ||||||||||||||||||||||||||||||||||||||||||||||||||||||||
| (ground leased through 2063)** | IPG and affiliates, AbbVie Inc., United States Post Office, | |||||||||||||||||||||||||||||||||||||||||||||||||||||||
| -Office | 100.0 | % | 93.1 | % | 68.18 | (6) |
60,900 | 1,352,000 | 1,352,000 | — | 350,000 | Geller & Company, Morrison Cohen LLP, Sard Verbinnen | ||||||||||||||||||||||||||||||||||||||||||||
150 East 58th Street(7) |
||||||||||||||||||||||||||||||||||||||||||||||||||||||||
| -Office | 100.0 | % | 81.7 | % | 81.90 | 541,000 | 541,000 | — | Castle Harlan, Tournesol Realty LLC (Peter Marino) | |||||||||||||||||||||||||||||||||||||||||||||||
| -Retail | 100.0 | % | 100.0 | % | 94.88 | 3,000 | 3,000 | — | ||||||||||||||||||||||||||||||||||||||||||||||||
| 100.0 | % | 81.7 | % | 81.98 | 36,000 | 544,000 | 544,000 | — | — | |||||||||||||||||||||||||||||||||||||||||||||||
| 715 Lexington Avenue | ||||||||||||||||||||||||||||||||||||||||||||||||||||||||
| -Retail | 100.0 | % | 100.0 | % | 198.71 | 4,300 | 22,000 | 22,000 | — | — | Orangetheory Fitness, Casper, Santander Bank, Blu Dot | |||||||||||||||||||||||||||||||||||||||||||||
| 966 Third Avenue | ||||||||||||||||||||||||||||||||||||||||||||||||||||||||
| -Retail | 100.0 | % | 100.0 | % | 112.60 | 800 | 7,000 | 7,000 | — | — | McDonald's | |||||||||||||||||||||||||||||||||||||||||||||
| 968 Third Avenue | ||||||||||||||||||||||||||||||||||||||||||||||||||||||||
| -Retail | 50.0 | % | 100.0 | % | 194.16 | 1,300 | 7,000 | 7,000 | — | — | Wells Fargo | |||||||||||||||||||||||||||||||||||||||||||||
| Total Midtown East | 103,300 | 1,932,000 | 1,932,000 | — | 350,000 | |||||||||||||||||||||||||||||||||||||||||||||||||||
| Midtown West: | ||||||||||||||||||||||||||||||||||||||||||||||||||||||||
| 888 Seventh Avenue | ||||||||||||||||||||||||||||||||||||||||||||||||||||||||
| (ground leased through 2067)** | Axon Capital LP, Lone Star US Acquisitions LLC, Top-New York, Inc., | |||||||||||||||||||||||||||||||||||||||||||||||||||||||
| -Office | 100.0 | % | 84.2 | % | 101.13 | 872,000 | 872,000 | — | Vornado Executive Headquarters, United Talent Agency | |||||||||||||||||||||||||||||||||||||||||||||||
| -Retail | 100.0 | % | 100.0 | % | 261.25 | 15,000 | 15,000 | — | Redeye Grill L.P. | |||||||||||||||||||||||||||||||||||||||||||||||
| 100.0 | % | 84.3 | % | 102.81 | 77,200 | 887,000 | 887,000 | — | 253,688 | |||||||||||||||||||||||||||||||||||||||||||||||
| 57th Street - 2 buildings | ||||||||||||||||||||||||||||||||||||||||||||||||||||||||
| -Office | 50.0 | % | 85.4 | % | 62.03 | 81,000 | 81,000 | — | ||||||||||||||||||||||||||||||||||||||||||||||||
| -Retail | 50.0 | % | — | % | — | 22,000 | 22,000 | — | ||||||||||||||||||||||||||||||||||||||||||||||||
| 50.0 | % | 71.2 | % | 62.03 | 4,300 | 103,000 | 103,000 | — | — | |||||||||||||||||||||||||||||||||||||||||||||||
| 825 Seventh Avenue | ||||||||||||||||||||||||||||||||||||||||||||||||||||||||
| -Office | 50.0 | % | 79.6 | % | 59.02 | 169,000 | 169,000 | — | 54,000 | Young Adult Institute Inc., New Alternatives for Children, Inc. | ||||||||||||||||||||||||||||||||||||||||||||||
| -Retail | 100.0 | % | 100.0 | % | 168.85 | 4,000 | 4,000 | — | — | Venchi | ||||||||||||||||||||||||||||||||||||||||||||||
| 80.1 | % | 62.21 | 8,500 | 173,000 | 173,000 | — | 54,000 | |||||||||||||||||||||||||||||||||||||||||||||||||
| Total Midtown West | 90,000 | 1,163,000 | 1,163,000 | — | 307,688 | |||||||||||||||||||||||||||||||||||||||||||||||||||
| NEW YORK SEGMENT | ||||||||||||||||||||||||||||||||||||||||||||||||||||||||
| PROPERTY TABLE | ||||||||||||||||||||||||||||||||||||||||||||||||||||||||
| (Annualized escalated rent amounts in thousands) | % Ownership |
% Occupancy |
Weighted
Average Escalated
Annual Rent
PSF(1)
|
Annualized Escalated Rent(2) |
Square Feet |
Encumbrances
(non-GAAP)
(in thousands)(3)
|
Major Tenants | |||||||||||||||||||||||||||||||||||||||||||||||||
| Property | Total Property |
In Service | Under Development or Not Available for Lease |
|||||||||||||||||||||||||||||||||||||||||||||||||||||
| NEW YORK (Continued): | ||||||||||||||||||||||||||||||||||||||||||||||||||||||||
| Park Avenue: | ||||||||||||||||||||||||||||||||||||||||||||||||||||||||
| 280 Park Avenue | Elliott Investment Management L.P., PJT Partners Holdings, GIC Inc., | |||||||||||||||||||||||||||||||||||||||||||||||||||||||
| -Office | 50.0 | % | 91.4 | % | $ | 119.28 | 1,238,000 | 1,238,000 | — | Wells Fargo, Investcorp International Inc. | ||||||||||||||||||||||||||||||||||||||||||||||
| -Retail | 50.0 | % | 100.0 | % | 57.56 | 28,000 | 28,000 | — | Starbucks, Fasano Restaurant | |||||||||||||||||||||||||||||||||||||||||||||||
| 50.0 | % | 91.6 | % | 117.77 | $ | 135,800 | 1,266,000 | 1,266,000 | — | $ | 1,075,000 | |||||||||||||||||||||||||||||||||||||||||||||
| 350 Park Avenue | ||||||||||||||||||||||||||||||||||||||||||||||||||||||||
| -Office | 100.0 | % | 100.0 | % | 106.75 | 62,500 | 585,000 | 585,000 | — | 400,000 | Citadel | |||||||||||||||||||||||||||||||||||||||||||||
| Total Park Avenue | 198,300 | 1,851,000 | 1,851,000 | — | 1,475,000 | |||||||||||||||||||||||||||||||||||||||||||||||||||
| Grand Central: | ||||||||||||||||||||||||||||||||||||||||||||||||||||||||
| 90 Park Avenue | Alston & Bird, PwC, MassMutual, Glencore* | |||||||||||||||||||||||||||||||||||||||||||||||||||||||
| -Office | 100.0 | % | 97.3 | % | 83.01 | 938,000 | 938,000 | — | Factset Research Systems Inc., Foley & Lardner | |||||||||||||||||||||||||||||||||||||||||||||||
| -Retail | 100.0 | % | 78.2 | % | 185.60 | 17,000 | 17,000 | — | Citibank, Starbucks | |||||||||||||||||||||||||||||||||||||||||||||||
| Total Grand Central | 100.0 | % | 97.0 | % | 84.42 | 75,500 | 955,000 | 955,000 | — | — | ||||||||||||||||||||||||||||||||||||||||||||||
| Madison/Fifth: | ||||||||||||||||||||||||||||||||||||||||||||||||||||||||
| 640 Fifth Avenue | Fidelity Investments, Abbott Capital Management, The Klein Company, | |||||||||||||||||||||||||||||||||||||||||||||||||||||||
| -Office | 52.0 | % | 91.5 | % | 112.75 | 246,000 | 246,000 | — | Avolon Aerospace, Houlihan Lokey Advisors Parent, Inc. | |||||||||||||||||||||||||||||||||||||||||||||||
| -Retail | 52.0 | % | 100.0 | % | 1,091.86 | 69,000 | 69,000 | — | Victoria's Secret, Dyson | |||||||||||||||||||||||||||||||||||||||||||||||
| 52.0 | % | 92.8 | % | 272.75 | 76,000 | 315,000 | 315,000 | — | 395,333 | |||||||||||||||||||||||||||||||||||||||||||||||
| 666 Fifth Avenue | ||||||||||||||||||||||||||||||||||||||||||||||||||||||||
| -Retail | 52.0 | % | 100.0 | % | 1,147.91 | 15,100 | 24,000 | 24,000 | — | — | Abercrombie & Fitch, Tissot | |||||||||||||||||||||||||||||||||||||||||||||
| 595 Madison Avenue | LVMH Moet Hennessy Louis Vuitton Inc., | |||||||||||||||||||||||||||||||||||||||||||||||||||||||
| -Office | 100.0 | % | 87.0 | % | 81.27 | 300,000 | 300,000 | — | Albea Beauty Solutions, Aerin LLC | |||||||||||||||||||||||||||||||||||||||||||||||
| -Retail | 100.0 | % | 100.0 | % | 757.56 | 30,000 | 30,000 | — | Fendi, Berluti, Christofle Silver Inc. | |||||||||||||||||||||||||||||||||||||||||||||||
| 100.0 | % | 87.8 | % | 130.01 | 39,000 | 330,000 | 330,000 | — | — | |||||||||||||||||||||||||||||||||||||||||||||||
| 650 Madison Avenue | Sotheby's International Realty, Inc., BC Partners Inc., | |||||||||||||||||||||||||||||||||||||||||||||||||||||||
| -Office | 20.1 | % | 81.4 | % | 107.49 | 563,000 | 563,000 | — | Polo Ralph Lauren, Willett Advisors LLC (Bloomberg Philanthropies) | |||||||||||||||||||||||||||||||||||||||||||||||
| -Retail | 20.1 | % | 95.7 | % | 1,077.75 | 38,000 | 38,000 | — | Moncler USA Inc., Tod's, Celine, Balmain | |||||||||||||||||||||||||||||||||||||||||||||||
| 20.1 | % | 82.0 | % | 154.92 | 73,100 | 601,000 | 601,000 | — | 800,000 | |||||||||||||||||||||||||||||||||||||||||||||||
| 689 Fifth Avenue | ||||||||||||||||||||||||||||||||||||||||||||||||||||||||
| -Office | 52.0 | % | 100.0 | % | 94.92 | 81,000 | 81,000 | — | Yamaha Artist Services Inc., Brunello Cucinelli USA Inc. | |||||||||||||||||||||||||||||||||||||||||||||||
| -Retail | 52.0 | % | 100.0 | % | 593.51 | 16,000 | 16,000 | — | Canada Goose | |||||||||||||||||||||||||||||||||||||||||||||||
| 52.0 | % | 100.0 | % | 153.80 | 16,400 | 97,000 | 97,000 | — | — | |||||||||||||||||||||||||||||||||||||||||||||||
| 655 Fifth Avenue | ||||||||||||||||||||||||||||||||||||||||||||||||||||||||
| -Retail | 50.0 | % | 100.0 | % | 303.65 | 17,900 | 57,000 | 57,000 | — | — | Ferragamo | |||||||||||||||||||||||||||||||||||||||||||||
| 697-703 Fifth Avenue | ||||||||||||||||||||||||||||||||||||||||||||||||||||||||
| -Retail | 44.8 | % | 66.6 | % | 2,986.60 | 40,500 | 26,000 | 26,000 | — | 355,803 | Swatch Group USA, Harry Winston | |||||||||||||||||||||||||||||||||||||||||||||
| Total Madison/Fifth | 278,000 | 1,450,000 | 1,450,000 | — | 1,551,136 | |||||||||||||||||||||||||||||||||||||||||||||||||||
| NEW YORK SEGMENT | ||||||||||||||||||||||||||||||||||||||||||||||||||||||||
| PROPERTY TABLE | ||||||||||||||||||||||||||||||||||||||||||||||||||||||||
| (Annualized escalated rent amounts in thousands) | % Ownership |
% Occupancy |
Weighted
Average Escalated
Annual Rent
PSF(1)
|
Annualized Escalated Rent(2) |
Square Feet |
Encumbrances
(non-GAAP)
(in thousands)(3)
|
Major Tenants | |||||||||||||||||||||||||||||||||||||||||||||||||
| Property | Total Property |
In Service | Under Development or Not Available for Lease |
|||||||||||||||||||||||||||||||||||||||||||||||||||||
| NEW YORK (Continued): | ||||||||||||||||||||||||||||||||||||||||||||||||||||||||
| Midtown South: | ||||||||||||||||||||||||||||||||||||||||||||||||||||||||
| 770 Broadway | ||||||||||||||||||||||||||||||||||||||||||||||||||||||||
| -Office | 100.0 | % | 52.7 | % | $ | 122.39 | 1,077,000 | 1,077,000 | — | Meta Platforms, Inc., Yahoo Inc. | ||||||||||||||||||||||||||||||||||||||||||||||
| -Retail | 100.0 | % | 92.0 | % | 95.04 | 106,000 | 106,000 | — | Bank of America N.A., Wegmans Food Markets | |||||||||||||||||||||||||||||||||||||||||||||||
| 100.0 | % | 56.0 | % | 118.64 | $ | 77,500 | 1,183,000 | 1,183,000 | — | $ | 700,000 | |||||||||||||||||||||||||||||||||||||||||||||
| One Park Avenue | ||||||||||||||||||||||||||||||||||||||||||||||||||||||||
| New York University, BMG Rights Management LLC, | ||||||||||||||||||||||||||||||||||||||||||||||||||||||||
| -Office | 100.0 | % | 93.9 | % | 72.79 | 871,000 | 871,000 | — | Robert A.M. Stern Architect | |||||||||||||||||||||||||||||||||||||||||||||||
| -Retail | 100.0 | % | 90.1 | % | 83.06 | 78,000 | 78,000 | — | Bank of Baroda, Citibank, Equinox | |||||||||||||||||||||||||||||||||||||||||||||||
| 100.0 | % | 93.6 | % | 73.60 | 63,700 | 949,000 | 949,000 | — | 525,000 | |||||||||||||||||||||||||||||||||||||||||||||||
| 4 Union Square South | ||||||||||||||||||||||||||||||||||||||||||||||||||||||||
| -Retail | 100.0 | % | 100.0 | % | 132.68 | 27,100 | 204,000 | 204,000 | — | 120,000 | Burlington, Whole Foods Market, DSW, Sephora | |||||||||||||||||||||||||||||||||||||||||||||
| Total Midtown South | 168,300 | 2,336,000 | 2,336,000 | — | 1,345,000 | |||||||||||||||||||||||||||||||||||||||||||||||||||
| Rockefeller Center: | ||||||||||||||||||||||||||||||||||||||||||||||||||||||||
| 1290 Avenue of the Americas | Hachette Book Group Inc., Bryan Cave LLP, | |||||||||||||||||||||||||||||||||||||||||||||||||||||||
| Neuberger Berman Group LLC, SSB Realty LLC, | ||||||||||||||||||||||||||||||||||||||||||||||||||||||||
| Cushman & Wakefield, Columbia University, Selendy Gay PLLC, | ||||||||||||||||||||||||||||||||||||||||||||||||||||||||
| -Office | 70.0 | % | 91.8 | % | 88.71 | 2,009,000 | 2,009,000 | — | Fubotv Inc, LinkLaters, King & Spalding*, Oaktree Capital* | |||||||||||||||||||||||||||||||||||||||||||||||
| -Retail | 70.0 | % | 95.9 | % | 212.64 | 92,000 | 92,000 | — | Duane Reade, JPMorgan Chase Bank, Starbucks | |||||||||||||||||||||||||||||||||||||||||||||||
| Total Rockefeller Center | 70.0 | % | 91.9 | % | 92.86 | 185,100 | 2,101,000 | 2,101,000 | — | 950,000 | ||||||||||||||||||||||||||||||||||||||||||||||
| SoHo: | ||||||||||||||||||||||||||||||||||||||||||||||||||||||||
| 606 Broadway (19 East Houston Street) | ||||||||||||||||||||||||||||||||||||||||||||||||||||||||
| -Office | 50.0 | % | 13.4 | % | 120.00 | 30,000 | 30,000 | — | ||||||||||||||||||||||||||||||||||||||||||||||||
| -Retail | 50.0 | % | 100.0 | % | 698.98 | 6,000 | 6,000 | — | HSBC, Harman International | |||||||||||||||||||||||||||||||||||||||||||||||
| 50.0 | % | 24.8 | % | 427.04 | 3,700 | 36,000 | 36,000 | — | 74,119 | |||||||||||||||||||||||||||||||||||||||||||||||
| 304-306 Canal Street | ||||||||||||||||||||||||||||||||||||||||||||||||||||||||
| -Retail | 100.0 | % | 100.0 | % | 63.80 | 4,000 | 4,000 | — | Stellar Works | |||||||||||||||||||||||||||||||||||||||||||||||
'-Residential’ |
100.0 | % | — | 9,000 | — | 9,000 | ||||||||||||||||||||||||||||||||||||||||||||||||||
| 100.0 | % | 300 | 13,000 | 4,000 | 9,000 | — | ||||||||||||||||||||||||||||||||||||||||||||||||||
| 334 Canal Street | ||||||||||||||||||||||||||||||||||||||||||||||||||||||||
| -Retail | 100.0 | % | — | — | 4,000 | — | 4,000 | |||||||||||||||||||||||||||||||||||||||||||||||||
| -Residential | 100.0 | % | — | 7,000 | — | 7,000 | ||||||||||||||||||||||||||||||||||||||||||||||||||
| 100.0 | % | — | 11,000 | — | 11,000 | — | ||||||||||||||||||||||||||||||||||||||||||||||||||
| Total SoHo | 4,000 | 60,000 | 40,000 | 20,000 | 74,119 | |||||||||||||||||||||||||||||||||||||||||||||||||||
| NEW YORK SEGMENT | ||||||||||||||||||||||||||||||||||||||||||||||||||||||||
| PROPERTY TABLE | ||||||||||||||||||||||||||||||||||||||||||||||||||||||||
| (Annualized escalated rent amounts in thousands) | % Ownership |
% Occupancy |
Weighted
Average Escalated
Annual Rent
PSF(1)
|
Annualized Escalated Rent(2) |
Square Feet |
Encumbrances
(non-GAAP)
(in thousands)(3)
|
Major Tenants | |||||||||||||||||||||||||||||||||||||||||||||||||
| Property | Total Property |
In Service | Under Development or Not Available for Lease |
|||||||||||||||||||||||||||||||||||||||||||||||||||||
| NEW YORK (Continued): | ||||||||||||||||||||||||||||||||||||||||||||||||||||||||
| Times Square: | ||||||||||||||||||||||||||||||||||||||||||||||||||||||||
| 1540 Broadway | ||||||||||||||||||||||||||||||||||||||||||||||||||||||||
| -Retail | 52.0 | % | 78.5 | % | $ | 131.76 | $ | 17,000 | 162,000 | 162,000 | — | $ | — | U.S. Polo, Forever 21, Disney | ||||||||||||||||||||||||||||||||||||||||||
| 1535 Broadway | ||||||||||||||||||||||||||||||||||||||||||||||||||||||||
| -Retail | 52.0 | % | 100.0 | % | 1,103.47 | 45,000 | 45,000 | — | T-Mobile, Swatch Group USA, Levi's, Sephora, Anita La Mamma Del Gelato | |||||||||||||||||||||||||||||||||||||||||||||||
| -Theatre | 52.0 | % | 100.0 | % | 21.55 | 62,000 | 62,000 | — | Nederlander-Marquis Theatre | |||||||||||||||||||||||||||||||||||||||||||||||
| 52.0 | % | 100.0 | % | 428.02 | 42,400 | 107,000 | 107,000 | — | — | |||||||||||||||||||||||||||||||||||||||||||||||
| Total Times Square | 59,400 | 269,000 | 269,000 | — | — | |||||||||||||||||||||||||||||||||||||||||||||||||||
| Upper East Side: | ||||||||||||||||||||||||||||||||||||||||||||||||||||||||
| 1131 Third Avenue | ||||||||||||||||||||||||||||||||||||||||||||||||||||||||
| -Retail | 100.0 | % | 63.7 | % | 207.45 | 3,000 | 23,000 | 23,000 | — | — | Crunch LLC, J.Jill | |||||||||||||||||||||||||||||||||||||||||||||
| 40 East 66th Street | ||||||||||||||||||||||||||||||||||||||||||||||||||||||||
| -Residential (3 units) | 100.0 | % | 100.0 | % | 10,000 | 10,000 | — | — | ||||||||||||||||||||||||||||||||||||||||||||||||
| Total Upper East Side | 3,000 | 33,000 | 33,000 | — | — | |||||||||||||||||||||||||||||||||||||||||||||||||||
| Chelsea/Meatpacking District: | ||||||||||||||||||||||||||||||||||||||||||||||||||||||||
| 260 Eleventh Avenue | ||||||||||||||||||||||||||||||||||||||||||||||||||||||||
| (ground leased through 2114)** | ||||||||||||||||||||||||||||||||||||||||||||||||||||||||
| -Office | 100.0 | % | 100.0 | % | 49.79 | 10,400 | 209,000 | 209,000 | — | — | The City of New York | |||||||||||||||||||||||||||||||||||||||||||||
| 85 Tenth Avenue | Google, Telehouse International Corp., | |||||||||||||||||||||||||||||||||||||||||||||||||||||||
| -Office | 49.9 | % | 89.9 | % | 95.57 | 598,000 | 598,000 | — | Clear Secure, Inc., Shopify | |||||||||||||||||||||||||||||||||||||||||||||||
| -Retail | 49.9 | % | 76.3 | % | 96.01 | 43,000 | 43,000 | — | Verde | |||||||||||||||||||||||||||||||||||||||||||||||
| 49.9 | % | 89.1 | % | 95.60 | 54,300 | 641,000 | 641,000 | — | 625,000 | |||||||||||||||||||||||||||||||||||||||||||||||
| 537 West 26th Street | ||||||||||||||||||||||||||||||||||||||||||||||||||||||||
| -Retail | 100.0 | % | 100.0 | % | 161.89 | 2,800 | 17,000 | 17,000 | — | — | The Chelsea Factory Inc. | |||||||||||||||||||||||||||||||||||||||||||||
| 61 Ninth Avenue (2 buildings) | ||||||||||||||||||||||||||||||||||||||||||||||||||||||||
| (ground leased through 2115)** | ||||||||||||||||||||||||||||||||||||||||||||||||||||||||
| -Office | 45.1 | % | 100.0 | % | 148.69 | 171,000 | 171,000 | — | Aetna Life Insurance Company, Apple Inc. | |||||||||||||||||||||||||||||||||||||||||||||||
| -Retail | 45.1 | % | 100.0 | % | 402.12 | 23,000 | 23,000 | — | Starbucks | |||||||||||||||||||||||||||||||||||||||||||||||
| 45.1 | % | 100.0 | % | 165.36 | 34,400 | 194,000 | 194,000 | — | 167,500 | |||||||||||||||||||||||||||||||||||||||||||||||
| 512 West 22nd Street | Kenneth Cole Productions, Inc.*, Next Jump, Omniva LLC, | |||||||||||||||||||||||||||||||||||||||||||||||||||||||
| -Office | 55.0 | % | 100.0 | % | 114.71 | 165,000 | 165,000 | — | Capricorn Investment Group, Genius Sports* | |||||||||||||||||||||||||||||||||||||||||||||||
| -Retail | 55.0 | % | 100.0 | % | 109.97 | 8,000 | 8,000 | — | Galeria Nara Roesler, Harper's Books | |||||||||||||||||||||||||||||||||||||||||||||||
| 55.0 | % | 100.0 | % | 114.50 | 19,800 | 173,000 | 173,000 | — | 124,693 | |||||||||||||||||||||||||||||||||||||||||||||||
| Total Chelsea/Meatpacking District | 121,700 | 1,234,000 | 1,234,000 | — | 917,193 | |||||||||||||||||||||||||||||||||||||||||||||||||||
| NEW YORK SEGMENT | ||||||||||||||||||||||||||||||||||||||||||||||||||||||||
| PROPERTY TABLE | ||||||||||||||||||||||||||||||||||||||||||||||||||||||||
| (Annualized escalated rent amounts in thousands) | % Ownership |
% Occupancy |
Weighted
Average Escalated
Annual Rent
PSF(1)
|
Annualized Escalated Rent(2) |
Square Feet |
Encumbrances
(non-GAAP)
(in thousands)(3)
|
Major Tenants | |||||||||||||||||||||||||||||||||||||||||||||||||
| Property | Total Property |
In Service | Under Development or Not Available for Lease |
|||||||||||||||||||||||||||||||||||||||||||||||||||||
| NEW YORK (Continued): | ||||||||||||||||||||||||||||||||||||||||||||||||||||||||
| Tribeca: | ||||||||||||||||||||||||||||||||||||||||||||||||||||||||
| Independence Plaza | ||||||||||||||||||||||||||||||||||||||||||||||||||||||||
| -Residential (1,327 units) | 50.1 | % | 96.9 | % | 1,186,000 | 1,186,000 | — | |||||||||||||||||||||||||||||||||||||||||||||||||
| -Retail | 50.1 | % | 57.7 | % | $ | 88.70 | 72,000 | 72,000 | — | Duane Reade | ||||||||||||||||||||||||||||||||||||||||||||||
| 50.1 | % | $ | 4,700 | 1,258,000 | 1,258,000 | — | $ | 675,000 | ||||||||||||||||||||||||||||||||||||||||||||||||
| 339 Greenwich Street | ||||||||||||||||||||||||||||||||||||||||||||||||||||||||
| -Retail | 100.0 | % | 100.0 | % | 154.75 | 700 | 9,000 | 9,000 | — | — | Paper Moon* | |||||||||||||||||||||||||||||||||||||||||||||
| Total Tribeca | 5,400 | 1,267,000 | 1,267,000 | — | 675,000 | |||||||||||||||||||||||||||||||||||||||||||||||||||
| New Jersey: | ||||||||||||||||||||||||||||||||||||||||||||||||||||||||
| Paramus | ||||||||||||||||||||||||||||||||||||||||||||||||||||||||
| -Office | 100.0 | % | 85.6 | % | 26.38 | 2,800 | 129,000 | 129,000 | — | — | Vornado's Administrative Headquarters | |||||||||||||||||||||||||||||||||||||||||||||
| Property under Development: | ||||||||||||||||||||||||||||||||||||||||||||||||||||||||
| Sunset Pier 94 Studios (ground and building leased through 2110)** |
||||||||||||||||||||||||||||||||||||||||||||||||||||||||
| ‘-Studio | 49.9 | % | — | — | — | 266,000 | — | 266,000 | 60,449 | |||||||||||||||||||||||||||||||||||||||||||||||
| Properties to be Developed: | ||||||||||||||||||||||||||||||||||||||||||||||||||||||||
| Hotel Pennsylvania site (PENN 15) | ||||||||||||||||||||||||||||||||||||||||||||||||||||||||
| -Land | 100.0 | % | — | — | — | — | — | — | — | |||||||||||||||||||||||||||||||||||||||||||||||
| 57th Street | ||||||||||||||||||||||||||||||||||||||||||||||||||||||||
| -Land | 50.0 | % | — | — | — | — | — | — | — | |||||||||||||||||||||||||||||||||||||||||||||||
| Eighth Avenue and 34th Street | ||||||||||||||||||||||||||||||||||||||||||||||||||||||||
| -Land | 100.0 | % | — | — | — | — | — | — | — | |||||||||||||||||||||||||||||||||||||||||||||||
| New York Office: | ||||||||||||||||||||||||||||||||||||||||||||||||||||||||
| Total | 85.2 | % | $ | 91.08 | $ | 1,516,100 | 20,352,000 | 20,086,000 | 266,000 | $ | 8,435,663 | |||||||||||||||||||||||||||||||||||||||||||||
| Vornado's Ownership Interest | 84.4 | % | $ | 89.12 | $ | 1,267,500 | 17,532,000 | 17,399,000 | 133,000 | $ | 6,059,714 | |||||||||||||||||||||||||||||||||||||||||||||
| New York Retail: | ||||||||||||||||||||||||||||||||||||||||||||||||||||||||
| Total | 74.2 | % | $ | 249.77 | $ | 420,300 | 2,347,000 | 2,343,000 | 4,000 | $ | 699,922 | |||||||||||||||||||||||||||||||||||||||||||||
| Vornado's Ownership Interest | 72.2 | % | $ | 209.49 | $ | 284,500 | 1,945,000 | 1,941,000 | 4,000 | $ | 466,409 | |||||||||||||||||||||||||||||||||||||||||||||
| New York Residential: | ||||||||||||||||||||||||||||||||||||||||||||||||||||||||
| Total | 96.3 | % | 1,212,000 | 1,196,000 | 16,000 | $ | 675,000 | |||||||||||||||||||||||||||||||||||||||||||||||||
| Vornado's Ownership Interest | 96.5 | % | 620,000 | 604,000 | 16,000 | $ | 338,175 | |||||||||||||||||||||||||||||||||||||||||||||||||
| NEW YORK SEGMENT | ||||||||||||||||||||||||||||||||||||||||||||||||||||||||
| PROPERTY TABLE | ||||||||||||||||||||||||||||||||||||||||||||||||||||||||
| (Annualized escalated rent amounts in thousands) | % Ownership |
% Occupancy |
Weighted
Average Escalated
Annual Rent
PSF(1)
|
Annualized Escalated Rent(2) |
Square Feet |
Encumbrances
(non-GAAP)
(in thousands)(3)
|
Major Tenants | |||||||||||||||||||||||||||||||||||||||||||||||||
| Property | Total Property |
In Service | Under Development or Not Available for Lease |
|||||||||||||||||||||||||||||||||||||||||||||||||||||
| NEW YORK (Continued): | ||||||||||||||||||||||||||||||||||||||||||||||||||||||||
| ALEXANDER'S, INC.: | ||||||||||||||||||||||||||||||||||||||||||||||||||||||||
| 731 Lexington Avenue, Manhattan | ||||||||||||||||||||||||||||||||||||||||||||||||||||||||
| -Office | 32.4 | % | 100.0 | % | $ | 143.96 | 952,000 | 952,000 | — | $ | 400,000 | Bloomberg L.P. | ||||||||||||||||||||||||||||||||||||||||||||
| -Retail | 32.4 | % | 25.6 | % | 404.49 | 128,000 | 128,000 | — | 300,000 | Hutong, Capital One | ||||||||||||||||||||||||||||||||||||||||||||||
| 32.4 | % | 91.5 | % | 152.24 | $ | 148,000 | 1,080,000 | 1,080,000 | — | 700,000 | ||||||||||||||||||||||||||||||||||||||||||||||
| Rego Park I, Queens (4.8 acres) | 32.4 | % | 100.0 | % | 73.43 | 6,300 | 338,000 | 86,000 | 252,000 | Burlington, Marshalls | ||||||||||||||||||||||||||||||||||||||||||||||
| Rego Park II (adjacent to Rego Park I), | ||||||||||||||||||||||||||||||||||||||||||||||||||||||||
| Queens (6.6 acres) | 32.4 | % | 99.0 | % | 75.17 | 41,700 | 615,000 | 479,000 | 136,000 | 201,754 | Costco, Kohl's, TJ Maxx, Best Buy | |||||||||||||||||||||||||||||||||||||||||||||
| Flushing, Queens (1.0 acre ground leased through 2037)** | 32.4 | % | 100.0 | % | 33.50 | 5,600 | 167,000 | 167,000 | — | — | New World Mall LLC | |||||||||||||||||||||||||||||||||||||||||||||
| The Alexander Apartment Tower, | ||||||||||||||||||||||||||||||||||||||||||||||||||||||||
| Rego Park, Queens, NY | ||||||||||||||||||||||||||||||||||||||||||||||||||||||||
| -Residential (312 units) | 32.4 | % | 93.9 | % | 255,000 | 255,000 | — | 94,000 | ||||||||||||||||||||||||||||||||||||||||||||||||
| Total Alexander's | 32.4 | % | 94.7 | % | 115.21 | 201,600 | 2,455,000 | 2,067,000 | 388,000 | 995,754 | ||||||||||||||||||||||||||||||||||||||||||||||
| Total New York | 84.9 | % | $ | 105.74 | $ | 2,138,000 | 26,366,000 | 25,692,000 | 674,000 | $ | 10,806,339 | |||||||||||||||||||||||||||||||||||||||||||||
| Vornado's Ownership Interest | 83.5 | % | $ | 99.73 | $ | 1,657,900 | 20,893,000 | 20,614,000 | 279,000 | $ | 7,186,922 | |||||||||||||||||||||||||||||||||||||||||||||
| OTHER SEGMENT | ||||||||||||||||||||||||||||||||||||||||||||||||||||||||
| PROPERTY TABLE | ||||||||||||||||||||||||||||||||||||||||||||||||||||||||
| (Annualized escalated rent amounts in thousands) | % Ownership |
% Occupancy |
Weighted
Average Escalated
Annual Rent
PSF(1)
|
Annualized Escalated Rent(2) |
Square Feet |
Encumbrances
(non-GAAP)
(in thousands)(3)
|
Major Tenants | |||||||||||||||||||||||||||||||||||||||||||||||||
| Property | Total Property |
In Service | Under Development or Not Available for Lease |
|||||||||||||||||||||||||||||||||||||||||||||||||||||
| THE MART: | ||||||||||||||||||||||||||||||||||||||||||||||||||||||||
| THE MART, Chicago | ||||||||||||||||||||||||||||||||||||||||||||||||||||||||
| Motorola Mobility (guaranteed by Google), Avant LLC, | ||||||||||||||||||||||||||||||||||||||||||||||||||||||||
| ANGI Home Services, Inc, Paypal, Inc., ConAgra Foods Inc., | ||||||||||||||||||||||||||||||||||||||||||||||||||||||||
| Allscripts Healthcare, Clear Channel Outdoor LLC*, IPG and affiliates, | ||||||||||||||||||||||||||||||||||||||||||||||||||||||||
| Government Employees Insurance Company*, Medline Industries, Inc, | ||||||||||||||||||||||||||||||||||||||||||||||||||||||||
| -Office | 100.0 | % | 84.3 | % | $ | 50.77 | $ | 90,600 | 2,098,000 | 2,098,000 | — | Innovation Development Institute, Inc., Allstate Insurance Company | ||||||||||||||||||||||||||||||||||||||||||||
| -Showroom/Trade show | 100.0 | % | 70.1 | % | 58.69 | 60,600 | 1,503,000 | 1,503,000 | — | Holly Hunt Ltd., Baker Interiors Group, Ltd. | ||||||||||||||||||||||||||||||||||||||||||||||
| -Retail | 100.0 | % | 71.2 | % | 49.01 | 3,000 | 91,000 | 91,000 | — | |||||||||||||||||||||||||||||||||||||||||||||||
| 100.0 | % | 78.2 | % | 53.61 | 154,200 | 3,692,000 | 3,692,000 | — | $ | — | ||||||||||||||||||||||||||||||||||||||||||||||
| Other (1 property) | 50.0 | % | 100.0 | % | 73.07 | 300 | 4,000 | 4,000 | — | 18,404 | ||||||||||||||||||||||||||||||||||||||||||||||
| Total THE MART, Chicago | 154,500 | 3,696,000 | 3,696,000 | — | 18,404 | |||||||||||||||||||||||||||||||||||||||||||||||||||
| Property to be Developed: | ||||||||||||||||||||||||||||||||||||||||||||||||||||||||
| 527 West Kinzie, Chicago | 100.0 | % | — | — | — | — | — | — | — | |||||||||||||||||||||||||||||||||||||||||||||||
| Total THE MART | 78.2 | % | $ | 53.64 | $ | 154,500 | 3,696,000 | 3,696,000 | — | $ | 18,404 | |||||||||||||||||||||||||||||||||||||||||||||
| Vornado's Ownership Interest | 78.2 | % | $ | 53.63 | $ | 154,400 | 3,694,000 | 3,694,000 | — | $ | 9,202 | |||||||||||||||||||||||||||||||||||||||||||||
| 555 California Street: | ||||||||||||||||||||||||||||||||||||||||||||||||||||||||
| 555 California Street | 70.0 | % | 97.0 | % | $ | 99.26 | $ | 142,600 | 1,508,000 | 1,508,000 | — | $ | 1,200,000 | Bank of America, N.A., Dodge & Cox, Goldman Sachs & Co., | ||||||||||||||||||||||||||||||||||||||||||
| Jones Day, Kirkland & Ellis LLP, Morgan Stanley & Co. Inc., | ||||||||||||||||||||||||||||||||||||||||||||||||||||||||
| McKinsey & Company Inc., UBS Financial Services, | ||||||||||||||||||||||||||||||||||||||||||||||||||||||||
| KKR Financial, Microsoft Corporation, | ||||||||||||||||||||||||||||||||||||||||||||||||||||||||
| Fenwick & West LLP, Sidley Austin | ||||||||||||||||||||||||||||||||||||||||||||||||||||||||
| 315 Montgomery Street | 70.0 | % | 93.6 | % | 90.81 | 19,700 | 236,000 | 236,000 | — | — | Bank of America, N.A., Regus, Ripple Labs Inc., Blue Shield, Lending Home Corporation |
|||||||||||||||||||||||||||||||||||||||||||||
| 345 Montgomery Street | 70.0 | % | — | % | — | — | 78,000 | 78,000 | — | — | ||||||||||||||||||||||||||||||||||||||||||||||
| Total 555 California Street | 92.3 | % | $ | 98.16 | $ | 162,300 | 1,822,000 | 1,822,000 | — | $ | 1,200,000 | |||||||||||||||||||||||||||||||||||||||||||||
| Vornado's Ownership Interest | 92.3 | % | $ | 98.16 | $ | 113,600 | 1,275,000 | 1,275,000 | — | $ | 840,000 | |||||||||||||||||||||||||||||||||||||||||||||
| OTHER SEGMENT | ||||||||||||||||||||||||||||||||||||||||||||||||||||||||
| PROPERTY TABLE | ||||||||||||||||||||||||||||||||||||||||||||||||||||||||
| (Annualized escalated rent amounts in thousands) | % Ownership |
% Occupancy |
Weighted
Average Escalated
Annual Rent
PSF(1)
|
Annualized Escalated Rent(2) |
Square Feet |
Encumbrances
(non-GAAP)
(in thousands)(3)
|
Major Tenants | |||||||||||||||||||||||||||||||||||||||||||||||||
| Property | Total Property |
Under Development or Not Available for Lease |
||||||||||||||||||||||||||||||||||||||||||||||||||||||
| In Service | ||||||||||||||||||||||||||||||||||||||||||||||||||||||||
| OTHER: | ||||||||||||||||||||||||||||||||||||||||||||||||||||||||
| Virginia: | ||||||||||||||||||||||||||||||||||||||||||||||||||||||||
| Rosslyn Plaza | ||||||||||||||||||||||||||||||||||||||||||||||||||||||||
| -Office - 4 buildings | 46.2 | % | 27.7 | % | $ | 51.18 | 736,000 | 432,000 | 304,000 | Nathan Associates | ||||||||||||||||||||||||||||||||||||||||||||||
| -Residential - 2 buildings (197 units) | 43.7 | % | 100.0 | % | 253,000 | 253,000 | — | |||||||||||||||||||||||||||||||||||||||||||||||||
| 45.6 | % | $ | 6,000 | 989,000 | 685,000 | 304,000 | $ | 25,000 | ||||||||||||||||||||||||||||||||||||||||||||||||
| Fashion Centre Mall / Washington Tower | ||||||||||||||||||||||||||||||||||||||||||||||||||||||||
| -Office | 7.5 | % | 75.0 | % | 58.35 | 170,000 | 170,000 | — | 42,300 | The Rand Corporation | ||||||||||||||||||||||||||||||||||||||||||||||
| -Retail | 7.5 | % | 97.6 | % | 38.83 | 868,000 | 868,000 | — | 412,700 | Macy's, Nordstrom | ||||||||||||||||||||||||||||||||||||||||||||||
| 7.5 | % | 93.9 | % | 41.38 | 52,700 | 1,038,000 | 1,038,000 | — | 455,000 | |||||||||||||||||||||||||||||||||||||||||||||||
| New Jersey: | ||||||||||||||||||||||||||||||||||||||||||||||||||||||||
| Wayne Town Center, Wayne (ground leased through 2064)**
|
100.0 | % | 100.0 | % | 28.99 | 13,400 | 690,000 | 686,000 | 4,000 | — | Costco, Dick's Sporting Goods, | |||||||||||||||||||||||||||||||||||||||||||||
| Nordstrom Rack, UFC FIT | ||||||||||||||||||||||||||||||||||||||||||||||||||||||||
|
Atlantic City
(11.3 acres ground leased through 2070 to VICI Properties for a
portion of the Borgata Hotel and Casino complex)
|
100.0 | % | 100.0 | % | — | 8,100 | — | — | — | — | VICI Properties (ground lessee) | |||||||||||||||||||||||||||||||||||||||||||||
| Maryland: | ||||||||||||||||||||||||||||||||||||||||||||||||||||||||
| Annapolis (ground and building leased through 2042)**
|
100.0 | % | 100.0 | % | 11.70 | 1,400 | 128,000 | 128,000 | — | — | The Home Depot | |||||||||||||||||||||||||||||||||||||||||||||
| Total Other | 83.5 | % | $ | 38.50 | $ | 81,600 | 2,845,000 | 2,537,000 | 308,000 | $ | 480,000 | |||||||||||||||||||||||||||||||||||||||||||||
| Vornado's Ownership Interest | 86.3 | % | $ | 24.84 | $ | 29,700 | 1,346,000 | 1,202,000 | 144,000 | $ | 46,728 | |||||||||||||||||||||||||||||||||||||||||||||
| INVESTOR INFORMATION | |||||||||||||||||
| Corporate Officers: | |||||||||||||||||
| Steven Roth | Chairman of the Board and Chief Executive Officer | ||||||||||||||||
| Michael J. Franco | President and Chief Financial Officer | ||||||||||||||||
| Glen J. Weiss | Executive Vice President - Office Leasing - Co-Head of Real Estate | ||||||||||||||||
| Barry S. Langer | Executive Vice President - Development - Co-Head of Real Estate | ||||||||||||||||
| Haim Chera | Executive Vice President - Head of Retail | ||||||||||||||||
| Thomas J. Sanelli | Executive Vice President - Finance and Chief Administrative Officer | ||||||||||||||||
| RESEARCH COVERAGE | |||||||||||||||||
| Jeff Spector/Jana Galan | Steve Sakwa | Vikram Malhotra | |||||||||||||||
| Bank of America/BofA Securities | Evercore ISI | Mizuho Securities (USA) Inc. | |||||||||||||||
| 646-855-1363/646-855-3081 | 212-446-9462 | 212-282-3827 | |||||||||||||||
| Brendan Lynch | Caitlin Burrows | Ronald Kamdem | |||||||||||||||
| Barclays Capital | Goldman Sachs | Morgan Stanley | |||||||||||||||
| 212-526-9428 | 212-902-4736 | 212-296-8319 | |||||||||||||||
| John P. Kim | Dylan Burzinski | Alexander Goldfarb/Connor Mitchell | |||||||||||||||
| BMO Capital Markets | Green Street Advisors | Piper Sandler | |||||||||||||||
| 212-885-4115 | 949-640-8780 | 212-466-7937/203-861-7615 | |||||||||||||||
| Nicholas Joseph/Seth Bergey | Anthony Paolone/Ray Zhong | Nicholas Yulico | |||||||||||||||
| Citi | JP Morgan | Scotia Capital (USA) Inc | |||||||||||||||
| 212-816-1909/212-816-2066 | 212-622-6682/212-622-5411 | 212-225-6904 | |||||||||||||||
| Floris van Dijkum | Mark Streeter/Ian Snyder | Michael Lewis | |||||||||||||||
| Compass Point | JP Morgan Fixed Income | Truist Securities | |||||||||||||||
| 646-757-2621 | 212-834-5086/212-834-3798 | 212-319-5659 | |||||||||||||||
| Research Coverage - is provided as a service to interested parties and not as an endorsement of any report, or representation as to the accuracy of any information contained therein. Opinions, forecasts and other forward-looking statements expressed in analysts' reports are subject to change without notice. | |||||||||||||||||
| FINANCIAL SUPPLEMENT DEFINITIONS | ||
|
NON-GAAP RECONCILIATIONS
RECONCILIATION OF NET INCOME (LOSS) ATTRIBUTABLE TO COMMON SHAREHOLDERS TO FFO ATTRIBUTABLE TO COMMON SHAREHOLDERS PLUS ASSUMED CONVERSIONS (unaudited)
|
|||||||||||||||||
| (Amounts in thousands, except per share amounts) | |||||||||||||||||
| For the Three Months Ended | |||||||||||||||||
| March 31, | December 31, 2024 | ||||||||||||||||
| 2025 | 2024 | ||||||||||||||||
| Reconciliation of net income (loss) attributable to common shareholders to FFO attributable to common shareholders plus assumed conversions (non-GAAP): | |||||||||||||||||
| Net income (loss) attributable to common shareholders | $ | 86,842 | $ | (9,034) | $ | 1,203 | |||||||||||
| Per diluted share | $ | 0.43 | $ | (0.05) | $ | 0.01 | |||||||||||
| FFO adjustments: | |||||||||||||||||
| Depreciation and amortization of real property | $ | 104,257 | $ | 96,783 | $ | 101,824 | |||||||||||
| Our share of partially owned entities: | |||||||||||||||||
| Net gain on sale of real estate | (77,008) | — | — | ||||||||||||||
| Depreciation and amortization of real property | 24,525 | 26,163 | 23,483 | ||||||||||||||
| FFO adjustments, net | 51,774 | 122,946 | 125,307 | ||||||||||||||
| Impact of assumed conversion of dilutive convertible securities | 310 | 388 | 358 | ||||||||||||||
| Noncontrolling interests' share of above adjustments on a dilutive basis | (3,887) | (10,171) | (9,783) | ||||||||||||||
| FFO attributable to common shareholders plus assumed conversions (non-GAAP) | 135,039 | 104,129 | 117,085 | ||||||||||||||
| Add back of FFO allocated to noncontrolling interests of the Operating Partnership | 11,747 | 9,356 | 9,890 | ||||||||||||||
| FFO attributable to Class A unitholders (non-GAAP) | $ | 146,786 | $ | 113,485 | $ | 126,975 | |||||||||||
| FFO per diluted share (non-GAAP) | $ | 0.67 | $ | 0.53 | $ | 0.58 | |||||||||||
NON-GAAP RECONCILIATIONS RECONCILIATION OF FFO ATTRIBUTABLE TO COMMON SHAREHOLDERS PLUS ASSUMED CONVERSIONS TO FFO ATTRIBUTABLE TO COMMON SHAREHOLDERS PLUS ASSUMED CONVERSIONS, AS ADJUSTED (unaudited) | |||||||||||||||||
| (Amounts in thousands, except per share amounts) | |||||||||||||||||
| For the Three Months Ended | |||||||||||||||||
| March 31, | December 31, 2024 | ||||||||||||||||
| 2025 | 2024 | ||||||||||||||||
| FFO attributable to common shareholders plus assumed conversions (non-GAAP) | $ | 135,039 | $ | 104,129 | $ | 117,085 | |||||||||||
| Per diluted share (non-GAAP) | $ | 0.67 | $ | 0.53 | $ | 0.58 | |||||||||||
| Certain (income) expense items that impact FFO attributable to common shareholders plus assumed conversions: | |||||||||||||||||
| After-tax net gain on sale of 220 Central Park South ("220 CPS") condominium units and ancillary amenities | $ | (11,028) | $ | — | $ | — | |||||||||||
| Deferred tax liability on our investment in the Farley Building (held through a taxable REIT subsidiary) | 3,205 | 4,134 | 3,456 | ||||||||||||||
| Other | (1,735) | 1,009 | 2,104 | ||||||||||||||
| (9,558) | 5,143 | 5,560 | |||||||||||||||
| Noncontrolling interests' share of above adjustments on a dilutive basis | 764 | (425) | (433) | ||||||||||||||
| Total of certain (income) expense items that impact FFO attributable to common shareholders plus assumed conversions, net | $ | (8,794) | $ | 4,718 | $ | 5,127 | |||||||||||
| FFO attributable to common shareholders plus assumed conversions, as adjusted (non-GAAP) | $ | 126,245 | $ | 108,847 | $ | 122,212 | |||||||||||
| Per diluted share (non-GAAP) | $ | 0.63 | $ | 0.55 | $ | 0.61 | |||||||||||
|
NON-GAAP RECONCILIATIONS
RECONCILIATION OF FFO ATTRIBUTABLE TO COMMON SHAREHOLDERS PLUS ASSUMED CONVERSIONS TO FAD (unaudited)
| ||||||||||||||||||||
| (Amounts in thousands) | ||||||||||||||||||||
| For the Three Months Ended | ||||||||||||||||||||
| March 31, | December 31, 2024 | |||||||||||||||||||
| 2025 | 2024 | |||||||||||||||||||
| FFO attributable to common shareholders, plus assumed conversions | (A) | $ | 135,039 | $ | 104,129 | $ | 117,085 | |||||||||||||
| Adjustments to arrive at FAD (at Vornado's share): | ||||||||||||||||||||
| Certain items that impact FAD | (9,558) | 5,143 | 5,560 | |||||||||||||||||
| Recurring tenant improvements, leasing commissions and other capital expenditures | (48,071) | (39,633) | (55,350) | |||||||||||||||||
| Stock-based compensation expense | 6,022 | 7,519 | 7,359 | |||||||||||||||||
| Amortization of debt issuance costs and other non-cash interest expense | 12,089 | 17,388 | 13,280 | |||||||||||||||||
| Personal property depreciation | 1,526 | 1,428 | 1,532 | |||||||||||||||||
| Non-cash adjustments for straight-line rents, amortization of acquired below-market leases, net and other | (23,919) | (1,511) | (8,378) | |||||||||||||||||
| Noncontrolling interests in the Operating Partnership's share of above adjustments | 5,139 | 800 | 2,946 | |||||||||||||||||
| FAD adjustments, net | (B) | (56,772) | (8,866) | (33,051) | ||||||||||||||||
| FAD (non-GAAP) | (A+B) | $ | 78,267 | $ | 95,263 | $ | 84,034 | |||||||||||||
FAD payout ratio |
N/A | (1) | N/A | N/A | ||||||||||||||||
|
NON-GAAP RECONCILIATIONS
RECONCILIATION OF NET INCOME (LOSS) TO NET OPERATING INCOME AT SHARE AND NET OPERATING INCOME AT SHARE - CASH BASIS (unaudited)
| |||||||||||||||||||||||||||||||||||||||||||||||||||||||||||
| (Amounts in thousands) | |||||||||||||||||||||||||||||||||||||||||||||||||||||||||||
| For the Three Months Ended | |||||||||||||||||
| March 31, | December 31, 2024 | ||||||||||||||||
| 2025 | 2024 | ||||||||||||||||
| Net income (loss) | $ | 99,824 | $ | (6,273) | $ | 5,758 | |||||||||||
| Depreciation and amortization expense | 116,155 | 108,659 | 113,061 | ||||||||||||||
| General and administrative expense | 38,597 | 37,897 | 36,637 | ||||||||||||||
| Transaction related costs and other | 43 | 653 | 1,341 | ||||||||||||||
| Income from partially owned entities | (96,977) | (16,279) | (30,007) | ||||||||||||||
| Interest and other investment income, net | (8,261) | (11,724) | (11,348) | ||||||||||||||
| Interest and debt expense | 95,816 | 90,478 | 100,483 | ||||||||||||||
| Net gains on disposition of wholly owned and partially owned assets | (15,551) | — | — | ||||||||||||||
| Income tax expense | 7,193 | 6,740 | 5,822 | ||||||||||||||
| NOI from partially owned entities | 67,111 | 70,369 | 73,270 | ||||||||||||||
| NOI attributable to noncontrolling interests in consolidated subsidiaries | (10,660) | (11,396) | (10,051) | ||||||||||||||
| NOI at share | 293,290 | 269,124 | 284,966 | ||||||||||||||
| Non-cash adjustments for straight-line rents, amortization of acquired below-market leases, net, and other | (23,919) | (1,511) | (8,378) | ||||||||||||||
| NOI at share - cash basis | $ | 269,371 | $ | 267,613 | $ | 276,588 | |||||||||||
|
NON-GAAP RECONCILIATIONS
COMPONENTS OF NET OPERATING INCOME AT SHARE AND NET OPERATING INCOME AT SHARE - CASH BASIS (unaudited)
| |||||||||||||||||||||||||||||||||||||||||||||||||||||||||||
| (Amounts in thousands) | |||||||||||||||||||||||||||||||||||||||||||||||||||||||||||
| For the Three Months Ended March 31, | |||||||||||||||||||||||||||||||||||||||||||||||||||||||||||
| Total Revenues | Operating Expenses | NOI | Non-cash Adjustments(1) |
NOI - cash basis | |||||||||||||||||||||||||||||||||||||||||||||||||||||||
| 2025 | 2024 | 2025 | 2024 | 2025 | 2024 | 2025 | 2024 | 2025 | 2024 | ||||||||||||||||||||||||||||||||||||||||||||||||||
| New York | $ | 376,206 | $ | 358,234 | $ | (183,640) | $ | (188,278) | $ | 192,566 | $ | 169,956 | $ | (18,710) | $ | 1,271 | $ | 173,856 | $ | 171,227 | |||||||||||||||||||||||||||||||||||||||
| Other | 85,373 | 78,141 | (41,100) | (37,946) | 44,273 | 40,195 | 1,798 | 870 | 46,071 | 41,065 | |||||||||||||||||||||||||||||||||||||||||||||||||
| Consolidated total | 461,579 | 436,375 | (224,740) | (226,224) | 236,839 | 210,151 | (16,912) | 2,141 | 219,927 | 212,292 | |||||||||||||||||||||||||||||||||||||||||||||||||
| Noncontrolling interests' share in consolidated subsidiaries | (53,035) | (53,167) | 42,375 | 41,771 | (10,660) | (11,396) | (3,770) | (5,138) | (14,430) | (16,534) | |||||||||||||||||||||||||||||||||||||||||||||||||
| Our share of partially owned entities | 116,389 | 120,742 | (49,278) | (50,373) | 67,111 | 70,369 | (3,237) | 1,486 | 63,874 | 71,855 | |||||||||||||||||||||||||||||||||||||||||||||||||
| Vornado's share | $ | 524,933 | $ | 503,950 | $ | (231,643) | $ | (234,826) | $ | 293,290 | $ | 269,124 | $ | (23,919) | $ | (1,511) | $ | 269,371 | $ | 267,613 | |||||||||||||||||||||||||||||||||||||||
| For the Three Months Ended December 31, 2024 | |||||||||||||||||||||||||||||
| Total Revenues | Operating Expenses | NOI | Non-cash Adjustments(1) |
NOI - cash basis | |||||||||||||||||||||||||
| New York | $ | 383,702 | $ | (194,195) | $ | 189,507 | $ | (8,222) | $ | 181,285 | |||||||||||||||||||
| Other | 74,088 | (41,848) | 32,240 | 7,543 | 39,783 | ||||||||||||||||||||||||
| Consolidated total | 457,790 | (236,043) | 221,747 | (679) | 221,068 | ||||||||||||||||||||||||
| Noncontrolling interests' share in consolidated subsidiaries | (53,503) | 43,452 | (10,051) | (5,175) | (15,226) | ||||||||||||||||||||||||
| Our share of partially owned entities | 122,859 | (49,589) | 73,270 | (2,524) | 70,746 | ||||||||||||||||||||||||
| Vornado's share | $ | 527,146 | $ | (242,180) | $ | 284,966 | $ | (8,378) | $ | 276,588 | |||||||||||||||||||
| NON-GAAP RECONCILIATIONS | ||
| RECONCILIATION OF NOI AT SHARE TO SAME STORE NOI AT SHARE FOR THE THREE MONTHS ENDED MARCH 31, 2025 COMPARED TO MARCH 31, 2024 (unaudited) | ||
| (Amounts in thousands) | ||
| Total | New York | THE MART | 555 California Street | Other | |||||||||||||||||||||||||
| NOI at share for the three months ended March 31, 2025 | $ | 293,290 | $ | 253,317 | $ | 15,916 | $ | 17,843 | $ | 6,214 | |||||||||||||||||||
| Less NOI at share from: | |||||||||||||||||||||||||||||
| Dispositions | (221) | (153) | (68) | — | — | ||||||||||||||||||||||||
| Development properties | (6,730) | (6,730) | — | — | — | ||||||||||||||||||||||||
| Other non-same store income, net | (27,536) | (20,866) | — | (456) | (6,214) | ||||||||||||||||||||||||
| Same store NOI at share for the three months ended March 31, 2025 | $ | 258,803 | $ | 225,568 | $ | 15,848 | $ | 17,387 | $ | — | |||||||||||||||||||
| NOI at share for the three months ended March 31, 2024 | $ | 269,124 | $ | 233,129 | $ | 14,486 | $ | 16,529 | $ | 4,980 | |||||||||||||||||||
| Less NOI at share from: | |||||||||||||||||||||||||||||
| Dispositions | (3,408) | (3,374) | (34) | — | — | ||||||||||||||||||||||||
| Development properties | (9,727) | (9,727) | — | — | — | ||||||||||||||||||||||||
| Other non-same store income, net | (6,029) | (1,049) | — | — | (4,980) | ||||||||||||||||||||||||
| Same store NOI at share for the three months ended March 31, 2024 | $ | 249,960 | $ | 218,979 | $ | 14,452 | $ | 16,529 | $ | — | |||||||||||||||||||
| Increase in same store NOI at share | $ | 8,843 | $ | 6,589 | $ | 1,396 | $ | 858 | $ | — | |||||||||||||||||||
| % increase in same store NOI at share | 3.5 | % | 3.0 | % | 9.7 | % | 5.2 | % | 0.0 | % | |||||||||||||||||||
| NON-GAAP RECONCILIATIONS | ||
| RECONCILIATION OF NOI AT SHARE - CASH BASIS TO SAME STORE NOI AT SHARE - CASH BASIS FOR THE THREE MONTHS ENDED MARCH 31, 2025 COMPARED TO MARCH 31, 2024 (unaudited) | ||
| (Amounts in thousands) | ||
| Total | New York | THE MART | 555 California Street | Other | |||||||||||||||||||||||||
| NOI at share - cash basis for the three months ended March 31, 2025 | $ | 269,371 | $ | 227,570 | $ | 17,517 | $ | 18,137 | $ | 6,147 | |||||||||||||||||||
| Less NOI at share - cash basis from: | |||||||||||||||||||||||||||||
| Dispositions | (223) | (153) | (70) | — | — | ||||||||||||||||||||||||
| Development properties | (6,489) | (6,489) | — | — | — | ||||||||||||||||||||||||
| Other non-same store income, net | (11,631) | (5,484) | — | — | (6,147) | ||||||||||||||||||||||||
| Same store NOI at share - cash basis for the three months ended March 31, 2025 | $ | 251,028 | $ | 215,444 | $ | 17,447 | $ | 18,137 | $ | — | |||||||||||||||||||
| NOI at share - cash basis for the three months ended March 31, 2024 | $ | 267,613 | $ | 230,794 | $ | 14,949 | $ | 16,938 | $ | 4,932 | |||||||||||||||||||
| Less NOI at share - cash basis from: | |||||||||||||||||||||||||||||
| Dispositions | (2,894) | (2,895) | 1 | — | — | ||||||||||||||||||||||||
| Development properties | (9,244) | (9,244) | — | — | — | ||||||||||||||||||||||||
| Other non-same store income, net | (6,598) | (1,666) | — | — | (4,932) | ||||||||||||||||||||||||
| Same store NOI at share - cash basis for the three months ended March 31, 2024 | $ | 248,877 | $ | 216,989 | $ | 14,950 | $ | 16,938 | $ | — | |||||||||||||||||||
| Increase (decrease) in same store NOI at share - cash basis | $ | 2,151 | $ | (1,545) | $ | 2,497 | $ | 1,199 | $ | — | |||||||||||||||||||
| % increase (decrease) in same store NOI at share - cash basis | 0.9 | % | (0.7) | % | 16.7 | % | 7.1 | % | 0.0 | % | |||||||||||||||||||
| NON-GAAP RECONCILIATIONS | ||
| RECONCILIATION OF NOI AT SHARE TO SAME STORE NOI AT SHARE FOR THE THREE MONTHS ENDED MARCH 31, 2025 COMPARED TO DECEMBER 31, 2024 (unaudited) | ||
| (Amounts in thousands) | ||
| Total | New York | THE MART | 555 California Street | Other | |||||||||||||||||||||||||
| NOI at share for the three months ended March 31, 2025 | $ | 293,290 | $ | 253,317 | $ | 15,916 | $ | 17,843 | $ | 6,214 | |||||||||||||||||||
| Less NOI at share from: | |||||||||||||||||||||||||||||
| Dispositions | (221) | (153) | (68) | — | — | ||||||||||||||||||||||||
| Development properties | (6,196) | (6,196) | — | — | — | ||||||||||||||||||||||||
| Other non-same store income, net | (26,946) | (20,276) | — | (456) | (6,214) | ||||||||||||||||||||||||
| Same store NOI at share for the three months ended March 31, 2025 | $ | 259,927 | $ | 226,692 | $ | 15,848 | $ | 17,387 | $ | — | |||||||||||||||||||
| NOI at share for the three months ended December 31, 2024 | $ | 284,966 | $ | 257,040 | $ | 6,168 | $ | 15,854 | $ | 5,904 | |||||||||||||||||||
| Less NOI at share from: | |||||||||||||||||||||||||||||
| Dispositions | (3,610) | (3,518) | (92) | — | — | ||||||||||||||||||||||||
| Development properties | (5,627) | (5,627) | — | — | — | ||||||||||||||||||||||||
| Other non-same store income, net | (11,880) | (5,850) | — | (126) | (5,904) | ||||||||||||||||||||||||
| Same store NOI at share for the three months ended December 31, 2024 | $ | 263,849 | $ | 242,045 | $ | 6,076 | $ | 15,728 | $ | — | |||||||||||||||||||
| (Decrease) increase in same store NOI at share | $ | (3,922) | $ | (15,353) | $ | 9,772 | $ | 1,659 | $ | — | |||||||||||||||||||
| % (decrease) increase in same store NOI at share | (1.5) | % | (6.3) | % | 160.8 | % | 10.5 | % | 0.0 | % | |||||||||||||||||||
| NON-GAAP RECONCILIATIONS | ||
| RECONCILIATION OF NOI AT SHARE - CASH BASIS TO SAME STORE NOI AT SHARE - CASH BASIS FOR THE THREE MONTHS ENDED MARCH 31, 2025 COMPARED TO DECEMBER 31, 2024 (unaudited) | ||
| Total | New York | THE MART | 555 California Street | Other | |||||||||||||||||||||||||
| NOI at share - cash basis for the three months ended March 31, 2025 | $ | 269,371 | $ | 227,570 | $ | 17,517 | $ | 18,137 | $ | 6,147 | |||||||||||||||||||
| Less NOI at share - cash basis from: | |||||||||||||||||||||||||||||
| Dispositions | (223) | (153) | (70) | — | — | ||||||||||||||||||||||||
| Development properties | 137 | 137 | — | — | — | ||||||||||||||||||||||||
| Other non-same store income, net | (10,995) | (4,848) | — | — | (6,147) | ||||||||||||||||||||||||
| Same store NOI at share - cash basis for the three months ended March 31, 2025 | $ | 258,290 | $ | 222,706 | $ | 17,447 | $ | 18,137 | $ | — | |||||||||||||||||||
| NOI at share - cash basis for the three months ended December 31, 2024 | $ | 276,588 | $ | 241,933 | $ | 10,550 | $ | 18,138 | $ | 5,967 | |||||||||||||||||||
| Less NOI at share - cash basis from: | |||||||||||||||||||||||||||||
| Dispositions | (2,312) | (2,218) | (94) | — | — | ||||||||||||||||||||||||
| Development properties | (1,664) | (1,664) | — | — | — | ||||||||||||||||||||||||
| Other non-same store income, net | (10,263) | (4,153) | — | (143) | (5,967) | ||||||||||||||||||||||||
| Same store NOI at share - cash basis for the three months ended December 31, 2024 | $ | 262,349 | $ | 233,898 | $ | 10,456 | $ | 17,995 | $ | — | |||||||||||||||||||
| (Decrease) increase in same store NOI at share - cash basis | $ | (4,059) | $ | (11,192) | $ | 6,991 | $ | 142 | $ | — | |||||||||||||||||||
| % (decrease) increase in same store NOI at share - cash basis | (1.5) | % | (4.8) | % | 66.9 | % | 0.8 | % | 0.0 | % | |||||||||||||||||||
| NON-GAAP RECONCILIATIONS | |||||||||||||||||
RECONCILIATION OF CONSOLIDATED DEBT, NET TO CONSOLIDATED CONTRACTUAL DEBT (unaudited) | |||||||||||||||||
| (Amounts in thousands) | |||||||||||||||||
| As of March 31, 2025 | |||||||||||||||||
Consolidated Debt, Net |
Deferred Financing Costs, Net and Other |
Consolidated Contractual Debt |
|||||||||||||||
| Mortgages payable | $ | 5,674,519 | $ | 28,288 | $ | 5,702,807 | |||||||||||
| Senior unsecured notes | 746,282 | 3,718 | 750,000 | ||||||||||||||
| $800 Million unsecured term loan | 796,295 | 3,705 | 800,000 | ||||||||||||||
| $2.2 Billion unsecured revolving credit facilities | 575,000 | — | 575,000 | ||||||||||||||
| $ | 7,792,096 | $ | 35,711 | $ | 7,827,807 | ||||||||||||
|
NON-GAAP RECONCILIATIONS
RECONCILIATION OF NET INCOME (LOSS) TO EBITDAre (unaudited)
|
||||||||||||||||||||
| (Amounts in thousands) | ||||||||||||||||||||
| For the Three Months Ended | |||||||||||||||||
| March 31, | December 31, 2024 | ||||||||||||||||
| 2025 | 2024 | ||||||||||||||||
| Reconciliation of net income (loss) to EBITDAre (non-GAAP): | |||||||||||||||||
| Net income (loss) | $ | 99,824 | $ | (6,273) | $ | 5,758 | |||||||||||
| Less net loss attributable to noncontrolling interests in consolidated subsidiaries | 10,433 | 11,982 | 11,107 | ||||||||||||||
| Net income attributable to the Operating Partnership | 110,257 | 5,709 | 16,865 | ||||||||||||||
| EBITDAre adjustments at share: | |||||||||||||||||
| Depreciation and amortization expense | 130,308 | 124,374 | 126,839 | ||||||||||||||
| Interest and debt expense | 117,891 | 117,340 | 121,875 | ||||||||||||||
| Income tax expense | 7,414 | 7,426 | 5,381 | ||||||||||||||
| Net gains on sale of real estate | (77,008) | — | — | ||||||||||||||
| EBITDAre at share | 288,862 | 254,849 | 270,960 | ||||||||||||||
| EBITDAre attributable to noncontrolling interests in consolidated subsidiaries | 11,314 | 12,076 | 10,819 | ||||||||||||||
| EBITDAre (non-GAAP) | $ | 300,176 | $ | 266,925 | $ | 281,779 | |||||||||||
|
NON-GAAP RECONCILIATIONS
RECONCILIATION OF EBITDAre TO EBITDAre, AS ADJUSTED (unaudited)
|
|||||||||||||||||
| (Amounts in thousands) | |||||||||||||||||
| For the Three Months Ended | |||||||||||||||||
| March 31, | December 31, 2024 | ||||||||||||||||
| 2025 | 2024 | ||||||||||||||||
| EBITDAre (non-GAAP) | $ | 300,176 | $ | 266,925 | $ | 281,779 | |||||||||||
| EBITDAre attributable to noncontrolling interests in consolidated subsidiaries | (11,314) | (12,076) | (10,819) | ||||||||||||||
| Certain (income) expense items that impact EBITDAre: | |||||||||||||||||
| Gain on sale of 220 CPS condominium units and ancillary amenities | (13,576) | — | — | ||||||||||||||
| Other | (1,589) | 1,009 | 1,732 | ||||||||||||||
| Total of certain (income) expense items that impact EBITDAre | (15,165) | 1,009 | 1,732 | ||||||||||||||
| EBITDAre, as adjusted (non-GAAP) | $ | 273,697 | $ | 255,858 | $ | 272,692 | |||||||||||

| INDEX | |||||||||||||||||
| Page | |||||||||||||||||
| FINANCIAL HIGHLIGHTS AND BUSINESS DEVELOPMENTS | - | 5 | |||||||||||||||
| DEBT AND CAPITALIZATION | |||||||||||||||||
| Unsecured Notes Covenant Ratios and Credit Ratings | |||||||||||||||||
| Liquidity and Capitalization | |||||||||||||||||
| Net Debt to EBITDAre, As Adjusted / Debt Snapshot | |||||||||||||||||
| Hedging Instruments | |||||||||||||||||
| Consolidated Debt Maturities | - | ||||||||||||||||
| PROPERTY STATISTICS | |||||||||||||||||
| Top 15 Tenants | |||||||||||||||||
| Lease Expirations | |||||||||||||||||
| DEVELOPMENT ACTIVITY | |||||||||||||||||
| Development/Redevelopment - Active Projects | |||||||||||||||||
| APPENDIX: DEFINITIONS AND NON-GAAP RECONCILIATIONS | - | ||||||||||||||||
| FINANCIAL HIGHLIGHTS AND BUSINESS DEVELOPMENTS (unaudited) | ||||||||||||||
| FINANCIAL HIGHLIGHTS AND BUSINESS DEVELOPMENTS (unaudited) | ||||||||||||||
| FINANCIAL HIGHLIGHTS AND BUSINESS DEVELOPMENTS (unaudited) | ||||||||||||||
| (Square feet in thousands) | New York | 555 California Street |
||||||||||||||||||||||||
| Office | Retail | THE MART | ||||||||||||||||||||||||
| Three Months Ended March 31, 2025 | ||||||||||||||||||||||||||
| Total square feet leased | 709 | 25 | 83 | 222 | ||||||||||||||||||||||
| Our share of square feet leased: | 685 | 18 | 83 | 155 | ||||||||||||||||||||||
Initial rent(1) |
$ | 95.53 | $ | 222.20 | $ | 51.33 | $ | 120.65 | ||||||||||||||||||
| Weighted average lease term (years) | 14.7 | 14.3 | 8.0 | 13.1 | ||||||||||||||||||||||
| Second generation relet space: | ||||||||||||||||||||||||||
| Square feet | 254 | 10 | 42 | 155 | ||||||||||||||||||||||
| GAAP basis: | ||||||||||||||||||||||||||
Straight-line rent(2) |
$ | 80.23 | $ | 139.99 | $ | 51.80 | $ | 132.08 | ||||||||||||||||||
| Prior straight-line rent | $ | 73.25 | $ | 108.59 | $ | 54.68 | $ | 110.28 | ||||||||||||||||||
| Percentage increase (decrease) | 9.5 | % | 28.9 | % | (5.3) | % | 19.8 | % | ||||||||||||||||||
| Cash basis (non-GAAP): | ||||||||||||||||||||||||||
Initial rent(1) |
$ | 84.72 | $ | 139.40 | $ | 51.67 | $ | 121.04 | ||||||||||||||||||
| Prior escalated rent | $ | 79.56 | $ | 112.57 | $ | 60.43 | $ | 117.37 | ||||||||||||||||||
| Percentage increase (decrease) | 6.5 | % | 23.8 | % | (14.5) | % | 3.1 | % | ||||||||||||||||||
| Tenant improvements and leasing commissions: | ||||||||||||||||||||||||||
| Per square foot | $ | 168.88 | $ | 377.61 | $ | 90.82 | $ | 229.71 | ||||||||||||||||||
| Per square foot per annum | $ | 11.49 | $ | 26.41 | $ | 11.35 | $ | 17.54 | ||||||||||||||||||
| Percentage of initial rent | 12.0 | % | 11.9 | % | 22.1 | % | 14.5 | % | ||||||||||||||||||
| UNSECURED NOTES COVENANT RATIOS AND CREDIT RATINGS (unaudited) | ||||||||||||||||||||||||||||||||
| (Amounts in thousands) | ||||||||||||||||||||||||||||||||
| As of | ||||||||||||||||||||||||||||||||
Unsecured Notes Covenant Ratios(1) |
Required | March 31, 2025 |
December 31, 2024 |
September 30, 2024 |
June 30, 2024 |
|||||||||||||||||||||||||||
Total outstanding debt/total assets(2) |
Less than 65% | 48% | 49% | 49% | 47% | |||||||||||||||||||||||||||
| Secured debt/total assets | Less than 50% | 35% | 35% | 35% | 33% | |||||||||||||||||||||||||||
| Interest coverage ratio (annualized combined EBITDA to annualized interest expense) | Greater than 1.50 | 1.87 | 1.77 | 1.71 | 1.87 | |||||||||||||||||||||||||||
| Unencumbered assets/unsecured debt | Greater than 150% | 470% | 388% | 396% | 425% | |||||||||||||||||||||||||||
Consolidated Unencumbered EBITDA(1) (non-GAAP): |
Q1 2025 Annualized |
|||||||
| New York | $ | 313,860 | ||||||
| Other | 84,440 | |||||||
| Total | $ | 398,300 | ||||||
Credit Ratings(3): |
Rating | Outlook | ||||||||||||
| Moody’s | Ba1 | Stable | ||||||||||||
| S&P | BBB- | Negative | ||||||||||||
| Fitch | BB+ | Stable | ||||||||||||
| LIQUIDITY AND CAPITALIZATION (unaudited) | |||||||||||
| (Amounts in thousands, except per share amounts) | |||||||||||
| Liquidity Snapshot | ||
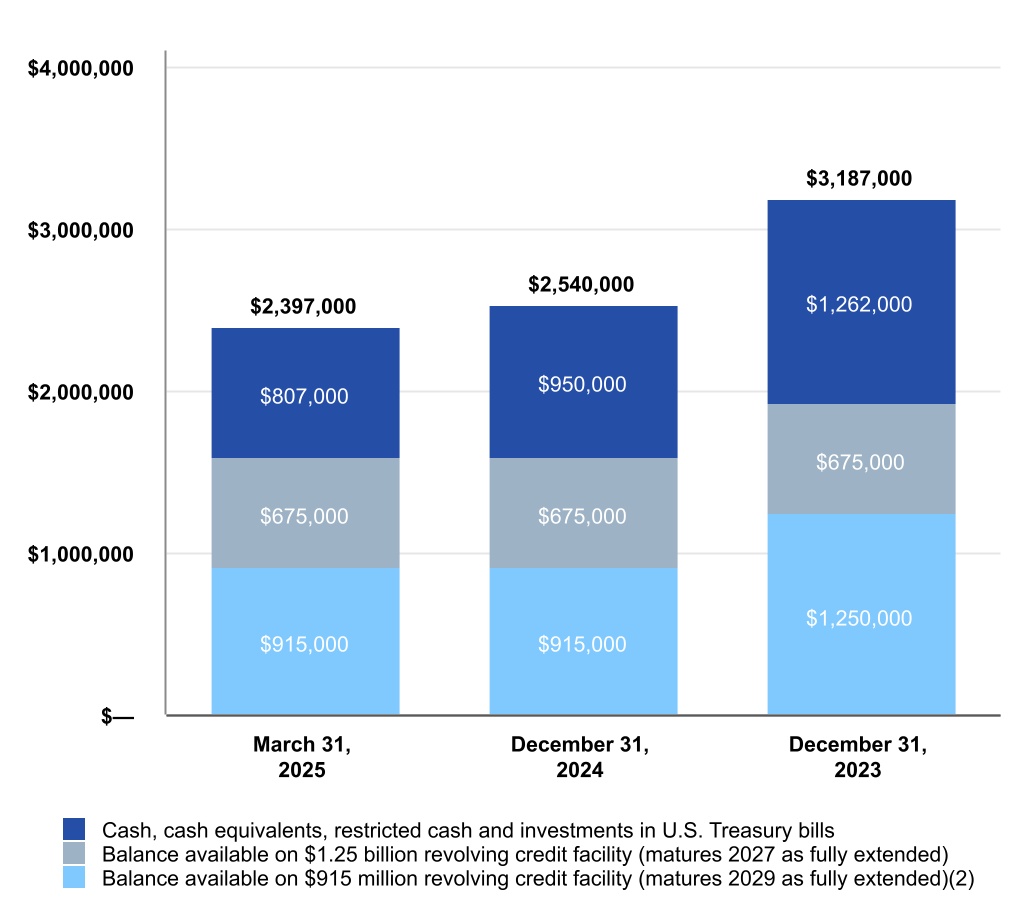
| (1) | The debt balances presented represent contractual debt balances. See reconciliation on page iii in the Appendix of consolidated debt, net as presented on our consolidated balance sheets to consolidated contractual debt as of March 31, 2025. |
|||||||||||||
| (2) | Prior to May 3, 2024, the $915 million revolving credit facility had full capacity of $1.25 billion. | |||||||||||||
| (3) | Based on the Vornado Realty Trust (NYSE: VNO) March 31, 2025 quarter end closing common share price of $36.99. |
|||||||||||||
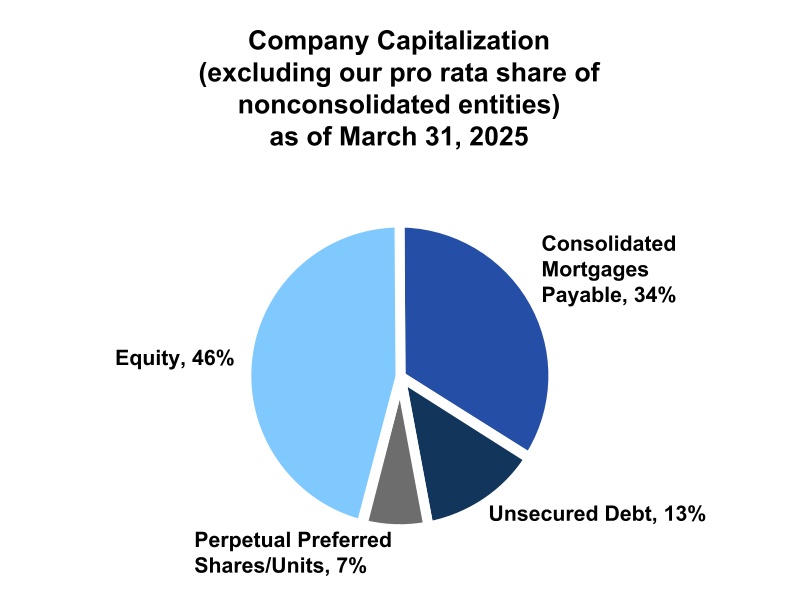
Company capitalization(1): |
Amount | % Total | ||||||||||||
| Consolidated mortgages payable (at 100%) | $ | 5,702,807 | 34% | |||||||||||
| Unsecured debt (contractual) | 2,125,000 | 13% | ||||||||||||
| Perpetual preferred shares/units | 1,223,035 | 7% | ||||||||||||
Equity(3) |
7,769,750 | 46% | ||||||||||||
| Total | 16,820,592 | 100% | ||||||||||||
| Pro rata share of debt of non-consolidated entities | 2,487,104 | |||||||||||||
| Less: Noncontrolling interests' share of consolidated debt | (682,059) | |||||||||||||
| Total at share | $ | 18,625,637 | ||||||||||||
| NET DEBT TO EBITDAre, AS ADJUSTED (unaudited) | |||||||||||||||||||||||
| (Amounts in thousands) | |||||||||||||||||||||||
| As of and For the Trailing Twelve Months Ended March 31, 2025 | As of and For the Year Ended December 31, | ||||||||||||||||||||||
| 2024 | 2023 | 2022 | |||||||||||||||||||||
| Secured debt | $ | 5,702,807 | $ | 5,707,176 | $ | 5,729,615 | $ | 5,877,615 | |||||||||||||||
Unsecured debt |
2,125,000 | 2,575,000 | 2,575,000 | 2,575,000 | |||||||||||||||||||
| Pro rata share of debt of non-consolidated entities | 2,487,104 | 2,477,701 | 2,654,701 | 2,697,226 | |||||||||||||||||||
| Less: Noncontrolling interests’ share of consolidated debt | (682,059) | (682,059) | (682,059) | (682,059) | |||||||||||||||||||
| Company’s pro rata share of total debt | $ | 9,632,852 | $ | 10,077,818 | $ | 10,277,257 | $ | 10,467,782 | |||||||||||||||
| % Unsecured debt | 26% | 25% | 25% | ||||||||||||||||||||
| Company’s pro rata share of total debt | $ | 9,632,852 | $ | 10,077,818 | $ | 10,277,257 | $ | 10,467,782 | |||||||||||||||
| Less: Cash and cash equivalents and investments in U.S. Treasury bills | (568,861) | (733,947) | (997,002) | (1,361,651) | |||||||||||||||||||
| Less: Escrowed cash included within restricted cash on our balance sheet | (202,429) | (187,416) | (221,578) | (94,374) | |||||||||||||||||||
| Less: Pro rata share of unconsolidated partially owned entities’ cash and cash equivalents and escrowed cash | (262,927) | (248,835) | (295,983) | (316,385) | |||||||||||||||||||
| Plus: Noncontrolling interests’ share of cash and cash equivalents, escrowed cash and investments in U.S. Treasury bills | 116,181 | 129,160 | 101,564 | 94,100 | |||||||||||||||||||
Less: Participation in 150 West 34th Street mortgage loan |
— | — | — | (105,000) | |||||||||||||||||||
| Net debt | $ | 8,714,816 | $ | 9,036,780 | $ | 8,864,258 | $ | 8,684,472 | |||||||||||||||
| EBITDAre, as adjusted (non-GAAP) | $ | 1,067,159 | $ | 1,049,320 | $ | 1,081,332 | $ | 1,090,564 | |||||||||||||||
| Net debt / EBITDAre, as adjusted (non-GAAP) | 8.2 | x | 8.6 | x | 8.2 | x | 8.0 | x | |||||||||||||||
| DEBT SNAPSHOT (unaudited) | |||||||||||||||||||||||||||||||||||
| (Amounts in thousands) | |||||||||||||||||||||||||||||||||||
| As of March 31, 2025 | |||||||||||||||||||||||||||||||||||
| Total | Variable | Fixed(1) |
|||||||||||||||||||||||||||||||||
| (Contractual debt balances) | Amount | Weighted Average Interest Rate |
Amount | Weighted Average Interest Rate |
Amount | Weighted Average Interest Rate |
|||||||||||||||||||||||||||||
Consolidated debt(2) |
$ | 7,827,807 | 4.61% | $ | 1,307,807 | 5.92%(3) |
$ | 6,520,000 | 4.34% | ||||||||||||||||||||||||||
| Pro rata share of debt of non-consolidated entities | 2,487,104 | 5.13% | 458,282 | 6.39% | 2,028,822 | 4.85% | |||||||||||||||||||||||||||||
| Total | 10,314,911 | 4.73% | 1,766,089 | 6.04% | 8,548,822 | 4.46% | |||||||||||||||||||||||||||||
| Less: Noncontrolling interests' share of consolidated debt (primarily 1290 Avenue of the Americas and 555 California Street) | (682,059) | (397,059) | (285,000) | ||||||||||||||||||||||||||||||||
| Company's pro rata share of total debt | $ | 9,632,852 | 4.73% | $ | 1,369,030 | 5.95% | $ | 8,263,822 | 4.53% | ||||||||||||||||||||||||||
| HEDGING INSTRUMENTS AS OF MARCH 31, 2025 (unaudited) | |||||||||||||||||||||||||||||||||||||||||||||||||||||||||||||||||
| (Amounts in thousands) | |||||||||||||||||||||||||||||||||||||||||||||||||||||||||||||||||
| Debt Information | Swap / Cap Information | ||||||||||||||||||||||||||||||||||||||||||||||||||||||||||||||||
| Balance at Share | Maturity Date(1) |
Variable Rate Spread | Notional Amount at Share | Expiration Date | All-In Swapped Rate | ||||||||||||||||||||||||||||||||||||||||||||||||||||||||||||
| Interest Rate Swaps: | |||||||||||||||||||||||||||||||||||||||||||||||||||||||||||||||||
| Consolidated: | |||||||||||||||||||||||||||||||||||||||||||||||||||||||||||||||||
| 555 California Street mortgage loan | $ | 840,000 | 05/28 | S+205 | $ | 840,000 | 05/26 | 6.03% | |||||||||||||||||||||||||||||||||||||||||||||||||||||||||
| 770 Broadway mortgage loan | 700,000 | 07/27 | S+225 | 700,000 | 07/27 | 4.98% | |||||||||||||||||||||||||||||||||||||||||||||||||||||||||||
| PENN 11 mortgage loan | 500,000 | 10/25 | S+206 | 500,000 | 10/25 | 6.28% | |||||||||||||||||||||||||||||||||||||||||||||||||||||||||||
| Unsecured revolving credit facility | 575,000 | 12/27 | S+115 | 575,000 | 08/27 | 3.88% | |||||||||||||||||||||||||||||||||||||||||||||||||||||||||||
| Unsecured term loan | 800,000 | 12/27 | S+130 | ||||||||||||||||||||||||||||||||||||||||||||||||||||||||||||||
| Through 07/25 | 700,000 | 07/25 | 4.53% | ||||||||||||||||||||||||||||||||||||||||||||||||||||||||||||||
| 07/25 through 10/26 | 550,000 | 10/26 | 4.36% | ||||||||||||||||||||||||||||||||||||||||||||||||||||||||||||||
| 10/26 through 8/27 | 50,000 | 08/27 | 4.04% | ||||||||||||||||||||||||||||||||||||||||||||||||||||||||||||||
| 100 West 33rd Street mortgage loan | 480,000 | 06/27 | S+185 | 480,000 | 06/27 | 5.26% | |||||||||||||||||||||||||||||||||||||||||||||||||||||||||||
| 888 Seventh Avenue mortgage loan | 253,688 | 12/25 | S+180 | 200,000 | 09/27 | 4.76% | |||||||||||||||||||||||||||||||||||||||||||||||||||||||||||
| 435 Seventh Avenue mortgage loan | 75,000 | 04/28 | S+210 | 75,000 | 04/26 | 6.96% | |||||||||||||||||||||||||||||||||||||||||||||||||||||||||||
| Unconsolidated: | |||||||||||||||||||||||||||||||||||||||||||||||||||||||||||||||||
| 280 Park Avenue mortgage loan | 537,500 | 09/27 | S+178 | 537,500 | 09/28 | 5.84% | |||||||||||||||||||||||||||||||||||||||||||||||||||||||||||
| 731 Lexington Avenue - retail condominium mortgage loan | 97,200 | 08/25 | S+151 | 97,200 | 05/25 | 1.76% | |||||||||||||||||||||||||||||||||||||||||||||||||||||||||||
| Interest Rate Caps: | Index Strike Rate | Cash Interest Rate(2) |
Effective Interest Rate(3) |
||||||||||||||||||||||||||||||||||||||||||||||||||||||||||||||
| Consolidated: | |||||||||||||||||||||||||||||||||||||||||||||||||||||||||||||||||
| 1290 Avenue of the Americas mortgage loan | $ | 665,000 | 11/28 | S+162 | $ | 665,000 | 11/25 | 1.00% | 2.62% | 5.94% | |||||||||||||||||||||||||||||||||||||||||||||||||||||||
| One Park Avenue mortgage loan | 525,000 | 03/26 | S+122 | 525,000 | 03/26 | 4.39% | 5.54% | 5.60% | |||||||||||||||||||||||||||||||||||||||||||||||||||||||||
| 150 West 34th Street mortgage loan | 75,000 | 02/28 | S+215 | 75,000 | 02/26 | 5.00% | 6.46% | 7.06% | |||||||||||||||||||||||||||||||||||||||||||||||||||||||||
| Unconsolidated: | |||||||||||||||||||||||||||||||||||||||||||||||||||||||||||||||||
| 61 Ninth Avenue mortgage loan | 75,543 | 01/26 | S+146 | 75,543 | 01/26 | 4.39% | 5.79% | 6.24% | |||||||||||||||||||||||||||||||||||||||||||||||||||||||||
| 512 West 22nd Street mortgage loan | 68,581 | 06/25 | S+235 | 68,581 | 06/25 | 4.50% | 6.67% | 6.98% | |||||||||||||||||||||||||||||||||||||||||||||||||||||||||
| Rego Park II mortgage loan | 65,368 | 12/25 | S+145 | 65,368 | 12/25 | 4.15% | 5.60% | 5.93% | |||||||||||||||||||||||||||||||||||||||||||||||||||||||||
| Fashion Centre Mall/Washington Tower mortgage loan | 34,125 | 05/26 | S+305 | 34,125 | 05/25 | 3.00% | 6.05% | 7.61% | |||||||||||||||||||||||||||||||||||||||||||||||||||||||||
| Debt subject to interest rate swaps and subject to a 1.00% SOFR interest rate cap | $ | 5,369,700 | |||||||||||||||||||||||||||||||||||||||||||||||||||||||||||||||
| Variable rate debt subject to interest rate caps | 843,617 | ||||||||||||||||||||||||||||||||||||||||||||||||||||||||||||||||
| Fixed rate debt per loan agreements | 2,894,122 | ||||||||||||||||||||||||||||||||||||||||||||||||||||||||||||||||
| Variable rate debt not subject to interest rate swaps or caps | 525,413 | (4) |
|||||||||||||||||||||||||||||||||||||||||||||||||||||||||||||||
| Total debt at share | $ | 9,632,852 | |||||||||||||||||||||||||||||||||||||||||||||||||||||||||||||||
| CONSOLIDATED DEBT MATURITIES (CONTRACTUAL BALANCES) (unaudited) | ||||||||||||||
| (Amounts in thousands) | ||||||||||||||
|
Consolidated Debt Maturity Schedule(1) as of March 31, 2025
(Excludes pro rata share of JV debt)(2)
| ||
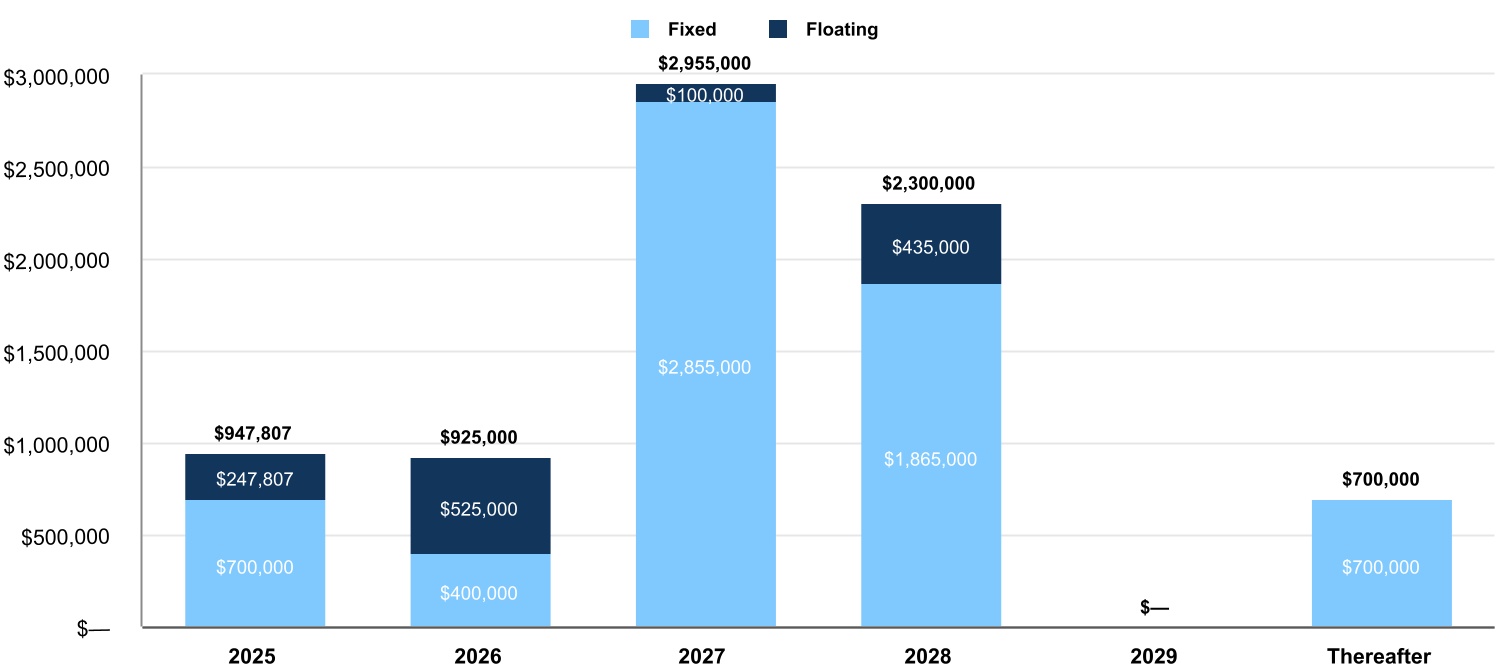
| Consolidated (100%): | ||||||||||||||||||||||||||||||||||||||||||||
| Secured | $ | 947,807 | (3) |
$ | 525,000 | $ | 1,580,000 | $ | 2,300,000 | $ | — | $ | 350,000 | |||||||||||||||||||||||||||||||
| Unsecured | — | 400,000 | 1,375,000 | — | — | 350,000 | ||||||||||||||||||||||||||||||||||||||
| Total consolidated debt (100%) | $ | 947,807 | $ | 925,000 | $ | 2,955,000 | $ | 2,300,000 | $ | — | $ | 700,000 | ||||||||||||||||||||||||||||||||
| % of total consolidated debt | 12.1 | % | 11.8 | % | 37.8 | % | 29.4 | % | 0.00 | % | 8.9 | % | ||||||||||||||||||||||||||||||||
| Debt maturities at share: | ||||||||||||||||||||||||||||||||||||||||||||
| Consolidated debt (100%) | $ | 947,807 | $ | 925,000 | $ | 2,955,000 | $ | 2,300,000 | $ | — | $ | 700,000 | ||||||||||||||||||||||||||||||||
| Pro rata share of debt of non-consolidated entities | 569,324 | 650,310 | 577,158 | 288,949 | 366,538 | 34,825 | ||||||||||||||||||||||||||||||||||||||
| Less: Noncontrolling interests' share of consolidated debt | (37,059) | — | — | (645,000) | — | — | ||||||||||||||||||||||||||||||||||||||
| Total debt at share | $ | 1,480,072 | $ | 1,575,310 | $ | 3,532,158 | $ | 1,943,949 | $ | 366,538 | $ | 734,825 | ||||||||||||||||||||||||||||||||
| % of total debt at share | 15.4 | % | 16.4 | % | 36.7 | % | 20.2 | % | 3.8 | % | 7.5 | % | ||||||||||||||||||||||||||||||||
| CONSOLIDATED DEBT MATURITIES AT 100% (CONTRACTUAL BALANCES) (unaudited) | ||||||||||||||||||||||||||||||||||||||||||||||||||||||||||||||||||||
| (Amounts in thousands) | ||||||||||||||||||||||||||||||||||||||||||||||||||||||||||||||||||||
| Property | Maturity Date(1) |
Spread over SOFR | Interest Rate(2) |
2025 | 2026 | 2027 | 2028 | 2029 | Thereafter | Total | ||||||||||||||||||||||||||||||||||||||||||||||||||||||||||
| Secured Debt: | ||||||||||||||||||||||||||||||||||||||||||||||||||||||||||||||||||||
| 606 Broadway (50.0% interest) | (3) | S+191 | 6.24% | (4) |
$ | 74,119 | $ | — | $ | — | $ | — | $ | — | $ | — | $ | 74,119 | ||||||||||||||||||||||||||||||||||||||||||||||||||
| 4 Union Square South | 08/25 | S+150 | 5.82% | 120,000 | — | — | — | — | — | 120,000 | ||||||||||||||||||||||||||||||||||||||||||||||||||||||||||
| PENN 11 | 10/25 | 6.28% | 500,000 | — | — | — | — | — | 500,000 | |||||||||||||||||||||||||||||||||||||||||||||||||||||||||||
| 888 Seventh Avenue | 12/25 | S+180 | (5) |
5.05% | 253,688 | — | — | — | — | — | 253,688 | |||||||||||||||||||||||||||||||||||||||||||||||||||||||||
| One Park Avenue | 03/26 | S+122 | 5.54% | — | 525,000 | — | — | — | — | 525,000 | ||||||||||||||||||||||||||||||||||||||||||||||||||||||||||
| 350 Park Avenue | 01/27 | 3.92% | — | — | 400,000 | — | — | — | 400,000 | |||||||||||||||||||||||||||||||||||||||||||||||||||||||||||
| 100 West 33rd Street | 06/27 | 5.26% | — | — | 480,000 | — | — | — | 480,000 | |||||||||||||||||||||||||||||||||||||||||||||||||||||||||||
| 770 Broadway | 07/27 | 4.98% | — | — | 700,000 | — | — | — | 700,000 | |||||||||||||||||||||||||||||||||||||||||||||||||||||||||||
| 150 West 34th Street | 02/28 | S+215 | 6.46% | — | — | — | 75,000 | — | — | 75,000 | ||||||||||||||||||||||||||||||||||||||||||||||||||||||||||
| 435 Seventh Avenue | 04/28 | 6.96% | — | — | — | 75,000 | — | — | 75,000 | |||||||||||||||||||||||||||||||||||||||||||||||||||||||||||
| 555 California Street (70.0% interest) | 05/28 | S+205 | (5) |
6.13% | — | — | — | 1,200,000 | — | — | 1,200,000 | |||||||||||||||||||||||||||||||||||||||||||||||||||||||||
| 1290 Avenue of the Americas (70.0% interest) | 11/28 | 2.62% | — | — | — | 950,000 | — | — | 950,000 | |||||||||||||||||||||||||||||||||||||||||||||||||||||||||||
| 909 Third Avenue | 04/31 | 3.23% | — | — | — | — | — | 350,000 | 350,000 | |||||||||||||||||||||||||||||||||||||||||||||||||||||||||||
| Total Secured Debt | 947,807 | 525,000 | 1,580,000 | 2,300,000 | — | 350,000 | 5,702,807 | |||||||||||||||||||||||||||||||||||||||||||||||||||||||||||||
| Unsecured Debt: | ||||||||||||||||||||||||||||||||||||||||||||||||||||||||||||||||||||
| Senior unsecured notes due 2026 | 06/26 | 2.15% | — | 400,000 | — | — | — | — | 400,000 | |||||||||||||||||||||||||||||||||||||||||||||||||||||||||||
| $1.25 Billion unsecured revolving credit facility | 12/27 | 3.88% | (6) |
— | — | 575,000 | — | — | — | 575,000 | ||||||||||||||||||||||||||||||||||||||||||||||||||||||||||
| $800 Million unsecured term loan | 12/27 | S+130 | (5) |
4.66% | (6) |
— | — | 800,000 | — | — | — | 800,000 | ||||||||||||||||||||||||||||||||||||||||||||||||||||||||
| $915 Million unsecured revolving credit facility | 04/29 | S+120 | — | — | — | — | — | — | — | — | ||||||||||||||||||||||||||||||||||||||||||||||||||||||||||
| Senior unsecured notes due 2031 | 06/31 | 3.40% | — | — | — | — | — | 350,000 | 350,000 | |||||||||||||||||||||||||||||||||||||||||||||||||||||||||||
| Total Unsecured Debt | — | 400,000 | 1,375,000 | — | — | 350,000 | 2,125,000 | |||||||||||||||||||||||||||||||||||||||||||||||||||||||||||||
| Total Debt | $ | 947,807 | $ | 925,000 | $ | 2,955,000 | $ | 2,300,000 | $ | — | $ | 700,000 | $ | 7,827,807 | ||||||||||||||||||||||||||||||||||||||||||||||||||||||
| Weighted average rate | 5.89% | 4.07% | 4.58% | 4.72% | 0.00% | 3.32% | 4.61% | |||||||||||||||||||||||||||||||||||||||||||||||||||||||||||||
Fixed rate debt(7) |
$ | 700,000 | $ | 400,000 | $ | 2,855,000 | $ | 1,865,000 | $ | — | $ | 700,000 | $ | 6,520,000 | ||||||||||||||||||||||||||||||||||||||||||||||||||||||
| Fixed weighted average rate expiring | 5.84% | 2.15% | 4.54% | 4.33% | 0.00% | 3.32% | 4.34% | |||||||||||||||||||||||||||||||||||||||||||||||||||||||||||||
| Floating rate debt | $ | 247,807 | $ | 525,000 | $ | 100,000 | $ | 435,000 | $ | — | $ | — | $ | 1,307,807 | ||||||||||||||||||||||||||||||||||||||||||||||||||||||
| Floating weighted average rate expiring | 6.01% | 5.54% | 5.62% | 6.38% | 0.00% | 0.00% | 5.92% | |||||||||||||||||||||||||||||||||||||||||||||||||||||||||||||
| TOP 15 TENANTS (unaudited) | |||||||||||||||||
| (Amounts in thousands, except square feet) | |||||||||||||||||
| Tenants | Square Footage At Share |
Annualized Escalated Rents
At Share(1)
|
% of Total Annualized Escalated Rents At Share |
||||||||||||||
| Meta Platforms, Inc. | 1,176,828 | $ | 141,813 | 7.6 | % | ||||||||||||
| IPG and affiliates | 955,211 | 63,844 | 3.5 | % | |||||||||||||
| Citadel | 585,460 | 62,498 | 3.4 | % | |||||||||||||
| New York University | 685,290 | 48,998 | 2.6 | % | |||||||||||||
| Madison Square Garden & Affiliates | 449,053 | 45,451 | 2.4 | % | |||||||||||||
| Bloomberg L.P. | 306,768 | 43,867 | 2.3 | % | |||||||||||||
| Google/Motorola Mobility (guaranteed by Google) | 759,446 | 43,355 | 2.3 | % | |||||||||||||
| UMG Recordings, Inc, | 336,700 | 35,411 | 1.9 | % | |||||||||||||
| Amazon (including its Whole Foods subsidiary) | 312,694 | 31,044 | 1.6 | % | |||||||||||||
| Neuberger Berman Group LLC | 306,612 | 28,363 | 1.5 | % | |||||||||||||
| Bank of America | 247,615 | 27,452 | 1.5 | % | |||||||||||||
| Apple Inc. | 473,311 | 26,948 | 1.4 | % | |||||||||||||
| LVMH Brands | 65,060 | 26,786 | 1.4 | % | |||||||||||||
| AMC Networks, Inc. | 326,717 | 26,183 | 1.4 | % | |||||||||||||
| WeWork | 303,741 | 25,818 | 1.4 | % | |||||||||||||
| 36.2 | % | ||||||||||||||||
| LEASE EXPIRATIONS (unaudited) | ||||||||||||||
| (Amounts in thousands) | ||||||||||||||
| Our Share of Square Feet of Expiring Leases As of March 31, 2025 | ||
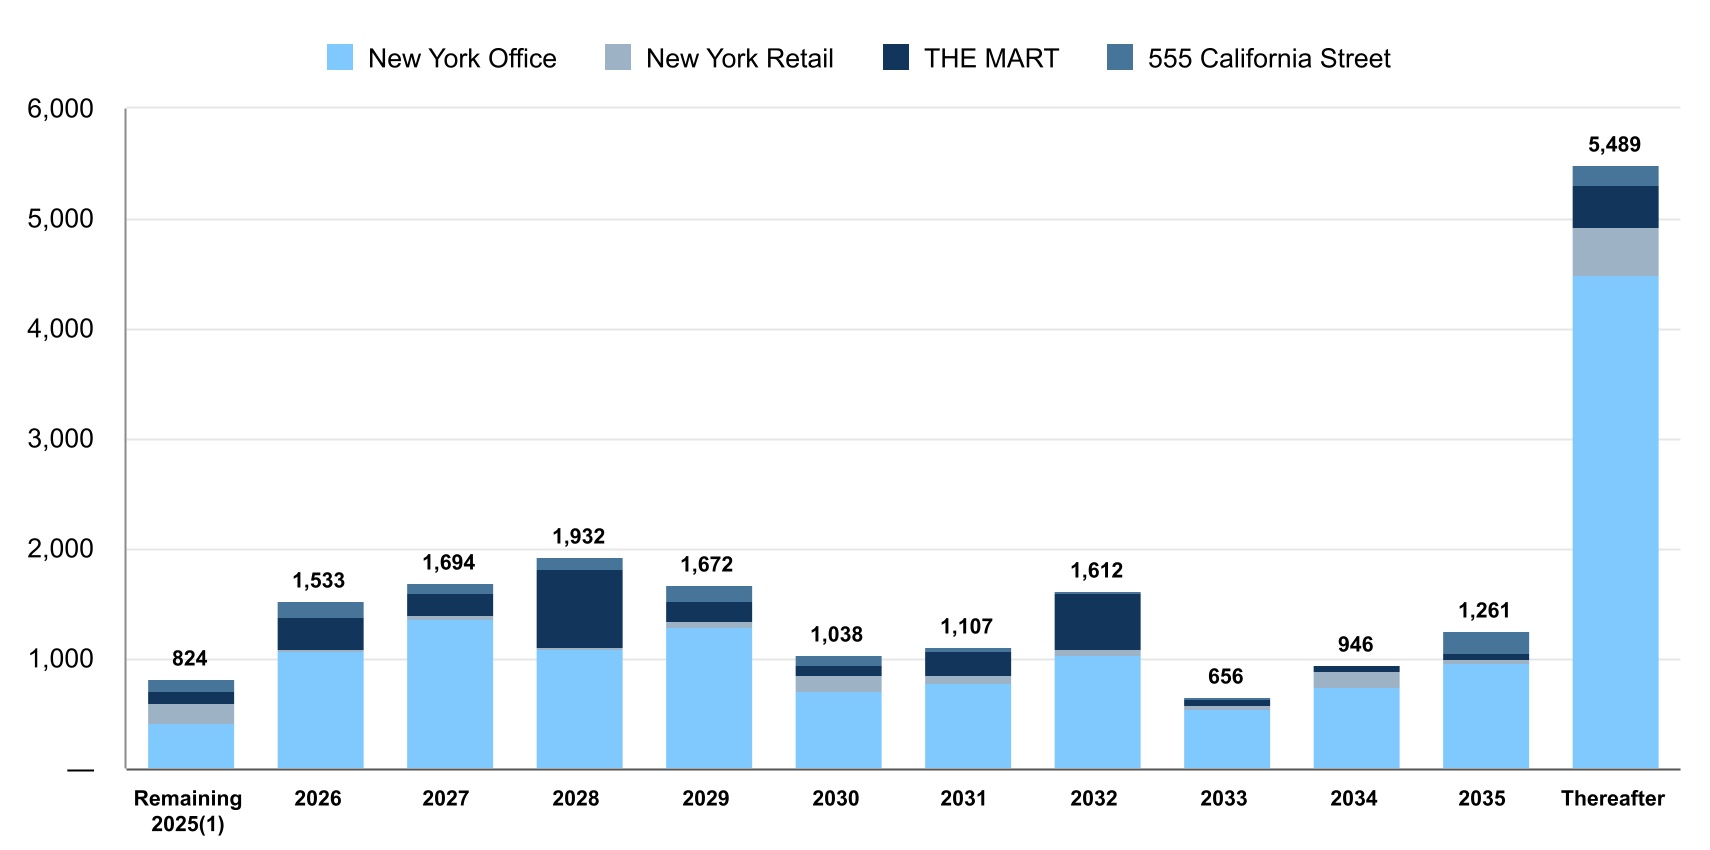
| New York Office | 421 | 1,068 | 1,357 | 1,082 | 1,289 | 713 | 783 | 1,039 | 548 | 748 | 970 | 4,500 | ||||||||||||||||||||||||||||||||||||||||||||||||||||||||||||||
| New York Retail | 183 | 21 | 52 | 26 | 53 | 146 | 68 | 52 | 39 | 147 | 33 | 436 | ||||||||||||||||||||||||||||||||||||||||||||||||||||||||||||||
| THE MART | 97 | 284 | 199 | 712 | 187 | 94 | 227 | 508 | 54 | 51 | 48 | 376 | ||||||||||||||||||||||||||||||||||||||||||||||||||||||||||||||
| 555 California Street | 123 | 160 | 86 | 112 | 143 | 85 | 29 | 13 | 15 | — | 210 | 177 | ||||||||||||||||||||||||||||||||||||||||||||||||||||||||||||||
| Total | 824 | 1,533 | 1,694 | 1,932 | 1,672 | 1,038 | 1,107 | 1,612 | 656 | 946 | 1,261 | 5,489 | ||||||||||||||||||||||||||||||||||||||||||||||||||||||||||||||
| % of total | 4.2% | 7.8% | 8.6% | 9.8% | 8.5% | 5.3% | 5.6% | 8.2% | 3.3% | 4.8% | 6.4% | 27.5% | ||||||||||||||||||||||||||||||||||||||||||||||||||||||||||||||
| DEVELOPMENT/REDEVELOPMENT - ACTIVE PROJECTS | ||||||||||||||||||||||||||||||||||||||||||||
| (Amounts in thousands, except square feet) | ||||||||||||||||||||||||||||||||||||||||||||
| (at Vornado’s share) | Projected Incremental Cash Yield |
|||||||||||||||||||||||||||||||||||||||||||
|
New York segment:
|
Property Rentable Sq. Ft. |
Budget | Cash Amount Expended |
Remaining Expenditures | Stabilization Year |
|||||||||||||||||||||||||||||||||||||||
| PENN District: | ||||||||||||||||||||||||||||||||||||||||||||
| PENN 2 | 1,815,000 | $ | 750,000 | $ | 708,267 | $ | 41,733 | 2026 | 10.2% | |||||||||||||||||||||||||||||||||||
| Districtwide Improvements | N/A | 100,000 | 75,189 | 24,811 | N/A | N/A | ||||||||||||||||||||||||||||||||||||||
| Total PENN District | 850,000 | (1) |
783,456 | 66,544 | ||||||||||||||||||||||||||||||||||||||||
| Sunset Pier 94 Studios (49.9% interest) | 266,000 | 125,000 | (2) |
66,551 | 58,449 | 2026 | 10.3% | |||||||||||||||||||||||||||||||||||||
| Total Active Development Projects | $ | 975,000 | $ | 850,007 | $ | 124,993 | ||||||||||||||||||||||||||||||||||||||
FIXED INCOME SUPPLEMENTAL DEFINITIONS | |||||||||||||||||||||||||||||||||||
|
NON-GAAP RECONCILIATIONS
RECONCILIATION OF CONSOLIDATED DEBT, NET TO CONSOLIDATED CONTRACTUAL DEBT (unaudited)
|
|||||||||||||||||
| (Amounts in thousands) | |||||||||||||||||
| As of March 31, 2025 | |||||||||||||||||
| Consolidated Debt, Net | Deferred Financing Costs, Net and Other | Consolidated Contractual Debt | |||||||||||||||
| Mortgages payable | $ | 5,674,519 | $ | 28,288 | $ | 5,702,807 | |||||||||||
| Senior unsecured notes | 746,282 | 3,718 | 750,000 | ||||||||||||||
| $800 Million unsecured term loan | 796,295 | 3,705 | 800,000 | ||||||||||||||
| $2.2 Billion unsecured revolving credit facilities | 575,000 | — | 575,000 | ||||||||||||||
| $ | 7,792,096 | $ | 35,711 | $ | 7,827,807 | ||||||||||||
|
NON-GAAP RECONCILIATIONS
RECONCILIATION OF NET INCOME (LOSS) TO EBITDAre (unaudited)
| |||||||||||||||||||||||
| (Amounts in thousands) | |||||||||||||||||||||||
| For the Three Months Ended March 31, | For the Trailing Twelve Months Ended | For the Year Ended December 31, | |||||||||||||||||||||||||||||||||
| 2025 | 2024 | March 31, 2025 | 2024 | 2023 | 2022 | ||||||||||||||||||||||||||||||
| Reconciliation of net income (loss) to EBITDAre (non-GAAP): | |||||||||||||||||||||||||||||||||||
| Net income (loss) | $ | 99,824 | $ | (6,273) | $ | 126,213 | $ | 20,116 | $ | 32,888 | $ | (382,612) | |||||||||||||||||||||||
| Less net loss attributable to noncontrolling interests in consolidated subsidiaries | 10,433 | 11,982 | 49,582 | 51,131 | 75,967 | 5,737 | |||||||||||||||||||||||||||||
| Net income (loss) attributable to the Operating Partnership | 110,257 | 5,709 | 175,795 | 71,247 | 108,855 | (376,875) | |||||||||||||||||||||||||||||
| EBITDAre adjustments at share: | |||||||||||||||||||||||||||||||||||
| Depreciation and amortization expense | 130,308 | 124,374 | 513,144 | 507,210 | 499,357 | 593,322 | |||||||||||||||||||||||||||||
| Interest and debt expense | 117,891 | 117,340 | 458,651 | 458,100 | 458,400 | 362,321 | |||||||||||||||||||||||||||||
| Income tax expense | 7,414 | 7,426 | 23,433 | 23,445 | 30,465 | 23,404 | |||||||||||||||||||||||||||||
| Real estate impairment losses | — | — | — | — | 73,289 | 595,488 | |||||||||||||||||||||||||||||
| Net gains on sale of real estate | (77,008) | — | (77,881) | (873) | (72,955) | (58,920) | |||||||||||||||||||||||||||||
| EBITDAre at share | 288,862 | 254,849 | 1,093,142 | 1,059,129 | 1,097,411 | 1,138,740 | |||||||||||||||||||||||||||||
| EBITDAre attributable to noncontrolling interests in consolidated subsidiaries | 11,314 | 12,076 | 41,363 | 42,125 | 39,405 | 71,786 | |||||||||||||||||||||||||||||
| EBITDAre (non-GAAP) | $ | 300,176 | $ | 266,925 | $ | 1,134,505 | $ | 1,101,254 | $ | 1,136,816 | $ | 1,210,526 | |||||||||||||||||||||||
|
NON-GAAP RECONCILIATIONS
RECONCILIATION OF EBITDAre TO EBITDAre, AS ADJUSTED (unaudited)
| |||||||||||||||||||||||||||||||||||
| (Amounts in thousands) | |||||||||||||||||||||||||||||||||||
| For the Three Months Ended March 31, | For the Trailing Twelve Months Ended | For the Year Ended December 31, | |||||||||||||||||||||||||||||||||
| 2025 | 2024 | March 31, 2025 | 2024 | 2023 | 2022 | ||||||||||||||||||||||||||||||
| EBITDAre (non-GAAP) | $ | 300,176 | $ | 266,925 | $ | 1,134,505 | $ | 1,101,254 | $ | 1,136,816 | $ | 1,210,526 | |||||||||||||||||||||||
| EBITDAre attributable to noncontrolling interests in consolidated subsidiaries | (11,314) | (12,076) | (41,363) | (42,125) | (39,405) | (71,786) | |||||||||||||||||||||||||||||
| Certain (income) expense items that impact EBITDAre: | |||||||||||||||||||||||||||||||||||
| Gain on sale of 220 CPS condominium units and ancillary amenities | (13,576) | — | (28,751) | (15,175) | (14,127) | (41,874) | |||||||||||||||||||||||||||||
| Other | (1,589) | 1,009 | 2,768 | 5,366 | (1,952) | (6,302) | |||||||||||||||||||||||||||||
| Total of certain (income) expense items that impact EBITDAre | (15,165) | 1,009 | (25,983) | (9,809) | (16,079) | (48,176) | |||||||||||||||||||||||||||||
| EBITDAre, as adjusted (non-GAAP) | $ | 273,697 | $ | 255,858 | $ | 1,067,159 | $ | 1,049,320 | $ | 1,081,332 | $ | 1,090,564 | |||||||||||||||||||||||