0000896878falseP3Y0M0DP3Y0M0DP2YP3Yhttp://fasb.org/us-gaap/2025#OtherLiabilitiesCurrenthttp://fasb.org/us-gaap/2025#OtherLiabilitiesCurrentP3YP3YadoptedadoptedterminatedterminatedInsider Trading Policyiso4217:USDiso4217:USDxbrli:sharesxbrli:sharesintu:hostingintu:vendorxbrli:pureintu:option_to_extendintu:periodintu:segment00008968782025-11-202025-11-200000896878us-gaap:ProductMember2024-08-012025-07-310000896878us-gaap:ProductMember2023-08-012024-07-310000896878us-gaap:ProductMember2022-08-012023-07-310000896878us-gaap:ServiceMember2024-08-012025-07-310000896878us-gaap:ServiceMember2023-08-012024-07-310000896878us-gaap:ServiceMember2022-08-012023-07-3100008968782024-08-012025-07-3100008968782023-08-012024-07-3100008968782022-08-012023-07-3100008968782025-07-3100008968782024-07-310000896878us-gaap:SeriesAPreferredStockMember2025-07-310000896878us-gaap:SeriesAPreferredStockMember2024-07-310000896878us-gaap:SeriesBPreferredStockMember2025-07-310000896878us-gaap:SeriesBPreferredStockMember2024-07-310000896878us-gaap:CommonStockMember2022-07-310000896878us-gaap:AdditionalPaidInCapitalMember2022-07-310000896878us-gaap:TreasuryStockCommonMember2022-07-310000896878us-gaap:AccumulatedOtherComprehensiveIncomeMember2022-07-310000896878us-gaap:RetainedEarningsMember2022-07-3100008968782022-07-310000896878us-gaap:AccumulatedOtherComprehensiveIncomeMember2022-08-012023-07-310000896878us-gaap:RetainedEarningsMember2022-08-012023-07-310000896878us-gaap:CommonStockMember2022-08-012023-07-310000896878us-gaap:AdditionalPaidInCapitalMember2022-08-012023-07-310000896878us-gaap:TreasuryStockCommonMember2022-08-012023-07-310000896878us-gaap:CommonStockMember2023-07-310000896878us-gaap:AdditionalPaidInCapitalMember2023-07-310000896878us-gaap:TreasuryStockCommonMember2023-07-310000896878us-gaap:AccumulatedOtherComprehensiveIncomeMember2023-07-310000896878us-gaap:RetainedEarningsMember2023-07-3100008968782023-07-310000896878us-gaap:AccumulatedOtherComprehensiveIncomeMember2023-08-012024-07-310000896878us-gaap:RetainedEarningsMember2023-08-012024-07-310000896878us-gaap:CommonStockMember2023-08-012024-07-310000896878us-gaap:AdditionalPaidInCapitalMember2023-08-012024-07-310000896878us-gaap:TreasuryStockCommonMember2023-08-012024-07-310000896878us-gaap:CommonStockMember2024-07-310000896878us-gaap:AdditionalPaidInCapitalMember2024-07-310000896878us-gaap:TreasuryStockCommonMember2024-07-310000896878us-gaap:AccumulatedOtherComprehensiveIncomeMember2024-07-310000896878us-gaap:RetainedEarningsMember2024-07-310000896878us-gaap:AccumulatedOtherComprehensiveIncomeMember2024-08-012025-07-310000896878us-gaap:RetainedEarningsMember2024-08-012025-07-310000896878us-gaap:CommonStockMember2024-08-012025-07-310000896878us-gaap:AdditionalPaidInCapitalMember2024-08-012025-07-310000896878us-gaap:TreasuryStockCommonMember2024-08-012025-07-310000896878us-gaap:CommonStockMember2025-07-310000896878us-gaap:AdditionalPaidInCapitalMember2025-07-310000896878us-gaap:TreasuryStockCommonMember2025-07-310000896878us-gaap:AccumulatedOtherComprehensiveIncomeMember2025-07-310000896878us-gaap:RetainedEarningsMember2025-07-310000896878us-gaap:OperatingSegmentsMemberintu:ReorganizationOfCertainWorkplaceAndRealEstateFunctionsMemberintu:GlobalBusinessSolutionsSegmentMember2023-08-012024-07-310000896878us-gaap:OperatingSegmentsMemberintu:ReorganizationOfCertainWorkplaceAndRealEstateFunctionsMemberintu:GlobalBusinessSolutionsSegmentMember2022-08-012023-07-310000896878us-gaap:OperatingSegmentsMemberintu:ReorganizationOneOfCertainTechnologyFunctionsMemberintu:ConsumerSegmentMember2023-08-012024-07-310000896878us-gaap:MaterialReconcilingItemsMemberintu:ReorganizationOneOfCertainTechnologyFunctionsMember2023-08-012024-07-310000896878us-gaap:MaterialReconcilingItemsMemberintu:ReorganizationOneOfCertainTechnologyFunctionsMember2022-08-012023-07-310000896878us-gaap:OperatingSegmentsMemberintu:ReorganizationOneOfCertainTechnologyFunctionsMemberintu:ConsumerSegmentMember2022-08-012023-07-310000896878us-gaap:OperatingSegmentsMemberus-gaap:ReclassificationSegmentationBasisChangeMemberintu:GlobalBusinessSolutionsSegmentMember2024-08-012025-07-310000896878us-gaap:OperatingSegmentsMemberus-gaap:ReclassificationSegmentationBasisChangeMemberintu:GlobalBusinessSolutionsSegmentMember2023-08-012024-07-310000896878us-gaap:OperatingSegmentsMemberus-gaap:ReclassificationSegmentationBasisChangeMemberintu:GlobalBusinessSolutionsSegmentMember2022-08-012023-07-310000896878us-gaap:OperatingSegmentsMemberus-gaap:ReclassificationSegmentationBasisChangeMemberintu:ConsumerSegmentMember2024-08-012025-07-310000896878us-gaap:OperatingSegmentsMemberus-gaap:ReclassificationSegmentationBasisChangeMemberintu:ConsumerSegmentMember2023-08-012024-07-310000896878us-gaap:OperatingSegmentsMemberus-gaap:ReclassificationSegmentationBasisChangeMemberintu:ConsumerSegmentMember2022-08-012023-07-310000896878srt:MinimumMember2025-07-310000896878srt:MaximumMember2025-07-310000896878srt:MinimumMemberus-gaap:SoftwareDevelopmentMember2025-07-310000896878srt:MaximumMemberus-gaap:SoftwareDevelopmentMember2025-07-310000896878us-gaap:SupplierConcentrationRiskMemberus-gaap:CostOfGoodsTotalMember2024-08-012025-07-310000896878us-gaap:FairValueMeasurementsRecurringMemberus-gaap:FairValueInputsLevel1Member2025-07-310000896878us-gaap:FairValueMeasurementsRecurringMemberus-gaap:FairValueInputsLevel2Member2025-07-310000896878us-gaap:FairValueMeasurementsRecurringMember2025-07-310000896878us-gaap:FairValueMeasurementsRecurringMemberus-gaap:FairValueInputsLevel1Member2024-07-310000896878us-gaap:FairValueMeasurementsRecurringMemberus-gaap:FairValueInputsLevel2Member2024-07-310000896878us-gaap:FairValueMeasurementsRecurringMember2024-07-310000896878us-gaap:CorporateNoteSecuritiesMemberus-gaap:FairValueMeasurementsRecurringMemberus-gaap:FairValueInputsLevel1Member2025-07-310000896878us-gaap:CorporateNoteSecuritiesMemberus-gaap:FairValueMeasurementsRecurringMemberus-gaap:FairValueInputsLevel2Member2025-07-310000896878us-gaap:CorporateNoteSecuritiesMemberus-gaap:FairValueMeasurementsRecurringMember2025-07-310000896878us-gaap:CorporateNoteSecuritiesMemberus-gaap:FairValueMeasurementsRecurringMemberus-gaap:FairValueInputsLevel1Member2024-07-310000896878us-gaap:CorporateNoteSecuritiesMemberus-gaap:FairValueMeasurementsRecurringMemberus-gaap:FairValueInputsLevel2Member2024-07-310000896878us-gaap:CorporateNoteSecuritiesMemberus-gaap:FairValueMeasurementsRecurringMember2024-07-310000896878us-gaap:USGovernmentAgenciesDebtSecuritiesMemberus-gaap:FairValueMeasurementsRecurringMemberus-gaap:FairValueInputsLevel1Member2025-07-310000896878us-gaap:USGovernmentAgenciesDebtSecuritiesMemberus-gaap:FairValueMeasurementsRecurringMemberus-gaap:FairValueInputsLevel2Member2025-07-310000896878us-gaap:USGovernmentAgenciesDebtSecuritiesMemberus-gaap:FairValueMeasurementsRecurringMember2025-07-310000896878us-gaap:USGovernmentAgenciesDebtSecuritiesMemberus-gaap:FairValueMeasurementsRecurringMemberus-gaap:FairValueInputsLevel1Member2024-07-310000896878us-gaap:USGovernmentAgenciesDebtSecuritiesMemberus-gaap:FairValueMeasurementsRecurringMemberus-gaap:FairValueInputsLevel2Member2024-07-310000896878us-gaap:USGovernmentAgenciesDebtSecuritiesMemberus-gaap:FairValueMeasurementsRecurringMember2024-07-310000896878us-gaap:CashAndCashEquivalentsMemberus-gaap:FairValueMeasurementsRecurringMemberus-gaap:FairValueInputsLevel1Member2025-07-310000896878us-gaap:CashAndCashEquivalentsMemberus-gaap:FairValueMeasurementsRecurringMemberus-gaap:FairValueInputsLevel2Member2025-07-310000896878us-gaap:CashAndCashEquivalentsMemberus-gaap:FairValueMeasurementsRecurringMember2025-07-310000896878us-gaap:CashAndCashEquivalentsMemberus-gaap:FairValueMeasurementsRecurringMemberus-gaap:FairValueInputsLevel1Member2024-07-310000896878us-gaap:CashAndCashEquivalentsMemberus-gaap:FairValueMeasurementsRecurringMemberus-gaap:FairValueInputsLevel2Member2024-07-310000896878us-gaap:CashAndCashEquivalentsMemberus-gaap:FairValueMeasurementsRecurringMember2024-07-310000896878intu:AvailableForSaleDebtSecuritiesInInvestmentsMemberus-gaap:FairValueMeasurementsRecurringMemberus-gaap:FairValueInputsLevel1Member2025-07-310000896878intu:AvailableForSaleDebtSecuritiesInInvestmentsMemberus-gaap:FairValueMeasurementsRecurringMemberus-gaap:FairValueInputsLevel2Member2025-07-310000896878intu:AvailableForSaleDebtSecuritiesInInvestmentsMemberus-gaap:FairValueMeasurementsRecurringMember2025-07-310000896878intu:AvailableForSaleDebtSecuritiesInInvestmentsMemberus-gaap:FairValueMeasurementsRecurringMemberus-gaap:FairValueInputsLevel1Member2024-07-310000896878intu:AvailableForSaleDebtSecuritiesInInvestmentsMemberus-gaap:FairValueMeasurementsRecurringMemberus-gaap:FairValueInputsLevel2Member2024-07-310000896878intu:AvailableForSaleDebtSecuritiesInInvestmentsMemberus-gaap:FairValueMeasurementsRecurringMember2024-07-310000896878intu:FundsReceivableAndAmountsHeldForCustomersMemberus-gaap:FairValueMeasurementsRecurringMemberus-gaap:FairValueInputsLevel1Member2025-07-310000896878intu:FundsReceivableAndAmountsHeldForCustomersMemberus-gaap:FairValueMeasurementsRecurringMemberus-gaap:FairValueInputsLevel2Member2025-07-310000896878intu:FundsReceivableAndAmountsHeldForCustomersMemberus-gaap:FairValueMeasurementsRecurringMember2025-07-310000896878intu:FundsReceivableAndAmountsHeldForCustomersMemberus-gaap:FairValueMeasurementsRecurringMemberus-gaap:FairValueInputsLevel1Member2024-07-310000896878intu:FundsReceivableAndAmountsHeldForCustomersMemberus-gaap:FairValueMeasurementsRecurringMemberus-gaap:FairValueInputsLevel2Member2024-07-310000896878intu:FundsReceivableAndAmountsHeldForCustomersMemberus-gaap:FairValueMeasurementsRecurringMember2024-07-310000896878us-gaap:FairValueMeasurementsRecurringMemberus-gaap:FairValueInputsLevel2Memberintu:SeniorUnsecuredNotesMemberus-gaap:UnsecuredDebtMember2025-07-310000896878us-gaap:FairValueMeasurementsRecurringMemberus-gaap:FairValueInputsLevel2Memberintu:SeniorUnsecuredNotesMemberus-gaap:UnsecuredDebtMember2024-07-310000896878intu:SeniorUnsecuredNotesMemberus-gaap:UnsecuredDebtMember2025-07-310000896878intu:SeniorUnsecuredNotesMemberus-gaap:UnsecuredDebtMember2024-07-310000896878us-gaap:FairValueInputsLevel3Member2024-08-012025-07-310000896878us-gaap:FairValueInputsLevel3Member2023-08-012024-07-310000896878us-gaap:FairValueInputsLevel3Member2022-08-012023-07-310000896878us-gaap:FairValueInputsLevel3Member2025-07-310000896878intu:CashAndCashEquivalentsIncludingFundsHeldForCustomersMember2025-07-310000896878intu:CashAndCashEquivalentsIncludingFundsHeldForCustomersMember2024-07-310000896878us-gaap:CorporateNoteSecuritiesMember2025-07-310000896878us-gaap:CorporateNoteSecuritiesMember2024-07-310000896878us-gaap:USGovernmentAgenciesDebtSecuritiesMember2025-07-310000896878us-gaap:USGovernmentAgenciesDebtSecuritiesMember2024-07-310000896878intu:SmallBusinessLoanMember2025-07-310000896878srt:MinimumMemberus-gaap:SoftwareAndSoftwareDevelopmentCostsMember2025-07-310000896878srt:MaximumMemberus-gaap:SoftwareAndSoftwareDevelopmentCostsMember2025-07-310000896878srt:MinimumMemberus-gaap:BuildingMember2025-07-310000896878srt:MaximumMemberus-gaap:BuildingMember2025-07-310000896878srt:MinimumMemberus-gaap:LeaseholdImprovementsMember2025-07-310000896878srt:MaximumMemberus-gaap:LeaseholdImprovementsMember2025-07-310000896878srt:MinimumMemberus-gaap:EquipmentMember2025-07-310000896878srt:MaximumMemberus-gaap:EquipmentMember2025-07-310000896878us-gaap:FurnitureAndFixturesMember2025-07-310000896878intu:GlobalBusinessSolutionsSegmentMember2023-07-310000896878intu:GlobalBusinessSolutionsSegmentMember2023-08-012024-07-310000896878intu:GlobalBusinessSolutionsSegmentMember2024-07-310000896878intu:GlobalBusinessSolutionsSegmentMember2024-08-012025-07-310000896878intu:GlobalBusinessSolutionsSegmentMember2025-07-310000896878intu:ConsumerSegmentMember2023-07-310000896878intu:ConsumerSegmentMember2023-08-012024-07-310000896878intu:ConsumerSegmentMember2024-07-310000896878intu:ConsumerSegmentMember2024-08-012025-07-310000896878intu:ConsumerSegmentMember2025-07-310000896878us-gaap:CustomerListsMember2025-07-310000896878intu:PurchasedTechnologyMember2025-07-310000896878us-gaap:TradeNamesMember2025-07-310000896878us-gaap:CustomerListsMember2024-07-310000896878intu:PurchasedTechnologyMember2024-07-310000896878us-gaap:TradeNamesMember2024-07-310000896878intu:A0.950NotesDueJuly2025Memberintu:SeniorUnsecuredNotesMember2025-07-310000896878intu:A0.950NotesDueJuly2025Memberintu:SeniorUnsecuredNotesMember2024-07-310000896878intu:A1.350notesdueJuly2027Memberintu:SeniorUnsecuredNotesMember2025-07-310000896878intu:A1.350notesdueJuly2027Memberintu:SeniorUnsecuredNotesMember2024-07-310000896878intu:A1.650notesdueJuly2030Memberintu:SeniorUnsecuredNotesMember2025-07-310000896878intu:A1.650notesdueJuly2030Memberintu:SeniorUnsecuredNotesMember2024-07-310000896878intu:FivePointTwoFiveZeroPercentNotesDueSeptember2026Memberintu:SeniorUnsecuredNotesMember2025-07-310000896878intu:FivePointTwoFiveZeroPercentNotesDueSeptember2026Memberintu:SeniorUnsecuredNotesMember2024-07-310000896878intu:FivePointOneTwoFivePercentNotesDueSeptember2028Memberintu:SeniorUnsecuredNotesMember2025-07-310000896878intu:FivePointOneTwoFivePercentNotesDueSeptember2028Memberintu:SeniorUnsecuredNotesMember2024-07-310000896878intu:FivePointTwoZeroZeroPercentNotesDueSeptember2033Memberintu:SeniorUnsecuredNotesMember2025-07-310000896878intu:FivePointTwoZeroZeroPercentNotesDueSeptember2033Memberintu:SeniorUnsecuredNotesMember2024-07-310000896878intu:FivePointFiveZeroZeroPercentNotesDueSeptember2053Memberintu:SeniorUnsecuredNotesMember2025-07-310000896878intu:FivePointFiveZeroZeroPercentNotesDueSeptember2053Memberintu:SeniorUnsecuredNotesMember2024-07-310000896878us-gaap:RevolvingCreditFacilityMemberintu:SubsidiaryMemberus-gaap:LineOfCreditMember2025-07-310000896878us-gaap:RevolvingCreditFacilityMemberintu:SubsidiaryMemberus-gaap:LineOfCreditMember2024-07-310000896878intu:TheSeniorUnsecuredNotesMemberintu:SeniorUnsecuredNotesMember2020-06-012020-06-300000896878intu:TheSeniorUnsecuredNotesMemberintu:SeniorUnsecuredNotesMember2020-06-300000896878intu:TheSeniorUnsecuredNotesMemberintu:SeniorUnsecuredNotesMember2025-05-012025-07-310000896878intu:TheSeniorUnsecuredNotesMemberintu:SeniorUnsecuredNotesMember2025-07-310000896878intu:The2023SeniorUnsecuredNotesMember2023-09-012023-09-300000896878intu:The2023SeniorUnsecuredNotesMember2023-09-300000896878us-gaap:RevolvingCreditFacilityMemberintu:A2024CreditFacilityMemberus-gaap:LineOfCreditMember2024-02-050000896878us-gaap:RevolvingCreditFacilityMemberintu:A2024CreditFacilityMemberus-gaap:LineOfCreditMember2024-02-052024-02-050000896878intu:SwinglineLoansMemberintu:A2024CreditFacilityMemberus-gaap:LineOfCreditMember2024-02-050000896878us-gaap:LetterOfCreditMemberintu:A2024CreditFacilityMemberus-gaap:LineOfCreditMember2024-02-050000896878us-gaap:RevolvingCreditFacilityMemberus-gaap:BaseRateMemberintu:A2024CreditFacilityMembersrt:MinimumMemberus-gaap:LineOfCreditMember2024-02-052024-02-050000896878us-gaap:RevolvingCreditFacilityMemberus-gaap:BaseRateMemberintu:A2024CreditFacilityMembersrt:MaximumMemberus-gaap:LineOfCreditMember2024-02-052024-02-050000896878us-gaap:RevolvingCreditFacilityMemberus-gaap:SecuredOvernightFinancingRateSofrMemberintu:A2024CreditFacilityMembersrt:MinimumMemberus-gaap:LineOfCreditMember2024-02-052024-02-050000896878us-gaap:RevolvingCreditFacilityMemberus-gaap:SecuredOvernightFinancingRateSofrMemberintu:A2024CreditFacilityMembersrt:MaximumMemberus-gaap:LineOfCreditMember2024-02-052024-02-050000896878us-gaap:RevolvingCreditFacilityMemberintu:InterestBenchmarkForRelevantCurrencyMemberintu:A2024CreditFacilityMembersrt:MinimumMemberus-gaap:LineOfCreditMember2024-02-052024-02-050000896878us-gaap:RevolvingCreditFacilityMemberintu:InterestBenchmarkForRelevantCurrencyMemberintu:A2024CreditFacilityMembersrt:MaximumMemberus-gaap:LineOfCreditMember2024-02-052024-02-050000896878us-gaap:RevolvingCreditFacilityMemberintu:A2024CreditFacilityMembersrt:MinimumMemberus-gaap:LineOfCreditMember2024-02-052024-02-050000896878us-gaap:RevolvingCreditFacilityMemberintu:A2024CreditFacilityMembersrt:MaximumMemberus-gaap:LineOfCreditMember2024-02-052024-02-050000896878us-gaap:RevolvingCreditFacilityMemberintu:A2024CreditFacilityMemberus-gaap:LineOfCreditMember2025-07-310000896878us-gaap:RevolvingCreditFacilityMemberintu:ShortTermRevolvingCreditFacilityMember2025-01-300000896878us-gaap:RevolvingCreditFacilityMemberus-gaap:BaseRateMemberintu:TheUnsecured2025CreditFacilityMemberus-gaap:LineOfCreditMember2025-01-302025-01-300000896878us-gaap:RevolvingCreditFacilityMemberus-gaap:SecuredOvernightFinancingRateSofrMemberintu:TheUnsecured2025CreditFacilityMemberus-gaap:LineOfCreditMember2025-01-302025-01-300000896878us-gaap:RevolvingCreditFacilityMemberintu:TheUnsecured2025CreditFacilityMember2025-01-302025-01-300000896878us-gaap:RevolvingCreditFacilityMemberintu:SecuredRevolvingCreditFacility2019Memberintu:SubsidiaryMemberus-gaap:LineOfCreditMember2022-07-180000896878us-gaap:RevolvingCreditFacilityMemberus-gaap:SecuredOvernightFinancingRateSofrMemberintu:SecuredRevolvingCreditFacility2019Memberintu:SubsidiaryMemberus-gaap:LineOfCreditMember2022-07-182022-07-180000896878us-gaap:RevolvingCreditFacilityMemberintu:SecuredRevolvingCreditFacility2019Membersrt:MinimumMemberintu:SubsidiaryMemberus-gaap:LineOfCreditMember2022-07-182022-07-180000896878us-gaap:RevolvingCreditFacilityMemberintu:SecuredRevolvingCreditFacility2019Membersrt:MaximumMemberintu:SubsidiaryMemberus-gaap:LineOfCreditMember2022-07-182022-07-180000896878us-gaap:RevolvingCreditFacilityMemberintu:SecuredRevolvingCreditFacility2019Memberintu:SubsidiaryMemberus-gaap:LineOfCreditMember2025-07-310000896878us-gaap:RevolvingCreditFacilityMemberintu:SecuredRevolvingCreditFacility2022Memberintu:SubsidiaryMemberus-gaap:LineOfCreditMember2024-04-300000896878us-gaap:RevolvingCreditFacilityMemberus-gaap:SecuredOvernightFinancingRateSofrMemberintu:SecuredRevolvingCreditFacility2022Memberintu:SubsidiaryMemberus-gaap:LineOfCreditMember2024-04-302024-04-300000896878us-gaap:RevolvingCreditFacilityMemberintu:SecuredRevolvingCreditFacility2022Membersrt:MinimumMemberintu:SubsidiaryMemberus-gaap:LineOfCreditMember2024-04-302024-04-300000896878us-gaap:RevolvingCreditFacilityMemberintu:SecuredRevolvingCreditFacility2022Membersrt:MaximumMemberintu:SubsidiaryMemberus-gaap:LineOfCreditMember2024-04-302024-04-300000896878us-gaap:RevolvingCreditFacilityMemberintu:SecuredRevolvingCreditFacility2022Memberintu:SubsidiaryMemberus-gaap:LineOfCreditMember2025-07-310000896878us-gaap:RevolvingCreditFacilityMemberintu:SecuredRevolvingCreditFacility2024Memberintu:SubsidiaryMemberus-gaap:LineOfCreditMember2024-04-300000896878us-gaap:RevolvingCreditFacilityMemberintu:SecuredRevolvingCreditFacility2024Memberintu:SubsidiaryMemberus-gaap:LineOfCreditMember2025-07-310000896878us-gaap:CommercialPaperMemberintu:CommercialPaperProgramMemberus-gaap:LineOfCreditMember2025-07-310000896878us-gaap:StateAndLocalJurisdictionMember2024-08-012025-07-310000896878us-gaap:StateAndLocalJurisdictionMember2023-08-012024-07-310000896878us-gaap:StateAndLocalJurisdictionMember2022-08-012023-07-310000896878us-gaap:DomesticCountryMember2025-07-310000896878us-gaap:StateAndLocalJurisdictionMember2025-07-310000896878us-gaap:ForeignCountryMember2025-07-310000896878us-gaap:StateAndLocalJurisdictionMemberus-gaap:ResearchMember2025-07-310000896878intu:CurrentProgramMember2025-07-310000896878us-gaap:SubsequentEventMember2025-08-190000896878us-gaap:SubsequentEventMember2025-08-312025-08-310000896878intu:Restated2005PlanMember2025-07-310000896878intu:Restated2005PlanMemberus-gaap:EmployeeStockOptionMember2024-08-012025-07-310000896878srt:MinimumMemberus-gaap:EmployeeStockOptionMember2024-08-012025-07-310000896878srt:MaximumMemberus-gaap:EmployeeStockOptionMember2024-08-012025-07-310000896878us-gaap:EmployeeStockOptionMember2024-08-012025-07-310000896878srt:MinimumMemberus-gaap:RestrictedStockUnitsRSUMember2024-08-012025-07-310000896878srt:MaximumMemberus-gaap:RestrictedStockUnitsRSUMember2024-08-012025-07-3100008968782022-01-212022-07-310000896878us-gaap:EmployeeStockOptionMember2025-07-310000896878us-gaap:EmployeeStockMember2025-07-310000896878us-gaap:SalesRevenueProductLineMember2024-08-012025-07-310000896878us-gaap:SalesRevenueProductLineMember2023-08-012024-07-310000896878us-gaap:SalesRevenueProductLineMember2022-08-012023-07-310000896878us-gaap:CostOfSalesMember2024-08-012025-07-310000896878us-gaap:CostOfSalesMember2023-08-012024-07-310000896878us-gaap:CostOfSalesMember2022-08-012023-07-310000896878us-gaap:SellingAndMarketingExpenseMember2024-08-012025-07-310000896878us-gaap:SellingAndMarketingExpenseMember2023-08-012024-07-310000896878us-gaap:SellingAndMarketingExpenseMember2022-08-012023-07-310000896878us-gaap:ResearchAndDevelopmentExpenseMember2024-08-012025-07-310000896878us-gaap:ResearchAndDevelopmentExpenseMember2023-08-012024-07-310000896878us-gaap:ResearchAndDevelopmentExpenseMember2022-08-012023-07-310000896878us-gaap:GeneralAndAdministrativeExpenseMember2024-08-012025-07-310000896878us-gaap:GeneralAndAdministrativeExpenseMember2023-08-012024-07-310000896878us-gaap:GeneralAndAdministrativeExpenseMember2022-08-012023-07-310000896878us-gaap:RestructuringChargesMember2024-08-012025-07-310000896878us-gaap:RestructuringChargesMember2023-08-012024-07-310000896878us-gaap:RestructuringChargesMember2022-08-012023-07-310000896878us-gaap:SegmentContinuingOperationsMember2024-08-012025-07-310000896878us-gaap:SegmentContinuingOperationsMember2023-08-012024-07-310000896878us-gaap:SegmentContinuingOperationsMember2022-08-012023-07-310000896878us-gaap:RestrictedStockUnitsRSUMember2024-08-012025-07-310000896878srt:MaximumMemberus-gaap:EmployeeStockOptionMember2023-08-012024-07-310000896878srt:MinimumMemberus-gaap:EmployeeStockOptionMember2022-08-012023-07-310000896878srt:MaximumMemberus-gaap:EmployeeStockOptionMember2022-08-012023-07-310000896878us-gaap:EmployeeStockOptionMember2023-08-012024-07-310000896878us-gaap:EmployeeStockOptionMember2022-08-012023-07-310000896878srt:MinimumMemberus-gaap:EmployeeStockMember2024-08-012025-07-310000896878srt:MaximumMemberus-gaap:EmployeeStockMember2024-08-012025-07-310000896878srt:MinimumMemberus-gaap:EmployeeStockMember2023-08-012024-07-310000896878srt:MaximumMemberus-gaap:EmployeeStockMember2023-08-012024-07-310000896878srt:MinimumMemberus-gaap:EmployeeStockMember2022-08-012023-07-310000896878srt:MaximumMemberus-gaap:EmployeeStockMember2022-08-012023-07-310000896878us-gaap:EmployeeStockMember2024-08-012025-07-310000896878us-gaap:EmployeeStockMember2023-08-012024-07-310000896878us-gaap:EmployeeStockMember2022-08-012023-07-310000896878us-gaap:RestrictedStockUnitsRSUMember2023-08-012024-07-310000896878us-gaap:RestrictedStockUnitsRSUMember2022-08-012023-07-310000896878us-gaap:RestrictedStockUnitsRSUMember2025-07-310000896878intu:StockOptionsAndEsppMember2024-08-012025-07-310000896878intu:StockOptionsAndEsppMember2023-08-012024-07-310000896878intu:StockOptionsAndEsppMember2022-08-012023-07-310000896878us-gaap:AccumulatedNetUnrealizedInvestmentGainLossMember2025-07-310000896878us-gaap:AccumulatedNetUnrealizedInvestmentGainLossMember2024-07-310000896878us-gaap:AccumulatedTranslationAdjustmentMember2025-07-310000896878us-gaap:AccumulatedTranslationAdjustmentMember2024-07-310000896878intu:IntuitInc401kPlanMember2024-08-012025-07-310000896878intu:CreditKarma401KPlanMember2024-08-012025-07-3100008968782022-05-042022-05-040000896878us-gaap:NonUsMemberus-gaap:GeographicConcentrationRiskMemberus-gaap:SalesRevenueNetMember2024-08-012025-07-310000896878us-gaap:NonUsMemberus-gaap:GeographicConcentrationRiskMemberus-gaap:SalesRevenueNetMember2022-08-012023-07-310000896878us-gaap:NonUsMemberus-gaap:GeographicConcentrationRiskMemberus-gaap:SalesRevenueNetMember2023-08-012024-07-310000896878us-gaap:OperatingSegmentsMemberintu:GlobalBusinessSolutionsSegmentMember2024-08-012025-07-310000896878us-gaap:OperatingSegmentsMemberintu:GlobalBusinessSolutionsSegmentMember2023-08-012024-07-310000896878us-gaap:OperatingSegmentsMemberintu:GlobalBusinessSolutionsSegmentMember2022-08-012023-07-310000896878us-gaap:OperatingSegmentsMemberintu:ConsumerSegmentMember2024-08-012025-07-310000896878us-gaap:OperatingSegmentsMemberintu:ConsumerSegmentMember2023-08-012024-07-310000896878us-gaap:OperatingSegmentsMemberintu:ConsumerSegmentMember2022-08-012023-07-310000896878us-gaap:OperatingSegmentsMember2024-08-012025-07-310000896878us-gaap:OperatingSegmentsMember2023-08-012024-07-310000896878us-gaap:OperatingSegmentsMember2022-08-012023-07-310000896878us-gaap:MaterialReconcilingItemsMember2024-08-012025-07-310000896878us-gaap:MaterialReconcilingItemsMember2023-08-012024-07-310000896878us-gaap:MaterialReconcilingItemsMember2022-08-012023-07-310000896878us-gaap:MaterialReconcilingItemsMemberintu:July2024RestructuringPlanMember2023-08-012024-07-310000896878intu:QuickBooksOnlineAccountingMemberintu:GlobalBusinessSolutionsSegmentMember2024-08-012025-07-310000896878intu:QuickBooksOnlineAccountingMemberintu:GlobalBusinessSolutionsSegmentMember2023-08-012024-07-310000896878intu:QuickBooksOnlineAccountingMemberintu:GlobalBusinessSolutionsSegmentMember2022-08-012023-07-310000896878intu:OnlineServicesMemberintu:GlobalBusinessSolutionsSegmentMember2024-08-012025-07-310000896878intu:OnlineServicesMemberintu:GlobalBusinessSolutionsSegmentMember2023-08-012024-07-310000896878intu:OnlineServicesMemberintu:GlobalBusinessSolutionsSegmentMember2022-08-012023-07-310000896878intu:OnlineEcosystemMemberintu:GlobalBusinessSolutionsSegmentMember2024-08-012025-07-310000896878intu:OnlineEcosystemMemberintu:GlobalBusinessSolutionsSegmentMember2023-08-012024-07-310000896878intu:OnlineEcosystemMemberintu:GlobalBusinessSolutionsSegmentMember2022-08-012023-07-310000896878intu:QuickBooksDesktopAccountingMemberintu:GlobalBusinessSolutionsSegmentMember2024-08-012025-07-310000896878intu:QuickBooksDesktopAccountingMemberintu:GlobalBusinessSolutionsSegmentMember2023-08-012024-07-310000896878intu:QuickBooksDesktopAccountingMemberintu:GlobalBusinessSolutionsSegmentMember2022-08-012023-07-310000896878intu:DesktopServicesandSuppliesMemberintu:GlobalBusinessSolutionsSegmentMember2024-08-012025-07-310000896878intu:DesktopServicesandSuppliesMemberintu:GlobalBusinessSolutionsSegmentMember2023-08-012024-07-310000896878intu:DesktopServicesandSuppliesMemberintu:GlobalBusinessSolutionsSegmentMember2022-08-012023-07-310000896878intu:DesktopEcosystemMemberintu:GlobalBusinessSolutionsSegmentMember2024-08-012025-07-310000896878intu:DesktopEcosystemMemberintu:GlobalBusinessSolutionsSegmentMember2023-08-012024-07-310000896878intu:DesktopEcosystemMemberintu:GlobalBusinessSolutionsSegmentMember2022-08-012023-07-310000896878intu:GlobalBusinessSolutionsSegmentMember2022-08-012023-07-310000896878intu:TurboTaxMemberintu:ConsumerSegmentMember2024-08-012025-07-310000896878intu:TurboTaxMemberintu:ConsumerSegmentMember2023-08-012024-07-310000896878intu:TurboTaxMemberintu:ConsumerSegmentMember2022-08-012023-07-310000896878intu:CreditKarmaMemberintu:ConsumerSegmentMember2024-08-012025-07-310000896878intu:CreditKarmaMemberintu:ConsumerSegmentMember2023-08-012024-07-310000896878intu:CreditKarmaMemberintu:ConsumerSegmentMember2022-08-012023-07-310000896878intu:ProTaxMemberintu:ConsumerSegmentMember2024-08-012025-07-310000896878intu:ProTaxMemberintu:ConsumerSegmentMember2023-08-012024-07-310000896878intu:ProTaxMemberintu:ConsumerSegmentMember2022-08-012023-07-310000896878intu:ConsumerSegmentMember2022-08-012023-07-310000896878us-gaap:OperatingSegmentsMemberintu:GlobalBusinessSolutionsSegmentMember2024-07-310000896878us-gaap:OperatingSegmentsMemberintu:GlobalBusinessSolutionsSegmentMember2025-07-310000896878us-gaap:OperatingSegmentsMemberintu:ConsumerSegmentMember2024-07-310000896878us-gaap:OperatingSegmentsMemberintu:ConsumerSegmentMember2025-07-310000896878us-gaap:CorporateNonSegmentMember2024-07-310000896878us-gaap:CorporateNonSegmentMember2024-08-012025-07-310000896878us-gaap:CorporateNonSegmentMember2025-07-310000896878us-gaap:OperatingSegmentsMemberintu:GlobalBusinessSolutionsSegmentMember2023-07-310000896878us-gaap:OperatingSegmentsMemberintu:ConsumerSegmentMember2023-07-310000896878us-gaap:CorporateNonSegmentMember2023-07-310000896878us-gaap:CorporateNonSegmentMember2023-08-012024-07-310000896878intu:SECSchedule1209AllowanceDoubtfulAccountsMember2024-07-310000896878intu:SECSchedule1209AllowanceDoubtfulAccountsMember2024-08-012025-07-310000896878intu:SECSchedule1209AllowanceDoubtfulAccountsMember2025-07-310000896878intu:SECSchedule1209ReserveForReturnsCreditsAndPromotionalDiscountsMember2024-07-310000896878intu:SECSchedule1209ReserveForReturnsCreditsAndPromotionalDiscountsMember2024-08-012025-07-310000896878intu:SECSchedule1209ReserveForReturnsCreditsAndPromotionalDiscountsMember2025-07-310000896878intu:SECSchedule1209AllowanceDoubtfulAccountsMember2023-07-310000896878intu:SECSchedule1209AllowanceDoubtfulAccountsMember2023-08-012024-07-310000896878intu:SECSchedule1209ReserveForReturnsCreditsAndPromotionalDiscountsMember2023-07-310000896878intu:SECSchedule1209ReserveForReturnsCreditsAndPromotionalDiscountsMember2023-08-012024-07-310000896878intu:SECSchedule1209AllowanceDoubtfulAccountsMember2022-07-310000896878intu:SECSchedule1209AllowanceDoubtfulAccountsMember2022-08-012023-07-310000896878intu:SECSchedule1209ReserveForReturnsCreditsAndPromotionalDiscountsMember2022-07-310000896878intu:SECSchedule1209ReserveForReturnsCreditsAndPromotionalDiscountsMember2022-08-012023-07-3100008968782025-05-012025-07-31
Washington, D.C. 20549
INTUIT INC.
Check the appropriate box below if the Form 8-K filing is intended to simultaneously satisfy the filing obligation of the registrant under any of the following provisions:
Indicate by check mark whether the registrant is an emerging growth company as defined in Rule 405 of the Securities Act of 1933 (§230.405 of this chapter) or Rule 12b-2 of the Securities Exchange Act of 1934 (§240.12b-2 of this chapter).
If an emerging growth company, indicate by check mark if the registrant has elected not to use the extended transition period for complying with any new or revised financial accounting standards provided pursuant to Section 13(a) of the Exchange Act. ☐
ITEM 8.01 OTHER EVENTS.
As previously announced, effective August 1, 2025, Intuit Inc. (the Company) combined its Consumer, Credit Karma, and ProTax businesses into a single Consumer business in order to better serve the diverse financial needs of its customers as one consumer platform. Since August 1, 2025, the Company has operated as two reporting segments: Consumer and Global Business Solutions. Since that date, the information that the Company's chief operating decision maker is regularly provided and reviews for purposes of allocating resources and assessing performance reflects this change.
To conform with these segment reporting changes, the Company has recast certain previously reported amounts and updated related disclosures contained in its Annual Report on Form 10-K for the fiscal year ended July 31, 2025 (2025 Form 10-K).
The Company is filing this Current Report on Form 8-K to provide the recast consolidated financial information for each of the three years covered in the 2025 Form 10-K. The updates do not represent a restatement of previously issued financial statements. The recast information of Items contained in the 2025 Form 10-K is presented in Exhibit 99.01 and incorporated herein by reference.
The information included in this Form 8-K is presented for informational purposes only in connection with the segment reporting changes described above and does not amend or restate our audited consolidated financial statements, which were included in our 2025 Form 10-K. This Form 8-K does not reflect events occurring after we filed our 2025 Form 10-K and does not modify or update the disclosures therein in any way, other than to illustrate the impact of the segment changes described above. For developments subsequent to the filing of the 2025 Form 10-K, refer to our Quarterly Report on Form 10-Q for the quarter ended October 31, 2025. This Form 8-K should be read in conjunction with the 2025 Form 10-K and our Quarterly Report on Form 10-Q for the quarter ended October 31, 2025.
ITEM 9.01 FINANCIAL STATEMENTS AND EXHIBITS.
Pursuant to the requirements of the Securities Exchange Act of 1934, the Registrant has duly caused this report to be signed on its behalf by the undersigned hereunto duly authorized.
Explanatory Note:
Intuit Inc. (Intuit) is filing this exhibit to update certain information set forth in its Annual Report on Form 10-K for the year ended July 31, 2025 (the 2025 Form 10-K), as filed with the Securities and Exchange Commission on September 3, 2025, to reflect changes in its reportable segments that became effective on August 1, 2025. This exhibit has not been updated for any other changes since the filing of the 2025 Form 10-K. For developments subsequent to the filing of the 2025 Form 10-K, refer to our Quarterly Report on Form 10-Q for the quarter ended October 31, 2025.
Intuit, TurboTax, Credit Karma, QuickBooks, and Mailchimp, among others, are registered trademarks and/or registered service marks of Intuit Inc., or one of its subsidiaries, in the United States and other countries. Other parties’ marks are the property of their respective owners.
Intuit is a global financial technology platform with a mission to power prosperity around the world. Serving approximately 100 million consumers, small and mid-market businesses, and accountants worldwide, Intuit’s platform brings the power of artificial intelligence (AI) and human intelligence together to fuel customers’ success. With TurboTax, Credit Karma, QuickBooks, Mailchimp, and Intuit Enterprise Suite, we help put more money in customers’ pockets, save them time by eliminating work, and help ensure that they have complete confidence in every financial decision they make.
Our strategy is to be an AI-driven expert platform by connecting customers to a virtual team of AI agents and AI-enabled human tax and financial experts. We're creating done-for-you experiences by automating everyday tasks, managing complex workflows and processes, and solving challenges before they arise with predictive insights. We connect customers to AI-enabled human experts for that last mile of decisions or to complete the work for them.
We harness the power of data, data services, AI, and human intelligence that help customers reach their financial goals. Intuit's all-in-one business platform helps customers run and grow their businesses end-to-end, from lead to cash. This includes financial management - including payments and capital - compliance, human capital management, and marketing products and services. Intuit's consumer platform helps customers do their taxes with ease and confidence and improve their financial success, from credit building to wealth building, with tax and personal financial management products and services. For accounting professionals, we provide professional tax and financial management products and services.
Intuit Inc. was incorporated in California in March 1984. We reincorporated in Delaware and completed our initial public offering in March 1993. Our principal executive offices are located at 2700 Coast Avenue, Mountain View, California, 94043, and our main telephone number is 650-944-6000. When we refer to “we,” “our,” or “Intuit” in this Annual Report on Form 10-K, we mean the current Delaware corporation (Intuit Inc.) and its California predecessor, as well as all of our consolidated subsidiaries.
Our Business Portfolio
Effective August 1, 2025, we combined our Consumer, Credit Karma, and ProTax businesses into a single Consumer segment in order to better serve the diverse financial needs of our customers as one consumer platform. Our chief operating decision maker allocates resources and assesses segment performance using regularly provided segment revenue and segment operating income information under this updated segment structure. The segment information in this Form 8-K has been recast to reflect these changes.
We organize our businesses into two reportable segments:
|
|
|
|
Global Business Solutions(1): This segment serves small and mid-market businesses around the world, and the accounting professionals who assist and advise them. QuickBooks and Intuit Enterprise Suite are offerings powered by our all-in-one business platform which includes financial management services, human capital management solutions such as payroll and time tracking, money solutions, such as merchant payment processing, bill pay, checking accounts through an FDIC-member bank partner, and financing for small and mid-market businesses. Intuit Enterprise Suite provides mid-market businesses with a configurable, AI-powered solution that includes multi-entity and multi-dimensional financial management capabilities designed to seamlessly scale and enhance productivity and profitability for more complex businesses to streamline operations. Mailchimp offerings include marketing automation and customer relationship tools.
Consumer: This segment primarily serves consumers and professional accountants.
Our TurboTax offerings primarily help consumers complete their taxes with confidence and maximize their financial outcomes—whether they do it themselves or with the help of an AI-enabled human expert. TurboTax delivers do-it-yourself and assisted income tax preparation products and services sold in the United States (U.S.) and Canada. We offer a variety of money products directly to consumers, including early refund access to any bank, as well as Credit Karma Money branded savings and checking accounts through an FDIC-member bank partner.
Credit Karma is a personal finance solution that helps members find the right financial products and make smarter money decisions throughout the year to reach their financial goals. This includes personalized recommendations for credit card, home, auto, and personal loan, and insurance products; and access to their credit scores and reports, credit and identity monitoring, credit report dispute, credit building tools, credit card rewards optimization, and connected account capabilities to help members understand net worth and make financial progress.
Finally, our ProTax offerings help professional accountants in the U.S. and Canada, who are essential to both business success and tax preparation and filing. Our professional tax offerings include Lacerte, ProSeries, and ProConnect Tax Online in the U.S., and ProFile and ProTax Online in Canada.
|
(1) On August 1, 2024, we renamed our Small Business & Self-Employed segment as the Global Business Solutions segment.
Our Business and Growth Strategy
The era of AI is igniting global innovations at an incredible pace and will fundamentally transform every part of our work and personal lives. We made an early bet on AI, declaring our AI-driven expert platform strategy in 2019. We have transformed the company from a tax and accounting platform to an AI-driven expert platform. We have a significant competitive advantage with our scale of data, data services, AI capabilities, ecosystem of applications, and our large network of AI-enabled human experts to become the all-in-one platform for consumers, businesses, and accountants. We're disrupting the categories we operate in to drive better money outcomes for our customers.
We leverage AI and human intelligence to provide our customers with done-for-you experiences that automate tasks, identify actionable insights to drive important decisions, and manage end-to-end workflows or entire processes to eliminate work, while ensuring the customer remains in control. When customers need additional help or want help to complete the work on their behalf, we connect them with the best human expert from our network of thousands of AI-enabled financial, tax, and bookkeeping experts who can complete a specific task, address specialized questions, or manage the entire workload. Our strategy, combined with our Big Bets that focus on the largest customer problems and growth opportunities, positions us for durable growth.
In fiscal 2025, we launched a transformative set of AI agents that provide customers with a virtual team to complete jobs on their behalf, dramatically improving how businesses run and grow. Combined with our AI-enabled human experts, these agents are automating workflows and delivering real-time insights to drive growth and improve cash flow. Our redesigned user interface and new business feed highlights these real-time insights and recommendations and the tasks completed by agents on behalf of the customer. We also launched AI agents in Intuit Enterprise Suite, including accounting, payments, finance, and project management agents, transforming how our small and mid-market business customers manage their finances by automating a variety of day-to-day tasks, and increasing productivity.
Our innovation has been possible with the investments in our proprietary Generative AI Operating System (GenOS), which have enabled us to fuel innovation with unparalleled speed for our customers. Built for our internal developers, GenOS not only keeps pace with rapid technological industry advances but is setting the pace—by melding the best of artificial intelligence and human intelligence on our platform. This enables us to rapidly deliver a new class of intelligent, autonomous financial solutions that will define the next decade of growth for our customers and for Intuit. Our AI-driven expert platform and products are built in keeping with the company’s commitment to data privacy, security, and responsible AI governance. We safeguard customer data and protect privacy using industry-leading technology and practices, and adhere to responsible AI principles that guide how we operate and scale our platform with our customers’ best interests in mind.
As we execute our global AI-driven expert platform strategy, we prioritize resources on our Big Bets across the company. We have driven significant momentum across the company over the past year. Looking ahead, we are doubling down on the areas that drove strong results this year where the combination of AI and human intelligence delivers done-for-you experiences, helps customers put more money in their pockets, and builds our mid-market business.
As the external environment evolves, we continue to innovate and adapt our strategy and anticipate our customers’ needs. For more than 40 years, we have been dedicated to developing innovative solutions that are designed to solve our customers' most important financial problems. At Intuit, we believe that everyone should have the opportunity to prosper, and we never stop working to find new, innovative ways to make that possible.
During fiscal 2025, we offered our products and services in the two segments described in “Our Business Portfolio” above. The following table shows the percentage of total revenue contributed by each of these segments over the last three fiscal years.
|
|
|
|
|
|
|
|
|
|
|
|
|
|
|
|
|
|
|
Fiscal 2025 |
|
Fiscal 2024 |
|
Fiscal 2023 |
|
|
|
|
|
|
| Global Business Solutions |
59 |
% |
|
59 |
% |
|
56 |
% |
| Consumer |
41 |
% |
|
41 |
% |
|
44 |
% |
Total international net revenue was approximately 8% of consolidated total net revenue in each of the twelve months ended July 31, 2025, 2024, and 2023.
For financial information about our reportable segments, see “Management’s Discussion and Analysis of Financial Condition and Results of Operations” in Item 7 and Note 14 to the consolidated financial statements in Item 8.
Global Business Solutions
Our Global Business Solutions segment serves small and mid-market businesses around the world, and the accounting professionals who assist and advise them. Our vision is to be the connected all-in-one platform with a virtual team of AI agents and AI-enabled human experts that small and mid-market businesses rely on every day to run and grow their businesses.
Small and mid-market business owners are constantly faced with challenges and barriers in their journey to success. Universally, businesses at every stage of growth struggle to get customers, pay and get paid, get capital, manage their workforce, get access to advice, and stay compliant. Our all-in-one platform features AI agents, providing actionable, AI-driven insights and automation to help our customers grow and run their businesses with confidence. These AI agents are also able to work alongside our large network of AI-enabled human experts to provide businesses with additional expertise and support.
Get Customers
Mailchimp. Mailchimp offers email and other marketing solutions that enable small and mid-market businesses to digitally promote themselves across email, social media, short message service (SMS), landing pages, ads, websites, and more, all from one place.
Pay and Get Paid
Payment Processing Solutions. Our full range of merchant services for small and mid-market businesses includes credit card, debit card, Apple Pay, and ACH payment services for in-person and card-not-present payments. We offer instant deposit and payment dispute protection options for eligible customers. Through seamless onboarding and automated transaction reconciliation, our payment processing solutions are deeply integrated into our QuickBooks Online, Desktop, and Intuit Enterprise Suite offerings.
QuickBooks Checking. The QuickBooks Checking business bank account comes with a physical and virtual debit card for more spending power, fast payments with no-fee Instant Deposit, and powerful cash flow management with envelopes for partitioning funds for future expenses, all with no fees.
Bill Pay. Our QuickBooks Online offerings and Intuit Enterprise Suite allow small and mid-market businesses to organize bills and make payments online. Small and mid-market businesses can connect with vendors and automatically import bills through our network, resulting in easier and faster payments.
Get Capital
Capital. We offer financing options for small and mid-market businesses to help them get the capital they need to succeed. The financing process provides customers with the ability to use their QuickBooks data to qualify to borrow capital, whether from Intuit via our originating bank partner or from partners on our QuickBooks Capital Marketplace. Additionally, QuickBooks Line of Credit provides flexible access to capital through pre-approved credit limits. Qualified small and mid-market businesses can choose to borrow funds through a series of term loans within a maximum approved credit limit.
Manage Their Workforce
Workforce Solutions. Our payroll solutions, available as online or desktop solutions, are sold on a subscription basis and integrate with our QuickBooks Online and Desktop offerings and Intuit Enterprise Suite, or may be purchased standalone. Our online payroll offerings include automated tax payments and filings, as well as access to human resources solutions and employee benefits offerings such as health insurance and 401(k) plans. We also offer time tracking solutions, which seamlessly integrate with our online payroll offerings to help businesses easily and accurately track time for their mobile workforce, including tools for project planning, job costing, and tracking billable hours per client.
Access Advice
QuickBooks Live. Businesses can get support through Expert Assisted and Full-Service Bookkeeping. With QuickBooks Live Expert Assisted, businesses have on-demand access to expert bookkeepers who can provide guidance and support on managing their books and making smart business decisions. With QuickBooks Live Full-Service Bookkeeping, businesses get one-on-one support from our team of expert bookkeepers to manage and maintain books with guaranteed accuracy. Our experienced bookkeepers are certified QuickBooks ProAdvisors, and many are Certified Public Accountants.
QuickBooks ProAdvisor. Accounting professionals can assist with bookkeeping, taxes, payroll, and more. Our free Find a ProAdvisor service helps customers find a QuickBooks Certified accountant or bookkeeper who knows their niche, speaks their language, or is nearby. To enable our network of hundreds of thousands of accountants, we offer memberships to the QuickBooks ProAdvisor program, which provides accountants access to QuickBooks Online Accountant, technical support, training, product certification, marketing tools, and discounts on Intuit products and services purchased on behalf of clients.
Be Compliant
QuickBooks Online. Designed for all kinds of businesses, QuickBooks Online helps simplify accounting and tax compliance. Users can track income and expenses, create and send invoices and estimates, manage and pay bills, and review a variety of financial reports. QuickBooks Online also has powerful industry-specific capabilities such as features for product-based businesses. QuickBooks Online is an open platform, enabling third-party developers to create online and mobile applications that integrate with our offering.
We offer different QuickBooks Online solutions depending on the size and complexity of the business, including Simple Start, Essentials, and Plus. QuickBooks Online Advanced is designed for mid-market businesses with more complex needs. QuickBooks Solopreneur and QuickBooks Self-Employed are designed for independent contractors and solo entrepreneurs.
Intuit Enterprise Suite. Designed for complex mid-market companies seeking to streamline operations, enhance productivity, and support growth, this solution builds upon the familiar QuickBooks Online interface. It integrates advanced financial management solutions, such as multi-entity accounting and multi-dimensional reporting, along with human resource and marketing tools in a unified solution.
QuickBooks Desktop Software. Our QuickBooks financial management solutions are also available as desktop versions for businesses on a subscription basis. QuickBooks Desktop Plus is designed for small businesses. QuickBooks Enterprise is designed for mid-market businesses with more complex needs and is available for download or as a hosted solution. This offering provides industry-specific reports and features for a range of industries, including Contractor, Manufacturing, Wholesale and Distribution, Retail, Nonprofit, Professional Services, and Accountants.
Financial Supplies. We offer a range of financial supplies designed for individuals and businesses that use our QuickBooks offerings. These include standard paper checks, Secure Plus checks with CheckLock fraud protection features, a variety of stationery, tax forms, and related supplies.
Consumer
Our Consumer segment primarily serves consumers and professional accountants and is comprised of our TurboTax, Credit Karma, and ProTax offerings. Our vision is to be a platform that engages consumers year-round to solve their most critical financial problems that include making ends meet, maximizing tax refunds, saving more, paying off debt, knowing where they stand, and reducing payments. We believe the combined strengths and reach of our brands will enable us to provide differentiated and durable personal finance benefits to consumers throughout the year.
TurboTax. Our TurboTax products and services are designed to enable consumers and businesses to prepare and file their federal and state income tax returns quickly and accurately. These offerings are available either online or as desktop versions in the U.S. and Canada. They are designed to be easy to use yet sophisticated enough for complex tax returns, serving the varied needs of our customers, from those who file simple returns to those who itemize deductions, own investments or rental property, and manage small and mid-market businesses.
Our do-it-yourself tax products and services are designed for customers who choose to independently prepare and file their tax returns. Our assisted tax products and services, such as TurboTax Live and TurboTax Live Full Service, are designed for customers who seek professional tax advice or who want their returns prepared by an expert. We also offer complementary
services, including electronic filing of federal and state income tax returns, audit defense, audit support, as well as a variety of financial offerings including early access to tax refunds and Credit Karma Money branded online savings and checking accounts through FDIC-member partner banks.
Our online tax preparation, filing, and other services are offered through the websites and mobile apps of thousands of financial institutions, electronic retailers, and other online merchants.
Credit Karma. Credit Karma provides consumers with a financial solution that propels them forward wherever they are on their financial journey, enabling them to understand their financial picture, make smart financial decisions, and stick to their financial plan. The platform offers a number of services to our members: access to their credit scores and reports, credit and identity monitoring, credit building, credit report dispute, tools to help understand net worth and make financial progress, personalized recommendations of credit card, loan, and insurance products, and access to our TurboTax offerings. To provide services to our members, Credit Karma works with a variety of partners, including credit bureaus, banks, credit card issuers, insurance carriers, and other financial institutions and lending partners. Additionally, Credit Karma leverages Lightbox, a first-of-its-kind enterprise platform which allows lenders to leverage thousands of de-identified data points from Credit Karma members to help provide our members with greater certainty that they will be approved if they apply for a financial product.
ProTax. Our ProTax professional tax offerings serve professional accountants in the U.S. and Canada, who are essential to both small business success and tax preparation and filing. Our professional tax offerings consist of Lacerte, ProSeries, and ProConnect Tax Online in the U.S., and ProFile and ProTax Online in Canada. These offerings enable accountants to accurately and efficiently complete and electronically file a full range of federal and state tax returns for individuals and businesses. Lacerte is designed for full-service, year-round accounting firms who handle more complex returns. ProSeries is designed for year-round tax practices handling moderately complex tax returns. ProConnect Tax Online is our cloud-based solution, designed for full-service, year-round practices that prepare all types of individual and business returns and integrates with our QuickBooks Online offerings. ProFile is our Canadian desktop tax offering, which serves year-round, full-service accounting firms for both individual and business tax returns. ProTax Online is our Canadian cloud-based tax solution, designed for full-service, year-round practices who prepare all forms of individual and business tax returns. It is integrated into QuickBooks Online Accountant to provide seamless integration of data across books and tax through our Workpapers solution. We also offer a variety of tax-related services that complement the tax return preparation process, including advisory services, year-round document storage, bank products, e-signature, and collaboration services, as well as additional capabilities such as desktop hosting, fixed asset management, and third-party solutions for practice management for some of our U.S. tax offerings.
Within our Consumer segment, our TurboTax and ProTax offerings have a significant and distinct seasonal pattern as sales and revenue from our income tax preparation products and services are typically heavily concentrated in the period from November through April. This seasonal pattern typically results in higher net revenues during our second and third quarters ending January 31 and April 30, respectively.
We expect the seasonality of these offerings to continue to have a material impact on our quarterly financial results in the future.
We are subject to federal, state, local, and international laws and regulations that add compliance costs, affect how we operate, and may impact our ability to compete. For example, the tax offerings in our Consumer segment are subject to federal, state, and international government requirements, including regulations related to the electronic filing of tax returns, the provision of tax preparer assistance, and the use and disclosure of customer information. The personal finance offerings in our Consumer segment, such as recommendations of credit card, loan, and insurance products and access to credit scores and reports, are also subject to certain regulatory requirements. Our Global Business Solutions segment offers products and services to small and mid-market businesses and consumers, such as payroll, payments, financing for small and mid-market businesses, and other financial service offerings, which are also subject to certain regulatory requirements. For additional information regarding the government regulations to which we are subject, see “Risk Factors” in Item 1A of Part I of our Annual Report on Form 10-K for the fiscal year ended July 31, 2025 (2025 Form 10-K), including without limitation the risks under “Legal and Compliance Risks.”
Our principal locations, their purposes, and the expiration dates for the leases on facilities at those locations as of July 31, 2025, are shown in the table below. We have renewal options on many of our leases.
|
|
|
|
|
|
|
|
|
|
|
|
|
|
|
|
|
|
|
|
|
| Location |
|
Purpose |
|
Approximate
Square
Feet |
|
Principal
Lease
Expiration
Dates |
|
|
|
|
|
|
|
| Mountain View, California |
|
Corporate headquarters and principal offices for Global Business Solutions segment |
|
364,000 |
|
Owned |
| Mountain View, California |
|
Corporate headquarters and principal offices for Global Business Solutions segment |
|
359,000 |
|
2026 - 2034 |
| Bangalore, India |
|
Principal offices for Intuit India |
|
478,000 |
|
2026 - 2029 |
| San Diego, California |
|
Principal offices for Consumer segment’s TurboTax business |
|
466,000 |
|
Owned |
| Oakland, California |
|
Principal offices for Consumer segment’s Credit Karma business |
|
167,000 |
|
2031 |
| Plano, Texas |
|
Principal offices for Consumer segment’s ProTax business |
|
166,000 |
|
2026 |
We also lease or own facilities in a number of domestic locations and lease facilities internationally in Canada, Israel, the United Kingdom, Australia, and other locations. We believe our facilities are suitable and adequate for our current and near-term needs, and that we will be able to locate additional facilities as needed. See Note 9 to the consolidated financial statements in Item 8 for more information about our lease commitments.
|
|
|
ITEM 7 - MANAGEMENT’S DISCUSSION AND ANALYSIS OF FINANCIAL
CONDITION AND RESULTS OF OPERATIONS |
Note: Intuit Inc. (Intuit) is filing this exhibit to update certain information set forth in its Annual Report on Form 10-K for the year ended July 31, 2025 (the 2025 Form 10-K), as filed with the Securities and Exchange Commission on September 3, 2025, to reflect changes in its reportable segments that became effective on August 1, 2025. This exhibit has not been updated for any other changes since the filing of the 2025 Form 10-K. For developments subsequent to the filing of the 2025 Form 10-K, refer to our Quarterly Report on Form 10-Q for the quarter ended October 31, 2025.
Management’s Discussion and Analysis of Financial Condition and Results of Operations (MD&A) is intended to provide readers of our consolidated financial statements with the perspectives of management. This should allow the readers of this report to obtain a comprehensive understanding of our businesses, strategies, current trends, and future prospects. Our MD&A includes the following sections:
|
|
|
|
• Executive Overview: High-level discussion of our operating results and some of the trends that affect our business.
• Critical Accounting Estimates: Policies and estimates that we believe are important to understanding the assumptions and judgments underlying our financial statements.
• Results of Operations: A more detailed discussion of our revenue and expenses.
• Liquidity and Capital Resources: Discussion of key aspects of our consolidated statements of cash flows, changes in our consolidated balance sheets, and our financial commitments.
|
You should note that this MD&A contains forward-looking statements that involve risks and uncertainties. Please see the section entitled “Forward-Looking Statements” immediately preceding Part I of our 2025 Form 10-K for important information to consider when evaluating such statements.
You should read this MD&A in conjunction with the consolidated financial statements and related notes in Item 8.
In the Results of Operations sections of this MD&A, where we describe two or more factors that contributed to changes in revenue and operating income, we have, where possible, quantified the impact of those factors. Where a change is the result of multiple factors that are interrelated and cannot be separately quantified, we have identified the interrelated factors without quantifying them.
In July 2024, our management approved, committed to, and initiated a plan of reorganization (the Plan) focused on reallocating resources to our key growth areas. The Plan included the exit of employees and the closing of real estate sites in certain markets to support growing technology teams and capabilities in strategic locations. The actions associated with the Plan were substantially complete in the first quarter of fiscal 2025. Total restructuring costs associated with the Plan were $238 million. During the twelve months ended July 31, 2025 and 2024, we recorded charges in connection with the Plan of $15 million and $223 million, respectively. These charges are primarily related to severance and employee benefits and are recorded to restructuring in our consolidated statements of operations. See Note 15 to the consolidated financial statements in Item 8 for more information.
On August 1, 2024, we renamed our Small Business & Self-Employed segment as the Global Business Solutions segment. This new name better aligns with the global reach of the Mailchimp and QuickBooks platform, our focus on serving both small and mid-market businesses, and our vision to become the all-in-one platform that customers use to grow and run their business.
On August 1, 2024, we reorganized certain technology and customer success functions in our Global Business Solutions and Consumer segments that support and benefit our overall platform and are managed at the corporate level rather than at the segment level. As a result of these reorganizations, costs associated with these functions are no longer included in segment operating income and are now included in other corporate expenses. For the twelve months ended July 31, 2024 and 2023, we reclassified $1.4 billion and $1.3 billion from Global Business Solutions and $606 million and $509 million from Consumer, to other corporate expenses, respectively, to conform to the current presentation. See Note 14 to the consolidated financial statements in Item 8 for more information.
Effective August 1, 2025, we combined our Consumer, Credit Karma, and ProTax businesses into a single Consumer segment in order to better serve the diverse financial needs of our customers as one consumer platform. Our chief operating decision maker allocates resources and assesses segment performance using regularly provided segment revenue and segment operating income information under this updated segment structure. To align results under this segment change, certain selling and marketing, product development, and general and administrative expenses for Credit Karma that were managed at the segment level are now managed at the platform level and are included in other corporate expenses rather than in segment expenses. Also on August 1, 2025, we reorganized certain marketing, communications, and customer success functions in our Global Business Solutions segment that support and benefit our overall platform and are managed at that level rather than at
the segment level. Additionally, certain data science and analytics teams that were managed at the platform level are now managed at the segment level. We have recast certain previously reported amounts to conform to these segment changes. For the twelve months ended July 31, 2025, 2024, and 2023, we reclassified expenses totaling $9 million, $16 million, and $4 million from Global Business Solutions and $606 million, $585 million, and $581 million from Consumer to other corporate expenses, respectively, to conform to the current presentation. See Note 14 to the consolidated financial statements in Item 8 for more information.
This overview provides a high-level discussion of our operating results and some of the trends that affect our business. We believe that an understanding of these trends is important in order to understand our financial results for fiscal 2025, as well as our future prospects. This summary is not intended to be exhaustive, nor is it a substitute for the detailed discussion and analysis provided elsewhere in this Annual Report on Form 10-K.
|
|
|
Industry Trends and Seasonality |
Industry Trends
AI, including GenAI, predictive AI, and agentic AI, is transforming multiple industries, in particular financial technology. Disruptive start-ups, emerging ecosystems, and mega-platforms are harnessing new technology to create personalized experiences, deliver data-driven insights, and increase speed of service. These shifts are creating a more dynamic and highly competitive environment where customer expectations are shifting around the world as more services become digitized and the array of choices continues to increase.
Seasonality
Within our Consumer segment, our TurboTax and ProTax offerings have a significant and distinct seasonal pattern as sales and revenue from our income tax preparation products and services are typically heavily concentrated in the period from November through April. This seasonal pattern typically results in higher net revenues during our second and third quarters ending January 31 and April 30, respectively.
We expect the seasonality of these offerings to continue to have a material impact on our quarterly financial results in the future.
Our growth strategy depends upon our ability to innovate, develop, and introduce emerging technologies, including AI and GenAI, to drive broad adoption of our products and services and enter new markets. Our future growth also increasingly depends on the strength of our third-party business relationships and our ability to continue to develop, maintain, and strengthen new and existing relationships. To remain competitive and continue to grow, we are investing significant resources in our product development, marketing, and sales capabilities, and we expect to continue to do so in the future. Much of our future success also depends on our ability to continue to attract, retain, and develop highly skilled employees, including those in technical and leadership roles who are critical to our strategic growth, in a highly competitive talent environment.
As we offer more online services, the ongoing operation and availability of our platforms and systems and those of our external service providers is becoming increasingly important. Because we help customers manage their financial lives, we face risks associated with the hosting, collection, use, and retention of personal customer information and data. We are investing significant management attention and resources in our information technology infrastructure and in our privacy and security capabilities, and we expect to continue to do so in the future.
We operate in industries that are experiencing an increasing amount of fraudulent activities by malicious third parties, and those fraudulent activities are becoming increasingly sophisticated, including through the use of AI. We implement additional security measures, and we continue to work with state and federal governments to implement industry-wide security and anti-fraud measures, including sharing information regarding suspicious activity. We continue to invest in security measures and to work with the broader industry and government to protect our customers against this type of fraud.
Our operations are impacted by a rapidly-evolving regulatory environment and face increasingly heightened scrutiny. We are subject to numerous federal, state, and local, as well as foreign laws and regulations covering a broad and increasing range of subjects, both in the United States (U.S.) and internationally.
For a complete discussion of the most significant risks and uncertainties affecting our business, please see “Forward-Looking Statements” immediately preceding Part I and “Risk Factors” in Item 1A of Part I of our 2025 Form 10-K.
|
|
|
Overview of Financial Results |
The most important financial indicators that we use to assess our business are revenue growth for the company as a whole and for each reportable segment; operating income growth for the company as a whole; earnings per share; and cash flow from operations. We also track certain non-financial drivers of revenue growth and, when material, identify them in the applicable discussions of segment results below. Service offerings are a significant part of our business. Our total service revenue was $16.4 billion, or 87% of our total revenue in fiscal 2025, and we expect our total service revenue as a percentage of our total revenue to grow over the long term.
Key highlights for fiscal 2025 include the following:
|
|
|
|
|
|
|
|
|
|
|
|
|
|
|
|
|
|
|
|
| Revenue of |
|
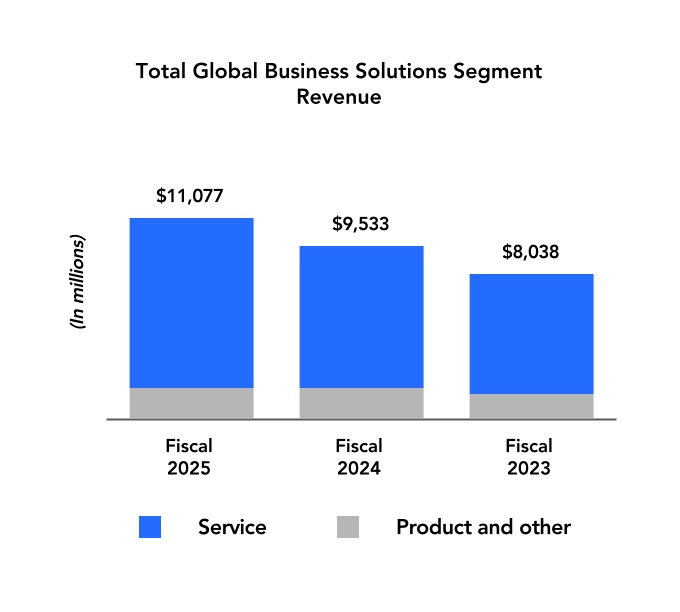
Global Business Solutions revenue of |
|
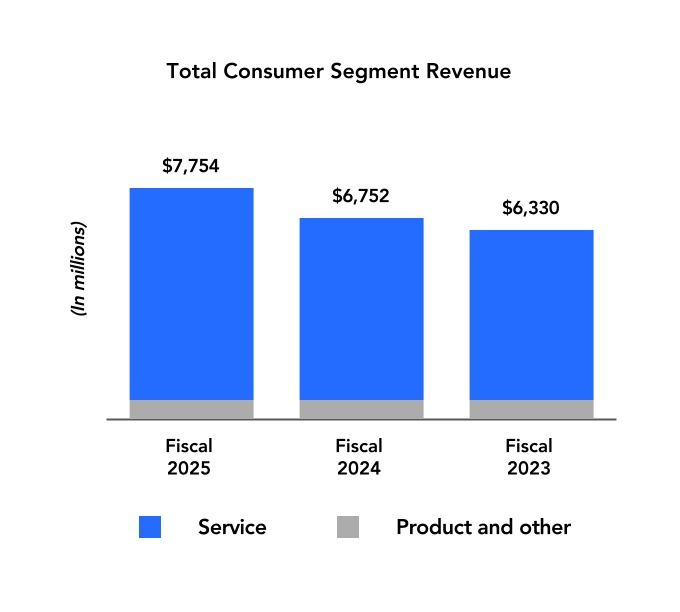
Consumer revenue of |
| $18.8 B |
|
$11.1 B |
|
$7.8 B |
| up 16% from fiscal 2024 |
|
up 16% from fiscal 2024 |
|
up 15% from fiscal 2024 |
|
|
|
|
|
|
|
|
|
|
| Operating income of |
|
Net income of |
|
Diluted net income per share of |
| $4.9 B |
|
$3.9 B |
|
$13.67 |
| up 36% from fiscal 2024 |
|
up 31% from fiscal 2024 |
|
up 31% from fiscal 2024 |
|
|
|
|
|
|
|
|
|
|
|
|
Cash flow from operations of |
|
|
|
|
$6.2 B |
|
|
|
|
up 27% from fiscal 2024 |
|
|
A discussion regarding our financial condition and results of operations for fiscal 2025 compared to fiscal 2024 is presented below. Also included below is a discussion regarding our segment results for fiscal 2024 compared to fiscal 2023. For a discussion regarding our consolidated financial condition and results of operations for fiscal 2024 compared to fiscal 2023, refer to Item 7 of Part II in our Annual Report on Form 10-K for the fiscal year ended July 31, 2024, filed with the SEC on September 4, 2024, which is available free of charge on the SEC’s website at www.sec.gov and on the Investor Relations section of our corporate website at investors.intuit.com.
|
|
|
|
|
|
|
|
|
|
|
|
|
|
|
|
|
|
|
|
|
|
|
|
|
|
|
|
|
|
| Financial Overview |
|
|
|
|
|
|
|
|
|
|
|
|
|
|
|
|
|
|
|
| (Dollars in millions, except per share amounts) |
Fiscal
2025 |
|
Fiscal
2024 |
|
Fiscal
2023 |
|
2025-2024
% Change |
|
2024-2023
% Change |
| Total net revenue |
$18,831 |
|
|
$16,285 |
|
|
$14,368 |
|
|
16 |
% |
|
13 |
% |
| Operating income |
4,923 |
|
|
3,630 |
|
|
3,141 |
|
|
36 |
% |
|
16 |
% |
| Net income |
3,869 |
|
|
2,963 |
|
|
2,384 |
|
|
31 |
% |
|
24 |
% |
| Diluted net income per share |
$13.67 |
|
|
$10.43 |
|
|
$8.42 |
|
|
31 |
% |
|
24 |
% |
Fiscal 2025 Compared with Fiscal 2024
Total net revenue increased $2.5 billion, or 16%, in fiscal 2025 compared with fiscal 2024. Global Business Solutions segment revenue increased 16% due to growth in our Online Ecosystem revenue. Consumer segment revenue increased 15% due to strength in our Credit Karma personal loan, credit card, and auto insurance verticals, and growth in TurboTax from higher-priced and additional service offerings, such as TurboTax Live and our early tax refund offerings. See “Segment Results” later in this Item 7 for more information.
Operating income increased $1.3 billion, or 36%, in fiscal 2025 compared with fiscal 2024. The increase in operating income was due to the increase in revenue described above partially offset by an increase in expenses. Expenses increased due to increases in marketing, staffing, outside services, and sales-related expenses partially offset by a decrease in restructuring expenses. See “Operating Expenses” later in this Item 7 for more information. See Note 15 to the consolidated financial statements in Item 8 for more information on our restructuring charges.
Net income increased $906 million, or 31%, in fiscal 2025 compared with fiscal 2024. The increase in net income was due to the increase in operating income described above, partially offset by an increase in income tax expense. The increase in income tax expense is due to the increase in operating income described above and a decrease in excess tax benefits related to share-based compensation. Diluted net income per share increased 31% to $13.67 for fiscal 2025, in line with the increase in net income.
Fiscal 2024 Compared with Fiscal 2023
Total net revenue increased $1.9 billion, or 13%, in fiscal 2024 compared with fiscal 2023. Global Business Solutions segment revenue increased 19% due to growth in our Online Ecosystem revenue. Consumer segment revenue increased 7% due to growth in TurboTax from the interrelated factors of a shift in mix to our higher-priced TurboTax services offerings, such as TurboTax Live, and higher effective prices. See “Segment Results” later in this Item 7 for more information.
Operating income increased $489 million, or 16%, in fiscal 2024 compared with fiscal 2023. The increase in operating income was due to the increase in revenue described above and an increase in expenses. Expenses increased due to staffing, marketing, restructuring, share-based compensation, and outside services. See “Operating Expenses” later in this Item 7 for more information. See Note 15 to the consolidated financial statements in Item 8 for more information on our restructuring charges.
Net income increased $579 million, or 24%, in fiscal 2024 compared with fiscal 2023. The increase in net income was due to the increase in operating income described above, an increase in interest income due to higher average interest rates, and a decrease in income tax expense related to higher excess tax benefits on share-based compensation. Diluted net income per share increased 24% to $10.43 for fiscal 2024, in line with the increase in net income.
The information below is organized in accordance with our two reportable segments. All of our segments operate and sell to customers primarily in the U.S. Total international net revenue was approximately 8% of consolidated total net revenue in each of the twelve months ended July 31, 2025, 2024, and 2023.
On August 1, 2024, we renamed our Small Business & Self-Employed segment as the Global Business Solutions segment. This new name better aligns with the global reach of the Mailchimp and QuickBooks platform, our focus on serving both small and mid-market businesses, and our vision to become the all-in-one platform that customers use to grow and run their business.
On August 1, 2024, we reorganized certain technology and customer success functions in our Global Business Solutions and Consumer segments that support and benefit our overall platform and are managed at the corporate level rather than at the segment level. As a result of these reorganizations, costs associated with these functions are no longer included in segment operating income and are now included in other corporate expenses. For the twelve months ended July 31, 2024 and 2023, we reclassified $1.4 billion and $1.3 billion from Global Business Solutions and $606 million and $509 million from Consumer to other corporate expenses, respectively, to conform to the current presentation.
Effective August 1, 2025, we combined our Consumer, Credit Karma, and ProTax businesses into a single Consumer segment in order to better serve the diverse financial needs of our customers as one consumer platform. Our chief operating decision maker allocates resources and assesses segment performance using regularly provided segment revenue and segment operating income information under this updated segment structure. To align results under this segment change, certain selling and marketing, product development, and general and administrative expenses for Credit Karma that were managed at the segment level are now managed at the platform level and are included in other corporate expenses rather than in segment expenses. Also on August 1, 2025, we reorganized certain marketing, communications, and customer success functions in our Global Business Solutions segment that support and benefit our overall platform and are managed at that level rather than at the segment level. Additionally, certain data science and analytics teams that were managed at the platform level are now managed at the segment level. We have recast certain previously reported amounts to conform to these segment changes. For the twelve months ended July 31, 2025, 2024, and 2023, we reclassified expenses totaling $9 million, $16 million, and $4 million from Global Business Solutions and $606 million, $585 million, and $581 million from Consumer to other corporate expenses, respectively, to conform to the current presentation. See Note 14 to the consolidated financial statements in Item 8 for more information.
Segment operating income is segment net revenue less segment cost of revenue and operating expenses. We include expenses such as corporate selling and marketing, general and administrative, and non-employment related legal and litigation settlement costs, which are not allocated to specific segments, in unallocated corporate items as part of other corporate expenses. As part of our platform strategy, we also include customer success and product development for our segments in unallocated corporate items as we do not allocate these expenses to the segments because they are managed at the platform level. Customer success includes the costs of tax and bookkeeping experts that support our TurboTax Live and QuickBooks Live offerings. Unallocated corporate items also include share-based compensation, amortization of acquired technology, amortization of other acquired intangible assets, goodwill and intangible asset impairment charges, professional fees and transaction costs related to business combinations, and restructuring charges. These unallocated corporate costs for all segments totaled $9.3 billion in fiscal 2025, $8.6 billion in fiscal 2024, and $7.6 billion in fiscal 2023. Unallocated corporate items increased in fiscal 2025 compared with fiscal 2024 due to increases in cost of service revenue, research and development expense, and general and administrative expense, partially offset by a decrease in restructuring costs. See Note 14 to the consolidated financial statements in Item 8 for reconciliations of total segment operating income to consolidated operating income for each fiscal year presented.
|
|
|
|
Global Business Solutions |
|
Global Business Solutions segment revenue includes both Online Ecosystem and Desktop Ecosystem revenue.
Our Online Ecosystem includes revenue from:
•QuickBooks Online and Intuit Enterprise Suite financial and business management offerings;
•QuickBooks Live;
•Workforce solutions, including QuickBooks Online Payroll and QuickBooks Time;
•Money offerings for businesses that use online offerings, which include merchant payment processing and bill pay services, and financing for small and mid-market businesses (QuickBooks Capital);
•Mailchimp’s marketing automation offerings; and
•QuickBooks Checking.
Our Desktop Ecosystem includes revenue from:
•QuickBooks Desktop software subscriptions (QuickBooks Desktop Plus, QuickBooks Enterprise, and ProAdvisor Program memberships for the accounting professionals who serve small businesses);
•Desktop workforce solutions, including payroll products);
•Money offerings for businesses that use desktop offerings, which include merchant payment processing services and financing for small and mid-market businesses (QuickBooks Capital); and
•Financial supplies.
Global Business Solutions segment service revenue is primarily derived from our Online Ecosystem revenue and revenue from the services, support, and when-and-if-available product upgrades and enhancements that are provided as part of our QuickBooks Desktop subscriptions; services and support for our desktop payroll offerings, and merchant payment processing services. Global Business Solutions segment product and other revenue is primarily derived from revenue related to delivery of software licenses, version protection updates, and payroll software updates for our QuickBooks Desktop subscriptions and desktop payroll offerings, which are part of our Desktop Ecosystem.
|
|
|
|
|
|
|
|
|
|
|
|
|
|
|
|
|
|
|
|
|
|
|
|
|
|
|
|
|
|
| (Dollars in millions) |
Fiscal
2025 |
|
Fiscal
2024 |
|
Fiscal
2023 |
|
2025-2024
% Change |
|
2024-2023
% Change |
Service revenue |
$ |
9,325 |
|
|
$ |
7,792 |
|
|
$ |
6,641 |
|
|
|
|
|
Product and other revenue |
1,752 |
|
|
1,741 |
|
|
1,397 |
|
|
|
|
|
| Total segment revenue |
$ |
11,077 |
|
|
$ |
9,533 |
|
|
$ |
8,038 |
|
|
16 |
% |
|
19 |
% |
| % of total revenue |
59 |
% |
|
59 |
% |
|
56 |
% |
|
|
|
|
|
|
|
|
|
|
|
|
|
|
| Segment operating income |
$ |
8,476 |
|
|
$ |
7,173 |
|
|
$ |
5,904 |
|
|
18 |
% |
|
21 |
% |
| % of related revenue |
77 |
% |
|
75 |
% |
|
73 |
% |
|
|
|
|
Revenue classified by significant service and product offerings was as follows:
|
|
|
|
|
|
|
|
|
|
|
|
|
|
|
|
|
|
|
|
|
|
|
|
|
|
|
|
|
|
| (Dollars in millions) |
Fiscal
2025 |
|
Fiscal
2024 |
|
Fiscal
2023 |
|
2025-2024
% Change |
|
2024-2023
% Change |
| Net revenue: |
|
|
|
|
|
|
|
|
|
| QuickBooks Online Accounting |
$ |
4,120 |
|
|
$ |
3,379 |
|
|
$ |
2,849 |
|
|
22 |
% |
|
19 |
% |
| Online Services |
4,182 |
|
|
3,513 |
|
|
2,910 |
|
|
19 |
% |
|
21 |
% |
| Total Online Ecosystem |
8,302 |
|
|
6,892 |
|
|
5,759 |
|
|
20 |
% |
|
20 |
% |
| QuickBooks Desktop Accounting |
1,672 |
|
|
1,575 |
|
|
1,211 |
|
|
6 |
% |
|
30 |
% |
| Desktop Services and Supplies |
1,103 |
|
|
1,066 |
|
|
1,068 |
|
|
3 |
% |
|
— |
% |
| Total Desktop Ecosystem |
2,775 |
|
|
2,641 |
|
|
2,279 |
|
|
5 |
% |
|
16 |
% |
| Total Global Business Solutions |
$ |
11,077 |
|
|
$ |
9,533 |
|
|
$ |
8,038 |
|
|
16 |
% |
|
19 |
% |
In August 2024, we reorganized certain technology and customer success functions that support and benefit the overall platform and are managed at the corporate level rather than at the segment level. As a result, these costs are no longer included in segment operating income and are now included in other corporate expenses. For the twelve months ended July 31, 2024 and 2023, we reclassified $1.4 billion and $1.3 billion, respectively, from Global Business Solutions to other corporate expenses to conform to the current presentation.
In August 2025, we reorganized certain marketing, communications, and customer success functions in our Global Business Solutions segment that support and benefit our overall platform and are managed at that level rather than at the segment level. Additionally, certain data science and analytics teams that were managed at the platform level are now managed at the segment level. We have recast certain previously reported amounts to conform to these segment changes. For the twelve months ended July 31, 2025, 2024, and 2023, we reclassified expenses totaling $9 million, $16 million, and $4 million from Global Business Solutions to other corporate expenses to conform to the current presentation.
Fiscal 2025 Compared with Fiscal 2024
Revenue for our Global Business Solutions segment increased $1.5 billion, or 16%, in fiscal 2025 compared with fiscal 2024. The increase was due to growth in Online Ecosystem revenue, which contributed to $1.4 billion of the increase for fiscal 2025.
Online Ecosystem
Online Ecosystem revenue increased $1.4 billion, or 20%, in fiscal 2025 compared with fiscal 2024. QuickBooks Online Accounting revenue increased $741 million, or 22%, in fiscal 2025 compared with fiscal 2024 due to the interrelated factors of higher effective prices, customer growth, and mix-shift. Online Services revenue increased $669 million, or 19%, in fiscal 2025 compared with fiscal 2024 due to increases in revenue from our money offerings of $379 million, our payroll offerings of $279 million, and Mailchimp of $20 million. Revenue increases were due to the interrelated factors described below. Money revenue increased $379 million due to a $242 million increase in payments revenue from payments customer growth, an increase in total payment volume per customer, and higher effective payments prices, and due to a $137 million increase from QuickBooks Capital. Online payroll revenue increased due to customer growth, mix-shift, and higher effective prices. Mailchimp revenue increased due to higher effective prices.
Online Ecosystem average revenue per customer, which we define as total online ecosystem revenue divided by the average number of online paying customers, increased 14% for fiscal 2025 compared with fiscal 2024. Online ecosystem paying customers, which we define as the sum of all QuickBooks Online customers, QuickBooks Time customers, Mailchimp paying customers, and customers who subscribe to standalone services outside of QuickBooks Online, increased 5% as of July 31, 2025 compared with July 31, 2024.
Desktop Ecosystem
Desktop Ecosystem revenue increased $134 million, or 5%, in fiscal 2025 compared with fiscal 2024. The increase was due to higher effective prices and changes we made to our QuickBooks desktop offerings beginning in early fiscal 2024 to complete the transition to a recurring subscription model, which more closely aligns our Desktop license and related product updates to our Desktop subscription billing model.
Global Business Solutions segment operating income increased $1.3 billion, or 18%, in fiscal 2025 compared with fiscal 2024 due to the increase in revenue described above, partially offset by increases in staffing expenses of $61 million, marketing expenses of $44 million, QuickBooks Capital cost of revenue of $42 million due to increased loan volume, online payments cost of revenue of $41 million due to an increase in payments volume, and sales-related expenses of $22 million.
Fiscal 2024 Compared with Fiscal 2023
Revenue for our Global Business Solutions segment increased $1.5 billion, or 19%, in fiscal 2024 compared with fiscal 2023. The increase was due to growth in Online Ecosystem revenue, which contributed to $1.1 billion of the increase for fiscal 2024.
Online Ecosystem
Online Ecosystem revenue increased $1.1 billion, or 20%, in fiscal 2024 compared with fiscal 2023. Online Services revenue increased $603 million, or 21%, in fiscal 2024 compared with fiscal 2023 due to increases in revenue from our payroll offerings of $211 million, our payments offerings of $203 million, and Mailchimp of $125 million. Revenue increases were due to the interrelated factors described below. Online payroll revenue increased due to customer growth, higher effective prices, and a shift in mix to higher-end offerings. Online payments revenue increased due to customer growth, higher effective prices, and an increase in total payment volume per customer. Mailchimp revenue increased due to higher effective prices and paid customer growth. QuickBooks Online Accounting revenue increased $530 million, or 19%, in fiscal 2024 compared with fiscal 2023 due to customer growth, higher effective prices, and a shift in mix to our higher-priced offerings.
Online Ecosystem average revenue per customer, which we define as total online ecosystem revenue divided by the average number of online paying customers, increased 11% for fiscal 2024 compared with fiscal 2023. Online ecosystem paying customers, which we define as the sum of all QuickBooks Online customers, QuickBooks Time customers, Mailchimp paying customers, and customers who subscribe to standalone services outside of QuickBooks Online, increased 6% as of July 31, 2024 compared with July 31, 2023.
Desktop Ecosystem
Desktop Ecosystem revenue increased $362 million, or 16%, in fiscal 2024 compared with fiscal 2023, $252 million of which is due to the interrelated factors of customer growth and price increases primarily in our QuickBooks Desktop and Enterprise subscription offerings. Approximately $110 million of fiscal 2024 revenue is associated with changes we made to our offerings in fiscal 2024 to complete the transition to a recurring subscription model, which more closely aligns our Desktop license and related product updates to our Desktop subscription billing model.
Global Business Solutions segment operating income increased $1.3 billion, or 21%, in fiscal 2024 compared with fiscal 2023, due to the increase in revenue described above, which was partially offset by increases in marketing expenses of $102 million, staffing expenses of $25 million, and sales-related expenses of $25 million.
Consumer segment revenue includes the following:
•TurboTax - TurboTax Online and TurboTax Live offerings; TurboTax desktop tax return preparation software; electronic tax filing services; Credit Karma Money; and related services.
•Credit Karma - cost-per-action transactions, which include the delivery of qualified links that result in completed actions such as credit card issuances and personal loan funding; cost-per-click and cost-per-lead transactions, which include user clicks on advertisements or advertisements that allow for the generation of leads, and primarily relate to mortgage and insurance businesses.
•ProTax - ProConnect Tax Online tax products; Lacerte, ProSeries, and ProFile desktop tax preparation software products, and related form updates; electronic tax filing services; connected services; and bank products.
Consumer segment service revenue is primarily derived from our online TurboTax and ProTax offerings, related electronic tax filing services, connected services, and bank products, and Credit Karma. Consumer segment product and other revenue is primarily derived from our TurboTax and ProTax desktop tax return preparation software and related form updates.
|
|
|
|
|
|
|
|
|
|
|
|
|
|
|
|
|
|
|
|
|
|
|
|
|
|
|
|
|
|
| (Dollars in millions) |
Fiscal
2025 |
|
Fiscal
2024 |
|
Fiscal
2023 |
|
2025-2024
% Change |
|
2024-2023
% Change |
Service revenue |
$ |
7,075 |
|
|
$ |
6,069 |
|
|
$ |
5,676 |
|
|
|
|
|
Product and other revenue |
679 |
|
|
683 |
|
|
654 |
|
|
|
|
|
| Total segment revenue |
$ |
7,754 |
|
|
$ |
6,752 |
|
|
$ |
6,330 |
|
|
15 |
% |
|
7 |
% |
| % of total revenue |
41 |
% |
|
41 |
% |
|
44 |
% |
|
|
|
|
|
|
|
|
|
|
|
|
|
|
| Segment operating income |
$ |
5,760 |
|
|
$ |
5,012 |
|
|
$ |
4,848 |
|
|
15 |
% |
|
3 |
% |
| % of related revenue |
74 |
% |
|
74 |
% |
|
77 |
% |
|
|
|
|
Revenue classified by significant service and product offerings was as follows:
|
|
|
|
|
|
|
|
|
|
|
|
|
|
|
|
|
|
|
|
|
|
|
|
|
|
|
|
|
|
| (Dollars in millions) |
Fiscal
2025 |
|
Fiscal
2024 |
|
Fiscal
2023 |
|
2025-2024
% Change |
|
2024-2023
% Change |
| Net revenue: |
|
|
|
|
|
|
|
|
|
TurboTax |
$ |
4,933 |
|
|
$ |
4,508 |
|
|
$ |
4,178 |
|
|
9 |
% |
|
8 |
% |
Credit Karma |
2,200 |
|
|
1,645 |
|
|
1,591 |
|
|
34 |
% |
|
3 |
% |
ProTax |
621 |
|
|
599 |
|
|
561 |
|
|
4 |
% |
|
7 |
% |
Total Consumer |
$ |
7,754 |
|
|
$ |
6,752 |
|
|
$ |
6,330 |
|
|
15 |
% |
|
7 |
% |
In August 2024, we reorganized certain technology and customer success functions that support and benefit the overall platform and are managed at the corporate level rather than at the segment level. As a result, these costs are no longer included in segment operating income and are now included in other corporate expenses. For the twelve months ended July 31, 2024 and 2023, we reclassified $606 million and $509 million, respectively, from Consumer to other corporate expenses to conform to the current presentation.
Effective August 1, 2025, we combined our Consumer, Credit Karma, and ProTax businesses into a single Consumer segment in order to better serve the diverse financial needs of our customers as one consumer platform. Our chief operating decision maker allocates resources and assesses segment performance using regularly provided segment revenue and segment operating income information under this updated segment structure. To align results under this segment change, certain selling and marketing, product development, and general and administrative expenses for Credit Karma that were managed at the segment level are now managed at the platform level and are included in other corporate expenses rather than in segment
expenses. Additionally, certain data science and analytics teams that were managed at the platform level are now managed at the segment level. We have recast certain previously reported amounts to conform to these segment changes. For the twelve months ended July 31, 2025, 2024, and 2023, we reclassified expenses totaling $606 million, $585 million, and $581 million from Consumer to other corporate expenses, respectively, to conform to the current presentation.
Fiscal 2025 Compared with Fiscal 2024
Revenue for our Consumer segment increased $1.0 billion, or 15%, in fiscal 2025 compared with fiscal 2024 due to increases in Credit Karma revenue of $555 million and TurboTax revenue of $425 million. The increase in Credit Karma revenue is due to increases in revenue from our personal loan vertical of $221 million, our credit card vertical of $213 million, and our auto insurance vertical of $99 million. The increase in TurboTax revenue is due to growth in our higher-priced and additional TurboTax service offerings, such as TurboTax Live and our early tax refund offerings.
Consumer segment operating income increased $748 million, or 15%, in fiscal 2025 compared with fiscal 2024 due to the increase in revenue described above, partially offset by an increase in marketing expenses of $253 million.
Fiscal 2024 Compared with Fiscal 2023
Revenue for our Consumer segment increased $422 million, or 7%, in fiscal 2024 compared with fiscal 2023 due to increases in TurboTax revenue of $330 million and Credit Karma revenue of $54 million. The increase in TurboTax revenue is due to the interrelated factors of a shift in mix to our higher-priced service offerings, such as TurboTax Live, and higher effective prices. The increase in Credit Karma revenue is due to increases in revenue from our credit card vertical of $32 million and auto insurance vertical of $25 million, partially offset by a decrease in revenue from our home loan vertical of $6 million.
Consumer segment operating income increased $164 million, or 3%, in fiscal 2024 compared with fiscal 2023 due to the increase in revenue described above, partially offset by an increase in marketing expenses of $183 million, sales-related expenses of $30 million, and staffing expense of $19 million.
|
|
|
|
|
|
|
|
|
|
|
|
|
|
|
|
|
|
|
|
|
|
|
|
|
|
|
|
|
|
|
|
|
|
|
|
| Cost of Revenue |
|
|
|
|
|
|
|
|
|
|
|
|
|
|
|
|
|
|
|
|
|
|
|
| (Dollars in millions) |
Fiscal
2025 |
|
% of
Related
Revenue |
|
Fiscal
2024 |
|
% of
Related
Revenue |
|
Fiscal
2023 |
|
% of
Related
Revenue |
Cost of service revenue |
$ |
3,624 |
|
|
22 |
% |
|
$ |
3,250 |
|
|
23 |
% |
|
$ |
2,908 |
|
|
24 |
% |
Cost of product and other revenue |
68 |
|
|
3 |
% |
|
69 |
|
|
3 |
% |
|
72 |
|
|
4 |
% |
| Amortization of acquired technology |
156 |
|
|
N/A |
|
146 |
|
|
N/A |
|
163 |
|
|
N/A |
| Total cost of revenue |
$ |
3,848 |
|
|
20 |
% |
|
$ |
3,465 |
|
|
21 |
% |
|
$ |
3,143 |
|
|
22 |
% |
Our cost of revenue has three components: (1) cost of service revenue, which includes the direct costs associated with our online and service offerings, such as staffing costs for ongoing production support, customer support, and tax and bookkeeping experts that support our TurboTax Live and QuickBooks Live offerings, costs for data processing and storage capabilities from cloud providers, and costs related to credit score providers; (2) cost of product and other revenue, which includes the direct costs of manufacturing and shipping or electronically downloading our desktop software and financial supplies products; and (3) amortization of acquired technology, which represents the cost of amortizing developed technologies that we have obtained through acquisitions, over their useful lives.
Cost of service revenue as a percentage of service revenue was relatively consistent in fiscal 2025 compared to fiscal 2024.
Cost of product and other revenue as a percentage of product and other revenue was flat in fiscal 2025 compared with fiscal 2024. Costs of product and other revenue are expensed as incurred, and we do not defer any of these costs when product and other revenue is deferred.
|
|
|
|
|
|
|
|
|
|
|
|
|
|
|
|
|
|
|
|
|
|
|
|
|
|
|
|
|
|
|
|
|
|
|
|
| Operating Expenses |
|
|
|
|
|
|
|
|
|
|
|
|
|
|
|
|
|
|
|
|
|
|
|
| (Dollars in millions) |
Fiscal
2025 |
|
% of
Total
Net
Revenue |
|
Fiscal
2024 |
|
% of
Total
Net
Revenue |
|
Fiscal
2023 |
|
% of
Total
Net
Revenue |
| Selling and marketing |
$ |
5,035 |
|
|
27 |
% |
|
$ |
4,312 |
|
|
26 |
% |
|
$ |
3,762 |
|
|
26 |
% |
| Research and development |
2,928 |
|
|
15 |
% |
|
2,754 |
|
|
17 |
% |
|
2,539 |
|
|
18 |
% |
| General and administrative |
1,601 |
|
|
8 |
% |
|
1,418 |
|
|
9 |
% |
|
1,300 |
|
|
9 |
% |
| Amortization of other acquired intangible assets |
481 |
|
|
3 |
% |
|
483 |
|
|
3 |
% |
|
483 |
|
|
3 |
% |
Restructuring |
15 |
|
|
— |
% |
|
223 |
|
|
1 |
% |
|
— |
|
|
— |
% |
|
|
|
|
|
|
|
|
|
|
|
|
| Total operating expenses |
$ |
10,060 |
|
|
53 |
% |
|
$ |
9,190 |
|
|
56 |
% |
|
$ |
8,084 |
|
|
56 |
% |
Total operating expenses as a percentage of total net revenue decreased in fiscal 2025 compared to fiscal 2024. Total net revenue increased $2.5 billion, or 16%, and total operating expenses increased $870 million, or 9%. The increase in total operating expenses was due to increases of $410 million for marketing expenses, $300 million for staffing expenses, $161 million for outside services, and $52 million for sales-related expenses, partially offset by a $208 million decrease in restructuring charges. See Note 15 to the consolidated financial statements in Item 8 for more information regarding restructuring charges.
|
|
|
Non-Operating Income and Expenses |
Interest Expense
Interest expense of $247 million in fiscal 2025 consisted of interest on our senior unsecured notes, unsecured revolving credit facility, and commercial paper program. Interest expense of $242 million in fiscal 2024 consisted of interest on our senior unsecured notes and unsecured term loan.
Interest and Other Income, Net
|
|
|
|
|
|
|
|
|
|
|
|
|
|
|
|
|
|
| (In millions) |
Fiscal 2025 |
|
Fiscal 2024 |
|
Fiscal 2023 |
Interest income (1) |
$ |
175 |
|
|
$ |
147 |
|
|
$ |
106 |
|
Net gain on executive deferred compensation plan assets (2) |
24 |
|
|
24 |
|
|
12 |
|
|
|
|
|
|
|
Other (3) |
(41) |
|
|
(9) |
|
|
(22) |
|
| Total interest and other income, net |
$ |
158 |
|
|
$ |
162 |
|
|
$ |
96 |
|
(1) Interest income increased in fiscal 2025 compared to fiscal 2024 due to higher average investable balances.
(2) In accordance with authoritative guidance, we record gains and losses associated with executive deferred compensation plan assets in interest and other income, and gains and losses associated with the related liabilities in operating expenses. The total amounts recorded in operating expenses for each period are approximately equal to the total amounts recorded in interest and other income in those periods.
(3) During fiscal 2025, we recorded $51 million in net losses on long-term investments.
Income Taxes
Our effective tax rate for fiscal 2025 was approximately 20%. Excluding certain tax benefits primarily related to share-based compensation, our effective tax rate was approximately 24%. This rate differed from the federal statutory rate of 21% primarily due to state income taxes and non-deductible share-based compensation, which were partially offset by the benefit we received from the federal research and experimentation credit.
Our effective tax rate for fiscal 2024 was approximately 17%. Excluding certain tax benefits primarily related to share-based compensation, our effective tax rate was approximately 24%. This rate differed from the federal statutory rate of 21% primarily due to state income taxes and non-deductible share-based compensation, which were partially offset by the benefit we received from the federal research and experimentation credit. See Note 10 to the consolidated financial statements in Item 8 for more information about our effective tax rates.
At July 31, 2025, we had net deferred tax assets of $1.2 billion, which included a valuation allowance for California net deferred tax assets primarily related to state research and experimentation tax credit carryforwards. We have also provided a valuation allowance on other non-California state operating loss and foreign operating loss carryforwards. See “Critical Accounting Estimates” earlier in this Item 7 and Note 10 to the consolidated financial statements in Item 8 for more information.
On July 4, 2025, the U.S. federal government enacted the One Big Beautiful Bill Act (OBBBA), which includes significant tax changes, most notably the reinstatement of the immediate expensing of domestic research and developmental expenditures, effective in fiscal 2026. The deductibility of these expenditures is expected to significantly reduce our deferred tax assets and income tax payable for periods starting in fiscal 2026.
The OBBBA has multiple effective dates from fiscal 2025 through fiscal 2027. The provisions effective during fiscal 2025 did not have a significant impact on our fiscal 2025 consolidated financial statements. We are currently assessing all applicable provisions of the legislation and their impact on our consolidated financial statements for fiscal 2026 and beyond.
In 2021, the Organisation for Economic Co-operation and Development (OECD) announced Pillar Two Model Rules, which call for the taxation of large multinational corporations at a minimum rate of 15%. The currently enacted Pillar Two Model Rules did not have any impact on our provision for income taxes and are not expected to have any significant impact on future years’ provisions for income taxes. We continue to monitor developments and evaluate impacts, if any, of these provisions on our results of operations and cash flows for future years.
In the current global tax policy environment, the U.S. and other domestic and foreign governments continue to consider, and in some cases enact, changes in corporate tax laws. As changes occur, we account for finalized legislation in the period of enactment.
|
|
|
| ITEM 8 - FINANCIAL STATEMENTS AND SUPPLEMENTARY DATA |
1.INDEX TO CONSOLIDATED FINANCIAL STATEMENTS
The following financial statements are filed as part of this report:
2.INDEX TO FINANCIAL STATEMENT SCHEDULES
The following financial statement schedule is filed as part of this report and should be read in conjunction with the Consolidated Financial Statements:
|
|
|
|
|
|
|
|
|
| |
|
All other schedules not listed above have been omitted because they are inapplicable or are not required. |
REPORT OF INDEPENDENT REGISTERED PUBLIC ACCOUNTING FIRM
To the Stockholders and the Board of Directors of Intuit Inc.
Opinion on the Financial Statements
We have audited the accompanying consolidated balance sheets of Intuit Inc. (the Company) as of July 31, 2025 and 2024, the related consolidated statements of operations, comprehensive income, stockholders' equity and cash flows for each of the three years in the period ended July 31, 2025, and the related notes and financial statement schedule listed in the Index at Item 15(a) (collectively referred to as the “consolidated financial statements”). In our opinion, the consolidated financial statements present fairly, in all material respects, the financial position of the Company at July 31, 2025 and 2024, and the results of its operations and its cash flows for each of the three years in the period ended July 31, 2025, in conformity with U.S. generally accepted accounting principles.
We also have audited, in accordance with the standards of the Public Company Accounting Oversight Board (United States) (PCAOB), the Company's internal control over financial reporting as of July 31, 2025, based on criteria established in Internal Control—Integrated Framework issued by the Committee of Sponsoring Organizations of the Treadway Commission (2013 framework), and our report dated September 3, 2025 expressed an unqualified opinion thereon.
Basis for Opinion
These financial statements are the responsibility of the Company's management. Our responsibility is to express an opinion on the Company’s financial statements based on our audits. We are a public accounting firm registered with the PCAOB and are required to be independent with respect to the Company in accordance with the U.S. federal securities laws and the applicable rules and regulations of the Securities and Exchange Commission and the PCAOB.
We conducted our audits in accordance with the standards of the PCAOB. Those standards require that we plan and perform the audit to obtain reasonable assurance about whether the financial statements are free of material misstatement, whether due to error or fraud. Our audits included performing procedures to assess the risks of material misstatement of the financial statements, whether due to error or fraud, and performing procedures that respond to those risks. Such procedures included examining, on a test basis, evidence regarding the amounts and disclosures in the financial statements. Our audits also included evaluating the accounting principles used and significant estimates made by management, as well as evaluating the overall presentation of the financial statements. We believe that our audits provide a reasonable basis for our opinion.
Critical Audit Matter
The critical audit matter communicated below is a matter arising from the current period audit of the financial statements that was communicated or required to be communicated to the audit committee and that: (1) relates to accounts or disclosures that are material to the financial statements and (2) involved our especially challenging, subjective or complex judgments. The communication of the critical audit matter does not alter in any way our opinion on the consolidated financial statements, taken as a whole, and we are not, by communicating the critical audit matter below, providing a separate opinion on the critical audit matter or on the accounts or disclosures to which it relates.
|
|
|
|
|
|
|
|
|
|
|
Determination of Distinct Performance Obligations in Revenue Contracts |
|
|
|
| Description of the Matter |
|
As described in Note 1 to the consolidated financial statements, the Company enters into contracts with customers that often include promises to transfer multiple products and services. The Company has generally concluded that software licenses and services are separate performance obligations and revenues from software licenses and services are recognized as those products and services are provided.
Given the nature of the Company’s product and service offerings, there is complexity in determining whether software licenses and services are considered performance obligations that should be accounted for separately or together. Auditing the Company’s determination of distinct performance obligations related to its various product and service offerings involved complex auditor judgment. In particular, significant judgment was required when assessing whether the promised products and services are separate performance obligations or inputs to a combined performance obligation due to the evaluation of the interdependency or interrelation of the promised products and services within each contract.
|
|
|
|
|
|
|
|
|
|
How We Addressed the
Matter in Our Audit |
|
We obtained an understanding, evaluated the design and tested the operating effectiveness of internal controls over the Company’s processes, as they relate to the determination of distinct performance obligations. We also obtained an understanding of the Company’s product and service offerings and tested the application of the revenue recognition accounting model to determine distinct performance obligations.
Among other audit procedures, we evaluated whether the performance obligations identified by the Company were capable of being distinct and distinct in the context of the contract through review of contracts, discussions with management, observing product demonstrations and review of the Company’s website and other marketing materials. More specifically, we evaluated the Company’s determination of whether the contract was to deliver (1) multiple promised products or services that constitute separate performance obligations or (2) a single performance obligation that is comprised of the combined products or services. That is, considering the utility, integration, interrelation or interdependence of the products and services, we evaluated whether the multiple promised products and services that were delivered to the customer were outputs or inputs to a combined item.
|
/s/ Ernst & Young LLP
We have served as the Company’s auditor since 1990.
San Jose, California
September 3, 2025
Except for Notes 1, 6, 14, and 15, as to which the date is November 20, 2025.
|
|
|
|
|
|
|
|
|
|
|
|
|
|
|
|
|
|
|
INTUIT INC.
CONSOLIDATED STATEMENTS OF OPERATIONS
|
|
|
|
|
|
|
|
|
|
|
|
| |
Twelve Months Ended July 31, |
| (In millions, except per share amounts) |
2025 |
|
2024 |
|
2023 |
| Net revenue: |
|
|
|
|
|
Service |
$ |
16,400 |
|
|
$ |
13,861 |
|
|
$ |
12,317 |
|
Product and other |
2,431 |
|
|
2,424 |
|
|
2,051 |
|
| Total net revenue |
18,831 |
|
|
16,285 |
|
|
14,368 |
|
| Costs and expenses: |
|
|
|
|
|
| Cost of revenue: |
|
|
|
|
|
Cost of service revenue |
3,624 |
|
|
3,250 |
|
|
2,908 |
|
Cost of product and other revenue |
68 |
|
|
69 |
|
|
72 |
|
| Amortization of acquired technology |
156 |
|
|
146 |
|
|
163 |
|
| Selling and marketing |
5,035 |
|
|
4,312 |
|
|
3,762 |
|
| Research and development |
2,928 |
|
|
2,754 |
|
|
2,539 |
|
| General and administrative |
1,601 |
|
|
1,418 |
|
|
1,300 |
|
| Amortization of other acquired intangible assets |
481 |
|
|
483 |
|
|
483 |
|
Restructuring |
15 |
|
|
223 |
|
|
— |
|
|
|
|
|
|
|
| Total costs and expenses |
13,908 |
|
|
12,655 |
|
|
11,227 |
|
| Operating income |
4,923 |
|
|
3,630 |
|
|
3,141 |
|
| Interest expense |
(247) |
|
|
(242) |
|
|
(248) |
|
| Interest and other income, net |
158 |
|
|
162 |
|
|
96 |
|
| Income before income taxes |
4,834 |
|
|
3,550 |
|
|
2,989 |
|
| Income tax provision |
965 |
|
|
587 |
|
|
605 |
|
|
|
|
|
|
|
|
|
|
|
|
|
| Net income |
$ |
3,869 |
|
|
$ |
2,963 |
|
|
$ |
2,384 |
|
|
|
|
|
|
|
|
|
|
|
|
|
|
|
|
|
|
|
| Basic net income per share |
$ |
13.82 |
|
|
$ |
10.58 |
|
|
$ |
8.49 |
|
| Shares used in basic per share calculations |
280 |
|
|
280 |
|
|
281 |
|
|
|
|
|
|
|
|
|
|
|
|
|
|
|
|
|
|
|
| Diluted net income per share |
$ |
13.67 |
|
|
$ |
10.43 |
|
|
$ |
8.42 |
|
| Shares used in diluted per share calculations |
283 |
|
|
284 |
|
|
283 |
|
|
|
|
|
|
|
|
|
|
|
|
|
See accompanying notes.
|
|
|
|
|
|
|
|
|
|
|
|
|
|
|
|
|
|
|
INTUIT INC.
CONSOLIDATED STATEMENTS OF COMPREHENSIVE INCOME
|
|
|
|
|
|
|
|
|
|
|
|
| |
Twelve Months Ended July 31, |
| (In millions) |
2025 |
|
2024 |
|
2023 |
| Net income |
$ |
3,869 |
|
|
$ |
2,963 |
|
|
$ |
2,384 |
|
Other comprehensive income, net of income taxes: |
|
|
|
|
|
| Unrealized gain on available-for-sale debt securities |
1 |
|
|
7 |
|
|
— |
|
|
|
|
|
|
|
|
|
|
|
|
|
| Foreign currency translation gain (loss) |
3 |
|
|
(15) |
|
|
5 |
|
| Cumulative translation adjustment reclassified to net income |
— |
|
|
9 |
|
|
— |
|
| Total other comprehensive income, net |
4 |
|
|
1 |
|
|
5 |
|
| Comprehensive income |
$ |
3,873 |
|
|
$ |
2,964 |
|
|
$ |
2,389 |
|
See accompanying notes.
|
|
|
|
|
|
|
|
|
|
|
|
|
INTUIT INC.
CONSOLIDATED BALANCE SHEETS
|
|
|
|
|
|
|
|
| |
July 31, |
| (Dollars in millions, except par value; shares in thousands) |
2025 |
|
2024 |
| ASSETS |
|
|
|
| Current assets: |
|
|
|
| Cash and cash equivalents |
$ |
2,884 |
|
|
$ |
3,609 |
|
| Investments |
1,668 |
|
|
465 |
|
Accounts receivable, net of allowance for doubtful accounts of $5 and $5 |
530 |
|
|
457 |
|
Notes receivable held for investment, net |
1,403 |
|
|
779 |
|
Notes receivable held for sale |
— |
|
|
3 |
|
| Income taxes receivable |
50 |
|
|
78 |
|
| Prepaid expenses and other current assets |
496 |
|
|
366 |
|
| Current assets before funds receivable and amounts held for customers |
7,031 |
|
|
5,757 |
|
| Funds receivable and amounts held for customers |
7,076 |
|
|
3,921 |
|
| Total current assets |
14,107 |
|
|
9,678 |
|
| Long-term investments |
94 |
|
|
131 |
|
| Property and equipment, net |
961 |
|
|
1,009 |
|
| Operating lease right-of-use assets |
541 |
|
|
411 |
|
| Goodwill |
13,980 |
|
|
13,844 |
|
| Acquired intangible assets, net |
5,302 |
|
|
5,820 |
|
| Long-term deferred income tax assets |
1,222 |
|
|
698 |
|
| Other assets |
751 |
|
|
541 |
|
| Total assets |
$ |
36,958 |
|
|
$ |
32,132 |
|
| LIABILITIES AND STOCKHOLDERS’ EQUITY |
|
|
|
| Current liabilities: |
|
|
|
| Short-term debt |
$ |
— |
|
|
$ |
499 |
|
| Accounts payable |
792 |
|
|
721 |
|
| Accrued compensation and related liabilities |
858 |
|
|
921 |
|
| Deferred revenue |
1,019 |
|
|
872 |
|
|
|
|
|
| Other current liabilities |
625 |
|
|
557 |
|
| Current liabilities before funds payable and amounts due to customers |
3,294 |
|
|
3,570 |
|
| Funds payable and amounts due to customers |
7,076 |
|
|
3,921 |
|
| Total current liabilities |
10,370 |
|
|
7,491 |
|
| Long-term debt |
5,973 |
|
|
5,539 |
|
|
|
|
|
| Operating lease liabilities |
597 |
|
|
458 |
|
| Other long-term obligations |
308 |
|
|
208 |
|
| Total liabilities |
17,248 |
|
|
13,696 |
|
| Commitments and contingencies |
|
|
|
| Stockholders’ equity: |
|
|
|
|
Preferred stock, $0.01 par value
Authorized - 1,345 shares total; 145 shares designated Series A;
250 shares designated Series B Junior Participating
Issued and outstanding - None
|
— |
|
|
— |
|
|
Common stock, $0.01 par value
Authorized - 750,000 shares
Outstanding - 279,129 shares at July 31, 2025 and 280,268 shares at July 31, 2024
|
3 |
|
|
3 |
|
| Additional paid-in capital |
21,632 |
|
|
20,248 |
|
| Treasury stock, at cost |
(21,543) |
|
|
(18,750) |
|
| Accumulated other comprehensive loss |
(50) |
|
|
(54) |
|
| Retained earnings |
19,668 |
|
|
16,989 |
|
| Total stockholders’ equity |
19,710 |
|
|
18,436 |
|
| Total liabilities and stockholders’ equity |
$ |
36,958 |
|
|
$ |
32,132 |
|
See accompanying notes.
|
|
|
|
|
|
|
|
|
|
|
|
|
|
|
|
|
|
|
|
|
|
|
|
|
INTUIT INC.
CONSOLIDATED STATEMENTS OF STOCKHOLDERS’ EQUITY
|
|
|
|
|
|
|
|
|
| |
Common Stock |
Additional
Paid-In Capital |
Treasury Stock |
Accumulated Other Comprehensive Loss |
Retained Earnings |
Total
Stockholders’ Equity |
|
(Dollars in millions, except per share amounts;
shares in thousands)
|
Shares |
Amount |
| Balance at July 31, 2022 |
281,932 |
|
$ |
3 |
|
$ |
17,722 |
|
$ |
(14,805) |
|
$ |
(60) |
|
$ |
13,581 |
|
$ |
16,441 |
|
| Comprehensive income |
— |
|
— |
|
— |
|
— |
|
5 |
|
2,384 |
|
2,389 |
|
| Issuance of stock under employee stock plans, net of shares withheld for employee taxes |
3,189 |
|
— |
|
(408) |
|
— |
|
— |
|
— |
|
(408) |
|
| Stock repurchases under stock repurchase programs |
(4,700) |
|
— |
|
— |
|
(1,967) |
|
— |
|
— |
|
(1,967) |
|
Dividends and dividend rights declared ($3.12 per share) |
— |
|
— |
|
— |
|
— |
|
— |
|
(898) |
|
(898) |
|
|
|
|
|
|
|
|
|
| Share-based compensation expense |
— |
|
— |
|
1,712 |
|
— |
|
— |
|
— |
|
1,712 |
|
|
|
|
|
|
|
|
|
| Balance at July 31, 2023 |
280,421 |
|
3 |
|
19,026 |
|
(16,772) |
|
(55) |
|
15,067 |
|
17,269 |
|
| Comprehensive income |
— |
|
— |
|
— |
|
— |
|
1 |
|
2,963 |
|
2,964 |
|
| Issuance of stock under employee stock plans, net of shares withheld for employee taxes |
3,274 |
|
— |
|
(718) |
|
— |
|
— |
|
— |
|
(718) |
|
Stock repurchases under stock repurchase programs |
(3,427) |
|
— |
|
— |
|
(1,978) |
|
— |
|
— |
|
(1,978) |
|
Dividends and dividend rights declared ($3.60 per share) |
— |
|
— |
|
— |
|
— |
|
— |
|
(1,041) |
|
(1,041) |
|
|
|
|
|
|
|
|
|
| Share-based compensation expense |
— |
|
— |
|
1,940 |
|
— |
|
— |
|
— |
|
1,940 |
|
|
|
|
|
|
|
|
|
| Balance at July 31, 2024 |
280,268 |
|
3 |
|
20,248 |
|
(18,750) |
|
(54) |
|
16,989 |
|
18,436 |
|
| Comprehensive income |
— |
|
— |
|
— |
|
— |
|
4 |
|
3,869 |
|
3,873 |
|
| Issuance of stock under employee stock plans, net of shares withheld for employee taxes |
3,180 |
|
— |
|
(584) |
|
— |
|
— |
|
— |
|
(584) |
|
| Stock repurchases under stock repurchase programs |
(4,319) |
|
— |
|
— |
|
(2,793) |
|
— |
|
— |
|
(2,793) |
|
Dividends and dividend rights declared ($4.16 per share) |
— |
|
— |
|
— |
|
— |
|
— |
|
(1,190) |
|
(1,190) |
|
|
|
|
|
|
|
|
|
| Share-based compensation expense |
— |
|
— |
|
1,968 |
|
— |
|
— |
|
— |
|
1,968 |
|
|
|
|
|
|
|
|
|
| Balance at July 31, 2025 |
279,129 |
|
$ |
3 |
|
$ |
21,632 |
|
$ |
(21,543) |
|
$ |
(50) |
|
$ |
19,668 |
|
$ |
19,710 |
|
See accompanying notes.
|
|
|
|
|
|
|
|
|
|
|
|
|
|
|
|
|
|
|
INTUIT INC.
CONSOLIDATED STATEMENTS OF CASH FLOWS
|
|
|
|
|
|
|
|
|
|
|
|
| |
Twelve Months Ended July 31, |
| (In millions) |
2025 |
|
2024 |
|
2023 |
| Cash flows from operating activities: |
|
|
|
|
|
| Net income |
$ |
3,869 |
|
|
$ |
2,963 |
|
|
$ |
2,384 |
|
| Adjustments to reconcile net income to net cash provided by operating activities: |
|
|
|
|
|
| Depreciation |
172 |
|
|
159 |
|
|
160 |
|
| Amortization of acquired intangible assets |
637 |
|
|
630 |
|
|
646 |
|
|
|
|
|
|
|
| Non-cash operating lease cost |
75 |
|
|
81 |
|
|
90 |
|
| Share-based compensation expense |
1,968 |
|
|
1,940 |
|
|
1,712 |
|
|
|
|
|
|
|
|
|
|
|
|
|
| Deferred income taxes |
(435) |
|
|
(554) |
|
|
(628) |
|
| Other |
127 |
|
|
92 |
|
|
81 |
|
| Total adjustments |
2,544 |
|
|
2,348 |
|
|
2,061 |
|
Originations and purchases of notes receivable held for sale |
— |
|
|
(96) |
|
|
— |
|
Sales and principal repayments of notes receivable held for sale |
— |
|
|
98 |
|
|
— |
|
| Changes in operating assets and liabilities: |
|
|
|
|
|
| Accounts receivable |
(71) |
|
|
(52) |
|
|
42 |
|
| Income taxes receivable |
27 |
|
|
(48) |
|
|
64 |
|
| Prepaid expenses and other assets |
(283) |
|
|
(30) |
|
|
(75) |
|
| Accounts payable |
73 |
|
|
133 |
|
|
(97) |
|
| Accrued compensation and related liabilities |
(64) |
|
|
257 |
|
|
88 |
|
| Deferred revenue |
142 |
|
|
(49) |
|
|
111 |
|
| Operating lease liabilities |
(77) |
|
|
(71) |
|
|
(81) |
|
|
|
|
|
|
|
| Other liabilities |
47 |
|
|
(569) |
|
|
549 |
|
| Total changes in operating assets and liabilities |
(206) |
|
|
(429) |
|
|
601 |
|
| Net cash provided by operating activities |
6,207 |
|
|
4,884 |
|
|
5,046 |
|
| Cash flows from investing activities: |
|
|
|
|
|
| Purchases of corporate and customer fund investments |
(2,363) |
|
|
(780) |
|
|
(1,015) |
|
| Sales of corporate and customer fund investments |
320 |
|
|
526 |
|
|
240 |
|
| Maturities of corporate and customer fund investments |
864 |
|
|
676 |
|
|
449 |
|
| Purchases of property and equipment |
(84) |
|
|
(191) |
|
|
(210) |
|
| Capitalization of internal use software |
(40) |
|
|
(59) |
|
|
(50) |
|
| Acquisitions of businesses, net of cash acquired |
(184) |
|
|
(83) |
|
|
(33) |
|
|
|
|
|
|
|
Originations and purchases of notes receivable held for investment |
(3,992) |
|
|
(2,538) |
|
|
(1,983) |
|
Sales of notes receivable originally classified as held for investment |
562 |
|
|
234 |
|
|
— |
|
Principal repayments of notes receivable held for investment |
2,706 |
|
|
2,068 |
|
|
1,727 |
|
| Other |
(107) |
|
|
(80) |
|
|
(47) |
|
| Net cash used in investing activities |
(2,318) |
|
|
(227) |
|
|
(922) |
|
| Cash flows from financing activities: |
|
|
|
|
|
Proceeds from issuance of long-term debt, net of discount and issuance costs |
— |
|
|
3,956 |
|
|
— |
|
| Repayments of debt |
(500) |
|
|
(4,200) |
|
|
(1,009) |
|
| Proceeds from borrowings under unsecured revolving credit facility |
— |
|
|
100 |
|
|
— |
|
| Repayments on borrowings under unsecured revolving credit facility |
— |
|
|
(100) |
|
|
— |
|
| Proceeds from borrowings under secured revolving credit facilities |
429 |
|
|
180 |
|
|
222 |
|
| Repayments on borrowings under secured revolving credit facilities |
— |
|
|
(25) |
|
|
(23) |
|
| Proceeds from issuance of stock under employee stock plans |
398 |
|
|
282 |
|
|
228 |
|
| Payments for employee taxes withheld upon vesting of restricted stock units |
(982) |
|
|
(1,002) |
|
|
(633) |
|
|
|
|
|
|
|
|
|
|
|
|
|
|
|
|
|
|
|
|
INTUIT INC.
CONSOLIDATED STATEMENTS OF CASH FLOWS
|
|
|
|
|
|
|
|
|
|
|
|
| Cash paid for purchases of treasury stock |
(2,772) |
|
|
(1,988) |
|
|
(1,967) |
|
| Dividends and dividend rights paid |
(1,189) |
|
|
(1,034) |
|
|
(889) |
|
| Net change in funds receivable and funds payable and amounts due to customers |
3,107 |
|
|
3,436 |
|
|
(197) |
|
| Other |
(1) |
|
|
(2) |
|
|
(1) |
|
| Net cash used in financing activities |
(1,510) |
|
|
(397) |
|
|
(4,269) |
|
| Effect of exchange rates on cash, cash equivalents, restricted cash, and restricted cash equivalents |
3 |
|
|
(13) |
|
|
— |
|
| Net increase (decrease) in cash, cash equivalents, restricted cash, and restricted cash equivalents |
2,382 |
|
|
4,247 |
|
|
(145) |
|
| Cash, cash equivalents, restricted cash, and restricted cash equivalents at beginning of period |
7,099 |
|
|
2,852 |
|
|
2,997 |
|
| Cash, cash equivalents, restricted cash, and restricted cash equivalents at end of period |
$ |
9,481 |
|
|
$ |
7,099 |
|
|
$ |
2,852 |
|
|
|
|
|
|
|
| Reconciliation of cash, cash equivalents, restricted cash, and restricted cash equivalents reported within the consolidated balance sheets to the total amounts reported on the consolidated statements of cash flows |
|
|
|
|
|
| Cash and cash equivalents |
$ |
2,884 |
|
|
$ |
3,609 |
|
|
$ |
2,848 |
|
| Restricted cash and restricted cash equivalents included in funds receivable and amounts held for customers |
6,597 |
|
|
3,490 |
|
|
4 |
|
| Total cash, cash equivalents, restricted cash, and restricted cash equivalents at end of period |
$ |
9,481 |
|
|
$ |
7,099 |
|
|
$ |
2,852 |
|
|
|
|
|
|
|
| Supplemental disclosure of cash flow information: |
|
|
|
|
|
| Interest paid |
$ |
284 |
|
|
$ |
200 |
|
|
$ |
272 |
|
Income taxes paid, net |
$ |
1,408 |
|
|
$ |
1,881 |
|
|
$ |
484 |
|
|
|
|
|
|
|
| Supplemental schedule of non-cash investing activities: |
|
|
|
|
|
|
|
|
|
|
|
Transfers of notes receivable originated or purchased as held for investment to held for sale |
$ |
546 |
|
|
$ |
231 |
|
|
$ |
— |
|
See accompanying notes.
|
|
|
|
INTUIT INC.
NOTES TO CONSOLIDATED FINANCIAL STATEMENTS
|
|
|
|
| 1. Description of Business and Summary of Significant Accounting Policies |
Intuit Inc. (Intuit, we, us, or our) is a global financial technology platform with a mission to power prosperity around the world. We help consumers do their taxes with ease and confidence and improve their financial success, from credit building to wealth building, with tax and personal financial management products and services. We help small and mid-market businesses grow and run their business end-to-end, from lead to cash. This includes financial management - including payments and capital - compliance, human capital management, and marketing products and services. For accounting professionals, we provide professional tax and financial management products and services.
We do this through our platform that powers TurboTax, Credit Karma, QuickBooks, Mailchimp, and Intuit Enterprise Suite. Lacerte, ProSeries, and ProConnect Tax Online are our leading tax preparation offerings for professional accountants. Incorporated in 1984 and headquartered in Mountain View, California, we sell our products and services primarily in the United States (U.S.).
These consolidated financial statements include the financial statements of Intuit and its wholly-owned subsidiaries. We have eliminated all intercompany balances and transactions in consolidation. We have reclassified certain amounts previously reported in our financial statements to conform to the current presentation.
On August 1, 2024, we renamed our Small Business & Self-Employed segment as the Global Business Solutions segment. This new name better aligns with the global reach of the Mailchimp and QuickBooks platform, our focus on serving both small and mid-market businesses, and our vision to become the all-in-one platform that customers use to grow and run their business. See Note 14, “Segment Information,” for more information.
On August 1, 2024, we reorganized certain technology and customer success functions in our Global Business Solutions and Consumer segments that support and benefit our overall platform and are managed at the corporate level rather than at the segment level. As a result of these reorganizations, costs associated with these functions are no longer included in segment operating income and are now included in other corporate expenses. For the twelve months ended July 31, 2024 and 2023, we reclassified $1.4 billion and $1.3 billion from Global Business Solutions and $606 million and $509 million from Consumer to other corporate expenses, respectively. See Note 14, “Segment Information,” for more information.
Effective August 1, 2025, we combined our Consumer, Credit Karma, and ProTax businesses into a single Consumer segment in order to better serve the diverse financial needs of our customers as one consumer platform. Our chief operating decision maker (CODM) allocates resources and assesses segment performance using regularly provided segment revenue and segment operating income information under this updated segment structure. To align results under this segment change, certain selling and marketing, product development, and general and administrative expenses for Credit Karma that were managed at the segment level are now managed at the platform level and are included in other corporate expenses rather than in segment expenses. Also on August 1, 2025, we reorganized certain marketing, communications, and customer success functions in our Global Business Solutions segment that support and benefit our overall platform and are managed at that level rather than at the segment level. Additionally, certain data science and analytics teams that were managed at the platform level are now managed at the segment level. We have recast certain previously reported amounts to conform to these segment changes. For the twelve months ended July 31, 2025, 2024, and 2023, we reclassified expenses totaling $9 million, $16 million, and $4 million from Global Business Solutions and $606 million, $585 million, and $581 million from Consumer to other corporate expenses, respectively, to conform to the current presentation. The segment changes primarily impacted Note 6, “Goodwill and Acquired Intangible Assets,” Note 14, “Segment Information,” and Note 15, “Restructuring.” The recast of prior period information had no impact on our consolidated balance sheets, consolidated income statements, or consolidated cash flow statements.
Within our Consumer segment, our TurboTax and ProTax offerings have a significant and distinct seasonal pattern as sales and revenue from our income tax preparation products and services are typically heavily concentrated in the period from November through April. This seasonal pattern typically results in higher net revenues during our second and third quarters ending January 31 and April 30, respectively.
In preparing our consolidated financial statements in accordance with U.S. generally accepted accounting principles (GAAP), we make certain judgments, estimates, and assumptions that affect the amounts reported in our financial statements and the
disclosures made in the accompanying notes. For example, we use judgments and estimates in determining how revenue should be recognized. These judgments and estimates include identifying performance obligations, determining if the performance obligations are distinct, determining the standalone sales price (SSP) and timing of revenue recognition for each distinct performance obligation, and estimating variable consideration to be included in the transaction price. We use estimates in determining the collectibility of accounts receivable and notes receivable held for investment, the appropriate levels of various accruals including accruals for litigation contingencies, the discount rate used to calculate lease liabilities, the amount of our worldwide tax provision, the realizability of deferred tax assets, the credit losses of available-for-sale debt securities, the fair value of assets acquired and liabilities assumed for business combinations, and the fair value of notes receivable held for sale. We also use estimates in determining the remaining economic lives and fair values of acquired intangible assets, property and equipment, and other long-lived assets. In addition, we use assumptions to estimate the fair value of reporting units and share-based compensation. Despite our intention to establish accurate estimates and use reasonable assumptions, actual results may differ from our estimates.
We derive our revenue primarily from the sale of online services such as tax, accounting, payroll, merchant payment processing services, delivery of qualified links, marketing automation, live expert advice, financing for small and mid-market businesses, and desktop software products, desktop software subscriptions, and financial supplies. We enter into contracts with customers that include promises to transfer various products and services, which are generally capable of being distinct and accounted for as separate performance obligations. Revenue is recognized when the promised goods or services are transferred to customers, in an amount that reflects the consideration allocated to the respective performance obligation.
Nature of Products and Services
Online Offerings
Our online offerings include TurboTax Online and TurboTax Live, ProConnect Tax Online, QuickBooks Online, Intuit Enterprise Suite, online payroll, and merchant payment processing services for small and mid-market businesses who use our online offerings. Our Mailchimp offerings include marketing automation.
These online offerings provide customers with the right to use the hosted software over the contract period without taking possession of the software and are billed on either a subscription or consumption basis. Revenue related to our online offerings that are billed on a subscription basis is recognized ratably over the contract period. Revenue related to online offerings that are billed on a consumption basis is recognized when the customer consumes the related service.
Credit Karma revenue is primarily comprised of revenue from the delivery of qualified links that result in completed actions, or cost-per-action transactions. Credit Karma also generates revenue from cost-per-click and cost-per-lead transactions.
Cost-per-action revenue is earned based on a pre-determined fee for approved actions, such as when credit cards are issued or when personal loans and other loans to businesses are funded. Revenue is recognized when a lead is generated that results in one of these approved actions.
Cost-per-click and cost-per-lead revenue is primarily related to mortgage and insurance businesses. Cost-per-click revenue is earned as users click on our customers' advertisements and is recognized based on the number of clicks recorded each month. Cost-per-lead revenue is earned via customer advertisements that allow the generation of leads from consumers interested in the advertised products and is recognized at the time a consumer request or lead is delivered to the customer.
Desktop Offerings
Our desktop offerings consist of our subscription-based QuickBooks Desktop products, our consumer and professional tax desktop products, which include TurboTax, Lacerte and ProSeries, our desktop payroll products, and merchant payment processing services for small and mid-market businesses who use our desktop offerings.
Our QuickBooks Desktop software subscriptions include a term software license, version protection updates, when-and-if-available product upgrades and enhancements, support, and various connected services. We recognize revenue for the software license and version protection updates at the time they are delivered and recognize revenue for when-and-if-available product upgrades and enhancements, support, and connected services over the subscription term as services are provided. For subscriptions sold in fiscal 2024, periodic delivery of version protection updates occurred through the first quarter of fiscal 2025, and the associated revenue was recognized upon delivery as noted above. Beginning in the second quarter of fiscal 2025, product upgrades and enhancements are delivered on a when-and-if-available basis, and the associated revenue is recognized on a straight-line basis over the term during which those product upgrades and enhancements are provided. Prior to fiscal 2025, we determined that the enhancements included in our QuickBooks Desktop software subscriptions were not material within the context of the contract.
Our consumer and professional tax desktop software products include an on-premise tax software license, related tax form updates, electronic filing service, and connected services. We recognize revenue for the software license and related tax form updates, as one performance obligation, over the period the forms and updates are delivered. We recognize revenue for our electronic filings service and connected services as services are provided.
We also sell some of our consumer tax desktop software products in non-consignment and consignment arrangements to certain retailers. For these retailers, we begin recognizing revenue when control has transferred to the retailer for non-consignment arrangements or to the customer for consignment arrangements.
Our desktop payroll products are sold as software subscriptions and include a term software license with a stand-ready obligation to maintain compliance with current payroll tax laws, support, and connected services. The term software license and stand-ready obligation to maintain compliance with current payroll tax laws is considered one performance obligation. As a result, revenue is recognized ratably over the subscription term as services are provided.
We offer merchant payment processing services as a separately paid connected service for our QuickBooks Desktop software subscriptions, and revenue is recognized as services are provided to the customers.
Other Solutions
Revenue from the sale of our financial supplies, such as printed check stock, is recognized when control is transferred to the customer, which is generally when the products are shipped.
Interest revenue is earned on term loans originated or purchased and held for investment in accordance with the specified period of time and defined interest rate noted in the term loan contract and is recorded net of amortized deferred origination fees and costs, and term loan discounts. We recognize a gain or loss on the sale of term loans sold to third parties by calculating the difference between the proceeds received and the carrying value of the term loans sold. Interest revenue and gains on sales of term loans were not material for all periods presented.
We also have revenue-sharing and royalty arrangements with third-party partners and recognize this revenue as earned based upon reporting provided to us by our partners. In instances where we do not have reporting from our partners, we estimate revenue based on information available to us at the time. Adjustments to our estimates based on actual results have not been material to our consolidated financial statements for any period presented.
Types of Revenue
Service revenue includes revenue from: our online offerings discussed above; our Credit Karma offerings; support, electronic filing services, when-and-if-available product upgrades and enhancements, and connected services included with our desktop offerings; merchant payment processing services; certain revenue-sharing and royalty arrangements; and interest on notes receivable.
Product and other revenue includes revenue from: QuickBooks Desktop software licenses and version protection updates; consumer and professional tax desktop licenses and the related tax form updates; desktop payroll licenses and related updates; financial supplies; certain revenue-sharing and royalty arrangements; and interest on amounts held for customers.
We record revenue net of sales tax obligations. For payroll services, we generally require customers to remit payroll tax funds to us in advance of the payroll date via electronic funds transfer. Revenue for electronic payment processing services that we provide to merchants is recorded net of interchange fees charged by credit card associations. We hold customer cash as part of delivering payroll and payment services, and we include in total net revenue the interest earned on these funds from the time they are collected until the time that we remit them to outside parties or merchants.
Judgments and Estimates
We use a five-step process in determining how revenue is recognized, which requires judgment and estimates. These judgments and estimates include identifying performance obligations in the contract, determining whether the performance obligations are distinct, determining the SSP for each distinct performance obligation, determining the timing of revenue recognition for distinct performance obligations, and estimating the amount of variable consideration to include in the transaction price. Our contracts with customers often include promises to transfer multiple products and services generally capable of being distinct performance obligations. SSPs for distinct performance obligations are based on directly observable pricing, when applicable. In instances where the SSP is not directly observable, such as when we do not sell the product or service separately, we determine the SSP using information that may include market conditions and other observable inputs.
The functionality of the software licenses included in our consumer and professional tax and payroll desktop offerings is dependent on the related enhancements and updates included in these offerings. Judgment is required to determine whether the software license is considered distinct and accounted for separately, or not distinct and accounted for together with the related updates and recognized over time.
Our consumer and professional tax desktop products include an on-premise tax software license and related tax form updates that are recognized as the forms and updates are delivered. We measure progress toward complete satisfaction of the software license and related tax form updates using an output method based on the timing of when the tax forms are delivered.
We generally provide refunds to customers for product returns and subscription cancellations. We also provide promotional discounts and incentive rebates on retail and distribution sales. These refunds, discounts, and incentive rebates are accounted for as variable consideration when estimating the amount of revenue to recognize. Refunds are estimated based on historical
experience and current business and economic indicators and are updated at the end of each reporting period as additional information becomes available to the extent that it is probable that a significant reversal of any incremental revenue will not occur. Discounts and incentive rebates are estimated based on distributors' and retailers' performance against the terms and conditions of the rebate programs.
Deferred Revenue
We record deferred revenue when we have entered into a contract with a customer and cash payments are received or due prior to transfer of control or satisfaction of the related performance obligation. Our deferred revenue primarily relates to our subscription offerings. During the twelve months ended July 31, 2025, we recognized revenue of $871 million that was included in deferred revenue at July 31, 2024. During the twelve months ended July 31, 2024, we recognized revenue of $920 million that was included in deferred revenue at July 31, 2023.
Our performance obligations are generally satisfied within 12 months of the initial contract date. As of July 31, 2025 and 2024, the deferred revenue balance related to performance obligations that will be satisfied after 12 months was $4 million and $4 million, respectively, and is included in other long-term obligations on our consolidated balance sheets.
Assets Recognized from the Costs to Obtain a Contract with a Customer
Our sales commissions are considered incremental costs of obtaining the contract with a customer. Sales commissions for subscription offerings where we expect the benefit of those costs to continue longer than one year are capitalized and amortized ratably over the period of benefit, which ranges from three to four years. As of July 31, 2025 and 2024, total capitalized costs to obtain a contract were $122 million and $94 million, respectively, and are included in prepaid expenses and other current assets and other assets on our consolidated balance sheets.
We apply a practical expedient to expense costs incurred to obtain a contract with a customer when the period of benefit is less than one year. These costs primarily include internal and external sales commissions for our consumer and professional tax offerings.
We record the amounts we charge our customers for the shipping and handling of our software products as product and other revenue, and we record the related costs as cost of product and other revenue in our consolidated statements of operations.
|
|
|
Customer Service and Technical Support |
We include the costs of customer service and technical support associated with our online or hosted offerings in cost of service revenue in our consolidated statements of operations. We also include the costs of providing technical support for our desktop offerings in cost of service revenue. We include the costs of customer service related to desktop offerings in selling and marketing expense in our consolidated statements of operations. Customer service and technical support costs include costs associated with performing order processing, answering customer inquiries by telephone and through websites, email, and other electronic means, and providing technical support assistance to customers. We expense the cost of providing this support as incurred.
|
|
|
Software Development Costs |
We expense software development costs as we incur them until technological feasibility has been established, at which time those costs are capitalized until the product is available for general release to customers. To date, our software has been available for general release concurrent with the establishment of technological feasibility and, accordingly, we have not capitalized any development costs. Costs we incur to enhance our existing products or after the general release of the service using the product are expensed in the period they are incurred and included in research and development expense in our consolidated statements of operations.
We capitalize costs related to the development of hosted services that we provide to our customers and internal use of enterprise-level business and finance software in support of our operational needs. Costs incurred in the application development phase are capitalized and amortized on a straight-line basis over their useful lives, which are generally three to six years. Costs related to planning and other preliminary project activities and to post-implementation activities are expensed as incurred. We test these assets for impairment whenever events or changes in circumstances occur that could impact their recoverability.
We expense all advertising costs as we incur them to selling and marketing expense in our consolidated statements of operations. We recorded advertising expense of approximately $2.1 billion for the twelve months ended July 31, 2025, $1.7 billion for the twelve months ended July 31, 2024, and $1.5 billion for the twelve months ended July 31, 2023.
Our leases are primarily operating leases for office facilities. We determine if an arrangement is a lease and classify it as either a finance or operating lease at lease inception. Operating leases are included in operating lease right-of-use (ROU) assets, other current liabilities, and operating lease liabilities on our consolidated balance sheets.
Operating lease liabilities are recognized at the lease commencement date based on the present value of the future minimum lease payments over the lease term. Our leases generally do not have a readily determinable implicit rate, therefore we use our incremental borrowing rate at the commencement date in determining the present value of future payments. Our incremental borrowing rate is determined based on a yield curve derived from publicly traded bond offerings for companies with similar credit ratings to ours. Our lease terms may include options to purchase, extend, or terminate the lease when it is reasonably certain that we will exercise that option. We account for the lease and non-lease components as a single lease component.
We measure ROU assets based on the corresponding lease liabilities adjusted for any initial direct costs and prepaid lease payments made to the lessor before or at the commencement date, net of lease incentives. Lease expense for minimum lease payments is recognized on a straight-line basis over the lease term. Variable lease payments are not included in the calculation of the ROU asset and lease liability and are recognized as lease expense is incurred. Our variable lease payments generally relate to amounts paid to lessors for common area maintenance under our real estate leases.
Our subleases generally do not relieve us of our primary obligations under the corresponding head lease. As a result, we account for the head lease based on the original assessment at inception. We determine if the sublease arrangement is either a sales-type, direct financing, or operating lease at inception. If the total remaining lease cost on the head lease for the term of the sublease is greater than the anticipated sublease income, the ROU asset is assessed for impairment. Our subleases are generally operating leases, and we recognize sublease income on a straight-line basis over the sublease term.
|
|
|
Capitalization of Interest Expense |
We capitalize interest on capital projects, including facilities build-out projects and internal use computer software projects. Capitalization commences with the first expenditure for the project and continues until the project is substantially complete and ready for its intended use. We amortize capitalized interest to depreciation expense using the straight-line method over the same lives as the related assets. Capitalized interest was not material for any period presented.
The functional currencies of our international operating subsidiaries are generally the local currencies. We translate the assets and liabilities of our foreign subsidiaries at the exchange rates in effect on the balance sheet date. We translate the revenue, costs, and expenses of our foreign subsidiaries at the average rates of exchange in effect during the period. We include translation gains and losses in the stockholders’ equity section of our consolidated balance sheets. We include net gains and losses resulting from foreign exchange transactions in interest and other income or expense in our consolidated statements of operations. Translation gains and losses and transaction gains and losses were not material for any period presented.
We estimate our income taxes based on the various jurisdictions where we conduct business. Significant judgment is required in determining our worldwide income tax provision. We estimate our current tax liability and assess temporary differences that result from differing treatments of certain items for tax and accounting purposes. These differences result in deferred tax assets and liabilities, which we show on our consolidated balance sheets. We must then assess the likelihood that our deferred tax assets will be realized. To the extent we believe that realization is not likely, we establish a valuation allowance. When we establish a valuation allowance or increase this allowance in an accounting period, we record a corresponding income tax expense in our consolidated statements of operations.
We review the need for a valuation allowance to reflect uncertainties about whether we will be able to utilize some of our deferred tax assets before they expire. The valuation allowance analysis is based on our estimates of taxable income for the jurisdictions in which we operate and the periods over which our deferred tax assets will be realizable. While we have considered future taxable income in assessing the need for a valuation allowance for the periods presented, we could be required to record a valuation allowance to take into account additional deferred tax assets that we may be unable to realize. An increase in the valuation allowance would have an adverse impact, which could be material, on our income tax provision and net income in the period in which we record the increase.
We recognize and measure benefits for uncertain tax positions using a two-step approach. The first step is to evaluate the tax position taken or expected to be taken in a tax return by determining if the weight of available evidence indicates that it is more likely than not that the tax position will be sustained upon audit, including resolution of any related appeals or litigation processes. For tax positions that are more likely than not of being sustained upon audit, the second step is to measure the tax benefit as the largest amount that is more than 50% likely of being realized upon settlement. Significant judgment is required to evaluate uncertain tax positions. We evaluate our uncertain tax positions on a quarterly basis. Our evaluations are based upon a number of factors, including changes in facts or circumstances, changes in tax law, correspondence with tax authorities during the course of audits, and effective settlement of audit issues. Changes in the recognition or measurement of uncertain tax positions could result in material increases or decreases in our income tax expense in the period in which we make the change, which could have a material impact on our effective tax rate and operating results.
A description of our accounting policies associated with tax-related contingencies and valuation allowances assumed as part of a business combination is provided under “Business Combinations” below.
|
|
|
Computation of Net Income Per Share |
We compute basic net income per share using the weighted-average number of common shares outstanding during the period. We compute diluted net income per share using the weighted-average number of common shares and dilutive potential common shares outstanding during the period. Dilutive potential common shares consist of the shares issuable upon the exercise of stock options and upon the vesting of restricted stock units (RSUs) under the treasury stock method.
We include stock options with combined exercise prices and unrecognized compensation expense that are less than the average market price for our common stock, and RSUs with unrecognized compensation expense that is less than the average market price for our common stock, in the calculation of diluted net income per share. We exclude stock options with combined exercise prices and unrecognized compensation expense that are greater than the average market price for our common stock, and RSUs with unrecognized compensation expense that is greater than the average market price for our common stock, from the calculation of diluted net income per share because their effect is anti-dilutive. Under the treasury stock method, the amount that must be paid to exercise stock options and the amount of compensation expense for future service that we have not yet recognized for stock options and RSUs are assumed to be used to repurchase shares.
Dividend rights apply to all RSUs that we grant and are accumulated and paid when the underlying RSUs vest. Since the dividend rights are subject to the same vesting requirements as the underlying equity awards, they are considered a contingent transfer of value. Consequently, the RSUs are not considered participating securities, and we do not present them separately in earnings per share.
The following table presents the composition of shares used in the computation of basic and diluted net income per share for the periods indicated.
|
|
|
|
|
|
|
|
|
|
|
|
|
|
|
|
|
|
| |
Twelve Months Ended July 31, |
| (In millions, except per share amounts) |
2025 |
|
2024 |
|
2023 |
| Numerator: |
|
|
|
|
|
|
|
|
|
|
|
|
|
|
|
|
|
| Net income |
$ |
3,869 |
|
|
$ |
2,963 |
|
|
$ |
2,384 |
|
| Denominator: |
|
|
|
|
|
Shares used in basic per share calculations: |
|
|
|
|
|
| Weighted-average common shares outstanding |
280 |
|
|
280 |
|
|
281 |
|
Shares used in diluted per share calculations: |
|
|
|
|
|
| Weighted-average common shares outstanding |
280 |
|
|
280 |
|
|
281 |
|
Dilutive potential common equivalent shares from share-based awards |
3 |
|
|
4 |
|
|
2 |
|
| Dilutive weighted-average common shares outstanding |
283 |
|
|
284 |
|
|
283 |
|
|
|
|
|
|
|
| Basic and diluted net income per share: |
|
|
|
|
|
|
|
|
|
|
|
|
|
|
|
|
|
| Basic net income per share |
$ |
13.82 |
|
|
$ |
10.58 |
|
|
$ |
8.49 |
|
|
|
|
|
|
|
|
|
|
|
|
|
| Diluted net income per share |
$ |
13.67 |
|
|
$ |
10.43 |
|
|
$ |
8.42 |
|
|
|
|
|
|
|
| Shares excluded from diluted net income per share: |
|
|
|
|
|
Weighted-average share-based awards that have been excluded from dilutive common equivalent shares outstanding due to their anti-dilutive effect |
— |
|
|
1 |
|
|
1 |
|
|
|
|
Cash Equivalents and Investments |
We consider highly liquid investments with maturities of three months or less at the date of purchase to be cash equivalents. In all periods presented, cash equivalents consist primarily of money market funds. Investments consist primarily of investment-grade available-for-sale debt securities. Except for direct obligations of the U.S. government, securities issued by agencies of the U.S. government, and money market funds, we diversify our investments by limiting our holdings with any individual issuer.
We use the specific identification method to compute gains and losses on investments. We record unrealized gains and losses on investments, net of tax, in accumulated other comprehensive income (loss) in the stockholders’ equity section of our consolidated balance sheets and reflect unrealized gain and loss activity in other comprehensive income in our consolidated statements of comprehensive income. We generally classify available-for-sale debt securities as current assets based upon our ability and intent to use any and all of these securities as necessary to satisfy the significant short-term liquidity requirements that may arise from the highly seasonal nature of our businesses. Because of our significant business seasonality, stock repurchase programs, and acquisition opportunities, cash flow requirements may fluctuate dramatically from quarter to quarter and require us to use a significant amount of the investments we hold as available-for-sale.
|
|
|
Accounts Receivable and Allowances for Doubtful Accounts |
Accounts receivable are recorded at the invoiced amount and are not interest bearing. Third-party payment processor receivables due from financial institutions for the settlement of credit and debit card transactions for the sales of our products and services are included in accounts receivable. We maintain an allowance for doubtful accounts to reserve for credit losses. In determining the amount of the allowance, we consider our historical level of credit losses, current economic trends that might impact the level of future credit losses, customer-specific information, and reasonable and supportable forecasts of future economic conditions to inform adjustments to historical loss data. We make judgments about the creditworthiness of significant customers based on ongoing credit evaluations. When we determine that amounts are uncollectible, we write them off against the allowance.
|
|
|
Funds Receivable and Amounts Held for Customers and Funds Payable and Amounts Due to Customers |
Funds receivable and amounts held for customers represent funds receivable from third-party payment processors for customer transactions, funds in transit to our customers, and funds held on behalf of our customers that are invested in cash and cash equivalents and investment-grade available-for-sale debt securities, restricted for use solely for the purpose of satisfying amounts we owe on behalf of our customers. Funds payable and amounts due to customers consist of amounts we owe on behalf of our customers, such as direct deposit payroll funds and payroll taxes.
Our obligations with respect to funds we transmit on behalf of our customers are satisfied when the funds are settled in the customers’ accounts. These obligations, including funds in transit to our customers, are reflected in funds payable and amounts due to customers in the accompanying consolidated balance sheets.
Property and equipment is stated at the lower of cost or realizable value, net of accumulated depreciation. We calculate depreciation using the straight-line method over the estimated useful lives of the assets, which range from two to 30 years. We amortize leasehold improvements using the straight-line method over the lesser of their estimated useful lives or remaining lease terms. We review property and equipment for impairment whenever events or changes in circumstances indicate that the carrying amount of an asset may not be recoverable. We did not record any material property or equipment impairment charges during the twelve months ended July 31, 2025, 2024, or 2023.
The acquisition method of accounting for business combinations requires us to use significant estimates and assumptions, including fair value estimates, as of the business combination date and to refine those estimates as necessary during the measurement period, which is defined as the period, not to exceed one year, in which we may adjust the provisional amounts recognized for a business combination.
Under the acquisition method of accounting, we recognize separately from goodwill the identifiable assets acquired, the liabilities assumed, and any noncontrolling interests in an acquiree, generally at the acquisition date fair value. We measure goodwill as of the acquisition date as the excess of consideration transferred, which we also measure at fair value, over the net of the acquisition date amounts of the identifiable assets acquired and liabilities assumed. Costs that we incur to complete the business combination, such as investment banking, legal, and other professional fees, are not considered part of consideration, and we recognize such costs as general and administrative expenses as they are incurred. Under the acquisition method, we also account for acquired company restructuring activities that we initiate separately from the business combination.
Should the initial accounting for a business combination be incomplete by the end of a reporting period that falls within the measurement period, we report provisional amounts in our financial statements. During the measurement period, we adjust
the provisional amounts recognized at the acquisition date to reflect new information obtained about facts and circumstances that existed as of the acquisition date that, if known, would have affected the measurement of the amounts recognized as of that date, and we record those adjustments to our financial statements. We apply those measurement period adjustments that we determine to be material retrospectively to comparative information in our financial statements, including adjustments to depreciation and amortization expense.
Under the acquisition method of accounting for business combinations, if we identify changes to acquired deferred tax asset valuation allowances or liabilities related to uncertain tax positions during the measurement period, and they relate to new information obtained about facts and circumstances that existed as of the acquisition date, those changes are considered a measurement period adjustment and we record the offset to goodwill. We record all other changes to deferred tax asset valuation allowances and liabilities related to uncertain tax positions in current period income tax expense. This accounting applies to all of our acquisitions regardless of acquisition date.
|
|
|
Goodwill, Acquired Intangible Assets and Other Long-Lived Assets |
Goodwill
We record goodwill when the fair value of consideration transferred in a business combination exceeds the fair value of the identifiable assets acquired and liabilities assumed. Goodwill is not amortized, but is tested for impairment annually during our fourth fiscal quarter and whenever an event or change in circumstances indicates that the carrying value of the asset may not be recoverable.
In accordance with authoritative guidance, we define fair value as the price that would be received from the sale of an asset or paid to transfer a liability in the principal or most advantageous market for the asset or liability in an orderly transaction between market participants on the measurement date. We consider and use all valuation methods that are appropriate in estimating the fair value of our reporting units and generally use a weighted combination of income and market approaches. Under the income approach, we estimate the fair value of each reporting unit based on the present value of future cash flows. We use a number of assumptions in our discounted cash flow model, including market factors specific to the business, the amount and timing of estimated future cash flows to be generated by the business over an extended period of time, long-term growth rates for the business, and a rate of return that considers the relative risk of achieving the cash flows and the time value of money. Under the market approach, we estimate the fair value of each reporting unit based on market multiples of revenue, operating income, and earnings for comparable publicly traded companies engaged in similar businesses. If the estimated fair value of the reporting unit exceeds the carrying value of the net assets assigned to that unit, goodwill is not impaired.
If the carrying value of the net assets assigned to a reporting unit exceeds the estimated fair value of the unit, we would record an impairment loss equal to the difference. We recorded no goodwill impairment charges for the twelve months ended July 31, 2025, 2024, or 2023.
Acquired Intangible Assets and Other Long-Lived Assets
We generally record acquired intangible assets that have finite useful lives, such as purchased technology, in connection with business combinations. We amortize the cost of acquired intangible assets on a straight-line basis over their estimated useful lives, which range from three to 15 years. We review intangible assets that have finite useful lives and other long-lived assets whenever an event or change in circumstances indicates that the carrying value of the asset may not be recoverable. We estimate the recoverability of these assets by comparing the carrying amount of the asset to the future undiscounted cash flows that we expect the asset to generate. We estimate the fair value of assets that have finite useful lives based on the present value of future cash flows for those assets. If the carrying value of an asset with a finite life exceeds its estimated fair value, we would record an impairment loss equal to the difference. Impairment charges for acquired intangible assets and other long-lived assets were not material for the twelve months ended July 31, 2025, 2024, or 2023.
|
|
|
Share-Based Compensation Plans |
RSUs granted typically vest based on continued service. We value these time-based RSUs at the date of grant using the intrinsic value method. We amortize the fair value of time-based RSUs on a straight-line basis over the service period. Certain RSUs granted to senior management vest based on the achievement of pre-established market or performance goals. We estimate the fair value of market-based RSUs at the date of grant using a Monte Carlo valuation methodology and amortize those fair values over the requisite service period for each separately vesting tranche of the award. The Monte Carlo methodology that we use to estimate the fair value of market-based RSUs at the date of grant incorporates into the valuation the possibility that the market condition may not be satisfied. Provided that the requisite service is rendered, the total fair value of the market-based RSUs at the date of grant must be recognized as compensation expense even if the market condition is not achieved. However, the number of shares that ultimately vest can vary significantly with the performance of the specified market criteria. We estimate the fair value of performance-based RSUs at the date of grant using the intrinsic value method and the probability that the specified performance criteria would be met. Each quarter, we update our assessment of the probability that the specified performance criteria will be achieved and adjust our estimate of the fair value of the performance-based RSUs if necessary. We amortize the fair values of performance-based RSUs over the requisite service period for each separately vesting tranche of the award. All of the RSUs we grant have dividend rights that are subject to the
same vesting requirements as the underlying equity awards, so we do not adjust the intrinsic (market) value of our RSUs for dividends.
We estimate the fair value of stock options granted using a lattice binomial model and a multiple option award approach. We amortize the fair value of stock options on a straight-line basis over the requisite service periods of the awards, which are generally the vesting periods.
See Note 11, “Stockholders’ Equity,” for a description of our share-based compensation plans and more information on the assumptions we use to calculate the fair value of share-based compensation.
We record charges associated with management-approved restructuring plans as restructuring in our consolidated statements of operations. These charges may include severance and employee benefits, and costs to vacate facilities. We generally recognize employee severance costs when payments are probable and the amounts are estimable, or when notifications occur, depending on the region where the employee works. The liability for restructuring charges is included in accrued compensation and related liabilities in the accompanying consolidated balance sheets.
|
|
|
Concentration of Credit Risk and Significant Customers and Suppliers |
We operate in markets that are highly competitive and rapidly changing. Significant technological changes, shifting customer needs, the emergence of competitive products or services with new capabilities, and other factors could negatively impact our operating results.
We are also subject to risks related to changes in the value of our material balance of investments. Our portfolio of investments consists of investment-grade securities. Except for direct obligations of the U.S. government, securities issued by agencies of the U.S. government and money market funds, we diversify our investments by limiting our holdings with any individual issuer. Our cash balances are primarily on deposit at high credit quality financial institutions. These deposits are typically in excess of insured limits.
We sell a portion of our products through third-party retailers and distributors. As a result, we face risks related to the collectibility of our accounts receivable. To appropriately manage this risk, we perform ongoing evaluations of customer credit and limit the amount of credit extended as we deem appropriate, but generally do not require collateral. We maintain reserves for estimated credit losses and these losses have historically been within our expectations. However, since we cannot predict future changes in the financial stability of our customers, we cannot guarantee that our reserves will continue to be adequate. No customer accounted for 10% or more of total net revenue for the twelve months ended July 31, 2025, 2024 or 2023, nor did any customer account for 10% or more of total accounts receivable at July 31, 2025 or July 31, 2024.
We primarily use two third-party public cloud providers for our cloud hosting needs. Additionally, we rely primarily on one third-party vendor to perform the manufacturing and distribution functions for our retail desktop software products. We also have a key single-source vendor that prints and fulfills orders for most of our financial supplies business. While we believe that relying on key vendors improves the efficiency and reliability of our business operations, relying on any one vendor for a significant aspect of our business can have a material negative impact on our revenue and profitability if that vendor fails to perform at acceptable service levels for any reason, including financial difficulties of the vendor.
|
|
|
Accounting Standards Recently Adopted |
Segment Information - In November 2023, the Financial Accounting Standards Board (FASB) issued Accounting Standards Update (ASU) 2023-07, “Segment Reporting (Topic 280): Improvements to Reportable Segment Disclosures.” This standard requires incremental segment information disclosures, including disclosures of significant segment expenses that are regularly provided to the CODM, a description of other segment items by reportable segment, and any additional measures of a segment's profit or loss used by the CODM when deciding how to allocate resources. We adopted ASU 2023-07 in the fourth quarter of fiscal 2025 on a retrospective basis. The adoption did not have a material impact on our consolidated financial statements and related disclosures. See Note 14, “Segment Information,” for more information.
|
|
|
Accounting Standards Not Yet Adopted |
Income Tax - In December 2023, the FASB issued ASU 2023-09, “Income Taxes (Topic 740): Improvements to Income Tax Disclosures.” This standard requires additional disclosures related to the income tax rate reconciliation, income taxes paid by jurisdiction, and other income tax-related disclosures. The standard is effective for fiscal years beginning after December 15, 2024, which means that it will be effective for us for the fiscal year ending July 31, 2026. Early adoption is permitted on either a prospective or retrospective basis. We are currently evaluating the impact of our pending adoption of ASU 2023-09 on our consolidated financial statements and related disclosures.
Income Statement - Expense Disaggregation - In November 2024, the FASB issued ASU 2024-03, “Income Statement - Reporting Comprehensive Income - Expense Disaggregation Disclosures (Subtopic 220-40): Disaggregation of Income
Statement Expenses,” and in January 2025, the FASB issued ASU 2025-01, “Income Statement - Reporting Comprehensive Income - Expense Disaggregation Disclosures (Subtopic 220-40): Clarifying the Effective Date,” which clarified the effective date of ASU 2024-03. This standard requires entities to disaggregate operating expenses into specific categories such as employee compensation, depreciation, and intangible asset amortization, by relevant expense caption on the statement of operations. The standard is effective for fiscal years beginning after December 15, 2026, and interim periods within fiscal years beginning after December 15, 2027, which means that it will be effective for our annual reporting for the fiscal year ending July 31, 2028 and for interim period reporting beginning in fiscal 2029. Early adoption is permitted on either a prospective or retrospective basis. We are currently evaluating the impact of our pending adoption of ASU 2024-03 on our consolidated financial statements and related disclosures.
Business Combinations and Consolidation - In May 2025, the FASB issued ASU 2025-03, “Business Combinations (Topic 805) and Consolidation (Topic 810): Determining the Accounting Acquirer in the Acquisition of a Variable Interest Entity (VIE).” This standard clarifies the guidance in determining the accounting acquirer in a business combination effected primarily by exchanging equity interests when the acquiree is a VIE that meets the definition of a business. The standard is effective for fiscal years beginning after December 15, 2026, including interim periods within those fiscal years, which means that it will be effective for us in the first quarter of our fiscal year beginning August 1, 2027. Early adoption is permitted, and the standard is to be applied prospectively to acquisitions after the adoption date. We are currently evaluating the impact of our pending adoption of ASU 2025-03 on our consolidated financial statements and related disclosures.
Financial Instruments—Credit Losses - In July 2025, the FASB issued ASU 2025-05, “Financial Instruments—Credit Losses (Topic 326): Measurement of Credit Losses for Accounts Receivable and Contract Assets.” This standard allows entities to apply a practical expedient when estimating expected credit losses for current accounts receivable and current contract assets that arise from transactions accounted for under FASB Accounting Standards Codification (ASC) Topic 606, “Revenue from Contracts with Customers.” The standard is effective for fiscal years beginning after December 15, 2025, including interim periods within those fiscal years, which means that it will be effective for us in the first quarter of our fiscal year beginning August 1, 2026. Early adoption is permitted, and the standard is to be applied prospectively. We are currently evaluating the impact of our pending adoption of ASU 2025-05 on our consolidated financial statements and related disclosures.
|
|
|
| 2. Fair Value Measurements |
The authoritative guidance defines fair value as the price that would be received from the sale of an asset or paid to transfer a liability in an orderly transaction between market participants on the measurement date. When determining fair value, we consider the principal or most advantageous market for an asset or liability and assumptions that market participants would use when pricing the asset or liability. In addition, we consider and use all valuation methods that are appropriate in estimating the fair value of an asset or liability.
The authoritative guidance establishes a fair value hierarchy that is based on the extent and level of judgment used to estimate the fair value of assets and liabilities. In general, the authoritative guidance requires us to maximize the use of observable inputs and minimize the use of unobservable inputs when measuring fair value. An asset or liability’s categorization within the fair value hierarchy is based upon the lowest level of input that is significant to the measurement of its fair value. The three levels of input defined by the authoritative guidance are as follows:
•Level 1 uses unadjusted quoted prices that are available in active markets for identical assets or liabilities.
•Level 2 uses inputs other than quoted prices included in Level 1 that are either directly or indirectly observable through correlation with market data. These include quoted prices in active markets for similar assets or liabilities; quoted prices for identical or similar assets or liabilities in markets that are not active; and inputs to valuation models or other pricing methodologies that do not require significant judgment because the inputs used in the model, such as interest rates and volatility, can be corroborated by readily observable market data for substantially the full term of the assets or liabilities.
•Level 3 uses one or more unobservable inputs that are supported by little or no market activity and that are significant to the determination of fair value. Level 3 assets and liabilities include those whose fair values are determined using pricing models, discounted cash flow methodologies, or similar valuation techniques and significant management judgment or estimation.
|
|
|
Assets and Liabilities Measured at Fair Value on a Recurring Basis |
The following table summarizes financial assets that we measured at fair value on a recurring basis at the dates indicated, classified in accordance with the fair value hierarchy described above.
|
|
|
|
|
|
|
|
|
|
|
|
|
|
|
|
|
|
|
|
|
|
|
|
|
|
|
|
|
|
|
|
|
|
|
|
|
|
|
|
| |
At July 31, 2025 |
|
At July 31, 2024 |
| (In millions) |
Level 1 |
|
Level 2 |
|
|
|
Total
Fair Value |
|
Level 1 |
|
Level 2 |
|
|
|
Total
Fair Value |
| Assets: |
|
|
|
|
|
|
|
|
|
|
|
|
|
|
|
| Cash equivalents, primarily money market funds |
$ |
1,790 |
|
|
$ |
— |
|
|
|
|
$ |
1,790 |
|
|
$ |
2,538 |
|
|
$ |
— |
|
|
|
|
$ |
2,538 |
|
| Available-for-sale debt securities: |
|
|
|
|
|
|
|
|
|
|
|
|
|
|
|
|
|
|
|
|
|
|
|
|
|
|
|
|
|
|
|
| Corporate notes |
— |
|
|
502 |
|
|
|
|
502 |
|
|
— |
|
|
456 |
|
|
|
|
456 |
|
| U.S. agency securities |
— |
|
|
1,316 |
|
|
|
|
1,316 |
|
|
— |
|
|
159 |
|
|
|
|
159 |
|
| Total available-for-sale debt securities |
— |
|
|
1,818 |
|
|
|
|
1,818 |
|
|
— |
|
|
615 |
|
|
|
|
615 |
|
| Total assets measured at fair value on a recurring basis |
$ |
1,790 |
|
|
$ |
1,818 |
|
|
|
|
$ |
3,608 |
|
|
$ |
2,538 |
|
|
$ |
615 |
|
|
|
|
$ |
3,153 |
|
|
|
|
|
|
|
|
|
|
|
|
|
|
|
|
|
|
|
|
|
|
|
|
|
|
|
|
|
|
|
|
|
The following table summarizes our cash equivalents and available-for-sale debt securities by balance sheet classification and level in the fair value hierarchy at the dates indicated:
|
|
|
|
|
|
|
|
|
|
|
|
|
|
|
|
|
|
|
|
|
|
|
|
|
|
|
|
|
|
|
|
|
|
|
|
|
|
|
|
| |
At July 31, 2025 |
|
At July 31, 2024 |
| (In millions) |
Level 1 |
|
Level 2 |
|
|
|
Total
Fair Value |
|
Level 1 |
|
Level 2 |
|
|
|
Total
Fair Value |
| Cash equivalents: |
|
|
|
|
|
|
|
|
|
|
|
|
|
|
|
| In cash and cash equivalents |
$ |
1,790 |
|
|
$ |
— |
|
|
|
|
$ |
1,790 |
|
|
$ |
2,538 |
|
|
$ |
— |
|
|
|
|
$ |
2,538 |
|
|
|
|
|
|
|
|
|
|
|
|
|
|
|
|
|
|
|
|
|
|
|
|
|
|
|
|
|
|
|
|
|
| Available-for-sale debt securities: |
|
|
|
|
|
|
|
|
|
|
|
|
|
|
|
| In investments |
$ |
— |
|
|
$ |
1,668 |
|
|
|
|
$ |
1,668 |
|
|
$ |
— |
|
|
$ |
465 |
|
|
|
|
$ |
465 |
|
| In funds receivable and amounts held for customers |
— |
|
|
150 |
|
|
|
|
150 |
|
|
— |
|
|
150 |
|
|
|
|
150 |
|
|
|
|
|
|
|
|
|
|
|
|
|
|
|
|
|
| Total available-for-sale debt securities |
$ |
— |
|
|
$ |
1,818 |
|
|
|
|
$ |
1,818 |
|
|
$ |
— |
|
|
$ |
615 |
|
|
|
|
$ |
615 |
|
We value our Level 1 assets, consisting primarily of money market funds, using quoted prices in active markets for identical instruments.
Financial assets whose fair values we measure on a recurring basis using Level 2 inputs consist of corporate notes and U.S. agency securities. We measure the fair values of these assets with the help of a pricing service that either provides quoted market prices in active markets for identical or similar securities or uses observable inputs for their pricing without applying significant adjustments. Our fair value processes include controls designed to ensure that we record appropriate fair values for our Level 2 investments. These controls include comparison to pricing provided by a secondary pricing service or investment manager, validation of pricing sources and models, review of key model inputs, analysis of period-over-period price fluctuations, and independent recalculation of prices where appropriate.
Financial assets whose fair values we measure using Level 3 inputs consist of notes receivable held for sale. These notes receivables are recorded at the lower of amortized cost or fair value. As of July 31, 2025 we held no notes receivable held for sale. As of July 31, 2024, total notes receivable held for sale was not material and the difference between amortized cost and fair value was not material.
Financial liabilities whose fair values we measure using Level 2 inputs consist of senior unsecured notes. See Note 7, “Debt,” for more information. We measure the fair value of our senior unsecured notes based on their trading prices and the interest rates we could obtain for other borrowings with similar terms. At July 31, 2025 and July 31, 2024, the total estimated fair value of the senior unsecured notes was $5.0 billion and $5.5 billion, respectively. At July 31, 2025 and July 31, 2024, the carrying value of the senior unsecured notes was $5.0 billion and $5.5 billion, respectively. See Note 7, “Debt,” for more information.
|
|
|
Assets and Liabilities Measured at Fair Value on a Non-Recurring Basis |
Assets measured at fair value on a non-recurring basis include reporting units measured at fair value in a goodwill impairment test and our long-term investments.
Estimates of fair value for reporting units fall under Level 3 of the fair value hierarchy. During the fourth quarters of fiscal 2025, fiscal 2024, and fiscal 2023, we performed our annual goodwill impairment tests. Using the methodology described in Note 1, we determined that the estimated fair values of all of our reporting units exceeded their carrying values and that they were not impaired.
Long-term investments primarily include non-marketable equity securities in privately held companies that do not have a readily determinable fair value. They are accounted for at cost and adjusted based on observable price changes from orderly transactions for identical or similar investments of the same issuer or impairment. These investments are classified as Level 3 in the fair value hierarchy because we estimate the value of these investments using a valuation method based on observable transaction price changes at the transaction date.
The following table summarizes the adjustments to the carrying value of our long-term investments.
|
|
|
|
|
|
|
|
|
|
|
|
|
|
|
|
|
|
|
July 31, |
| (In millions) |
2025 |
|
2024 |
|
2023 |
Upward adjustments |
$ |
11 |
|
|
$ |
4 |
|
|
$ |
— |
|
Downward adjustments, including impairments |
(51) |
|
|
(2) |
|
|
(6) |
|
Net adjustments |
$ |
(40) |
|
|
$ |
2 |
|
|
$ |
(6) |
|
Cumulative upward adjustments were $85 million, and cumulative downward adjustments, including impairments, were $69 million through July 31, 2025 for measurement alternative investments held as of July 31, 2025. As of July 31, 2025 and July 31, 2024, the carrying value of long-term investments was $94 million and $131 million, respectively.
|
|
|
| 3. Cash and Cash Equivalents, Investments, and Funds Receivable and Amounts Held for Customers |
The following table summarizes our cash and cash equivalents, investments, and funds receivable and amounts held for customers by balance sheet classification at the dates indicated.
|
|
|
|
|
|
|
|
|
|
|
|
|
|
|
|
|
|
|
|
|
|
|
|
| |
July 31, 2025 |
|
July 31, 2024 |
| (In millions) |
Amortized
Cost
|
|
Fair Value |
|
Amortized
Cost
|
|
Fair Value |
| Classification on consolidated balance sheets: |
|
|
|
|
|
|
|
| Cash and cash equivalents |
$ |
2,884 |
|
|
$ |
2,884 |
|
|
$ |
3,609 |
|
|
$ |
3,609 |
|
| Investments |
1,667 |
|
|
1,668 |
|
|
465 |
|
|
465 |
|
| Funds receivable and amounts held for customers |
7,076 |
|
|
7,076 |
|
|
3,921 |
|
|
3,921 |
|
| Total cash and cash equivalents, investments, and funds receivable and amounts held for customers |
$ |
11,627 |
|
|
$ |
11,628 |
|
|
$ |
7,995 |
|
|
$ |
7,995 |
|
The following table summarizes our cash and cash equivalents, investments, and relevant portion of funds receivable and amounts held for customers by investment category at the dates indicated. As of July 31, 2025 and July 31, 2024, this excludes $329 million and $281 million, respectively, of funds receivable on our consolidated balance sheets included in funds receivable and amounts held for customers that were not measured and recorded at fair value.
|
|
|
|
|
|
|
|
|
|
|
|
|
|
|
|
|
|
|
|
|
|
|
|
| |
July 31, 2025 |
|
July 31, 2024 |
| (In millions) |
Amortized Cost |
|
Fair Value |
|
Amortized Cost |
|
Fair Value |
| Type of issue: |
|
|
|
|
|
|
|
| Total cash, cash equivalents, restricted cash, and restricted cash equivalents |
$ |
9,481 |
|
|
$ |
9,481 |
|
|
$ |
7,099 |
|
|
$ |
7,099 |
|
| Available-for-sale debt securities: |
|
|
|
|
|
|
|
|
|
|
|
|
|
|
|
| Corporate notes |
502 |
|
|
502 |
|
|
456 |
|
|
456 |
|
| U.S. agency securities |
1,315 |
|
|
1,316 |
|
|
159 |
|
|
159 |
|
| Total available-for-sale debt securities |
1,817 |
|
|
1,818 |
|
|
615 |
|
|
615 |
|
| Total cash, cash equivalents, restricted cash, restricted cash equivalents, and investments |
$ |
11,298 |
|
|
$ |
11,299 |
|
|
$ |
7,714 |
|
|
$ |
7,714 |
|
We include realized gains and losses on our available-for-sale debt securities in interest and other income, net in our consolidated statements of operations. Gross realized gains and losses on our available-for-sale debt securities for the twelve months ended July 31, 2025, 2024, and 2023 were not material.
We accumulate unrealized gains and losses on our available-for-sale debt securities, net of tax, in accumulated other comprehensive income or loss in the stockholders’ equity section of our consolidated balance sheets, except for certain unrealized losses described below. Gross unrealized gains and losses on our available-for-sale debt securities at July 31, 2025 and July 31, 2024 were not material.
For available-for-sale debt securities in an unrealized loss position, we determine whether a credit loss exists. The estimate of the credit loss is determined by considering available information relevant to the collectibility of the security and information about past events, current conditions, and reasonable and supportable forecasts. The allowance for credit loss is recorded to interest and other income, net in our consolidated statements of operations, not to exceed the amount of the unrealized loss. Any excess unrealized loss greater than the allowance for credit loss at a security level is recognized in accumulated other comprehensive income or loss in the stockholders' equity section of our consolidated balance sheets. We determined there were no credit losses related to available-for-sale debt securities as of July 31, 2025 and July 31, 2024. Unrealized losses on available-for-sale debt securities at July 31, 2025 were not material. We do not intend to sell these investments. In addition, it is more likely than not that we will not be required to sell them before recovery of the amortized cost basis, which may be at maturity.
The following table summarizes our available-for-sale debt securities, included in investments and relevant portion of funds receivable and amounts held for customers, classified by the stated maturity date of the security at the dates indicated.
|
|
|
|
|
|
|
|
|
|
|
|
|
|
|
|
|
|
|
|
|
|
|
|
| |
July 31, 2025 |
|
July 31, 2024 |
| (In millions) |
Amortized Cost |
|
Fair Value |
|
Amortized Cost |
|
Fair Value |
| Due within one year |
$ |
1,694 |
|
|
$ |
1,694 |
|
|
$ |
517 |
|
|
$ |
516 |
|
| Due within two years |
62 |
|
|
63 |
|
|
55 |
|
|
56 |
|
| Due within three years |
61 |
|
|
61 |
|
|
43 |
|
|
43 |
|
|
|
|
|
|
|
|
|
| Total available-for-sale debt securities |
$ |
1,817 |
|
|
$ |
1,818 |
|
|
$ |
615 |
|
|
$ |
615 |
|
The following table summarizes our funds receivable and amounts held for customers by asset category at the dates indicated.
|
|
|
|
|
|
|
|
|
|
|
|
|
|
|
|
|
|
|
|
|
|
|
|
|
| (In millions) |
July 31, 2025 |
|
July 31, 2024 |
|
July 31, 2023 |
|
July 31, 2022 |
|
| Restricted cash and restricted cash equivalents |
$ |
6,597 |
|
|
$ |
3,490 |
|
|
$ |
4 |
|
|
$ |
201 |
|
|
| Restricted available-for-sale debt securities and funds receivable |
479 |
|
|
431 |
|
|
416 |
|
|
230 |
|
|
| Total funds receivable and amounts held for customers |
$ |
7,076 |
|
|
$ |
3,921 |
|
|
$ |
420 |
|
|
$ |
431 |
|
|
|
|
|
| 4. Notes Receivable and Allowances for Credit Losses |
As of July 31, 2025 and 2024, our notes receivable portfolio consisted of notes receivable held for investment, including term loans to small and mid-market businesses and refund advance loans to consumers, and notes receivable held for sale, including term loans to small and mid-market businesses. We classify notes receivable as held for investment when we have both the intent and ability to hold until maturity or payoff. We classify notes receivable as held for sale when we have the intent and ability to sell substantially all of our rights and interests in a qualified loan to a third-party investor. A note receivable that is initially designated as held for sale or held for investment may be reclassified when our intent for that individual note receivable changes. When a note receivable held for investment is reclassified to held for sale and recorded at the lower of amortized cost or fair value, the related allowance for credit losses for that note receivable is released, and any adjustment to record the loan at the lower of amortized cost or fair value is recorded.
|
|
|
Notes Receivable Held for Investment |
Term loans to small and mid-market businesses. We provide financing to small and mid-market businesses via term loans that we originate directly or through an originating bank partner. During the twelve months ended July 31, 2025 and 2024, we purchased term loans from our originating bank partner with principal balances in the amount of $3.5 billion and $1.8 billion, respectively. As of July 31, 2025, we had commitments to purchase $38 million in term loans that were originated on or prior to July 31, 2025.
The term loans are not secured and are recorded at amortized cost, which includes unpaid principal balances, deferred origination costs and fees, and any related discount or premium, net of allowances for credit losses. As of July 31, 2025 and July 31, 2024, the net notes receivable held for investment balance for term loans to small and mid-market businesses was $1.5 billion and $912 million, respectively. The current portion is included in notes receivable held for investment and the long-term portion is included in other assets on our consolidated balance sheets.
We maintain an allowance for credit losses on notes receivable held for investment to reserve for expected credit losses in the notes receivable portfolio. The allowance for credit losses is determined based on our current estimate of expected credit losses, historical credit losses, estimates of recoveries, and future expectations as of each balance sheet date. We evaluate the creditworthiness of our notes receivable portfolio on a pooled basis due to its composition of term loans with similar general credit risk and characteristics. The allowance for credit losses is subjective and requires management estimates, including such factors as known and inherent risks in the notes receivable portfolio, use of historical credit losses to estimate expected credit
losses, adverse situations that may affect borrowers' ability to repay, and current and forecasted economic conditions. Expected credit losses are measured based on a credit loss forecasting model and calculated by applying loss curves derived from loan level risk segment and term mixes, aggregated at monthly loan vintages. Loss curves are estimated based on a combination of empirical loss curve data and management judgment. We use empirical data and management judgment to estimate losses for new credit tests or products for which we do not have enough history. The methodologies are updated periodically to reflect factors such as actual term loan performance and changes in assumptions based on the risk characteristics of the notes receivable portfolio. When available information confirms that the specific term loans or portions thereof are uncollectible, identified amounts are charged off against the allowance for credit losses. Term loans are charged off as the contractual principal becomes 120 days past due or meets certain other charge-off policy requirements. Subsequent recoveries of the unpaid principal balance, if any, are credited to the allowance for credit losses. As of July 31, 2025 and July 31, 2024, the allowances for credit losses, amount of charge-offs recorded, and amount of recoveries on term loans to small and mid-market businesses were not material.
We consider a term loan to be delinquent when the payments are one day past due. We place delinquent term loans on nonaccrual status and stop accruing interest revenue. Term loans are returned to accrual status if they are brought current or have performed in accordance with the contractual terms for a reasonable period of time and, in our judgment, will continue to make periodic principal and interest payments as per the contractual terms. Past due amounts were not material for all periods presented.
Refund Advance Loans. Refund advance loans are loans available to eligible TurboTax customers based on a customer's anticipated income tax refund, at no cost to the customer. These loans are repaid from the customer's income tax refund, which is generally received within three to four weeks after acceptance of the customer's income tax return by the Internal Revenue Service (IRS). We partner with a third-party issuing bank to originate the loans and subsequently purchase full participating interests in those loans. The refund advance loans are not secured and are recorded at amortized cost, net of an allowance for credit losses. As of July 31, 2025 and July 31, 2024, the net notes receivable balances for refund advance loans were not material. We maintain an allowance for credit losses to reserve for potentially uncollectible loans. We estimate the allowance for credit losses based on the expected funding of refunds by the IRS using historical trends. When we determine that any amounts are uncollectible, we charge them off against the allowance for credit losses. As of July 31, 2025 and July 31, 2024, the allowances for credit losses on refund advance loans were not material.
|
|
|
Notes Receivable Held for Sale |
Term loans to small and mid-market businesses. We have entered into multiple forward flow arrangements with institutional investors that facilitate the sale of participation interests in eligible unsecured term loans. These arrangements have varying terms, with expiration dates ranging from 2027 to 2029. Total sales of term loans during the twelve months ended July 31, 2025 and July 31, 2024 were $543 million and $323 million, respectively. For the twelve months ended July 31, 2025 and July 31, 2024, gains on sales of term loans and servicing income were not material.
Notes receivable held for sale are recorded at the lower of amortized cost or fair value determined on an individual term loan basis. As of July 31, 2025 we held no notes receivable as held for sale. As of July 31, 2024, the balances of notes receivable held for sale was $3 million, and is included in notes receivable held for sale on our consolidated balance sheets.
|
|
|
| 5. Property and Equipment |
Property and equipment consisted of the following at the dates indicated:
|
|
|
|
|
|
|
|
|
|
|
|
|
|
|
|
|
|
| |
Life in |
|
July 31, |
| (Dollars in millions) |
Years |
|
2025 |
|
2024 |
| Computer software |
2-6 |
|
$ |
791 |
|
|
$ |
810 |
|
| Buildings |
5-30 |
|
644 |
|
|
636 |
|
| Leasehold improvements |
2-16 |
|
479 |
|
|
495 |
|
| Equipment |
3-5 |
|
175 |
|
|
177 |
|
| Furniture and fixtures |
5 |
|
139 |
|
|
141 |
|
| Land |
– |
|
96 |
|
|
96 |
|
| Capital in progress |
– |
|
39 |
|
|
17 |
|
| |
|
|
2,363 |
|
|
2,372 |
|
| Less accumulated depreciation and amortization |
|
|
(1,402) |
|
|
(1,363) |
|
| Total property and equipment, net |
|
|
$ |
961 |
|
|
$ |
1,009 |
|
Capital in progress at July 31, 2025 and 2024, consisted primarily of costs related to various buildings and site improvements that have not yet been placed into service.
As discussed in Note 1, “Description of Business and Summary of Significant Accounting Policies – Internal Use Software,” we capitalize costs related to the development of computer software for internal use. We capitalized internal use software costs totaling $40 million for the twelve months ended July 31, 2025; $59 million for the twelve months ended July 31, 2024; and $50 million for the twelve months ended July 31, 2023. There was no capitalized labor in these amounts for the twelve months ended July 31, 2025, 2024, and 2023. Costs related to internal use software projects are included in the capital in progress category of property and equipment until project completion, at which time they are transferred to the computer software category.
|
|
|
| 6. Goodwill and Acquired Intangible Assets |
Changes in the carrying value of goodwill by reportable segment during the twelve months ended July 31, 2025 and July 31, 2024 were as shown in the following table. Our reportable segments are described in Note 14, “Segment Information.” We have recast certain prior period amounts to conform to the way we internally manage and monitor our business. See Note 1, “Description of Business and Summary of Significant Accounting Policies — Basis of Presentation,” for more information.
|
|
|
|
|
|
|
|
|
|
|
|
|
|
|
|
|
|
|
|
|
|
|
|
|
|
|
|
|
|
|
|
|
|
|
|
|
|
|
|
|
|
| (In millions) |
Balance
July 31, 2023 |
|
Goodwill Acquired/
Adjusted |
|
Foreign Currency Translation |
|
Balance
July 31, 2024 |
|
Goodwill Acquired/
Adjusted |
|
Foreign Currency Translation |
|
Balance
July 31, 2025 |
| Global Business Solutions |
$ |
9,691 |
|
|
$ |
— |
|
|
$ |
(1) |
|
|
$ |
9,690 |
|
|
$ |
134 |
|
|
$ |
1 |
|
|
$ |
9,825 |
|
| Consumer |
4,089 |
|
|
65 |
|
|
— |
|
|
4,154 |
|
|
— |
|
|
1 |
|
|
4,155 |
|
| Totals |
$ |
13,780 |
|
|
$ |
65 |
|
|
$ |
(1) |
|
|
$ |
13,844 |
|
|
$ |
134 |
|
|
$ |
2 |
|
|
$ |
13,980 |
|
Goodwill is net of accumulated impairment losses of $114 million, which were recorded prior to July 31, 2023 and are included in our Consumer segment. The increases in goodwill during the twelve months ended July 31, 2025 and July 31, 2024 were primarily due to acquisitions.
|
|
|
Acquired Intangible Assets |
The following table shows the cost, accumulated amortization, and weighted-average life in years for our acquired intangible assets at the dates indicated. The weighted-average lives are calculated for assets that are not fully amortized.
|
|
|
|
|
|
|
|
|
|
|
|
|
|
|
|
|
|
|
|
|
|
|
|
|
|
| (Dollars in millions) |
Customer and User Relationships |
|
Purchased
Technology |
|
Trade
Names
and Logos |
|
|
|
Total |
|
|
|
|
|
|
|
|
|
|
| At July 31, 2025: |
|
|
|
|
|
|
|
|
|
| Cost |
$ |
6,198 |
|
|
$ |
1,765 |
|
|
$ |
680 |
|
|
|
|
$ |
8,643 |
|
| Accumulated amortization |
(2,034) |
|
|
(1,061) |
|
|
(246) |
|
|
|
|
(3,341) |
|
| Acquired intangible assets, net |
$ |
4,164 |
|
|
$ |
704 |
|
|
$ |
434 |
|
|
|
|
$ |
5,302 |
|
| Weighted-average life in years |
14 |
|
8 |
|
13 |
|
|
|
13 |
|
|
|
|
|
|
|
|
|
|
| At July 31, 2024: |
|
|
|
|
|
|
|
|
|
| Cost |
$ |
6,196 |
|
|
$ |
1,648 |
|
|
$ |
680 |
|
|
|
|
$ |
8,524 |
|
| Accumulated amortization |
(1,605) |
|
|
(905) |
|
|
(194) |
|
|
|
|
(2,704) |
|
| Acquired intangible assets, net |
$ |
4,591 |
|
|
$ |
743 |
|
|
$ |
486 |
|
|
|
|
$ |
5,820 |
|
| Weighted-average life in years |
14 |
|
8 |
|
13 |
|
|
|
13 |
The following table shows the expected future amortization expense for our acquired intangible assets at July 31, 2025. Amortization of purchased technology is generally charged to amortization of acquired technology in our consolidated statements of operations. Amortization of other acquired intangible assets, such as customer and user relationships, is charged to amortization of other acquired intangible assets in our consolidated statements of operations. If impairment events occur, they could accelerate the timing of acquired intangible asset charges.
|
|
|
|
|
|
| (In millions) |
Expected
Future
Amortization
Expense |
| Fiscal year ending July 31, |
|
| 2026 |
$ |
660 |
|
| 2027 |
633 |
|
| 2028 |
613 |
|
| 2029 |
593 |
|
| 2030 |
590 |
|
| Thereafter |
2,213 |
|
| Total expected future amortization expense |
$ |
5,302 |
|
The carrying value of our debt was as follows at the dates indicated:
|
|
|
|
|
|
|
|
|
|
|
|
|
|
|
|
|
|
| |
July 31, |
|
July 31, |
|
Effective |
(Dollars in millions) |
2025 |
|
2024 |
|
Interest Rate |
| Senior unsecured notes issued June 2020: |
|
|
|
|
|
0.950% notes due July 2025 |
$ |
— |
|
|
$ |
500 |
|
|
1.127% |
1.350% notes due July 2027 |
500 |
|
|
500 |
|
|
1.486% |
1.650% notes due July 2030 |
500 |
|
|
500 |
|
|
1.767% |
Senior unsecured notes issued September 2023: |
|
|
|
|
|
5.250% notes due September 2026 |
750 |
|
|
750 |
|
|
5.325% |
5.125% notes due September 2028 |
750 |
|
|
750 |
|
|
5.258% |
5.200% notes due September 2033 |
1,250 |
|
|
1,250 |
|
|
5.312% |
5.500% notes due September 2053 |
1,250 |
|
|
1,250 |
|
|
5.576% |
|
|
|
|
|
|
| Secured revolving credit facilities |
1,014 |
|
|
585 |
|
|
|
| Total principal balance of debt |
6,014 |
|
|
6,085 |
|
|
|
| Unamortized discount and debt issuance costs |
(41) |
|
|
(47) |
|
|
|
| Net carrying value of debt |
$ |
5,973 |
|
|
$ |
6,038 |
|
|
|
|
|
|
|
|
|
| Short-term debt |
$ |
— |
|
|
$ |
499 |
|
|
|
| Long-term debt |
$ |
5,973 |
|
|
$ |
5,539 |
|
|
|
Future principal payments for debt at July 31, 2025 were as shown in the table below.
|
|
|
|
|
|
| (In millions) |
|
| Fiscal year ending July 31, |
|
| 2026 |
$ |
— |
|
| 2027 |
1,250 |
|
| 2028 |
300 |
|
| 2029 |
1,464 |
|
| 2030 |
500 |
|
| Thereafter |
2,500 |
|
| Total future principal payments for debt |
$ |
6,014 |
|
2020 Notes. In June 2020, we issued four series of senior unsecured notes (together, the 2020 Notes) pursuant to a public debt offering. The proceeds from the issuance were $1.98 billion, net of debt discount of $2 million and debt issuance costs of $15 million. During the fourth quarter of fiscal 2025, we repaid the $500 million in notes due in July 2025 when they became due using cash from operations. As of July 31, 2025, $1.0 billion of the 2020 Notes remained outstanding.
Interest is payable semiannually on January 15 and July 15 of each year. The discount and debt issuance costs are amortized to interest expense using the effective interest method over the term of the 2020 Notes.
The 2020 Notes are senior unsecured obligations of Intuit and rank equally with all existing and future unsecured and unsubordinated indebtedness of Intuit and are redeemable by us at any time, subject to a make-whole premium. Upon the occurrence of change of control transactions that are accompanied by certain downgrades in the credit ratings of the 2020 Notes, we will be required to repurchase the 2020 Notes at a repurchase price equal to 101% of the aggregate outstanding principal plus any accrued and unpaid interest to but not including the date of repurchase. The indenture governing the 2020 Notes requires us to comply with certain covenants. For example, the 2020 Notes limit our ability to create certain liens and enter into sale and leaseback transactions. As of July 31, 2025, we were compliant with all covenants governing the 2020 Notes.
2023 Notes. In September 2023, we issued four series of senior unsecured notes (together, the 2023 Notes) pursuant to a public debt offering. The proceeds from the issuance were $3.96 billion, net of debt discount of $20 million and debt issuance costs of $24 million, and were used, together with operating cash, to repay the outstanding balance on our unsecured term loan. As of July 31, 2025, $4.0 billion of the 2023 Notes remained outstanding.
Interest is payable semiannually on March 15 and September 15 of each year. The discount and debt issuance costs are amortized to interest expense using the effective interest method over the term of the 2023 Notes.
The 2023 Notes are senior unsecured obligations of Intuit and rank equally with all existing and future unsecured and unsubordinated indebtedness of Intuit and are redeemable by us at any time, subject to a make-whole premium. The indenture governing the 2023 Notes requires us to comply with certain covenants. For example, the 2023 Notes limit our ability to create certain liens and enter into sale and leaseback transactions. As of July 31, 2025, we were compliant with all covenants governing the 2023 Notes.
|
|
|
Unsecured Credit Facilities |
2024 Credit Facility. On February 5, 2024, we terminated our amended and restated credit agreement dated November 1, 2021 (2021 Credit Facility), and entered into a credit agreement with certain lenders providing for a $1.5 billion unsecured revolving credit facility that expires on February 5, 2029 (2024 Credit Facility).
Under the 2024 Credit Facility, we may, subject to certain customary conditions, including approval of relevant lenders, on one or more occasions, increase commitments under the 2024 Credit Facility by an amount not to exceed $1 billion in the aggregate, and, on one or more occasions, extend the maturity date of the 2024 Credit Facility by one year. The 2024 Credit Facility includes a $500 million sublimit for borrowing swingline loans and a $250 million sublimit for the issuance of letters of credit. Advances under the 2024 Credit Facility accrue interest at rates equal to (a) in the case of U.S. dollar borrowings, at our election, either (i) the alternate base rate plus a margin that ranges from 0.0% to 0.125%, or (ii) the adjusted term Secured Overnight Finance Rate (SOFR) plus a margin that ranges from 0.7% to 1.125%, or (b) in the case of foreign currency borrowings, the interest benchmark for the relevant currency specified in the credit agreement plus a margin that ranges from 0.7% to 1.125%. The facility fee ranges from 0.050% to 0.125% per annum. The actual interest margins and the facility fee are based on our senior debt credit ratings.
The 2024 Credit Facility includes customary affirmative and negative covenants, including a financial covenant that requires us to maintain a ratio of total gross debt to earnings before interest, taxes, depreciation, and amortization (EBITDA), as defined in the agreement, of not greater than 4.00 to 1.00 as measured on a rolling twelve month basis as of the last day of each fiscal quarter. As of July 31, 2025, we were compliant with all covenants governing the 2024 Credit Facility. At July 31, 2025, no amounts were outstanding under the 2024 Credit Facility.
2025 Credit Facility. On January 30, 2025, we entered into a credit agreement with certain lenders providing for a $4.5 billion unsecured short-term revolving credit facility (2025 Credit Facility) to fund a portion of our TurboTax early tax refund offering. We terminated the 2025 Credit Facility on March 3, 2025.
Advances under the 2025 Credit Facility accrued interest at rates equal to, at our election, either (i) the alternate base rate plus a margin of 0.125%, or (ii) the adjusted daily simple SOFR or term SOFR plus a margin of 1.125%. Unused portions of the commitment accrued a fee of 0.10% per annum.
|
|
|
Secured Revolving Credit Facilities |
2019 Secured Facility. On February 19, 2019, a subsidiary of Intuit entered into a secured revolving credit facility with a lender to fund the lending products and services we offer to qualified small and mid-market businesses (the 2019 Secured Facility).
The 2019 Secured Facility is non-recourse to Intuit Inc. and is secured by cash and receivables of the subsidiary, which are in excess of the amount outstanding under the 2019 Secured Facility as of July 31, 2025. We have entered into several amendments to this facility. These amendments primarily increase the facility limit, extend the commitment term and final maturity date, and update the benchmark interest rate. Under the amended 2019 Secured Facility, the facility limit is $500 million, of which $300 million is committed and $200 million is uncommitted. Advances accrue interest at adjusted daily simple SOFR plus 1.25%. Unused portions of the committed credit facility accrue a fee at a rate ranging from 0.25% to 0.75%, depending on the total unused committed balance. The commitment term is through August 31, 2027, and the final maturity date is August 31, 2028. The agreement includes certain affirmative and negative covenants, including financial covenants, that require the subsidiary to maintain specified financial ratios. As of July 31, 2025, we were compliant with all covenants governing the 2019 Secured Facility. At July 31, 2025, $440 million was outstanding under the 2019 Secured Facility and the weighted-average interest rate was 5.74%. Interest on the 2019 Secured Facility is payable monthly.
2022 Secured Facility. On October 12, 2022, another subsidiary of Intuit entered into a secured revolving credit facility with a lender to fund the lending products and services we offer to qualified small and mid-market businesses (the 2022 Secured Facility). The 2022 Secured Facility is non-recourse to Intuit Inc. and is secured by cash and receivables of the subsidiary, which are in excess of the amount outstanding under the 2022 Secured Facility as of July 31, 2025. We have entered into several amendments to this facility. These amendments primarily extend the commitment term and final maturity date, increase the commitment amount, and reduce the interest rate. Under the amended 2022 Secured Facility, the facility limit is $500 million, of which $400 million is committed and $100 million is uncommitted. Advances accrue interest at SOFR plus 1.1%. Unused portions of the committed credit facility accrue a fee at a rate ranging from 0.2% to 0.4%, depending on the total unused committed balance. The commitment term is through April 30, 2027, and the final maturity date is May 1, 2028. The agreement includes certain affirmative and negative covenants, including financial covenants, that require the subsidiary to maintain specified financial ratios. As of July 31, 2025, we were compliant with all covenants governing the 2022 Secured Facility. At July 31, 2025, $300 million was outstanding under the 2022 Secured Facility and the weighted-average interest rate was 5.56%, which includes the fee on the unused committed portion. Interest on the 2022 Secured Facility is payable monthly.
2024 Secured Facility. On November 1, 2024, another subsidiary of Intuit entered into a secured revolving credit facility with a lender to fund the lending products and services we offer to qualified small and mid-market businesses (the 2024 Secured Facility). The 2024 Secured Facility is non-recourse to Intuit Inc. and is secured by cash and receivables of the subsidiary, which are in excess of the amount outstanding under the 2024 Secured Facility as of July 31, 2025. We have entered into several amendments to this facility. These amendments primarily increased the commitment amount. Under the amended 2024 Secured Facility, the facility limit is $300 million, all of which is committed. Advances accrue interest at SOFR plus 1.15%. Unused portions of the committed credit facility accrue a fee at a rate ranging from 0.2% to 0.4%, depending on the total unused committed balance. The commitment term is through November 1, 2027, and the final maturity date is November 1, 2028. The agreement includes certain affirmative and negative covenants, including financial covenants that require the subsidiary to maintain specified financial ratios. As of July 31, 2025, we were compliant with all covenants governing the 2024 Secured Facility. At July 31, 2025, $274 million was outstanding under the 2024 Secured Facility and the weighted-average interest rate was 5.56%, which includes the fee on the unused committed portion. Interest on the 2024 Secured Facility is payable monthly.
Under our established commercial paper program, we may issue and sell unsecured short-term promissory notes (commercial paper) up to $1.5 billion. The maturities of the commercial paper may vary but will not exceed 397 days from the date of issuance. During the twelve months ended July 31, 2025, we temporarily increased the capacity of our commercial paper program from $1.5 billion to $2.0 billion to support our seasonal working capital needs. As of July 31, 2025, the capacity of the commercial paper program was $1.5 billion. At July 31, 2025 and July 31, 2024, no amounts were outstanding under this program.
|
|
|
| 8. Other Liabilities and Commitments |
|
|
|
Other Current Liabilities |
Other current liabilities were as follows at the dates indicated:
|
|
|
|
|
|
|
|
|
|
|
|
| |
July 31, |
| (In millions) |
2025 |
|
2024 |
| Executive deferred compensation plan liabilities |
$ |
248 |
|
|
$ |
207 |
|
| Interest payable |
85 |
|
|
84 |
|
| Current portion of operating lease liabilities |
69 |
|
|
71 |
|
| Sales, property, and other taxes |
55 |
|
|
47 |
|
| Reserve for returns, credits, and promotional discounts |
39 |
|
|
40 |
|
|
|
|
|
|
|
|
|
|
|
|
|
|
|
|
|
|
|
|
|
|
|
|
|
| Other |
129 |
|
|
108 |
|
| Total other current liabilities |
$ |
625 |
|
|
$ |
557 |
|
|
|
|
Other Long-Term Obligations |
Other long-term obligations were as follows at the dates indicated:
|
|
|
|
|
|
|
|
|
|
|
|
| |
July 31, |
| (In millions) |
2025 |
|
2024 |
| Income tax liabilities |
$ |
238 |
|
|
$ |
157 |
|
|
|
|
|
|
|
|
|
|
|
|
|
| Other |
70 |
|
|
51 |
|
| Total other long-term obligations |
$ |
308 |
|
|
$ |
208 |
|
|
|
|
|
|
|
|
|
|
|
|
Unconditional Purchase Obligations |
In the ordinary course of business, we enter into certain unconditional purchase obligations with our suppliers. These are agreements to purchase products and services that are enforceable, legally binding, and specify terms that include fixed or minimum quantities to be purchased; fixed, minimum, or variable price provisions; and the approximate timing of the payments.
As of July 31, 2025, our commitments under purchase obligations, primarily related to a cloud services agreement, were as shown in the table below.
|
|
|
|
|
|
| (In millions) |
Purchase
Obligations |
| Fiscal year ending July 31, |
|
| 2026 |
$ |
808 |
|
| 2027 |
725 |
|
| 2028 |
881 |
|
| 2029 |
682 |
|
| 2030 |
616 |
|
| Thereafter |
1,180 |
|
| Total commitments |
$ |
4,892 |
|
We lease office facilities under non-cancellable operating lease arrangements. Our facility leases generally provide for periodic rent increases and may contain escalation clauses and renewal options. Our leases have remaining lease terms of up to 17 years, which include options to extend that are reasonably certain of being exercised. Some of our leases include one or more options to extend the lease for up to 10 years per option, which we are not reasonably certain to exercise. The options to extend are generally at rates to be determined in accordance with the agreements. Options to extend the lease are included in the lease liability if they are reasonably certain of being exercised.
We sublease certain office facilities to third parties. These subleases have remaining lease terms of up to 5 years, one of which includes an option to extend the sublease for up to 5 years.
The components of lease expense were as follows:
|
|
|
|
|
|
|
|
|
|
|
|
|
|
|
|
|
|
|
Twelve Months Ended July 31, |
| (In millions) |
2025 |
|
2024 |
|
2023 |
Operating lease cost (1) |
$ |
111 |
|
|
$ |
108 |
|
|
$ |
124 |
|
|
|
|
|
|
|
| Variable lease cost |
22 |
|
|
23 |
|
|
20 |
|
| Sublease income |
(10) |
|
|
(11) |
|
|
(12) |
|
| Total net lease cost |
$ |
123 |
|
|
$ |
120 |
|
|
$ |
132 |
|
(1) Includes short-term leases, which were not material for the twelve months ended July 31, 2025, 2024, or 2023.
Supplemental cash flow information related to operating leases was as follows:
|
|
|
|
|
|
|
|
|
|
|
|
|
|
|
|
|
|
|
|
|
|
Twelve Months Ended July 31, |
|
|
|
| (In millions) |
2025 |
|
2024 |
|
2023 |
|
|
|
| Cash paid for amounts included in the measurement of operating lease liabilities |
$ |
101 |
|
|
$ |
89 |
|
|
$ |
107 |
|
|
|
|
| Right-of-use assets obtained in exchange for operating lease liabilities |
$ |
212 |
|
|
$ |
35 |
|
|
$ |
28 |
|
|
|
|
Other information related to operating leases was as follows at the dates indicated:
|
|
|
|
|
|
|
|
|
|
|
|
|
|
|
|
|
|
|
July 31, |
|
2025 |
|
2024 |
|
2023 |
| Weighted-average remaining lease term for operating leases |
8.1 years |
|
7.7 years |
|
7.9 years |
| Weighted-average discount rate for operating leases |
3.8 |
% |
|
3.3 |
% |
|
3.0 |
% |
Future minimum lease payments under non-cancellable operating leases as of July 31, 2025 were as follows:
|
|
|
|
|
|
| (In millions) |
Operating
Leases (1)
|
| Fiscal year ending July 31, |
|
| 2026 |
$ |
78 |
|
| 2027 |
105 |
|
| 2028 |
97 |
|
| 2029 |
100 |
|
| 2030 |
98 |
|
| Thereafter |
314 |
|
| Total future minimum lease payments |
792 |
|
| Less imputed interest |
(126) |
|
| Present value of lease liabilities |
$ |
666 |
|
(1) Non-cancellable future sublease proceeds as of July 31, 2025 totaled $22 million through July 31, 2030 and $1 million thereafter, and are not included in the table above.
Supplemental balance sheet information related to operating leases was as follows at the dates indicated:
|
|
|
|
|
|
|
|
|
|
|
|
|
July 31, |
| (In millions) |
2025 |
|
2024 |
|
|
|
|
| Operating lease right-of-use assets |
$ |
541 |
|
|
$ |
411 |
|
|
|
|
|
| Other current liabilities |
$ |
69 |
|
|
$ |
71 |
|
| Operating lease liabilities |
597 |
|
|
458 |
|
| Total operating lease liabilities |
$ |
666 |
|
|
$ |
529 |
|
As of July 31, 2025, we have additional operating leases with total minimum lease payments of $133 million for office facilities that have not yet commenced and therefore are not reflected on the consolidated balance sheets nor in the tables above. These operating leases are expected to commence in fiscal years 2026 and 2027 with lease terms of 10 years.
The provision for income taxes consisted of the following for the periods indicated:
|
|
|
|
|
|
|
|
|
|
|
|
|
|
|
|
|
|
| |
Twelve Months Ended July 31, |
| (In millions) |
2025 |
|
2024 |
|
2023 |
| Current: |
|
|
|
|
|
| Federal |
$ |
1,219 |
|
|
$ |
984 |
|
|
$ |
970 |
|
| State |
237 |
|
|
202 |
|
|
208 |
|
| Foreign |
25 |
|
|
36 |
|
|
86 |
|
| Total current |
1,481 |
|
|
1,222 |
|
|
1,264 |
|
| Deferred: |
|
|
|
|
|
| Federal |
(453) |
|
|
(523) |
|
|
(559) |
|
| State |
(70) |
|
|
(97) |
|
|
(99) |
|
| Foreign |
7 |
|
|
(15) |
|
|
(1) |
|
| Total deferred |
(516) |
|
|
(635) |
|
|
(659) |
|
| Total provision for income taxes |
$ |
965 |
|
|
$ |
587 |
|
|
$ |
605 |
|
We recognized excess tax benefits on share-based compensation of $143 million, $183 million, and $32 million in the provision for income taxes for the twelve months ended July 31, 2025, 2024, and 2023, respectively.
The sources of income before the provision for income taxes consisted of the following for the periods indicated:
|
|
|
|
|
|
|
|
|
|
|
|
|
|
|
|
|
|
| |
Twelve Months Ended July 31, |
| (In millions) |
2025 |
|
2024 |
|
2023 |
| United States |
$ |
4,700 |
|
|
$ |
3,449 |
|
|
$ |
2,798 |
|
| Foreign |
134 |
|
|
101 |
|
|
191 |
|
| Total |
$ |
4,834 |
|
|
$ |
3,550 |
|
|
$ |
2,989 |
|
Differences between income taxes calculated using the federal statutory income tax rate and the provision for income taxes were as follows for the periods indicated:
|
|
|
|
|
|
|
|
|
|
|
|
|
|
|
|
|
|
| |
Twelve Months Ended July 31, |
| (In millions) |
2025 |
|
2024 |
|
2023 |
| Income before income taxes |
$ |
4,834 |
|
|
$ |
3,550 |
|
|
$ |
2,989 |
|
|
|
|
|
|
|
|
|
|
|
|
|
|
|
|
|
|
|
| Statutory federal income tax |
$ |
1,015 |
|
|
$ |
746 |
|
|
$ |
628 |
|
| State income tax, net of federal benefit |
132 |
|
|
83 |
|
|
86 |
|
| Federal research and experimentation credits |
(113) |
|
|
(109) |
|
|
(106) |
|
| Share-based compensation |
47 |
|
|
43 |
|
|
58 |
|
| Excess tax benefits related to share-based compensation |
(120) |
|
|
(153) |
|
|
(26) |
|
| Effects of non-U.S. operations |
1 |
|
|
— |
|
|
(28) |
|
| Other, net |
3 |
|
|
(23) |
|
|
(7) |
|
| Total provision for income taxes |
$ |
965 |
|
|
$ |
587 |
|
|
$ |
605 |
|
The state income tax line in the table above includes excess tax benefits related to share-based compensation of $23 million, $30 million, and $6 million for the twelve months ended July 31, 2025, 2024, and 2023, respectively.
On July 4, 2025, the U.S. federal government enacted the One Big Beautiful Bill Act (OBBBA), which includes significant tax law changes. The OBBBA has multiple effective dates from fiscal 2025 through fiscal 2027. The provisions effective during fiscal 2025 did not have a significant impact on our consolidated financial statements.
In the current global tax policy environment, the U.S. and other domestic and foreign governments continue to consider, and in some cases enact, changes in corporate tax laws. As changes occur, we account for finalized legislation in the period of enactment.
Material deferred tax assets and liabilities were as follows at the dates indicated:
|
|
|
|
|
|
|
|
|
|
|
|
| |
July 31, |
| (In millions) |
2025 |
|
2024 |
| Deferred tax assets: |
|
|
|
| Accruals and reserves not currently deductible |
$ |
72 |
|
|
$ |
47 |
|
Capitalized research and development |
1,895 |
|
|
1,321 |
|
| Operating lease liabilities |
173 |
|
|
137 |
|
|
|
|
|
| Accrued and deferred compensation |
116 |
|
|
132 |
|
| Loss and tax credit carryforwards |
277 |
|
|
204 |
|
|
|
|
|
| Share-based compensation |
113 |
|
|
117 |
|
| Other, net |
24 |
|
|
20 |
|
| Total gross deferred tax assets |
2,670 |
|
|
1,978 |
|
| Valuation allowance |
(290) |
|
|
(227) |
|
| Total deferred tax assets |
2,380 |
|
|
1,751 |
|
| Deferred tax liabilities: |
|
|
|
|
|
|
|
| Operating lease right-of-use assets |
140 |
|
|
105 |
|
| Intangibles |
950 |
|
|
864 |
|
| Property and equipment |
32 |
|
|
38 |
|
| Other, net |
56 |
|
|
49 |
|
| Total deferred tax liabilities |
1,178 |
|
|
1,056 |
|
Net deferred tax assets |
$ |
1,202 |
|
|
$ |
695 |
|
The components of total net deferred tax assets, net of valuation allowances, as shown on our consolidated balance sheets were as follows at the dates indicated:
|
|
|
|
|
|
|
|
|
|
|
|
| |
July 31, |
| (In millions) |
2025 |
|
2024 |
| Long-term deferred income tax assets |
$ |
1,222 |
|
|
$ |
698 |
|
Long-term deferred income tax liabilities included in other long-term obligations |
(20) |
|
|
(3) |
|
| Net deferred tax assets |
$ |
1,202 |
|
|
$ |
695 |
|
We have provided a valuation allowance on all California net deferred tax assets primarily related to state research and experimentation tax credit carryforwards. We have also provided a valuation allowance on other non-California state operating loss and foreign loss carryforwards. We have provided a valuation allowance on these deferred tax assets as we believe they are unlikely to be realized. We have a valuation allowance of $290 million and $227 million for the twelve months ended July 31, 2025 and July 31, 2024, respectively. The valuation allowance on our net deferred taxes increased by $63 million for the twelve months ended July 31, 2025. The change in the valuation allowance was primarily related to an increase in the allowance for California net deferred tax assets. The valuation allowance on our net deferred taxes decreased by $8 million for the twelve months ended July 31, 2024. The change in the valuation allowance was primarily related to a decrease in the allowance for foreign net operating loss carryforwards, net of an increase in the allowance for California net deferred tax assets.
At July 31, 2025, we had federal net operating loss carryforwards of approximately $54 million that will start to expire in fiscal 2032. Utilization of the net operating losses is subject to annual limitation. The annual limitation may result in the expiration of net operating losses before utilization.
At July 31, 2025, we had state net operating loss carryforwards of approximately $137 million for which we have recorded a deferred tax asset of $9 million and a valuation allowance of $6 million. The state net operating loss carryforwards will start to expire in fiscal 2028. Utilization of the net operating losses is subject to annual limitation. The annual limitation may result in the expiration of net operating losses before utilization.
At July 31, 2025, we had foreign net operating loss carryforwards of approximately $18 million which carry forward indefinitely. We maintain a full valuation allowance with respect to the foreign net operating losses as there is not sufficient evidence of future sources of taxable income required to utilize such carryforwards.
At July 31, 2025, we had California research and experimentation credit carryforwards of approximately $426 million. The California research and experimentation credit will carry forward indefinitely. We maintain a full valuation allowance with respect to the California research and experimentation credit carryforwards as there is not sufficient evidence of future sources of taxable income required to utilize such carryforwards.
|
|
|
Unrecognized Tax Benefits |
The aggregate changes in the balance of our gross unrecognized tax benefits were as follows for the periods indicated:
|
|
|
|
|
|
|
|
|
|
|
|
|
|
|
|
|
|
| |
Twelve Months Ended July 31, |
| (In millions) |
2025 |
|
2024 |
|
2023 |
| Gross unrecognized tax benefits, beginning balance |
$ |
327 |
|
|
$ |
246 |
|
|
$ |
216 |
|
| Increases related to tax positions from prior fiscal years, including acquisitions |
11 |
|
|
36 |
|
|
11 |
|
| Decreases related to tax positions from prior fiscal years |
(21) |
|
|
(12) |
|
|
(16) |
|
| Increases related to tax positions taken during current fiscal year |
91 |
|
|
95 |
|
|
38 |
|
| Settlements with tax authorities |
(2) |
|
|
(1) |
|
|
(2) |
|
| Lapse of statute of limitations |
(12) |
|
|
(37) |
|
|
(1) |
|
| Gross unrecognized tax benefits, ending balance |
$ |
394 |
|
|
$ |
327 |
|
|
$ |
246 |
|
The total amount of our unrecognized tax benefits at July 31, 2025 was $394 million. If we were to recognize these net benefits, our income tax expense would reflect a favorable net impact of $276 million. We do not believe that it is reasonably possible that there will be a significant increase or decrease in unrecognized tax benefits over the next 12 months.
We file U.S. federal, U.S. state, and foreign tax returns. Our major tax jurisdiction is the U.S. federal jurisdiction. For U.S. federal tax returns, we are no longer subject to tax examinations for years prior to fiscal 2022 except for fiscal 2018 and fiscal 2016.
We recognize interest and penalties related to unrecognized tax benefits within the provision for income taxes. Amounts accrued at July 31, 2025 and July 31, 2024 for the payment of interest and penalties were not material. The amounts of interest and penalties that we recognized during the twelve months ended July 31, 2025, 2024, and 2023, were also not material.
We offset a $61 million and $66 million long-term liability for uncertain tax positions against our long-term income tax receivable at July 31, 2025 and July 31, 2024, respectively. The long-term income tax receivable for both periods was primarily related to the government’s approval of a method of accounting change request for fiscal 2018.
|
|
|
Stock Repurchase Programs and Treasury Shares |
Intuit’s Board of Directors has authorized a series of common stock repurchase programs. Shares of common stock repurchased under these programs become treasury shares. Under these programs, we repurchased 4.3 million shares of our common stock for $2.8 billion during the twelve months ended July 31, 2025. At July 31, 2025, we had authorization from our Board of Directors for up to $2.1 billion in stock repurchases. On August 19, 2025, our Board of Directors approved an increase in the authorization under the existing stock repurchase program under which we are authorized to repurchase up to an additional $3.2 billion of our common stock. Future stock repurchases under the current program are at the discretion of management, and authorization of future stock repurchase programs is subject to the final determination of our Board of Directors.
Our treasury shares are repurchased at the market price on the trade date; accordingly, all amounts paid to reacquire these shares have been recorded as treasury stock on our consolidated balance sheets. Any direct costs to acquire treasury stock are recorded to treasury stock on our consolidated balance sheets. Repurchased shares of our common stock are held as treasury shares until they are reissued or retired. When we reissue treasury stock, if the proceeds from the sale are more than the average price we paid to acquire the shares, we record an increase in additional paid-in capital. Conversely, if the proceeds from the sale are less than the average price we paid to acquire the shares, we record a decrease in additional paid-in capital to the extent of increases previously recorded for similar transactions and a decrease in retained earnings for any remaining amount.
In the past, we have satisfied option exercises and restricted stock unit vesting under our employee equity incentive plans by reissuing treasury shares, and we may do so again in the future. For all periods presented, we issued new shares of common stock to satisfy option exercises and RSU vesting under our 2005 Equity Incentive Plan. We have not yet determined the ultimate disposition of the shares that we have repurchased in the past, and consequently we continue to hold them as treasury shares.
|
|
|
Dividends on Common Stock |
During the twelve months ended July 31, 2025, we declared cash dividends that totaled $4.16 per share of outstanding common stock, or approximately $1.2 billion. In August 2025, our Board of Directors declared a quarterly cash dividend of $1.20 per share of outstanding common stock payable on October 17, 2025 to stockholders of record at the close of business on October 9, 2025. Future declarations of dividends and the establishment of future record dates and payment dates are subject to the final determination of our Board of Directors.
|
|
|
Description of 2005 Equity Incentive Plan and Credit Karma, Inc. 2015 Equity Incentive Plan |
Our stockholders initially approved our 2005 Equity Incentive Plan (2005 Plan) on December 9, 2004. On January 18, 2024, our stockholders approved an Amended and Restated 2005 Equity Incentive Plan (Restated 2005 Plan) that expires on January 18, 2034. Under the Restated 2005 Plan, we are permitted to grant incentive and non-qualified stock options, restricted stock awards, RSUs, stock appreciation rights, and stock bonus awards to our employees, non-employee directors, and consultants. The Compensation and Organizational Development Committee of our Board of Directors or its delegates determine who will receive grants, when those grants will be exercisable, their exercise price, and other terms. We are permitted to issue up to 171.7 million shares under the Restated 2005 Plan. The plan provides a fungible share reserve. Each stock option granted on or after November 1, 2010 reduces the share reserve by one share and each restricted stock award or restricted stock unit granted reduces the share reserve by 2.3 shares. Stock options forfeited and returned to the pool of shares available for grant increase the pool by one share for each share forfeited. Restricted stock awards and RSUs forfeited and returned to the pool of shares available for grant increase the pool by 2.3 shares for each share forfeited. Shares withheld for income taxes upon vesting of RSUs that were granted on or after July 21, 2016 are also returned to the pool of shares available for grant. Stock options granted under the 2005 Plan and the Restated 2005 Plan typically vest over three to four years based on continued service and have a seven-year term. RSUs granted under those plans typically vest over three to four years based on continued service. Certain RSUs granted to senior management vest based on the achievement of pre-established performance or market goals.
In connection with our acquisition of Credit Karma on December 3, 2020, we assumed the Credit Karma, Inc. 2015 Equity Incentive Plan, as amended (Credit Karma Plan), under which the assumed equity awards were granted. Under the Restated 2005 Plan, effective January 20, 2022, shares available under the Credit Karma Plan became available for grant under the Restated 2005 Plan and no shares may be granted out of the Credit Karma Plan. After January 20, 2022, shares forfeited and returned to the pool from grants issued out of the Credit Karma Plan increase the pool by 2.3 shares for each share forfeited.
At July 31, 2025, there were approximately 25.1 million shares available for grant under the Restated 2005 Plan.
|
|
|
Description of Employee Stock Purchase Plan |
On November 26, 1996, our stockholders initially adopted our Employee Stock Purchase Plan (ESPP) under Section 423 of the Internal Revenue Code. The ESPP permits our eligible employees to make payroll deductions to purchase our stock on regularly scheduled purchase dates at a discount. Our stockholders have approved amendments to the ESPP to permit the issuance of up to 25.8 million shares under the ESPP, which expires upon the earliest to occur of (a) termination of the ESPP by our Board of Directors, or (b) issuance of all the shares of Intuit’s common stock reserved for issuance under the ESPP. Offering periods under the ESPP are six months in duration and composed of two consecutive three-month accrual periods. Shares are purchased at 85% of the lower of the closing price for Intuit common stock on the first day of the offering period or the last day of the accrual period.
Under the ESPP, employees purchased 306,286 shares of Intuit common stock during the twelve months ended July 31, 2025; 360,028 shares during the twelve months ended July 31, 2024; and 399,975 shares during the twelve months ended July 31, 2023. At July 31, 2025, there were 1,657,666 shares available for issuance under this plan.
|
|
|
Share-Based Compensation Expense |
The following table summarizes the total share-based compensation expense that we recorded in operating income for the periods shown.
|
|
|
|
|
|
|
|
|
|
|
|
|
|
|
|
|
|
| |
Twelve Months Ended July 31, |
(In millions, except per share amounts) |
2025 |
|
2024 |
|
2023 |
Cost of service revenue |
$ |
420 |
|
|
$ |
398 |
|
|
$ |
371 |
|
Cost of product and other revenue |
3 |
|
|
4 |
|
|
3 |
|
| Selling and marketing |
541 |
|
|
506 |
|
|
429 |
|
| Research and development |
629 |
|
|
639 |
|
|
532 |
|
| General and administrative |
375 |
|
|
368 |
|
|
377 |
|
Restructuring |
— |
|
|
25 |
|
|
— |
|
| Total share-based compensation expense |
1,968 |
|
|
1,940 |
|
|
1,712 |
|
| Income tax benefit |
(548) |
|
|
(594) |
|
|
(373) |
|
| Decrease in net income |
$ |
1,420 |
|
|
$ |
1,346 |
|
|
$ |
1,339 |
|
|
|
|
|
|
|
|
|
|
|
|
|
|
|
|
|
|
|
|
|
|
|
|
|
Valuation and Amortization Methods
RSUs granted typically vest based on continued service. We value these time-based RSUs at the date of grant using the intrinsic value method. We amortize the fair value of time-based RSUs on a straight-line basis over the service period. These time-based RSUs accounted for approximately 91% of our total share-based compensation expense during the twelve months ended July 31, 2025. Certain RSUs granted to senior management vest based on the achievement of pre-established market or performance goals. We estimate the fair value of market-based RSUs at the date of grant using a Monte Carlo valuation methodology and amortize those fair values over the requisite service period for each separately vesting tranche of the award. The Monte Carlo methodology that we use to estimate the fair value of market-based RSUs at the date of grant incorporates into the valuation the possibility that the market condition may not be satisfied. Provided that the requisite service is rendered, the total fair value of the market-based RSUs at the date of grant must be recognized as compensation expense even if the market condition is not achieved. However, the number of shares that ultimately vest can vary significantly with the performance of the specified market criteria. We estimate the fair value of performance-based RSUs at the date of grant using the intrinsic value method and the probability that the specified performance criteria will be met. Each quarter, we update our assessment of the probability that the specified performance criteria will be achieved and adjust our estimate of the fair value of the performance-based RSUs if necessary. We amortize the fair values of performance-based RSUs over the requisite service period for each separately vesting tranche of the award. All of the RSUs we grant have dividend rights that are subject to the same vesting requirements as the underlying equity awards, so we do not adjust the market price of our stock on the date of grant for dividends.
We estimate the fair value of stock options granted using a lattice binomial model and a multiple option award approach. Our stock options have various restrictions, including vesting provisions and restrictions on transfer, and are often exercised prior to their contractual maturity. We believe that lattice binomial models are more capable of incorporating the features of our stock options than closed-form models such as the Black Scholes model. The use of a lattice binomial model requires the use of extensive actual employee exercise behavior and a number of complex assumptions, including the expected volatility of our stock price over the term of the options, risk-free interest rates, and expected dividends. We amortize the fair value of options on a straight-line basis over the requisite service periods of the awards, which are generally the vesting periods.
Expected Term. The expected term of options granted represents the period of time that they are expected to be outstanding and is a derived output of the lattice binomial model. The expected term of stock options is impacted by all of the underlying assumptions and calibration of our model. The lattice binomial model assumes that option exercise behavior is a function of the option’s remaining life and the extent to which the market price of our common stock exceeds the option exercise price. The lattice binomial model estimates the probability of exercise as a function of these two variables based on the history of exercises and cancellations on all past option grants made by us.
Expected Volatility. We estimate the volatility of our common stock at the date of grant based on the implied volatility of one-year publicly traded options on our common stock. Our decision to use implied volatility was based on the availability of actively traded options on our common stock and our assessment that implied volatility is more representative of future stock price trends than historical volatility.
Risk-Free Interest Rate. We base the risk-free interest rate that we use in our option valuation model on the implied yield in effect at the time of option grant on constant maturity U.S. Treasury issues with equivalent remaining terms.
Dividends. We use an annualized expected dividend yield in our option valuation model. We paid quarterly cash dividends during all years presented and currently expect to continue to pay cash dividends in the future.
Forfeitures. We adjust share-based compensation expense for actual forfeitures as they occur.
We used the following assumptions to estimate the fair value of stock options granted and shares purchased under our Employee Stock Purchase Plan for the periods indicated:
|
|
|
|
|
|
|
|
|
|
|
|
|
|
|
|
|
|
| |
Twelve Months Ended July 31, |
|
2025 |
|
2024 |
|
2023 |
| Assumptions for stock options: |
|
|
|
|
|
| Expected volatility (range) |
29.54 |
% |
|
31 |
% |
|
30.41% - 33.19% |
| Weighted-average expected volatility |
29.54 |
% |
|
31 |
% |
|
30.67 |
% |
| Risk-free interest rate (range) |
3.95 |
% |
|
4.13 |
% |
|
3.52% - 4.46% |
| Expected dividend yield |
0.53 |
% |
|
0.57 |
% |
|
0.63 |
% |
|
|
|
|
|
|
| Assumptions for ESPP: |
|
|
|
|
|
| Expected volatility (range) |
30% - 31% |
|
27% - 36% |
|
38% - 48% |
| Weighted-average expected volatility |
30 |
% |
|
31 |
% |
|
42 |
% |
| Risk-free interest rate (range) |
4.29% - 5.39% |
|
4.94% - 5.55% |
|
1.59% - 4.74% |
| Expected dividend yield (range) |
0.56% - 0.69% |
|
0.57% - 0.75% |
|
0.74% - 0.81% |
|
|
|
Share-Based Awards Available for Grant |
A summary of share-based awards available for grant under our plans for the fiscal periods indicated was as follows:
|
|
|
|
|
|
| (Shares in thousands) |
Shares
Available
for Grant |
| Balance at July 31, 2022 |
26,260 |
|
|
|
|
|
Restricted stock units granted (1) |
(12,098) |
|
| Options granted |
(413) |
|
Share-based awards canceled/forfeited/expired (1)(2) |
5,277 |
|
| Balance at July 31, 2023 |
19,026 |
|
| Additional shares authorized |
12,200 |
|
|
|
Restricted stock units granted (1) |
(9,782) |
|
| Options granted |
(326) |
|
Share-based awards canceled/forfeited/expired (1)(2) |
6,199 |
|
| Balance at July 31, 2024 |
27,317 |
|
|
|
|
|
Restricted stock units granted (1) |
(8,812) |
|
| Options granted |
(287) |
|
Share-based awards canceled/forfeited/expired (1)(2) |
6,929 |
|
| Balance at July 31, 2025 |
25,147 |
|
(1)RSUs granted from the pool of shares available for grant under our Restated 2005 Plan reduce the pool by 2.3 shares for each share granted. RSUs forfeited and returned to the pool of shares available for grant under the Restated 2005 Plan increase the pool by 2.3 shares for each share forfeited.
(2)Stock options and RSUs canceled, expired, or forfeited under our Restated 2005 Plan are returned to the pool of shares available for grant. Under the Restated 2005 Plan, shares withheld for income taxes upon vesting of RSUs that were granted on or after July 21, 2016 are also returned to the pool of shares available for grant.
|
|
|
Restricted Stock Unit and Restricted Stock Activity |
A summary of RSU and restricted stock activity for the periods indicated was as follows:
|
|
|
|
|
|
|
|
|
|
|
|
| (Shares in thousands) |
Number
of Shares |
|
Weighted-Average
Grant Date
Fair Value
|
| Nonvested at July 31, 2022 |
11,467 |
|
|
$413.32 |
|
|
|
|
|
Granted |
5,260 |
|
|
452.45 |
|
|
|
|
|
| Vested |
(4,019) |
|
|
414.12 |
|
| Forfeited |
(814) |
|
|
364.45 |
|
| Nonvested at July 31, 2023 |
11,894 |
|
|
433.70 |
|
|
|
|
|
Granted |
4,253 |
|
|
590.59 |
|
|
|
|
|
|
|
|
|
| Vested |
(4,233) |
|
|
439.08 |
|
| Forfeited |
(990) |
|
|
390.17 |
|
| Nonvested at July 31, 2024 |
10,924 |
|
|
496.64 |
|
|
|
|
|
| Granted |
3,831 |
|
|
696.82 |
|
|
|
|
|
|
|
|
|
| Vested |
(3,674) |
|
|
512.36 |
|
| Forfeited |
(1,508) |
|
|
456.60 |
|
| Nonvested at July 31, 2025 |
9,573 |
|
|
$577.03 |
|
Additional information regarding our RSUs is shown in the table below.
|
|
|
|
|
|
|
|
|
|
|
|
|
|
|
|
|
|
|
Twelve Months Ended July 31, |
| (In millions) |
2025 |
|
2024 |
|
2023 |
| Total fair market value of shares vested |
$ |
2,434 |
|
|
$ |
2,575 |
|
|
$ |
1,673 |
|
|
|
|
|
|
|
| Share-based compensation for RSUs |
$ |
1,882 |
|
|
$ |
1,857 |
|
|
$ |
1,636 |
|
|
|
|
|
|
|
| Total tax benefit related to RSU share-based compensation expense |
$ |
524 |
|
|
$ |
545 |
|
|
$ |
339 |
|
|
|
|
|
|
|
| Cash tax benefits realized for tax deductions for RSUs |
$ |
533 |
|
|
$ |
526 |
|
|
$ |
347 |
|
At July 31, 2025, there was $5.1 billion of unrecognized compensation cost related to non-vested RSUs and restricted stock with a weighted-average vesting period of 3.0 years. We adjust unrecognized compensation cost for actual forfeitures as they occur.
A summary of stock option activity for the periods indicated was as follows:
|
|
|
|
|
|
|
|
|
|
|
|
| |
Options Outstanding |
| (Shares in thousands) |
Number of
Shares |
|
Weighted-Average
Exercise Price
Per Share
|
| Balance at July 31, 2022 |
2,292 |
|
|
$289.62 |
|
| Granted |
413 |
|
|
489.85 |
|
|
|
|
|
| Exercised |
(551) |
|
|
163.64 |
|
| Canceled or expired |
(24) |
|
|
368.72 |
|
| Balance at July 31, 2023 |
2,130 |
|
|
360.17 |
|
| Granted |
326 |
|
|
626.32 |
|
| Exercised |
(570) |
|
|
212.89 |
|
| Canceled or expired |
(114) |
|
|
467.16 |
|
| Balance at July 31, 2024 |
1,772 |
|
|
449.66 |
|
| Granted |
287 |
|
|
781.21 |
|
| Exercised |
(660) |
|
|
354.70 |
|
| Canceled or expired |
(80) |
|
|
493.70 |
|
| Balance at July 31, 2025 |
1,319 |
|
|
$566.59 |
|
Information regarding stock options outstanding as of July 31, 2025 is summarized below:
|
|
|
|
|
|
|
|
|
|
|
|
|
|
|
|
|
|
|
|
|
|
|
|
|
Number
of Shares
(in thousands) |
|
Weighted-
Average
Remaining
Contractual
Life
(in years) |
|
Weighted-
Average
Exercise
Price per
Share |
|
Aggregate
Intrinsic
Value
(in millions) |
| Options outstanding |
1,319 |
|
|
5.03 |
|
$566.59 |
|
|
$288 |
|
| Options exercisable |
572 |
|
|
3.79 |
|
$468.33 |
|
|
$181 |
|
The aggregate intrinsic values at July 31, 2025 are calculated as the difference between the exercise price of the underlying options and the market price of our common stock for shares that were in-the-money at that date. In-the-money options at July 31, 2025 were options that had exercise prices that were lower than the $785.13 market price of our common stock at that date.
Additional information regarding our stock options and ESPP shares is shown in the table below.
|
|
|
|
|
|
|
|
|
|
|
|
|
|
|
|
|
|
|
Twelve Months Ended July 31, |
(In millions, except per share amounts) |
2025 |
|
2024 |
|
2023 |
| Weighted-average fair value of options granted (per share) |
$ |
246.17 |
|
|
$ |
188.54 |
|
|
$ |
144.92 |
|
|
|
|
|
|
|
| Total grant date fair value of options vested |
$ |
43 |
|
|
$ |
38 |
|
|
$ |
33 |
|
|
|
|
|
|
|
| Aggregate intrinsic value of options exercised |
$ |
208 |
|
|
$ |
209 |
|
|
$ |
150 |
|
|
|
|
|
|
|
| Share-based compensation expense for stock options and ESPP |
$ |
86 |
|
|
$ |
83 |
|
|
$ |
76 |
|
|
|
|
|
|
|
| Total tax benefit for stock option and ESPP share-based compensation |
$ |
24 |
|
|
$ |
49 |
|
|
$ |
34 |
|
|
|
|
|
|
|
| Cash received from option exercises |
$ |
234 |
|
|
$ |
121 |
|
|
$ |
90 |
|
|
|
|
|
|
|
| Cash tax benefits realized related to tax deductions for non-qualified option exercises and disqualifying dispositions under all share-based payment arrangements |
$ |
27 |
|
|
$ |
49 |
|
|
$ |
31 |
|
At July 31, 2025, there was $146 million of unrecognized compensation cost related to non-vested stock options with a weighted-average vesting period of 3.2 years. We adjust unrecognized compensation cost for actual forfeitures as they occur.
|
|
|
Accumulated Other Comprehensive Loss |
Comprehensive income consists of two elements, net income and other comprehensive income (loss). Other comprehensive income (loss) items are recorded in the stockholders’ equity section of our consolidated balance sheets and are excluded from net income. Our other comprehensive income (loss) consists of unrealized gains and losses on marketable debt securities classified as available-for-sale and foreign currency translation adjustments for subsidiaries with functional currencies other than the U.S. dollar.
The following table shows the components of accumulated other comprehensive loss, net of income taxes, in the stockholders’ equity section of our consolidated balance sheets at the dates indicated.
|
|
|
|
|
|
|
|
|
|
|
|
|
July 31, |
| (In millions) |
2025 |
|
2024 |
| Unrealized gain on available-for-sale debt securities |
$ |
1 |
|
|
$ |
— |
|
| Foreign currency translation adjustments |
(51) |
|
|
(54) |
|
| Total accumulated other comprehensive loss |
$ |
(50) |
|
|
$ |
(54) |
|
|
|
|
Non-Qualified Deferred Compensation Plan |
Intuit’s Executive Deferred Compensation Plan provides that executives who meet minimum compensation requirements are eligible to defer up to 75% of their salaries and up to 75% of their bonuses. We have agreed to credit the participants’ contributions with earnings that reflect the performance of certain independent investment funds. We do not guarantee above-market interest on account balances. We may also make discretionary employer contributions to participant accounts in certain circumstances. The timing, amounts, and vesting schedules of employer contributions are at the sole discretion of the Compensation and Organizational Development Committee of our Board of Directors or its delegate. The benefits under this plan are unsecured and are general assets of Intuit. Participants are generally eligible to receive payment of their vested benefit at the end of their elected deferral period or after termination of their employment with Intuit for any reason or at a later date to comply with the restrictions of Section 409A of the Internal Revenue Code. Participants may elect to receive their payments in a lump sum or installments. Discretionary company contributions and the related earnings vest completely upon the participant’s disability, death, or a change in control of Intuit. We made no employer contributions to the plan for any period presented.
We had liabilities related to this plan of $248 million at July 31, 2025 and $207 million at July 31, 2024. We have matched the plan liabilities with similar-performing assets, which are primarily investments in life insurance contracts. These assets are recorded in other long-term assets, while liabilities related to obligations are recorded in other current liabilities on our consolidated balance sheets.
In the U.S., employees who participate in the Intuit Inc. 401(k) Plan may currently contribute up to 50% of pre-tax compensation, subject to IRS limitations and the terms and conditions of the plan. We match a portion of employee contributions, currently 125% up to six percent of compensation, subject to maximum aggregate matching amounts and IRS limitations.
Additionally, Credit Karma employees in the U.S. who participate in the Credit Karma 401(k) Plan may currently contribute up to 90% of pre-tax compensation, subject to IRS limitations and the terms and conditions of the plan. We match a portion of Credit Karma employee contributions, currently 100% up to six percent of compensation each pay period, subject to maximum aggregate matching amounts and IRS limitations.
Matching contributions for both plans were $149 million for the twelve months ended July 31, 2025; $138 million for the twelve months ended July 31, 2024; and $136 million for the twelve months ended July 31, 2023.
Beginning in May 2019, various legal proceedings were filed and certain regulatory inquiries were commenced in connection with our provision and marketing of free online tax preparation programs. We believe that the allegations contained within these legal proceedings are without merit and continue to defend our interests in them. These proceedings included, among others, multiple putative class actions that were consolidated into a single putative class action in the Northern District of California in September 2019 (the Intuit Free File Litigation). In August 2020, the Ninth Circuit Court of Appeals ordered that the putative class action claims be resolved through arbitration. In May 2021, the Intuit Free File Litigation was dismissed on a non-class basis after we entered into an agreement that resolved the matter on an individual non-class basis, without any admission of wrongdoing, for an amount that was not material. These proceedings also include a class action lawsuit that was filed in the Ontario (Canada) Superior Court of Justice on August 25, 2022.
These proceedings also included individual demands for arbitration that were filed beginning in October 2019. As of January 31, 2023, we settled all of these arbitration claims, without any admission of wrongdoing, for an amount that was not material. In June 2021, we received a demand and draft complaint from the Federal Trade Commission (FTC) and certain state attorneys general relating to the ongoing inquiries described above. On March 29, 2022, the FTC filed an action in federal court seeking a temporary restraining order and a preliminary injunction enjoining certain Intuit business practices pending resolution of the FTC’s administrative complaint seeking to permanently enjoin certain Intuit business practices (the FTC Actions). On April 22, 2022, the Northern District of California denied the FTC’s requests for a temporary restraining order and a preliminary injunction. Beginning on March 27, 2023, a final hearing on the administrative action was held before an administrative law judge (ALJ) at the FTC and, on August 29, 2023, the FTC’s ALJ issued a decision in favor of the FTC and adverse to Intuit. On January 19, 2024, the FTC Commissioners affirmed the ALJ’s decision and issued a final order that requires us to adhere to certain marketing practices and does not contain any monetary penalties. On January 21, 2024, we filed a petition for review with the United States Court of Appeals for the Fifth Circuit and this appeal is pending. The FTC’s order became effective on March 23, 2024, and is now pending review by the Court of Appeals. We intend to continue to defend our position on the merits of this case. However, the defense and resolution of this matter could involve significant costs. The state attorneys general did not join the FTC Actions, and, on May 4, 2022, we entered into a settlement agreement with the attorneys general of the 50 states and the District of Columbia, admitting no wrongdoing, that resolved the states’ inquiry, as well as actions brought by the Los Angeles City Attorney and the Santa Clara County (California) Counsel. As part of this agreement, we agreed to pay $141 million and made certain commitments regarding our advertising and marketing practices. We recorded this as a one-time charge in the quarter ended April 30, 2022, and paid the full amount to the fund administrator in the quarter ended January 31, 2023.
In view of the complexity and ongoing and uncertain nature of the outstanding proceedings and inquiries, at this time, we are unable to estimate a reasonably possible financial loss or range of financial loss that we may incur to resolve or settle the remaining matters.
To date, the legal and other fees we have incurred related to these proceedings and inquiries have not been material. The ongoing defense and any resolution or settlement of these proceedings and inquiries could involve significant costs to us.
Intuit is subject to certain routine legal proceedings, including class action lawsuits, as well as demands, claims, government inquiries, and threatened litigation, that arise in the normal course of our business, including assertions that we may be infringing patents or other intellectual property rights of others. Our failure to obtain necessary licenses or other rights, or litigation arising out of intellectual property claims could adversely affect our business. We currently believe that, in addition to any amounts accrued, the amount of potential losses, if any, for any pending claims of any type (either alone or combined) will not have a material impact on our consolidated financial statements. The ultimate outcome of any legal proceeding is uncertain and, regardless of outcome, legal proceedings can have an adverse impact on Intuit because of defense costs, negative publicity, diversion of management resources, and other factors.
We have defined our two reportable segments, described below, based on factors such as how we manage our operations and how our CODM views results. We define the CODM as our Chief Executive Officer and our Chief Financial Officer. Our CODM uses regularly provided segment revenue and segment operating income to assess operating performance and allocate company resources.
On August 1, 2024, we renamed our Small Business & Self-Employed segment as the Global Business Solutions segment. This new name better aligns with the global reach of the Mailchimp and QuickBooks platform, our focus on serving both small and mid-market businesses, and our vision to become the all-in-one platform that customers use to grow and run their business.
On August 1, 2024, we reorganized certain technology and customer success functions in our Global Business Solutions and Consumer segments that support and benefit our overall platform and are managed at the corporate level rather than at the segment level. As a result of these reorganizations, costs associated with these functions are no longer included in segment operating income and are now included in other corporate expenses. For the twelve months ended July 31, 2024 and 2023, we reclassified expenses totaling $1.4 billion and $1.3 billion from Global Business Solutions, $606 million and $509 million from Consumer to other corporate expenses, respectively, to conform to the current presentation.
Effective August 1, 2025, we combined our Consumer, Credit Karma, and ProTax businesses into a single Consumer segment in order to better serve the diverse financial needs of our customers as one consumer platform. Our CODM allocates resources and assesses segment performance using regularly provided segment revenue and segment operating income information under this updated segment structure. To align results under this segment change, certain selling and marketing, product development, and general and administrative expenses for Credit Karma that were managed at the segment level are now managed at the platform level and are included in other corporate expenses rather than in segment expenses. Also on August 1, 2025, we reorganized certain marketing, communications, and customer success functions in our Global Business Solutions segment that support and benefit our overall platform and are managed at that level rather than at the segment level. Additionally, certain data science and analytics teams that were managed at the platform level are now managed at the segment level. We have recast certain previously reported amounts to conform to these segment changes. For the twelve months ended July 31, 2025, 2024, and 2023, we reclassified expenses totaling $9 million, $16 million, and $4 million from Global Business Solutions and $606 million, $585 million, and $581 million from Consumer to other corporate expenses, respectively, to conform to the current presentation.
|
|
|
|
Global Business Solutions: This segment serves small and mid-market businesses around the world, and the accounting professionals who assist and advise them. QuickBooks and Intuit Enterprise Suite are offerings powered by our all-in-one business platform which includes financial management services, human capital management solutions such as payroll and time tracking, money solutions, such as merchant payment processing, bill pay, checking accounts through an FDIC-member bank partner, and financing for small and mid-market businesses. Intuit Enterprise Suite provides mid-market businesses with a configurable, AI-powered solution that includes multi-entity and multi-dimensional financial management capabilities designed to seamlessly scale and enhance productivity and profitability for more complex businesses to streamline operations. Mailchimp offerings include marketing automation and customer relationship tools.
Consumer: This segment primarily serves consumers and professional accountants.
Our TurboTax offerings primarily help consumers complete their taxes with confidence and maximize their financial outcomes—whether they do it themselves or with the help of an AI-enabled human expert. TurboTax delivers do-it-yourself and assisted income tax preparation products and services sold in the United States (U.S.) and Canada. We offer a variety of money products directly to consumers, including early refund access to any bank, as well as Credit Karma Money branded savings and checking accounts through an FDIC-member bank partner.
Credit Karma is a personal finance solution that helps members find the right financial products and make smarter money decisions throughout the year to reach their financial goals. This includes personalized recommendations for credit card, home, auto, and personal loan, and insurance products; and access to their credit scores and reports, credit and identity monitoring, credit report dispute, credit building tools, credit card rewards optimization, and connected account capabilities to help members understand net worth and make financial progress.
Finally, our ProTax offerings help professional accountants in the U.S. and Canada, who are essential to both business success and tax preparation and filing. Our professional tax offerings include Lacerte, ProSeries, and ProConnect Tax Online in the U.S., and ProFile and ProTax Online in Canada.
|
All of our segments operate primarily in the U.S. and sell primarily to customers in the U.S. Total international net revenue was approximately 8% of consolidated total net revenue in each of the twelve months ended July 31, 2025, 2024, and 2023.
We include expenses such as corporate selling and marketing, general and administrative, and non-employment related legal and litigation settlement costs, which are not allocated to specific segments, in unallocated corporate items as part of other corporate expenses. As part of our platform strategy, we also include customer success and product development for our segments in unallocated corporate items as we do not allocate these expenses to the segments because they are managed at the platform level. Customer success includes the costs of tax and bookkeeping experts that support our TurboTax Live and QuickBooks Live offerings. Unallocated corporate items also include share-based compensation, amortization of acquired technology, amortization of other acquired intangible assets, goodwill and intangible asset impairment charges, professional fees and transaction costs related to business combinations, and restructuring charges.
The accounting policies of our reportable segments are the same as those described in the summary of significant accounting policies in Note 1. Except for goodwill and acquired intangible assets, we do not generally track assets by reportable segment and, consequently, we do not disclose total assets by reportable segment. See Note 6, “Goodwill and Acquired Intangible Assets,” for goodwill by reportable segment.
The following table shows our financial results by reportable segment for the periods indicated.
|
|
|
|
|
|
|
|
|
|
|
|
|
|
|
|
|
|
| |
Twelve Months Ended July 31, |
| (In millions) |
2025 |
|
2024 |
|
2023 |
| Net revenue: |
|
|
|
|
|
| Global Business Solutions |
$ |
11,077 |
|
|
$ |
9,533 |
|
|
$ |
8,038 |
|
| Consumer |
7,754 |
|
|
6,752 |
|
|
6,330 |
|
| Total net revenue |
$ |
18,831 |
|
|
$ |
16,285 |
|
|
$ |
14,368 |
|
|
|
|
|
|
|
Segment cost of revenue and operating expenses (1): |
|
|
|
|
|
Global Business Solutions |
$ |
2,601 |
|
|
$ |
2,360 |
|
|
$ |
2,134 |
|
Consumer |
1,994 |
|
|
1,740 |
|
|
1,482 |
|
Total segment cost of revenues and operating expenses |
$ |
4,595 |
|
|
$ |
4,100 |
|
|
$ |
3,616 |
|
|
|
|
|
|
|
| Operating income: |
|
|
|
|
|
| Global Business Solutions |
$ |
8,476 |
|
|
$ |
7,173 |
|
|
$ |
5,904 |
|
| Consumer |
5,760 |
|
|
5,012 |
|
|
4,848 |
|
| Total segment operating income |
14,236 |
|
|
12,185 |
|
|
10,752 |
|
| Unallocated corporate items: |
|
|
|
|
|
| Share-based compensation expense |
(1,968) |
|
|
(1,915) |
|
|
(1,712) |
|
| Other corporate expenses |
(6,693) |
|
|
(5,788) |
|
|
(5,253) |
|
| Amortization of acquired technology |
(156) |
|
|
(146) |
|
|
(163) |
|
| Amortization of other acquired intangible assets |
(481) |
|
|
(483) |
|
|
(483) |
|
Restructuring charges (2) |
(15) |
|
|
(223) |
|
|
— |
|
|
|
|
|
|
|
| Total unallocated corporate items |
(9,313) |
|
|
(8,555) |
|
|
(7,611) |
|
| Total operating income |
$ |
4,923 |
|
|
$ |
3,630 |
|
|
$ |
3,141 |
|
(1) Cost of revenues and operating expenses primarily include direct expenses related to selling and marketing, direct costs associated with our product and services offerings, certain data science and analytics related costs, and certain design and product management related costs. They exclude expenses that are recorded within unallocated corporate items, such as certain technology and customer success costs that support and benefit the overall platform and are managed at the corporate level.
(2) Restructuring charges for the twelve months ended July 31, 2024 include $25 million in share-based compensation expense associated with our restructuring plan. See Note 15, “Restructuring,” for more information.
Revenue classified by significant service and product offerings was as follows:
|
|
|
|
|
|
|
|
|
|
|
|
|
|
|
|
|
|
| |
Twelve Months Ended July 31, |
| (In millions) |
2025 |
|
2024 |
|
2023 |
| Net revenue: |
|
|
|
|
|
| QuickBooks Online Accounting |
$ |
4,120 |
|
|
$ |
3,379 |
|
|
$ |
2,849 |
|
| Online Services |
4,182 |
|
|
3,513 |
|
|
2,910 |
|
| Total Online Ecosystem |
8,302 |
|
|
6,892 |
|
|
5,759 |
|
| QuickBooks Desktop Accounting |
1,672 |
|
|
1,575 |
|
|
1,211 |
|
| Desktop Services and Supplies |
1,103 |
|
|
1,066 |
|
|
1,068 |
|
| Total Desktop Ecosystem |
2,775 |
|
|
2,641 |
|
|
2,279 |
|
| Global Business Solutions |
11,077 |
|
|
9,533 |
|
|
8,038 |
|
TurboTax |
4,933 |
|
|
4,508 |
|
|
4,178 |
|
Credit Karma |
2,200 |
|
|
1,645 |
|
|
1,591 |
|
ProTax |
621 |
|
|
599 |
|
|
561 |
|
Consumer |
7,754 |
|
|
6,752 |
|
|
6,330 |
|
| Total net revenue |
$ |
18,831 |
|
|
$ |
16,285 |
|
|
$ |
14,368 |
|
In July 2024, our management approved, committed to, and initiated a plan of reorganization (the Plan) focused on reallocating resources to our key growth areas. The Plan included the exit of employees and the closing of real estate sites in certain markets to support growing technology teams and capabilities in strategic locations. The actions associated with the Plan were substantially complete in the first quarter of fiscal 2025. Total restructuring costs associated with the Plan were $238 million. During the twelve months ended July 31, 2025 and 2024, we recorded charges in connection with the Plan of $15 million and $223 million, respectively. These charges are primarily related to severance and employee benefits and are recorded to restructuring in our consolidated statements of operations.
We have recast certain prior period amounts to conform to the way we internally manage and monitor our business. See Note 1, “Description of Business and Summary of Significant Accounting Policies — Basis of Presentation,” for more information.
The following table summarizes the activity for the Plan by segment.
|
|
|
|
|
|
|
|
|
|
|
|
|
|
|
|
|
|
|
|
|
|
|
|
|
|
|
|
|
|
|
|
|
|
|
|
|
|
|
|
|
|
|
|
| (In millions) |
Accrued
July 31, 2024
|
|
Additional Costs/Adjustments |
|
Cash Payments |
|
Non-Cash Items |
|
Accrued
July 31, 2025
|
|
Total Costs Incurred to Date |
|
Total Expected Plan Cost |
|
|
| Global Business Solutions |
$ |
84 |
|
|
$ |
5 |
|
|
$ |
(86) |
|
|
$ |
— |
|
|
$ |
3 |
|
|
$ |
101 |
|
|
$ |
101 |
|
|
|
| Consumer |
11 |
|
|
— |
|
|
(11) |
|
|
— |
|
|
— |
|
|
11 |
|
|
11 |
|
|
|
Corporate |
92 |
|
|
10 |
|
|
(97) |
|
|
(5) |
|
|
— |
|
|
126 |
|
|
126 |
|
|
|
| Totals |
$ |
187 |
|
|
$ |
15 |
|
|
$ |
(194) |
|
|
$ |
(5) |
|
|
$ |
3 |
|
|
$ |
238 |
|
|
$ |
238 |
|
|
|
|
|
|
|
|
|
|
|
|
|
|
|
|
|
|
|
|
|
|
|
|
|
|
|
|
|
|
|
|
|
|
|
|
|
|
|
|
|
|
|
|
|
|
|
|
Accrued
July 31, 2023
|
|
Initial Costs |
|
Cash Payments |
|
Non-Cash Items |
|
Accrued
July 31, 2024
|
|
|
|
|
|
|
| Global Business Solutions |
$ |
— |
|
|
$ |
96 |
|
|
$ |
— |
|
|
$ |
(12) |
|
|
$ |
84 |
|
|
|
|
|
|
|
| Consumer |
— |
|
|
11 |
|
|
— |
|
|
— |
|
|
11 |
|
|
|
|
|
|
|
Corporate |
— |
|
|
116 |
|
|
— |
|
|
(24) |
|
|
92 |
|
|
|
|
|
|
|
| Totals |
$ |
— |
|
|
$ |
223 |
|
|
$ |
— |
|
|
$ |
(36) |
|
|
$ |
187 |
|
|
|
|
|
|
|
The liability for restructuring charges is included in accrued compensation and related liabilities in the accompanying consolidated balance sheets.
|
|
|
|
|
|
|
|
|
|
|
|
|
|
|
|
|
|
|
|
|
|
|
|
|
INTUIT INC.
SCHEDULE II - VALUATION AND QUALIFYING ACCOUNTS
|
|
|
|
|
|
|
|
|
| (In millions) |
Beginning
Balance |
|
Additions
Charged to
Expense/
Revenue |
|
Deductions |
|
Ending
Balance |
| Year ended July 31, 2025 |
|
|
|
|
|
|
|
| Allowance for doubtful accounts |
$ |
5 |
|
|
$ |
50 |
|
|
$ |
(50) |
|
|
$ |
5 |
|
| Reserve for returns, credits, and promotional discounts |
40 |
|
|
334 |
|
|
(335) |
|
|
39 |
|
|
|
|
|
|
|
|
|
| Year ended July 31, 2024 |
|
|
|
|
|
|
|
| Allowance for doubtful accounts |
$ |
7 |
|
|
$ |
61 |
|
|
$ |
(63) |
|
|
$ |
5 |
|
| Reserve for returns, credits, and promotional discounts |
32 |
|
|
302 |
|
|
(294) |
|
|
40 |
|
|
|
|
|
|
|
|
|
| Year ended July 31, 2023 |
|
|
|
|
|
|
|
| Allowance for doubtful accounts |
$ |
31 |
|
|
$ |
57 |
|
|
$ |
(81) |
|
|
$ |
7 |
|
| Reserve for returns, credits, and promotional discounts |
31 |
|
|
261 |
|
|
(260) |
|
|
32 |
|