UNITED STATES
SECURITIES AND EXCHANGE COMMISSION
Washington, D.C. 20549
FORM 10-K
(Mark One) | |
☒ |
ANNUAL REPORT PURSUANT TO SECTION 13 OR 15(d) OF THE SECURITIES EXCHANGE ACT OF 1934 |
For the fiscal year ended January 28, 2023 | |
OR | |
☐ |
TRANSITION REPORT PURSUANT TO SECTION 13 OR 15(d) OF THE SECURITIES EXCHANGE ACT OF 1934 |
|
|
For the transition period from to | |
Commission File No. 1-10299 | |
|
(Exact name of registrant as specified in its charter) | |
|
|
New York |
13-3513936 |
(State or other jurisdiction of |
(I.R.S. Employer Identification No.) |
incorporation or organization) |
|
330 West 34th Street, New York, New York |
10001 |
(Address of principal executive offices) |
(Zip Code) |

Registrant’s telephone number, including area code: (212) 720-3700
Securities registered pursuant to Section 12(b) of the Act:
|
||
Title of each class |
Trading Symbol(s) |
Name of each exchange on which registered |
Common Stock, par value $0.01 |
FL |
New York Stock Exchange |
|
|
|
Securities registered pursuant to Section 12(g) of the Act: None
Indicate by check mark if the registrant is a well-known seasoned issuer, as defined in Rule 405 of the Securities Act. Yes ⌧ No ◻
Indicate by check mark if the registrant is not required to file reports pursuant to Section 13 or Section 15(d) of the Act. Yes ◻ No ⌧
Indicate by check mark whether the registrant (1) has filed all reports required to be filed by Section 13 or 15(d) of the Securities Exchange Act of 1934 during the preceding 12 months (or for such shorter period that the Registrant was required to file such reports), and (2) has been subject to such filing requirements for the past 90 days. Yes ⌧ No ◻
Indicate by check mark whether the registrant has submitted electronically every Interactive Data File required to be submitted pursuant to Rule 405 of Regulation S-T (§ 232.405 of this chapter) during the preceding 12 months (or for such shorter period that the registrant was required to submit such files). Yes ⌧ No ◻
Indicate by check mark whether the registrant is a large accelerated filer, an accelerated filer, a non-accelerated filer, smaller reporting company, or an emerging growth company. See the definitions of “large accelerated filer,” “accelerated filer,” “smaller reporting company,” and “emerging growth company” in Rule 12b-2 of the Exchange Act.
Large accelerated filer |
Accelerated filer ◻ |
Non-accelerated filer ◻ |
Smaller reporting company ☐ |
Emerging growth company ☐ |
|
|
|
If an emerging growth company, indicate by check mark if the registrant has elected not to use the extended transition period for complying with any new or revised financial accounting standards pursuant to Section 13(a) of the Exchange Act. ◻
Indicate by check mark whether the registrant has filed a report on and attestation to its management’s assessment of the effectiveness of its internal control over financial reporting under Section 404(b) of the Sarbanes-Oxley Act (15 U.S.C. 7262(b)) by the registered public accounting firm that prepared or issued its audit report. ☒
Indicate by check mark whether the registrant is a shell company (as defined in Rule 12b-2 of the Act). Yes ☐ No ☒
The number of shares of the registrant’s Common Stock, par value $0.01 per share, outstanding as of March 20, 2023: |
93,429,371 |
The aggregate market value of voting stock held by non-affiliates of the registrant computed by reference to the closing price as of the last business day of the Registrant’s most recently completed second fiscal quarter, July 30, 2022 was approximately: |
$1,323,542,801* |
* For purposes of this calculation only (a) all non-employee directors plus six executive officers and owners of 5% or more of the registrant are deemed to be affiliates of the registrant, and (b) shares deemed to be “held” by such persons include only outstanding shares of the registrant’s voting stock with respect to which such persons had, on such date, voting or investment power.
DOCUMENTS INCORPORATED BY REFERENCE
Portions of the registrant’s definitive Proxy Statement (the “Proxy Statement”) to be filed in connection with the Annual Meeting of Shareholders to be held on May 17, 2023: Parts III and IV.

TABLE OF CONTENTS
|
|
|
|
|
1 |
||
|
3 |
||
|
14 |
||
|
14 |
||
|
15 |
||
|
15 |
||
|
15 |
||
|
|
|
|
|
|
|
|
|
|
|
|
|
16 |
||
|
17 |
||
|
Management’s Discussion and Analysis of Financial Condition and Results of Operations |
18 |
|
|
29 |
||
|
29 |
||
|
Changes in and Disagreements with Accountants on Accounting and Financial Disclosure |
68 |
|
|
68 |
||
|
71 |
||
|
Disclosure Regarding Foreign Jurisdictions that Prevent Inspections |
71 |
|
|
|
|
|
|
|
|
|
|
|
|
|
|
71 |
||
|
71 |
||
|
Security Ownership of Certain Beneficial Owners and Management and Related Shareholder Matters |
71 |
|
|
Certain Relationships and Related Transactions, and Director Independence |
71 |
|
|
71 |
||
|
|
|
|
|
|
|
|
|
|
|
|
|
71 |
||
|
71 |
||
|
|
||
72 |
|||
|
|
||
76 |
|||
CAUTIONARY NOTE REGARDING FORWARD-LOOKING STATEMENTS
This Annual Report on Form 10-K (“Annual Report”) includes “forward-looking” statements within the meaning of the Private Securities Litigation Reform Act of 1995. Forward-looking statements can be identified by the fact that they do not relate strictly to historical or current facts. They often include words such as “believes,” “expects,” “anticipates,” “estimates,” “intends,” “plans,” “seeks,” “continues,” “feels,” “forecasts,” or words of similar meaning, or future or conditional verbs, such as “will,” “should,” “could,” “may,” “aims,” “intends,” or “projects.” Statements may be forward looking even in the absence of these particular words.
Examples of forward-looking statements include, but are not limited to, statements regarding our financial position, business strategy, and other plans and objectives for our future operations, and generation of free cash flow. These forward-looking statements are based on our current expectations and beliefs concerning future developments and their potential effect on us. The forward-looking statements contained herein are largely based on our expectations for the future, which reflect certain estimates and assumptions made by our management. These estimates and assumptions reflect our best judgment based on currently known market conditions, operating trends, and other factors. Although we believe such estimates and assumptions to be reasonable, they are inherently uncertain and involve a number of risks and uncertainties that are beyond our control. As such, management’s assumptions about future events may prove to be inaccurate.
We do not intend to publicly update or revise any forward-looking statements as a result of new information, future events, changes in circumstances, or otherwise. These cautionary statements qualify all forward-looking statements attributable to us, or persons acting on our behalf. Management cautions you that the forward-looking statements contained herein are not guarantees of future performance, and we cannot assure you that such statements will be realized or that the events and circumstances they describe will occur. Factors that could cause actual results to differ materially from those anticipated or implied in the forward-looking statements herein include, but are not limited to, a change in the relationship with any of our key suppliers, including the unavailability of premium products at competitive prices, volume discounts, cooperative advertising, markdown allowances, or the ability to cancel orders and return merchandise; our ability to fund our planned capital investments; volatility in the financial markets or other global economic factors; our ability to access the credit markets at competitive terms; difficulties in appropriately allocating capital and resources among our strategic opportunities; our ability to realize the expected benefits from acquisitions; business opportunities and expansion; investments; expenses; dividends; share repurchases; liquidity; cash flow from operations; use of cash and cash requirements; borrowing capacity under our credit facility; repatriation of cash to the United States; supply chain issues; labor shortages and wage pressures; expectations regarding increased wages; inflation; consumer spending levels; the effect of governmental assistance programs;, including vaccines and safety protocols; expectations regarding increasing global taxes; the effect of increased government regulation, compliance, and changes in law; the effect of the adverse outcome of any material litigation against us or judicial decisions that affect us or our industry generally; the effects of weather; climate change; ESG risks; increased competition; geopolitical events; the financial effect of accounting regulations and critical accounting policies; credit risk relating to the risk of loss as a result of non-performance by our counterparties; and any other factors set forth in the section entitled “Risk Factors” in this Annual Report.
All written and oral forward-looking statements attributable to us are expressly qualified in their entirety by this cautionary statement. A forward-looking statement is neither a prediction nor a guarantee of future events or circumstances, and those future events or circumstances may not occur. You should not place undue reliance on forward-looking statements, which speak to our views only as of the date of this filing. Additional risks and uncertainties that we do not presently know about or that we currently consider to be insignificant may also affect our business operations and financial performance.
Please refer to “Item 1A. Risk Factors” in this Annual Report for a discussion of certain risks relating to our business and any investment in our securities. Given these risks and uncertainties, you should not rely on forward-looking statements as predictions of actual results. Any or all of the forward-looking statements contained in this report, or any other public statement made by us, including by our management, may turn out to be incorrect.
We are including this cautionary note to make applicable, and take advantage of, the safe harbor provisions of the Private Securities Litigation Reform Act of 1995 for forward-looking statements. We expressly disclaim any obligation to update or revise any forward-looking statements, whether as a result of new information, future events, or otherwise.
PART I
Item 1. Business
General
Foot Locker, Inc., incorporated under the laws of the State of New York in 1989. Foot Locker, Inc. and its subsidiaries hereafter are referred to as the “Registrant,” “Company,” “we,” “our,” or “us.” Foot Locker, Inc. has its corporate headquarters in New York.
Foot Locker, Inc. is a leading footwear and apparel retailer that unlocks the “inner sneakerhead” in all of us. As of January 28, 2023, we operated 2,714 stores in 29 countries across North America, Europe, Australia, New Zealand, and Asia, and a franchised store presence in the Middle East and Asia. Foot Locker, Inc. has a strong history of sneaker authority that sparks discovery and ignites the power of sneaker culture through its portfolio of brands, including Foot Locker, Kids Foot Locker, Champs Sports, WSS, and atmos.
Ensuring that our customers can engage with us in the most convenient manner for them whether in our stores, on our website, or on our mobile application, is a high priority for us. We use our omni-channel capabilities to bridge the digital world and physical stores, including order-in-store, buy online and pickup-in-store, and buy online and ship-from-store, as well as e-commerce. We operate websites and mobile apps aligned with the brand names of our store banners. These sites offer some of the largest online product selections and provide a seamless link between e-commerce and physical stores.
The service marks, tradenames, and trademarks appearing in this report (except for Nike, Jordan, adidas, and Puma) are owned by Foot Locker, Inc. or its subsidiaries.
Store and Operations Profile
|
|
|
|
|
|
|
|
|
|
|
|
Square Footage |
||
|
|
January 29, |
|
|
|
|
|
January 28, |
|
Relocations/ |
|
(in thousands) |
||
|
|
2022 |
|
Opened |
|
Closed |
|
2023 |
|
Remodels |
|
Selling |
|
Gross |
Foot Locker U.S. (1) |
|
816 |
|
31 |
|
100 |
|
747 |
|
37 |
|
2,362 |
|
4,044 |
Foot Locker Canada |
|
95 |
|
1 |
|
10 |
|
86 |
|
4 |
|
249 |
|
412 |
Kids Foot Locker |
|
410 |
|
22 |
|
22 |
|
410 |
|
22 |
|
772 |
|
1,306 |
Champs Sports |
|
525 |
|
3 |
|
42 |
|
486 |
|
6 |
|
1,792 |
|
2,809 |
WSS |
|
98 |
|
17 |
|
— |
|
115 |
|
4 |
|
1,138 |
|
1,435 |
Footaction (2) |
|
41 |
|
— |
|
39 |
|
2 |
|
— |
|
6 |
|
11 |
North America |
|
1,985 |
|
74 |
|
213 |
|
1,846 |
|
73 |
|
6,319 |
|
10,017 |
Foot Locker Europe |
|
626 |
|
20 |
|
18 |
|
628 |
|
24 |
|
1,131 |
|
2,329 |
Sidestep |
|
86 |
|
1 |
|
9 |
|
78 |
|
— |
|
97 |
|
186 |
EMEA |
|
712 |
|
21 |
|
27 |
|
706 |
|
24 |
|
1,228 |
|
2,515 |
Foot Locker Pacific |
|
94 |
|
1 |
|
1 |
|
94 |
|
15 |
|
213 |
|
325 |
Foot Locker Asia |
|
30 |
|
3 |
|
— |
|
33 |
|
— |
|
126 |
|
233 |
atmos |
|
37 |
|
4 |
|
6 |
|
35 |
|
3 |
|
37 |
|
63 |
Asia Pacific |
|
161 |
|
8 |
|
7 |
|
162 |
|
18 |
|
376 |
|
621 |
Total owned stores |
|
2,858 |
|
103 |
|
247 |
|
2,714 |
|
115 |
|
7,923 |
|
13,153 |
|
|
|
|
|
|
|
|
|
|
|
|
|
|
|
Franchised stores |
|
142 |
|
33 |
|
16 |
|
159 |
|
|
|
|
|
|
Grand Total |
|
3,000 |
|
136 |
|
263 |
|
2,873 |
|
|
|
|
|
|
| (1) | Includes 14 and 6 Lady Foot Locker stores as of January 29, 2022 and January 28, 2023, respectively. |
| (2) | We expect to close the two remaining stores in the first half of 2023. |
As of January 28, 2023, we operate 173 Community and Power Stores across the geographies in which we operate. Community Stores are off-mall stores in the heart of the community that focus on creating authentic trust with local consumers and provide elevated shopping experiences with community spaces. Power Stores are stores that provide an elevated, seamless, and convenient shopping journey for the full family. Both Community and Power Stores provide pinnacle retail experiences that deliver connected customer interactions through service, experience, product, and a sense of community.
2022 Form 10-K Page 1
The following is a brief description of each of our banners:
Foot Locker — Foot Locker is a leading global youth culture brand that connects the sneaker-obsessed consumer with the most innovative and culturally relevant sneakers and apparel. Across all our consumer touchpoints, Foot Locker enables consumers to fulfill their desire to be part of sneaker and youth culture. We curate special product assortments and marketing content that supports our premium position, from leading global brands such as Nike, Jordan, adidas, and Puma, as well as new and emerging brands in the athletic and lifestyle space. We connect emotionally with our consumers through a combination of global brand events, highly targeted and personalized experiences in local markets, and through our social and digital channels. Foot Locker’s 1,588 stores are located in 28 countries including 747 in the United States, Puerto Rico, U.S. Virgin Islands, and Guam, 86 in Canada, 628 in Europe, a combined 94 in Australia and New Zealand, and 33 in Asia. Our domestic stores have an average of 3,200 selling square feet and our international stores have an average of 2,000 selling square feet.
Kids Foot Locker — Kids Foot Locker offers a large selection of premium brand-name athletic footwear, apparel, and accessories for children. Kids Foot Locker enables youth of all ages to participate in sneaker culture and helps their parents shop in a curated environment with only the best assortment in stores and online. We drive a sense of community in local markets through our newly-launched “House of Play” Community Store concept, which connects with kids, parents, and caregivers through the power of play, offering experiences and products that celebrate the wonder and fun of childhood. Of our 410 stores, 379 are located in the United States, and Puerto Rico, 16 in Europe, and 15 in Canada. These stores have an average of 1,900 selling square feet.
Champs Sports — Champs Sports is a primarily mall-based specialty athletic footwear and apparel retailer in North America focused on serving the “Active Athlete” segment that is highly connected to sport and inspired by what’s worn in the game and on the field. Champs Sports is our lead banner for apparel, driving more head-to-toe offerings for the consumer shopping for their performance and athleisure needs. Of our 486 stores, 454 are located in the United States, Puerto Rico, and the U.S. Virgin Islands and 32 in Canada. The Champs Sports stores have an average of 3,700 selling square feet.
Sidestep — We have announced our plan to wind down our Sidestep banner in 2023. We will close our 78 stores located in Germany, Netherlands, Spain, Belgium, and Luxembourg, with select stores converting to our Foot Locker banner. Sidestep stores have an average of 1,200 selling square feet.
WSS — Acquired in 2021, WSS is an athletic-inspired retailer focused on the large and rapidly growing Hispanic consumer demographic, operating a fleet of 115 off-mall stores in key markets across California, Texas, Arizona, and Nevada. WSS’s community-driven business benefits from deep relationships with customers. WSS stores have an average of 9,900 selling square feet.
atmos — Acquired in 2021, atmos is a digitally-led, culturally-connected global brand featuring premium sneakers and apparel, an exclusive in-house label, collaborative relationships with leading vendors in the sneaker ecosystem, experiential stores, and a robust omni-channel platform. atmos operates 32 stores in Japan and 3 stores in the United States, with an average of 1,100 selling square feet. The brand is also licensed to various entities across Asia.
Competition
The athletic footwear and apparel industry is highly competitive. We compete primarily with athletic footwear specialty stores, sporting goods stores, department stores, traditional shoe stores, mass merchandisers, and online retailers, some of which are our suppliers.
Merchandise Purchases
Financial information concerning merchandise purchases is contained under the “Liquidity” section in “Item 7. Management’s Discussion and Analysis of Financial Condition and Results of Operations” and under the “Business Risk” section in the Financial Instruments and Risk Management note in “Item 8. Consolidated Financial Statements and Supplementary Data.”
Human Capital
We had 15,200 full-time and 31,680 part-time employees as of January 28, 2023, and we consider employee relations to be satisfactory.
2022 Form 10-K Page 2
We believe the strength of our workforce is a significant contributor to our success as a global brand that leads with purpose. We seek to be a great place to work by cultivating and celebrating a culture that promotes diversity, inclusion, and belonging (DIBs). Our “Live Well. Work Well.” framework enables us to provide support and resources for a variety of needs to help our team members reach their fullest potential.
Our People Strategy includes actions surrounding “Uniting our Communities of Talent” around the world to achieve focus and drive results as a more agile and dynamic organization. By following our DIBs strategy as part of our people processes, we are able to attract, select, hire, grow, develop, promote, and retain valued team members with diverse backgrounds, perspectives, and experiences. We are relentless in creating a work environment that celebrates the differences that make us even stronger. We provide career growth and professional development through formal learning and on-the-job experiences to advance our team members’ capabilities, confidence, and contributions.
We offer competitive compensation (including salary, incentive bonus, and equity) and benefits packages to eligible employees in each of our locations around the globe. Our compensation program is designed to attract, retain, and reward talented individuals who possess the skills necessary to lead and support our business objectives, achieve our strategic goals, and create long-term value for our shareholders.
We are committed to engaging in environmental, social, and governance (ESG) initiatives that support our communities and help us develop trusted relationships with our stakeholders. Our ESG disclosure is available at investors.footlocker-inc.com/impactreport.
Available Information
We maintain a corporate website at www.footlocker.com/corp. Our filings with the U.S. Securities and Exchange Commission (the “SEC”), including our annual report on Form 10-K, quarterly reports on Form 10-Q, current reports on Form 8-K, and all amendments to those reports are available free of charge through this website as soon as reasonably practicable after they are filed with or furnished to the SEC. The Corporate Governance section of our corporate website contains our Corporate Governance Guidelines, Committee Charters, and the Code of Business Conduct for directors, officers, and employees, including the Chief Executive Officer, Chief Financial Officer, and Chief Accounting Officer. Copies of these documents may also be obtained free of charge upon written request to our Corporate Secretary at 330 West 34th Street, New York, NY 10001.
Item 1A. Risk Factors
Risks Related to Our Business and Industry
Our inability to implement our long-range strategic plan may adversely affect our future results.
Our ability to successfully implement and execute our long-range strategic plan is dependent on many factors. Our strategies may require significant capital investment and management attention. Additionally, any new initiative is subject to certain risks including customer acceptance of our products and renovated store designs, competition, product differentiation, the ability to attract and retain qualified personnel, and our ability to successfully integrate our acquisitions and implement technological initiatives. If we cannot successfully execute our strategic growth initiatives or if the long-range plan does not adequately address the challenges or opportunities we face, our financial condition and results of operations may be adversely affected. Additionally, failure to meet shareholder expectations, particularly with respect to sales, supplier diversification, cost-cutting programs, operating margins, and earnings per share, would likely result in volatility in the market value of our stock.
The retail athletic footwear and apparel business is highly competitive.
Our athletic footwear and apparel operations compete primarily with athletic footwear specialty stores, sporting goods stores, department stores, traditional shoe stores, mass merchandisers, and online retailers, as well as our merchandise vendor suppliers direct-to-customers channels. Although we sell an increasing proportion of our merchandise online, a significantly faster shift in customer buying patterns to purchasing athletic footwear, athletic apparel, and sporting goods online could have a material adverse effect on our business results. In addition, all of our significant suppliers operate retail stores and distribute products directly through the internet and others may follow. Should this continue to occur or accelerate, and if our customers decide to purchase directly from our suppliers, it could have a material adverse effect on our business, financial condition, and results of operations.
2022 Form 10-K Page 3
The principal competitive factors in our markets are selection of merchandise, customer experience, reputation, store location, advertising, and price. We cannot assure that we will continue to be able to compete successfully against existing or future competitors. Our expansion into markets served by our competitors, and entry of new competitors or expansion of existing competitors into our markets, could have a material adverse effect on our business, financial condition, and results of operations.
A change in the relationship with any of our key suppliers or the unavailability of key products at competitive prices could affect our financial health.
Our business is dependent to a significant degree upon our ability to obtain premium product and the ability to purchase brand-name merchandise at competitive prices from a limited number of suppliers. In addition, we have negotiated volume discounts, cooperative advertising, and markdown allowances with our suppliers, as well as the ability to cancel orders and return excess or unneeded merchandise. We cannot be certain that such terms with our suppliers will continue in the future.
We purchased 86% of our merchandise in 2022 from our top five suppliers and we expect to continue to obtain a significant percentage of our athletic product from these suppliers in future periods. Approximately 65% of all merchandise purchased in 2022 was purchased from one supplier — Nike, Inc. (“Nike”). Each of our banners are highly dependent on Nike. Individually, they purchased approximately 50% to 70% of their merchandise from Nike during the year. Merchandise that is high profile and in high demand is allocated by our suppliers based upon their own criteria. We cannot be certain that our suppliers will allocate sufficient amounts to us in the future or whether our suppliers will choose to further sell such merchandise through their own direct-to-customers channel.
Our inability to obtain merchandise in a timely manner from major suppliers as a result of business decisions by our suppliers, or any disruption in the supply chain, could have a material adverse effect on our business, financial condition, and results of operations. Because of the high proportion of purchases from Nike, any adverse development in Nike’s reputation, financial condition or results of operations, or the inability of Nike to develop and manufacture products that appeal to our target customers could also have an adverse effect on our business, financial condition, and results of operations. We cannot be certain that we will be able to acquire merchandise at competitive prices or on competitive terms in the future. These risks could have a material adverse effect on our business, financial condition, and results of operations.
The industry in which we operate is dependent upon fashion trends, customer preferences, product innovations, and other fashion-related factors.
The athletic footwear and apparel industry, especially at the premium end of the price spectrum, in which we operate, is subject to changing fashion trends and customer preferences. In addition, retailers in the athletic industry rely on their suppliers to maintain innovation in the products they develop. We cannot guarantee that our merchandise selection will accurately reflect customer preferences when it is offered for sale or that we will be able to identify and respond quickly to fashion changes, particularly given the long lead times for ordering much of our merchandise from suppliers. A substantial portion of our highest margin sales are to young males (ages 12–25), many of whom we believe purchase athletic footwear and athletic apparel as a fashion statement and are frequent purchasers. Our failure to anticipate, identify or react appropriately in a timely manner to changes in fashion trends that would make athletic footwear or athletic apparel less attractive to our customers could have a material adverse effect on our business, financial condition, and results of operations.
If we do not successfully manage our inventory levels, our operating results will be adversely affected.
We must maintain sufficient inventory levels to operate our business successfully. However, we also must guard against accumulating excess inventory. For example, we order most of our footwear four to six months prior to delivery to us. If we fail to anticipate accurately either the market for the merchandise or our customers’ purchasing habits, we may be forced to rely on markdowns or promotional sales to dispose of excess or slow-moving inventory, which could have a material adverse effect on our business, financial condition, and results of operations.
We are affected by mall traffic and our ability to secure suitable store locations, both in malls and off-malls.
Many of our stores, especially in North America where only 26% of our locations are off-mall, are located primarily in enclosed regional and neighborhood malls. Our sales are affected, in part, by the volume of mall traffic. Mall traffic may be adversely affected by, among other factors, economic downturns, the closing or continued decline of anchor department stores and/or specialty stores, and a decline in the popularity of mall shopping among our target customers.
2022 Form 10-K Page 4
Further, any terrorist act, natural disaster, public health issue, such as COVID-19, flu or other pandemics, or safety concern that decreases the level of mall traffic, or that affects our ability to open and operate stores in such locations, could have a material adverse effect on our business.
To take advantage of customer traffic and the shopping preferences of our customers, we need to maintain or acquire stores in desirable locations, such as in regional and neighborhood malls, as well as high-traffic urban retail areas and high streets. We cannot be certain that desirable locations will continue to be available at favorable rates. Some traditional enclosed malls are experiencing significantly lower levels of customer traffic, driven by economic conditions, public health issues, the closure of certain mall anchor tenants, and changes in customer shopping preferences, such as online shopping. Further, some malls have closed, and others may close in the future. While we seek to obtain suitable locations off-mall, there is no guarantee that we will be able to secure such locations.
Several large landlords dominate the ownership of prime malls and because of our dependence upon these landlords for a substantial number of our locations, any significant erosion of their financial condition or our relationships with them could negatively affect our ability to obtain and retain store locations. Additionally, further landlord consolidation may negatively affect our ability to negotiate favorable lease terms.
Our business could be materially harmed if we fail to adequately integrate the operations of the businesses we have acquired, or may acquire.
We have recently made, and may continue to make, acquisitions in the future based on available opportunities in the market. Acquisitions involve numerous inherent challenges, such as properly evaluating acquisition opportunities, properly evaluating risks and other diligence matters, ensuring adequate capital availability, and balancing other resource constraints. There are risks and uncertainties related to acquisitions, including difficulties integrating operations, personnel, and financial and other systems; unrealized sales expectations from the acquired business; unrealized synergies and cost savings; unknown or underestimated liabilities; diversion of management attention from running our existing businesses; and potential loss of key management or customers of the acquired business.
Our future growth may depend on our ability to expand operations in international markets.
Our future growth will depend, in part, on our ability to expand our business in additional international markets. As we expand into new international markets, we may have only limited experience in operating our business in such markets. In other instances, we may have to rely on the efforts and abilities of foreign business partners in such markets. In addition, business practices in these new international markets may be unlike those in the other markets we serve, and we may face increased exposure to certain risks. Our future growth may be materially adversely affected if we are unsuccessful in our international expansion efforts. Our inability to expand in international markets could have a material adverse effect on our business.
We may experience fluctuations in, and cyclicality of, our comparable-store sales results.
Our comparable-store sales have fluctuated significantly in the past, on both an annual and a quarterly basis, and we expect them to continue to fluctuate in the future. A variety of factors affect our comparable-store sales results, including, among others, fashion trends, product innovation, promotional events, the highly competitive retail sales environment, economic conditions, timing of income tax refunds, changes in our merchandise mix, calendar shifts of holiday periods, declines in foot traffic, supply chain disruptions, and weather conditions. Many of our products represent discretionary purchases. Accordingly, customer demand for these products could decline in an economic downturn or if our customers develop other priorities for their discretionary spending. These risks could have a material adverse effect on our business, financial condition, and results of operations.
The effects of natural disasters, terrorism, acts of war, acts of violence, and public health issues, such as COVID-19, may adversely affect our business.
Natural disasters, including earthquakes, hurricanes, floods, and tornadoes may affect store and distribution center operations. In addition, acts of terrorism, acts of war, and military action both in the United States and abroad can have a significant effect on economic conditions and may negatively affect our ability to purchase merchandise from suppliers for sale to our customers. Any act of violence, including active shooter situations and terrorist activities, that are targeted at or threatened against shopping malls, our stores, offices or distribution centers, could result in restricted access to our stores and/or store closures in the short-term and, in the long-term, may cause our customers and employees to avoid visiting our stores. The invasion of Ukraine by Russia and the retaliatory measures taken by the U.S., NATO, and other countries have created global security concerns and economic uncertainty that could have a lasting effect on regional and global economies.
2022 Form 10-K Page 5
Public health issues, such as COVID-19, flu, or other pandemics, whether occurring in the United States or abroad, could disrupt our operations and result in a significant part of our workforce being unable to operate or maintain our infrastructure or perform other tasks necessary to conduct our business. Additionally, public health issues may disrupt, or have an adverse effect on, our suppliers’ operations, our operations, our customers, or result in significantly lower traffic to or closure of our stores, or customer demand. Our ability to mitigate the adverse effect of these events depends, in part, upon the effectiveness of our disaster preparedness and response planning as well as business continuity planning. However, we cannot be certain that our plans will be adequate or implemented properly in the event of an actual disaster.
Any significant declines in public safety or uncertainties regarding future economic prospects that affect customer spending habits could have a material adverse effect on customer purchases of our products. We may be required to suspend operations in some or all of our locations and incur significant costs to remediate concerns which could have a material adverse effect on our business, financial condition, and results of operations.
Riots, vandalism, and other crimes and acts of violence may affect the markets in which we operate, our customers, delivery of our products and customer service, and could have a material adverse effect on our business, results of operations, or financial condition.
Our business may be adversely affected by instability, disruption, or destruction, regardless of cause, including riots, civil insurrection or social unrest, and manmade disasters or crimes. Such events may result in property damage and loss and may also cause customers to suspend their decisions to shop in our stores, interrupt our supply chain, and cause restrictions, postponements, and cancellations of events that attract large crowds and public gatherings, such as store marketing events. Additional risks and uncertainties not currently known to us or that we currently deem to be immaterial also may adversely affect our business, financial condition or operating results.
Risks Related to Technology, Data Security, and Privacy
We are subject to technology risks including failures, security breaches, and cybersecurity risks that could harm our business, damage our reputation, and increase our costs in an effort to protect against these risks.
Information technology is a critical part of our business operations. We depend on information systems to process transactions, analyze customer behaviors through our loyalty program, make operational decisions, manage inventory, operate our websites, purchase, sell and ship goods on a timely basis, and maintain cost-efficient operations. There is a risk that we could experience a business interruption, theft of information, or reputational damage as a result of a cyber-attack, such as an infiltration of a data center or data leakage of confidential information, either internally or through our third-party providers. In addition, cybersecurity researchers anticipate an increase in cyberattack activity in connection with the Russian invasion of Ukraine.
We may experience operational problems with our information systems as a result of system failures, system implementation issues, viruses, malicious hackers, sabotage, or other causes. We invest in security technology to protect the data stored by us, including our data and business processes, against the risk of data security breaches and cyber-attacks. Our data security management program includes enforcement of standard data protection policies such as Payment Card Industry compliance and other regulatory requirements. Additionally, we evaluate our major technology suppliers and any outsourced services through accepted security assessment measures. We maintain and routinely test backup systems and disaster recovery, along with external network security penetration testing by an independent third party as part of our business continuity preparedness.
While we believe that our security technology and processes follow appropriate practices in the prevention of security breaches and the mitigation of cybersecurity risks, given the ever-increasing abilities of those intent on breaching cybersecurity measures and given the necessity of our reliance on the security procedures of third-party vendors, the total security effort at any point in time may not be completely effective.
Failure of our systems, either internally or at our third-party providers, including failures due to cyber-attacks that would prevent the ability of systems to function as intended, could cause transaction errors, loss of customers and sales, and negative consequences to us, our employees, and those with whom we do business. A cyberattack on a communications network or power grid could cause operational disruption resulting in loss of revenues. Any security breach involving the misappropriation, loss, or other unauthorized disclosure of confidential information by us could also severely damage our reputation, expose us to the risks of litigation and liability, increase operating costs associated with remediation, and harm our business. While we carry insurance that would mitigate losses in connection with security breaches and cyber incidents, insurance may be insufficient to compensate us fully for potentially significant losses.
2022 Form 10-K Page 6
Risks associated with digital operations.
Our digital operations are subject to numerous risks, including risks related to the failure of the computer systems that operate our websites, mobile sites, and apps and their related support systems, computer viruses, cybersecurity risks, telecommunications or power failures, denial of service attacks, bot attacks, and similar disruptions. Also, to sustain, keep current, or grow our digital commerce business we will need to make additional investments. Risks related to digital commerce include those associated with credit card fraud, the need to keep pace with rapid technological change, governmental regulation, and legal uncertainties with respect to internet regulatory compliance. If any of these risks materialize, it could have a material adverse effect on our business.
Privacy and data security concerns and regulation could result in additional costs and liabilities.
The protection of customer, employee, and Company data is critical. The regulatory environment surrounding privacy is demanding, with the frequent imposition of new and changing requirements. In addition, customers appear increasingly to have a high expectation that we will adequately protect their personal information. Any actual or perceived misappropriation or breach involving this data could cause our customers to lose confidence in our ability to protect their data, which may cause them to potentially stop shopping with us or joining our loyalty program, attract negative media attention, cause harm to our reputation or result in liability (including but not limited to fines, penalties or lawsuits), any of which could have a material adverse effect on our business, operational results, financial position, and cash flows.
Regulatory scrutiny of privacy, user data protection, use of data and data collection is increasing on a global basis. We are subject to a number of privacy and similar laws and regulations in the countries in which we operate and these laws and regulations will likely continue to evolve over time.
The European Union (“E.U.”) adopted a comprehensive General Data Privacy Regulation (the “GDPR”), which requires companies to satisfy requirements regarding the handling of personal and sensitive data, including its use, protection, and the ability of persons whose data is stored to correct or delete data about themselves. Failure to comply with GDPR, including UK GDPR post-Brexit, requirements could result in penalties of up to 4% of worldwide revenue.
Data protection legislation and enforcement is also becoming increasingly common in the Asia Pacific region and in the United States at both the federal and state level. For example, the State of California enacted the California Consumer Privacy Act of 2018 (the “CCPA”), which became effective on January 1, 2020. The CCPA, among other things, requires companies that process information of California residents to make disclosures to consumers about their data collection, use and sharing practices, allows consumers to opt out of certain data sharing with third parties and provides a new cause of action for data breaches. Effective starting January 1, 2023, the California Privacy Rights Act (the “CPRA”) has revised and significantly expanded the scope of the CCPA. The CPRA, among other things, also creates a new California data protection agency authorized to implement and enforce the CCPA and the CPRA, which could result in increased privacy and information security enforcement. Connecticut, Utah, and Virginia have also enacted comprehensive consumer privacy laws, and other states may follow. Additionally, the Federal Trade Commission and many state attorneys general are interpreting federal and state consumer protection laws to impose standards for the online collection, use, dissemination and security of data. The burdens imposed by the CCPA, CPRA, and other similar laws that may be enacted at the federal and state level may require us to further modify our data processing practices and policies and to incur substantial expenditures in order to comply. The laws and regulations relating to privacy and data security are evolving, can be subject to significant change and may result in ever-increasing regulatory and public scrutiny and escalating levels of enforcement, sanctions, and private litigation.
The technology enablement of omni-channel in our business is complex.
We continue to invest in initiatives designed to deliver a high-quality, coordinated shopping experience online, in stores, and on mobile devices, which requires substantial investment in technology, information systems, and employee training, as well as significant management time and resources. Our omni-channel retailing efforts include the integration and implementation of new technology, software, and processes to be able to fulfill orders from any point within our system of stores and distribution centers, which is extremely complex and may not meet customer expectations for timely and accurate deliveries. These efforts involve substantial risk, including risk of implementation delays, cost overruns, technology interruptions, supply and distribution delays, and other issues that can affect the successful implementation and operation of our omni-channel initiatives. If our omni-channel initiatives are not successful we may not be able to provide a relevant shopping experience, or we may not realize the return on our omni-channel investments that we anticipate, our financial performance and future growth could be materially adversely affected.
2022 Form 10-K Page 7
Risks Related to our Operations and Supply Chain
Complications in our distribution centers and other factors affecting the distribution of merchandise may affect our business.
We operate multiple distribution centers worldwide, as well as third-party arrangements, to support our operations in the United States, Canada, England, Australia, New Zealand, and Asia.
If complications arise with any facility or third-party arrangements, or if any facility is severely damaged or destroyed, our other distribution centers may be unable to support the resulting additional distribution demands. We also may be affected by disruptions in the global transportation network caused by events including delays caused by port disruption, port strikes, weather conditions, work stoppages, or other labor unrest. These factors may adversely affect our ability to deliver inventory on a timely basis. We depend upon third-party carriers for shipment of merchandise. Any interruption in service by these carriers for any reason could cause disruptions in our business, a loss of sales and profits, and other material adverse effects.
Manufacturer compliance with our social compliance program requirements.
We require our independent manufacturers to comply with our policies and procedures, which cover many areas including human rights policy, labor, health and safety, and environmental standards. We monitor compliance with our policies and procedures using internal resources, as well as third-party monitoring firms. Although we monitor their compliance with these policies and procedures, we do not control the manufacturers or their practices. Any failure of our independent manufacturers to comply with our policies and procedures or local laws in the country of manufacture could disrupt the shipment of merchandise to us, force us to locate alternate manufacturing sources, reduce demand for our merchandise, or damage our reputation.
Our reliance on key management.
Future performance will depend upon our ability to attract, retain, and motivate our executive and senior management teams. Our future performance depends, to a significant extent, both upon the continued services of our current executive and senior management teams, as well as our ability to attract, hire, motivate, and retain additional qualified management in the future. We have succession plans in place and our Board of Directors reviews these succession plans. If our succession plans do not adequately cover significant and unanticipated turnover, the loss of the services of any of these individuals, or any resulting negative perceptions or reactions, could damage our reputation and our business.
Additionally, our success depends on the talents and abilities of our workforce in all areas of our business, especially personnel that can adapt to complexities and grow their skillset across the changing environment. Our ability to successfully execute our strategy depends on attracting, developing and retaining qualified talent with diverse sets of skills, especially functional and technology specialists that directly support our strategies.
Risks associated with attracting and retaining store and field team members.
Our success depends, in part, upon our ability to attract, develop, and retain a sufficient number of qualified store and field team members. The turnover rate in the retail industry is generally high. If we are unable to attract and retain quality team members, our ability to meet our growth goals or to sustain expected levels of profitability may be compromised.
We have experienced unusually low availability of workers, which we believe was primarily attributable to COVID-19 pandemic-related factors and in turn has created increased competition in labor markets. Our ability to meet our labor needs while controlling costs is subject to external factors such as unemployment levels, prevailing wage rates, minimum wage legislation, and overtime regulations.
Risks Related to our Investments
If our long-lived tangible assets and operating lease right-of-use assets, or goodwill become impaired, we may need to record significant non-cash impairment charges.
We review our long-lived tangible assets, operating lease right-of-use assets, and goodwill when events indicate that the carrying value of such assets may be impaired. Goodwill is reviewed for impairment if impairment indicators arise and, at a minimum, annually.
2022 Form 10-K Page 8
Goodwill is not amortized but is subject to an impairment test, which consists of either a qualitative assessment on a reporting unit level, or a quantitative impairment test, if necessary. The determination of impairment charges is significantly affected by estimates of future operating cash flows and estimates of fair value. Our estimates of future operating cash flows are identified from our long-range strategic plans, which are based upon our experience, knowledge, and expectations; however, these estimates can be affected by factors such as our future operating results, future store profitability, and future economic conditions, all of which are difficult to predict accurately. Any significant deterioration in macroeconomic conditions could affect the fair value of our long-lived assets, operating lease right-of-use assets, and goodwill and could result in future impairment charges, which would adversely affect our results of operations.
We do not have the ability to exert control over our minority investments, and therefore, we are dependent on others in order to realize their potential benefits.
At January 28, 2023 we hold $630 million of non-controlling minority investments in various entities and we may make additional strategic minority investments in the future. Such minority investments inherently involve a lesser degree of control over business operations, thereby potentially increasing the financial, legal, operational, and compliance risks associated with the investments. Other investors in these entities may have business goals and interests that are not aligned with ours or may exercise their rights in a manner in which we do not approve. These circumstances could lead to delayed decisions or disputes and litigation with those other investors, all of which could have a material adverse impact on our reputation, business, financial condition, and results of operations.
If our investees seek additional financing to fund their growth strategies, these financing transactions may result in further dilution of our ownership stakes and these transactions may occur at lower valuations than the investment transactions through which we acquired such interests, which could significantly decrease the fair values of our investments in those entities. Additionally, if our investees are unable to obtain additional financing, those entities could need to significantly reduce their spending in order to fund their operations or result in their insolvency. These actions likely would result in reduced growth forecasts, which also could significantly decrease the fair values of our investments in those entities.
Risks Related to Internal Controls, Shareholder Activism, Geopolitics, Regulations, and Other External Risks
We have identified a material weakness in our internal control over financial reporting, and if we are unable to improve our internal controls, our financial results may not be accurately reported.
As disclosed in Item 9A, “Controls and Procedures,” we identified a material weakness in our control over financial reporting related to our newly acquired WSS business. The material weakness did not result in any identified misstatements to the financial statements, and there were no changes to previously issued financial results. We are actively engaged in developing a remediation plan designed to address this material weakness; however, we cannot guarantee that these steps will be sufficient or that we will not have a material weakness in the future. This material weakness, or difficulties encountered in implementing new or improved controls or remediation, could prevent us from accurately reporting our financial results, result in material misstatements in our financial statements or cause us to fail to meet our reporting obligations. Failure to comply with Section 404 of the Sarbanes-Oxley Act of 2002 could negatively affect our business, the price of our common stock and market confidence in our reported financial information.
We may face risks associated with shareholder activism.
Publicly-traded companies are subject to campaigns by shareholders advocating corporate actions related to matters such as corporate governance, operational practices, and strategic direction. We may become subject in the future to such shareholder activity and demands. Such activities could interfere with our ability to execute our business plans, be costly and time-consuming, disrupt our operations, and divert the attention of management, any of which could have an adverse effect on our business or stock price.
Economic or political conditions in other countries, including fluctuations in foreign currency exchange rates and tax rates may adversely affect our operations.
A significant portion of our sales and operating income for 2022 was attributable to our operations outside of the United States. As a result, our business is subject to the risks associated with doing business outside of the United States such as local customer product preferences, political unrest, disruptions or delays in shipments, changes in economic conditions in countries in which we operate, foreign currency fluctuations, real estate costs, and labor and employment practices in non-U.S. jurisdictions that may differ significantly from those that prevail in the United States.
2022 Form 10-K Page 9
In addition, because our suppliers manufacture a substantial amount of our products in foreign countries, our ability to obtain sufficient quantities of merchandise on favorable terms may be affected by governmental regulations, trade restrictions, labor, and other conditions in the countries from which our suppliers obtain their product.
Fluctuations in the value of the euro and the British Pound may affect the value of our European earnings when translated into U.S. dollars. Similarly, our earnings in other jurisdictions may be affected by the value of currencies when translated into U.S. dollars. Except for our business in the United Kingdom (the “U.K.”), our international subsidiaries conduct most of their business in their local currency. Inventory purchases for our U.K. business are generally denominated in euros, which could result in foreign currency transaction gains or losses.
Our products are subject to import and excise duties and/or sales or value-added taxes in many jurisdictions. Fluctuations in tax rates and duties and changes in tax legislation or regulation could have a material adverse effect on our results of operations and financial condition.
Our stock price may be volatile, and the value of our common stock has declined and may continue to decline.
The market price of our common stock may be highly volatile and may fluctuate or decline substantially as a result of a variety of factors, some of which are beyond our control, including without limitation:
| • | a change in the relationship with any of our key suppliers or the unavailability of key products at competitive prices; |
| • | actual or anticipated fluctuations in our financial condition or results of operations; |
| • | variance in our financial performance from expectations of securities analysts and securities analysts may issue unfavorable research about us; |
| • | changes in our projected operating and financial results; |
| • | announcements by us or our competitors of significant business developments, acquisitions, or new offerings; |
| • | significant data breaches; |
| • | material litigation; |
| • | future sales of our common stock by us or our shareholders, or the perception that such sales may occur; |
| • | changes in senior management or key personnel; |
| • | the trading volume of our common stock; |
| • | changes in the anticipated future size and growth rate of our market; and |
| • | general macroeconomic, geopolitical, and market conditions beyond our control. |
Broad market and industry fluctuations, as well as general economic, political, regulatory, and market conditions, such as recessions, interest rate changes, or international currency fluctuations, may also negatively affect the market price of our common stock. In the past, companies that have experienced volatility in the market price of their securities have been subject to securities class action litigation. We may be the target of this type of litigation in the future, which could result in substantial expenses and divert our management’s attention.
Macroeconomic developments may adversely affect our business.
Our performance is subject to global economic conditions and the related effects on consumer spending levels. Continued uncertainty about global economic conditions, including the COVID-19 pandemic, poses a risk as consumers and businesses may postpone spending in response to tighter credit, unemployment, negative financial news, and/or declines in income or asset values, which could have a material negative effect on demand for our products. The invasion of Ukraine by Russia has created global security concerns and economic uncertainty.
As a retailer that is dependent upon consumer discretionary spending, our results of operations are sensitive to changes in macroeconomic conditions. Our customers may have less money for discretionary purchases as a result of job losses, foreclosures, bankruptcies, increased fuel and energy costs, higher interest rates, higher taxes, reduced access to credit, and lower home values. These and other economic factors could adversely affect demand for our products, which could adversely affect our financial condition and operating results.
2022 Form 10-K Page 10
Significant developments stemming from the U.K.’s withdrawal from the E.U. could have a material adverse effect on the Company.
The U.K. formally exited the European Union on January 31, 2020 (commonly referred to as “Brexit”) and entered into a new trade agreement with the European Union on December 24, 2020. Despite the U.K.’s December 2020 trade agreement, many potential future effects of Brexit remain unclear and could adversely affect certain areas of our business, including, but not limited to, an increase in duties and delays in the delivery of products, and adverse effects to our suppliers.
We have significant operations in both the U.K. and the E.U., and we are highly dependent on the free flow of labor and goods in those regions. In response to Brexit, in February 2020 we engaged with a third-party logistics provider within England to mitigate supply chain risks. Uncertainty surrounding Brexit could cause a slowdown in economic activity in the U.K., Europe or globally, which could adversely affect our operating results and growth prospects. In addition, Brexit could lead to legal uncertainty and potentially divergent national laws and regulations as the U.K. determines which E.U. laws to replace or replicate, including data protection regulation. Compliance with any new laws and regulations may be cumbersome, difficult, or costly.
There remains substantial uncertainty surrounding the ultimate effect of Brexit and outcomes could disrupt the markets we serve and the tax jurisdictions in which we operate. This uncertainty creates challenges (particularly in the near term) with respect to trading relationships between our U.K. subsidiary and other E.U. nations. These possible effects of Brexit could adversely affect our business, results of operations, and financial condition.
Imposition of tariffs and export controls on the products we buy may have a material adverse effect on our business.
A significant portion of the products that we purchase, including the portion purchased from U.S.-based suppliers, as well as most of our private brand merchandise, is manufactured abroad. We may be affected by potential changes in international trade agreements or tariffs, such as new tariffs imposed on certain Chinese-made goods imported into the U.S. Furthermore, China or other countries may institute retaliatory trade measures in response to existing or future tariffs imposed by the U.S. that could have a negative effect on our business. If any of these events occur as described, we may be obligated to seek alternative suppliers for our private brand merchandise, raise prices, or make changes to our operations, any of which could have a material adverse effect on our sales and profitability, results of operations, and financial condition.
Increasing inflation could adversely affect our business, financial condition, results of operations, or cash flows.
Inflation, as well as some of the measures taken by or that may be taken by the governments in countries where we operate in an attempt to curb inflation, may have negative effects on the economies of those countries generally. If the United States or other countries where we operate experience substantial inflation in the future, our business may be adversely affected. Fewer customers may shop as these purchases may be seen as discretionary, and those who do shop may limit the amount of their purchases. Any reduced demand or changes in customer purchasing behavior may lead to lower sales, higher markdowns and an overly promotional environment or increased marketing and promotional spending. This could have a material adverse effect on our business, financial condition, results of operations, or cash flows.
Instability in the financial markets may adversely affect our business.
The global macroeconomic environment could be negatively affected by, among other things, instability in global economic markets, disruptions to the banking system and financial market volatility resulting from bank failures, increased U.S. trade tariffs and trade disputes with other countries, instability in the global credit markets, supply chain weaknesses, instability in the geopolitical environment as a result of Brexit, the Russian invasion of the Ukraine and other political tensions, and foreign governmental debt concerns. Such challenges have caused, and may continue to cause, uncertainty and instability in local economies and in global financial markets.
The phase out of LIBOR could cause market volatility or disruption and may adversely affect our access to the capital markets and cost of funding. The Federal Reserve Board adopted a final rule in December 2022 that replaces LIBOR in certain financial contracts after June 30, 2023. Our revolving credit agreement provides for alternative methods of calculating the interest rate payable on indebtedness thereunder.
2022 Form 10-K Page 11
This volatility may affect our future access to the credit and debt security markets, leading to higher borrowing costs, or, in some cases, the inability to obtain additional financing. Although we currently have a revolving credit agreement in place until July 14, 2025, tightening of credit markets could make it more difficult for us to access funds, refinance our existing indebtedness, enter into agreements for new indebtedness, or obtain funding through the issuance of the Company’s securities.
Material changes in the market value of the securities we hold may adversely affect our results of operations and financial condition.
At January 28, 2023 our cash and cash equivalents totaled $536 million. The majority of our investments were short-term deposits in highly-rated banking institutions. We regularly monitor our counterparty credit risk and mitigate our exposure by making short-term investments only in highly-rated institutions and by limiting the amount we invest in any one institution. We continually monitor the creditworthiness of our counterparties. At January 28, 2023, all investments were in investment grade institutions. Despite an investment grade rating, it is possible that the value or liquidity of our investments may decline due to any number of factors, including general market conditions and bank-specific credit issues.
Our U.S. pension plan trust holds assets totaling $509 million at January 28, 2023. The fair values of these assets held in the trust are compared to the plan’s projected benefit obligation to determine the pension funding liability. We attempt to mitigate funding risk through asset diversification, and we regularly monitor investment risk of our portfolio through quarterly investment portfolio reviews and periodic asset and liability studies. Despite these measures, it is possible that the value of our portfolio may decline in the future due to any number of factors, including general market conditions and credit issues. Such declines could affect the funded status of our pension plan and future funding requirements.
Our financial results may be adversely affected by tax rates or exposure to additional tax liabilities.
We are a U.S.-based multinational company subject to tax in multiple U.S. and foreign tax jurisdictions. Our provision for income taxes is based on a jurisdictional mix of earnings, statutory rates, and enacted tax rules, including transfer pricing. Significant judgment is required in determining our provision for income taxes and in evaluating our tax positions on a worldwide basis. Our effective tax rate could be adversely affected by a number of factors, including shifts in the mix of pretax results by tax jurisdiction, changes in tax laws or related interpretations in the jurisdictions in which we operate, and tax assessments and related interest and penalties resulting from income tax audits. Further, many countries continue to consider changes in their tax laws by implementing new taxes such as the digital service tax and initiatives such as the Organization for Economic Co-operation and Development’s Pillar II global minimum tax. Various countries are in the process of incorporating the Pillar II framework within their tax laws.
Changes in employment laws or regulation could harm our performance.
Various foreign and domestic labor laws govern our relationship with our employees and affect our operating costs. These laws include, but are not limited to, minimum wage requirements, overtime, sick, and premium pay, paid time off, work scheduling, healthcare reform and the Patient Protection and Affordable Care Act, and the Protecting the Right to Organize Act, unemployment tax rates, workers’ compensation rates, European works council requirements, and union organization.
A number of factors could adversely affect our operating results, including additional government-imposed increases in minimum wages, overtime, sick, and premium pay, paid leaves of absence, mandated health benefits, and changing regulations from the National Labor Relations Board or other agencies. Complying with any new legislation or interpretation of law, or reversing changes implemented under existing law could be time-intensive and expensive and may affect our business.
Legislative or regulatory initiatives related to climate change concerns may negatively affect our business.
Greenhouse gases may have an adverse effect on global temperatures, weather patterns, and the frequency and severity of extreme weather and natural disasters. Global climate change could result in certain types of natural disasters occurring more frequently or with more intense effects. Such events could make it difficult or impossible for us to deliver products to our customers, create delays, and inefficiencies in our supply chain. Following an interruption to our business, we could require substantial recovery time, experience significant expenditures to resume operations, and lose significant sales. Concern over climate change may result in new or additional legal, legislative, regulatory, and compliance requirements to reduce or mitigate the effects of climate change on the environment, which could result in future tax, transportation, and utility increases, which could adversely affect our business.
2022 Form 10-K Page 12
There is also increased focus, including by investors, customers, and other stakeholders, on these and other sustainability matters, such as worker safety, the use of plastic, energy consumption, and waste.
We face reputational, regulatory, human capital, and business development risks from a perceived or actual failure to effectively manage our material ESG risks and opportunities.
Our reputation could be damaged if we do not, or are perceived to not, act responsibly with respect to ESG matters, which could adversely affect our business, results of operations, cash flows, and financial condition. Our global ESG program is focused on the following four pillars through which we believe we may significantly impact our stakeholders, or which may pose a material risk or opportunity for our business: (1) Leveraging the Power of Our People and Communities, (2) Strengthening the Sustainability of Our Supply Chain, (3) Managing and Reducing Our Environmental Impacts, and (4) Operating Ethically and Transparently. These focus areas could prove to be the wrong focus areas, or not the most material focus areas, for our business.
In light of increasing regulatory, customer, team member, investor, and societal scrutiny of businesses’ management of material ESG issues, we may face a number of related risks, including making insufficient progress on or failing to identify all material ESG issues, resulting in potentially significant negative impacts on our stakeholders and related reputational harm; being perceived as having a superficial commitment to ESG without meaningfully addressing stakeholder impacts, risks, and opportunities, thereby potentially reducing important stakeholders’ willingness to be associated with, do business with, or be employed by us; an inability to control or avoid stakeholders politicizing our ESG positions, causing potential reputational harm among segments of our important stakeholders; or failing to comply with rapidly developing regulation on ESG in various jurisdictions, which may compromise our credibility, cause reputational harm, or lead to legal proceedings against us.
Increasing attention to ESG matters may also cause certain institutional investors to be discouraged from investing in us. Investor advocacy groups, certain institutional investors, investment funds, and other influential investors are also increasingly focused on ESG practices and, in recent years, have placed increasing importance on the implications and social cost of their investments. Regardless of the industry, investors’ increased focus and activism related to ESG and similar matters may hinder access to capital, as investors may decide to reallocate capital or to not commit capital as a result of their assessment of a company’s ESG practices. Companies which do not adapt to or comply with investor or stakeholder expectations and standards, which are evolving, or which are perceived to have not responded appropriately to the growing concern for ESG issues, regardless of whether there is a legal requirement to do so, may suffer from reputational damage, and the business, financial condition, and/or stock price of such a company could be materially and adversely affected. In addition, the importance of ESG scoring evaluations is becoming more broadly accepted by shareholders. Certain organizations have developed scores and ratings to evaluate companies based upon certain ESG metrics. Many shareholders focus on positive ESG business practices and scores when making investments and may consider a company’s score as a reputational or other factor in making an investment decision.
In addition, certain investors, particularly institutional investors, use these scores to benchmark companies against their peers and if a company is perceived as lagging, these investors may engage with companies to require improved ESG disclosure or performance. We may face reputational damage in the event our ESG procedures or standards do not meet the standards set by various constituencies. A low score could result in a negative perception of us, or exclusion of our common stock from consideration by certain investors. In addition, the cost of compliance to receive high ESG scores may be considerable.
We may be adversely affected by regulatory and litigation developments.
We are exposed to the risk that federal or state legislation may negatively affect our operations. Changes in federal or state wage requirements, employee rights, health care, social welfare or entitlement programs, including health insurance, paid leave programs, or other changes in workplace regulation could increase our cost of doing business or otherwise adversely affect our operations. Additionally, we are regularly involved in litigation, including commercial, tort, intellectual property, customer, employment, wage and hour, data privacy, anti-corruption, and other claims, including purported class action lawsuits. The cost of defending against these types of claims against us or the ultimate resolution of such claims, whether by settlement, mediation, arbitration, or adverse court or agency decision, may harm our business.
2022 Form 10-K Page 13
We operate in many different jurisdictions and we could be adversely affected by violations of the U.S. Foreign Corrupt Practices Act and similar worldwide anti-corruption laws.
The U.S. Foreign Corrupt Practices Act (“FCPA”) and similar worldwide anti-corruption laws, including the U.K. Bribery Act of 2010, which is broader in scope than the FCPA, generally prohibit companies and their intermediaries from making improper payments to government officials for the purpose of obtaining or retaining business. Our internal policies mandate compliance with these anti-corruption laws. Despite our training and compliance programs, we cannot be assured that our internal control policies and procedures will always protect us from reckless or criminal acts committed by our employees or agents. Our continued expansion outside the United States, including in developing countries, could increase the risk of FCPA violations in the future. Violations of these laws, or allegations of such violations, could have a material adverse effect on our results of operations or financial condition.
International intellectual property protection can be uncertain and costly.
Uncertainty in intellectual property protection can result from conducting business outside the United States, particularly in jurisdictions that do not have comparable levels of protection for our assets such as intellectual property, copyrights, and trademarks. Continuing to operate in such foreign jurisdictions where the ability to enforce intellectual property rights is limited increases our exposure to risk.
Risks Related to our Indebtedness and our Credit Facility
Our debt may cause an adverse effect on our business.
During 2021, we completed the sale of $400 million of 4% Senior Notes due 2029. Our inability to generate sufficient cash flow to satisfy our debt obligations or to refinance our debt obligations could adversely affect our business, financial condition, results of operations, and other corporate requirements. This could require us to direct a substantial portion of our future cash flow toward payments on our indebtedness, which would reduce the amount of cash flow available to fund working capital, capital expenditures, and other corporate requirements, thereby limiting our ability to respond to business opportunities.
We may be unable to draw on our credit facility in the future.
Borrowings and letters of credit under our credit facility are not permitted to exceed a borrowing base, which is tied to our level of inventory. Therefore, reductions in the value of our inventory would result in a reduction in our borrowing base, which would reduce the amount of financial resources available to meet our operating requirements. Also, if we do not comply with our financial covenants and we do not obtain a waiver or amendment from our lenders, the lenders may elect to cause any amounts then owed to become immediately due and payable, or they may decline to renew our credit facility. In that event, we would seek to establish a replacement credit facility with one or more other lenders, including lenders with which we have an existing relationship, potentially on less desirable terms. There can be no guarantee that replacement financing would be available at commercially reasonable terms, if at all.
Item 1B. Unresolved Staff Comments
None
Item 2. Properties
Our properties consist of land, leased stores, administrative facilities, and distribution centers. Gross square footage and total selling area for our store locations at the end of 2022 were approximately 13.15 and 7.92 million square feet, respectively. These properties, which are primarily leased, are located in the United States and its territories, Canada, various European countries, Asia, Australia, and New Zealand.
As of January 28, 2023, we operated eight distribution centers, of which two are owned and six are leased, occupying an aggregate of 3.85 million square feet. Six of these distribution centers are in the United States, one in Canada, and one in the Netherlands. Additionally, we utilize the services of third-party providers for our operations in the U.K., Australia, New Zealand, and Asia. In connection with the closure of the Eastbay business, its distribution center will be closed in early 2023. We also own a manufacturing facility and operate a leased warehouse in the United States, which support our Team Edition apparel business.
We believe that all leases of properties that are material to our operations may be renewed, or that alternative properties are available, on terms similar to existing leases.
2022 Form 10-K Page 14
Item 3. Legal Proceedings
Information regarding the Company’s legal proceedings is contained in the Legal Proceedings note under “Item 8. Consolidated Financial Statements and Supplementary Data.”
Item 4. Mine Safety Disclosures
Not applicable.
Item 4A. Information about our Executive Officers
The following table provides information with respect to all persons serving as executive officers as of March 27, 2023, including business experience for the last five years.
Name |
Position |
Age |
Executive Officer Since |
Mary N. Dillon |
Chief Executive Officer since September 2022. Previously, Ms. Dillon served as Chief Executive Officer of Ulta Beauty, Inc. from July 2013 through June 2021. |
61 |
2022 |
Franklin R. Bracken |
Executive Vice President and Chief Commercial Officer since December 2022. Previously, he served as Executive Vice President and Chief Operating Officer from November 2021 through December 2022, Executive Vice President and Chief Executive Officer — North America from July 2020 through November 2021, Senior Vice President and General Manager Foot Locker U.S., Lady Foot Locker, and Kids Foot Locker from October 2017 through July 2020, and Vice President General Manager of Foot Locker Canada from February 2016 through October 2017. |
50 |
2021 |
Sheilagh M. Clarke |
Executive Vice President, General Counsel and Secretary since March 2022. Previously, she served as Senior Vice President, General Counsel and Secretary from June 2014 through March 2022. |
63 |
2014 |
Rosalind Reeves |
Executive Vice President and Chief Human Resource Officer since December 2022. Previously, she served as Vice President, Talent, Diversity & Organizational Capability from December 2021 through December 2022, and Vice President, Field Human Resources from July 2020 through December 2021. From March 2020 through July 2020, she was a founding partner of AgileHR Services. Prior to this, she served as VP, Employment Practice and Compliance of AMC Theaters from January 2019 through August 2019 and Vice President, Benefits and Employment Practices from January 2017 through December 2018. |
55 |
2022 |
Elliott D. Rodgers |
Executive Vice President and Chief Operations Officer since December 2022. Previously, Mr. Rodgers served as Chief People Officer for Project 44 from October 2021 through November 2022. He served various roles at Ulta Beauty, Inc., including Chief Information Officer from September 2020 through October 2021, Chief Supply Chain Officer from April 2019 to September 2020, and Senior Vice President, Supply Chain from March 2017 through March 2019. |
47 |
2022 |
Robert Higginbotham |
Mr. Higginbotham is the interim Chief Financial Officer, effective March 1, 2023. Mr. Higginbotham has served as Senior Vice President, Investor Relations and Financial Planning & Analysis since December 2022. Previously, Mr. Higginbotham served as Vice President, Investor Relations from January 2022 through November 2022. Prior to joining the Company, Mr. Higginbotham served as an Analyst at Guidepoint Global, LLC from January 2020 through January 2022, and Senior Analyst and Co-Portfolio Manager at BTG Pactual S.A. from August 2015 through October 2018. |
46 |
2023 |
Giovanna Cipriano |
Senior Vice President and Chief Accounting Officer since May 2009. |
53 |
2009 |
There are no family relationships among the executive officers or directors of the Company.
2022 Form 10-K Page 15
PART II
Item 5. |
Market for the Company’s Common Equity, Related Shareholder Matters, and Issuer Purchases of Equity Securities |
Foot Locker, Inc. common stock (ticker symbol “FL”) is listed on the New York Stock Exchange as well as on the Börse Stuttgart stock exchange in Germany. As of January 28, 2023, we had 9,183 shareholders of record owning 93,393,339 common shares.
We declared dividends of $0.40 per share in the first, second, third, and fourth quarters of 2022. On February 25, 2023, the Board of Directors declared a quarterly dividend of $0.40 per share to be paid on April 28, 2023. The Board of Directors regularly reviews the dividend policy and rate, taking into consideration the overall financial and strategic outlook for our earnings, liquidity, and cash flow.
The following table is a summary of our fourth quarter share repurchases:
|
|
|
|
|
|
|
Total Number of |
|
|
Dollar Value of |
|
|
Total |
|
Average |
|
Shares Purchased as |
|
|
Shares that may |
|
|
|
Number |
|
Price |
|
Part of Publicly |
|
|
yet be Purchased |
|
|
|
of Shares |
|
Paid Per |
|
Announced |
|
|
Under the |
|
Date Purchased |
|
Purchased (1) |
|
Share (1) |
|
Program (2) |
|
|
Program (2) |
|
October 30 to November 26, 2022 |
|
229 |
|
$ |
31.41 |
|
— |
|
$ |
1,103,814,042 |
November 27 to December 31, 2022 |
|
— |
|
|
— |
|
— |
|
|
1,103,814,042 |
January 1 to January 28, 2023 |
|
1,489 |
|
|
38.92 |
|
— |
|
|
1,103,814,042 |
|
|
1,718 |
|
$ |
37.92 |
|
— |
|
|
|
| (1) | These columns reflect shares acquired in satisfaction of the tax withholding obligation of holders of restricted stock awards, which vested during the quarter. The calculation of the average price paid per share includes all fees, commissions, and other costs associated with the repurchase of such shares. |
| (2) | On February 24, 2022, the Board of Directors approved a share repurchase program authorizing the Company to repurchase up to $1.2 billion of its common stock replacing the prior authorization. The new share repurchase program does not have an expiration date. |
Performance Graph
The graph below compares the cumulative five-year total return to shareholders (common stock price appreciation plus dividends, on a reinvested basis) of our common stock relative to the total returns of the S&P 400 Specialty Retailing Index and the Russell Midcap Index.
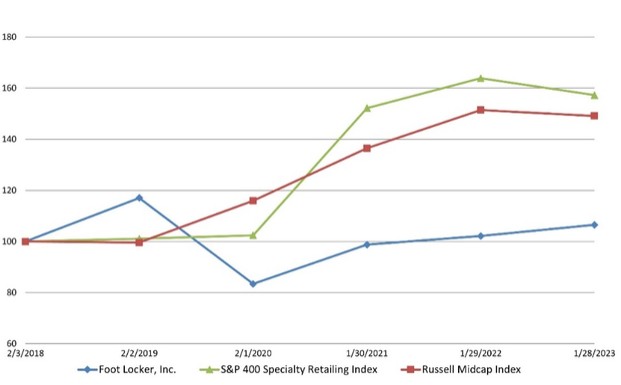
|
|
2/3/2018 |
|
2/2/2019 |
|
2/1/2020 |
|
1/30/2021 |
|
1/29/2022 |
|
1/28/2023 |
||||||
Foot Locker, Inc. |
|
$ |
100.00 |
|
$ |
117.01 |
|
$ |
83.41 |
|
$ |
98.73 |
|
$ |
102.13 |
|
$ |
106.51 |
S&P 400 Specialty Retailing Index |
|
$ |
100.00 |
|
$ |
101.07 |
|
$ |
102.43 |
|
$ |
152.18 |
|
$ |
163.86 |
|
$ |
157.26 |
Russell Midcap Index |
|
$ |
100.00 |
|
$ |
99.59 |
|
$ |
115.89 |
|
$ |
136.44 |
|
$ |
151.42 |
|
$ |
149.11 |
The above information should not be deemed “soliciting material” or to be filed with the SEC, nor shall such information be incorporated by reference into any future filing under the Securities Act of 1933 or Securities Exchange Act of 1934, each as amended, except to the extent that we specifically incorporate it by reference into such filing.
2022 Form 10-K Page 16
Item 6. Selected Financial Data
FIVE-YEAR SUMMARY OF SELECTED FINANCIAL DATA
The selected financial data below should be read in conjunction with the Consolidated Financial Statements and the Notes thereto and other information contained elsewhere in this report.
($ in millions, except per share amounts) |
|
|
2022 |
|
2021 |
|
2020 |
|
2019 |
|
2018 |
Summary of Operations |
|
|
|
|
|
|
|
|
|
|
|
Sales |
|
$ |
8,747 |
|
8,958 |
|
7,548 |
|
8,005 |
|
7,939 |
Licensing revenue |
|
|
12 |
|
10 |
|
6 |
|
8 |
|
6 |
Gross margin |
|
|
2,792 |
|
3,080 |
|
2,183 |
|
2,543 |
|
2,528 |
Selling, general and administrative expenses |
|
|
1,903 |
|
1,851 |
|
1,587 |
|
1,650 |
|
1,614 |
Depreciation and amortization |
|
|
208 |
|
197 |
|
176 |
|
179 |
|
178 |
Impairment and other |
|
|
112 |
|
172 |
|
117 |
|
65 |
|
37 |
Interest (expense) income, net |
|
|
(15) |
|
(14) |
|
(7) |
|
11 |
|
9 |
Other income / (expense), net |
|
|
(42) |
|
384 |
|
192 |
|
4 |
|
(1) |
Net income attributable to Foot Locker, Inc. |
|
|
342 |
|
893 |
|
323 |
|
491 |
|
541 |
Per Common Share Data |
|
|
|
|
|
|
|
|
|
|
|
Basic earnings |
|
$ |
3.62 |
|
8.72 |
|
3.10 |
|
4.52 |
|
4.68 |
Diluted earnings |
|
$ |
3.58 |
|
8.61 |
|
3.08 |
|
4.50 |
|
4.66 |
Common stock dividends declared per share |
|
$ |
1.60 |
|
1.00 |
|
0.70 |
|
1.52 |
|
1.38 |
Weighted-average Common Shares Outstanding |
|
|
|
|
|
|
|
|
|
|
|
Basic earnings |
|
|
94.3 |
|
102.5 |
|
104.3 |
|
108.7 |
|
115.6 |
Diluted earnings |
|
|
95.5 |
|
103.8 |
|
105.1 |
|
109.1 |
|
116.1 |
Financial Condition |
|
|
|
|
|
|
|
|
|
|
|
Cash and cash equivalents |
|
$ |
536 |
|
804 |
|
1,680 |
|
907 |
|
891 |
Merchandise inventories |
|
|
1,643 |
|
1,266 |
|
923 |
|
1,208 |
|
1,269 |
Property and equipment, net |
|
|
920 |
|
917 |
|
788 |
|
824 |
|
836 |
Total assets |
|
|
7,907 |
|
8,135 |
|
7,043 |
|
6,589 |
|
3,820 |
Long-term debt and obligations under capital leases |
|
|
452 |
|
457 |
|
110 |
|
122 |
|
124 |
Total shareholders’ equity |
|
|
3,293 |
|
3,243 |
|
2,776 |
|
2,473 |
|
2,506 |
Financial Ratios |
|
|
|
|
|
|
|
|
|
|
|
Sales per average gross square foot (1) |
|
$ |
548 |
|
540 |
|
417 |
|
510 |
|
504 |
SG&A as a percentage of sales |
|
|
21.8 |
% |
20.7 |
|
21.0 |
|
20.6 |
|
20.3 |
Net income margin |
|
|
3.9 |
% |
10.0 |
|
4.3 |
|
6.1 |
|
6.8 |
Adjusted net income margin (2) |
|
|
5.4 |
% |
8.4 |
|
3.9 |
|
6.7 |
|
6.9 |
Earnings before interest and taxes (EBIT) (2) |
|
$ |
539 |
|
1,254 |
|
501 |
|
661 |
|
704 |
EBIT margin (2) |
|
|
6.2 |
% |
14.0 |
|
6.6 |
|
8.3 |
|
8.9 |
Adjusted EBIT (2) |
|
$ |
692 |
|
1,049 |
|
428 |
|
722 |
|
741 |
Adjusted EBIT margin (2) |
|
|
7.9 |
% |
11.7 |
|
5.7 |
|
9.0 |
|
9.3 |
Return on assets (ROA) |
|
|
4.3 |
% |
11.8 |
|
4.7 |
|
9.4 |
|
13.9 |
Return on invested capital (ROIC) (2) |
|
|
9.2 |
% |
16.4 |
|
8.6 |
|
12.5 |
|
12.0 |
Current ratio |
|
|
1.6 |
|
1.4 |
|
1.7 |
|
2.0 |
|
3.3 |
Other Data |
|
|
|
|
|
|
|
|
|
|
|
Capital expenditures |
|
$ |
285 |
|
209 |
|
159 |
|
187 |
|
187 |
Number of stores at year end |
|
|
2,714 |
|
2,858 |
|
2,998 |
|
3,129 |
|
3,221 |
Total selling square footage at year end (in millions) |
|
|
7.92 |
|
7.91 |
|
7.50 |
|
7.57 |
|
7.63 |
Total gross square footage at year end (in millions) |
|
|
13.15 |
|
13.28 |
|
12.98 |
|
13.15 |
|
13.24 |
| (1) | Calculated as store sales divided by the average monthly ending gross square footage of the last thirteen months. The computation for each of the years presented reflects the foreign exchange rate in effect for such year. |
| (2) | These represent non-GAAP measures, see Item 7, “Management’s Discussion and Analysis of Financial Condition and Results of Operations” for additional information and calculation. |
2022 Form 10-K Page 17
Item 7. Management’s Discussion and Analysis of Financial Condition and Results of Operations
This section of the Annual Report on Form 10-K generally discusses 2022 and 2021 detail and year-over-year comparisons between these years. For a comparison of our results for 2021 to our results of 2020 and other financial information related to 2020, refer to our Annual Report on Form 10-K for the year ended January 29, 2022 filed with the SEC on March 24, 2022.
Our Business
Foot Locker, Inc. is a leading specialty retailer operating 2,714 stores in 29 countries across the North America, Europe, Australia, New Zealand, and Asia with a franchised store presence in the Middle East and Asia. Foot Locker, Inc. has a strong history of sneaker authority that sparks discovery and ignites the power of sneaker culture through its portfolio of brands, including Foot Locker, Kids Foot Locker, Champs Sports, WSS, and atmos.
Overview of Consolidated Results
(in millions, except per share data) |
|
2022 |
|
2021 |
|
2020 |
|||
Sales |
|
$ |
8,747 |
|
$ |
8,958 |
|
$ |
7,548 |
Sales per average square foot |
|
|
548 |
|
|
540 |
|
|
417 |
Licensing revenue |
|
|
12 |
|
|
10 |
|
|
6 |
Gross margin |
|
|
2,792 |
|
|
3,080 |
|
|
2,183 |
Gross margin rate |
|
|
31.9 |
% |
|
34.4 |
% |
|
28.9 |
Selling, general and administrative expenses ("SG&A") |
|
|
1,903 |
|
|
1,851 |
|
|
1,587 |
SG&A, as a percentage of sales |
|
|
21.8 |
% |
|
20.7 |
% |
|
21.0 |
Income from operations |
|
$ |
581 |
|
$ |
870 |
|
$ |
309 |
Income from continuing operations before income taxes |
|
$ |
524 |
|
$ |
1,240 |
|
$ |
494 |
Net income attributable to Foot Locker, Inc. |
|
$ |
342 |
|
$ |
893 |
|
$ |
323 |
Diluted earnings per share |
|
$ |
3.58 |
|
$ |
8.61 |
|
$ |
3.08 |
|
|
|
|
|
|
|
|
|
|
Adjusted net income (non-GAAP) |
|
$ |
473 |
|
$ |
755 |
|
$ |
296 |
Adjusted diluted earnings per share (non-GAAP) |
|
$ |
4.95 |
|
$ |
7.27 |
|
$ |
2.81 |
Highlights of our 2022 financial performance include:
| ● | Sales per square foot increased to $548, from $540 per square foot in 2021, while total sales declined by 2.4%. Excluding the effect of foreign currency fluctuations, sales increased by 0.9% as compared to the prior-year period. |
| ● | Our footwear sales represented 80% of total sales, while apparel and accessory sales were 20%, consistent with last year’s distribution of sales. |
| ● | Sales and comparable sales both decreased in 2022 compared to our record year in 2021. |
|
|
2022 |
|
2021 |
|
2020 |
|
Sales increase/(decrease) |
|
(2.4) |
% |
18.7 |
% |
(5.7) |
% |
Comparable-store sales increase/(decrease) |
|
(1.9) |
% |
15.4 |
% |
(5.9) |
% |
| ● | The percentage of our direct-to-customers sales channel decreased to 17.5% of total sales in 2022 as compared with the prior year which represented 21.5% of total sales. The results in 2021 reflected some remaining effects from the COVID-19 pandemic. We are making ongoing investments in our omni-channel ecosystem, including our e-commerce experience and supply chain capabilities, in order to create seamless shopping experiences across all of our sales channels. |
| ● | Gross margin, as a percentage of sales, decreased to 31.9% as a result of a more promotional marketplace during 2022. We took pricing actions in line with the market in order to ensure that our inventory position remained current and corresponding with sales trends. |
| ● | SG&A expenses were 21.8% of sales, an increase of 110 basis points as compared with the prior year. The increase primarily reflected higher compensation costs and the effect of the prior-year payroll subsidies recorded in connection with the COVID-19 pandemic. |
2022 Form 10-K Page 18
| ● | Our newly acquired businesses of WSS and atmos were both accretive to earnings. We continued to be excited about the growth potential in both these banners. |
| ● | We substantially completed the wind down of the Footaction banner during 2022 and recently announced the closure of our underperforming Sidestep banner, which is expected to be completed in the first half of 2023. |
| ● | Net income attributable to Foot Locker, Inc. was $342 million, or $3.58 diluted earnings per share. The $551 million decrease from the prior-year period reflected a $426 million reduction in other income, primarily from fair value adjustments to our minority investments, and a reduction in income from operations. |
| ● | Adjusted net income was $473 million, or $4.95 diluted earnings per share, as compared with adjusted net income of $755 million, or $7.27 diluted earnings per share, in the prior year. |
Highlights of our financial position for the year ended January 28, 2023 include:
| ● | We ended the year in a strong financial position. Our cash and cash equivalents at January 28, 2023 were $536 million and net of debt it was $84 million. |
| ● | Net cash provided by operating activities was $173 million as compared with $666 million last year, as we built up our inventory position in 2022. |
| ● | Cash capital expenditures during 2022 totaled $285 million and were primarily directed to the remodeling or relocation of 115 stores and the build-out of 103 new stores, as well as various technology and infrastructure projects. |
| ● | During 2022, we returned $279 million of cash to our shareholders. Dividends totaling $150 million were declared and paid during 2022, and 4,050,000 shares were repurchased under our share repurchase program at a cost of $129 million. In February 2023, our Board of Directors approved a dividend of $0.40 per share payable in April 2023. These initiatives demonstrate our commitment to continue delivering meaningful returns to our shareholders. |
Reconciliation of Non-GAAP Measures
In addition to reporting our financial results in accordance with generally accepted accounting principles (“GAAP”), we report certain financial results that differ from what is reported under GAAP. In the following tables, we have presented certain financial measures and ratios identified as non-GAAP such as Earnings Before Interest and Taxes (“EBIT”), adjusted EBIT, adjusted EBIT margin, adjusted income before income taxes, adjusted net income, adjusted net income margin, adjusted diluted earnings per share, Return on Invested Capital (“ROIC”), and free cash flow.
Effective with the first quarter of 2022, the calculation for non-GAAP earnings excludes gains and losses from all minority investments, including the adjustments related to the investment in Retailors, Ltd. We believe this is a more representative measure of our recurring earnings, assists in the comparability of results, and is consistent with how management reviews performance. The non-GAAP results for prior periods have been recast, as applicable, to conform to the current year’s presentation.
We present these non-GAAP measures because we believe they assist investors in comparing our performance across reporting periods on a consistent basis by excluding items that are not indicative of our core business or which affect comparability. These non-GAAP measures are also useful in assessing our progress in achieving our long-term financial objectives.
Additionally, we present certain amounts as excluding the effects of foreign currency fluctuations, which are also considered non-GAAP measures. Throughout the following discussions, where amounts are expressed as excluding the effects of foreign currency fluctuations, such changes are determined by translating all amounts in both years using the prior-year average foreign exchange rates. Presenting amounts on a constant currency basis is useful to investors because it enables them to better understand the changes in our businesses that are not related to currency movements.
We estimate the tax effect of the non-GAAP adjustments by applying a marginal rate to each of the respective items. The income tax items represent the discrete amount that affected the period.
The non-GAAP financial information is provided in addition to, and not as an alternative to, our reported results prepared in accordance with GAAP. Presented below is a reconciliation of GAAP and non-GAAP results discussed throughout this Annual Report on Form 10-K. All adjusted amounts exclude the loss from discontinued operations. Please see the non-GAAP reconciliations for free cash flow in the “Liquidity and Capital Resources” section.
2022 Form 10-K Page 19
Reconciliation of Non-GAAP Measures
($ in millions) |
|
2022 |
|
2021 |
|
2020 |
|
|||
Pre-tax income: |
|
|
|
|
|
|
|
|
|
|
Income from continuing operations before income taxes |
|
$ |
524 |
|
$ |
1,240 |
|
$ |
494 |
|
Pre-tax adjustments excluded from GAAP: |
|
|
|
|
|
|
|
|
|
|
Impairment and other (1) |
|
|
112 |
|
|
172 |
|
|
117 |
|
Other income, net (2) |
|
|
41 |
|
|
(377) |
|
|
(190) |
|
Adjusted income before income taxes (non-GAAP) |
|
$ |
677 |
|
$ |
1,035 |
|
$ |
421 |
|
|
|
|
|
|
|
|
|
|
|
|
Calculation of Earnings Before Interest and Taxes (EBIT): |
|
|
|
|
|
|
|
|
|
|
Income from continuing operations before income taxes |
|
$ |
524 |
|
$ |
1,240 |
|
$ |
494 |
|
Interest expense, net |
|
|
(15) |
|
|
(14) |
|
|
(7) |
|
EBIT |
|
$ |
539 |
|
$ |
1,254 |
|
$ |
501 |
|
|
|
|
|
|
|
|
|
|
|
|
Adjusted income before income taxes |
|
$ |
677 |
|
$ |
1,035 |
|
$ |
421 |
|
Interest expense, net |
|
|
(15) |
|
|
(14) |
|
|
(7) |
|
Adjusted EBIT (non-GAAP) |
|
$ |
692 |
|
$ |
1,049 |
|
$ |
428 |
|
|
|
|
|
|
|
|
|
|
|
|
EBIT margin % |
|
|
6.2 |
% |
|
14.0 |
% |
|
6.6 |
% |
Adjusted EBIT margin % |
|
|
7.9 |
% |
|
11.7 |
% |
|
5.7 |
% |
|
|
|
|
|
|
|
|
|||
After-tax income: |
|
|
|
|
|
|
|
|
|
|
Net income attributable to Foot Locker, Inc. |
|
$ |
342 |
|
$ |
893 |
|
$ |
323 |
|
After-tax adjustments excluded from GAAP: |
|
|
|
|
|
|
|
|
|
|
Impairment and other, net of income tax benefit of $21, $42, and $24, respectively (1) |
|
|
91 |
|
|
130 |
|
|
93 |
|
Other income, net of income tax (benefit) expense of ($9), $99, and $50 respectively (2) |
|
|
32 |
|
|
(278) |
|
|
(140) |
|
Net loss from discontinued operations, net of income tax benefit of $1, $-, and $-, respectively (3) |
|
|
3 |
|
|
— |
|
|
— |
|
Tax reserves charge (4) |
|
|
5 |
|
|
— |
|
|
— |
|
Tax benefits related to tax law rate changes (5) |
|
|
— |
|
|
(1) |
|
|
(5) |
|
Tax charge related to revaluation of certain intellectual property |
|
|
— |
|
|
11 |
|
|
25 |
|
Adjusted net income (non-GAAP) |
|
$ |
473 |
|
$ |
755 |
|
$ |
296 |
|
|
|
|
|
|
|
|
|
|
|
|
Earnings per share: |
|
|
|
|
|
|
|
|
|
|
Diluted EPS |
|
$ |
3.58 |
|
$ |
8.61 |
|
$ |
3.08 |
|
Diluted EPS amounts excluded from GAAP: |
|
|
|
|
|
|
|
|
|
|
Impairment and other (1) |
|
|
0.95 |
|
|
1.24 |
|
|
0.87 |
|
Other income, net (2) |
|
|
0.33 |
|
|
(2.68) |
|
|
(1.33) |
|
Net loss from discontinued operations (3) |
|
|
0.04 |
|
|
— |
|
|
— |
|
Tax reserves charge (4) |
|
|
0.05 |
|
|
— |
|
|
— |
|
Tax benefits related to tax law rate changes (5) |
|
|
— |
|
|
(0.01) |
|
|
(0.05) |
|
Tax charge related to revaluation of certain intellectual property |
|
|
— |
|
|
0.11 |
|
|
0.24 |
|
Adjusted diluted EPS (non-GAAP) |
|
$ |
4.95 |
|
$ |
7.27 |
|
$ |
2.81 |
|
|
|
|
|
|
|
|
|
|
|
|
Net income margin % |
|
|
3.9 |
% |
|
10.0 |
% |
|
4.3 |
% |
Adjusted net income margin % |
|
|
5.4 |
% |
|
8.4 |
% |
|
3.9 |
% |
2022 Form 10-K Page 20
Notes on Non-GAAP Adjustments:
| (1) | For 2022, 2021, and 2020, we recorded impairment and other of $112 million ($91 million after tax), $172 million ($130 million after tax), and $117 million ($93 million after tax), respectively. See the Impairment and Other section for further information. |
| (2) | During 2022, 2021 and 2020, we recorded other expense of $41 million ($32 million after tax), and other income of $377 million ($278 million after tax), and $190 million, ($140 million after-tax), respectively. During 2022, we recognized a loss of $61 million ($45 million after tax) to measure the Retailors, Ltd. investment at fair value, based on the publicly available stock price, until it was sold in the fourth quarter. This includes an offset of $1 million of dividend income. We recorded a gain of $77 million ($59 million after tax) on the Retailors, Ltd. investment in 2021. In 2022, we recognized a $19 million ($12 million after tax) gain on the sale of our Eastbay Team Sales business. Non-cash gains of $290 million ($214 million after tax) and $190 million ($140 million after tax) in 2021 and 2020, respectively, related to our minority investment in GOAT, which is measured using the fair value measurement alternative and received additional funding at higher valuations than our initial investment. In 2021, this caption also included $7 million ($5 million after tax) related to the finalization of the insurance claim associated with the prior year social unrest. |
See the Other Income / (Expense), net section for further information.
| (3) | We recognized a charge to discontinued operations of $4 million ($3 million after tax) during the fourth quarter of 2022 related to the resolution of a legal matter of a business we formerly operated. |
| (4) | In the second quarter of 2022, we recorded a $5 million charge related to our income tax reserves due to the resolution of a foreign tax settlement. |
| (5) | We recognized tax charges of $1 million and $5 million during the fourth quarters of 2021 and 2020, respectively, in connection with tax law changes in the Netherlands. |
| (6) | We recorded tax charges related to the revaluation of certain intellectual property rights, pursuant to a non-U.S. advance pricing agreement of $11 million and $25 million for 2021 and 2020, respectively. |
Return on Invested Capital
ROIC is presented below and represents a non-GAAP measure. We believe ROIC is a meaningful measure because it quantifies how efficiently we generated operating income relative to the capital we have invested in the business. ROIC, subject to certain adjustments, is also used as a measure in executive long-term incentive compensation.
The closest U.S. GAAP measure to ROIC is Return on Assets (“ROA”) and is also presented below. ROA is calculated as net income attributable to Foot Locker, Inc. in the fiscal year divided by the two-year average of total assets. ROA decreased to 4.3% as compared with 11.8% in the prior year. This decrease reflected lower profits and higher average total assets compared with 2021. Our ROIC decreased to 9.2% in 2022, as compared with 16.4% in the prior year. The overall decrease in ROIC reflected a decrease in adjusted return after taxes, as well as higher average invested capital, primarily related to higher inventory levels in 2022.
|
|
2022 |
|
|
2021 |
|
|
2020 |
|
ROA (1) |
|
4.3 |
% |
|
11.8 |
% |
|
4.7 |
% |
ROIC % |
|
9.2 |
% |
|
16.4 |
% |
|
8.6 |
% |
| (1) | Represents net income attributable to Foot Locker, Inc. of $349 million, $893 million, and $323 million divided by average total assets of $8,021 million, $7,589 million, and $6,816 million for 2022, 2021, and 2020, respectively. |
Calculation of ROIC:
($ in millions) |
|
2022 |
|
2021 |
|
2020 |
|
|||
Adjusted EBIT |
|
$ |
692 |
|
$ |
1,049 |
|
$ |
428 |
|
+ Interest component of straight-line rent expense (1) |
|
|
136 |
|
|
144 |
|
|
158 |
|
Adjusted net operating profit |
|
|
828 |
|
|
1,193 |
|
|
586 |
|
- Adjusted income tax expense (2) |
|
|
(244) |
|
|
(321) |
|
|
(167) |
|
+ Net loss attributable to noncontrolling interests |
|
|
1 |
|
|
1 |
|
|
— |
|
= Adjusted return after taxes |
|
$ |
585 |
|
$ |
873 |
|
$ |
419 |
|
Average total assets |
|
$ |
8,021 |
|
$ |
7,589 |
|
$ |
6,816 |
|
- Average cash and cash equivalents |
|
|
(670) |
|
|
(1,242) |
|
|
(1,294) |
|
- Average non-interest bearing current liabilities |
|
|
(1,109) |
|
|
(1,060) |
|
|
(819) |
|
- Average merchandise inventories |
|
|
(1,455) |
|
|
(1,095) |
|
|
(1,066) |
|
+ 13‑month average merchandise inventories |
|
|
1,569 |
|
|
1,116 |
|
|
1,243 |
|
= Average invested capital |
|
$ |
6,356 |
|
$ |
5,308 |
|
$ |
4,880 |
|
ROIC % |
|
|
9.2 |
% |
|
16.4 |
% |
|
8.6 |
% |
| (1) | Represents the add-back to operating income driven by the hypothetical interest expense we would incur if the property under our operating leases were owned or accounted for as finance leases. Calculated using the discount rate for each operating lease recorded as a component of rent expense. Operating lease interest is added back to adjusted net operating profit in the ROIC calculation to account for differences in capital structure between us and our competitors. |
| (2) | The adjusted income tax expense represents the marginal tax rate applied to adjusted net operating profit for each of the periods presented. |
2022 Form 10-K Page 21
Segment Reporting and Results of Operations
Our operating segments are identified according to how our business activities are managed and evaluated by our chief operating decision maker, our CEO. We have three operating segments, North America, Europe, Middle East, and Africa (“EMEA”), and Asia Pacific. We have further aggregated these operating segments into one reportable segment based upon their shared customer base and similar economic characteristics.
Sales
Comparable-store sales is a key performance indicator for us. All references to comparable-store sales for a given period relate to sales of stores that were open at the period-end and had been open for more than one year. The computation of consolidated comparable sales also includes direct-to-customers sales as a result of our omnichannel strategy. We view our e-commerce business as an extension of our physical stores. Stores opened or closed during the period are not included in the comparable-store base; however, stores closed temporarily for relocation or remodeling are included. Computations exclude the effect of foreign currency fluctuations.
Sales from acquired businesses that include inventory are included in the computation of comparable-store sales after 15 months of operations. Accordingly, sales of WSS were included effective January 2023, while the sales from atmos continues to be excluded from the computation of comparable-store sales. Additionally, as a result of the Eastbay Team Sales divestiture, sales from this business were removed for the computation of comparable sales for all periods.
The information shown below represents certain sales metrics by sales channel:
($ in millions) |
2022 |
|
2021 |
|
2020 |
|
|||
Store sales |
$ |
7,219 |
|
$ |
7,029 |
|
$ |
5,447 |
|
$ Change |
$ |
190 |
|
$ |
1,582 |
|
|
|
|
% Change |
|
2.7 |
% |
|
29.0 |
% |
|
|
|
% of total sales |
|
82.5 |
% |
|
78.5 |
% |
|
72.2 |
% |
Comparable sales increase (decrease) |
|
3.7 |
% |
|
25.8 |
% |
|
(19.3) |
% |
Direct-to-customer sales |
$ |
1,528 |
|
$ |
1,929 |
|
$ |
2,101 |
|
$ Change |
$ |
(401) |
|
$ |
(172) |
|
|
|
|
% Change |
|
(20.8) |
% |
|
(8.2) |
% |
|
|
|
% of total sales |
|
17.5 |
% |
|
21.5 |
% |
|
27.8 |
% |
Comparable sales increase (decrease) |
|
(21.2) |
% |
|
(10.6) |
% |
|
62.8 |
% |
Total sales |
$ |
8,747 |
|
$ |
8,958 |
|
$ |
7,548 |
|
$ Change |
$ |
(211) |
|
$ |
1,410 |
|
|
|
|
% Change |
|
(2.4) |
% |
|
18.7 |
% |
|
|
|
Comparable sales increase (decrease) |
|
(1.9) |
% |
|
62.8 |
% |
|
5.6 |
% |
In 2022, sales decreased by 2.4% to $8,747 million from sales of $8,958 million in 2021. Excluding the effect of foreign currency fluctuations, sales increased by 0.9% as compared with 2021. Sales from our acquired WSS and atmos banners totaled $604 million and $188 million for 2022, respectively, compared with a partial year in 2021 of $195 million and $49 million, respectively.
|
|
Constant Currencies |
|
Comparable Sales |
|
Foot Locker |
|
0.7 |
% |
0.9 |
% |
Champs Sports |
|
(13.1) |
% |
(13.1) |
% |
Kids Foot Locker |
|
(2.2) |
% |
(5.4) |
% |
WSS |
|
209.7 |
% |
10.6 |
% |
Other |
|
n.m. |
|
n.m. |
|
North America |
|
(6.6) |
% |
(7.2) |
% |
Foot Locker |
|
16.5 |
% |
14.1 |
% |
Sidestep |
|
38.4 |
% |
23.0 |
% |
EMEA |
|
17.5 |
% |
14.5 |
% |
Foot Locker |
|
19.5 |
% |
16.0 |
% |
atmos |
|
351.5 |
% |
n.m. |
|
Asia Pacific |
|
58.1 |
% |
16.0 |
% |
Total Foot Locker, Inc. |
|
0.9 |
% |
(1.9) |
% |
2022 Form 10-K Page 22
Comparable sales decreased by 1.9% as compared with the prior year. By operating segment, North America had a 7.2% decrease, while EMEA and Asia Pacific generated increases of 14.5% and 16.0%, respectively. Comparable sales increased in our stores; however, they declined in our direct-to-customer channel in 2022. Our sales in stores increased, driven by strong demand, brand diversification efforts, and improved access to high-quality inventory. Our direct-to-customer channel continued to decrease to more historical levels, as shoppers navigated back to physical locations.
For the combined channels, sales, excluding foreign currency fluctuations, decreased in North America by 6.6%, while EMEA increased by 17.5%, and Asia Pacific increased by 19.5%, as compared with 2021. Our North American operating segment’s sales, while strong in 2022, no longer benefited from the significant fiscal stimulus which contributed to growth in 2021. The effects of inflation negatively affected customer demand. Additionally, the wind down of the Footaction and Eastbay businesses negatively affected sales. Within EMEA, sales for the Foot Locker and Sidestep banners increased with the return of in-store traffic. Asia Pacific, excluding atmos, generated increases in all of the geographies in which it operates, led by our operations in Australia.
From a product perspective for the combined channels, the sales decrease in 2022 was across footwear and apparel, offset by a small increase in accessories. Footwear sales decreased mainly across the men’s and kids’ segments, while women’s increased. Similarly, apparel sales decreased for men’s and kids’, while women’s increased slightly.
Gross Margin
|
|
2022 |
|
2021 |
|
2020 |
|
Gross margin rate |
|
31.9 |
% |
34.4 |
% |
28.9 |
% |
Basis point (decrease)/increase in the gross margin rate |
|
(250) |
|
550 |
|
|
|
Components of the change: |
|
|
|
|
|
|
|
Merchandise margin rate (decline)/ improvement |
|
(240) |
|
450 |
|
|
|
(Higher)/lower occupancy and buyers’ compensation expense rate |
|
(10) |
|
100 |
|
|
|
Gross margin is calculated as sales minus cost of sales. Cost of sales includes the cost of merchandise, freight, distribution costs including related depreciation expense, shipping and handling, occupancy and buyers’ compensation. Occupancy costs include rent (including fixed common area maintenance charges and other fixed non-lease components), real estate taxes, general maintenance, and utilities.
The gross margin rate decreased in 2022 by 250 basis points as compared to the prior year, reflecting a lower merchandise margin rate due to higher markdowns versus historically-low levels last year. The occupancy rate deleverage reflected the effect of prior year rent abatements related to COVID-19. Excluding the benefit from the prior year abatement, the rate would have decreased by 10 basis points despite the decline in sales.
Selling, General and Administrative Expenses (SG&A)
|
|
|
|
|
|
|
|
|
|
($ in millions) |
2022 |
|
2021 |
|
2020 |
|
|||
SG&A |
$ |
1,903 |
|
$ |
1,851 |
|
$ |
1,587 |
|
$ Change |
$ |
52 |
|
$ |
264 |
|
|
|
|
% Change |
|
2.8 |
% |
|
16.6 |
% |
|
|
|
SG&A as a percentage of sales |
|
21.8 |
% |
|
20.7 |
% |
|
21.0 |
% |
SG&A increased by $52 million, or 2.8%, in 2022, as compared with the prior year. As a percentage of sales, the SG&A rate increased by 110 basis points as compared with 2021. Excluding the effect of foreign currency fluctuations, SG&A increased by $121 million, or 6.5%, as compared with the prior year. Our newly acquired businesses contributed $104 million to SG&A, as the prior year represented a partial year.
The increase in SG&A, as a percentage of sales, was driven by higher labor costs, information technology and support expenses, and COVID-19 related matters in the prior year. SG&A in 2022 included nominal payroll subsidies from local governments, compared with $16 million in 2021.
2022 Form 10-K Page 23
Depreciation and Amortization
($ in millions) |
2022 |
|
2021 |
|
2020 |
|
|||
Depreciation and amortization |
$ |
208 |
|
$ |
197 |
|
$ |
176 |
|
$ Change |
$ |
11 |
|
$ |
21 |
|
|
|
|
% Change |
|
5.6 |
% |
|
11.9 |
% |
|
|
|
Depreciation and amortization increased by $11 million as compared with the prior year. Excluding the effect of foreign currency fluctuations, depreciation and amortization increased by $17 million primarily due to the additions of WSS and atmos.
Operating Results
Division profit was $832 million, or 9.5% of sales in 2022. This compares with $1,161 million, or 13.0% of sales, for the prior year. The decrease was driven by both sales channels experiencing declines in gross margin and deleveraging expenses. Our newly acquired businesses contributed $45 million to division profit, as the prior year represented a partial period.
Impairment and Other
During the fourth quarter of 2022, we conducted an impairment review for approximately 142 underperforming stores, including 70 Sidestep stores due to the announced closure of the banner. We evaluated the long-lived assets, including the right-of-use assets and recorded non-cash charges of $53 million to write down store fixtures, leasehold improvements, and right-of-use assets for approximately 110 of these stores, which included $17 million for Sidestep stores. During the first and second quarters of 2022 we recorded impairment charges of $5 million related to long-lived assets and right-of-use assets, as well as accelerated tenancy charges.
During 2022, we incurred $42 million of transformation consulting expense. Additionally, we incurred $22 million of reorganization costs, primarily severance, due to the reduction of support functions as we streamlined the organization for operational efficiency and included $4 million of other costs related to the wind down of the Sidestep banner. We also recorded $8 million of intangible asset impairment on the Sidestep tradename, due to the store and website closures. During the fourth quarter of 2022, we recorded a $9 million charge for litigation costs, as well as a benefit of $31 million related to the change in fair value of contingent consideration related to our acquisition of atmos. During 2022 and 2021 we recorded acquisition and integration costs of $4 million and $24 million, respectively, which primarily represented investment banking and integration consulting fees related to the WSS and atmos acquisitions.
During 2021, we conducted impairment reviews of Footaction stores and underperforming stores and we recorded charges totaling $92 million. to write down store fixtures, leasehold improvements, and right-of-use assets. We also recorded $4 million of reorganization expense related to Footaction and certain support functions. and non-cash charges of $42 million related to the write-down of certain minority investments. Additionally, we recorded $15 million of lease termination costs related to the closure of certain stores and $2 million of intangible asset impairment on the Footaction tradename, due to the store and website closures.
See Note 5, Impairment and Other for additional information.
Corporate Expense
($ in millions) |
2022 |
|
2021 |
|
2020 |
|
|||
Corporate expense |
$ |
151 |
|
$ |
129 |
|
$ |
71 |
|
$ Change |
$ |
22 |
|
$ |
58 |
|
|
|
|
Corporate expense consists of unallocated general and administrative expenses as well as depreciation and amortization related to our corporate headquarters, centrally managed departments, unallocated insurance and benefit programs, certain foreign exchange transaction gains and losses, and other items. Depreciation and amortization included in corporate expense was $39 million and $34 million in 2022 and 2021, respectively. Excluding the changes in depreciation and amortization, corporate expense increased primarily due to higher information technology and support expenses.
2022 Form 10-K Page 24
Interest Expense, net
($ in millions) |
|
2022 |
|
2021 |
|
2020 |
|
|||
Interest expense |
|
$ |
(24) |
|
$ |
(17) |
|
$ |
(13) |
|
Interest income |
|
|
9 |
|
|
3 |
|
|
6 |
|
Interest expense, net |
|
$ |
(15) |
|
$ |
(14) |
|
$ |
(7) |
|
Weighted-average interest rate (excluding fees) |
|
|
3.8 |
% |
|
4.8 |
% |
|
6.6 |
% |
We recorded net interest expense of $15 million in 2022, compared to $14 million in 2021. Interest expense increased primarily due to the issuance of the 4% Notes, partially offset by interest income from our cross-currency swap and higher interest rates earned on our cash and cash equivalents.
Other Income / (Expense), net
($ in millions) |
2022 |
|
2021 |
|
2020 |
|
|||
Other income / (expense), net |
$ |
(42) |
|
$ |
384 |
|
$ |
192 |
|
This caption generally includes non-operating items, including changes in fair value of minority investments measured at fair value or using the fair value measurement alternative, changes in the market value of our available-for-sale security, our share of earnings or losses related to our equity method investments, and net benefit (expense) related to our pension and postretirement programs excluding the service cost component.
During 2021, we invested $68 million to take a common stock minority stake in a public entity, Retailors, Ltd., which is traded on the Tel Aviv stock exchange. This investment was at a discount to the initial public offering price, resulting in a non-cash gain of $9 million in 2021. Additionally, changes in fair value generated non-cash gains of $68 million during 2021. A loss of $62 million was recorded during 2022, partially offset by $1 million of dividend income. This investment was sold during 2022 generating proceeds of $83 million. Our minority investment in GOAT is accounted for using the fair value measurement alternative, which is at cost adjusted for changes in observable prices minus impairment. GOAT received funding at higher valuations in both 2021 and 2020 resulting in non-cash gains of $290 million and $190 million, respectively. As of January 28, 2023, the fair value of our investment in GOAT totaled $612 million.
The losses in 2022 were offset by a gain of $19 million from the divestiture of Eastbay Team Sales.
Income Taxes
($ in millions) |
2022 |
|
2021 |
|
2020 |
|
|||
Provision for income taxes |
$ |
180 |
|
$ |
348 |
|
$ |
171 |
|
Effective tax rate |
|
34.3 |
% |
|
28.1 |
% |
|
34.5 |
% |
Our effective tax rate for 2022 was 34.3%, as compared with 28.1% in 2021. The increase was primarily due to significantly lower pretax income earned in the United States increasing the effect of nondeductible expenses on the effective tax rate. Additionally, we recorded a $11 million tax charge in 2021 related to the revaluation of certain intellectual property rights pursuant to a non-U.S. advance pricing agreement. During 2020, a $25 million tax charge was recognized in connection with the revaluation. Additionally, during the fourth quarters of 2021 and 2020, we recorded tax benefits of $1 million and $5 million, respectively, in connection with tax law changes in the Netherlands.
We regularly assess the adequacy of provisions for income tax contingencies in accordance with the applicable authoritative guidance on accounting for income taxes. As a result, reserves for unrecognized tax benefits may be adjusted due to new facts and developments, such as changes to interpretations of relevant tax law, assessments from taxing authorities, settlements with taxing authorities, and lapses of statutes of limitations. During 2022, we recorded a $5 million charge related to our income tax reserves due to the resolution of a foreign tax settlement. Partially offsetting this charge were tax benefits totaling $3 million from reserves releases due to various statute of limitation lapses. The changes in the tax reserves were not significant in 2021 and 2020.
During 2022, we recorded a tax expense of $6 million in connection with Eastbay Team Sales divestiture, including the effect of a non-deductible goodwill write-off.
On August 16, 2022, President Biden signed the Inflation Reduction Act (“IRA”) of 2022 into law. The IRA contains a number of revisions to the Internal Revenue Code, including a 15% corporate minimum tax and a 1% excise tax on corporate stock repurchases in tax years beginning after December 31, 2022. We do not currently expect the IRA tax provisions will have a significant effect on our overall effective tax rate.
2022 Form 10-K Page 25
Liquidity and Capital Resources
Liquidity
Our primary source of liquidity has been cash flow from operations, while the principal uses of cash have been to fund inventory and other working capital requirements; finance capital expenditures related to store openings, store remodelings, internet and mobile sites, information systems, and other support facilities; quarterly dividend payments; and interest payments; and fund other cash requirements to support the development of our short-term and long-term operating strategies. We generally finance real estate with operating leases. We believe our cash, cash equivalents, future cash flow from operations, and amounts available under our credit agreement will be adequate to fund these requirements.
We may also repurchase our common stock through open market purchases, privately negotiated transactions, or otherwise. Such repurchases if any, will depend on prevailing market conditions, liquidity requirements, contractual restrictions, and other factors. The amounts involved may be material. On February 24, 2022, the Board of Directors approved a share repurchase program authorizing the Company to repurchase up to $1.2 billion of its common stock replacing the prior authorization. The new share repurchase program does not have an expiration date and as of January 28, 2023, approximately $1.1 billion remained available.
On February 15, 2023, the Board of Directors declared a quarterly dividend of $0.40 per share to be paid on April 28, 2023.
Any material adverse change in customer demand, fashion trends, competitive market forces, or customer acceptance of our merchandise mix and retail locations, uncertainties related to the effect of competitive products and pricing, our reliance on a few key suppliers for a significant portion of our merchandise purchases and risks associated with global product sourcing, economic conditions worldwide, the effects of currency fluctuations, as well as other factors listed under the heading “Disclosure Regarding Forward-Looking Statements,” could affect our ability to continue to fund our liquidity needs from business operations.
Maintaining access to merchandise that we consider appropriate for our business may be subject to the policies and practices of our key suppliers. Therefore, we believe that it is critical to continue to maintain satisfactory relationships with these key suppliers. We purchased 86% and 87% of our merchandise from our top five suppliers in 2022 and 2021, respectively. Approximately 65% and 68% was purchased from one supplier, Nike, Inc., in 2022 and 2021, respectively.
Planned capital expenditures in 2023 are $275 million. Included in the planned amount is $210 million dedicated to real estate projects designed to elevate our customers’ in-store experience. The real estate total includes the remodeling or expansion of approximately 170 existing stores, as well as the planned opening of approximately 100 new stores, primarily representing the continued expansion of our off-mall community-based and “power” store formats, which provide pinnacle retail experiences that deliver connected customer interactions through service, experience, product, and a sense of community. The real estate total includes continued expansion in North America, EMEA and funding for approximately 25 WSS new stores. Finally, the capital plan for 2023 also includes $65 million primarily for digital and supply chain initiatives. We also expect to spend an additional $30 million in software-as-a-service contracts related to our technology initiatives. We have the ability to revise and reschedule some of the anticipated spending program should our financial position require it.
Operating Activities
($ in millions) |
|
2022 |
|
2021 |
|
2020 |
|||
Net cash provided by operating activities |
|
$ |
173 |
|
$ |
666 |
|
$ |
1,062 |
$ Change |
|
$ |
(493) |
|
|
|
|
|
|
The amount provided by operating activities reflects income adjusted for non-cash items and working capital changes. Adjustments to net income for non-cash items include gains, losses, impairment and other, depreciation and amortization, deferred income taxes, and share-based compensation expense.
The decrease in cash from operating activities reflected higher merchandise purchases and payments of accounts payable and accrued and other liabilities, as well as lower net income, as compared with the same period last year.
2022 Form 10-K Page 26
Investing Activities
($ in millions) |
|
2022 |
|
2021 |
|
2020 |
|||
Net cash used in investing activities |
|
$ |
(162) |
|
$ |
(1,376) |
|
$ |
(168) |
$ Change |
|
$ |
1,214 |
|
|
|
|
|
|
The reduction in cash used in investing activities primarily reflected the WSS and atmos acquisitions in the prior year, a reduction in minority investment spend, and proceeds from the sale of a business and minority investment, partially offset by higher capital expenditures in the current year. Spending for acquisitions in the current year related to WSS of $2 million and $14 million for atmos as certain post-closing conditions were satisfied, as compared with total spending of $1,056 million in 2021.
Capital expenditures in 2022 increased to $285 million from $209 million in the prior year. During 2022, we completed the remodeling or relocation of 115 existing stores, the build-out of 103 new stores, and made progress on the development of information systems, websites, and infrastructure, including supply chain initiatives.
During 2022, we sold our investment in a public entity (Retailors, Ltd.) generating cash of $83 million and dissolved a joint venture for proceeds of $12 million. Also during the second quarter of 2022, we sold our Eastbay Team Sales business receiving proceeds of $47 million. We have invested $5 million in minority investments during the current year, including various limited partner venture capital funds managed by Black fund managers, who are committed to advancing diverse-led businesses as part of our Leading in Education and Economic Development (LEED) initiative.
Financing Activities
($ in millions) |
|
2022 |
|
2021 |
|
2020 |
|||
Net cash used in financing activities |
|
$ |
(279) |
|
$ |
(152) |
|
$ |
(126) |
$ Change |
|
$ |
(127) |
|
|
|
|
|
|
Cash used in financing activities consisted primarily of our return to shareholders initiatives, including our share repurchase program and cash dividend payments, as follows:
($ in millions) |
|
2022 |
|
2021 |
|
2020 |
|||
Share repurchases |
|
$ |
129 |
|
$ |
348 |
|
$ |
37 |
Dividends paid on common stock |
|
|
150 |
|
|
101 |
|
|
73 |
Total returned to shareholders |
|
$ |
279 |
|
$ |
449 |
|
$ |
110 |
Cash used in financing activities increased primarily due to the prior year sale of $400 million aggregate principal amount of our 4% Senior Notes due 2029, partially offset by the $98 million repayment of principal related to the 8.5% debentures.
During 2022, we repurchased 4,050,000 shares of common stock for $129 million under our share repurchase programs, whereas in the prior year we spent $348 million to repurchase shares. We also declared and paid $150 million in dividends representing a quarterly rate of $0.40 per share in 2022, as compared with $101 million in dividends in 2021.
Free Cash Flow (non-GAAP measure)
In addition to net cash provided by operating activities, we use free cash flow as a useful measure of performance and as an indication of our financial strength and our ability to generate cash. We define free cash flow as net cash provided by operating activities less capital expenditures (which is classified as an investing activity). We believe the presentation of free cash flow is relevant and useful for investors because it allows investors to evaluate the cash generated from underlying operations in a manner similar to the method used by management. Free cash flow is not defined under U.S. GAAP. Therefore, it should not be considered a substitute for income or cash flow data prepared in accordance with U.S. GAAP and may not be comparable to similarly titled measures used by other companies. It should not be inferred that the entire free cash flow amount is available for discretionary expenditures. The following table presents a reconciliation of net cash flow provided by operating activities, the most directly comparable U.S. GAAP financial measure, to free cash flow.
($ in millions) |
|
2022 |
|
2021 |
|
2020 |
|||
Net cash provided by operating activities |
|
$ |
173 |
|
$ |
666 |
|
$ |
1,062 |
Free cash flow |
|
$ |
(112) |
|
$ |
457 |
|
$ |
903 |
2022 Form 10-K Page 27
Capital Structure
We maintain a credit facility for working capital and general corporate purposes. We currently have a $600 million asset-based revolving credit facility that is scheduled to expire on July 14, 2025. No borrowings were outstanding as of January 28, 2023. The amount of borrowing under our credit facility is reduced by the amount of standby and commercial letters of credit outstanding, which are not significant.
Credit Rating
As of March 27, 2023, our corporate credit ratings from Standard & Poor’s and Moody’s Investors Service are BB+ and Ba1, respectively. In addition, Moody’s Investors Service has rated our senior unsecured notes Ba2.
Off-Balance Sheet Arrangements
We have not entered into any transactions with unconsolidated entities that expose us to material continuing risks, contingent liabilities, or any other obligation under a variable interest in an unconsolidated entity. Also, our financial policies prohibit the use of derivatives for which there is no underlying exposure.
Critical Accounting Policies
Our responsibility for integrity and objectivity in the preparation and presentation of the financial statements requires application of appropriate accounting policies. Generally, our accounting policies and methods are those specifically required by U.S. GAAP. Included in the Summary of Significant Accounting Policies note in “Item 8. Consolidated Financial Statements and Supplementary Data” is a summary of the most significant accounting policies. In some cases, we are required to calculate amounts based on estimates for matters that are inherently uncertain. We believe the following to be the most critical of those accounting policies that necessitate subjective judgments.
Business Combinations
We account for business combinations using the acquisition method of accounting, which requires that once control is obtained, all the assets acquired and liabilities assumed are recorded at their respective fair values at the date of acquisition. Additionally, contingent consideration is recorded at fair value on the acquisition date and classified as a liability. We allocate the purchase price of acquired businesses to the tangible, intangible assets, and contingent consideration based, in part, upon internal estimates of cash flows and considering the report of a third-party valuation expert retained to assist the Company and requires a significant amount of management judgment. The determination of fair values of identifiable assets and liabilities as well as contingent consideration requires estimates and the use of valuation techniques when market value is not readily available. For intangible assets acquired in a business combination, we typically determine the fair value based on the discounted cash flow model, specifically the relief from royalty method for intangible assets related to a tradename. Significant estimates in valuing certain intangible assets and contingent consideration include, but are not limited to, the amount and timing of future cash flows, growth rates, customer attrition rates, discount rates and useful lives. Changes to the assumptions used to estimate the fair value could affect the recorded amounts of the assets acquired and the resultant goodwill, as well as the depreciation and amortization expense recorded in future periods.
Impairment of Long-Lived Tangible Assets and Right-of-Use Assets
We perform an impairment review when circumstances indicate that the carrying value of long-lived tangible assets and right-of-use assets may not be recoverable (“a triggering event”). Our policy for determining whether a triggering event exists comprises the evaluation of measurable operating performance criteria and qualitative measures at the lowest level for which identifiable cash flows are largely independent of cash flows of other assets and liabilities, which is generally at the store level. We also evaluate for triggering events at the banner level. If an impairment review is necessitated by the identification of a triggering event, we determine the fair value of the asset using assumptions predominately identified from our historical performance and our long-range strategic plans.
To determine if an impairment exists, we compare the carrying amount of the asset with the estimated future undiscounted cash flows expected to result from the use of the asset group. If the carrying amount of the asset exceeds the estimated undiscounted future cash flows, we measure the amount of the impairment by comparing the carrying amount of the asset group with its estimated fair value.
The estimation of fair value is measured by discounting expected future cash flows using a risk adjusted discount rate and by using a market approach to determine current lease rates. Future expected cash flows are based upon estimates that, if not achieved, may result in significantly different results.
2022 Form 10-K Page 28
Recoverability of Goodwill and Indefinite-Lived Intangible Assets
|
We review goodwill and indefinite-lived intangible assets for impairment annually during the fourth quarter of each fiscal year or more frequently if impairment indicators arise. For more information on the change in our annual impairment testing date, see the Summary of Significant Accounting Policies note in “Item 8. Consolidated Financial Statements and Supplementary Data.” The review of impairment consists of either using a qualitative approach to determine whether it is more likely than not that the fair value of the assets is less than their respective carrying values or a one-step qualitative impairment test. In performing the qualitative assessment, we consider many factors in evaluating whether the carrying value of goodwill may not be recoverable, including declines in our stock price and market capitalization in relation to the book value of the Company and macroeconomic conditions affecting retail. If, based on the results of the qualitative assessment, it is concluded that it is not more likely than not that the fair value of a reporting unit exceeds its carrying value, additional quantitative impairment testing is performed. The quantitative test requires that the carrying value of each reporting unit be compared with its estimated fair value. If the carrying value of a reporting unit is greater than its fair value, a goodwill impairment charge will be recorded for the difference (up to the carrying value of goodwill). |
|
We use a discounted cash flow approach to determine the fair value of a reporting unit. The determination of discounted cash flows of the reporting units and assets and liabilities within the reporting units requires significant estimates and assumptions. These estimates and assumptions primarily include, but are not limited to, the discount rate, terminal growth rates, earnings before depreciation and amortization, and capital expenditures forecasts. Due to the inherent uncertainty involved in making these estimates, actual results could differ from those estimates. We evaluate the merits of each significant assumption, both individually and in the aggregate, used to determine the fair value of the reporting units, as well as the fair values of the corresponding assets and liabilities within the reporting units. Owned trademarks and trade names that have been determined to have indefinite lives are not subject to amortization but are reviewed at least annually for potential impairment. Our impairment evaluation for indefinite-lived intangible assets consists of either a qualitative or quantitative assessment, similar to the process for goodwill. If the results of the qualitative assessment indicate that it is more likely than not that the fair value of the indefinite lived intangible is less than its carrying amount, or if we elect to proceed directly to a quantitative assessment, we calculate the fair value using a discounted cash flow method, based on the relief-from-royalty concept, and compare the fair value to the carrying value to determine if the asset is impaired. This methodology assumes that, in lieu of ownership, a third party would be willing to pay a royalty in order to exploit the related benefits of these types of assets. This approach is dependent on a number of factors, including estimates of future growth and trends, royalty rates in the category of intellectual property, discount rates, and other variables. We base our fair value estimates on assumptions we believe to be reasonable, but which are unpredictable and inherently uncertain. Actual future results may differ from those estimates. We recognize an impairment loss when the estimated fair value of the intangible asset is less than the carrying value. |
Recent Accounting Pronouncements
Descriptions of the recently issued accounting principles are included in the Summary of Significant Accounting Policies note in “Item 8. Consolidated Financial Statements and Supplementary Data.”
Item 7A. Quantitative and Qualitative Disclosures About Market Risk
Information regarding foreign exchange risk management is included in the Financial Instruments and Risk Management note under “Item 8. Consolidated Financial Statements and Supplementary Data.”
Item 8. Consolidated Financial Statements and Supplementary Data
The following Consolidated Financial Statements of the Company are included as part of this Report:
| ● | Consolidated Statements of Operations |
| ● | Consolidated Statements of Comprehensive Income |
| ● | Consolidated Balance Sheets |
| ● | Consolidated Statements of Changes in Shareholders’ Equity |
| ● | Consolidated Statements of Cash Flows |
| ● | Notes to the Consolidated Financial Statements |
2022 Form 10-K Page 29
REPORT OF INDEPENDENT REGISTERED PUBLIC ACCOUNTING FIRM
To the Shareholders and Board of Directors
Foot Locker, Inc.:
Opinion on the Consolidated Financial Statements
We have audited the accompanying consolidated balance sheets of Foot Locker, Inc. and subsidiaries (the Company) as of January 28, 2023 and January 29, 2022, the related consolidated statements of operations, comprehensive income, changes in shareholders’ equity, and cash flows for each of the years in the three-year period ended January 28, 2023, and the related notes (collectively, the consolidated financial statements). In our opinion, the consolidated financial statements present fairly, in all material respects, the financial position of the Company as of January 28, 2023 and January 29, 2022, and the results of its operations and its cash flows for each of the years in the three-year period ended January 28, 2023, in conformity with U.S. generally accepted accounting principles.
We also have audited, in accordance with the standards of the Public Company Accounting Oversight Board (United States) (PCAOB), the Company’s internal control over financial reporting as of January 28, 2023, based on criteria established in Internal Control – Integrated Framework (2013) issued by the Committee of Sponsoring Organizations of the Treadway Commission, and our report dated March 27, 2023 expressed an adverse opinion on the effectiveness of the Company’s internal control over financial reporting.
Basis for Opinion
These consolidated financial statements are the responsibility of the Company’s management. Our responsibility is to express an opinion on these consolidated financial statements based on our audits. We are a public accounting firm registered with the PCAOB and are required to be independent with respect to the Company in accordance with the U.S. federal securities laws and the applicable rules and regulations of the Securities and Exchange Commission and the PCAOB.
We conducted our audits in accordance with the standards of the PCAOB. Those standards require that we plan and perform the audit to obtain reasonable assurance about whether the consolidated financial statements are free of material misstatement, whether due to error or fraud. Our audits included performing procedures to assess the risks of material misstatement of the consolidated financial statements, whether due to error or fraud, and performing procedures that respond to those risks. Such procedures included examining, on a test basis, evidence regarding the amounts and disclosures in the consolidated financial statements. Our audits also included evaluating the accounting principles used and significant estimates made by management, as well as evaluating the overall presentation of the consolidated financial statements. We believe that our audits provide a reasonable basis for our opinion.
Critical Audit Matter
The critical audit matter communicated below is a matter arising from the current period audit of the consolidated financial statements that was communicated or required to be communicated to the audit committee and that: (1) relates to accounts or disclosures that are material to the consolidated financial statements and (2) involved our especially challenging, subjective, or complex judgments. The communication of a critical audit matter does not alter in any way our opinion on the consolidated financial statements, taken as a whole, and we are not, by communicating the critical audit matter below, providing a separate opinion on the critical audit matter or on the accounts or disclosures to which it relates.
Fair value of asset group related to certain underperforming stores
As discussed in Notes 1 and 5 to the consolidated financial statements, the Company performs an impairment review when circumstances indicate that the carrying amount of long-lived tangible assets and right-of-use assets may not be recoverable. The long-lived tangible assets and the right-of-use assets of the Company as of January 28, 2023 were $920 million and $2,443 million, respectively. If a triggering event is identified, the Company compares the carrying amount of the asset group with the estimated future cash flows expected to result from the use of the asset group. If the carrying amount of the asset group exceeds the estimated undiscounted future cash flows, the Company measures the amount of the impairment by comparing the carrying amount of the asset group with its estimated fair value.
2022 Form 10-K Page 30
The estimation of fair value of the asset group is measured by discounting expected future cash flows using a risk-adjusted discount rate and current market-based information for right-of-use assets. During the year ended January 28, 2023, the Company recorded impairment charges of $53 million related to certain underperforming stores.
We identified the evaluation of the fair value of the asset group related to certain underperforming stores as a critical audit matter. The market-based assumptions used to estimate the fair value of the asset group included market rent estimates for comparable stores that required a high degree of auditor judgment to evaluate and were challenging to test in the current economic environment. Changes in the selection of the market rent estimates could have had a significant effect on the determination of the fair value of the asset group, which impacted the measurement and allocation of the impairment loss within the asset group.
The following are the primary procedures we performed to address this critical audit matter. We evaluated the design and tested the operating effectiveness of certain internal controls over the Company’s long-lived tangible asset and right-of-use asset impairment assessment process, including a control related to the estimate of the fair value of the asset group. We involved valuation professionals with specialized skills and knowledge, who assisted in (1) evaluating the market rent estimates by assessing comparable retail leasing activity applicable to each location, and (2) assessing historic leasing activity of the Company in relation to historical store sales performance.
/s/ KPMG LLP
We have served as the Company’s auditor since 1995.
New York, New York
March 27, 2023
2022 Form 10-K Page 31

CONSOLIDATED STATEMENTS OF OPERATIONS
|
|
|
|
|
|
|
|
|
($ in millions, except per share amounts) |
2022 |
|
2021 |
|
2020 |
|||
Sales |
$ |
8,747 |
|
$ |
8,958 |
|
$ |
7,548 |
Licensing revenue |
|
12 |
|
|
10 |
|
|
6 |
Total revenue |
|
8,759 |
|
|
8,968 |
|
|
7,554 |
|
|
|
|
|
|
|
|
|
Cost of sales |
|
5,955 |
|
|
5,878 |
|
|
5,365 |
Selling, general and administrative expenses |
|
1,903 |
|
|
1,851 |
|
|
1,587 |
Depreciation and amortization |
|
208 |
|
|
197 |
|
|
176 |
Impairment and other |
|
112 |
|
|
172 |
|
|
117 |
Income from operations |
|
581 |
|
|
870 |
|
|
309 |
|
|
|
|
|
|
|
|
|
Interest expense, net |
|
(15) |
|
|
(14) |
|
|
(7) |
Other income / (expense), net |
|
(42) |
|
|
384 |
|
|
192 |
Income from continuing operations before income taxes |
|
524 |
|
|
1,240 |
|
|
494 |
Income tax expense |
|
180 |
|
|
348 |
|
|
171 |
Net income from continuing operations |
|
344 |
|
|
892 |
|
|
323 |
Net loss from discontinued operations, net of tax |
|
(3) |
|
|
— |
|
|
— |
Net income |
|
341 |
|
|
892 |
|
|
323 |
Net loss attributable to noncontrolling interests |
|
1 |
|
|
1 |
|
|
— |
Net income attributable to Foot Locker, Inc. |
$ |
342 |
|
$ |
893 |
|
$ |
323 |
|
|
|
|
|
|
|
|
|
Basic earnings per share |
|
|
|
|
|
|
|
|
Earnings per share from continuing operations attributable to Foot Locker, Inc. |
$ |
3.66 |
|
$ |
8.72 |
|
$ |
3.10 |
Net loss per share from discontinued operations, net of tax |
$ |
(0.04) |
|
$ |
— |
|
$ |
— |
Net earnings per share attributable to Foot Locker, Inc. |
$ |
3.62 |
|
$ |
8.72 |
|
$ |
3.10 |
Weighted-average shares outstanding |
|
94.3 |
|
|
102.5 |
|
|
104.3 |
|
|
|
|
|
|
|
|
|
Diluted earnings per share |
|
|
|
|
|
|
|
|
Earnings per share from continuing operations attributable to Foot Locker, Inc. |
$ |
3.62 |
|
$ |
8.61 |
|
$ |
3.08 |
Net loss per share from discontinued operations, net of tax |
$ |
(0.04) |
|
$ |
— |
|
$ |
— |
Net earnings per share attributable to Foot Locker, Inc. |
$ |
3.58 |
|
$ |
8.61 |
|
$ |
3.08 |
Weighted-average shares outstanding, assuming dilution |
|
95.5 |
|
|
103.8 |
|
|
105.1 |
See Accompanying Notes to Consolidated Financial Statements.
2022 Form 10-K Page 32

CONSOLIDATED STATEMENTS OF COMPREHENSIVE INCOME
($ in millions) |
2022 |
|
2021 |
|
2020 |
|||
Net income attributable to Foot Locker, Inc. |
$ |
342 |
|
$ |
893 |
|
$ |
323 |
Other comprehensive income (loss), net of income tax |
|
|
|
|
|
|
|
|
|
|
|
|
|
|
|
|
|
Foreign currency translation adjustment: |
|
|
|
|
|
|
|
|
Translation adjustment arising during the period, net of income tax (benefit)/expense of $-, $(1), and $3, respectively |
|
(41) |
|
|
(43) |
|
|
40 |
|
|
|
|
|
|
|
|
|
Hedges contracts: |
|
|
|
|
|
|
|
|
|
Change in fair value of derivatives, net of income tax benefit of $-, $-, and $-, respectively |
|
(3) |
|
|
1 |
|
|
2 |
|
|
|
|
|
|
|
|
|
Pension and postretirement adjustments: |
|
|
|
|
|
|
|
|
Net actuarial gain (loss) and foreign currency fluctuations arising during the year, net of income tax expense/(benefit) of $(4), $8, and $4, respectively |
|
(12) |
|
|
23 |
|
|
13 |
|
|
|
|
|
|
|
|
|
Amortization of net actuarial gain/loss and prior service cost included in net periodic benefit costs, net of income tax expense of $3, $3, and $3, respectively |
|
7 |
|
|
7 |
|
|
8 |
Comprehensive income |
$ |
293 |
|
$ |
881 |
|
$ |
386 |
See Accompanying Notes to Consolidated Financial Statements.
2022 Form 10-K Page 33
CONSOLIDATED BALANCE SHEETS
|
January 28, |
|
January 29, |
||
($ in millions, except share amounts) |
2023 |
|
2022 |
||
ASSETS |
|
|
|
|
|
|
|
|
|
|
|
Current assets: |
|
|
|
|
|
Cash and cash equivalents |
$ |
536 |
|
$ |
804 |
Merchandise inventories |
|
1,643 |
|
|
1,266 |
Other current assets |
|
342 |
|
|
293 |
|
|
2,521 |
|
|
2,363 |
Property and equipment, net |
|
920 |
|
|
917 |
Operating lease right-of-use assets |
|
2,443 |
|
|
2,616 |
Deferred taxes |
|
90 |
|
|
86 |
Goodwill |
|
785 |
|
|
797 |
Other intangible assets, net |
|
426 |
|
|
454 |
Minority investments |
|
630 |
|
|
781 |
Other assets |
|
92 |
|
|
121 |
|
$ |
7,907 |
|
$ |
8,135 |
|
|
|
|
|
|
LIABILITIES AND SHAREHOLDERS’ EQUITY |
|
|
|
|
|
|
|
|
|
|
|
Current liabilities: |
|
|
|
|
|
Accounts payable |
$ |
492 |
|
$ |
596 |
Accrued and other liabilities |
|
568 |
|
|
561 |
Current portion of debt and obligations under finance leases |
|
6 |
|
|
6 |
Current portion of lease obligations |
|
544 |
|
|
572 |
|
|
1,610 |
|
|
1,735 |
Long-term debt and obligations under finance leases |
|
446 |
|
|
451 |
Long-term lease obligations |
|
2,230 |
|
|
2,363 |
Other liabilities |
|
328 |
|
|
343 |
Total liabilities |
|
4,614 |
|
|
4,892 |
Shareholders’ equity: |
|
|
|
|
|
Common stock and paid-in capital: 93,396,901 and 99,070,796 shares issued, respectively |
|
760 |
|
|
770 |
Retained earnings |
|
2,925 |
|
|
2,900 |
Accumulated other comprehensive loss |
|
(392) |
|
|
(343) |
Less: Treasury stock at cost: 1,489 and 2,050,000 shares, respectively |
|
— |
|
|
(88) |
Noncontrolling interest |
|
— |
|
|
4 |
Total shareholders' equity |
|
3,293 |
|
|
3,243 |
|
$ |
7,907 |
|
$ |
8,135 |
See Accompanying Notes to Consolidated Financial Statements.
2022 Form 10-K Page 34
CONSOLIDATED STATEMENTS OF CHANGES IN SHAREHOLDERS’ EQUITY
|
|
Additional Paid-In |
|
|
|
|
|
|
|
|
|
Accumulated |
|
|
|
|
|
|
||||
|
|
Capital & |
|
|
|
|
|
|
|
|
|
Other |
|
|
Non- |
|
Total |
|||||
|
|
Common Stock |
|
Treasury Stock |
|
Retained |
|
Comprehensive |
|
|
Controlling |
|
Shareholders' |
|||||||||
(shares in thousands, amounts in millions) |
|
Shares |
|
Amount |
|
Shares |
|
Amount |
|
Earnings |
|
Loss |
|
|
interest |
|
Equity |
|||||
Balance at February 1, 2020 |
|
104,188 |
|
$ |
764 |
|
— |
|
$ |
— |
|
$ |
2,103 |
|
$ |
(394) |
|
$ |
— |
|
$ |
2,473 |
Restricted stock issued |
|
121 |
|
|
— |
|
— |
|
|
— |
|
|
— |
|
|
— |
|
|
— |
|
|
— |
Issued under director and stock plans |
|
297 |
|
|
7 |
|
— |
|
|
— |
|
|
— |
|
|
— |
|
|
— |
|
|
7 |
Share-based compensation expense |
|
— |
|
|
15 |
|
— |
|
|
— |
|
|
— |
|
|
— |
|
|
— |
|
|
15 |
Shares of common stock used to satisfy tax withholding obligations |
|
— |
|
|
— |
|
(41) |
|
|
(1) |
|
|
— |
|
|
— |
|
|
— |
|
|
(1) |
Share repurchases |
|
— |
|
|
— |
|
(969) |
|
|
(37) |
|
|
— |
|
|
— |
|
|
— |
|
|
(37) |
Reissued - Employee Stock Purchase Plan ("ESPP") |
|
— |
|
|
— |
|
23 |
|
|
1 |
|
|
— |
|
|
— |
|
|
— |
|
|
1 |
Retirement of treasury stock |
|
(913) |
|
|
(7) |
|
913 |
|
|
34 |
|
|
(27) |
|
|
— |
|
|
— |
|
|
— |
Noncontrolling interest acquired |
|
— |
|
|
— |
|
— |
|
|
— |
|
|
— |
|
|
— |
|
|
5 |
|
|
5 |
Net income |
|
— |
|
|
— |
|
— |
|
|
— |
|
|
323 |
|
|
— |
|
|
— |
|
|
323 |
Cash dividends on common stock ($0.70 per share) |
|
— |
|
|
— |
|
— |
|
|
— |
|
|
(73) |
|
|
— |
|
|
— |
|
|
(73) |
Translation adjustment, net of tax |
|
— |
|
|
— |
|
— |
|
|
— |
|
|
— |
|
|
40 |
|
|
— |
|
|
40 |
Change in hedges, net of tax |
|
— |
|
|
— |
|
— |
|
|
— |
|
|
— |
|
|
2 |
|
|
— |
|
|
2 |
Pension and postretirement adjustments, net of tax |
|
— |
|
|
— |
|
— |
|
|
— |
|
|
— |
|
|
21 |
|
|
— |
|
|
21 |
Balance at January 30, 2021 |
|
103,693 |
|
$ |
779 |
|
(74) |
|
$ |
(3) |
|
$ |
2,326 |
|
$ |
(331) |
|
$ |
5 |
|
$ |
2,776 |
Restricted stock issued |
|
499 |
|
|
— |
|
— |
|
|
— |
|
|
— |
|
|
— |
|
|
— |
|
|
— |
Issued under director and stock plans |
|
353 |
|
|
11 |
|
— |
|
|
— |
|
|
— |
|
|
— |
|
|
— |
|
|
11 |
Share-based compensation expense |
|
— |
|
|
29 |
|
— |
|
|
— |
|
|
— |
|
|
— |
|
|
— |
|
|
29 |
Shares of common stock used to satisfy tax withholding obligations |
|
— |
|
|
— |
|
(205) |
|
|
(11) |
|
|
— |
|
|
— |
|
|
— |
|
|
(11) |
Share repurchases |
|
— |
|
|
— |
|
(7,546) |
|
|
(348) |
|
|
— |
|
|
— |
|
|
— |
|
|
(348) |
Reissued - ESPP |
|
— |
|
|
(7) |
|
301 |
|
|
14 |
|
|
— |
|
|
— |
|
|
— |
|
|
7 |
Retirement of treasury stock |
|
(5,474) |
|
|
(42) |
|
5,474 |
|
|
260 |
|
|
(218) |
|
|
— |
|
|
— |
|
|
— |
Net income (loss) |
|
— |
|
|
— |
|
— |
|
|
— |
|
|
893 |
|
|
— |
|
|
(1) |
|
|
892 |
Cash dividends on common stock ($1.00 per share) |
|
— |
|
|
— |
|
— |
|
|
— |
|
|
(101) |
|
|
— |
|
|
— |
|
|
(101) |
Translation adjustment, net of tax |
|
— |
|
|
— |
|
— |
|
|
— |
|
|
— |
|
|
(43) |
|
|
— |
|
|
(43) |
Change in hedges, net of tax |
|
— |
|
|
— |
|
— |
|
|
— |
|
|
— |
|
|
1 |
|
|
— |
|
|
1 |
Pension and postretirement adjustments, net of tax |
|
— |
|
|
— |
|
— |
|
|
— |
|
|
— |
|
|
30 |
|
|
— |
|
|
30 |
Balance at January 29, 2022 |
|
99,071 |
|
$ |
770 |
|
(2,050) |
|
$ |
(88) |
|
$ |
2,900 |
|
$ |
(343) |
|
$ |
4 |
|
$ |
3,243 |
Restricted stock issued |
|
117 |
|
|
— |
|
— |
|
|
— |
|
|
— |
|
|
— |
|
|
— |
|
|
— |
Issued under director and stock plans |
|
228 |
|
|
7 |
|
— |
|
|
— |
|
|
— |
|
|
— |
|
|
— |
|
|
7 |
Share-based compensation expense |
|
— |
|
|
31 |
|
— |
|
|
— |
|
|
— |
|
|
— |
|
|
— |
|
|
31 |
Shares of common stock used to satisfy tax withholding obligations |
|
— |
|
|
— |
|
(40) |
|
|
(1) |
|
|
— |
|
|
— |
|
|
— |
|
|
(1) |
Share repurchases |
|
— |
|
|
— |
|
(4,050) |
|
|
(129) |
|
|
— |
|
|
— |
|
|
— |
|
|
(129) |
Reissued - ESPP |
|
— |
|
|
(2) |
|
120 |
|
|
5 |
|
|
— |
|
|
— |
|
|
— |
|
|
3 |
Retirement of treasury stock |
|
(6,019) |
|
|
(46) |
|
6,019 |
|
|
213 |
|
|
(167) |
|
|
— |
|
|
— |
|
|
— |
Termination of joint venture |
|
— |
|
|
— |
|
— |
|
|
— |
|
|
— |
|
|
— |
|
|
(3) |
|
|
(3) |
Net income (loss) |
|
— |
|
|
— |
|
— |
|
|
— |
|
|
342 |
|
|
— |
|
|
(1) |
|
|
341 |
Cash dividends on common stock ($1.60 per share) |
|
— |
|
|
— |
|
— |
|
|
— |
|
|
(150) |
|
|
— |
|
|
— |
|
|
(150) |
Translation adjustment, net of tax |
|
— |
|
|
— |
|
— |
|
|
— |
|
|
— |
|
|
(41) |
|
|
— |
|
|
(41) |
Change in hedges, net of tax |
|
— |
|
|
— |
|
— |
|
|
— |
|
|
— |
|
|
(3) |
|
|
— |
|
|
(3) |
Pension and postretirement adjustments, net of tax |
|
— |
|
|
— |
|
— |
|
|
— |
|
|
— |
|
|
(5) |
|
|
— |
|
|
(5) |
Balance at January 28, 2023 |
|
93,397 |
|
$ |
760 |
|
(1) |
|
$ |
— |
|
$ |
2,925 |
|
$ |
(392) |
|
$ |
— |
|
$ |
3,293 |
See Accompanying Notes to Consolidated Financial Statements.
2022 Form 10-K Page 35
CONSOLIDATED STATEMENTS OF CASH FLOWS
($ in millions) |
2022 |
|
2021 |
|
2020 |
|||
From operating activities: |
|
|
|
|
|
|
|
|
Net income |
$ |
341 |
|
$ |
892 |
|
$ |
323 |
Adjustments to reconcile net income to net cash from operating activities: |
|
|
|
|
|
|
|
|
Non-cash impairment and other |
|
67 |
|
|
148 |
|
|
97 |
Fair value adjustments to minority investments |
|
61 |
|
|
(367) |
|
|
(190) |
Fair value change in contingent consideration |
|
(31) |
|
|
— |
|
|
— |
Depreciation and amortization |
|
208 |
|
|
197 |
|
|
176 |
Deferred income taxes |
|
21 |
|
|
74 |
|
|
(9) |
Share-based compensation expense |
|
31 |
|
|
29 |
|
|
15 |
Gain on disposal of business |
|
(19) |
|
|
— |
|
|
— |
Change in assets and liabilities: |
|
|
|
|
|
|
|
|
Merchandise inventories |
|
(397) |
|
|
(259) |
|
|
294 |
Accounts payable |
|
(101) |
|
|
161 |
|
|
60 |
Accrued and other liabilities |
|
(1) |
|
|
1 |
|
|
140 |
Insurance recovery received for inventory loss |
|
— |
|
|
10 |
|
|
— |
Other, net |
|
(7) |
|
|
(220) |
|
|
156 |
Net cash provided by operating activities |
|
173 |
|
|
666 |
|
|
1,062 |
From investing activities: |
|
|
|
|
|
|
|
|
Capital expenditures |
|
(285) |
|
|
(209) |
|
|
(159) |
Purchase of business, net of cash acquired |
|
(14) |
|
|
(1,056) |
|
|
— |
Minority investments |
|
(5) |
|
|
(118) |
|
|
(9) |
Proceeds from sale of business |
|
47 |
|
|
— |
|
|
— |
Proceeds from minority investments |
|
95 |
|
|
— |
|
|
— |
Proceeds from sale of property |
|
— |
|
|
3 |
|
|
— |
Insurance proceeds related to loss on property and equipment |
|
— |
|
|
4 |
|
|
— |
Net cash used in investing activities |
|
(162) |
|
|
(1,376) |
|
|
(168) |
From financing activities: |
|
|
|
|
|
|
|
|
Proceeds from debt issuance, net |
|
— |
|
|
395 |
|
|
— |
Payment of debt issuance costs |
|
— |
|
|
(2) |
|
|
(4) |
Proceeds from the revolving credit facility |
|
— |
|
|
— |
|
|
330 |
Repayment of the revolving credit facility |
|
— |
|
|
— |
|
|
(330) |
Purchase of treasury shares |
|
(129) |
|
|
(348) |
|
|
(37) |
Dividends paid on common stock |
|
(150) |
|
|
(101) |
|
|
(73) |
Payment of long-term debt and obligations under finance leases |
|
(6) |
|
|
(102) |
|
|
(23) |
Shares of common stock repurchased to satisfy tax withholding obligations |
|
(1) |
|
|
(11) |
|
|
(1) |
Treasury stock reissued under employee stock plan |
|
3 |
|
|
7 |
|
|
— |
Proceeds from common stock issued under employee stock plan |
|
— |
|
|
— |
|
|
2 |
Proceeds from exercise of stock options |
|
6 |
|
|
10 |
|
|
4 |
(Purchase of) / contribution from non-controlling interest |
|
(2) |
|
|
— |
|
|
6 |
Net cash used in financing activities |
|
(279) |
|
|
(152) |
|
|
(126) |
Effect of exchange rate fluctuations on cash, cash equivalents, and restricted cash |
|
— |
|
|
(6) |
|
|
8 |
Net change in cash, cash equivalents, and restricted cash |
|
(268) |
|
|
(868) |
|
|
776 |
Cash, cash equivalents, and restricted cash at beginning of year |
|
850 |
|
|
1,718 |
|
|
942 |
Cash, cash equivalents, and restricted cash at end of period |
$ |
582 |
|
$ |
850 |
|
$ |
1,718 |
|
|
|
|
|
|
|
|
|
Supplemental information: |
|
|
|
|
|
|
|
|
Interest paid |
$ |
17 |
|
$ |
11 |
|
$ |
14 |
Income taxes paid |
|
153 |
|
|
387 |
|
|
100 |
Cash paid for amounts included in measurement of operating lease liabilities |
|
704 |
|
|
790 |
|
|
626 |
Cash paid for amounts included in measurement of finance lease liabilities |
|
9 |
|
|
5 |
|
|
1 |
Right-of-use assets obtained in exchange for operating lease obligations |
|
458 |
|
|
417 |
|
|
331 |
Assets obtained in exchange for finance lease obligations |
|
— |
|
|
4 |
|
|
11 |
See Accompanying Notes to Consolidated Financial Statements.
2022 Form 10-K Page 36

NOTES TO CONSOLIDATED FINANCIAL STATEMENTS
1. Summary of Significant Accounting Policies
Basis of Presentation
The consolidated financial statements include the accounts of Foot Locker, Inc. and its domestic and international subsidiaries, as well as any entities in which we have a controlling voting interest that are required to be consolidated. All significant intercompany amounts have been eliminated. As used in these Notes to Consolidated Financial Statements the terms “Foot Locker,” “Company,” “we,” “our,” and “us” refer to Foot Locker, Inc. and its consolidated subsidiaries.
The preparation of financial statements in conformity with U.S. generally accepted accounting principles requires management to make estimates and assumptions relating to the reporting of assets and liabilities and the disclosure of contingent liabilities at the date of the financial statements, and the reported amounts of revenues and expenses during the reporting period. Actual results may differ from those estimates.
Certain reclassifications have been made to prior period financial statements to conform to the current period presentation. Effective in 2022, we separately present licensing revenue in the Consolidated Statements of Operations as a component of total revenue. Previously, licensing revenue was presented within other income / (expense), net.
Reporting Year
Our fiscal year end is a 52-week or 53-week period ending the Saturday closest to the last day in January. Fiscal year 2022, 2021, and 2020 represented the 52 weeks ended January 28, 2023, January 29, 2022, and February 1, 2020, respectively. References to years in this annual report relate to fiscal years rather than calendar years.
Revenue Recognition
Store revenue is recognized at the point of sale and includes merchandise, net of returns, and excludes taxes. Revenue from layaway sales is recognized when the customer receives the product, rather than when the initial deposit is paid. We recognize revenue for merchandise that is shipped to our customers from our distribution centers and stores upon shipment as the customer has control of the product upon shipment. We account for shipping and handling as a fulfillment activity. We accrue the cost and recognize revenue for these activities upon shipment date, therefore total sales recognized includes shipping and handling fees. We have license agreements with unaffiliated third-party operators located in the Middle East and Asia. The agreements are largely structured with royalty income paid as a percentage of sales for the use of our trademarks, trade name and branding. We record licensing revenue based upon sales estimates for the current period from the third-party operators.
Gift Cards
We sell gift cards which do not have expiration dates. Revenue from gift card sales is recorded when the gift cards are redeemed by customers. Gift card breakage is recognized as revenue in proportion to the pattern of rights exercised by the customer, unless there is a legal obligation to remit the value of unredeemed gift cards to the relevant jurisdictions.
Advertising Costs and Sales Promotion
Advertising and sales promotion costs are expensed at the time the advertising or promotion takes place, net of reimbursements for cooperative advertising. Cooperative advertising reimbursements earned for the launch and promotion of certain products agreed upon with vendors are recorded in the same period as the associated expenses are incurred.
Digital advertising costs are expensed as incurred, net of reimbursements for cooperative advertising. Digital advertising includes search engine marketing, such as display ads and keyword search terms, and other various forms of digital advertising. Reimbursements received in excess of expenses incurred related to specific, incremental, and identifiable advertising costs are accounted for as a reduction to the cost of merchandise and are reflected in cost of sales when the merchandise is sold.
2022 Form 10-K Page 37
NOTES TO CONSOLIDATED FINANCIAL STATEMENTS
1. Summary of Significant Accounting Policies (continued)
Advertising costs, including digital advertising, which are included as a component of SG&A, were as follows:
($ in millions) |
|
2022 |
|
2021 |
|
2020 |
|||
Advertising expenses |
|
$ |
135 |
|
$ |
113 |
|
$ |
69 |
Digital advertising expenses |
|
|
87 |
|
|
110 |
|
|
89 |
Cooperative advertising reimbursements |
|
|
(37) |
|
|
(29) |
|
|
(14) |
Net advertising expense |
|
$ |
185 |
|
$ |
194 |
|
$ |
144 |
Share-Based Compensation
We recognize compensation expense for share-based awards based on the grant date fair value of those awards. We use the Black-Scholes option-pricing model to determine the fair value of stock options, which requires the input of subjective assumptions regarding the expected term, expected volatility, and risk-free interest rate. See Note 22, Share-Based Compensation, for information on the assumptions used to calculate the fair value of stock options. Share-based compensation expense is recognized on a straight-line basis over the requisite service period for each vesting tranche of the award. Upon exercise of stock options, issuance of restricted stock or units, or issuance of shares under the employee stock purchase plan, we will issue authorized but unissued common stock or use common stock held in treasury.
Awards of restricted stock units cliff vest after the passage of time, generally three years. Performance stock unit awards are earned only after the attainment of performance goals in connection with the relevant performance period and vest after an additional one-year period.
PSU awards granted in 2022 also include a performance objective based on our relative total shareholder return over the performance period to a pre-determined peer group, assuming the reinvestment of dividends. The fair value of these awards is determined using a Monte Carlo simulation as of the date of the grant and share-based compensation expense will not be adjusted should the target awards vary from actual awards.
Earnings Per Share
We account for earnings per share (“EPS”) using the treasury stock method. Basic EPS is computed by dividing net income for the period by the weighted-average number of common shares outstanding at the end of the period. Diluted EPS reflects the weighted-average number of common shares outstanding during the period used in the basic EPS computation plus dilutive common stock equivalents.
The computation of basic and diluted EPS is as follows:
(in millions, except per share data) |
|
2022 |
|
2021 |
|
2020 |
|||
Income from continuing operations |
|
$ |
344 |
|
$ |
892 |
|
$ |
323 |
Net loss attributable to noncontrolling interests |
|
|
1 |
|
|
1 |
|
|
— |
Income from continuing operations attributable to |
|
|
345 |
|
|
893 |
|
|
323 |
Net loss from discontinued operations, net of tax |
|
|
(3) |
|
|
— |
|
|
— |
Net income attributable to Foot Locker, Inc. |
|
$ |
342 |
|
$ |
893 |
|
$ |
323 |
|
|
|
|
|
|
|
|
|
|
Weighted-average common shares outstanding |
|
|
94.3 |
|
|
102.5 |
|
|
104.3 |
Dilutive effect of potential common shares |
|
|
1.2 |
|
|
1.3 |
|
|
0.8 |
Weighted-average common shares outstanding assuming dilution |
|
|
95.5 |
|
|
103.8 |
|
|
105.1 |
2022 Form 10-K Page 38
NOTES TO CONSOLIDATED FINANCIAL STATEMENTS
1. Summary of Significant Accounting Policies (continued)
(in millions, except per share data) |
|
2022 |
|
2021 |
|
2020 |
|||
Basic earnings per share |
|
|
|
|
|
|
|
|
|
Earnings per share from continuing operations attributable to Foot Locker, Inc. |
|
$ |
3.66 |
|
$ |
8.72 |
|
$ |
3.10 |
Net loss per share from discontinued operations, net of tax |
|
|
(0.04) |
|
|
— |
|
|
— |
Net earnings per share attributable to Foot Locker, Inc. |
|
$ |
3.62 |
|
$ |
8.72 |
|
$ |
3.10 |
|
|
|
|
|
|
|
|
|
|
Diluted earnings per share |
|
|
|
|
|
|
|
|
|
Earnings per share from continuing operations attributable to Foot Locker, Inc. |
|
$ |
3.62 |
|
$ |
8.61 |
|
$ |
3.08 |
Net loss per share from discontinued operations, net of tax |
|
|
(0.04) |
|
|
— |
|
|
— |
Net earnings per share attributable to Foot Locker, Inc. |
|
$ |
3.58 |
|
$ |
8.61 |
|
$ |
3.08 |
|
|
|
|
|
|
|
|
|
|
Anti-dilutive share-based awards excluded from diluted calculation |
|
|
2.7 |
|
|
1.8 |
|
|
2.5 |
Performance stock units related to our long-term incentive programs of 0.4 million for 2022, 0.4 million for 2021, and 0.4 million for 2020, have been excluded from diluted weighted-average shares. The issuance of these shares are contingent on our performance metrics as compared to the pre-established performance goals, which have not been achieved.
Cash, Cash Equivalents, and Restricted Cash
Cash consists of funds held on hand and in bank accounts. Cash equivalents include amounts on demand with banks and all highly liquid investments with original maturities of three months or less, including money market funds. Additionally, amounts due from third-party credit card processors for the settlement of debit and credit card transactions are included as cash equivalents as they are generally collected within three business days. We present book overdrafts, representing checks issued but still outstanding in excess of bank balances, as part of accounts payable.
Restricted cash represents cash that is restricted as to withdrawal or use under the terms of various agreements. Restricted cash includes amounts held in escrow in connection with various leasing arrangements in Europe, and deposits held in insurance trusts to satisfy the requirement to collateralize part of the self-insured workers’ compensation and liability claims.
The following table provides the reconciliation of cash, cash equivalents, and restricted cash, as reported on our consolidated statements of cash flows:
|
|
January 28, |
|
January 29, |
|
January 30, |
|||
($ in millions) |
|
2023 |
|
2022 |
|
2021 |
|||
Cash and cash equivalents (1) |
|
$ |
536 |
|
$ |
804 |
|
$ |
1,680 |
Restricted cash included in other current assets |
|
|
13 |
|
|
8 |
|
|
8 |
Restricted cash included in other non-current assets |
|
|
33 |
|
|
38 |
|
|
30 |
Cash, cash equivalents, and restricted cash |
|
$ |
582 |
|
$ |
850 |
|
$ |
1,718 |
| (1) | Includes cash equivalents of $41 million, $48 million, and $503 million for the years ended January 28, 2023, January 29, 2022, and February 1, 2020, respectively. |
2022 Form 10-K Page 39
NOTES TO CONSOLIDATED FINANCIAL STATEMENTS
1. Summary of Significant Accounting Policies (continued)
Merchandise Inventories and Cost of Sales
Merchandise inventories are valued at the lower of cost or market using the retail inventory method, except for WSS and atmos. Cost is determined on the last-in, first-out (“LIFO”) basis for domestic inventories and on the first-in, first-out (“FIFO”) basis for international inventories. Merchandise inventories for our WSS and atmos businesses are valued at its net realizable value using the weighted average method. Cost is determined on the FIFO basis.
The retail inventory method is used by retail companies to value inventories at cost and calculate gross margins due to its practicality. Under the retail inventory method, cost is determined by applying a cost-to-retail percentage across groupings of similar items, known as departments. The cost-to-retail percentage is applied to ending inventory at its current owned retail valuation to determine the cost of ending inventory on a department basis. We provide reserves based on current selling prices when the inventory has not been marked down to market.
Transportation, distribution center, and sourcing costs are capitalized in merchandise inventories. We expense the freight associated with transfers between our store locations in the period incurred. We maintain an accrual for shrinkage based on historical rates.
Cost of sales is comprised of the cost of merchandise, as well as occupancy, buyers’ compensation, and shipping and handling costs. The cost of merchandise is recorded net of amounts received from suppliers for damaged product returns, markdown allowances, and volume rebates, as well as cooperative advertising reimbursements received in excess of specific, incremental advertising expenses.
Minority Investments
We use the equity method to account for investments in which we have the ability to exercise significant influence over the investee’s operating and financial policies, or in which we hold a partnership or limited liability company interest in an entity with specific ownership accounts, unless we have virtually no influence over the investee’s operating and financial policies. As of January 28, 2023 and January 29, 2022, we had $51 million and $56 million, respectively, of investments which are accounted for under the equity method.
Our investments that are not accounted for under the equity method are measured either at cost, adjusted for changes in observable prices minus impairment under the practicability exception, or at fair value for our investment in the common stock of an entity that is publicly traded. As of January 28, 2023 and January 29, 2022, we had $579 million and $725 million, respectively, of investments which are accounted for under these methods.
Property and Equipment
Property and equipment are recorded at cost, less accumulated depreciation and amortization. Significant additions and improvements to property and equipment are capitalized. Major renewals or replacements that substantially extend the useful life of an asset are capitalized. Maintenance and repairs are expensed as incurred.
Depreciation and amortization are computed on a straight-line basis over the following estimated useful lives:
|
|
|
Buildings |
|
Maximum of 50 years |
Store leasehold improvements |
|
Shorter of the asset useful life or expected term of the lease |
Furniture, fixtures, and equipment |
|
3‑10 years |
Software |
|
2‑5 years |
2022 Form 10-K Page 40
NOTES TO CONSOLIDATED FINANCIAL STATEMENTS
1. Summary of Significant Accounting Policies (continued)
Internal-Use Software Development Costs
We capitalize certain external and internal computer software and software development costs incurred during the application development stage. The application development stage generally includes software design and configuration, coding, testing, and installation activities. Capitalized costs include only external direct cost of materials and services consumed in developing or obtaining internal-use software, and payroll and payroll-related costs for employees who are directly associated with and devote time to the internal-use software project. Capitalization of such costs ceases no later than the point at which the project is substantially complete and ready for its intended use. We generally amortize these costs on a straight-line basis over a period not to exceed five years. Training and maintenance costs are expensed as incurred, while upgrades and enhancements are capitalized if it is probable that such expenditures will result in additional functionality. Capitalized software, net of accumulated amortization, is included as a component of Property and equipment, net and was $87 million and $103 million at January 28, 2023 and January 29, 2022, respectively.
Cloud computing arrangements (software-as-a-service contracts) and related implementation costs that are capitalized are amortized on a straight-line basis over the contract term. These amounts are classified with prepaid expense and other long-term assets in the Consolidated Balance Sheets. Expense related to cloud computing arrangements are included in SG&A. The corresponding cash flows related to these arrangements are included in “Net cash provided by operating activities” in the Company’s Consolidated Statements of Cash Flows.
Impairment of Long-Lived Tangible Assets and Right-of-Use Assets
We perform an impairment review when circumstances indicate that the carrying value of long-lived tangible assets and right-of-use assets may not be recoverable (“a triggering event”). Our policy in determining whether a triggering event exists comprises the evaluation of measurable operating performance criteria and qualitative measures at the lowest level for which identifiable cash flows are largely independent of cash flows for other assets and liabilities, which is generally at the store level. We also evaluate triggering events at the banner level. In evaluating potential store level impairment, we compare future undiscounted cash flows expected to result from the use of the asset group to the carrying amount of the asset group. The future cash flows are estimated predominately based on our historical performance and long-range strategic plans. If the carrying amount of the asset group exceeds the estimated undiscounted future cash flows, we measure the amount of the impairment by comparing the carrying amount of the asset group with its estimated fair value. The estimation of fair value is measured by discounting expected future cash flows using a risk adjusted discount rate and using current market-based information for right-of-use assets. We estimate fair value based on the best information available using estimates, judgments, and projections as considered necessary.
Leases
Lease liabilities are recognized at the commencement date based on the present value of lease payments over the lease term for those arrangements where there is an identified asset and the contract conveys the right to control its use. The lease term includes options to extend or terminate a lease only when we are reasonably certain that we will exercise that option. The right-of-use asset is measured at the initial amount of the lease liability adjusted for lease payments made at or before the lease commencement date, initial direct costs, and any tenant improvement allowances received. For operating leases, right-of-use assets are reduced over the lease term by the straight-line lease expense recognized less the amount of accretion of the lease liability determined using the effective interest method.
We combine lease components and non-lease components. Given our policy election to combine lease and non-lease components, we also consider fixed common area maintenance (“CAM”) part of our fixed future lease payments; therefore, fixed CAM is also included in our lease liability. We recognize rent expense for operating leases as of the possession date for store leases or the commencement of the agreement for non-store leases. Rental expense, inclusive of rent holidays, concessions, and tenant allowances are recognized over the lease term on a straight-line basis. Contingent payments based upon sales and future increases determined by inflation related indices cannot be estimated at the inception of the lease and, accordingly, are charged to operations as incurred.
2022 Form 10-K Page 41
NOTES TO CONSOLIDATED FINANCIAL STATEMENTS
1. Summary of Significant Accounting Policies (continued)
As most of our leases do not provide an implicit interest rate, we use our incremental borrowing rates based on the remaining lease term to determine the present value of future lease payments. Our incremental borrowing rate for a lease is the rate of interest we would have to pay on a collateralized basis to borrow an amount equal to the lease payments under similar terms.
Leases with an initial term of 12 months or less are not recorded on the balance sheet. We recognize lease expense for short-term leases on a straight-line basis over the lease term.
Impairment of Goodwill and Other Intangible Assets
Goodwill and intangible assets with indefinite lives are reviewed for impairment annually during the first quarter of each fiscal year historically, or more frequently if impairment indicators arise. During the fourth quarter of 2022, we voluntarily changed our annual goodwill testing date from the first day of the fiscal year to the first day of our fourth quarter. The Company believes this change in method of applying the accounting principle is preferable, as it better aligns the annual impairment testing date with the most current information from the budgeting and strategic planning process and provides management with sufficient time to complete its annual assessment in advance of our year-end reporting. The change did not delay, accelerate, or avoid an impairment charge.
The review of goodwill impairment consists of either using a qualitative approach to determine whether it is more likely than not that the fair value of the assets is less than their respective carrying values or a one-step quantitative impairment test. In performing the qualitative assessment, we consider many factors in evaluating whether the carrying value of goodwill may not be recoverable, including declines in our stock price and market capitalization in relation to the book value of the Company and macroeconomic conditions affecting retail. If, based on the results of the qualitative assessment, it is concluded that it is not more likely than not that the fair value of a reporting unit exceeds its carrying value, additional quantitative impairment testing is performed. The quantitative test requires that the carrying value of each reporting unit be compared with its estimated fair value. If the carrying value of a reporting unit is greater than its fair value, a goodwill impairment charge will be recorded for the difference (up to the carrying value of goodwill).
We use a discounted cash flow approach to determine the fair value of a reporting unit. The determination of discounted cash flows of the reporting units and assets and liabilities within the reporting units requires significant estimates and assumptions. These estimates and assumptions primarily include, but are not limited to, the discount rate, terminal growth rates, earnings before depreciation and amortization, and capital expenditures forecasts. Due to the inherent uncertainty involved in making these estimates, actual results could differ from those estimates. We evaluate the merits of each significant assumption, both individually and in the aggregate, used to determine the fair value of the reporting units, as well as the fair values of the corresponding assets and liabilities within the reporting units.
For our annual impairment review conducted in the fourth quarter of 2022, we concluded the fair value of each reporting unit exceeded its carrying value. Goodwill is net of accumulated impairment charges of $167 million for all periods presented. Refer to Note 2 for further detail regarding acquisitions made during 2021.
Intangible assets with indefinite lives are tested for impairment if impairment indicators arise and, at a minimum, annually. The impairment review for intangible assets with indefinite lives consists of either performing a qualitative or a quantitative assessment. If the results of the qualitative assessment indicate that it is more likely than not that the fair value of the indefinite-lived intangible is less than its carrying amount, or if we elect to proceed directly to a quantitative assessment, we calculate the fair value using a discounted cash flow method, based on the relief from royalty method, and compare the fair value to the carrying value to determine if the asset is impaired. Intangible assets that are determined to have finite lives are amortized over their useful lives and are measured for impairment only when events or changes in circumstances indicate that the carrying value may be impaired.
2022 Form 10-K Page 42
NOTES TO CONSOLIDATED FINANCIAL STATEMENTS
1. Summary of Significant Accounting Policies (continued)
Contingent Consideration
As a result of our purchase of atmos, we recognized contingent consideration, as a component of the purchase consideration is payable contingent on the achievement of certain sales and EBITDA performance. See Note 2 for further details. Contingent consideration is classified as a liability when it will be settled in cash or a variable number of shares (or a combination thereof), and the amount of the payment is not dependent upon the fair value of the Company’s common stock. The fair value of the contingent consideration liability is estimated using an option pricing model simulation that determines an average projected payment value across numerous iterations. This technique determines projected payments based on simulated sales and EBITDA derived from an internal forecast, adjusted for selected revenue and EBITDA volatilities and risk premiums based on market data for comparable guideline public companies. The projected payments are then discounted back to the valuation date at the Company’s cost of debt using a term commensurate with the contractual payment dates.
The contingent consideration liability will be measured at fair value on a recurring basis until the contingency is resolved. Changes in the estimated fair value of the contingent consideration liability will be reflected in operating income or expense in the Consolidated Statements of Operations.
Derivative Financial Instruments
All derivative financial instruments are recorded in our Consolidated Balance Sheets at their fair values. For derivatives designated as a hedge, and effective as part of a hedge transaction, the effective portion of the gain or loss on the hedging derivative instrument is reported as a component of other comprehensive income/loss or as a basis adjustment to the underlying hedged item and reclassified to earnings in the period in which the hedged item affects earnings. The effective portion of the gain or loss on hedges of foreign net investments is generally not reclassified to earnings unless the net investment is disposed of. To the extent derivatives do not qualify or are not designated as hedges, or are ineffective, their changes in fair value are recorded in earnings immediately, which may subject us to increased earnings volatility.
Income Taxes
We account for our income taxes under the asset and liability method, which requires the recognition of deferred tax assets and liabilities for the expected future tax consequences of events that have been included in the financial statements. Under this method, deferred tax assets and liabilities are determined on the basis of the differences between the financial statements and the tax basis of assets and liabilities, using enacted tax rates in effect for the year in which the differences are expected to reverse. Deferred tax assets are recognized for tax credits and net operating loss carryforwards, reduced by a valuation allowance, which is established when it is more likely than not that some portion or all of the deferred tax assets will not be realized. The effect of a change in tax rates on deferred tax assets and liabilities is recognized in income in the period that includes the enactment date.
We recognize net deferred tax assets to the extent that we believe these assets are more likely than not to be realized. In making such a determination, we consider all available positive and negative evidence, including future reversals of existing taxable temporary differences, projected future taxable income, tax-planning strategies, and results of recent operations. If we determine that we would be able to realize our deferred tax assets in the future in excess of their net recorded amount, we would make an adjustment to the deferred tax asset valuation allowance, which would reduce the provision for income taxes.
A taxing authority may challenge positions that we adopted in our income tax filings. Accordingly, we may apply different tax treatments for transactions in filing our income tax returns than for income tax financial reporting. We regularly assess our tax positions for such transactions and record reserves for those differences when considered necessary. Tax positions are recognized only when it is more likely than not, based on technical merits, that the positions will be sustained upon examination. Tax positions that meet the more-likely-than-not threshold are measured using a probability weighted approach as the largest amount of tax benefit that is greater than fifty percent likely of being realized upon settlement. Whether the more-likely-than-not recognition threshold is met for a tax position is a matter of judgment based on the individual facts and circumstances of that position evaluated in light of all available evidence. We recognize interest and penalties related to unrecognized tax benefits within income tax expense in the accompanying Consolidated Statement of Operations. Accrued interest and penalties are included within the related tax liability line in the Consolidated Balance Sheet.
2022 Form 10-K Page 43
NOTES TO CONSOLIDATED FINANCIAL STATEMENTS
1. Summary of Significant Accounting Policies (continued)
Pension and Postretirement Obligations
Pension benefit obligations and net periodic pension costs are calculated using actuarial assumptions. Two key assumptions used in accounting for pension liabilities and expenses are the discount rate and expected rate of return on plan assets. The discount rate for the U.S. plans is determined by reference to the Bond:Link interest rate model based upon a portfolio of highly-rated U.S. corporate bonds with individual bonds that are theoretically purchased to settle the plan’s anticipated cash outflows. The cash flows are discounted to their present value and an overall discount rate is determined. The discount rate selected to measure the present value of the Canadian benefit obligations was developed by using that plan’s bond portfolio indices, which match the benefit obligations. We measure our plan assets and benefit obligations using the month-end date that is closest to our fiscal year end. The expected return on plan assets assumption is derived using the current and expected asset allocation of the pension plan assets and considering historical as well as expected performance of those assets.
Insurance Liabilities
We are primarily self-insured for health care, workers’ compensation, and general liability costs. Accordingly, provisions are made for actuarially determined estimates of discounted future claim costs for such risks, for the aggregate of claims reported, and claims incurred but not yet reported. Self-insured liabilities totaled $13 million for January 28, 2023, $14 million for January 29, 2022 and $13 million for January 30, 2021. Workers’ compensation and general liability reserves are discounted using a risk-free interest rate. Imputed interest expense related to these liabilities was not significant for any of the periods presented.
Treasury Stock Retirement
We periodically retire treasury shares that we acquire through share repurchases and return those shares to the status of authorized but unissued. We account for treasury stock transactions under the cost method. For each reacquisition of common stock, the number of shares and the acquisition price for those shares is added to the existing treasury stock count and total value. When treasury shares are retired, our policy is to allocate the excess of the repurchase price over the par value of shares acquired to both retained earnings and additional paid-in capital. The portion allocated to additional paid-in capital is determined by applying a percentage, which is determined by dividing the number of shares to be retired by the number of shares issued, to the balance of additional paid-in capital as of the retirement date.
We retired 6,019,212 and 5,474,288 shares of our common stock held in treasury during 2022 and 2021, respectively. The shares were returned to the status of authorized but unissued. As a result, treasury stock decreased by $213 million and $260 million as of January 28, 2023 and January 29, 2022, respectively.
Foreign Currency Translation
The functional currency of our international operations is the applicable local currency. The translation of the applicable foreign currency into U.S. dollars is performed for balance sheet accounts using current exchange rates in effect at the balance sheet date and for revenue and expense accounts using the weighted-average rates of exchange prevailing during the year. The unearned gains and losses resulting from such translation are included as a separate component of accumulated other comprehensive loss (“AOCL”) within shareholders’ equity.
Recently Adopted Accounting Pronouncements
Recently issued accounting pronouncements did not, or are not believed by management to, have a material effect on our present or future consolidated financial statements.
Recent Accounting Pronouncements Not Yet Adopted
All recently issued accounting pronouncements are not expected to have a material effect on the consolidated financial statements.
2022 Form 10-K Page 44
NOTES TO CONSOLIDATED FINANCIAL STATEMENTS
2. Acquisitions
WSS
In 2021, the Company, through its wholly-owned subsidiary Foot Locker Retail, Inc., acquired 100% of the shares of Eurostar, Inc., a Delaware corporation operating as WSS (“WSS”). WSS is a U.S.-based off-mall athletic footwear and apparel retailer, focused on the Hispanic consumer, which operated 93 stores at the acquisition, primarily on the West Coast.
We believe that this acquisition enhances our growth opportunities in North America and creates further diversification and differentiation in terms of both customers and products.
The results of WSS are included in our consolidated financial statements since the acquisition date. The proforma effects of the acquisition have not been presented, as their effects were not significant to the consolidated results of operations.
The aggregate purchase price for the acquisition was $809 million ($2 million paid in 2022 and $737 million paid in 2021, net of cash acquired) and was funded with available cash. During 2022, we recorded insignificant changes to the value of net assets acquired related to income tax balances.
The following table represents the final allocation of the purchase price for WSS. We determined that the WSS tradename will have an indefinite life and will not be amortized. The excess purchase price over the fair value of assets was allocated to goodwill.
($ in millions) |
|
|
|
Assets acquired: |
|
|
|
Cash and cash equivalents |
|
$ |
70 |
Merchandise inventories |
|
|
82 |
Other current assets |
|
|
10 |
Property and equipment, net |
|
|
133 |
Operating lease right-of-use assets |
|
|
143 |
Tradenames |
|
|
296 |
Customer relationships |
|
|
13 |
Other assets |
|
|
4 |
Liabilities assumed: |
|
|
|
Accounts payable and accrued liabilities |
|
$ |
(59) |
Current portion of obligations under finance leases |
|
|
(3) |
Current portion of lease obligations |
|
|
(19) |
Long-term portion of obligations under finance leases |
|
|
(50) |
Long-term lease obligations |
|
|
(127) |
Deferred taxes |
|
|
(87) |
Other liabilities |
|
|
(4) |
|
|
|
|
Goodwill |
|
|
407 |
Total purchase price |
|
$ |
809 |
atmos
Effective November 1, 2021, the Company, acquired certain entities collectively operated as atmos, headquartered in Japan. atmos is a digitally led, culturally-connected global brand featuring premium sneakers and apparel, an exclusive in-house label, collaborative relationships with leading vendors in the sneaker ecosystem, experiential stores, and a robust omni-channel platform.
The aggregate purchase price for the acquisition was $372 million ($12 million paid in 2022 and $319 million paid in 2021, net of cash acquired) subject to adjustment for the finalization of the purchase price. At closing, we placed $20 million related to certain indemnifications and this indemnification escrow will be released in May 2023, unless there is a pending claim. The acquisition was funded with available cash.
2022 Form 10-K Page 45
NOTES TO CONSOLIDATED FINANCIAL STATEMENTS
2. Acquisitions (continued)
The purchase price includes contingent consideration which can reach up to $111 million based on achieving certain revenue growth and EBITDA performance targets. The contingent consideration was initially valued at $35 million in 2021 and during 2022 that amount was reduced to $4 million, through impairment and other in our Consolidated Statements of Operations.
The results of atmos are included in our consolidated financial statements since the acquisition date. The proforma effects of the acquisition have not been presented, as their effects were not significant to the consolidated results of operations.
The table below summarizes the final allocation of the purchase price to the fair value of assets acquired for atmos using the exchange rate in effect as of the date of the acquisition. The excess purchase price over the fair value of assets was allocated to goodwill. Changes to amounts reported in the prior year resulted in a change to goodwill of $7 million and primarily was related to intangibles. These adjustments did not have a significant effect on the consolidated results of operations. We determined that the atmos tradenames will have an indefinite life and will not be amortized. Goodwill of $30 million is deductible for tax purposes over 15 years.
($ in millions) |
|
|
|
Assets acquired: |
|
|
|
Cash and cash equivalents |
|
$ |
6 |
Merchandise inventories |
|
|
20 |
Other current assets |
|
|
12 |
Property and equipment, net |
|
|
7 |
Operating lease right-of-use assets |
|
|
44 |
Tradenames |
|
|
130 |
Customer relationships |
|
|
9 |
Other assets |
|
|
6 |
Liabilities assumed: |
|
|
|
Accounts payable |
|
$ |
(10) |
Current portion of lease obligations |
|
|
(10) |
Other current liabilities |
|
|
(8) |
Long-term lease obligations |
|
|
(35) |
Deferred taxes |
|
|
(40) |
Other liabilities |
|
|
(8) |
|
|
|
|
Goodwill (1) |
|
|
249 |
Total purchase price (2) |
|
$ |
372 |
| (1) | Goodwill represented on this table is at the exchange rate in effect as of the date of acquisition. |
| (2) | Total purchase price consists of $337 million in cash and $35 million of contingent consideration. |
3. Revenue
The table below presents sales disaggregated by sales channel as well as licensing revenue earned from our various franchised arrangements. Sales are attributable to the channel in which the sales transaction is initiated.
($ in millions) |
2022 |
|
2021 |
|
2020 |
|||
Sales by Channel |
|
|
|
|
|
|
|
|
Stores |
$ |
7,219 |
|
$ |
7,029 |
|
$ |
5,447 |
Direct-to-customers |
|
1,528 |
|
|
1,929 |
|
|
2,101 |
Total sales |
|
8,747 |
|
|
8,958 |
|
|
7,548 |
Licensing revenue |
|
12 |
|
|
10 |
|
|
6 |
Total revenue |
$ |
8,759 |
|
$ |
8,968 |
|
$ |
7,554 |
2022 Form 10-K Page 46
NOTES TO CONSOLIDATED FINANCIAL STATEMENTS
3. Revenue (continued)
Revenue by geographic area is presented in the following table. Revenue is attributed to the country in which the transaction is fulfilled.
($ in millions) |
2022 |
|
2021 |
|
2020 |
|||
Revenue by Geography |
|
|
|
|
|
|
|
|
United States |
$ |
5,981 |
|
$ |
6,477 |
|
$ |
5,581 |
International |
|
2,778 |
|
|
2,491 |
|
|
1,973 |
Total revenue |
$ |
8,759 |
|
$ |
8,968 |
|
$ |
7,554 |
For the year ended January 28, 2023, the countries that comprised the majority of the revenue for the international category were Canada, France, Italy, Australia, and Germany. No other individual country included in the international category was significant.
Sales by banner and operating segments are presented in the following table.
($ in millions) |
2022 |
|
2021 |
|
2020 |
|||
Foot Locker |
$ |
3,304 |
|
$ |
3,295 |
|
$ |
2,835 |
Champs Sports |
|
1,681 |
|
|
1,939 |
|
|
1,610 |
Kids Foot Locker |
|
708 |
|
|
724 |
|
|
590 |
WSS |
|
604 |
|
|
195 |
|
|
— |
Other |
|
126 |
|
|
742 |
|
|
903 |
North America |
|
6,423 |
|
|
6,895 |
|
|
5,938 |
Foot Locker |
|
1,628 |
|
|
1,565 |
|
|
1,250 |
Sidestep |
|
94 |
|
|
76 |
|
|
46 |
Other |
|
— |
|
|
— |
|
|
47 |
EMEA |
|
1,722 |
|
|
1,641 |
|
|
1,343 |
Foot Locker |
|
414 |
|
|
373 |
|
|
267 |
atmos |
|
188 |
|
|
49 |
|
|
— |
Asia Pacific |
|
602 |
|
|
422 |
|
|
267 |
Total sales |
$ |
8,747 |
|
$ |
8,958 |
|
$ |
7,548 |
Contract Liabilities
The table below presents the activity of our gift card liability balance:
|
|
January 28, |
|
January 29, |
||
($ in millions) |
|
2023 |
|
2022 |
||
Gift card liability at beginning of year |
|
$ |
46 |
|
$ |
41 |
Liabilities acquired - WSS |
|
|
— |
|
|
1 |
Redemptions |
|
|
(259) |
|
|
(249) |
Breakage recognized in sales |
|
|
(17) |
|
|
(17) |
Activations |
|
|
266 |
|
|
271 |
Foreign currency fluctuations |
|
|
— |
|
|
(1) |
Gift card liability |
|
$ |
36 |
|
$ |
46 |
We elected not to disclose the information about remaining performance obligations since the amount of gift cards redeemed after 12 months is not significant for both 2022 and 2021.
4. Segment Information
We have integrated all available shopping channels including stores, websites, apps, social channels, and catalogs. Store sales are primarily fulfilled from the store’s inventory but may also be shipped from our distribution centers or from a different store location if an item is not available at the original store. Direct-to-customer orders are generally shipped to our customers through our distribution centers but may also be shipped from a store or a combination of our distribution centers and stores depending on the availability of particular items.
2022 Form 10-K Page 47
NOTES TO CONSOLIDATED FINANCIAL STATEMENTS
4. Segment Information (continued)
Our operating segments are identified according to how our business activities are managed and evaluated by our chief operating decision maker, our CEO. We have three operating segments, North America, EMEA (Europe, Middle East and Africa), and Asia Pacific. Our North America operating segment includes the results of the following banners in the U.S. and Canada: Foot Locker, Kids Foot Locker, Lady Foot Locker, Champs Sports, Footaction, and WSS, including each of their related e-commerce businesses, as well as our Eastbay business that included internet, catalog, and team sales. Our EMEA operating segment includes the results of the following banners in Europe: Foot Locker, Sidestep, and Kids Foot Locker, including each of their related e-commerce businesses. Our Asia Pacific operating segment includes the results of Foot Locker in Australia, New Zealand, and Asia and atmos operating primarily in Japan, as well as their related e-commerce businesses. Additionally, the EMEA and Asia Pacific operating segments include licensing revenue. We further aggregated these operating segments into one reportable segment based upon their shared customer base and similar economic characteristics.
We evaluate performance based on several factors, of which the primary financial measure is the banner’s financial results referred to as division profit. Division profit reflects income before income taxes, impairment and other, corporate expense, interest expense, net and other income / (expense), net.
The following table summarizes our results:
($ in millions) |
|
2022 |
|
2021 |
2020 |
|||
Division profit |
|
$ |
844 |
|
$ |
1,171 |
$ |
497 |
Less: Impairment and other (1) |
|
|
112 |
|
|
172 |
|
117 |
Less: Corporate expense (2) |
|
|
151 |
|
|
129 |
|
71 |
Income from operations |
|
|
581 |
|
|
870 |
|
309 |
Interest expense, net |
|
|
(15) |
|
|
(14) |
|
(7) |
Other income / (expense), net (3) |
|
|
(42) |
|
|
384 |
|
192 |
Income from continuing operations before income taxes |
|
$ |
524 |
|
$ |
1,240 |
$ |
494 |
| (1) | See Note 5, Impairment and Other for additional information on these amounts. |
| (2) | Corporate expense for all years presented reflects the reallocation of expense between corporate and the operating divisions. No change was made during 2022. Based upon annual internal studies of corporate expense, the allocation of such expenses to the operating divisions was increased by $19 million for 2021 and $28 million for 2020, thereby reducing corporate expense. |
| (3) | See Note 6, Other Income / (expense), net for additional information on these amounts. |
Long-lived asset information as of and for the fiscal years ended January 28, 2023, January 29, 2022, and January 30, 2021 is presented in the following table. Long-lived assets reflect property and equipment and lease right-of-use assets.
($ in millions) |
2022 |
|
2021 |
|
2020 |
|||
Long-Lived Assets |
|
|
|
|
|
|
|
|
United States |
$ |
2,152 |
|
$ |
2,285 |
|
$ |
2,218 |
International |
|
1,211 |
|
|
1,248 |
|
|
1,286 |
Total long-lived assets |
$ |
3,363 |
|
$ |
3,533 |
|
$ |
3,504 |
For the year ended January 28, 2023, the countries that comprised the majority of long-lived assets for the international category were Canada, France, Italy, Australia, Germany, and England. No other individual country included in the international category was significant as of January 28, 2023.
|
|
Depreciation and |
|
|
|
|
|
|
|
|
|
|
|
|
|
|
|
|
|
|
|||||||
|
|
Amortization |
|
Capital Expenditures (1) |
|
Total Assets |
|||||||||||||||||||||
($ in millions) |
|
2022 |
|
2021 |
|
2020 |
|
2022 |
|
2021 |
|
2020 |
|
2022 |
|
2021 |
|
2020 |
|||||||||
Division |
|
$ |
169 |
|
$ |
163 |
|
$ |
152 |
|
$ |
200 |
|
$ |
127 |
|
$ |
88 |
|
$ |
7,178 |
|
$ |
7,184 |
|
$ |
5,159 |
Corporate |
|
|
39 |
|
|
34 |
|
|
24 |
|
|
85 |
|
|
82 |
|
|
71 |
|
|
729 |
|
|
951 |
|
|
1,884 |
Total |
|
$ |
208 |
|
$ |
197 |
|
$ |
176 |
|
$ |
285 |
|
$ |
209 |
|
$ |
159 |
|
$ |
7,907 |
|
$ |
8,135 |
|
$ |
7,043 |
(1) Represents cash capital expenditures for all years presented.
2022 Form 10-K Page 48
NOTES TO CONSOLIDATED FINANCIAL STATEMENTS
5. Impairment and Other
($ in millions) |
|
2022 |
|
2021 |
|
2020 |
|||
Impairment of long-lived assets and right-of-use assets |
|
$ |
58 |
|
$ |
92 |
|
$ |
77 |
Transformation consulting |
|
|
42 |
|
|
— |
|
|
— |
Reorganization costs |
|
|
22 |
|
|
4 |
|
|
7 |
Litigation costs |
|
|
9 |
|
|
— |
|
|
— |
Other intangible asset impairments |
|
|
8 |
|
|
2 |
|
|
— |
Acquisition and integration costs |
|
|
4 |
|
|
24 |
|
|
— |
Change in fair value of contingent consideration |
|
|
(31) |
|
|
— |
|
|
— |
Impairment of investments |
|
|
— |
|
|
42 |
|
|
4 |
Lease termination costs |
|
|
— |
|
|
15 |
|
|
— |
(Insurance recovery)/ losses related to social unrest |
|
|
— |
|
|
(7) |
|
|
8 |
Runners Point shut down |
|
|
— |
|
|
— |
|
|
19 |
Pension litigation related charges |
|
|
— |
|
|
— |
|
|
2 |
Total impairment and other |
|
$ |
112 |
|
$ |
172 |
|
$ |
117 |
During the fourth quarter of 2022, we conducted an impairment review for approximately 142 underperforming stores, which included 70 Sidestep stores. The Company has made the strategic decision to shut down this banner during 2023. We evaluated the long-lived assets, including the right-of-use assets and recorded non-cash charges of $53 million to write down store fixtures, leasehold improvements, and right-of-use assets for approximately 110 of these stores, which included $17 million for Sidestep stores. During the first and second quarters of 2022 we recorded impairment charges of $5 million related to long-lived assets and right-of-use assets, as well as accelerated tenancy charges.
Impairment of long-lived assets and right of use assets recorded during 2021 related primarily to the decision to shut down our Footaction banner. The amounts in 2020 primarily represented impairment related to our stores operating in Europe, which had a triggering event caused by the COVID-19 pandemic. All periods reflect charges associated with our annual fourth quarter impairment review of underperforming stores.
During 2022, we incurred $42 million of transformation consulting expense. Additionally, we incurred $22 million of reorganization costs, primarily severance, due to the reduction of support functions as we streamlined the organization for operational efficiency and included $4 million of other costs related to the wind down of the Sidestep banner. Associated with the decision to shut down the Sidestep banner, we recorded an $8 million intangible asset impairment on the Sidestep tradename.
During the fourth quarter of 2022, we recorded a $9 million charge for litigation, representing a pending settlement of a wage/hour matter.
In connection with the acquisition of atmos in the prior year, the purchase included contingent consideration based on the achievement of certain sales and EBITDA metrics. The fair value was initially measured as part of the purchase price as $35 million. As required, the adjustment of its fair value was recorded through earnings and represents a benefit of $31 million recorded in the fourth quarter of 2022.
During 2022 and 2021 we recorded acquisition and integration costs of $4 million and $24 million, respectively, which primarily represented investment banking and integration consulting fees related to the WSS and atmos acquisitions.
Over the last several years we have made several minority investments in early-stage companies. In connection with these investments, we recorded non-cash charges of $42 million and $4 million, in 2021 and 2020 respectively, related to the write-down of certain minority investments due to their underperformance.
2022 Form 10-K Page 49
NOTES TO CONSOLIDATED FINANCIAL STATEMENTS
6. Other Income / (Expense), net
Other income / expense, net generally includes non-operating items, such as:
| - | changes in value for our investments accounted for using the fair value measurement alternative, which is at cost adjusted for changes in observable prices minus impairment, |
| - | our share of earnings or losses related to our equity method investments, |
| - | net benefit expense or income related to our pension and postretirement programs, excluding the service cost component, |
| - | changes in fair value, premiums paid, and realized gains associated with foreign currency option contracts, |
| - | changes in the market value of our available-for-sale security, and |
premiums paid to repurchase and retire bonds.
($ in millions) |
|
2022 |
|
2021 |
|
2020 |
|||
Minority investment in Retailors, Ltd. |
|
$ |
(61) |
|
$ |
77 |
|
$ |
— |
Share of earnings (losses) related to other minority investments |
|
|
1 |
|
|
3 |
|
|
(1) |
Team Sales divestiture |
|
|
19 |
|
|
— |
|
|
— |
Minority investment in GOAT |
|
|
— |
|
|
290 |
|
|
190 |
Pension and postretirement net benefit income, excluding service cost |
|
|
— |
|
|
7 |
|
|
5 |
Other |
|
|
(1) |
|
|
7 |
|
|
(2) |
Total other income / (expense), net |
|
$ |
(42) |
|
$ |
384 |
|
$ |
192 |
During 2021, we invested $68 million to take a common stock minority stake in a public entity, Retailors, Ltd., which is traded on the Tel Aviv stock exchange. This investment was at a discount to the initial public offering price, resulting in a non-cash gain of $9 million in 2021. Additionally, changes in fair value related to our Retailors, Ltd. investment generated non-cash gains of $68 million during 2021. During 2022, we sold our position in this investment. A loss of $62 million was recorded during 2022, partially offset by $1 million of dividend income. Our minority investment in GOAT is accounted for using the fair value measurement alternative, which is at cost adjusted for changes in observable prices minus impairment. GOAT received funding at higher valuations in both 2021 and 2020 resulting in non-cash gains of $290 million and $190 million, respectively.
During 2021, we recorded $7 million of insurance recoveries in excess of the losses sustained in the prior year related to the social unrest.
7. Merchandise Inventories
($ in millions) |
|
January 28, |
|
January 29, |
||
LIFO inventories |
|
$ |
1,093 |
|
$ |
788 |
FIFO inventories |
|
|
550 |
|
|
478 |
Total merchandise inventories |
|
$ |
1,643 |
|
$ |
1,266 |
The value of our LIFO inventories as calculated on a LIFO basis, approximates their value as calculated on a FIFO basis.
8. Other Current Assets
($ in millions) |
|
January 28, |
|
January 29, |
||
Net receivables |
|
$ |
160 |
|
$ |
134 |
Prepaid income taxes |
|
|
62 |
|
|
56 |
Other prepaid expenses |
|
|
71 |
|
|
64 |
Prepaid rent |
|
|
19 |
|
|
19 |
Restricted cash |
|
|
13 |
|
|
8 |
Other |
|
|
17 |
|
|
12 |
|
|
$ |
342 |
|
$ |
293 |
2022 Form 10-K Page 50
NOTES TO CONSOLIDATED FINANCIAL STATEMENTS
9. Property and Equipment, net
($ in millions) |
|
January 28, |
|
January 29, |
||
Owned properties: |
|
|
|
|
|
|
Land |
|
$ |
4 |
|
$ |
4 |
Buildings |
|
|
53 |
|
|
52 |
Furniture, fixtures, equipment and software development costs |
|
|
1,379 |
|
|
1,329 |
|
|
|
1,436 |
|
|
1,385 |
Less: accumulated depreciation |
|
|
(948) |
|
|
(902) |
|
|
|
488 |
|
|
483 |
Finance leases: |
|
|
|
|
|
|
Assets under finance leases |
|
|
65 |
|
|
65 |
Less: accumulated amortization |
|
|
(12) |
|
|
(6) |
|
|
|
53 |
|
|
59 |
Alterations to leased and owned buildings: |
|
|
|
|
|
|
Cost |
|
|
967 |
|
|
954 |
Less: accumulated amortization |
|
|
(588) |
|
|
(579) |
|
|
|
379 |
|
|
375 |
|
|
$ |
920 |
|
$ |
917 |
10. Other Intangible Assets, net
|
|
|
January 28, 2023 |
|
|
|
|
January 29, 2022 |
||||||||||||
|
|
Gross |
|
Accum. |
|
Net |
|
Life in |
|
Gross |
|
Accum. |
|
Net |
||||||
($ in millions) |
|
value |
|
amort. |
|
value |
|
Years (3) |
|
value |
|
amort. |
|
value |
||||||
Amortized intangible assets: (1) |
|
|
|
|
|
|
|
|
|
|
|
|
|
|
|
|
|
|
|
|
Lease acquisition costs |
|
$ |
102 |
|
$ |
(100) |
|
$ |
2 |
|
9.4 |
|
$ |
107 |
|
$ |
(104) |
|
$ |
3 |
Trademarks/tradenames |
|
|
18 |
|
|
(18) |
|
|
— |
|
— |
|
|
18 |
|
|
(18) |
|
|
— |
Customer lists |
|
|
20 |
|
|
(9) |
|
|
11 |
|
3.0 |
|
|
13 |
|
|
(2) |
|
|
11 |
|
|
$ |
140 |
|
$ |
(127) |
|
$ |
13 |
|
5.0 |
|
$ |
138 |
|
$ |
(124) |
|
$ |
14 |
|
|
|
|
|
|
|
|
|
|
|
|
|
|
|
|
|
|
|
|
|
Indefinite life intangible assets: (1) |
|
|
|
|
|
|
|
|
|
|
|
|
|
|
|
|
|
|
|
|
Trademarks/tradenames (2) |
|
|
|
|
|
|
|
$ |
413 |
|
|
|
|
|
|
|
|
|
$ |
440 |
|
|
|
|
|
|
|
|
$ |
426 |
|
|
|
|
|
|
|
|
|
$ |
454 |
| (1) | The change in the ending balances also reflect the effect of foreign currency fluctuations due primarily to the movements of the Yen in relation to the U.S. dollar. |
| (2) | Includes a non-cash impairment charge of $8 million and $2 million recorded in 2022 and 2021, respectively, see Note 5, Impairment and Other. |
| (3) | Represents the weighted-average useful life as of January 28, 2023 and excludes those assets that are fully amortized. |
In connection with the acquisitions of WSS and atmos, we recognized indefinite life intangible assets of $296 million for WSS related tradenames, $130 million for atmos related tradenames (a provisional amount of $135 million was recorded at January 29, 2022). Additionally, we recognized customer list intangible assets of $13 million for WSS and $9 million for atmos, both of which will be amortized over 3 years. The intangibles related to atmos were originally recorded at the exchange rate in effect as of the date of acquisition and are presented in the above table at current period exchange rates.
Amortizing intangible assets primarily represent the WSS and atmos customer lists and lease acquisition costs, which are amounts that are required to secure prime lease locations, primarily in Europe. Amortization expense recorded is as follows:
($ in millions) |
|
2022 |
|
2021 |
|
2020 |
|||
Amortization expense |
|
$ |
8 |
|
$ |
5 |
|
$ |
3 |
2022 Form 10-K Page 51
NOTES TO CONSOLIDATED FINANCIAL STATEMENTS
10. Other Intangible Assets, net (continued)
Estimated future amortization expense for finite lived intangibles for the next five years is as follows:
($ in millions) |
|
|
|
2023 |
|
$ |
7 |
2024 |
|
|
5 |
2025 |
|
|
1 |
11. Other Assets
($ in millions) |
|
January 28, |
|
January 29, |
||
Restricted cash |
|
$ |
33 |
|
$ |
38 |
Security deposits |
|
|
29 |
|
|
33 |
Pension asset |
|
|
4 |
|
|
21 |
Auction rate security |
|
|
6 |
|
|
7 |
Other |
|
|
20 |
|
|
22 |
|
|
$ |
92 |
|
$ |
121 |
12. Accrued and Other Liabilities
($ in millions) |
|
January 28, |
|
January 29, |
||
Other payroll and payroll related costs, excluding taxes |
|
$ |
99 |
|
$ |
78 |
Incentive bonuses |
|
|
72 |
|
|
82 |
Taxes other than income taxes |
|
|
69 |
|
|
75 |
Property and equipment (1) |
|
|
39 |
|
|
58 |
Customer deposits |
|
|
39 |
|
|
50 |
Rent related costs |
|
|
35 |
|
|
57 |
Advertising |
|
|
30 |
|
|
34 |
Income taxes payable |
|
|
39 |
|
|
11 |
Other |
|
|
146 |
|
|
116 |
|
|
$ |
568 |
|
$ |
561 |
| (1) | Accruals for property and equipment are excluded from the Statements of Cash Flows for all years presented. |
13. Revolving Credit Facility
We have a $600 million asset-based revolving credit facility that is scheduled to expire on July 14, 2025 (as amended, “2020 Credit Agreement”).
In 2021, we entered into an amendment to the 2020 Credit Agreement (“Amended Credit Agreement”). The amendment provides for, among other things, (i) reducing the interest rates and commitment fees applicable to the loans and commitments, respectively, as described below, and (ii) reducing the “floor” applicable. The amendment provides that the interest rate applicable to loans drawn under the credit facility will be equal to, at our option, either a base rate, determined by reference to the federal funds rate, plus a margin of 0.25% to 0.75% per annum, or a Eurodollar rate, determined by reference to LIBOR, plus a margin of 1.25% to 1.75% per annum, in each case, depending on availability under the Amended Credit Agreement. In addition, we will pay a commitment fee of 0.25% per annum on the unused portion of the commitments under the Amended Credit Agreement. No events of default occurred during 2022.
We may use the Amended Credit Agreement to, among other things, support standby letters of credit in connection with insurance programs. The letters of credit outstanding as of January 28, 2023 were not significant.
The unamortized balance of fees paid in connection with the credit facility at January 28, 2023 was $3 million. Interest expense, including facility fees, related to the revolving credit facility was $3 million, $3 million, and $5 million for 2022, 2021, and 2020, respectively.
2022 Form 10-K Page 52
NOTES TO CONSOLIDATED FINANCIAL STATEMENTS
14. Long-Term Debt and Obligations Under Finance Leases
The components of long-term debt and obligations under finance leases are as follows:
|
|
January 28, |
|
January 29, |
||
($ in millions) |
|
2023 |
|
2022 |
||
4% Senior Notes due 2029 |
|
$ |
395 |
|
$ |
394 |
Obligations under finance leases |
|
|
57 |
|
|
63 |
|
|
$ |
452 |
|
$ |
457 |
Current portion of debt and obligations under finance leases |
|
|
6 |
|
|
6 |
|
|
$ |
446 |
|
$ |
451 |
Interest expense related to long-term debt and the amortization of the associated debt issuance costs was $17 million, $12 million and $8 million for 2022, 2021, and 2020, respectively.
15. Other Liabilities
($ in millions) |
|
January 28, |
|
January 29, |
||
Deferred taxes |
|
$ |
237 |
|
$ |
224 |
Income taxes |
|
|
31 |
|
|
28 |
Pension benefits |
|
|
21 |
|
|
16 |
Contingent consideration |
|
|
4 |
|
|
35 |
Other |
|
|
35 |
|
|
40 |
|
|
$ |
328 |
|
$ |
343 |
\
16. Leases
The majority of our leases are operating leases for our company-operated retail store locations. We also lease, among other things, distribution and warehouse facilities, and office space for corporate administrative purposes. Operating lease periods generally range from 5 to 10 years and generally contain rent escalation provisions. Some of the store leases contain renewal options with varying terms and conditions.
Amounts recognized in the Consolidated Balance Sheet were as follows:
|
|
January 28, |
|
January 29, |
||
($ in millions) |
|
2023 |
|
2022 |
||
Operating leases: |
|
|
|
|
|
|
Operating lease right-of-use assets |
|
$ |
2,443 |
|
$ |
2,616 |
|
|
|
|
|
|
|
Operating lease liabilities classified as current |
|
$ |
544 |
|
$ |
572 |
Operating lease liabilities classified as long-term |
|
|
2,230 |
|
|
2,363 |
Total operating lease liabilities |
|
$ |
2,774 |
|
$ |
2,935 |
|
|
January 28, |
|
January 29, |
||
($ in millions) |
|
2023 |
|
2022 |
||
Finance leases: |
|
|
|
|
|
|
Property and equipment, net |
|
$ |
53 |
|
$ |
59 |
|
|
|
|
|
|
|
Finance lease obligations classified as current |
|
$ |
6 |
|
$ |
6 |
Finance lease obligations classified as long-term |
|
|
51 |
|
|
57 |
Total finance lease obligations |
|
$ |
57 |
|
$ |
63 |
2022 Form 10-K Page 53
NOTES TO CONSOLIDATED FINANCIAL STATEMENTS
16. Leases (continued)
Other information related to our leases as of January 28, 2023 and January 29, 2022 consisted of the following:
|
|
|
January 28, |
|
January 29, |
||
|
|
|
2023 |
|
2022 |
||
Weighted-average remaining lease term (years) |
|
|
|
|
|
|
|
Operating leases |
|
|
6.5 |
|
|
6.7 |
|
Finance leases |
|
|
14.7 |
|
|
15.0 |
|
Weighted-average discount rate |
|
|
|
|
|
|
|
Operating leases |
|
|
5.0 |
% |
|
4.7 |
% |
Finance leases |
|
|
4.3 |
% |
|
4.2 |
% |
Total lease costs include fixed operating lease costs, variable lease costs, and short-term lease costs. Most of our real estate leases require us to pay certain expenses, such as CAM costs, real estate taxes, and other executory costs, of which the fixed portion is included in operating lease costs. Variable lease costs include non-lease components which are not fixed and are not included in determining the present value of our lease liability. Variable lease costs also include amounts based on a percentage of gross sales in excess of specified levels that are recognized when probable.
Lease costs which relate to retail stores and distribution centers are classified within cost of sales, while non-store lease costs are included in SG&A. Amortization of leased equipment assets is classified in depreciation and amortization. The components of lease cost for 2022, 2021, and 2020 were as follows:
($ in millions) |
|
2022 |
|
2021 |
|
2020 |
|||
Operating lease costs |
|
$ |
657 |
|
$ |
653 |
|
$ |
620 |
Variable lease costs |
|
|
308 |
|
|
331 |
|
|
290 |
Short-term lease costs |
|
|
19 |
|
|
23 |
|
|
23 |
Sublease income |
|
|
(1) |
|
|
(1) |
|
|
(1) |
Total operating lease costs |
|
|
983 |
|
|
1,006 |
|
|
932 |
Finance lease costs: |
|
|
|
|
|
|
|
|
|
Amortization of leased assets |
|
|
6 |
|
|
4 |
|
|
1 |
Interest on lease liabilities |
|
|
3 |
|
|
1 |
|
|
— |
Total finance lease costs |
|
|
9 |
|
|
5 |
|
|
1 |
Total lease cost |
|
$ |
992 |
|
$ |
1,011 |
|
$ |
933 |
Maturities of lease liabilities as of January 28, 2023 are as follows:
($ in millions) |
Operating leases |
|
Finance leases |
|
Total |
||||
2023 |
|
$ |
651 |
|
$ |
8 |
|
$ |
659 |
2024 |
|
|
576 |
|
|
8 |
|
|
584 |
2025 |
|
|
481 |
|
|
6 |
|
|
487 |
2026 |
|
|
387 |
|
|
4 |
|
|
391 |
2027 |
|
|
304 |
|
|
4 |
|
|
308 |
Thereafter |
|
|
877 |
|
|
48 |
|
|
925 |
Total lease payments |
|
|
3,276 |
|
|
78 |
|
|
3,354 |
Less: Interest |
|
|
502 |
|
|
21 |
|
|
523 |
Total lease liabilities |
|
$ |
2,774 |
|
$ |
57 |
|
$ |
2,831 |
As of January 28, 2023, we signed operating leases primarily for retail stores that have not yet commenced and the total future undiscounted lease payments under these leases are $102 million.
2022 Form 10-K Page 54
NOTES TO CONSOLIDATED FINANCIAL STATEMENTS
17. Accumulated Other Comprehensive Loss
($ in millions) |
|
2022 |
|
2021 |
|
2020 |
|||
Foreign currency translation adjustments |
|
$ |
(148) |
|
$ |
(107) |
|
$ |
(64) |
Hedge contracts |
|
|
(3) |
|
|
— |
|
|
(1) |
Unrecognized pension cost and postretirement benefit |
|
|
(241) |
|
|
(236) |
|
|
(266) |
|
|
$ |
(392) |
|
$ |
(343) |
|
$ |
(331) |
The changes in AOCL for the year ended January 28, 2023 were as follows:
|
|
Foreign |
|
|
|
|
Items Related |
|
|
|
||
|
|
Currency |
|
|
|
|
to Pension and |
|
|
|
||
|
|
Translation |
|
Hedge |
|
Postretirement |
|
|
|
|||
($ in millions) |
|
Adjustments |
|
Contracts |
|
Benefits |
|
Total |
||||
Balance as of January 29, 2022 |
|
$ |
(107) |
|
$ |
— |
|
$ |
(236) |
|
$ |
(343) |
|
|
|
|
|
|
|
|
|
|
|
|
|
OCI before reclassification |
|
|
(41) |
|
|
(3) |
|
|
2 |
|
|
(42) |
Amortization of pension actuarial loss, net of tax |
|
|
— |
|
|
— |
|
|
7 |
|
|
7 |
Pension and postretirement remeasurement, net of tax |
|
|
— |
|
|
— |
|
|
(14) |
|
|
(14) |
Other comprehensive income |
|
|
(41) |
|
|
(3) |
|
|
(5) |
|
|
(49) |
Balance as of January 28, 2023 |
|
$ |
(148) |
|
$ |
(3) |
|
$ |
(241) |
|
$ |
(392) |
Reclassifications to income from AOCL for the year ended January 28, 2023 were as follows:
($ in millions) |
|
|
|
Amortization of actuarial loss: |
|
|
|
Pension benefits |
|
$ |
10 |
Income tax benefit |
|
|
(3) |
Amortization of actuarial loss, net of tax |
|
$ |
7 |
18. Income Taxes
The domestic and international components of pre-tax income are as follows:
($ in millions) |
|
2022 |
|
2021 |
|
2020 |
|||
Domestic |
|
$ |
440 |
|
$ |
1,244 |
|
$ |
647 |
International |
|
|
84 |
|
|
(4) |
|
|
(153) |
Total pre-tax income |
|
$ |
524 |
|
$ |
1,240 |
|
$ |
494 |
Domestic pre-tax income includes the results of non-U.S. businesses that are operated in branches owned directly by the U.S. which, therefore, are subject to U.S. income tax.
The income tax provision consists of the following:
($ in millions) |
|
2022 |
|
2021 |
|
2020 |
|||
Current: |
|
|
|
|
|
|
|
|
|
Federal |
|
$ |
64 |
|
$ |
192 |
|
$ |
114 |
State and local |
|
|
27 |
|
|
66 |
|
|
43 |
International |
|
|
68 |
|
|
16 |
|
|
23 |
Total current tax provision |
|
|
159 |
|
|
274 |
|
|
180 |
Deferred: |
|
|
|
|
|
|
|
|
|
Federal |
|
|
23 |
|
|
49 |
|
|
6 |
State and local |
|
|
4 |
|
|
15 |
|
|
(2) |
International |
|
|
(6) |
|
|
10 |
|
|
(13) |
Total deferred tax provision |
|
|
21 |
|
|
74 |
|
|
(9) |
Total income tax provision |
|
$ |
180 |
|
$ |
348 |
|
$ |
171 |
2022 Form 10-K Page 55
NOTES TO CONSOLIDATED FINANCIAL STATEMENTS
18. Income Taxes (continued)
Following the enactment of Public Law 115-97 (“Tax Act”) and the one-time transition tax, our historical foreign earnings are not subject to additional U.S. federal tax upon repatriation. Further, no additional U.S. federal tax will be due upon repatriation of current foreign earnings because they are either exempt or subject to U.S. tax as earned.
At January 28, 2023, we had accumulated undistributed foreign earnings of approximately $571 million. This amount consists of historical earnings that were previously taxed under the Tax Act and post-Tax Act earnings. Investments in our foreign subsidiaries, including working capital, will continue to be permanently reinvested. Cash balances in excess of working capital needs are considered to be available for repatriation to the United States and foreign withholding taxes will be accrued as necessary on these amounts.
We have not recorded a deferred tax liability for the difference between the financial statement carrying amount and the tax basis of our investments in foreign subsidiaries. The determination of any unrecorded deferred tax liability on this amount is not practicable due to the uncertainty of how these investments would be recovered.
A reconciliation of the significant differences between the federal statutory income tax rate and the effective income tax rate on pre-tax income is as follows:
|
|
2022 |
|
2021 |
|
2020 |
|
Federal statutory income tax rate |
|
21.0 |
% |
21.0 |
% |
21.0 |
% |
Increase in valuation allowance |
|
2.6 |
|
0.7 |
|
6.3 |
|
State and local income taxes, net of federal tax benefit |
|
5.0 |
|
5.4 |
|
6.6 |
|
International income taxed at varying rates |
|
8.4 |
|
2.4 |
|
4.3 |
|
Foreign tax credits |
|
(3.6) |
|
(1.4) |
|
(2.4) |
|
Domestic/foreign tax settlements |
|
(0.5) |
|
(0.3) |
|
(0.5) |
|
Federal tax credits |
|
(0.4) |
|
(0.1) |
|
(0.4) |
|
Other, net |
|
1.8 |
|
0.4 |
|
(0.4) |
|
Effective income tax rate |
|
34.3 |
% |
28.1 |
% |
34.5 |
% |
Deferred income taxes are provided for the effects of temporary differences between the amounts of assets and liabilities recognized for financial reporting purposes and the amounts recognized for income tax purposes. Items that give rise to significant portions of our deferred tax assets and liabilities are as follows:
|
|
January 28, |
|
January 29, |
||
($ in millions) |
|
2023 |
|
2022 |
||
Deferred tax assets: |
|
|
|
|
|
|
Tax loss/credit carryforwards and capital loss |
|
$ |
123 |
|
$ |
133 |
Employee benefits |
|
|
42 |
|
|
38 |
Property and equipment |
|
|
— |
|
|
15 |
Operating leases - liabilities |
|
|
725 |
|
|
720 |
Other |
|
|
61 |
|
|
74 |
Total deferred tax assets |
|
$ |
951 |
|
$ |
980 |
Valuation allowance |
|
|
(93) |
|
|
(80) |
Total deferred tax assets, net |
|
$ |
858 |
|
$ |
900 |
Deferred tax liabilities: |
|
|
|
|
|
|
Merchandise inventories |
|
$ |
87 |
|
$ |
68 |
Operating leases - assets |
|
|
667 |
|
|
662 |
Goodwill and other intangible assets |
|
|
123 |
|
|
155 |
Net investment gains |
|
|
115 |
|
|
131 |
Property and equipment |
|
|
6 |
|
|
— |
Other |
|
|
7 |
|
|
22 |
Total deferred tax liabilities |
|
$ |
1,005 |
|
$ |
1,038 |
Net deferred tax liability |
|
$ |
(147) |
|
$ |
(138) |
Balance Sheet caption reported in: |
|
|
|
|
|
|
Deferred taxes |
|
$ |
90 |
|
$ |
86 |
Other liabilities |
|
|
(237) |
|
|
(224) |
|
|
$ |
(147) |
|
$ |
(138) |
2022 Form 10-K Page 56
NOTES TO CONSOLIDATED FINANCIAL STATEMENTS
18. Income Taxes (continued)
Based upon the level of historical taxable income and projections for future taxable income, which are based upon our long-range strategic plans, management believes it is more likely than not that we will realize the benefits of deductible differences, net of the valuation allowances, over the periods in which the temporary differences are anticipated to reverse. However, the amount of the deferred tax asset considered realizable could be adjusted in the future if estimates of taxable income are revised.
As of January 28, 2023, we have a valuation allowance of $93 million to reduce our deferred tax assets to an amount that is more likely than not to be realized. A valuation allowance of $77 million was recorded against tax loss carryforwards of certain foreign entities. Based on the history of losses and the absence of prudent and feasible business plans for generating future taxable income in these entities, we believe it is more likely than not that the benefit of these loss carryforwards will not be realized. As of January 28, 2023, a valuation allowance of $15 million was established for foreign taxes assessed at rates in excess of the U.S. federal tax rate for which no U.S. foreign tax credit is available. Additionally, since we do not have any reasonably foreseeable sources of Canadian capital gains, a valuation allowance of $1 million was established since 2019 for a deferred tax asset arising from a capital loss.
At January 28, 2023, we have international minimum tax credit carryforwards with a potential tax benefit of $3 million and operating loss carryforwards with a potential tax benefit of $100 million, a portion of which will expire between 2023 and 2029 and a portion of which will never expire. We will have, when realized, a capital loss with a potential benefit of $1 million. The Canadian loss will carryforward indefinitely after realization. The international operating loss carryforwards include nominal unrecognized tax benefits. We also have foreign tax credit carrybacks and carryforwards with a potential tax benefit of $19 million that will expire between 2023 and 2032.
We operate in multiple taxing jurisdictions and are subject to audit. Audits can involve complex issues that may require an extended period of time to resolve. A taxing authority may challenge positions that we have adopted in our income tax filings. Accordingly, we may apply different tax treatments for transactions in filing the income tax returns than for income tax financial reporting. We regularly assess our tax positions for such transactions and record reserves for those differences. We participate in the IRS’s Compliance Assurance Process and the examination of our 2021 U.S. Federal income tax filing was concluded in February 2023. To date, no adjustments have been proposed in any audits that will have a material effect on our financial position or results of operations.
At January 28, 2023, we had $52 million of gross unrecognized tax benefits, of which $44 million would, if recognized, affect our annual effective tax rate. We classified certain income tax liabilities as current or noncurrent based on management’s estimate of when these liabilities will be settled. Interest expense and penalties related to unrecognized tax benefits are classified as income tax expense. Interest expense recognized was $6 million in 2022 and was not significant for any of the prior years presented.
The following table summarizes the activity related to unrecognized tax benefits:
($ in millions) |
|
2022 |
|
2021 |
|
2020 |
|||
Unrecognized tax benefits at beginning of year |
|
$ |
41 |
|
$ |
47 |
|
$ |
45 |
Foreign currency translation adjustments |
|
|
(1) |
|
|
(2) |
|
|
3 |
Increases related to current year tax positions |
|
|
9 |
|
|
3 |
|
|
2 |
Increases related to prior period tax positions |
|
|
7 |
|
|
2 |
|
|
3 |
Decreases related to prior period tax positions |
|
|
— |
|
|
(3) |
|
|
— |
Settlements |
|
|
— |
|
|
(1) |
|
|
(1) |
Lapse of statute of limitations |
|
|
(4) |
|
|
(5) |
|
|
(5) |
Unrecognized tax benefits at end of year |
|
$ |
52 |
|
$ |
41 |
|
$ |
47 |
It is reasonably possible that the liability associated with our unrecognized tax benefits will increase or decrease within the next twelve months. These changes may be the result of foreign currency fluctuations, ongoing audits, or the expiration of statutes of limitations. Settlements during 2023 are not expected to be significant based on current estimates. Audit outcomes and the timing of audit settlements are subject to significant uncertainty. Although management believes that adequate provision has been made for such issues, the ultimate resolution could have an adverse effect on our earnings. Conversely, if these issues are resolved favorably in the future, the related provision would be reduced, generating a positive effect on earnings.
2022 Form 10-K Page 57
NOTES TO CONSOLIDATED FINANCIAL STATEMENTS
19. Financial Instruments and Risk Management
We operate internationally and utilize certain derivative financial instruments to mitigate our foreign currency exposures, primarily related to third-party and intercompany forecasted transactions. As a result of the use of derivative instruments, we are exposed to the risk that counterparties will fail to meet their contractual obligations. To mitigate this counterparty credit risk, we have a practice of entering into contracts with major financial institutions selected based upon their credit ratings and other financial factors. We monitor the creditworthiness of counterparties throughout the duration of the derivative instrument.
Derivative Holdings Designated as Hedges
The primary currencies to which we are exposed are the euro, British pound, Canadian dollar, Australian dollar, and the Japanese Yen. Generally, merchandise inventories are purchased by each geographic area in their respective local currency with the exception of the United Kingdom, whose merchandise inventory purchases are primarily denominated in euros.
For option and foreign exchange forward contracts designated as cash flow hedges of the purchase of inventory, the effective portion of gains and losses is deferred as a component of AOCL and is recognized as a component of cost of sales when the related inventory is sold. The amount reclassified to cost of sales related to such contracts was not significant for any of the periods presented. The effective portion of gains or losses associated with other forward contracts is deferred as a component of AOCL until the underlying transaction is reported in earnings. The ineffective portion of gains and losses related to cash flow hedges recorded to earnings was not significant for any of the periods presented.
On May 6, 2022, we entered into a cross-currency swap contract to reduce the effect of the fluctuating U.S. Dollar (“USD”) to Japanese Yen (“JPY”) foreign exchange rate on our foreign currency-denominated intercompany loan between our Japanese and U.S. subsidiary. We expect the gains and losses on this contract to offset losses and gains on the hedged transaction in an effort to reduce the earnings volatility resulting from the remeasurement of the principal and interest accrued on the loan. Though the intercompany loan eliminates in consolidation, the foreign currency remeasurement of the loan and interest by the U.S. subsidiary is reflected in the consolidated financial statements.
The cross-currency swap contract has a notional amount of JPY 11 billion and final receipt of $85 million. The cross-currency swap contract, which matures on November 2, 2031, swaps Yen-denominated interest payments for U.S. dollar-denominated interest payments, thereby economically converting the JPY 11 billion fixed-rate 3.51% intercompany loan to a fixed-rate 6.77% USD-denominated receivable for our U.S. subsidiary.
We designated the cross-currency swap contract to hedge the changes in value of the intercompany loan and its variability on earnings. We apply fair value hedge accounting, and we consider market factors other than the change in the spot exchange rate on the notional amount of the swap to be excluded components. The foreign currency spot rate fluctuations on the cross-currency swap notional amount and interest accruals are reported in earnings each period, while all other changes are reported in other comprehensive income. Because the terms of the hedged item and the hedging instrument match and the likelihood of swap counterparty default is not probable, the hedge is expected to exactly offset changes in the fair value of the foreign currency debt resulting from to foreign currency fluctuations over the term of the swap.
As of January 28, 2023, the cross-currency swap had a fair value of $3 million and was included in other liabilities. We record the changes in the fair value of the contract to AOCL. Each period, we reclassify an amount out of AOCL equal to the remeasurement gain or loss on the hedged intercompany loan that is recorded in selling, general and administrative expenses. As of January 28, 2023, there was $3 million in AOCL, net of tax, related to the cross-currency swap. In addition, we recognize swap interest income based on the differential in fixed interest rates per the contract. During 2022, we recorded $2 million of income in interest expense, net. Refer to Note 17 for further information regarding amounts recorded in AOCL.
2022 Form 10-K Page 58
NOTES TO CONSOLIDATED FINANCIAL STATEMENTS
19. Financial Instruments and Risk Management (continued)
Derivative Holdings Not Designated as Hedges
We enter into certain derivative contracts that are not designated as hedges, such as foreign exchange forward contracts and currency option contracts. These derivative contracts are used to manage certain costs of foreign currency-denominated merchandise purchases, intercompany transactions, and the effect of fluctuating foreign exchange rates on the reporting of foreign currency-denominated earnings. Changes in the fair value of derivative holdings not designated as hedges, as well as realized gains and premiums paid, are recorded in earnings immediately within SG&A or Other income, net, depending on the type of transaction. The aggregate amount recognized for these contracts was not significant for any of the periods presented.
Fair Value of Derivative Contracts
The following represents the fair value of our derivative contracts.
|
|
Balance Sheet |
|
January 28, |
|
January 29, |
||
($ in millions) |
|
Caption |
|
2023 |
|
2022 |
||
Hedging Instruments: |
|
|
|
|
|
|
|
|
Foreign exchange forward contracts |
|
Current liabilities |
|
$ |
— |
|
$ |
1 |
Cross-currency swap |
|
Non-current liabilities |
|
$ |
3 |
|
$ |
— |
Business Risk
The retail business is highly competitive. Price, quality, selection of merchandise, reputation, store location, advertising, and customer experience are important competitive factors in our business. We operate in 29 countries and purchased 86% of our merchandise in 2022 from our top 5 suppliers. In 2022, we purchased 65% of our athletic merchandise from one major supplier, Nike, Inc. (“Nike”). Each of our banners are highly dependent on Nike; they individually purchased approximately 50% to 75% of their merchandise from Nike.
Included in our Consolidated Balance Sheet at January 28, 2023, are the net assets of our European operations, which total $454 million and are located in 20 countries, 11 of which have adopted the euro as their functional currency.
20. Fair Value Measurements
We categorize our financial instruments into a three-level fair value hierarchy that prioritizes the inputs to valuation techniques used to measure fair value into three broad levels. The fair value hierarchy gives the highest priority to quoted prices in active markets for identical assets or liabilities (Level 1) and the lowest priority to unobservable inputs (Level 3). If the inputs used to measure fair value fall within different levels of the hierarchy, the category level is based on the lowest priority level input that is significant to the fair value measurement of the instrument.
Fair value is determined based upon the exit price that would be received to sell an asset or paid to transfer a liability in an orderly transaction between market participants exclusive of any transaction costs. Our financial assets recorded at fair value are categorized as follows:
Level 1 - Quoted prices for identical instruments in active markets.
Level 2 - Observable inputs other than quoted prices included within Level 1, including quoted prices for similar instruments in active markets; quoted prices for identical or similar instruments in markets that are not active; and model-derived valuations in which all significant inputs or significant value-drivers are observable in active markets.
Level 3 - Model-derived valuations in which one or more significant inputs or significant value-drivers are unobservable.
During 2021, we invested $68 million to take a common stock minority stake in a public entity, Retailors, Ltd., which is traded on the Tel Aviv stock exchange. This investment was classified as a Level 1 instrument since the fair value is readily available in an active market. During 2022, we sold our holdings in this investment.
2022 Form 10-K Page 59
NOTES TO CONSOLIDATED FINANCIAL STATEMENTS
20. Fair Value Measurements (continued)
Our auction rate security, classified as available-for-sale, is recorded within Other assets on the Consolidated Balance Sheet and is recorded at fair value with gains and losses reported in Other income, net in our Consolidated Statements of Operations. The fair value of the auction rate security is determined by using quoted prices for similar instruments in active markets and accordingly is classified as a Level 2 instrument.
The fair value of the contingent consideration liability associated with the atmos acquisition is estimated using an option pricing model simulation that determines an average projected payment value across numerous iterations. See Note 1 for further details.
Our derivative financial instruments are valued using market-based inputs to valuation models. These valuation models require a variety of inputs, including contractual terms, market prices, yield curves, and measures of volatility and therefore are classified as Level 2 instruments.
Assets and Liabilities Measured at Fair Value on a Recurring Basis
($ in millions) |
|
As of January 28, 2023 |
|
As of January 29, 2022 |
||||||||||||||
|
|
Level 1 |
|
Level 2 |
|
Level 3 |
|
Level 1 |
|
Level 2 |
|
Level 3 |
||||||
Assets |
|
|
|
|
|
|
|
|
|
|
|
|
|
|
|
|
|
|
Minority investment in common stock |
|
$ |
— |
|
$ |
— |
|
$ |
— |
|
$ |
145 |
|
$ |
— |
|
$ |
— |
Available-for-sale security |
|
|
— |
|
|
6 |
|
|
— |
|
|
— |
|
|
7 |
|
|
— |
Total assets |
|
$ |
— |
|
$ |
6 |
|
$ |
— |
|
$ |
145 |
|
$ |
7 |
|
$ |
— |
Liabilities |
|
|
|
|
|
|
|
|
|
|
|
|
|
|
|
|
|
|
Contingent consideration |
|
$ |
— |
|
$ |
— |
|
$ |
4 |
|
$ |
— |
|
$ |
— |
|
$ |
35 |
Foreign exchange forward contracts |
|
|
— |
|
|
— |
|
|
— |
|
|
— |
|
|
1 |
|
|
— |
Cross-currency swap contract |
|
|
— |
|
|
3 |
|
|
— |
|
|
— |
|
|
— |
|
|
— |
Total liabilities |
|
$ |
— |
|
$ |
3 |
|
$ |
4 |
|
$ |
— |
|
$ |
1 |
|
$ |
35 |
There were no transfers into or out of Level 1, Level 2, or Level 3 for any of the periods presented.
Assets and Liabilities Measured at Fair Value on a Nonrecurring Basis
Certain assets and liabilities are measured at fair value on a nonrecurring basis. Assets and liabilities recognized or disclosed at fair value on the consolidated financial statements on a nonrecurring basis include items such as property, plant and equipment, operating lease right-of-use assets, goodwill, other intangible assets, and minority investments that are not accounted for under the equity method of accounting. These assets are measured using Level 3 inputs, if determined to be impaired. The preferred stock of our minority investment in GOAT is measured using the fair value measurement alternative had a carrying value of $579 million for both January 28, 2023 and January 29, 2022. As of January 28, 2023, cumulative impairments on our portfolio of minority investments were $53 million.
Long-Term Debt
The fair value of long-term debt is determined by using model-derived valuations in which all significant inputs or significant value-drivers are observable in active markets and therefore are classified as Level 2.
($ in millions) |
|
January 28, 2023 |
|
January 29, 2022 |
||
Carrying value (1) |
|
$ |
395 |
|
$ |
394 |
Fair value |
|
$ |
338 |
|
$ |
389 |
| (1) | The carrying value of debt for both periods reflect $5 million of issuer’s discount and costs related to 4% Notes due in 2029. |
The carrying values of cash and cash equivalents, restricted cash, and other current receivables and payables approximate their fair value.
2022 Form 10-K Page 60
NOTES TO CONSOLIDATED FINANCIAL STATEMENTS
21. Retirement Plans and Other Benefits
Pension and Other Postretirement Plans
We have defined benefit pension plans covering certain of our North American employees. In May 2019, the U.S. qualified pension plan was amended such that all employees who were not participants in the plan as of December 31, 2019, will not become participants after such date. All benefit accruals were frozen as of December 31, 2019 for all plan participants with less than eleven years of service as of that date. For participants with more than eleven years of service as of December 31, 2019, benefit accruals were frozen as of December 31, 2022. Participants will continue to accrue interest at a fixed rate of 6% per year.
We also sponsor postretirement medical and life insurance plans, which are available to most of our retired U.S. employees. These plans are contributory and are not funded. These plans are not significant.
The following tables set forth the plans’ changes in benefit obligations and plan assets, funded status, and amounts recognized in the Consolidated Balance Sheets:
|
|
|
||||
($ in millions) |
|
2022 |
|
2021 |
||
Change in benefit obligation |
|
|
|
|
|
|
Benefit obligation at beginning of year |
|
$ |
674 |
|
$ |
753 |
Service cost |
|
|
14 |
|
|
16 |
Interest cost |
|
|
21 |
|
|
18 |
Plan participants’ contributions |
|
|
— |
|
|
— |
Actuarial gains |
|
|
(93) |
|
|
(55) |
Foreign currency translation adjustments |
|
|
(2) |
|
|
(1) |
Benefits paid |
|
|
(48) |
|
|
(55) |
Settlement |
|
|
— |
|
|
(2) |
Benefit obligation at end of year |
|
$ |
566 |
|
$ |
674 |
|
|
|
|
|
|
|
Change in plan assets |
|
|
|
|
|
|
Fair value of plan assets at beginning of year |
|
$ |
676 |
|
$ |
716 |
Actual return on plan assets |
|
|
(83) |
|
|
11 |
Employer contributions |
|
|
3 |
|
|
3 |
Foreign currency translation adjustments |
|
|
(2) |
|
|
1 |
Benefits paid |
|
|
(48) |
|
|
(55) |
Fair value of plan assets at end of year |
|
$ |
546 |
|
$ |
676 |
|
|
|
|
|
|
|
Funded status |
|
$ |
(20) |
|
$ |
2 |
|
|
|
|
|
|
|
Amounts recognized on the balance sheet: |
|
|
|
|
|
|
Other assets |
|
$ |
4 |
|
$ |
21 |
Accrued and other liabilities |
|
|
(3) |
|
|
(3) |
Other liabilities |
|
|
(21) |
|
|
(16) |
|
|
$ |
(20) |
|
$ |
2 |
The Canadian qualified pension plan’s assets exceeded its accumulated benefit obligation for both 2022 and 2021. In 2021, the U.S. qualified pension plan’s assets exceeded its accumulated benefit obligation, however in 2022 the accumulated benefit obligation was greater than the plan’s assets. Our non-qualified pension plans have an accumulated benefit obligation in excess of plan assets, as these plans are unfunded. Accordingly, the table below reflects the U.S. non-qualified plans for 2022 and 2021 and the U.S. qualified plan for 2022.
($ in millions) |
|
2022 |
|
2021 |
||
Projected benefit obligation |
|
$ |
533 |
|
$ |
20 |
Accumulated benefit obligation |
|
|
533 |
|
|
20 |
Fair value of plan assets |
|
|
509 |
|
|
— |
2022 Form 10-K Page 61
NOTES TO CONSOLIDATED FINANCIAL STATEMENTS
21. Retirement Plans and Other Benefits (continued)
The following table provides the amounts recognized in AOCL on a pre-tax basis:
|
|
|
|
($ in millions) |
|
|
|
Net actuarial loss at beginning of year |
|
$ |
320 |
Amortization of net loss |
|
|
(10) |
Loss arising during the year |
|
|
21 |
Foreign currency fluctuations |
|
|
(2) |
Net actuarial loss at end of year |
|
$ |
329 |
The actuarial losses recognized during 2022 were primarily driven lower actual return as compared with the expected return on plan assets partially offset by an increase in discount rates applied against future expected benefit payments, which resulted in a decrease in the benefit obligation for the pension benefit plans.
The following weighted-average assumptions were used to determine the benefit obligations under the plans:
|
|
2022 |
|
2021 |
|
Discount rate |
|
5.0 |
% |
3.2 |
% |
Rate of compensation increase |
|
3.6 |
% |
3.6 |
% |
Pension expense is actuarially calculated annually based on data available at the beginning of each year. The expected return on plan assets is determined by multiplying the expected long-term rate of return on assets by the market-related value of plan assets for the U.S. qualified pension plan and market value for the Canadian qualified pension plan. The market-related value of plan assets is a calculated value that recognizes investment gains and losses in fair value related to equities over three or five years, depending on which computation results in a market-related value closer to market value. Market-related value for the U.S. qualified plan was $618 million and $652 million for 2022 and 2021, respectively.
Assumptions used in the calculation of net benefit cost include the discount rate selected and disclosed at the end of the previous year, as well as other assumptions detailed in the table below:
|
|
2022 |
|
2021 |
|
2020 |
|
Discount rate |
|
3.2 |
% |
2.5 |
% |
2.9 |
% |
Rate of compensation increase |
|
3.6 |
% |
3.6 |
% |
3.6 |
% |
Expected long-term rate of return on assets |
|
4.8 |
% |
5.3 |
% |
5.5 |
% |
The expected long-term rate of return on invested plan assets is based on the plans’ weighted-average target asset allocation, as well as historical and future expected performance of those assets. The target asset allocation is selected to obtain an investment return that is sufficient to cover the expected benefit payments and to reduce the variability of our future contributions.
The following are the components of net periodic pension benefit cost. Service cost is recognized as a component of SG&A and the remaining pension and postretirement expense components are recognized as part of Other income, net.
($ in millions) |
|
2022 |
|
2021 |
|
2020 |
|||
Service cost |
|
$ |
14 |
|
$ |
16 |
|
$ |
14 |
Interest cost |
|
|
21 |
|
|
18 |
|
|
21 |
Expected return on plan assets |
|
|
(31) |
|
|
(35) |
|
|
(37) |
Amortization of net loss |
|
|
10 |
|
|
10 |
|
|
12 |
Net benefit expense |
|
$ |
14 |
|
$ |
9 |
|
$ |
10 |
The mortality assumption used to value the 2022 and 2021 U.S. pension obligations was the Pri-2012 mortality table with generational projection using MP-2021 for both males and females. For years ended January 28, 2023 and January 29, 2022, we used the 2014 CPM Private Sector mortality table projected generationally with Scale CPM-B for both males and females to value its Canadian pension obligations
2022 Form 10-K Page 62
NOTES TO CONSOLIDATED FINANCIAL STATEMENTS
21. Retirement Plans and Other Benefits (continued)
Plan Assets
The target composition of our U.S. qualified pension plan assets is 70% fixed-income securities, 28.5% equities, and 1.5% real estate. We may alter the asset allocation targets from time to time depending on market conditions and the funding requirements of the pension plan. This current asset allocation has and is expected to limit volatility with regard to the funded status of the plan, but may result in higher pension expense due to the lower long-term rate of return associated with fixed-income securities. Due to market conditions and other factors, actual asset allocations may vary from the target allocation outlined above. The target composition of our Canadian qualified pension plan assets is 95% fixed-income securities and 5% equities. We believe plan assets are invested in a conservative manner with the same overall objective and investment strategy as noted below for the U.S. pension plan. The bond portfolio is comprised of government and corporate bonds chosen to match the duration of the pension plan’s benefit payment obligations. This current asset allocation will limit future volatility.
We believe plan assets are invested in a conservative manner with an objective of providing a total return that, over the long term, provides sufficient assets to fund benefit obligations, taking into account our expected contributions and the level of funding risk deemed appropriate. Our investment strategy seeks to diversify assets among classes of investments with differing rates of return, volatility, and correlation in order to reduce funding risk. Diversification within asset classes is also utilized to ensure that there are no significant concentrations of risk in plan assets and to reduce the effect that the return on any single investment may have on the entire portfolio.
Valuation of Investments
Commingled trust funds are valued at the net asset value of units held by the plan at year end. Stocks and mutual funds traded on U.S. and Canadian security exchanges are valued at closing market prices on the measurement date. Each category of U.S. and Canadian plan assets is classified within the same level of the fair value hierarchy for 2022 and 2021.
The fair values of the U.S. pension plan assets at January 28, 2023 and January 29, 2022 were as follows:
($ in millions) |
|
Level 1 |
|
Level 2 |
|
Level 3 |
|
2022 Total |
|
2021 Total |
|||||
Cash |
|
$ |
2 |
|
$ |
— |
|
$ |
— |
|
$ |
2 |
|
$ |
— |
Cash equivalents |
|
|
— |
|
|
1 |
|
|
— |
|
|
1 |
|
|
4 |
Commingled funds: |
|
|
|
|
|
|
|
|
|
|
|
|
|
|
|
Equity securities |
|
|
— |
|
|
130 |
|
|
— |
|
|
130 |
|
|
163 |
Fixed-income securities |
|
|
— |
|
|
341 |
|
|
— |
|
|
341 |
|
|
425 |
Real estate securities |
|
|
— |
|
|
8 |
|
|
— |
|
|
8 |
|
|
9 |
Corporate stock |
|
|
17 |
|
|
— |
|
|
— |
|
|
17 |
|
|
18 |
Mutual fund |
|
|
10 |
|
|
— |
|
|
— |
|
|
10 |
|
|
12 |
Total assets at fair value |
|
$ |
29 |
|
$ |
480 |
|
$ |
— |
|
$ |
509 |
|
$ |
631 |
The fair values of the Canadian pension plan assets at January 28, 2023 and January 29, 2022 were as follows:
|
|
|
|
|
|
|
|
|
|
|
|
|
|
|
|
($ in millions) |
|
Level 1 |
|
Level 2 |
|
Level 3 |
|
2022 Total |
|
2021 Total |
|||||
Cash equivalents |
|
$ |
— |
|
$ |
6 |
|
$ |
— |
|
$ |
6 |
|
$ |
6 |
Equity securities: |
|
|
|
|
|
|
|
|
|
|
|
|
|
|
|
Canadian and international |
|
|
3 |
|
|
— |
|
|
— |
|
|
3 |
|
|
3 |
Fixed-income securities: |
|
|
|
|
|
|
|
|
|
|
|
|
|
|
|
Cash matched bonds |
|
|
— |
|
|
28 |
|
|
— |
|
|
28 |
|
|
36 |
Total assets at fair value |
|
$ |
3 |
|
$ |
34 |
|
$ |
— |
|
$ |
37 |
|
$ |
45 |
2022 Form 10-K Page 63
NOTES TO CONSOLIDATED FINANCIAL STATEMENTS
21. Retirement Plans and Other Benefits (continued)
Contributions and Expected Payments
We were not required to make any contributions to the U.S. qualified pension plan in 2022 and 2021. We do not anticipate making any contributions to the U.S. qualified pension plan in 2023 due to the strong funded status of the plan, however we continually evaluate the amount and timing of any potential contributions based on market conditions and other factors. We paid $3 million and $3 million in pension benefits related to our non-qualified pension plans during 2022 and 2021, respectively.
Estimated future benefit payments for each of the next five years and the five years thereafter are as follows:
($ in millions) |
|
|
|
2023 |
|
$ |
68 |
2024 |
|
|
50 |
2025 |
|
|
47 |
2026 |
|
|
46 |
2027 |
|
|
44 |
2028-2032 |
|
|
198 |
Savings Plans
We have a 401(k) plan that is available to employees whose primary place of employment is the U.S., and another plan that is available to employees whose primary place of employment is in Puerto Rico. With the acquisition of WSS in 2021, we became the sponsor of the 401(k) plan for WSS employees. The charges for matching contributions were not significant for any of the periods presented.
22. Share-Based Compensation
Stock Awards
Under our 2007 Stock Incentive Plan (the “2007 Stock Plan”), stock options, restricted stock, restricted stock units, stock appreciation rights, or other share-based awards may be granted to nonemployee directors, officers and other employees, including our subsidiaries and operating divisions worldwide. Options for employees become exercisable in substantially equal annual installments over a three-year period, beginning with the first anniversary of the date of grant of the option, unless a shorter or longer duration is established at the time of the option grant. The options terminate ten years from the date of grant. On May 21, 2014, the 2007 Stock Plan was amended to increase the number of shares of common stock reserved for all awards to 14 million shares. As of January 28, 2023, there were 3,651,807 shares available for issuance under this plan.
On August 24, 2022, the Company granted options and other awards to its new President and Chief Executive Officer, Mary N. Dillon. These awards were granted outside of the 2007 Stock Incentive Plan as employment inducement awards and do not require shareholder approval under the rules of the New York Stock Exchange or otherwise. Shares available for future grant under this plan of 545,660 are reserved for the sole purpose to issue shares pursuant to her employment inducement awards.
Employees Stock Purchase Plan
Under our 2013 Foot Locker Employees Stock Purchase Plan (“ESPP”), participating employees are able to contribute up to 10% of their annual compensation, not to exceed $25,000 in any plan year, through payroll deductions to acquire shares of our common stock at 85% of the lower market price on one of two specified dates in each plan year. Of the 3,000,000 shares of common stock authorized under this plan, there were 1,854,858 shares available for purchase as of January 28, 2023. During 2022 and 2021, participating employees purchased 119,518 shares and 300,788 shares, respectively.
2022 Form 10-K Page 64
NOTES TO CONSOLIDATED FINANCIAL STATEMENTS
22. Share-Based Compensation (continued)
Share-Based Compensation Expense
($ in millions) |
2022 |
|
2021 |
|
2020 |
|||
Options and employee stock purchase plan |
$ |
5 |
|
$ |
6 |
|
$ |
6 |
Restricted stock units and performance stock units |
|
26 |
|
|
23 |
|
|
9 |
Total share-based compensation expense |
$ |
31 |
|
$ |
29 |
|
$ |
15 |
|
|
|
|
|
|
|
|
|
Tax benefit recognized |
$ |
3 |
|
$ |
3 |
|
$ |
2 |
Valuation Model and Assumptions
The Black-Scholes option-pricing model is used to estimate the fair value of options and the stock purchase plan. The Black-Scholes option-pricing model incorporates various and subjective assumptions, including expected term and expected volatility.
We estimate the expected term of options using our historical exercise and post-vesting employment termination patterns, which we believe are representative of future behavior. The expected term for the employee stock purchase plan valuation is based on the length of each purchase period as measured at the beginning of the offering period, which is one year.
We estimate the expected volatility of our common stock at the grant date using a weighted-average of our historical volatility and implied volatility from traded options on our common stock. We believe that this combination of historical volatility and implied volatility provides a better estimate of future stock price volatility.
The risk-free interest rate assumption is determined using the Federal Reserve nominal rates for U.S. Treasury zero-coupon bonds with maturities similar to those of the expected term of the award being valued. The expected dividend yield is derived from our historical experience.
The following table shows the assumptions used to compute the share-based compensation expense:
|
|
|
|
|
|
|
|
|
|
|
|
|
|
|
|
|
|
|
|
Stock Option Plans |
Stock Purchase Plan |
|
|||||||||||||||
|
2022 |
|
2021 |
|
2020 |
|
2022 |
|
2021 |
|
2020 |
|
||||||
Weighted-average risk free rate of interest |
|
1.8 |
% |
|
0.9 |
% |
|
0.5 |
% |
|
1.0 |
% |
|
0.1 |
% |
|
1.8 |
% |
Expected volatility |
|
35 |
% |
|
47 |
% |
|
37 |
% |
|
40.0 |
% |
|
45 |
% |
|
48 |
% |
Weighted-average expected award life (in years) |
|
3.9 |
|
|
5.5 |
|
|
4.9 |
|
|
1.0 |
|
|
1.0 |
|
|
1.0 |
|
Dividend yield |
|
2.7 |
% |
|
1.5 |
% |
|
4.3 |
% |
|
2.6 |
% |
|
4.0 |
% |
|
4.2 |
% |
Weighted-average fair value |
$ |
10.80 |
|
$ |
20.22 |
|
$ |
5.03 |
|
$ |
18.46 |
|
$ |
9.61 |
|
$ |
13.97 |
|
2022 Form 10-K Page 65
NOTES TO CONSOLIDATED FINANCIAL STATEMENTS
22. Share-Based Compensation (continued)
The information set forth in the following table covers options granted under our stock option plans:
|
|
|
|
|
|
|
|
|
|
|
|
|
Weighted- |
|
Weighted- |
||
|
|
Number |
|
Average |
|
Average |
||
|
|
of |
|
Remaining |
|
Exercise |
||
|
|
Shares |
|
Contractual Life |
|
Price |
||
|
|
(in thousands) |
|
(in years) |
|
(per share) |
||
Options outstanding at the beginning of the year |
|
3,211 |
|
|
|
|
$ |
48.84 |
Granted |
|
590 |
|
|
|
|
|
31.71 |
Exercised |
|
(207) |
|
|
|
|
|
28.15 |
Expired or cancelled |
|
(338) |
|
|
|
|
|
41.22 |
Options outstanding at January 28, 2023 |
|
3,256 |
|
|
4.5 |
|
$ |
47.85 |
Options exercisable at January 28, 2023 |
|
2,535 |
|
|
3.3 |
|
$ |
52.36 |
The total fair value of options vested was $4 million during 2022 and 2021. During the years ended January 28, 2023, and January 29, 2022, we received $6 million and $10 million in cash from option exercises and recognized a related tax benefit of an insignificant amount and $2 million, respectively.
The total intrinsic value of options exercised (the difference between the market price of the Company’s common stock on the exercise date and the price paid by the optionee to exercise the option) is presented below:
|
|
|
|
|
|
|
|
|
|
($ in millions) |
|
2022 |
|
2021 |
|
2020 |
|||
Exercised |
|
$ |
1 |
|
$ |
8 |
|
$ |
3 |
The aggregate intrinsic value for stock options outstanding, and those outstanding and exercisable (the difference between the closing stock price on the last trading day of the period and the exercise price of the options, multiplied by the number of in-the-money stock options) is presented below:
($ in millions) |
2022 |
|
Outstanding |
$ |
20 |
Outstanding and exercisable |
$ |
11 |
As of January 28, 2023, there was $3 million of total unrecognized compensation cost related to nonvested stock options, which is expected to be recognized over a remaining weighted-average period of 1.5 years.
The following table summarizes information about stock options outstanding and exercisable at January 28, 2023:
|
|
|
|
|
|
|
|
|
|
|
|
|
|
|
Options Outstanding |
Options Exercisable |
|||||||||
|
|
|
|
Weighted- |
|
|
|
|
|
|
|
|
|
|
|
|
Average |
|
Weighted- |
|
|
|
Weighted- |
||
|
|
|
|
Remaining |
|
Average |
|
|
|
Average |
||
Range of Exercise |
|
Number |
|
Contractual |
|
Exercise |
|
Number |
|
Exercise |
||
Prices |
|
Outstanding |
|
Life |
|
Price |
|
Exercisable |
|
Price |
||
|
|
(in thousands, except prices per share and contractual life) |
||||||||||
$21.60 - $36.51 |
|
1,123 |
|
7.0 |
|
$ |
25.91 |
|
514 |
|
$ |
23.09 |
$39.17 - $48.98 |
|
459 |
|
2.9 |
|
|
44.84 |
|
445 |
|
|
45.02 |
$53.61 - $58.94 |
|
493 |
|
5.1 |
|
|
56.75 |
|
395 |
|
|
57.46 |
$62.02 - $72.83 |
|
1,181 |
|
2.4 |
|
|
66.14 |
|
1,181 |
|
|
66.14 |
|
|
3,256 |
|
4.5 |
|
$ |
47.85 |
|
2,535 |
|
$ |
52.36 |
2022 Form 10-K Page 66
NOTES TO CONSOLIDATED FINANCIAL STATEMENTS
22. Share-Based Compensation (continued)
Restricted Stock Units and Performance Stock Units
Restricted stock units (“RSU”) may be awarded to certain officers, key employees of the Company, and nonemployee directors. Additionally, performance stock units (“PSU”) are awarded to officers and certain key employees in connection with our long-term incentive program. Each RSU and PSU represents the right to receive one share of our common stock provided that the applicable performance and vesting conditions are satisfied. PSU awards granted in 2022 also include a performance objective based on our relative total shareholder return over the performance period to a pre-determined peer group, assuming the reinvestment of dividends. The fair value of these awards is determined using a Monte Carlo simulation as of the date of the grant and share-based compensation expense will not be adjusted should the target awards vary from actual awards.
Generally, RSU awards fully vest after the passage of time, typically three years for employees and one year for nonemployee directors, provided there is continued service with the Company until the vesting date, subject to the terms of the award. PSU awards are earned only after the attainment of performance goals in connection with the relevant performance period and vest after an additional one-year period. No dividends are paid or accumulated on any RSU or PSU awards. Compensation expense is recognized using the market value at the date of grant and is amortized over the vesting period.
RSU and PSU activity is summarized as follows:
|
|
|
|
|
Weighted-Average |
|
|
||
|
|
Number |
Remaining |
Weighted-Average |
|||||
|
|
of |
Contractual |
Grant Date |
|||||
|
|
Shares |
Life |
Fair Value |
|||||
|
|
|
(in thousands) |
|
|
(in years) |
|
|
(per share) |
Nonvested at beginning of year |
|
|
1,391 |
|
|
|
|
$ |
43.95 |
Granted |
|
|
1,242 |
|
|
|
|
|
31.42 |
Vested |
|
|
(117) |
|
|
|
|
|
54.29 |
Performance adjustment (1) |
|
|
15 |
|
|
|
|
|
|
Forfeited |
|
|
(539) |
|
|
|
|
|
35.56 |
Nonvested at January 28, 2023 |
|
|
1,992 |
|
|
1.3 |
|
$ |
37.58 |
|
|
|
|
|
|
|
|
|
|
Aggregate value ($ in millions) |
|
$ |
75 |
|
|
|
|
|
|
| (1) | This represents adjustments made to PSU awards reflecting changes in estimates based upon our current performance against predefined financial targets. |
The total fair value of awards vested was $6 million, $23 million, and $6 million, for 2022, 2021, and 2020, respectively. At January 28, 2023, there was $27 million of total unrecognized compensation cost related to nonvested awards.
23. Legal Proceedings
Legal proceedings pending against the Company or its consolidated subsidiaries consist of ordinary, routine litigation, including administrative proceedings, incidental to the business of the Company or businesses that have been sold or discontinued by the Company in past years. These legal proceedings include commercial, intellectual property, customer, privacy, environmental, and employment-related claims. Additionally, the Company is a defendant in two purported class actions alleging wage/hour and wage statement violations in California.
We do not believe that the outcome of any such legal proceedings pending against the Company or its consolidated subsidiaries, as described above, would have a material adverse effect on our consolidated financial position, liquidity, or results of operations, taken as a whole, based upon current knowledge and taking into consideration current accruals. Litigation is inherently unpredictable. Judgments could be rendered or settlements made that could adversely affect the Company’s operating results or cash flows in a particular period.
2022 Form 10-K Page 67
Item 9. Changes in and Disagreements with Accountants on Accounting and Financial Disclosure
There were no disagreements between the Company and its independent registered public accounting firm on matters of accounting principles or practices.
Item 9A. Controls and Procedures
| (a) | Evaluation of Disclosure Controls and Procedures |
The Company’s management performed an evaluation, under the supervision and with the participation of the Company’s Chief Executive Officer (“CEO”) and Chief Financial Officer (“CFO”), of the effectiveness of the design and operation of the Company’s disclosure controls and procedures (as that term is defined in Rules 13a-15(e) and 15d-15(e) under the Securities Exchange Act of 1934, as amended (the “Exchange Act”)) as of January 28, 2023. Based on that evaluation, the Company’s CEO and CFO have concluded that the Company’s disclosure controls and procedures were not effective as of January 28, 2023, due to deficiencies identified at our WSS business resulting in a material weakness, discussed below in Management’s Annual Report on Internal Control over Financial Reporting.
Per Rules 13a-15(e) and 15d-15(e), the term disclosure controls and procedures means controls and other procedures of an issuer that are designed to ensure that information required to be disclosed by the issuer in the reports that it files or submits under the Exchange Act (15 U.S.C. 78a et seq.) is recorded, processed, summarized, and reported within the time periods specified in the SEC’s rules and forms. Disclosure controls and procedures include, without limitation, controls and procedures designed to ensure that information required to be disclosed by an issuer in the reports that it files or submits under the Exchange Act is accumulated and communicated to the issuer’s management, including its CEO and CFO, or persons performing similar functions, as appropriate to allow timely decisions regarding required disclosure.
The Company’s management, including the CEO and CFO, does not expect that our disclosure controls and procedures or our internal control over financial reporting will prevent all errors and all fraud due to inherent limitations of internal controls. Because of such limitations, there is a risk that material misstatements will not be prevented or detected on a timely basis by internal control over financial reporting. However, these inherent limitations are known features of the financial reporting process. Therefore, it is possible to design into the process safeguards to reduce, though not eliminate, this risk.
In light of the material weakness described below, management performed additional analysis and other procedures to ensure that our consolidated financial statements were prepared in accordance with U.S. generally accepted accounting principles (U.S. GAAP). Accordingly, management believes that the consolidated financial statements included in this Annual Report on Form 10-K fairly present, in all material respects, our financial position, results of operations and cash flows as of and for each of the periods presented herein, in accordance with U.S. GAAP.
| (b) | Management’s Annual Report on Internal Control over Financial Reporting |
The Company’s management is responsible for establishing and maintaining adequate internal control over financial reporting (as that term is defined in Exchange Act Rules 13a-15(f) and 15d-15(f)). To evaluate the effectiveness of the Company’s internal control over financial reporting, the Company uses the framework in Internal Control-Integrated Framework (2013) issued by the Committee of Sponsoring Organizations of the Treadway Commission (the “2013 COSO Framework”). Using the 2013 COSO Framework, the Company’s management, including the CEO and CFO, under the oversight of the Board of Directors, evaluated the Company’s internal control over financial reporting and concluded that the Company’s internal control over financial reporting was not effective as of January 28, 2023.
2022 Form 10-K Page 68
A company’s internal control over financial reporting includes those policies and procedures that:
| (1) | pertain to the maintenance of records that, in reasonable detail, accurately and fairly reflect the transactions and dispositions of the assets of the Company; |
| (2) | provide reasonable assurance that transactions are recorded as necessary to permit preparation of financial statements in accordance with generally accepted accounting principles, and that receipts and expenditures of the company are being made only in accordance with authorizations of management and directors of the Company; and |
| (3) | provide reasonable assurance regarding prevention or timely detection of unauthorized acquisition, use, or disposition of the company’s assets that could have a material effect on the financial statements. |
Because of its inherent limitations, internal control over financial reporting may not prevent or detect misstatements. Also, projections of any evaluation of effectiveness to future periods are subject to the risk that controls may become inadequate because of changes in conditions or that the degree of compliance with the policies or procedures may deteriorate.
A material weakness is a deficiency, or a combination of deficiencies, in internal control over financial reporting, such that there is a reasonable possibility that a material misstatement of our annual or interim financial statements will not be prevented or detected on a timely basis.
Management identified a material weakness related to ineffective general information technology controls over logical access and change management at our WSS business. As a result, process level automated controls and manual controls that are dependent on the completeness and accuracy of information derived from the affected information systems were also ineffective. This material weakness resulted from ineffective risk assessment associated with the information technology environment and individuals with insufficient knowledge and training associated with designing and implementing the controls.
The control deficiencies did not result in any errors. However, the control deficiencies created a reasonable possibility that a material misstatement to the consolidated financial statements would not be prevented or detected on a timely basis. Therefore, we concluded that the deficiencies represent a material weakness in the Company’s internal control over financial reporting and our internal control over financial reporting was not effective as of January 28, 2023.
Our independent registered public accounting firm, KPMG LLP, who audited the Company’s consolidated financial statements included in this Annual Report on Form 10-K, has issued an adverse opinion on the effectiveness of the Company’s internal control over financial reporting, which is included in Item 9A(d).
| (c) | Changes in Internal Control over Financial Reporting |
Management, with oversight from the Audit Committee of the Board of Directors, has begun certain remedial actions and is developing a full plan, which will be executed during fiscal 2023. This plan may include, among other items, additional risk assessment procedures over information technology, modifications and enhancements to controls, and additional training related to the design and implementation of control procedures. These deficiencies will not be considered remediated until the remediation plan is complete, and controls have been operational for a sufficient period of time and successfully tested.
There were no other changes in internal control over financial reporting (as defined by Rule 13a-15(f) and 15d-15(f) under the Exchange Act) during the quarter ended January 28, 2023 that have materially affected, or are reasonably likely to materially affect, our internal control over financial reporting.
| (d) | Report of Independent Registered Public Accounting Firm on Internal Control Over Financial Reporting |
The report appears on the following page.
2022 Form 10-K Page 69
REPORT OF INDEPENDENT REGISTERED PUBLIC ACCOUNTING FIRM
To the Shareholders and Board of Directors
Foot Locker, Inc.:
Opinion on Internal Control Over Financial Reporting
We have audited Foot Locker, Inc. and subsidiaries' (the Company) internal control over financial reporting as of January 28, 2023, based on criteria established in Internal Control – Integrated Framework (2013) issued by the Committee of Sponsoring Organizations of the Treadway Commission. In our opinion, because of the effect of the material weakness, described below, on the achievement of the objectives of the control criteria, the Company has not maintained effective internal control over financial reporting as of January 28, 2023, based on criteria established in Internal Control – Integrated Framework (2013) issued by the Committee of Sponsoring Organizations of the Treadway Commission.
We also have audited, in accordance with the standards of the Public Company Accounting Oversight Board (United States) (PCAOB), the consolidated balance sheets of the Company as of January 28, 2023 and January 29, 2022, the related consolidated statements of operations, comprehensive income, changes in shareholders’ equity, and cash flows for each of the years in the three-year period ended January 28, 2023, and the related notes (collectively, the consolidated financial statements), and our report dated March 27, 2023 expressed an unqualified opinion on those consolidated financial statements.
A material weakness is a deficiency, or a combination of deficiencies, in internal control over financial reporting, such that there is a reasonable possibility that a material misstatement of the company’s annual or interim financial statements will not be prevented or detected on a timely basis. A material weakness related to ineffective general information technology controls over logical access and change management has been identified and included in management’s assessment. The material weakness was considered in determining the nature, timing, and extent of audit tests applied in our audit of the 2022 consolidated financial statements, and this report does not affect our report on those consolidated financial statements.
Basis for Opinion
The Company’s management is responsible for maintaining effective internal control over financial reporting and for its assessment of the effectiveness of internal control over financial reporting, included in the accompanying Management’s Annual Report on Internal Control over Financial Reporting. Our responsibility is to express an opinion on the Company’s internal control over financial reporting based on our audit. We are a public accounting firm registered with the PCAOB and are required to be independent with respect to the Company in accordance with the U.S. federal securities laws and the applicable rules and regulations of the Securities and Exchange Commission and the PCAOB.
We conducted our audit in accordance with the standards of the PCAOB. Those standards require that we plan and perform the audit to obtain reasonable assurance about whether effective internal control over financial reporting was maintained in all material respects. Our audit of internal control over financial reporting included obtaining an understanding of internal control over financial reporting, assessing the risk that a material weakness exists, and testing and evaluating the design and operating effectiveness of internal control based on the assessed risk. Our audit also included performing such other procedures as we considered necessary in the circumstances. We believe that our audit provides a reasonable basis for our opinion.
Definition and Limitations of Internal Control Over Financial Reporting
A company’s internal control over financial reporting is a process designed to provide reasonable assurance regarding the reliability of financial reporting and the preparation of financial statements for external purposes in accordance with generally accepted accounting principles. A company’s internal control over financial reporting includes those policies and procedures that (1) pertain to the maintenance of records that, in reasonable detail, accurately and fairly reflect the transactions and dispositions of the assets of the company; (2) provide reasonable assurance that transactions are recorded as necessary to permit preparation of financial statements in accordance with generally accepted accounting principles, and that receipts and expenditures of the company are being made only in accordance with authorizations of management and directors of the company; and (3) provide reasonable assurance regarding prevention or timely detection of unauthorized acquisition, use, or disposition of the company’s assets that could have a material effect on the financial statements.
Because of its inherent limitations, internal control over financial reporting may not prevent or detect misstatements. Also, projections of any evaluation of effectiveness to future periods are subject to the risk that controls may become inadequate because of changes in conditions, or that the degree of compliance with the policies or procedures may deteriorate.
/s/ KPMG LLP
New York, New York
March 27, 2023
2022 Form 10-K Page 70
Item 9B. Other Information
None.
Item 9C. Disclosure Regarding Foreign Jurisdictions that Prevent Inspections
None.
PART III
Item 10. Directors, Executive Officers, and Corporate Governance
| (a) | Directors of the Company |
Information relative to directors of the Company will be set forth under the heading “Proposal 1: Election of Directors” in the Proxy Statement and is incorporated herein by reference.
| (b) | Executive Officers of the Company |
Information with respect to executive officers of the Company is set forth in Item 4A in Part I.
| (c) | Information on our audit committee and the audit committee financial expert will be contained under the heading “Committees” under the Board of Directors section of the Proxy Statement and is incorporated herein by reference. |
| (d) | Information about the Code of Business Conduct applicable to our employees, including our Chief Executive Officer, Chief Financial Officer, Chief Accounting Officer, and the Board of Directors, will be set forth under the heading “Code of Business Conduct” under the Governance section of the Proxy Statement and is incorporated herein by reference. |
Item 11. Executive Compensation
Information set forth in the Proxy Statement beginning with the section captioned “Director Compensation” through and including the section captioned “Excess Savings Plan” is incorporated herein by reference.
Item 12. Security Ownership of Certain Beneficial Owners and Management and Related Shareholder Matters
Information set forth in the Proxy Statement under the section captioned “Shareholder Ownership” is incorporated herein by reference. Equity compensation plan information is contained under the “Stock Awards” and “Employees Stock Purchase Plan” sections of the Share-Based Compensation note in “Item 8. Consolidated Financial Statements and Supplementary Data.”
Item 13. Certain Relationships and Related Transactions, and Director Independence
Information set forth under the heading “Directors’ Independence” under the Governance section of the Proxy Statement is incorporated herein by reference.
Item 14. Principal Accounting Fees and Services
Our independent registered public accounting firm is KPMG LLP, New York, NY, Auditor Firm ID: 185. Information about the principal accounting fees and services is set forth under the heading “Audit and Non-Audit Fees” under the “Proposal 5” section of the Proxy Statement and is incorporated herein by reference. Information about the Audit Committee’s preapproval policies and procedures is set forth in the section captioned “Audit Committee Preapproval Policies and Procedures” under the “Proposal 5” section of the Proxy Statement and is incorporated by reference.
PART IV
Item 15. Exhibits and Financial Statement Schedules
(a)(1) and (2) Financial Statements
The list of financial statements required by this item is set forth in Item 8. “Consolidated Financial Statements and Supplementary Data.” All other schedules specified under Regulation S-X have been omitted because they are not applicable, because they are not required, or because the information required is included in the financial statements or notes thereto.
(a)(3) and (c) Exhibits
An index of the exhibits are on pages 72 through 75.
Item 16. Form 10-K Summary
None.
2022 Form 10-K Page 71
FOOT LOCKER, INC.
INDEX OF EXHIBITS
Exhibit No. |
|
Description |
|---|---|---|
3.1 |
|
Certificate of Incorporation of the Registrant, as filed by the Department of State of the State of New York on April 7, 1989 (incorporated herein by reference to Exhibit 3(i)(a) to the Quarterly Report on Form 10-Q for the quarterly period ended July 26, 1997 filed on September 4, 1997 (the “July 26, 1997 Form 10-Q”)), as amended by Certificates of Amendment of the Certificate of Incorporation of the Registrant, as filed by the Department of State of the State of New York on (a) July 20, 1989, (b) July 24, 1990, (c) July 9, 1997 (incorporated herein by reference to Exhibit 3(i)(b) to the July 26, 1997 Form 10-Q), (d) June 11, 1998 (incorporated herein by reference to Exhibit 4.2(a) to the Registration Statement on Form S-8 (Registration No. 333-62425)), (e) November 1, 2001 (incorporated herein by reference to Exhibit 4.2 to the Registration Statement on Form S-8 (Registration No. 333-74688)), (f) May 28, 2014 (incorporated herein by reference to Exhibit 3.1 to the Current Report on Form 8-K dated May 21, 2014 filed on May 28, 2014), and (g) December 8, 2020 (incorporated herein by reference to Exhibit 3.1 to the Current Report on Form 8-K dated December 7, 2020 filed on December 8, 2020). |
|
|
|
3.2 |
|
|
|
|
|
4.1 |
|
|
|
|
|
4.2 |
|
|
4.3 |
|
|
10.1 |
|
|
|
|
|
10.2 |
|
|
|
|
|
10.3 |
|
|
|
|
|
10.4† |
|
|
|
|
|
10.5† |
|
|
|
|
|
2022 Form 10-K Page 72
Exhibit No. |
|
Description |
|---|---|---|
10.6† |
|
|
|
|
|
10.7† |
|
|
|
|
|
10.8† |
|
|
|
|
|
10.9† |
||
|
|
|
10.10† |
|
|
|
|
|
10.11† |
|
|
|
|
|
10.12† |
|
Form of Stock Option Inducement Award Agreement (Annual Award) for Mary N. Dillon (incorporated herein by reference to Exhibit 99.3 on Form S-8 (Registration No. 333-267044), filed on August 24, 2022 (the "2022 Form S-8")). |
|
|
|
10.13† |
|
|
|
|
|
10.14† |
|
|
|
|
|
10.15† |
|
|
|
|
|
10.16† |
|
|
|
|
|
10.17† |
|
Executive Supplemental Retirement Plan (incorporated herein by reference to Exhibit 10(d) to the Registration Statement on Form 8-B filed on August 7, 1989 (Registration No. 1-10299) (the “8-B Registration Statement”)). |
|
|
|
10.18† |
|
Amendment No. 1 to Executive Supplemental Retirement Plan (incorporated herein by reference to Exhibit 10(c)(i) to the Annual Report on Form 10-K for the fiscal year ended January 28, 1995 filed on April 24, 1995). |
|
|
|
10.19† |
|
Amendment No. 2 to Executive Supplemental Retirement Plan (incorporated herein by reference to Exhibit 10(d)(ii) to the Annual Report on Form 10-K for the fiscal year ended January 27, 1996 filed on April 26, 1996). |
|
|
|
10.20† |
|
|
|
|
|
10.21† |
|
|
|
|
|
2022 Form 10-K Page 73
Exhibit No. |
|
Description |
|---|---|---|
10.22† |
|
|
|
|
|
10.23† |
|
|
|
|
|
10.24† |
|
|
|
|
|
10.25† |
|
Directors’ Retirement Plan, as amended (incorporated herein by reference to Exhibit 10(k) to the 8-B Registration Statement). |
|
|
|
10.26† |
|
Amendment No. 1 to Directors’ Retirement Plan (incorporated herein by reference to Exhibit 10(c) to the Quarterly Report on Form 10-Q for the quarterly period ended October 28, 1995 filed on December 11, 1995). |
|
|
|
10.27† |
|
|
|
|
|
10.28† |
|
|
|
|
|
10.29† |
|
|
|
|
|
10.30† |
|
|
|
|
|
10.31† |
|
|
|
|
|
10.32† |
|
|
|
|
|
10.33* |
|
|
|
|
|
10.34 |
|
Trust Agreement dated as of November 12, 1987 (“Trust Agreement”), between F.W. Woolworth Co. and The Bank of New York, as amended and assumed by the Registrant (incorporated herein by reference to Exhibit 10(j) to the 8-B Registration Statement). |
|
|
|
10.35 |
|
|
|
|
|
10.36† |
|
|
|
|
|
10.37† |
|
|
|
|
|
10.38† |
|
|
|
|
|
2022 Form 10-K Page 74
Exhibit No. |
|
Description |
|---|---|---|
10.39† |
|
|
|
|
|
10.40† |
|
|
|
|
|
19* |
|
|
|
|
|
21* |
|
|
|
|
|
23* |
|
|
|
|
|
31.1* |
|
Certification of Chief Executive Officer Pursuant to Section 302 of the Sarbanes-Oxley Act of 2002. |
|
|
|
31.2* |
|
Certification of Chief Financial Officer Pursuant to Section 302 of the Sarbanes-Oxley Act of 2002. |
|
|
|
32** |
|
|
|
|
|
101.INS* |
|
XBRL Instance Document. |
|
|
|
101.SCH* |
|
XBRL Taxonomy Extension Schema. |
|
|
|
101.CAL* |
|
XBRL Taxonomy Extension Calculation Linkbase. |
|
|
|
101.DEF* |
|
XBRL Taxonomy Extension Definition Linkbase. |
|
|
|
101.LAB* |
|
XBRL Taxonomy Extension Label Linkbase. |
|
|
|
|
101.PRE* 104* |
|
XBRL Taxonomy Extension Presentation Linkbase. Cover Page Interactive Data File (formatted as Inline XBRL and contained in Exhibit 10.1). |
† |
Management contract or compensatory plan or arrangement |
* |
Filed herewith |
** |
Furnished herewith |
2022 Form 10-K Page 75
SIGNATURES
Pursuant to the requirements of Section 13 or 15(d) of the Securities Exchange Act of 1934, the Company has duly caused this report to be signed on its behalf by the undersigned, thereunto duly authorized.
|
FOOT LOCKER, INC. |
|
|
|
By: /s/ MARY N. DILLON |
|
Mary N. Dillon |
|
|
|
Date: March 27, 2023 |
Pursuant to the requirements of the Securities Exchange Act of 1934, this report has been signed below on March 27, 2023, by the following persons on behalf of the Company and in the capacities indicated.
/s/ MARY N. DILLON |
|
/s/ ROBERT HIGGINBOTHAM |
Mary N. Dillon |
|
Robert Higginbotham |
President and |
|
Senior Vice President and |
Chief Executive Officer |
|
Interim Chief Financial Officer |
|
|
|
/s/ GIOVANNA CIPRIANO |
|
/s/ STEVEN OAKLAND |
Giovanna Cipriano |
|
Steven Oakland |
Senior Vice President and Chief Accounting Officer |
|
Director |
|
|
|
/s/ VIRGINIA C. DROSOS |
|
/s/ ULICE PAYNE, JR. |
Virginia C. Drosos |
|
Ulice Payne, Jr. |
Director |
|
Director |
|
|
|
/s/ ALAN D. FELDMAN |
|
/s/ KIMBERLY K. UNDERHILL |
Alan D. Feldman |
|
Kimberly K. Underhill |
Director |
|
Director |
|
|
|
/s/ GUILLERMO G. MARMOL |
|
/s/ TRISTAN WALKER |
Guillermo G. Marmol |
|
Tristan Walker |
Director |
|
Director |
|
|
|
/s/ DARLENE NICOSIA |
|
/s/ DONA D. YOUNG |
Darlene Nicosia |
|
Dona D. Young |
Director |
|
Non-Executive Chair |
|
|
|
2022 Form 10-K Page 76
2022 Form 10-K Page 77
Exhibit 10.33
INDEMNIFICATION AGREEMENT, AS AMENDED
THIS INDEMNIFICATION AGREEMENT is effective as of __________, between Foot Locker, Inc., a New York corporation (the "Company"), and __________ ("Indemnitee").
WHEREAS, it is essential to the Company to retain and attract as directors and officers the most capable persons available;
WHEREAS, Indemnitee is a director or officer of the Company;
WHEREAS, both the Company and Indemnitee recognize the increased risk of litigation and other claims being asserted against directors and officers of public companies in today's environment;
WHEREAS, basic protection against undue risk of personal liability of directors and officers heretofore has been provided through insurance coverage providing reasonable protection at reasonable cost, and Indemnitee has relied on the availability of such coverage; but as a result of substantial changes in the marketplace for such insurance it generally has become more difficult to obtain such insurance on terms providing reasonable protection at reasonable cost;
WHEREAS, in response to the conclusion of the Governor's Advisory Commission on Liability Insurance that it is crucial to secure the continued service of competent and experienced people in senior corporate positions and to assure that they will be able to exercise judgment without fear of personal liability so long as they fulfill the basic duties of honesty, care and good faith, the provisions of the New York Business Corporation Law ("BCL") were amended in July 1986 to provide, among other things, for the ability of New York corporations to implement individual indemnification contracts;
WHEREAS, the By-laws of the Company have been amended to require the Company to indemnify and advance expenses to its directors and officers to the fullest extent permitted by law and authorize the Company to enter into agreements providing for such indemnification; and
WHEREAS, in recognition of the fact that Indemnitee continues to serve as a director or officer of the Company, in part in reliance on the aforesaid By-laws and Indemnitee's need for substantial protection against personal liability in order to enhance Indemnitee's continued service to the Company in an effective manner, and in part to provide Indemnitee with specific contractual assurance that the protection promised by such By-laws will be available to Indemnitee (regardless of, among other things, any amendment to, or revocation of, such By-laws or any change in the composition of the Company's Board of Directors or any acquisition transaction relating to the Company), and due to the potential inadequacy of the Company's directors' and officers' liability insurance coverage, the Company wishes to provide in this Agreement for the indemnification of, and the advancing of expenses to, Indemnitee to the fullest extent (whether partial or complete) permitted by law and as set forth in this Agreement, and, to the extent insurance is maintained, for the continued coverage of Indemnitee under the Company's directors' and officers' liability insurance policies;
NOW, THEREFORE, in consideration of the premises and of Indemnitee continuing to serve the Company directly or, at its request, with another enterprise, and intending to be legally bound hereby, the parties hereto agree as follows:
1.Certain Definitions.
(a) |
“Approved Law Firm” shall mean any law firm (i) located in New York City, (ii) having 100 or more attorneys and (iii) rated "av" by Martindale-Hubbell Law Directory; provided, however, that such law firm shall not, for a five-year period prior to the Indemnifiable Event, have been engaged by the Company, an Acquiring Person or Indemnitee. |
(b)“Board of Directors” shall mean the Board of Directors of the Company.
(c) |
“Change in Control” shall be deemed to have occurred if (i) any "person" (as such term is used in Sections 13(d) and 14(d) of the Securities Exchange Act of 1934, as amended), other than a trustee or other fiduciary holding securities under an employee benefit plan of the Company or a corporation owned directly or indirectly by the shareholders of the Company in substantially the same proportions as their ownership of stock of the Company, is or becomes the "beneficial owner" (as defined in Rule 13d-3 under said Act), directly or indirectly, of securities of the Company representing 20 percent or more of the total voting power represented by the Company's then outstanding Voting Securities (such person being hereinafter referred to as an "Acquiring Person"), or (ii) during any 24-consecutive-month period, individuals who at the beginning of such period constitute the Board of Directors of the Company and any new director whose election by the Board of Directors or nomination for election by the Company's shareholders was approved by a vote of at least two-thirds (⅔) of the directors then still in office who either were directors at the beginning of the period or whose election or nomination for election was previously so approved, cease for any reason to constitute a majority thereof, or (iii) the shareholders of the Company approve a merger or consolidation of the Company with any other corporation, other than a merger or consolidation which would result in the Voting Securities of the Company outstanding immediately prior thereto continuing to represent (either by remaining outstanding or by being converted into Voting Securities of the surviving entity) at least 80 percent of the total voting power represented by the Voting Securities of the Company or such surviving entity outstanding immediately after such merger or consolidation, or (iv) the shareholders of the Company approve a plan of complete liquidation of the Company or an agreement for the sale or disposition by the Company of all or substantially all the Company's assets. |
(d) |
“Claim” shall mean any threatened, pending or completed action, suit or proceeding, or any inquiry or investigation, whether conducted by the Company or any other party, that Indemnitee in good faith believes might lead to the institution of any such action, suit or proceeding, whether civil, criminal, administrative, investigative or other. |
(e) |
“Expenses” shall include attorneys' fees and all other costs, expenses and obligations paid or incurred in connection with investigating, defending, being a witness in or participating in (including on appeal), or preparing to defend, be a witness in or participate in, any Claim relating to any Indemnifiable Event, together with interest, computed at the Company's average cost of funds for short-term borrowings, accrued from the date of incurrence of such expense to the date Indemnitee receives reimbursement therefor. |
(f) |
“Indemnifiable Event” shall mean any event or occurrence related to the fact that Indemnitee is or was a director, officer, employee, agent or fiduciary of the Company, or is or was serving at the request of the Company as a director, officer, employee, trustee, agent or fiduciary of another corporation of any type or kind, domestic or foreign, partnership, joint venture, trust, employee benefit plan or other enterprise, or by reason of anything done or not done by Indemnitee in any such capacity. Without limitation of any indemnification provided hereunder, an Indemnitee serving (i) another corporation, partnership, joint venture or trust of which 20 percent or more of the voting power or residual economic interest is held, directly or indirectly, by the Company, or (ii) any employee benefit plan of the Company or any entity referred to in clause (i), in any capacity shall be deemed to be doing so at the request of the Company. |
(g) |
“Reviewing Party” shall be (i) the Board of Directors acting by quorum consisting of directors who are not parties to the particular Claim with respect to which Indemnitee is seeking indemnification, or (ii), if such a quorum is not obtainable or, even if obtainable, if a quorum of disinterested directors so directs, (A) the Board of Directors upon the opinion in writing of independent legal counsel that indemnification is proper in the circumstances because the applicable standard of conduct set forth in Section 2 of this Agreement and in Section 721 of the BCL has been met by Indemnitee or (B) the shareholders upon a finding that Indemnitee has met the applicable standard of conduct referred to in clause (ii)(A) of this definition. |
(h) |
“Voting Securities” shall mean any securities of the Company which vote generally in the election of directors. |
2. |
Basic Indemnification Arrangement. If Indemnitee was, is or becomes at any time a party to, or witness or other participant in, or is threatened to be made a party to, or witness or other participant in, a Claim by reason of (or arising in part out of) an Indemnifiable Event, the Company shall indemnify Indemnitee to the fullest extent permitted by law as soon as practicable but in any event no later than 30 days after written demand is presented to the Company, against any and all Expenses, judgments, fines (including excise taxes assessed on an Indemnitee with respect to an employee benefit plan), penalties and amounts paid in settlement (including all interest, assessments and other charges paid or payable in connection with, or in respect of, such Expenses, judgments, fines, penalties or amounts paid in settlement) of such Claim. If so requested by Indemnitee, the Company shall advance (within two business days of such request) any and all Expenses to Indemnitee (an "Expense Advance"). Notwithstanding anything in this Agreement to the contrary, (i) Indemnitee shall not be entitled to indemnification pursuant to this Agreement if a judgment or other final adjudication adverse to Indemnitee establishes that Indemnitee's acts were committed in bad faith or were the result of active and deliberate dishonesty and, in either case, were material to the cause of action so adjudicated, or that Indemnitee personally gained in fact a financial profit or other advantage to which Indemnitee was not legally entitled and (ii) prior to a Change in Control Indemnitee shall not be entitled to indemnification pursuant to this Agreement in connection with any Claim initiated by Indemnitee against the Company or any director or officer of the Company unless the Company has joined in or consented to the initiation of such Claim. |
3. |
Payment. Notwithstanding the provisions of Section 2, the obligations of the Company under Section 2 (which shall in no event be deemed to preclude any right to indemnification to which Indemnitee may be entitled under Section 723(a) of the BCL) shall be subject to the condition that the Reviewing Party shall have authorized such indemnification in the specific case by having determined that Indemnitee is permitted to be indemnified under the applicable standard of conduct set forth in Section 2 and applicable law. The Company shall promptly call a meeting of the Board of Directors with respect to a Claim and agrees to use its best efforts to facilitate a prompt determination by the Reviewing Party with respect to the Claim. Indemnitee shall be afforded the opportunity to make submissions to the Reviewing Party with respect to the Claim. The obligation of the Company to make an Expense Advance pursuant to Section 2 shall be subject to the condition that, if, when and to the extent that the Reviewing Party determines that Indemnitee would not be permitted to be so indemnified under Section 2 and applicable law, the Company shall be entitled to be reimbursed by Indemnitee (who hereby agrees and undertakes to the full extent required by paragraph (a) of Section 725 of the BCL to reimburse the Company) for all such amounts theretofore paid; provided, however, that if Indemnitee has commenced legal proceedings in a court of competent jurisdiction to secure a determination that Indemnitee should be indemnified under applicable law, any determination made by the Reviewing Party that Indemnitee would not be permitted to be indemnified under applicable law shall not be binding and Indemnitee shall not be required to reimburse the Company for any Expense Advance until a final judicial determination is made with respect thereto (as to which all rights of appeal therefrom have been exhausted or lapsed). If there has been no determination by the Reviewing Party or if the Reviewing Party determines that Indemnitee substantively would not be permitted to be indemnified in whole or in part under applicable law, Indemnitee shall have the right to commence litigation in any court in the State of New York having subject matter jurisdiction thereof and in which venue is proper seeking an initial determination by the court or challenging any such determination by the Reviewing Party or any aspect thereof, and the Company hereby consents to service of process and to appear in any such proceeding. Any determination by the Reviewing Party otherwise shall be conclusive and binding on the Company and Indemnitee. |
4. |
Change in Control. If there is a Change in Control of the Company (other than a Change in Control which has been approved by a majority of the Board of Directors who were directors immediately prior to such Change in Control) then (i) all determinations by the Company pursuant to the first sentence of Section 3 hereof and Section 723(b) of the BCL shall be made pursuant to subparagraph (1) or (2)(A) of such Section 723(b) and (ii) with respect to all matters thereafter arising concerning the rights of Indemnitee to indemnity payments and Expense Advances under this Agreement or any other agreement or By-law of the Company now or hereafter in effect relating to Claims for Indemnifiable Events (including, but not limited to, any opinion to be rendered pursuant |
to subparagraph (2)(A) of Section 723(b) of the BCL) the Company (including the Board of Directors) shall seek legal advice from (and only from) special, independent counsel selected by Indemnitee and approved by the Company (which approval shall not be unreasonably withheld), and who has not otherwise performed services for the Company (or any subsidiary of the Company) or the Acquiring Person (or any affiliate or associate of such Acquiring Person) within the last five years (other than in connection with such matters) or Indemnitee. Unless Indemnitee has theretofore selected counsel pursuant to this Section 4 and such counsel has been approved by the Company, any Approved Law Firm shall be deemed to satisfy the requirements set forth above. Such counsel, among other things, shall render its written opinion to the Company, the Board of Directors and Indemnitee as to whether and to what extent Indemnitee would be permitted to be indemnified under applicable law. The Company agrees to pay the reasonable fees of the special, independent counsel referred to above and to fully indemnify such counsel against any and all expenses (including attorneys' fees), claims, liabilities and damages arising out of or relating to this Agreement or its engagement pursuant hereto. As used in this Section 4, the terms "affiliate" and "associate" shall have the respective meanings ascribed to such terms in Rule 12b-2 of the General Rules and Regulations under the Securities Exchange Act of 1934, as amended and in effect on the date of this Agreement.
5. |
Indemnification for Additional Expenses. The Company shall indemnify Indemnitee against any and all expenses (including attorneys' fees) and, if requested by Indemnitee, shall (within two business days of such request) advance such expenses to Indemnitee, which are incurred by Indemnitee in connection with any claim asserted or action brought by Indemnitee for (i) indemnification or advance payment of Expenses by the Company under this Agreement or any other agreement or By-law of the Company now or hereafter in effect relating to Claims for Indemnifiable Events and/or (ii) recovery under any directors' and officers' liability insurance policies maintained by the Company, regardless of whether Indemnitee ultimately is determined to be entitled to such indemnification, advance expense payment or insurance recovery, as the case may be. |
6. |
Partial Indemnity, Etc. If Indemnitee is entitled under any provision of this Agreement to indemnification by the Company for some or a portion of the Expenses, judgments, fines, penalties and amounts paid in settlement of a Claim but not, however, for all of the total amount thereof, the Company shall nevertheless indemnify Indemnitee for the portion thereof to which Indemnitee is entitled. Moreover, notwithstanding any other provision of this Agreement, to the extent that Indemnitee has been successful on the merits or otherwise in defense of any or all Claims relating in whole or in part to an Indemnifiable Event or in defense of any issue or matter therein, including dismissal without prejudice, Indemnitee shall be indemnified, to the extent permitted by law, against all Expenses incurred in connection with such Indemnifiable Event. In connection with any determination by the Reviewing Party or otherwise as to whether Indemnitee is entitled to be indemnified hereunder, the burden of proof shall, to the extent permitted by law, be on the Company to establish that Indemnitee is not so entitled. |
7. |
No Presumption. For purposes of this Agreement, the termination of any claim, action, suit or proceeding, whether civil or criminal, by judgment, order, settlement (whether with or without court approval) or conviction, or upon a plea of nolo contendere, or its equivalent, shall not create a presumption that Indemnitee did not meet any particular standard of conduct or have any particular belief or that a court has determined that indemnification is not permitted by applicable law. |
8. |
Nonexclusivity, Etc. The rights of Indemnitee hereunder shall be in addition to any other rights Indemnitee may have under the By-laws of the Company, the BCL or otherwise. To the extent that a change in the BCL (whether by statute or judicial decision) permits greater indemnification by agreement than would be afforded currently under the By-laws of the Company and this Agreement, it is the intent of the parties hereto that Indemnitee shall enjoy by this Agreement the greater benefits so afforded by such change. |
9. |
Liability Insurance. To the extent the Company maintains an insurance policy or policies providing directors' and officers' liability insurance, Indemnitee shall be covered by such policy or policies, in accordance with its or their terms, to the maximum extent of the coverage available for any director or officer of the Company. |
10. |
Period of Limitations. No legal action shall be brought and no cause of action shall be asserted by or on behalf of the Company or any affiliate of the Company against Indemnitee, Indemnitee's spouse, heirs, executors or personal or legal representatives after the expiration of two years from the date of accrual of such cause of action, and any claim or cause of action of the Company or its affiliate shall be extinguished and deemed released unless asserted by the timely filing of a legal action within such two-year period; provided, however, that if any shorter period of limitations is otherwise applicable to any such cause of action, such shorter period shall govern. |
11. |
Amendments, Etc. No supplement, modification or amendment of this Agreement shall be binding unless executed in writing by both of the parties hereto. No waiver of any of the provisions of this Agreement shall be deemed or shall constitute a waiver of any other provisions hereof (whether or not similar) nor shall such waiver constitute a continuing waiver. |
12. |
Subrogation. In the event of payment under this Agreement, the Company shall be subrogated to the extent of such payment to all of the rights of recovery of Indemnitee, who shall execute all papers required and shall do everything that may be necessary to secure such rights, including the execution of such documents necessary to enable the Company effectively to bring suit to enforce such rights. |
13. |
No Duplication of Payments. The Company shall not be liable under this Agreement to make any payment in connection with any claim made against Indemnitee to the extent Indemnitee has otherwise actually received payment (under any insurance policy, By-law or otherwise) of the amounts otherwise indemnifiable hereunder. |
14. |
Specific Performance. The parties recognize that if any provision of this Agreement is violated by the Company, Indemnitee may be without an adequate remedy at law. Accordingly, in the event of any such violation, Indemnitee shall be entitled, if Indemnitee so elects, to institute proceedings, either in law or at equity, to obtain damages, to enforce specific performance, to enjoin such violation, or to obtain any relief or any combination of the foregoing as Indemnitee may elect to pursue. |
15. |
Binding Effect, Etc. This Agreement shall be binding upon, inure to the benefit of, and be enforceable by, the parties hereto and their respective successors (including any direct or indirect successor by purchase, merger, consolidation or otherwise to all or substantially all of the business and/or assets of the Company), assigns, spouses, heirs, and personal and legal representatives. This Agreement shall continue in effect regardless of whether Indemnitee continues to serve as an officer or director of the Company or of any other enterprise at the Company's request. |
16. |
Severability. The provisions of this Agreement shall be severable if any of the provisions hereof (including any provision within a single section, paragraph or sentence) are held by a court of competent jurisdiction to be invalid, void or otherwise unenforceable, and the remaining provisions shall remain enforceable to the fullest extent permitted by law. |
17. |
Governing Law. This Agreement shall be governed by, and be construed and enforced in accordance with, the laws of the State of New York applicable to contracts made and to be performed in such state without giving effect to the principles of conflicts of laws. |
[SIGNATURE PAGE FOLLOWS]
IN WITNESS WHEREOF, the parties hereto have caused this Agreement to be duly executed as of the day and year first above written.
FOOT LOCKER, INC.
By:_______________________
[●]
_______________________
[●]
Exhibit 19
POLICY PROHIBITING INSIDER TRADING
| I. | INTRODUCTION |
In the course of performing your duties as a director, officer, or other team member of Foot Locker, Inc., including its subsidiaries (the “Company”), you may have access to “material nonpublic” information about the Company and other organizations, including vendors and competitors. The U.S. securities laws prohibit you from engaging in any transaction in the Company’s or other corporation’s securities while you are aware of material nonpublic information concerning that corporation or to disclose (or “tip”) material nonpublic information to others (called “tippees”) who then trade on that information. Insider trading violators are subject to prosecution and severe punishment.
This Policy Prohibiting Insider Trading (this “Policy”) applies to all of the Company’s directors and team members. This Policy is intended to promote compliance with the U.S. securities laws and protect the Company and you from the serious liabilities and penalties that could result from violation of these laws.
For purposes of this Policy, references to “trading” and “transactions” include purchases and sales of stocks, bonds, debentures, options, puts, calls, and other securities, as well as sales of stock you acquire by exercising stock options, and other trades you may make pursuant to an investment direction under the Foot Locker 401(k) Plan.
| II. | STATEMENT OF POLICY |
No director, officer, or other team member of the Company who is aware of material nonpublic information about the Company may, directly or through family members or other persons or entities, (a) buy or sell the Company’s securities, (b) engage in any other action to take advantage of that information, or (c) disclose that information to others outside the Company, including family members and friends, or suggest that anyone purchase or sell any of the Company’s securities.
This Policy also includes organizations other than the Company, including vendors and competitors, where you are aware of material nonpublic information about that organization.
No director, officer, or other team member of the Company may use material nonpublic information about the Company, its vendors, suppliers, and other business partners for personal gain, such as disclosing information about the Company or these other organizations to third parties. Directors, officers, and other team members of the Company may not participate in so-called “expert network” firms that relate to the retail or athletic footwear and apparel industries. As used in this Policy, expert network refers to firms that connect their clients – principally hedge funds and other institutional investors – with persons who have special expertise in their clients’ areas of interest.
There is no exception to this Policy for small transactions or those that seem necessary or justifiable for independent reasons, such as the need to raise money to pay taxes or tuition. Transactions outside of the United States, as well as securities of non-U.S. companies, are also covered by this Policy.
| III. | MATERIAL NONPUBLIC INFORMATION |
“Material” information is information that a reasonable investor would consider important in making a decision to buy, hold, or sell securities. Any information that could be expected to affect the Company’s stock price, whether it is positive or negative, should be considered material. Examples of information that ordinarily would be considered material include materially higher or lower than expected sales or earnings results; the pending acquisition or disposition of a substantial business; projections of future earnings or losses, or other earnings guidance; financings, restructurings, or public or private debt or equity offerings; significant changes in business strategies; a change in dividend policy; senior management changes; and the gain or loss of a significant vendor.
“Nonpublic” information is information that is not generally known or available to the public. All nonpublic information about the Company should be treated confidentially. We consider information about the Company to be available to the public only when it has been disclosed broadly by appropriate methods, such as a press release or a filing with the U.S. Securities and Exchange Commission (the “SEC”), and the investing public has had sufficient time to absorb and evaluate the information. As a general rule, you should consider information to be nonpublic until one business day after public disclosure.
| IV. | TRANSACTIONS BY FAMILY MEMBERS |
The Policy also applies to your family members who reside with you and any family members who do not live in your household but whose transactions in the Company’s securities are directed by you or are subject to your influence or control (such as parents or children who consult with you before they trade). You are responsible for compliance with this Policy by these persons. The SEC and federal prosecutors may presume that trading by family members (including children away at school) is based on information you supplied and treat their transactions as if you had traded yourself.
| V. | TRADING “WINDOWS” AND PRECLEARANCE REQUIREMENT |
Directors and Corporate Officers: You may not engage in any transaction involving the Company’s securities without first pre-clearing the transaction with the General Counsel’s Office. Further, you may only trade in the Company’s securities during the window period that begins one business day after the Company releases year-end or quarterly earnings and ends two weeks before the end of the quarter (the “Trading Window”), unless advised of a shorter Trading Window by the General Counsel’s Office. In general, however, the optimal time for you to trade in the Company’s stock from a securities law standpoint would be during the ten business-day period that begins one business day after earnings are released. Please note that even during the Trading Window you may not initiate a trade in the Company’s securities if you are aware of material nonpublic information about the Company.
Other Restricted Persons: All senior members of the operating, merchant, accounting, finance, legal, human resources, corporate development, investor relations, and corporate communications departments, as well as any other team members in a role that makes it likely they will have involvement with material non-public information (“Other Restricted Persons”) must exercise greater diligence to comply with insider trading prohibitions. The General Counsel’s Office may notify you if you are considered an Other Restricted Person under this Policy. Other Restricted Persons may only trade in the Company’s securities during the Trading Window, unless advised of a shorter Trading Window by the General Counsel’s Office. In general, however, the optimal time for you to trade in the Company’s stock from a securities law standpoint would be during the ten business-day period that begins one business day after earnings are released. Please note that even during the Trading Window you may not initiate a trade in the Company’s securities if you are aware of material nonpublic information about the Company.
All Team Members: No stock option exercises in which the underlying shares will be sold are permitted during the period from the end of each quarter to one business day following the issuance of the quarterly earnings release. In addition, from time to time, the Company, through the General Counsel’s Office, may restrict trading in the Company’s securities (including to specified team members because of their involvement with a project involving material nonpublic information) due to material nonpublic information. In that event, the General Counsel’s Office may notify particular groups or individuals that they should not engage in any transactions involving the Company’s securities and should not disclose to others the fact that the trading window has been closed.
Post-Termination Restriction: Following termination of employment or service on the Board, directors, corporate officers, and Other Restricted Persons shall continue to be subject to the insider trading restrictions on the Company’s stock for a period of 90 days, or for such longer period of time reasonably determined by the Company that the insider is in possession of material non-public information about the Company.
| VI. | PUBLICLY-TRADED OPTIONS AND HEDGING |
Directors, officers, and Other Restricted Persons may never (1) engage in transactions involving publicly-traded options that relate to the Company’s securities, or (2) purchase financial instruments (e.g., prepaid variable forward contracts, equity swaps, collars, and exchange funds) that are designed to hedge or offset a decrease in the market value of securities either granted to the director, officer, or Other Restricted Person as part of their compensation or otherwise held, directly or indirectly, by the director, officer, or Other Restricted Person.
No team member may engage in these types of transactions while aware of material nonpublic information about the Company.
| VII. | MARGIN ACCOUNTS AND PLEDGES OF STOCK |
You should be aware that securities held in a margin account may be sold by the broker without the customer's consent if the customer fails to meet a margin call. Similarly, securities pledged as collateral for a loan may be sold in foreclosure if the borrower defaults on the loan. Because a margin sale or foreclosure sale may occur at a time when you are aware of material nonpublic information or are otherwise not permitted to trade in the Company’s securities, you should be particularly careful in holding Company securities in a margin account or pledging Company securities as collateral for a loan. The sale of Company stock in a margin account or held as collateral for a loan, at times other than those permitted by this Policy, even if involuntary, would violate this Policy and may violate U.S. securities laws.
| VIII. | POST-TERMINATION TRANSACTIONS |
This Policy may continue to apply to your transactions in the Company’s securities even after your service with the Company terminates. If you are in possession of material nonpublic information when your service terminates, you may not trade in the Company’s securities until that information has become public or is no longer material.
| IX. | SECTION 16 REPORTING REQUIREMENTS |
Directors and executive officers of Foot Locker, Inc. are required to report their transactions in the Company’s securities with the SEC within two business days after the transaction. Therefore, in addition to the pre-clearance and trading window procedures provided under this Policy, directors and executive officers are required to confirm the details of their pre-cleared transactions in the Company’s securities by providing the information to the General Counsel’s Office by the close of business on the same day that the transactions occurs so that the appropriate form can be prepared and timely filed with the SEC. In order to facilitate filing of Section 16 reports, the Company also requests that directors and executive officers provide the Company’s Secretary with a power of attorney for this purpose.
| X. | SANCTIONS AND PENALTIES |
The consequences of an insider trading violation can be severe. For example, under U.S. securities laws, individuals may be subject to imprisonment for up to 20 years, criminal fines of up to $5 million, and civil fines of up to three times the profit gained or loss avoided. Also, team members who fail to comply with this Policy may be subject to Company-imposed sanctions, including immediate termination for cause.
If you disclose material nonpublic information to a person who then trades on the information, you will be subject to the same penalties as the tippee, even if you do not trade and do not profit from the tippee’s trading.
| XI. | RULE 10b5-1 PLANS |
There is a procedure under Rule 10b5-1 adopted by the SEC that allows an individual to establish an automatic trading plan (e.g., purchases or sales of stock at pre-determined prices and/or pre-determined times) that may result in trades taking place when they would otherwise not be permitted under this Policy. Trading plans under this rule must be approved by the General Counsel and also meet the SEC’s stringent requirements and may be subject to public filing.
Any director or corporate officer who wishes to implement a trading plan must comply with the following procedures:
| ● | Trading plans may only be entered into during a Trading Window and when the insider is otherwise not in possession of material non-public information regarding the Company. |
| ● | All trading plans must be pre-cleared with the General Counsel’s Office. |
| ● | Trading may commence only upon the later of: (1) 90 days following trading plan’s adoption or modification; or (2) two business days following the disclosure in a periodic report of the Company’s financial results for the fiscal quarter in which the trading plan was adopted or modified (but not to exceed 120 days following plan adoption or modification). |
| ● | In the event the insider terminates a trading plan prior to expiration by its terms, the insider shall not be permitted to enter into a new trading plan during the 90-day period following termination of the original plan. |
| ● | Multiple, overlapping plans are not permitted. |
Transactions effected pursuant to a trading plan will not require further pre-clearance at the time of the transaction if the plan specifies the dates, prices, and amounts of the contemplated trades, or otherwise establishes a formula for determining the dates, prices, and amounts.
| XII. | EFFECTIVE DATE |
The effective date of this Policy is January 29, 2023.
| XIII. | QUESTIONS |
If you have any questions concerning this Policy, please contact the General Counsel’s Office, as follows:
Sheilagh M. Clarke
Executive Vice President, General Counsel and Secretary The following is a list of subsidiaries of Foot Locker, Inc. as of January 28, 2023, omitting some subsidiaries, which, considered in the aggregate, would not constitute a significant subsidiary.
(212) 720-4477
sclarke@footlocker.com
Exhibit 21
FOOT LOCKER, INC. SUBSIDIARIES (1)
Name |
Jurisdiction of Incorporation |
||||||
Foot Locker Australia, Inc. |
Virginia |
||||||
Foot Locker New Zealand, Inc. |
Virginia |
||||||
Team Edition Apparel, Inc. |
Florida |
||||||
FL Canada Holdings, Inc. |
Delaware |
||||||
Foot Locker Sourcing, Inc. |
Delaware |
||||||
Foot Locker Services Pte. Ltd. |
Singapore |
||||||
FLE Holdings Coöperatief U.A. |
Netherlands |
||||||
FLE Logistics B.V. |
Netherlands |
||||||
Foot Locker Greece Athletic Goods Ltd. |
Greece |
||||||
FL Finance (Europe) Limited |
Ireland |
||||||
Foot Locker Retail Ireland Limited |
Ireland |
||||||
Foot Locker Europe B.V. |
Netherlands |
||||||
FL Ventures B.V. |
Netherlands |
||||||
Foot Locker Poland Spólka z ograniczonq odpowiedzialnościq |
Poland |
||||||
Foot Locker Hungary Kft |
Hungary |
||||||
Foot Locker Romania SRL |
Romania |
||||||
Foot Locker Canada Co. |
Canada |
||||||
Foot Locker Norway B.V. |
Netherlands |
||||||
Foot Locker Denmark B.V. |
Netherlands |
||||||
Runners Point B.V. & Co. KG |
Germany |
||||||
RPG.com GmbH |
Germany |
||||||
Sidestep GmbH |
Germany |
||||||
Runners Point Administration GmbH |
Germany |
||||||
Runners Point Switzerland LLC |
Switzerland |
||||||
Foot Locker Germany Holdings GmbH |
Germany |
||||||
Foot Locker Germany GmbH & Co. KG |
Germany |
||||||
Foot Locker Germany Administration GmbH |
Germany |
||||||
Foot Locker France S.A.S. |
France |
||||||
Foot Locker Austria GmbH |
Austria |
||||||
Foot Locker Belgium B.V. |
Belgium |
||||||
Foot Locker Czech Republic s.r.o. |
Czech Republic |
||||||
Foot Locker - Artigos Desportivos e de Tempos Livres Lda. |
Portugal |
||||||
Foot Locker Europe.com B.V. |
Netherlands |
||||||
Foot Locker Scandinavia B.V. |
Netherlands |
||||||
Foot Locker Switzerland LLC |
Switzerland |
||||||
Foot Locker U.K. Limited |
U.K. |
||||||
Freedom Sportsline Limited |
U.K. |
||||||
Foot Locker Italy S.r.l. |
Italy |
||||||
Foot Locker Netherlands B.V. |
Netherlands |
||||||
Name |
Jurisdiction of Incorporation |
||||||
Foot Locker Spain S.L.U. |
Spain |
||||||
Foot Locker Asia Pte Ltd. |
Singapore |
||||||
Foot Locker Japan GK |
Japan |
||||||
Foot Locker Korea LLC |
South Korea |
||||||
Foot Locker Macau, Limited |
Macau |
||||||
Foot Locker Singapore Pte Ltd. |
Singapore |
||||||
Foot Locker Taiwan Ltd. |
Taiwan |
||||||
Hommyo Limited |
Hong Kong |
||||||
atmos Korea Inc. |
Korea |
||||||
Foot Locker Malaysia Sdn. Bhd |
Malaysia |
||||||
Foot Locker Hong Kong Limited |
Hong Kong |
||||||
Foot Locker Specialty, Inc. |
New York |
||||||
Foot Locker Retail, Inc. |
New York |
||||||
FL atmos US, LLC |
New York |
||||||
FL atmos US Holdco, LLC |
New York |
||||||
Foot Locker atmos Japan G.K. |
Japan |
||||||
Eurostar, Inc. |
Delaware |
||||||
Foot Locker Card Services LLC |
Virginia |
||||||
Foot Locker Stores, Inc. |
Delaware |
||||||
Foot Locker Corporate Services, Inc. |
Delaware |
||||||
FL Finance (Europe) (US) Ltd. |
Ireland |
||||||
|
|
||||||
| (1) | Each subsidiary company is 100% owned, directly or indirectly, by Foot Locker, Inc. All subsidiaries are consolidated with Foot Locker, Inc. for accounting and financial reporting purposes. |
Exhibit 23
CONSENT OF INDEPENDENT REGISTERED PUBLIC ACCOUNTING FIRM
We consent to the incorporation by reference in the following registration statements of Foot Locker, Inc. and subsidiaries of our reports dated March 27, 2023, with respect to the consolidated financial statements of Foot Locker, Inc. and subsidiaries and the effectiveness of internal control over financial reporting.
Form S-8 No. 333-33120
Form S-8 No. 333-121515
Form S-8 No. 333-144044
Form S-8 No. 333-149803
Form S-8 No. 333-167066
Form S-8 No. 333-171523
Form S-8 No. 333-190680
Form S-8 No. 333-196899
Form S-8 No. 333-267044
/s/ KPMG LLP
New York, New York
March 27, 2023
Exhibit 31.1
CERTIFICATION
I, Mary N. Dillon, certify that:
1. |
|
I have reviewed this Annual Report on Form 10-K of Foot Locker, Inc. (the “Registrant”); |
||||||||
| ||||||||||
2. |
|
Based on my knowledge, this report does not contain any untrue statement of a material fact or omit to state a material fact necessary to make the statements made, in light of the circumstances under which such statements were made, not misleading with respect to the period covered by this report; |
||||||||
| ||||||||||
3. |
|
Based on my knowledge, the financial statements, and other financial information included in this report, fairly present in all material respects the financial condition, results of operations and cash flows of the Registrant as of, and for, the periods presented in this report; |
||||||||
| ||||||||||
4. |
|
The Registrant’s other certifying officer(s) and I are responsible for establishing and maintaining disclosure controls and procedures (as defined in Exchange Act Rules 13a-15(e) and 15d-15(e)) and internal control over financial reporting (as defined in Exchange Act Rules 13a-15(f) and 15d-15(f)) for the Registrant and have: |
||||||||
| ||||||||||
|
|
a) |
|
designed such disclosure controls and procedures, or caused such disclosure controls and procedures to be designed under our supervision, to ensure that material information relating to the Registrant, including its consolidated subsidiaries, is made known to us by others within those entities, particularly during the period in which this report is being prepared; |
||||||
| ||||||||||
|
|
b) |
|
designed such internal control over financial reporting, or caused such internal control over financial reporting to be designed under our supervision, to provide reasonable assurance regarding the reliability of financial reporting and the preparation of financial statements for external purposes in accordance with generally accepted accounting principles; |
||||||
| ||||||||||
|
|
c) |
|
evaluated the effectiveness of the Registrant’s disclosure controls and procedures and presented in this report our conclusions about the effectiveness of the disclosure controls and procedures, as of the end of the period covered by this report based on such evaluation; and |
||||||
| ||||||||||
|
|
d) |
|
disclosed in this report any change in the Registrant’s internal control over financial reporting that occurred during the Registrant’s most recent fiscal quarter (the Registrant’s fourth fiscal quarter in the case of an annual report) that has materially affected, or is reasonably likely to materially affect, the Registrant’s internal control over financial reporting; and |
||||||
| ||||||||||
5. |
|
The Registrant’s other certifying officer(s) and I have disclosed, based on our most recent evaluation of internal control over financial reporting, to the Registrant’s auditors and the Audit Committee of the Registrant’s Board of Directors: |
||||||||
| ||||||||||
|
|
a) |
|
all significant deficiencies and material weaknesses in the design or operation of internal control over financial reporting which are reasonably likely to adversely affect the Registrant’s ability to record, process, summarize and report financial information; and |
||||||
| ||||||||||
|
|
b) |
|
any fraud, whether or not material, that involves management or other employees who have a significant role in the Registrant’s internal control over financial reporting. |
||||||
March 27, 2023
|
/s/ MARY N. DILLON |
Chief Executive Officer
Exhibit 31.2
CERTIFICATION
I, Robert Higginbotham, certify that:
1. |
|
I have reviewed this Annual Report on Form 10-K of Foot Locker, Inc. (the “Registrant”); |
||
| ||||
2. |
|
Based on my knowledge, this report does not contain any untrue statement of a material fact or omit to state a material fact necessary to make the statements made, in light of the circumstances under which such statements were made, not misleading with respect to the period covered by this report; |
||
| ||||
3. |
|
Based on my knowledge, the financial statements, and other financial information included in this report, fairly present in all material respects the financial condition, results of operations and cash flows of the Registrant as of, and for, the periods presented in this report; |
||
| ||||
4. |
|
The Registrant’s other certifying officer(s) and I are responsible for establishing and maintaining disclosure controls and procedures (as defined in Exchange Act Rules 13a-15(e) and 15d-15(e)) and internal control over financial reporting (as defined in Exchange Act Rules 13a-15(f) and 15d-15(f)) for the Registrant and have: |
||
| ||||
|
|
a) |
|
designed such disclosure controls and procedures, or caused such disclosure controls and procedures to be designed under our supervision, to ensure that material information relating to the Registrant, including its consolidated subsidiaries, is made known to us by others within those entities, particularly during the period in which this report is being prepared; |
| ||||
|
|
b) |
|
designed such internal control over financial reporting, or caused such internal control over financial reporting to be designed under our supervision, to provide reasonable assurance regarding the reliability of financial reporting and the preparation of financial statements for external purposes in accordance with generally accepted accounting principles; |
| ||||
|
|
c) |
|
evaluated the effectiveness of the Registrant’s disclosure controls and procedures and presented in this report our conclusions about the effectiveness of the disclosure controls and procedures, as of the end of the period covered by this report based on such evaluation; and |
| ||||
|
|
d) |
|
disclosed in this report any change in the Registrant’s internal control over financial reporting that occurred during the Registrant’s most recent fiscal quarter (the Registrant’s fourth fiscal quarter in the case of an annual report) that has materially affected, or is reasonably likely to materially affect, the Registrant’s internal control over financial reporting; and |
| ||||
5. |
|
The Registrant’s other certifying officer(s) and I have disclosed, based on our most recent evaluation of internal control over financial reporting, to the Registrant’s auditors and the Audit Committee of the Registrant’s Board of Directors: |
||
| ||||
|
|
a) |
|
all significant deficiencies and material weaknesses in the design or operation of internal control over financial reporting which are reasonably likely to adversely affect the Registrant’s ability to record, process, summarize and report financial information; and |
| ||||
|
|
b) |
|
any fraud, whether or not material, that involves management or other employees who have a significant role in the Registrant’s internal control over financial reporting. |
March 27, 2023
|
/s/ ROBERT HIGGINBOTHAM |
|
Interim Chief Financial Officer |
Exhibit 32
FOOT LOCKER, INC.
CERTIFICATION PURSUANT TO
18 U.S.C. SECTION 1350
AS ADOPTED PURSUANT TO
SECTION 906 OF THE SARBANES-OXLEY ACT OF 2002
In connection with the Annual Report on Form 10-K of Foot Locker, Inc. (the “Registrant”) for the period ended January 28, 2023, as filed with the Securities and Exchange Commission on the date hereof (the “Report”), Mary N. Dillon, as Chief Executive Officer of the Registrant and Robert Higginbotham, as Interim Chief Financial Officer of the Registrant, each hereby certify, pursuant to 18 U.S.C. Section 1350, that:
|
(1) |
|
the Report fully complies with the requirements of Section 13(a) or 15(d) of the Securities Exchange Act of 1934; and |
|
|
||
|
(2) |
|
the information contained in the Report fairly presents, in all material respects, the financial condition and results of operations of the Registrant. |
Dated: March 27, 2023
|
|
|
/s/ MARY N. DILLON |
|
Mary N. Dillon |
|
Chief Executive Officer |
|
|
|
/s/ ROBERT HIGGINBOTHAM |
|
Robert Higginbotham |
|
Interim Chief Financial Officer |
The foregoing certification is being furnished solely pursuant to 18 U.S.C. § 1350 and is not being filed as part of the Report or as a separate disclosure document. Such certification will not be deemed to be incorporated by reference into any filing under the Securities Act of 1933, as amended, or the Securities Exchange Act of 1934, as amended, except to the extent that the company specifically incorporates it by reference.