UNITED STATES
SECURITIES AND EXCHANGE COMMISSION
Washington, D.C. 20549
FORM 8-K
CURRENT REPORT
Pursuant to Section 13 or 15(d) of the Securities Exchange Act of 1934
Date of Report (Date of earliest event reported): November 1, 2023
Commission |
|
Exact Name of Registrant |
|
State or Other Jurisdiction of |
|
IRS Employer |
1-9936 |
|
EDISON INTERNATIONAL |
|
California |
|
95-4137452 |
1-2313 |
|
SOUTHERN CALIFORNIA EDISON COMPANY |
|
California |
|
95-1240335 |
Check the appropriate box below if the Form 8-K filing is intended to simultaneously satisfy the filing obligation of the registrant under any of the following provisions:
[ ☐ ] Written communications pursuant to Rule 425 under the Securities Act (17 CFR 230.425)
[ ☐ ] Soliciting material pursuant to Rule 14a-12 under the Exchange Act (17 CFR 240.14a-12)
[ ☐ ] Pre-commencement communications pursuant to Rule 14d-2(b) under the Exchange Act (17 CFR 240.14d-2(b))
[ ☐ ] Pre-commencement communications pursuant to Rule 13e-4(c) under the Exchange Act (17 CFR 240.13e-4(c))
Securities registered pursuant to Section 12(b) of the Act:
Edison International:
Southern California Edison Company: None
Indicate by check mark whether the registrant is an emerging growth company as defined in Rule 405 of the Securities Act of 1933 (§230.405 of this chapter) or Rule 12b-2 of the Securities Exchange Act of 1934 (§240.12b-2 of this chapter).
If an emerging growth company, indicate by check mark if the registrant has elected not to use the extended transition period for complying with any new or revised financial accounting standards provided pursuant to Section 13(a) of the Exchange Act.
This current report and its exhibits include forward-looking statements. Edison International and Southern California Edison Company ("SCE") based these forward-looking statements on their current expectations and projections about future events in light of their knowledge of facts as of the date of this current report and their assumptions about future circumstances. These forward-looking statements are subject to various risks and uncertainties that may be outside the control of Edison International and SCE. Edison International and SCE have no obligation to publicly update or revise any forward-looking statements, whether due to new information, future events, or otherwise. This current report should be read with Edison International's and SCE's combined Annual Report on Form 10-K for the year ended December 31, 2022 and subsequent Quarterly Reports on Form 10-Q. Additionally, Edison International and SCE provide direct links to Edison International and SCE presentations, documents and other information at www.edisoninvestor.com (Presentations and Updates) in order to publicly disseminate such information.
Item 2.02Results of Operations and Financial Condition
On November 1, 2023, Edison International issued a press release reporting its financial results and the financial results for its subsidiary, Southern California Edison Company, for the quarter ended September 30, 2023. A copy of the press release is attached as Exhibit 99.1. On the same day, members of Edison International's management will speak to investors via a financial teleconference. Senior management's prepared remarks and accompanying presentation are attached as Exhibit 99.2 and Exhibit 99.3 to this report. The information furnished in this Item 2.02 and Exhibits 99.1, 99.2, and 99.3 shall not be deemed to be “filed” for purposes of the Securities Exchange Act of 1934, nor shall it be deemed to be incorporated by reference in any filing under the Securities Act of 1933.
Item 7.01Regulation FD Disclosure
Members of Edison International management will use the information in the presentation furnished as Exhibit 99.3 to this report in meetings with institutional investors and analysts and at investor conferences. The attached presentation will also be posted on www.edisoninvestor.com.
Item 9.01Financial Statements and Exhibits
(d) |
Exhibits |
EXHIBIT INDEX
|
|
|
Exhibit No. |
|
Description |
|
|
|
99.1 |
|
|
|
|
|
99.2 |
|
|
|
|
|
99.3 |
|
Edison International Q3 2023 Financial Results Conference Call Presentation dated November 1, 2023 |
|
|
|
104 |
|
Cover Page Interactive Data File (embedded within the Inline XBRL document) |
SIGNATURES
Pursuant to the requirements of the Securities Exchange Act of 1934, the registrants have duly caused this report to be signed on its behalf by the undersigned hereunto duly authorized.
Date: November 1, 2023
Date: November 1, 2023
Exhibit 99.1
Investor Relations: Sam Ramraj, (626) 302-2540
Media Relations: (626) 302-2255
News@sce.com
Edison International Reports Third Quarter 2023 Results
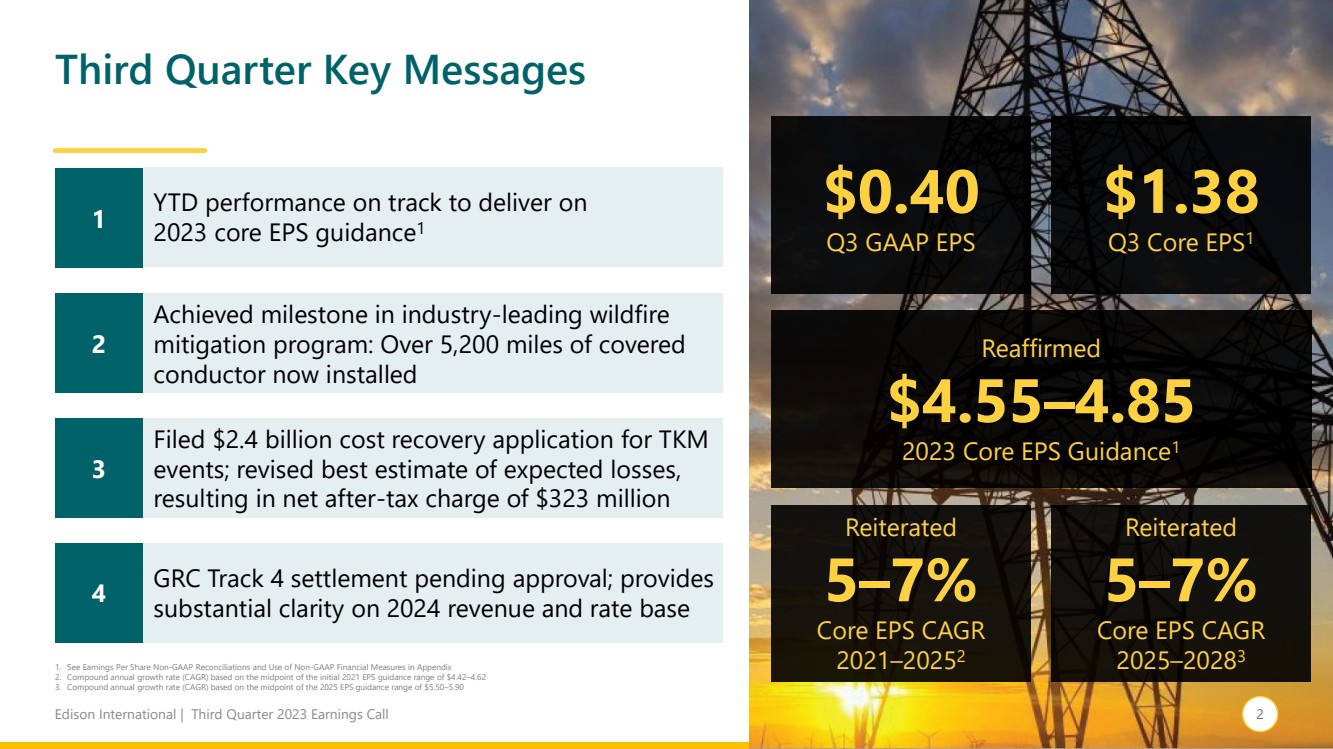
| ● | Third quarter 2023 GAAP earnings per share of $0.40; Core EPS of $1.38 |
| ● | Achieved milestone in industry-leading wildfire mitigation program: More than 5,200 miles of covered conductor installed |
| ● | Revised best estimate of expected losses for 2017/2018 Wildfire/Mudslide Events, resulting in net after-tax charge of $323 million |
| ● | Reaffirmed 2023 EPS guidance of $4.55-$4.85 |
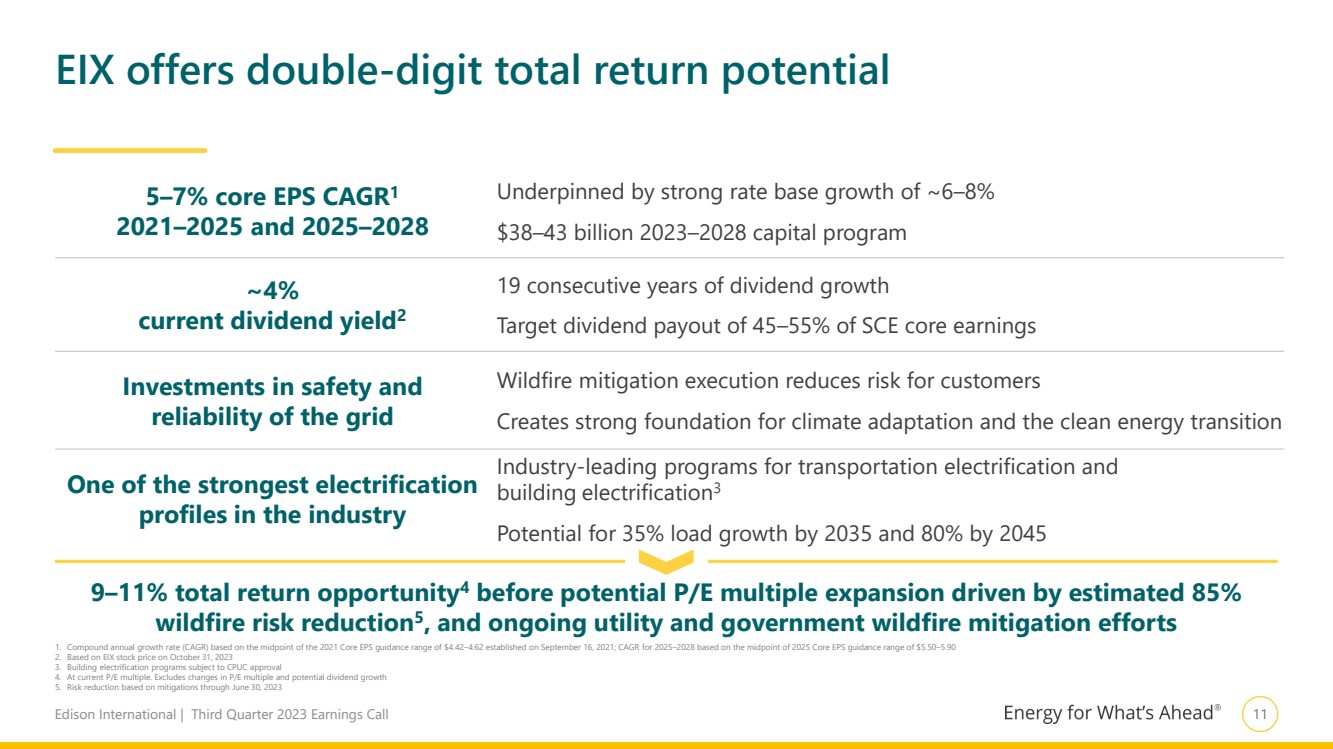
| ● | Reiterated long-term core EPS growth rate target of 5%-7% for 2021-2025 and 5%-7% for 2025-2028 |
ROSEMEAD, Calif., Nov. 1, 2023 — Edison International (NYSE: EIX) today reported third-quarter net income of $155 million, or $0.40 per share, compared to net loss of $128 million, or ($0.33) per share, in the third quarter of last year. As adjusted, third-quarter core earnings were $531 million, or $1.38 per share, compared to core earnings of $564 million, or $1.48 per share, in the third quarter of last year.
Southern California Edison’s third-quarter core earnings per share (EPS) decreased year over year, primarily due to higher interest expense and a true-up recorded in the third quarter of last year related to the Customer Service Re-Platform (CSRP) decision. The true-up recognized previously unrecognized return on rate base related to the CSRP project. This reduction was partially offset by higher revenue from the escalation mechanism set forth in the 2021 General Rate Case final decision.
Edison International Parent and Other’s third-quarter core loss per share increased year over year, primarily due to higher interest expense.
“We are pleased with our performance year to date and, combined with the outlook for the fourth quarter, we are confident in reaffirming our 2023 core EPS guidance range,” said Pedro J. Pizarro, president and CEO of Edison International. “I also reaffirm our ongoing commitment to delivering 5% to 7% core EPS growth through 2025 and 2028, which does not factor in several potential upsides.”
Pizarro added, “SCE’s industry-leading, multi-layered wildfire mitigation practices differentiate the company as climate change-driven wildfire risk affects utilities across the nation. Against this backdrop, SCE has made tremendous progress since 2018, reducing its risk of losses from catastrophic wildfires by 85%. Additionally, with their deep experience and achievements, my SCE colleagues are sharing mitigation strategies with utilities across the country.”
Edison International uses core earnings internally for financial planning and analysis of performance. Core earnings are also used when communicating with investors and analysts regarding Edison International’s earnings results to facilitate comparisons of the company’s performance from period to period. Please see the attached tables to reconcile core earnings to basic GAAP earnings.
Edison International Reports Third Quarter 2023 Financial Results
Page 2 of 10
Revision to Best Estimate of Losses for 2017/2018 Wildfire/Mudslide Events
Each reporting period, management reviews its loss estimates for remaining alleged and potential claims related to the 2017/2018 Wildfire/Mudslide Events. Management’s third quarter 2023 review included a review of information obtained from settling claims in the 2017/2018 Wildfire/Mudslide Events litigations through the third quarter of 2023, including higher than expected costs to settle claims. Management’s review also included a review of third-party expert information obtained in the third quarter of 2023 regarding the nature of claims remaining in the 2017/2018 Wildfire/Mudslide Events litigations. As a result of management's third quarter 2023 review, a $475 million increase in estimated losses for the 2017/2018 Wildfire/Mudslide Events as of September 30, 2023 was recorded. As a result, SCE recorded expected recoveries through FERC electric rates of $27 million against the charge. The resulting net charge to earnings was $448 million ($323 million after-tax).
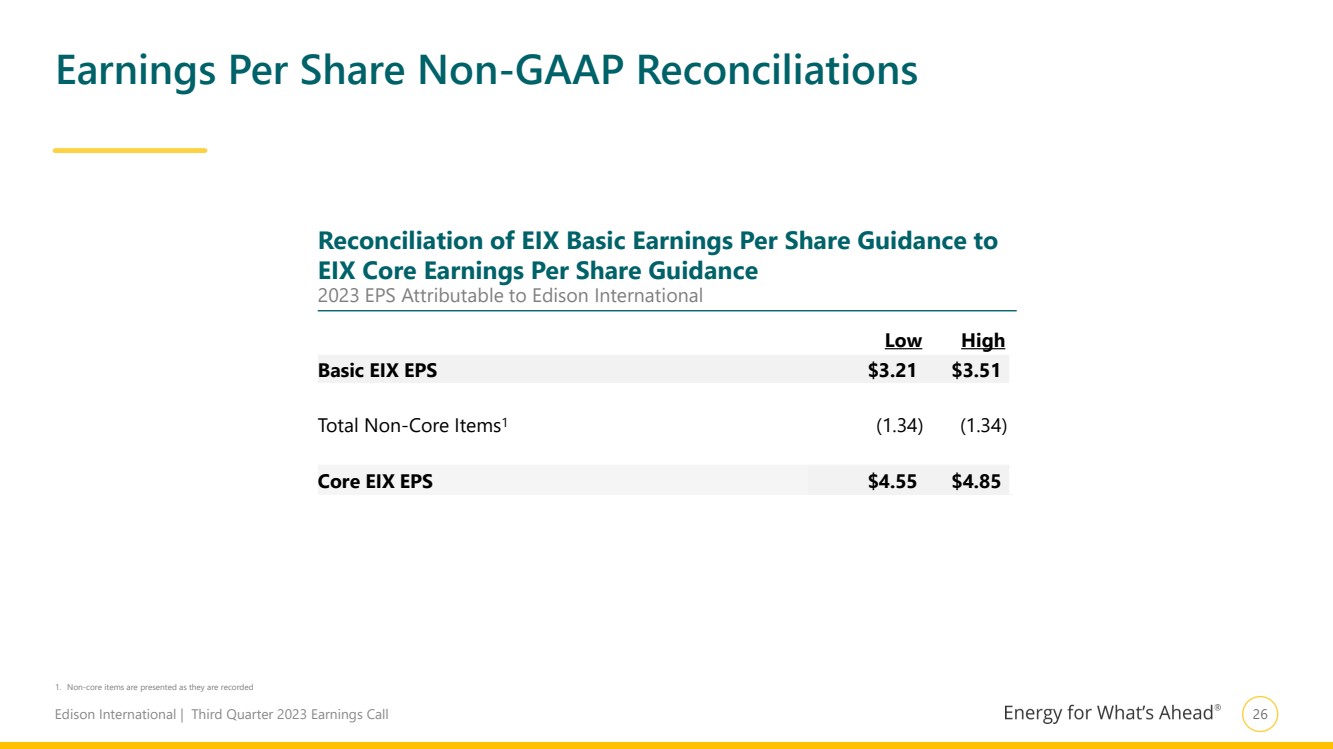
2023 Earnings Guidance
The company reaffirmed its earnings guidance range for 2023 as summarized in the following chart. See the presentation accompanying the company’s conference call for further information and assumptions.
|
|
2023 Earnings Guidance |
|
2023 Earnings Guidance |
||||||||
|
|
as of July 27, 2023 |
|
as of Nov. 1, 2023 |
||||||||
|
|
Low |
|
High |
|
Low |
|
High |
||||
EIX Basic EPS |
|
$ |
4.18 |
|
$ |
4.48 |
|
$ |
3.21 |
|
$ |
3.51 |
Less: Non-core Items* |
|
|
(0.37) |
|
|
(0.37) |
|
|
(1.34) |
|
|
(1.34) |
EIX Core EPS |
|
$ |
4.55 |
|
$ |
4.85 |
|
$ |
4.55 |
|
$ |
4.85 |
* There were ($516) million, or ($1.34) per share, of non-core items recorded for the nine months ended Sept. 30, 2023. Basic EIX EPS guidance only incorporates non-core items to Sept. 30, 2023.
Third Quarter 2023 Earnings Conference Call and Webcast Details
When: |
|
Wednesday, Nov. 1, 1:30-2:30 p.m. (PDT) |
Telephone Numbers: |
|
1-888-673-9780 (U.S.) and 1-312-470-0178 (Int'l) — Passcode: Edison |
Telephone Replay: |
|
1-866-510-4834 (U.S.) and 1-203-369-1942 (Int’l) — Passcode: 1650 |
|
|
Telephone replay available through Nov. 16 at 6 p.m. (PDT) |
Webcast: |
|
www.edisoninvestor.com |
Edison International has posted its earnings conference call prepared remarks by the CEO and CFO, the teleconference presentation and Form 10-Q to the company’s investor relations website. These materials are available at www.edisoninvestor.com.
About Edison International
Edison International (NYSE: EIX) is one of the nation’s largest electric utility holding companies, providing clean and reliable energy and energy services through its independent companies. Headquartered in Rosemead, California, Edison International is the parent company of Southern California Edison Company, a utility that delivers electricity to 15 million people across Southern, Central and Coastal California. Edison International is also the parent company of Edison Energy LLC, a global energy advisory firm providing integrated sustainability and energy solutions to commercial, industrial and institutional customers.
Edison International Reports Third Quarter 2023 Financial Results
Page 3 of 10
Appendix
Use of Non-GAAP Financial Measures
Edison International’s earnings are prepared in accordance with generally accepted accounting principles used in the United States and represent the company’s earnings as reported to the Securities and Exchange Commission. Our management uses core earnings and core earnings per share (EPS) internally for financial planning and for analysis of performance of Edison International and Southern California Edison. We also use core earnings and core EPS when communicating with analysts and investors regarding our earnings results to facilitate comparisons of the Company’s performance from period to period. Financial measures referred to as net income, basic EPS, core earnings, or core EPS also apply to the description of earnings or earnings per share.
Core earnings and core EPS are non-GAAP financial measures and may not be comparable to those of other companies. Core earnings and core EPS are defined as basic earnings and basic EPS excluding income or loss from discontinued operations and income or loss from significant discrete items that management does not consider representative of ongoing earnings. Basic earnings and losses refer to net income or losses attributable to Edison International shareholders. Core earnings are reconciled to basic earnings in the attached tables. The impact of participating securities (vested awards that earn dividend equivalents that may participate in undistributed earnings with common stock) for the principal operating subsidiary is not material to the principal operating subsidiary’s EPS and is therefore reflected in the results of the Edison International holding company, which is included in Edison International Parent and Other.
Safe Harbor Statement
Statements contained in this presentation about future performance, including, without limitation, operating results, capital expenditures, rate base growth, dividend policy, financial outlook, and other statements that are not purely historical, are forward-looking statements. These forward-looking statements reflect our current expectations; however, such statements involve risks and uncertainties. Actual results could differ materially from current expectations. These forward-looking statements represent our expectations only as of the date of this presentation, and Edison International assumes no duty to update them to reflect new information, events or circumstances. Important factors that could cause different results include, but are not limited to the:
| ● | ability of SCE to recover its costs through regulated rates, including uninsured wildfire-related and debris flow-related costs, costs incurred to mitigate the risk of utility equipment causing future wildfires, costs incurred as a result of the COVID-19 pandemic, and increased costs due to supply chain constraints, inflation, and rising interest rates; |
| ● | ability of SCE to implement its Wildfire Mitigation Plan and capital program; |
| ● | risks of regulatory or legislative restrictions that would limit SCE's ability to implement operational measures to mitigate wildfire risk, including Public Safety Power Shutoff (“PSPS”) and fast curve settings, when conditions warrant or would otherwise limit SCE's operational practices relative to wildfire risk mitigation; |
| ● | risks associated with SCE implementing PSPS, including regulatory fines and penalties, claims for damages and reputational harm; |
| ● | ability of SCE to maintain a valid safety certification, which is required to benefit from certain provisions of California Assembly Bill 1054 (“AB 1054”); |
| ● | extreme weather-related incidents (including events caused, or exacerbated, by climate change, such as wildfires, debris flows, flooding, droughts, high wind events and extreme heat events) and other natural disasters (such as earthquakes), which could cause, among other things, public safety issues, property damage, rotating outages and other operational issues (such as issues due to damaged infrastructure), PSPS activations and unanticipated costs; |
| ● | risk that AB 1054 does not effectively mitigate the significant exposure faced by California investor-owned utilities related to liability for damages arising from catastrophic wildfires where utility facilities are alleged to be a substantial cause, including the longevity of the Wildfire Insurance Fund and the CPUC's interpretation of and actions under AB 1054, including its interpretation of the prudency standard clarified by AB 1054; |
| ● | ability of Edison International and SCE to effectively attract, manage, develop and retain a skilled workforce, including its contract workers; |
Edison International Reports Third Quarter 2023 Financial Results
Page 4 of 10
| ● | decisions and other actions by the California Public Utilities Commission, the Office of Energy Infrastructure Safety of the California Natural Resources Agency, the Federal Energy Regulatory Commission, the Nuclear Regulatory Commission and other governmental authorities, including decisions and actions related to nationwide or statewide crisis, determinations of authorized rates of return or return on equity, issuance of SCE's wildfire safety certification, wildfire mitigation efforts, approval and implementation of electrification programs, and delays in executive, regulatory and legislative actions; |
| ● | cost and availability of labor, equipment and materials, including as a result of supply chain constraints and inflation; |
| ● | ability of Edison International or SCE to borrow funds and access bank and capital markets on reasonable terms; |
| ● | risks associated with the decommissioning of San Onofre, including those related to worker and public safety, public opposition, permitting, governmental approvals, on-site storage of spent nuclear fuel and other radioactive material, delays, contractual disputes, contractor performance, and cost overruns; |
| ● | ability of Edison International and SCE to obtain sufficient insurance at a reasonable cost or to maintain its customer funded self-insurance program, and to recover the costs of such insurance or, in the event liabilities exceed insured amounts, the ability to recover uninsured losses (including amounts paid for self-insured retention and co-insurance) from customers or other parties; |
| ● | pandemics, such as COVID-19, and other events that cause regional, statewide, national or global disruption, which could impact, among other things, Edison International's and SCE's business, operations, cash flows, liquidity and/or financial results and cause Edison International and SCE to incur unanticipated costs; |
| ● | physical security of Edison International's and SCE's critical assets and personnel and the cybersecurity of Edison International's and SCE's critical information technology systems for grid control, and business, employee and customer data; |
| ● | risks associated with cost allocation resulting in higher rates for utility bundled service customers because of possible customer bypass or departure for other electricity providers such as Community Choice Aggregators (“CCA,” which are cities, counties, and certain other public agencies with the authority to generate and/or purchase electricity for their local residents and businesses) and Electric Service Providers (entities that offer electric power and ancillary services to retail customers, other than electrical corporations (like SCE) and CCAs); |
| ● | risks inherent in SCE’s capital investment program, including those related to project site identification, public opposition, environmental mitigation, construction, permitting, contractor performance, availability of labor, equipment and materials, weather, changes in the California Independent System Operator’s transmission plans, and governmental approvals; and |
| ● | risks associated with the operation of electrical facilities, including worker and public safety issues, the risk of utility assets causing or contributing to wildfires, failure, availability, efficiency, and output of equipment and facilities, and availability and cost of spare parts. |
Additional information about risks and uncertainties is contained in Edison International and SCE’s most recent combined Annual Report on Form 10-K for the year ended December 31, 2022, and subsequent Quarterly Report(s) on Form 10-Q filed with the Securities and Exchange commission, including the "Risk Factors" sections. Readers are urged to read this entire release as well as the most recent Form 10-K and Form 10-Q (including information incorporated by reference), and carefully consider the risks, uncertainties, and other factors that affect Edison International's and SCE's businesses. Edison International and SCE post or provide direct links (i) to certain SCE and other parties' regulatory filings and documents with the CPUC and the FERC and certain agency rulings and notices in open proceedings in a section titled "SCE Regulatory Highlights," (ii) to certain documents and information related to Southern California wildfires which may be of interest to investors in a section titled "Southern California Wildfires," and (iii) to presentations, documents and other information that may be of interest to investors in a section titled "Presentations and Updates" at www.edisoninvestor.com in order to publicly disseminate such information.
These forward-looking statements represent our expectations only as of the date of this news release, and Edison International assumes no duty to update them to reflect new information, events or circumstances. Readers should review future reports filed by Edison International and SCE with the SEC.
Edison International Reports Third Quarter 2023 Financial Results
Page 5 of 10
Third Quarter Reconciliation of Basic Earnings Per Share to Core Earnings Per Share
|
|
Three months ended |
|
|
|
|
Nine months ended |
|
|
|
||||||||
|
|
September 30, |
|
|
|
|
September 30, |
|
|
|
||||||||
|
|
2023 |
|
2022 |
|
Change |
|
2023 |
|
2022 |
|
Change |
||||||
Earnings (loss) per share attributable to Edison International |
|
|
|
|
|
|
|
|
|
|
|
|
|
|
|
|
|
|
SCE |
|
$ |
0.62 |
|
$ |
(0.21) |
|
$ |
0.83 |
|
$ |
2.69 |
|
$ |
0.97 |
|
$ |
1.72 |
Edison International Parent and Other |
|
|
(0.22) |
|
|
(0.12) |
|
|
(0.10) |
|
|
(0.55) |
|
|
(0.45) |
|
|
(0.10) |
Edison International |
|
|
0.40 |
|
|
(0.33) |
|
|
0.73 |
|
|
2.14 |
|
|
0.52 |
|
|
1.62 |
Less: Non-core items |
|
|
|
|
|
|
|
|
|
|
|
|
|
|
|
|
|
|
SCE |
|
|
(0.98) |
|
|
(1.84) |
|
|
0.86 |
|
|
(1.43) |
|
|
(3.00) |
|
|
1.57 |
Edison International Parent and Other |
|
|
— |
|
|
0.03 |
|
|
(0.03) |
|
|
0.09 |
|
|
0.03 |
|
|
0.06 |
Total non-core items |
|
|
(0.98) |
|
|
(1.81) |
|
|
0.83 |
|
|
(1.34) |
|
|
(2.97) |
|
|
1.63 |
Core earnings (loss) per share |
|
|
|
|
|
|
|
|
|
|
|
|
|
|
|
|
|
|
SCE |
|
|
1.60 |
|
|
1.63 |
|
|
(0.03) |
|
|
4.12 |
|
|
3.97 |
|
|
0.15 |
Edison International Parent and Other |
|
|
(0.22) |
|
|
(0.15) |
|
|
(0.07) |
|
|
(0.64) |
|
|
(0.48) |
|
|
(0.16) |
Edison International |
|
$ |
1.38 |
|
$ |
1.48 |
|
$ |
(0.10) |
|
$ |
3.48 |
|
$ |
3.49 |
|
$ |
(0.01) |
Note: Diluted earnings/(loss) were $0.40 and $(0.33) per share for the three months ended September 30, 2023 and 2022, respectively. Diluted earnings were $2.13 and $0.52 per share for the nine months ended September 30, 2023 and 2022, respectively.
Third Quarter Reconciliation of Basic Earnings Per Share to Core Earnings (in millions)
|
|
Three months ended |
|
|
|
|
Nine months ended |
|
|
|
||||||||
|
|
September 30, |
|
|
|
|
September 30, |
|
|
|
||||||||
(in millions) |
|
2023 |
|
2022 |
|
Change |
|
2023 |
|
2022 |
|
Change |
||||||
Net income (loss) attributable to Edison International |
|
|
|
|
|
|
|
|
|
|
|
|
|
|
|
|
|
|
SCE |
|
$ |
239 |
|
$ |
(80) |
|
$ |
319 |
|
$ |
1,029 |
|
$ |
369 |
|
$ |
660 |
Edison International Parent and Other |
|
|
(84) |
|
|
(48) |
|
|
(36) |
|
|
(210) |
|
|
(172) |
|
|
(38) |
Edison International |
|
|
155 |
|
|
(128) |
|
|
283 |
|
|
819 |
|
|
197 |
|
|
622 |
Less: Non-core items |
|
|
|
|
|
|
|
|
|
|
|
|
|
|
|
|
|
|
SCE1,2,3,4,5,6,7,9,10 |
|
|
(374) |
|
|
(703) |
|
|
329 |
|
|
(549) |
|
|
(1,142) |
|
|
593 |
Edison International Parent and Other8 |
|
|
(2) |
|
|
11 |
|
|
(13) |
|
|
33 |
|
|
11 |
|
|
22 |
Total non-core items |
|
|
(376) |
|
|
(692) |
|
|
316 |
|
|
(516) |
|
|
(1,131) |
|
|
615 |
Core earnings (losses) |
|
|
|
|
|
|
|
|
|
|
|
|
|
|
|
|
|
|
SCE |
|
|
613 |
|
|
623 |
|
|
(10) |
|
|
1,578 |
|
|
1,511 |
|
|
67 |
Edison International Parent and Other |
|
|
(82) |
|
|
(59) |
|
|
(23) |
|
|
(243) |
|
|
(183) |
|
|
(60) |
Edison International |
|
$ |
531 |
|
$ |
564 |
|
$ |
(33) |
|
$ |
1,335 |
|
$ |
1,328 |
|
$ |
7 |
1 |
Includes amortization of SCE's Wildfire Insurance Fund expenses of $54 million ($39 million after-tax) for both the three months ended September 2023 and 2022 and $159 million ($114 million after-tax) and $160 million ($115 million after-tax) for the nine months ended September 30, 2023 and 2022, respectively. |
2 |
Includes charges for 2017/2018 Wildfire/Mudslide Events claims and expenses, net of recoveries of $459 million ($330 million after-tax) and $834 million ($600 million after-tax) for the three months ended September 30, 2023 and 2022 and $560 million ($404 million after-tax) and $1.2 billion ($891 million after-tax) for the nine months ended September 30, 2023 and 2022, respectively. |
3 |
Includes a charge of probable disallowance related to the reasonableness review of recorded San Onofre Units 2 and 3 decommissioning costs in the 2021 NDCTP of $30 million ($21 million after-tax) for the nine months ended September 30, 2023. |
4 |
Includes a charge related to customer cancellations of certain ECS data services of $17 million ($12 million after-tax) for the three and nine months ended September 30, 2023. |
5 |
Includes an insurance recovery of $10 million ($7 million after-tax) and a charge of $23 million ($16 million after-tax) after net of estimated insurance recoveries related to settlement of an employment litigation matter for the three and nine months ended September 30, 2023 and 2022, respectively. |
6 |
Includes impairment charges of $64 million ($46 million after-tax) for the nine months ended September 30, 2022, including $47 million ($34 million after-tax) related to SCE's CSRP settlement agreement and $17 million ($12 million after-tax) related to historical capital expenditures disallowed in SCE's track 3 of the 2021 GRC final decision. |
| 7 | Includes a charge related to organizational realignment services of $14 million ($10 million after-tax) for the nine months ended September 30, 2022. |
Edison International Reports Third Quarter 2023 Financial Results
Page 6 of 10
| 8 | Includes customer revenues, net of claims related to an EIS insurance contract of $(3) million ($(2) million after-tax) and $14 million ($11 million after-tax) for the three months ended September 30, 2023 and 2022, and $42 million ($33 million after-tax) and $14 million ($11 million after-tax) for the nine months ended September 30, 2023 and 2022, respectively. |
| 9 | Includes charge related to the Presiding Officer's Decision ("POD") in September 2022 on SCE's Upstream Lighting Program for the Upstream Lighting Program of $81 million ($64 million after-tax) for both the three months and the nine months ended September 30, 2022. |
| 10 | Includes charges of $7 million ($5 million after-tax) for wildfire claims and expenses, net of recoveries related to wildfires occurring prior to July 1, 2023 for both the three months and the nine months ended September 30, 2023. |
Edison International Reports Third Quarter 2023 Financial Results
Page 7 of 10
Consolidated Statements of Income |
|
Edison International |
||||||||||
|
|
|
|
|
|
|
|
|
|
|
|
|
|
|
Three months ended |
|
Nine months ended |
||||||||
|
|
September 30, |
|
September 30, |
||||||||
(in millions, except per-share amounts) |
|
2023 |
|
2022 |
|
2023 |
|
2022 |
||||
Operating revenue |
|
$ |
4,702 |
|
$ |
5,228 |
|
$ |
12,632 |
|
$ |
13,204 |
Purchased power and fuel |
|
|
1,988 |
|
|
2,485 |
|
|
4,453 |
|
|
4,826 |
Operation and maintenance |
|
|
882 |
|
|
979 |
|
|
3,207 |
|
|
3,827 |
Wildfire-related claims, net of insurance recoveries |
|
|
482 |
|
|
889 |
|
|
578 |
|
|
1,316 |
Wildfire Insurance Fund expense |
|
|
54 |
|
|
54 |
|
|
159 |
|
|
160 |
Depreciation and amortization |
|
|
665 |
|
|
738 |
|
|
1,971 |
|
|
1,922 |
Property and other taxes |
|
|
139 |
|
|
128 |
|
|
428 |
|
|
374 |
Impairment, net of other operating income |
|
|
— |
|
|
(1) |
|
|
— |
|
|
60 |
Total operating expenses |
|
|
4,210 |
|
|
5,272 |
|
|
10,796 |
|
|
12,485 |
Operating income (loss) |
|
|
492 |
|
|
(44) |
|
|
1,836 |
|
|
719 |
Interest expense |
|
|
(433) |
|
|
(302) |
|
|
(1,186) |
|
|
(819) |
Other income |
|
|
130 |
|
|
85 |
|
|
377 |
|
|
219 |
Income (loss) before income taxes |
|
|
189 |
|
|
(261) |
|
|
1,027 |
|
|
119 |
Income tax (benefit) expense |
|
|
(23) |
|
|
(187) |
|
|
41 |
|
|
(235) |
Net income (loss) |
|
|
212 |
|
|
(74) |
|
|
986 |
|
|
354 |
Preference stock dividend requirements of SCE |
|
|
30 |
|
|
27 |
|
|
88 |
|
|
78 |
Preferred stock dividend requirement of Edison International |
|
|
27 |
|
|
27 |
|
|
79 |
|
|
79 |
Net income (loss) attributable to Edison International common shareholders |
|
$ |
155 |
|
$ |
(128) |
|
$ |
819 |
|
$ |
197 |
Basic earnings (loss) per share: |
|
|
|
|
|
|
|
|
|
|
|
|
Weighted average shares of common stock outstanding |
|
|
383 |
|
|
382 |
|
|
383 |
|
|
381 |
Basic earnings (loss) per common share attributable to Edison International common shareholders |
|
$ |
0.40 |
|
$ |
(0.33) |
|
$ |
2.14 |
|
$ |
0.52 |
Diluted earnings (loss) per share: |
|
|
|
|
|
|
|
|
|
|
|
|
Weighted average shares of common stock outstanding, including effect of dilutive securities |
|
|
385 |
|
|
383 |
|
|
385 |
|
|
382 |
Diluted earnings (loss) per common share attributable to Edison International common shareholders |
|
$ |
0.40 |
|
$ |
(0.33) |
|
$ |
2.13 |
|
$ |
0.52 |
Edison International Reports Third Quarter 2023 Financial Results
Page 8 of 10
Consolidated Balance Sheets |
|
Edison International |
||||
|
|
|
|
|
|
|
|
|
|
September 30, |
|
|
December 31, |
(in millions) |
|
2023 |
|
2022 |
||
ASSETS |
|
|
|
|
|
|
Cash and cash equivalents |
|
$ |
446 |
|
$ |
914 |
Receivables, less allowances of $341 and $347 for uncollectible accounts at respective dates |
|
|
2,363 |
|
|
1,695 |
Accrued unbilled revenue |
|
|
929 |
|
|
641 |
Inventory |
|
|
505 |
|
|
474 |
Prepaid expenses |
|
|
102 |
|
|
248 |
Regulatory assets |
|
|
2,408 |
|
|
2,497 |
Wildfire Insurance Fund contributions |
|
|
204 |
|
|
204 |
Other current assets |
|
|
278 |
|
|
397 |
Total current assets |
|
|
7,235 |
|
|
7,070 |
Nuclear decommissioning trusts |
|
|
3,943 |
|
|
3,948 |
Other investments |
|
|
81 |
|
|
55 |
Total investments |
|
|
4,024 |
|
|
4,003 |
Utility property, plant and equipment, less accumulated depreciation and amortization of $12,928 and $12,260 at respective dates |
|
|
54,852 |
|
|
53,274 |
Nonutility property, plant and equipment, less accumulated depreciation of $112 and $106 at respective dates |
|
|
202 |
|
|
212 |
Total property, plant and equipment |
|
|
55,054 |
|
|
53,486 |
Regulatory assets (include $1,571 and $834 related to Variable Interest Entities "VIEs" at respective dates) |
|
|
8,774 |
|
|
8,181 |
Wildfire Insurance Fund contributions |
|
|
2,002 |
|
|
2,155 |
Operating lease right-of-use assets |
|
|
1,292 |
|
|
1,442 |
Long-term insurance receivables |
|
|
549 |
|
|
465 |
Other long-term assets |
|
|
1,234 |
|
|
1,239 |
Total long-term assets |
|
|
13,851 |
|
|
13,482 |
|
|
|
|
|
|
|
Total assets |
|
$ |
80,164 |
|
$ |
78,041 |
Edison International Reports Third Quarter 2023 Financial Results
Page 9 of 10
Consolidated Balance Sheets |
|
Edison International |
||||
|
|
|
|
|
|
|
|
|
|
September 30, |
|
|
December 31, |
(in millions, except share amounts) |
|
2023 |
|
2022 |
||
LIABILITIES AND EQUITY |
|
|
|
|
|
|
Short-term debt |
|
$ |
1,005 |
|
$ |
2,015 |
Current portion of long-term debt |
|
|
2,939 |
|
|
2,614 |
Accounts payable |
|
|
2,108 |
|
|
2,359 |
Wildfire-related claims |
|
|
150 |
|
|
121 |
Customer deposits |
|
|
175 |
|
|
167 |
Regulatory liabilities |
|
|
717 |
|
|
964 |
Current portion of operating lease liabilities |
|
|
179 |
|
|
506 |
Other current liabilities |
|
|
1,754 |
|
|
1,601 |
Total current liabilities |
|
|
9,027 |
|
|
10,347 |
Long-term debt (include $1,539 and $809 related to VIEs at respective dates) |
|
|
29,532 |
|
|
27,025 |
Deferred income taxes and credits |
|
|
6,507 |
|
|
6,149 |
Pensions and benefits |
|
|
402 |
|
|
422 |
Asset retirement obligations |
|
|
2,695 |
|
|
2,754 |
Regulatory liabilities |
|
|
8,570 |
|
|
8,211 |
Operating lease liabilities |
|
|
1,113 |
|
|
936 |
Wildfire-related claims |
|
|
1,583 |
|
|
1,687 |
Other deferred credits and other long-term liabilities |
|
|
3,164 |
|
|
2,988 |
Total deferred credits and other liabilities |
|
|
24,034 |
|
|
23,147 |
Total liabilities |
|
|
62,593 |
|
|
60,519 |
Commitments and contingencies |
|
|
|
|
|
|
Preferred stock (50,000,000 shares authorized; 1,250,000 shares of Series A and 750,000 shares of Series B issued and outstanding at respective dates) |
|
|
1,978 |
|
|
1,978 |
Common stock, no par value (800,000,000 shares authorized; 383,567,856 and 382,208,498 shares issued and outstanding at respective dates) |
|
|
6,301 |
|
|
6,200 |
Accumulated other comprehensive loss |
|
|
(8) |
|
|
(11) |
Retained earnings |
|
|
7,399 |
|
|
7,454 |
Total Edison International's shareholders' equity |
|
|
15,670 |
|
|
15,621 |
Noncontrolling interests – preference stock of SCE |
|
|
1,901 |
|
|
1,901 |
Total equity |
|
|
17,571 |
|
|
17,522 |
|
|
|
|
|
|
|
Total liabilities and equity |
|
$ |
80,164 |
|
$ |
78,041 |
Edison International Reports Third Quarter 2023 Financial Results
Page 10 of 10
Consolidated Statements of Cash Flows |
|
Edison International |
||||
|
|
|
|
|
|
|
|
|
Nine months ended |
||||
|
|
September 30, |
||||
(in millions) |
|
2023 |
|
2022 |
||
Cash flows from operating activities: |
|
|
|
|
|
|
Net income |
|
$ |
986 |
|
$ |
354 |
Adjustments to reconcile to net cash provided by operating activities: |
|
|
|
|
|
|
Depreciation and amortization |
|
|
2,034 |
|
|
1,977 |
Allowance for equity during construction |
|
|
(116) |
|
|
(91) |
Impairment |
|
|
— |
|
|
60 |
Deferred income taxes |
|
|
53 |
|
|
(237) |
Wildfire Insurance Fund amortization expense |
|
|
159 |
|
|
160 |
Other |
|
|
32 |
|
|
50 |
Nuclear decommissioning trusts |
|
|
(94) |
|
|
(81) |
Changes in operating assets and liabilities: |
|
|
|
|
|
|
Receivables |
|
|
(692) |
|
|
(807) |
Inventory |
|
|
(40) |
|
|
(20) |
Accounts payable |
|
|
(186) |
|
|
363 |
Tax receivables and payables |
|
|
127 |
|
|
171 |
Other current assets and liabilities |
|
|
(214) |
|
|
(673) |
Derivative assets and liabilities, net |
|
|
(139) |
|
|
(8) |
Regulatory assets and liabilities, net |
|
|
705 |
|
|
1,032 |
Wildfire-related insurance receivable |
|
|
(84) |
|
|
(383) |
Wildfire-related claims |
|
|
(75) |
|
|
271 |
Other noncurrent assets and liabilities |
|
|
90 |
|
|
(26) |
Net cash provided by operating activities |
|
|
2,546 |
|
|
2,112 |
Cash flows from financing activities: |
|
|
|
|
|
|
Long-term debt issued, net of discount and issuance costs of $48 and $36 for the respective periods |
|
|
4,678 |
|
|
3,347 |
Long-term debt repaid |
|
|
(1,867) |
|
|
(773) |
Short-term debt issued |
|
|
851 |
|
|
600 |
Short-term debt repaid |
|
|
(1,944) |
|
|
(993) |
Common stock issued |
|
|
16 |
|
|
10 |
Commercial paper borrowing, net |
|
|
74 |
|
|
529 |
Dividends and distribution to noncontrolling interests |
|
|
(87) |
|
|
(83) |
Common stock dividends paid |
|
|
(833) |
|
|
(787) |
Preferred stock dividends paid |
|
|
(105) |
|
|
(99) |
Other |
|
|
97 |
|
|
81 |
Net cash provided by financing activities |
|
|
880 |
|
|
1,832 |
Cash flows from investing activities: |
|
|
|
|
|
|
Capital expenditures |
|
|
(3,991) |
|
|
(4,206) |
Proceeds from sale of nuclear decommissioning trust investments |
|
|
3,223 |
|
|
3,120 |
Purchases of nuclear decommissioning trust investments |
|
|
(3,129) |
|
|
(3,039) |
Other |
|
|
3 |
|
|
20 |
Net cash used in investing activities |
|
|
(3,894) |
|
|
(4,105) |
Net decrease in cash, cash equivalents and restricted cash |
|
|
(468) |
|
|
(161) |
Cash, cash equivalents and restricted cash at beginning of period |
|
|
917 |
|
|
394 |
Cash, cash equivalents and restricted cash at end of period |
|
$ |
449 |
|
$ |
233 |
Exhibit 99.2
Prepared Remarks of Edison International CEO and CFO
Third Quarter 2023 Earnings Teleconference
November 1, 2023, 1:30 p.m. (PT)
Pedro Pizarro, President and Chief Executive Officer, Edison International
Edison International reported core earnings per share of $1.38 for the third quarter and $3.48 for the first nine months of the year. We are pleased with our performance year to date and, combined with the outlook for the fourth quarter, we are confident in reaffirming our 2023 core EPS guidance range of $4.55 to $4.85. I would also like to reaffirm our ongoing commitment to delivering 5 to 7% core EPS growth through 2025, which does not factor in several potential upsides. We also reaffirm our EPS growth guidance of 5 to 7% for 2025 through 2028.
My comments today cover four key topics:
| ● | First, an update on the legacy wildfires relating to a change in the best estimate. |
| ● | Second, how SCE’s industry-leading wildfire mitigation practices differentiate the company as climate change-driven wildfire risk affects utilities across the nation. |
| ● | Third, several SCE regulatory updates. |
| ● | And finally, Edison’s updated projections on the dramatic grid expansion required to enable economywide electrification and the clean energy transition. |
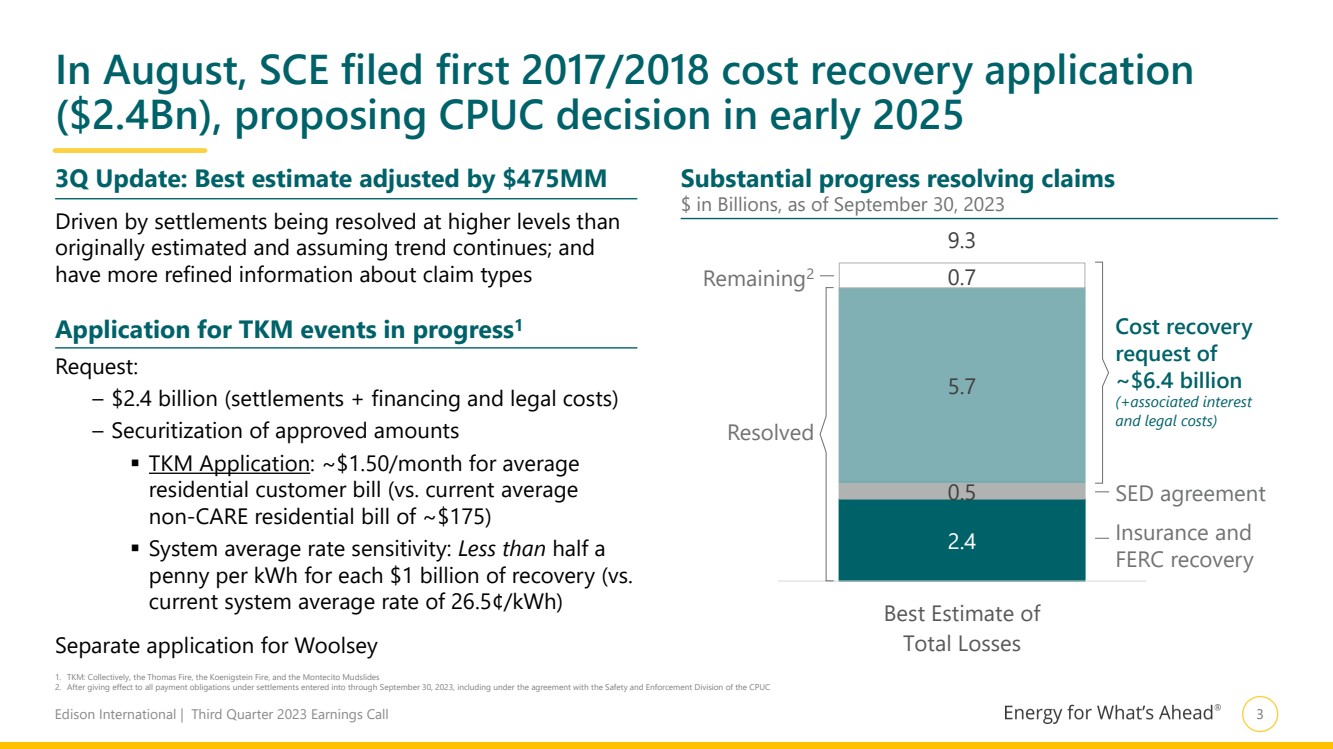
Starting with SCE’s legacy wildfires, as shown on page 3, the process to resolve claims and estimate the final outcome is complex and challenging, and each quarter SCE evaluates the estimated cost for resolving the remaining claims. The utility has made substantial progress settling claims and moving toward recovering these costs. However, this quarter’s evaluation required SCE to increase the best estimate by $475 million, driven primarily by settlements being resolved at higher levels than originally estimated and assuming that trend will continue. SCE also now has more refined information about the types of claims being presented as it works through the mediation process. The majority — about two-thirds — of the increase is attributable to Woolsey. The impact of this increase on you, our shareholders, is not lost on us.
As shareholders ourselves, we understand the importance of putting this issue behind us. Resolving all outstanding claims is crucial, and SCE is firmly committed to completing this in a reasonable and prudent manner that will ultimately support cost recovery. A positive step in this process is that recently a deadline was set for Woolsey claimants in the settlement protocol to notify SCE of their complete claims by February 2024. After then, SCE will have increased clarity on the remaining value of claims and the utility’s ability to swiftly resolve them. As always, we will continue to update you each quarter, including SCE’s expectation for when it will file the cost recovery application for the Woolsey Fire. The Woolsey application will cover more than $4 billion of eligible claims payments, plus financing and legal costs.
We recognize that utilities across the country are facing new challenges from wildfires, which were initially viewed as specific to California, but have expanded to become an international issue. Against this backdrop, SCE has made tremendous progress since 2018, reducing its risk of losses from catastrophic wildfires by 85%. SCE has differentiated itself through its multi-layered wildfire mitigation strategy. This is anchored by grid hardening and includes enhanced vegetation management, asset inspections, and other programs. SCE has replaced more than 5,200 miles of distribution lines with covered conductor. In fact, by year-end, SCE will have physically hardened over 75% of its distribution miles in high fire risk areas. Risk mitigation beyond covered conductor includes one of the largest private weather station networks in the country, and enhanced protective settings, known as “fast curve settings.” With their deep experience and achievements, my SCE colleagues are sharing mitigation strategies with utilities across the country.
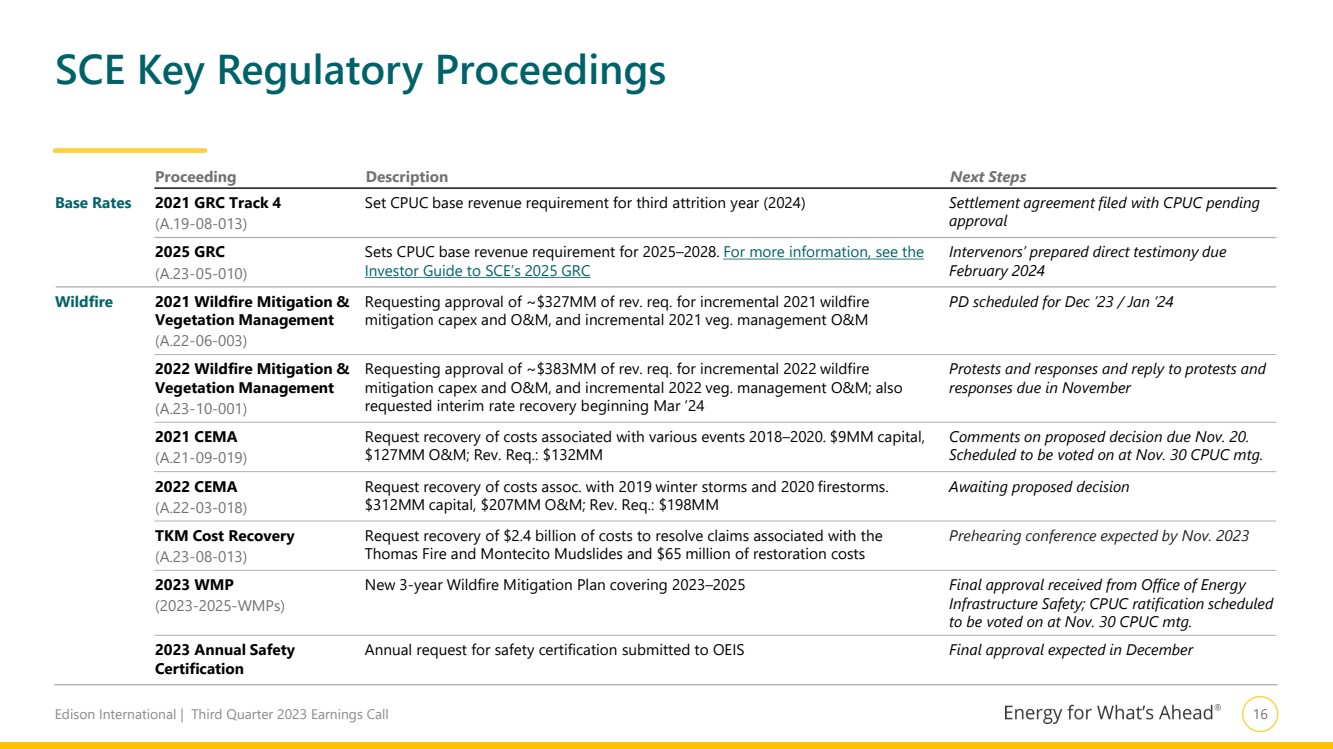
Moving to the regulatory front, I’d like to provide three updates. First, in August, SCE delivered on its commitment to file its TKM cost recovery application, requesting recovery of $2.4 billion. SCE provided a compelling case that it prudently designed, managed, and operated its equipment, and that the associated costs were reasonably incurred. The evidence provided shows that the damages resulted from extraordinary environmental conditions and other factors beyond SCE’s control. Expert testimony estimates that a reasonable decision could save customers as much as $4.9 billion by avoiding excess financing costs for SCE debt issued over the next 10 years, making it more affordable to achieve economywide electrification.
2
As for next steps, the Commission will issue a scoping memo that will set the procedural schedule. Second, in September, SCE filed an unopposed motion for the CPUC to approve a settlement on track 4 of its 2021 GRC, which sets the revenue requirement for 2024. Reaching this agreement with intervenors is a successful outcome for the utility and its customers, and SCE has sought CPUC approval by the end of the year. Maria will provide additional details in her remarks. Third, at the end of September, the cost of capital mechanism triggered, resulting in a 70-basis point increase to SCE’s return on equity, effective January 1, 2024. SCE filed a Tier 2 advice letter on October 13 to implement the update to its ROE along with the costs of debt and preferred equity. The response period for intervenors ends tomorrow, after which the CPUC’s Energy Division can approve it or refer it to the full CPUC. Consistent with our usual practice, we will provide 2024 earnings guidance on our fourth quarter earnings call. I’d like to reiterate that our EPS growth through 2025 is achievable at SCE’s currently authorized ROE and this increase is one of the upsides I mentioned earlier in my remarks.
I want to share a recent achievement and recognition of our company’s strong corporate governance. The Center for Political Accountability and Zicklin Center for Business Ethics Research recently published their annual index, which is the marquee measurement of corporate political transparency and accountability. For the second consecutive year, Edison International received a perfect score, and was recognized as a corporate leader for the tenth consecutive year. I’m very proud of our team for this accomplishment and our continued commitment to integrity and transparency. With my current EEI chair hat on, I am also proud to say that 17 other utilities were also identified as “Trendsetters,” which are S&P 500 companies with CPA-Zicklin Index scores indicating robust disclosure and oversight.
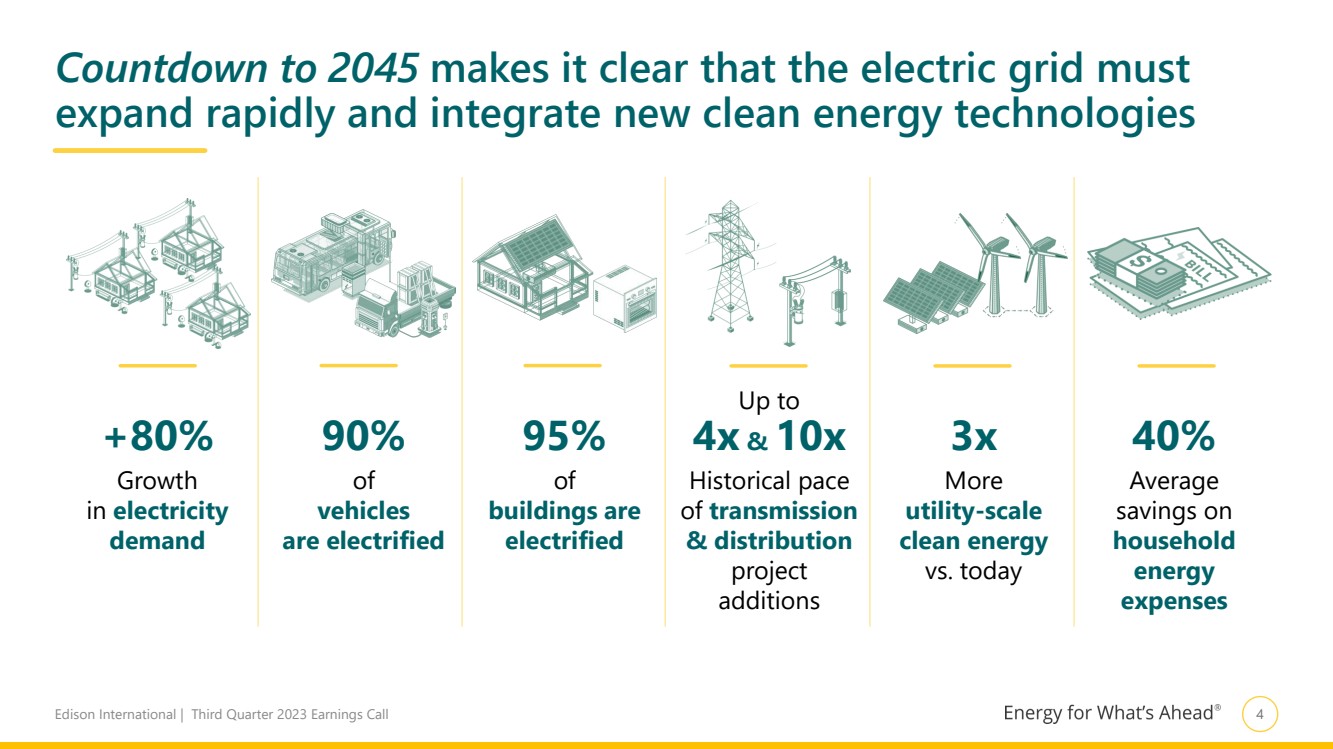
Edison has been a thought leader on the clean energy transition for many years and has published numerous white papers about how California can achieve it. In September, we published Countdown to 2045, our latest analysis. This updates the earlier Pathway 2045 work, reflecting new laws and policies, technology advances, and customer adoption, while leveraging the latest modelling and climate science. We conclude that for California to achieve its net-zero greenhouse gas emission goals in just over two decades, the electric grid must expand faster than ever before to levels higher than we previously estimated.
3
Page 4 shows some top-line findings on how the state gets to carbon neutrality. We forecast an 80% increase in electrical demand by 2045, due to 90% of vehicles and 95% of buildings going electric. To serve this load, the grid will need to expand to handle three times the clean energy flowing today. This means new transmission and distribution grid projects will need to be added at 4 times and 10 times their historical rates, respectively. Importantly, the average household will save about 40% on their overall annual energy expenses by 2045 due to reduced fossil fuel spending and the greater efficiency of electric vehicles and appliances.
The unprecedented pace of grid buildout needed to electrify the economy requires bold actions to improve how the state's entire energy infrastructure is planned and operated. Edison is committed to helping California reach its ambitious goal to mitigate the impacts of climate change and sees the set of approaches outlined in Countdown to 2045 as a model for other states and nations.
Maria Rigatti, Executive Vice President and Chief Financial Officer, Edison International
In my comments today, I will cover third quarter results, discuss our 2023 EPS guidance, and provide additional insight into our long-term core EPS growth expectations.
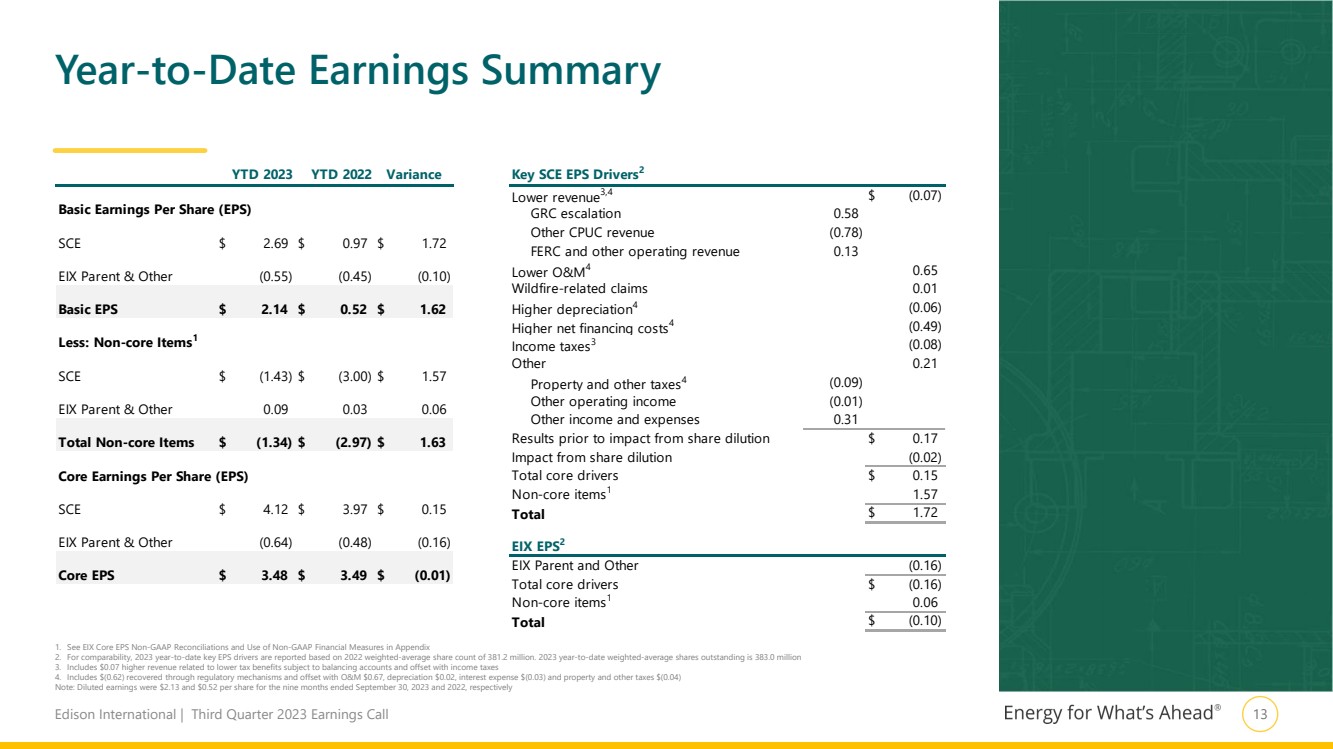
Starting with the third quarter of 2023, EIX reported core EPS of $1.38. As you can see from the year-over-year quarterly variance analysis shown on page 5, SCE’s third quarter earnings saw a 3-cent decrease. Recall that during this period last year, SCE received a CPUC final decision on its Customer Service Re-Platform project and recorded a 9-cent true-up. This results in an unfavorable year-over-year comparison for this quarter. I will highlight two additional key variances — SCE’s earnings were driven by an increase in revenue due to the GRC escalation mechanism, partially offset by higher interest expense. At EIX Parent and Other, there was a negative variance of 7 cents primarily due to higher holding company interest expense. Overall, we are pleased with our performance through the first nine months of the year and, combined with our outlook for the fourth quarter, we are confident in reaffirming our full-year core EPS guidance of $4.55 to $4.85.
4
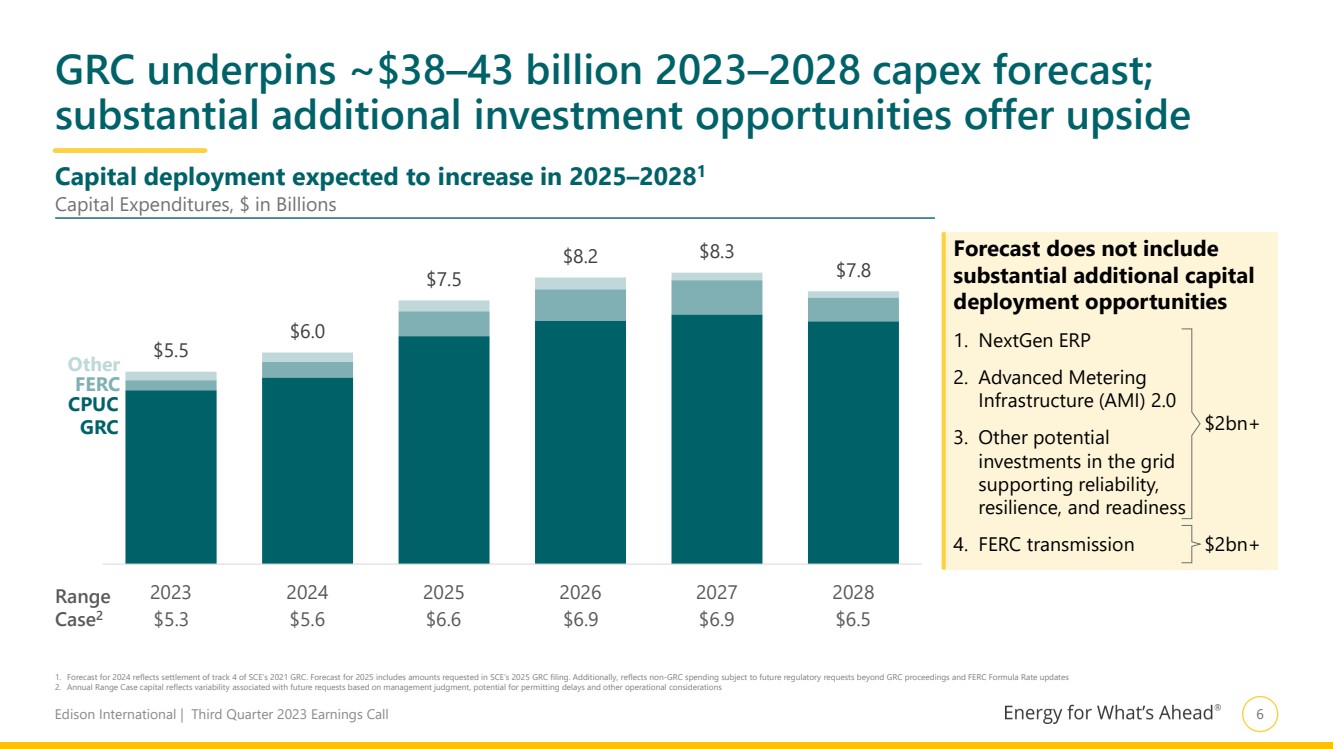
I’ll cover this in more detail in a few minutes.
On page 6, we have updated the capital forecast to incorporate the GRC track 4 settlement agreement and assumptions about the timing for certain projects. The key message here is that we continue to see $38 to $43 billion of capital investment opportunity from 2023 through 2028. Turning to page 7, our capital plan supports approximately 6 to 8% rate base growth from 2023 through 2028. Let me emphasize that SCE is an electric-only, transmission and distribution focused utility, which benefits from several strong regulatory mechanisms and competitive ROEs. So, we see this rate base growth as high-quality and lower-risk since it is driven by the crucial grid infrastructure needed to facilitate California’s leading role in transitioning to a carbon-free economy.
As outlined in our Countdown to 2045 analysis, unprecedented grid expansion is needed to keep pace with long-term, systemwide resource capacity growth. For a sense of scale, because of the upgrades and additions needed for distribution circuits, substations, transformers, and conductors, SCE expects to have a 25% larger distribution system by 2045. This significant expansion in the grid makes us confident in the long-term investment opportunity here in California.
Before I discuss our outlook for 2023 and beyond, I'd like to point out two key opportunities we've identified that would add certainty around our future financing needs and financial outlook.
First, SCE will be filing an application with the CPUC tomorrow that would allow the utility to monetize its current portfolio of contracts with wireless providers and future contracting opportunities on its transmission infrastructure. The utility currently has more than 850 leases of space on transmission towers and other structures that wireless providers use to attach their equipment. SCE is making this filing prior to the marketing of these assets to shorten the timeline leading to final regulatory approval. The contracts the utility expects to monetize generate nearly $20 million in annual revenue. This transaction will financially benefit customers, and for shareholders, this is an efficient form of financing that can reduce the need for equity in the future.
5
We will keep you updated as the transaction progresses.
Second, EIX recently announced a $750 million tender offer for its outstanding preferred stock. This offer would be funded with debt issuances, such as junior subordinated notes, or “JSNs.” By funding the repurchase with JSNs, we will replace the equity content of the preferred stock. Overall, the transaction will simultaneously de-lever the balance sheet and reduce our interest rate exposure. Let me underscore that this transaction creates near- and long-term financial benefits. In 2023, we would recognize core EPS of about 2 cents for every $100 million of preferred stock tendered. In 2026 and beyond, we will have locked in lower after-tax financing costs compared to the expected reset rates for the preferred stock.
These two opportunities build on our track record of successfully identifying ways to manage the business even more efficiently and executing to create additional value.
As shown on page 8, we are reaffirming our 2023 core EPS guidance range of $4.55 to $4.85. Based on our year-to-date performance and outlook for the rest of year, we are confident in delivering on this target. Recall that this guidance includes 14 cents related to SCE’s 2022 CEMA application. The CPUC recently extended the proceeding’s statutory deadline to April 2024, but there still is a possibility of a final decision by year-end. Together with the tender offer, these two items could put us at the top end of our guidance range. However, if the CEMA final decision occurs in 2024, we will realize those earnings in that year.
Page 9 gives you an update on our accomplishments to date in regard to our 2023 financing plan. The financing transactions so far this year have been in line with our expectations and supported by strong investor response. As I mentioned a moment ago, we’ve opportunistically added a new component to our plan with the tender offer and look forward to executing another successful transaction.
On the regulatory front, I’d like to expand on a couple of Pedro’s earlier points. First, to provide some detail on GRC track 4, the agreement with intervenors would authorize 98% of SCE’s requested revenue requirement and 99% of its requested rate base.
6
The key takeaway here is that, once approved by the CPUC, the agreement will provide clarity on 2024 revenue and translate to 12 cents in incremental rate base EPS over 2023. Consistent with our typical practice, we will provide 2024 earnings guidance on our fourth quarter earnings call.
Second, as shown on page 10, the cost of capital mechanism triggered a 70-basis point ROE increase, resulting in 2024 and 2025 CPUC ROEs of 10.75%. This benefits 2025 EPS by approximately 39 cents. The mechanism provides a hedge against future increases in interest rates above the levels embedded in our 2025 guidance of $5.50 to $5.90. In terms of operational drivers, we are confident that we will deliver results within the range shown in the modeling considerations. SCE is also evaluating opportunities to reinvest a portion of the 39 cents to accelerate initiatives that would benefit safety, quality, and affordability for customers. This investment would enable the utility to capture savings sooner thereby providing a strong base for long-term customer benefits. I will share more on this front over time.
I want to reiterate the high confidence we have in our ability to achieve our 2025 and 2028 EPS growth targets. In addition to our strong rate base growth, we also see upside opportunities. We are looking forward to delivering our targeted EPS growth, which sets the foundation for an attractive total return proposition.
7
|
NOVEMBER 1, 2023 THIRD QUARTER 2023 FINANCIAL RESULTS |
|
Edison International | Third Quarter 2023 Earnings Call 1 Statements contained in this presentation about future performance, including, without limitation, operating results, capital expenditures, rate base growth, dividend policy, financial outlook, and other statements that are not purely historical, are forward-looking statements. These forward-looking statements reflect our current expectations; however, such statements involve risks and uncertainties. Actual results could differ materially from current expectations. These forward-looking statements represent our expectations only as of the date of this presentation, and Edison International assumes no duty to update them to reflect new information, events or circumstances. Important factors that could cause different results include, but are not limited to the: • ability of SCE to recover its costs through regulated rates, including uninsured wildfire-related and debris flow-related costs, costs incurred to mitigate the risk of utility equipment causing future wildfires, costs incurred as a result of the COVID-19 pandemic, and increased costs due to supply chain constraints, inflation, and rising interest rates; • ability of SCE to implement its Wildfire Mitigation Plan and capital program; • risks of regulatory or legislative restrictions that would limit SCE's ability to implement operational measures to mitigate wildfire risk, including Public Safety Power Shutoff (“PSPS”) and fast curve settings, when conditions warrant or would otherwise limit SCE's operational practices relative to wildfire risk mitigation; • risks associated with SCE implementing PSPS, including regulatory fines and penalties, claims for damages and reputational harm; • ability of SCE to maintain a valid safety certification, which is required to benefit from certain provisions of California Assembly Bill 1054 (“AB 1054”); • extreme weather-related incidents (including events caused, or exacerbated, by climate change, such as wildfires, debris flows, flooding, droughts, high wind events and extreme heat events) and other natural disasters (such as earthquakes), which could cause, among other things, public safety issues, property damage, rotating outages and other operational issues (such as issues due to damaged infrastructure), PSPS activations and unanticipated costs; • risk that AB 1054 does not effectively mitigate the significant exposure faced by California investor-owned utilities related to liability for damages arising from catastrophic wildfires where utility facilities are alleged to be a substantial cause, including the longevity of the Wildfire Insurance Fund and the CPUC's interpretation of and actions under AB 1054, including its interpretation of the prudency standard clarified by AB 1054; • ability of Edison International and SCE to effectively attract, manage, develop and retain a skilled workforce, including its contract workers; • decisions and other actions by the California Public Utilities Commission, the Office of Energy Infrastructure Safety of the California Natural Resources Agency, the Federal Energy Regulatory Commission, the Nuclear Regulatory Commission and other governmental authorities, including decisions and actions related to nationwide or statewide crisis, determinations of authorized rates of return or return on equity, issuance of SCE's wildfire safety certification, wildfire mitigation efforts, approval and implementation of electrification programs, and delays in executive, regulatory and legislative actions; • cost and availability of labor, equipment and materials, including as a result of supply chain constraints and inflation; • ability of Edison International or SCE to borrow funds and access bank and capital markets on reasonable terms; • risks associated with the decommissioning of San Onofre, including those related to worker and public safety, public opposition, permitting, governmental approvals, on-site storage of spent nuclear fuel and other radioactive material, delays, contractual disputes, contractor performance, and cost overruns; • ability of Edison International and SCE to obtain sufficient insurance at a reasonable cost or to maintain its customer funded self-insurance program, and to recover the costs of such insurance or, in the event liabilities exceed insured amounts, the ability to recover uninsured losses (including amounts paid for self-insured retention and co-insurance) from customers or other parties; • pandemics, such as COVID-19, and other events that cause regional, statewide, national or global disruption, which could impact, among other things, Edison International's and SCE's business, operations, cash flows, liquidity and/or financial results and cause Edison International and SCE to incur unanticipated costs; • physical security of Edison International's and SCE's critical assets and personnel and the cybersecurity of Edison International's and SCE's critical information technology systems for grid control, and business, employee and customer data; • risks associated with cost allocation resulting in higher rates for utility bundled service customers because of possible customer bypass or departure for other electricity providers such as Community Choice Aggregators (“CCA,” which are cities, counties, and certain other public agencies with the authority to generate and/or purchase electricity for their local residents and businesses) and Electric Service Providers (entities that offer electric power and ancillary services to retail customers, other than electrical corporations (like SCE) and CCAs); • risks inherent in SCE’s capital investment program, including those related to project site identification, public opposition, environmental mitigation, construction, permitting, contractor performance, availability of labor, equipment and materials, weather, changes in the California Independent System Operator’s transmission plans, and governmental approvals; and • risks associated with the operation of electrical facilities, including worker and public safety issues, the risk of utility assets causing or contributing to wildfires, failure, availability, efficiency, and output of equipment and facilities, and availability and cost of spare parts. Other important factors are discussed under the headings “Forward-Looking Statements”, “Risk Factors” and “Management’s Discussion and Analysis” in Edison International’s Form 10-K and other reports filed with the Securities and Exchange Commission, which are available on our website: www.edisoninvestor.com. These filings also provide additional information on historical and other factual data contained in this presentation. Forward-Looking Statements |
|
Edison International | Third Quarter 2023 Earnings Call 2 Third Quarter Key Messages $0.40 Q3 GAAP EPS $1.38 Q3 Core EPS1 Reiterated 5–7% Core EPS CAGR 2025–20283 Reiterated 5–7% Core EPS CAGR 2021–20252 1 Reaffirmed $4.55–4.85 2023 Core EPS Guidance1 YTD performance on track to deliver on 2023 core EPS guidance1 2 Achieved milestone in industry-leading wildfire mitigation program: Over 5,200 miles of covered conductor now installed 3 Filed $2.4 billion cost recovery application for TKM events; revised best estimate of expected losses, resulting in net after-tax charge of $323 million 4 GRC Track 4 settlement pending approval; provides substantial clarity on 2024 revenue and rate base 1. See Earnings Per Share Non-GAAP Reconciliations and Use of Non-GAAP Financial Measures in Appendix 2. Compound annual growth rate (CAGR) based on the midpoint of the initial 2021 EPS guidance range of $4.42–4.62 3. Compound annual growth rate (CAGR) based on the midpoint of the 2025 EPS guidance range of $5.50–5.90 2 |
|
Edison International | Third Quarter 2023 Earnings Call 3 In August, SCE filed first 2017/2018 cost recovery application ($2.4Bn), proposing CPUC decision in early 2025 2.4 0.5 5.7 0.7 9.3 Best Estimate of Total Losses 1. TKM: Collectively, the Thomas Fire, the Koenigstein Fire, and the Montecito Mudslides 2. After giving effect to all payment obligations under settlements entered into through September 30, 2023, including under the agreement with the Safety and Enforcement Division of the CPUC Substantial progress resolving claims $ in Billions, as of September 30, 2023 Application for TKM events in progress1 Remaining2 Request: – $2.4 billion (settlements + financing and legal costs) – Securitization of approved amounts ▪ TKM Application: ~$1.50/month for average residential customer bill (vs. current average non-CARE residential bill of ~$175) ▪ System average rate sensitivity: Less than half a penny per kWh for each $1 billion of recovery (vs. current system average rate of 26.5¢/kWh) Separate application for Woolsey Resolved Cost recovery request of ~$6.4 billion (+associated interest and legal costs) SED agreement Insurance and FERC recovery 3Q Update: Best estimate adjusted by $475MM Driven by settlements being resolved at higher levels than originally estimated and assuming trend continues; and have more refined information about claim types |
|
Edison International | Third Quarter 2023 Earnings Call 4 40% Average savings on household energy expenses +80% Growth in electricity demand 95% of buildings are electrified 3x More utility-scale clean energy vs. today Up to 4x & 10x Historical pace of transmission & distribution project additions 90% of vehicles are electrified Countdown to 2045 makes it clear that the electric grid must expand rapidly and integrate new clean energy technologies |
|
Edison International | Third Quarter 2023 Earnings Call 5 Q3 2023 Q3 2022 Variance Basic Earnings Per Share (EPS) SCE $ 0.62 $ (0.21) $ 0.83 EIX Parent & Other (0.22) (0.12) (0.10) Basic EPS $ 0.40 $ (0.33) $ 0.73 Less: Non-core Items1 SCE $ (0.98) $ (1.84) $ 0.86 EIX Parent & Other — 0.03 (0.03) Total Non-core Items $ (0.98) $ (1.81) $ 0.83 Core Earnings Per Share (EPS) SCE $ 1.60 $ 1.63 $ (0.03) EIX Parent & Other (0.22) (0.15) (0.07) Core EPS $ 1.38 $ 1.48 $ (0.10) Key SCE EPS Drivers2 Lower revenue3,4 $ (0.05) GRC escalation 0.20 Other CPUC revenue (0.27) FERC and other operating revenue 0.02 Lower O&M4 0.07 Lower depreciation4 0.16 Higher net financing costs4 (0.17) Income taxes3 (0.12) Other 0.08 Property and other taxes4 (0.02) Other income and expenses 0.10 Total core drivers $ (0.03) Non-core items1 0.86 Total $ 0.83 (0.07) Total core drivers $ (0.07) Non-core items1 (0.03) Total $ (0.10) EIX EPS2 EIX Parent and Other Third Quarter Earnings Summary 1. See EIX Core EPS Non-GAAP Reconciliations and Use of Non-GAAP Financial Measures in Appendix 2. For comparability, 2023 third quarter key EPS drivers are reported based on 2022 weighted-average share count of 381.6 million. 2023 third quarter weighted-average shares outstanding is 383.4 million 3. Includes $0.11 higher revenue related to lower tax benefits subject to balancing accounts and offset with income taxes 4. Includes $(0.24) recovered through regulatory mechanisms and offset with O&M $0.06, interest expense $0.19 and property and other taxes $(0.01) Note: Diluted earnings (loss) were $0.40 and $(0.33) per share for the three months ended September 30, 2023 and 2022, respectively |
|
Edison International | Third Quarter 2023 Earnings Call 6 Capital deployment expected to increase in 2025–20281 Range Case2 $5.3 $5.6 $6.6 $6.9 $6.9 $6.5 $5.5 $6.0 $7.5 $8.2 $8.3 $7.8 2023 2024 2025 2026 2027 2028 GRC underpins ~$38–43 billion 2023–2028 capex forecast; substantial additional investment opportunities offer upside 1. Forecast for 2024 reflects settlement of track 4 of SCE’s 2021 GRC. Forecast for 2025 includes amounts requested in SCE’s 2025 GRC filing. Additionally, reflects non-GRC spending subject to future regulatory requests beyond GRC proceedings and FERC Formula Rate updates 2. Annual Range Case capital reflects variability associated with future requests based on management judgment, potential for permitting delays and other operational considerations CPUC GRC FERC Other Capital Expenditures, $ in Billions Forecast does not include substantial additional capital deployment opportunities 1. NextGen ERP 2. Advanced Metering Infrastructure (AMI) 2.0 3. Other potential investments in the grid supporting reliability, resilience, and readiness 4. FERC transmission $2bn+ $2bn+ |
|
Edison International | Third Quarter 2023 Earnings Call 7 GRC request supports ~6–8% rate base growth 2023–2028; substantial additional investment opportunities offer upside 1. Weighted-average year basis 2. Range Case rate base reflects only changes in forecast capital expenditures $41.3 $43.9 $49.5 $53.2 $57.0 $60.9 2023 2024 2025 2026 2027 2028 CPUC GRC FERC Other ~8% CAGR 2023–2028 Rate Base1 , $ in Billions Strong rate base growth driven by wildfire mitigation and important grid work to support California’s leading role in clean energy transition Range Case2 $41.1 $43.3 $48.0 $50.4 $52.8 $55.4 Forecast does not include substantial additional capital deployment opportunities 1. NextGen ERP 2. Advanced Metering Infrastructure (AMI) 2.0 3. Other potential investments in the grid supporting reliability, resilience, and readiness 4. FERC transmission $2bn+ $2bn+ |
|
Edison International | Third Quarter 2023 Earnings Call 8 EIX reaffirms 2023 core EPS guidance of $4.55–4.85 1. SCE is unable to conclude, at this time, that these amounts are probable of recovery; however, recovery will be sought as part of future cost recovery applications 2. 2023 guidance share count reflects shares outstanding as of Dec. 31, 2022. Dilution from shares issued during 2023 are reflected in EIX Parent and Other. 2023 YTD results based on weighted average share count in Q3 2023 Note: See Earnings Per Share Non-GAAP Reconciliations and Use of Non-GAAP Financial Measures in Appendix. All tax-effected information on this slide is based on our current combined statutory tax rate of approximately 28%. Totals may not add due to rounding 2023 YTD 2023 Guidance Rate Base EPS 4.13 5.58 SCE Operational Variances 0.49 0.58–0.75 SCE Costs Excluded from Authorized (0.50) (0.74)–(0.73) EIX Parent and Other Operational expense (0.08) (0.12)–(0.11) Interest expense, preferred dividends (incl. dilution) (0.56) (0.75)–(0.64) EIX Consolidated Core EPS $3.48 $4.55–4.85 Share Count (in millions)2 383.0 382.2 EIX 2023 Core Earnings Per Share Guidance Range Building from SCE Rate Base EPS Rate Base CPUC FERC Rate Base ($Bn) $33.7 $7.6 Equity Ratio 52.00% 47.50% ROE 10.05% 10.30% EPS $4.61 $0.97 Modeling Considerations AFUDC 0.43 2022 CEMA decision true-up 0.14 Wildfire fund debt cost (0.09) Wildfire claims debt cost1 (0.45) (to be requested for recovery) Exec. compensation not in rates (0.20) |
|
Edison International | Third Quarter 2023 Earnings Call 9 ✓ Significant portion of EIX 2023 financing plan accomplished, with strong investor support for offerings 1. Financing plans are subject to change 2. Equity content based on S&P methodology $1,400 $400 2.95% senior notes due March $600 term loan due April EIX 2023 Debt Maturities EIX 2023 Financing Plan Status1 $ in Millions Expect to issue securities with $300–400 million of equity content: – In March, issued $500 million of junior subordinated notes ($250 million equity content2 ) – Expect to generate ~$100 million common equity via internal programs ($74 million complete YTD) Expect to issue parent debt for remainder – In May, issued $600 million of senior unsecured debt @5.25% Up to $750 million tender offer for outstanding preferred equity; equity content of repurchased securities to be replaced through an equity content financing (e.g., junior subordinated notes) $400 term loan due November ✓ ✓ ✓ ✓ ✓ As of September 30, 2023 ✓ ✓ |
|
Edison International | Third Quarter 2023 Earnings Call 10 3.0 3.5 4.0 4.5 5.0 5.5 6.0 6.5 7.0 Oct. 1, 2022 Oct. 1, 2023 CPUC cost of capital mechanism adjusts ROE for 2024 and 2025 upward to 10.75%; also resets costs of debt and preferred Advice letter to implement 70 bps upward adjustment filed October 13 for rates effective January 1, 2024 – New deadband becomes ±100bps around 5.78% Next Steps: – Intervenors may file protests by November 2 – CPUC Energy Division can approve advice letter or refer to full CPUC for approval CPUC Cost of Capital Adjustment Mechanism (CCM) Moody’s Baa Utility Bond Index Rate (%), as of October 30, 2023 Average of 5.78% results in 70bps upward adjustment to ROE and becomes new benchmark Current Spot Rate: 6.72% https://www.edison.com/_gallery/get_file/?file_id=63d432a6b3aed337c6e7381c&file_ext=.xlsx&page_id= Click here for link to spreadsheet illustrating CCM mechanics New deadband of 4.78–6.78% for Oct. 1, 2023– Sept. 30, 2024 |
|
Edison International | Third Quarter 2023 Earnings Call 11 EIX offers double-digit total return potential 1. Compound annual growth rate (CAGR) based on the midpoint of the 2021 Core EPS guidance range of $4.42–4.62 established on September 16, 2021; CAGR for 2025–2028 based on the midpoint of 2025 Core EPS guidance range of $5.50–5.90 2. Based on EIX stock price on October 31, 2023 3. Building electrification programs subject to CPUC approval 4. At current P/E multiple. Excludes changes in P/E multiple and potential dividend growth 5. Risk reduction based on mitigations through June 30, 2023 5–7% core EPS CAGR1 2021–2025 and 2025–2028 Underpinned by strong rate base growth of ~6–8% $38–43 billion 2023–2028 capital program ~4% current dividend yield2 19 consecutive years of dividend growth Target dividend payout of 45–55% of SCE core earnings Investments in safety and reliability of the grid Wildfire mitigation execution reduces risk for customers Creates strong foundation for climate adaptation and the clean energy transition One of the strongest electrification profiles in the industry Industry-leading programs for transportation electrification and building electrification3 Potential for 35% load growth by 2035 and 80% by 2045 9–11% total return opportunity4 before potential P/E multiple expansion driven by estimated 85% wildfire risk reduction5 , and ongoing utility and government wildfire mitigation efforts |
|
ADDITIONAL INFORMATION |
|
Edison International | Third Quarter 2023 Earnings Call 13 YTD 2023 YTD 2022 Variance Basic Earnings Per Share (EPS) SCE $ 2.69 $ 0.97 $ 1.72 EIX Parent & Other (0.55) (0.45) (0.10) Basic EPS $ 2.14 $ 0.52 $ 1.62 Less: Non-core Items1 SCE $ (1.43) $ (3.00) $ 1.57 EIX Parent & Other 0.09 0.03 0.06 Total Non-core Items $ (1.34) $ (2.97) $ 1.63 Core Earnings Per Share (EPS) SCE $ 4.12 $ 3.97 $ 0.15 EIX Parent & Other (0.64) (0.48) (0.16) Core EPS $ 3.48 $ 3.49 $ (0.01) Key SCE EPS Drivers2 Lower revenue3,4 $ (0.07) GRC escalation 0.58 Other CPUC revenue (0.78) FERC and other operating revenue 0.13 Lower O&M4 0.65 Wildfire-related claims 0.01 Higher depreciation4 (0.06) Higher net financing costs4 (0.49) Income taxes3 (0.08) Other 0.21 Property and other taxes4 (0.09) Other operating income (0.01) Other income and expenses 0.31 Results prior to impact from share dilution $ 0.17 Impact from share dilution (0.02) Total core drivers $ 0.15 Non-core items1 1.57 Total $ 1.72 (0.16) Total core drivers $ (0.16) Non-core items1 0.06 Total $ (0.10) EIX EPS2 EIX Parent and Other Year-to-Date Earnings Summary 1. See EIX Core EPS Non-GAAP Reconciliations and Use of Non-GAAP Financial Measures in Appendix 2. For comparability, 2023 year-to-date key EPS drivers are reported based on 2022 weighted-average share count of 381.2 million. 2023 year-to-date weighted-average shares outstanding is 383.0 million 3. Includes $0.07 higher revenue related to lower tax benefits subject to balancing accounts and offset with income taxes 4. Includes $(0.62) recovered through regulatory mechanisms and offset with O&M $0.67, depreciation $0.02, interest expense $(0.03) and property and other taxes $(0.04) Note: Diluted earnings were $2.13 and $0.52 per share for the nine months ended September 30, 2023 and 2022, respectively |
|
Edison International | Third Quarter 2023 Earnings Call 14 4.63 0.25 0.18 (0.11) 4.95 (0.25) 4.70 2022 Core EPS Rate Base Earnings SCE Operational Variances EIX Parent & Other Results Before Incr. WF Claims Debt Interest Incr. WF Claims Debt Interest 2023 Core EPS Guidance (@ Midpoint) Gap between 2023 rate base and core EPS growth largely driven by interest on debt for wildfire claims payments1 1. See Earnings Per Share Non-GAAP Reconciliations and Use of Non-GAAP Financial Measures in Appendix. Non-core items are presented as recorded 2. Includes SCE Operational variances plus interest expense on wildfire fund contribution debt and executive compensation not in rates. Excludes incremental interest expense on debt funding wildfire claims payments 3. Variance reflects 2022 expense of 8¢ related to financing of unmonetized tax benefits associated with wildfire claims payments previously categorized as an SCE Operational Variance Earnings from strong 7% 2023 rate base growth offset by higher interest expense 2022 Core EPS vs. 2023 Core EPS Guidance at Midpoint of $4.55–4.85 Range1 Higher debt balance as more claims settled and higher interest rates. Interest to be included in cost recovery applications +6.9% +1.5% GAAP EPS 1.61 Non-Core items primarily related to 2017/18 Events 3.02 2 2 1 3 GAAP EPS 3.36 Non-Core items 1.34 |
|
Edison International | Third Quarter 2023 Earnings Call 15 Cash flow from memo account recovery and securitization strengthens our balance sheet and credit metrics Approved Applications Application / Account Balance @ Sept. 30 Recovery Through Remaining Rate Recovery by Year Q4 2023 2024 2025 ✓ GRC Track 3 267 Sept. ’25 33 134 100 ✓ CSRP Track 1 239 Dec. ’25 50 87 102 ✓ GRC Track 2 190 Feb. ’25 34 134 22 ✓ WEMA2 138 May ’24 52 86 – ✓ Others1 138 Varies 37 82 19 ✓ GRC Track 1 (Jan.–Sept. 2021 Balance) 80 Dec. ’23 80 – – Total 1,052 285 523 244 Pending Applications2 (Subject to CPUC Authorization) Application Request2 Expected Amort.2 Expected Rate Recovery by Year Q4 2023 2024 2025 2022 Wildfire Mitigation & Vegetation Mgmt. (WM/VM) 384 12 months – – 384 2021 Wildfire Mitigation & Vegetation Mgmt. (WM/VM) 327 12 months – 273 55 2022 CEMA3 198 12 months – 198 – 2021 CEMA3 132 12 months – 132 – Total 1,041 – 603 438 1. Includes 2020-2022 Residential Uncollectibles, CSRP Track 2, and Vegetation Management Z-Factor 2. Pending Applications reflects applications already submitted to the CPUC. Additional CEMA applications will be made for other events. Requested revenue requirement shown. Amounts and amortization subject to CPUC approval 3. Reflects request at the time of the application. SCE continues to record capital-related revenue requirements and interest in CEMA that would also be authorized upon commission approval Note: Numbers may not add due to rounding GRC, Wildfire-related, and Wildfire Insurance Applications $ in Millions |
|
Edison International | Third Quarter 2023 Earnings Call 16 SCE Key Regulatory Proceedings Proceeding Description Next Steps Base Rates 2021 GRC Track 4 (A.19-08-013) Set CPUC base revenue requirement for third attrition year (2024) Settlement agreement filed with CPUC pending approval 2025 GRC (A.23-05-010) Sets CPUC base revenue requirement for 2025–2028. For more information, see the Investor Guide to SCE’s 2025 GRC Intervenors’ prepared direct testimony due February 2024 Wildfire 2021 Wildfire Mitigation & Vegetation Management (A.22-06-003) Requesting approval of ~$327MM of rev. req. for incremental 2021 wildfire mitigation capex and O&M, and incremental 2021 veg. management O&M PD scheduled for Dec ’23 / Jan ‘24 2022 Wildfire Mitigation & Vegetation Management (A.23-10-001) Requesting approval of ~$383MM of rev. req. for incremental 2022 wildfire mitigation capex and O&M, and incremental 2022 veg. management O&M; also requested interim rate recovery beginning Mar ‘24 Protests and responses and reply to protests and responses due in November 2021 CEMA (A.21-09-019) Request recovery of costs associated with various events 2018–2020. $9MM capital, $127MM O&M; Rev. Req.: $132MM Comments on proposed decision due Nov. 20. Scheduled to be voted on at Nov. 30 CPUC mtg. 2022 CEMA (A.22-03-018) Request recovery of costs assoc. with 2019 winter storms and 2020 firestorms. $312MM capital, $207MM O&M; Rev. Req.: $198MM Awaiting proposed decision TKM Cost Recovery (A.23-08-013) Request recovery of $2.4 billion of costs to resolve claims associated with the Thomas Fire and Montecito Mudslides and $65 million of restoration costs Prehearing conference expected by Nov. 2023 2023 WMP (2023-2025-WMPs) New 3-year Wildfire Mitigation Plan covering 2023–2025 Final approval received from Office of Energy Infrastructure Safety; CPUC ratification scheduled to be voted on at Nov. 30 CPUC mtg. 2023 Annual Safety Certification Annual request for safety certification submitted to OEIS Final approval expected in December |
|
Edison International | Third Quarter 2023 Earnings Call 17 TKM Cost Recovery Proposed Schedule Event SCE Proposal ✓ Application Filed Complete ✓ Protests and responses Complete ✓ SCE’s reply to protests Complete Pre-hearing Conference By November 2023 Scoping ruling issued December 2023 Public Advocates Office and intervenor testimony Late April/Early May 2024 Rebuttal testimony Late June 2024 Evidentiary Hearings Early September 2024 Opening Briefs Early November 2024 Reply Briefs Early December 2024 Proposed Decision February 2025 Final Decision March 2025 17 |
|
Edison International | Third Quarter 2023 Earnings Call 18 EIX reaffirms 5–7% 2021–2025 EPS growth rate target, which would result in 2025 EPS of $5.50–5.901 1. Based on the midpoint of initial 2021 Core EPS guidance range of $4.42–4.62 established September 16, 2021. Growth in any given year can be outside the range 2. Components are rounded to the nearest 5 cents and based on EIX 2022 guidance share count of 381.4 million shares. For purposes of this illustration, all costs and dilution associated with any equity content issued beyond 2022 are reflected in EIX Parent and Other. Actual financing activity may vary and is subject to change Component Modeling Considerations Rate Base EPS (based on capex levels) 6.50–6.75 •CPUC ROE of 10.05% and FERC ROE 10.30% •Does not include upside from implementation of Cost of Capital Mechanism increasing CPUC ROE by 70bps (~$0.39) SCE Op. Variances 0.65–0.75 •Includes AFUDC of ~$0.30 to $0.35, regulatory applications, operational efficiencies, among other items SCE Costs Excluded from Authorized (0.70)–(0.65) •Primarily wildfire claims payment-related debt •Current interest rate assumption of 5.3% (sensitivity: ~1¢ EPS per ±20bps change) EIX Parent & Other (including dilution) (0.80)–(0.95) •Current interest rate assumption of 6.1% (sensitivity: ~1¢ EPS per ±20bps change) Pursuing opportunities to deliver 5–7% growth rate1 2025 Core Earnings per Share Component Ranges2 |
|
Edison International | Third Quarter 2023 Earnings Call 19 EIX expects 5–7% core EPS growth for 2025–20281 , with minimal equity needs 1. For 2025, represents the midpoint of the 2025 core EPS guidance range for $5.50–5.90 $5.70 $6.60–7.00 2025 Midpoint 2028 Achievable EPS growth for 2028 Core Earnings per Share Guidance1 1 Core driver for earnings trajectory is SCE’s strong rate base growth, driven by investing in the reliability, resilience, and readiness of the grid 2 2025–2028 core EPS growth achievable at current ROEs and projected interest rates 3 Stabilization of variables by 2025 allows for simplified growth story; opportunity to efficiently manage operational and financing costs to drive growth 4 For 2025 through 2028, we expect equity needs fulfilled using internal programs: ~$100 million/year 5–7% CAGR1 5 EPS guidance does not incorporate potential cost recovery for 2017/2018 Wildfire/Mudslide Events |
|
Edison International | Third Quarter 2023 Earnings Call 20 Key 2028 Earnings Sensitivities Variable Sensitivity 2028 EPS1 (“Per year” amounts refer to 2025–2028) Capex & Rate Base Rate Base $100 million/year of capex 5¢ AFUDC (~45¢/share) Annual capex of $200 million 1¢ Requested ~$400 million increase in depreciation in 2025 GRC If requested increase not authorized +15–35¢ (on range case) Rates & Financing CPUC ROE (Currently 10.05%) 10 bps 7¢2 FERC ROE (Currently 10.30%) 10 bps 1¢2 Wildfire Debt Rate (4.6% weighted average portfolio) 20 bps 2¢ EIX Parent Debt Rate (5.0% weighted average portfolio) 20 bps 2¢ Equity (~$100 million/year 2025–2028) For each $10 million/year reduction +1¢ 1. Assumes ~390 million shares outstanding for 2028 2. Based on a CPUC / FERC rate base mix of 86% CPUC / 14% FERC and current authorized capital structures |
|
Edison International | Third Quarter 2023 Earnings Call 21 Cost recovery for 2017/2018 events benefits financial strength of the utility and reduces costs for customers Modeling sensitivities: For each $1 billion of cost recovery… Debt paydown with proceeds of securitization2 $1 billion Higher FFO-to-Debt ~40–50 bps Reduced interest expense ~$35 million (~9¢/share) Total potential avoided excess financing costs3 for SCE debt issued over next 10 years As high as $4.9 billion 1. SCE’s pending application seeks a reasonableness review of the costs incurred and indicates an intent to seek authority for securitization after a final decision on cost recovery 2. Bill impact of $0.63/month for each $1 billion of recovery, with no impact to low-income customers. This will be offset by avoided excess financing costs for all customers 3. Represents the high end of the total estimated avoided excess debt costs realized through the narrowing of the debt issuance financing cost spread between SCE and its non-California peers if investors find the decision in this proceeding to be reasonable based on the underlying facts. For additional description and detail, see Thomas Fire and Debris Flow Cost Recovery Application – Financial Policy Testimony (SCE-01, Volume 3) Reduces overall costs to customers2 |
|
Edison International | Third Quarter 2023 Earnings Call 22 EIX & SCE have limited variable-rate exposure Approximately $11 billion of the total ~$31 billion long-term debt portfolio matures through 20281 SCE Wildfire Interest expense will be included in cost recovery applications SCE Operational Minimal exposure based on authorized cost of capital EIX Parent Outstanding Short- and Long-Term Debt Maturities (2023–2028)1 as of September 30, 2023, $ in Millions 735 - 900 - - 439 2023 2024 2025 2026 2027 2028 1. Does not include commercial paper or amortization of secured recovery bonds issued by SCE Recovery Funding LLC. The chart shows the 2023 mandatory purchase of $135 million of tax-exempt bonds as a maturity in 2023 2. For variable rate debt, based on effective rates as of September 30, 2023 1,150 1,000 - 2,150 300 750 1,350 1,300 2023 2024 2025 2026 2027 2028 500 800 - 600 1,150 2023 2024 2025 2026 2027 2028 3.3% 3.5% 3.2% 5.3% 3.7% 3.6% 4.8% 5.8% Wtd. Avg. Rate2 Fixed Rate 4.2% Variable Rate - 4.7% 5.4% 3.5% |
|
Edison International | Third Quarter 2023 Earnings Call 23 SCE continues to fund wildfire claims payments with debt Series Principal Due Rate 2021C 400 4/1/24 SOFR + 83bps 2021E 700 4/1/24 1.100% Term Loan 600 5/7/24 Adj. SOFR + 90bps 2021K 450 8/1/24 0.975% 2022C 300 6/1/25 4.200% 2020C 350 2/1/26 1.200% 2023C 400 6/1/26 4.900% 2022D 600 6/1/27 4.700% 2022F 750 11/1/27 5.850% 2023A 750 3/1/28 5.300% 2023E 550 10/1/28 5.650% 2022E 350 6/1/52 5.450% Total $6,200 Annualized Interest1: ~$274 Wildfire Claims Payment-Related Debt Issuances $ in Millions except percentages, as of September 30, 2023 Interest expense not currently recoverable in rates, however, will be included in 2017/2018 Wildfire/ Mudslide Events cost recovery applications SCE has waiver from CPUC, allowing exclusion with respect to certain current and future charges to equity and associated debt for calculating SCE’s regulatory equity ratio – Waiver approved through August 2025 (with ability to seek additional extension via application) or until CPUC makes a final determination on cost recovery for 2017/2018 Wildfire/Mudslide Events 1. Pre-tax. Based on SOFR of 5.40% as of September 30, 2023 |
|
Edison International | Third Quarter 2023 Earnings Call 24 Q3 2023 Q3 2022 YTD 2023 YTD 2022 SCE $ 239 $ (80) $ 1,029 $ 369 EIX Parent & Other (84) (48) (210) (172) Basic Earnings $ 155 $ (128) $ 819 $ 197 Non-Core Items SCE 2017/2018 Wildfire/Mudslide Events claims and expenses, net of recoveries (458) (834) (560) (1,238) Wildfire Insurance Fund expense (54) (54) (159) (160) 2021 NDCTP probable disallowance — — (30) — Customer cancellations of certain ECS data services — — (17) — Employment litigation matter, net of recoveries — — 10 (23) Other wildfire claims and expenses, net of recoveries 1 (7) — (7) — Upstream Lighting Program decision — (81) — (81) Impairments — — — (64) Organizational realignment charge — — — (14) Income tax benefit2 145 266 214 438 Subtotal SCE (374) (703) (549) (1,142) EIX Parent & Other Customer revenues for EIS insurance contract, net of claims (3) 14 42 14 Income tax benefit (expense)2 1 (3) (9) (3) Subtotal EIX Parent & Other (2) 11 33 11 Less: Total non-core items $ (376) $ (692) $ (516) $ (1,131) SCE 613 623 1,578 1,511 EIX Parent & Other (82) (59) (243) (183) Core Earnings $ 531 $ 564 $ 1,335 $ 1,328 Earnings Non-GAAP Reconciliations 1. Beginning in Q3 2023 management no longer believes that wildfire-related claims are representative of ongoing earnings, due to the implementation of the customer-funded self-insurance 2. SCE non-core items are tax-effected at an estimated statutory rate of approximately 28%; customer revenues for EIS insurance contract are tax-effected at an estimated statutory rate of approximately 20% Reconciliation of EIX GAAP Earnings to EIX Core Earnings Earnings (Losses) Attributable to Edison International, $ in Millions |
|
Edison International | Third Quarter 2023 Earnings Call 25 Q3 2023 Q3 2022 YTD 2023 YTD 2022 Basic EPS $ 0.40 $ (0.33) $ 2.14 $ 0.52 Non-Core Items SCE 2017/2018 Wildfire/Mudslide Events claims and expenses, net of recoveries (1.19) (2.19) (1.46) (3.25) Wildfire Insurance Fund expense (0.14) (0.14) (0.42) (0.42) 2021 NDCTP probable disallowance — — (0.08) — Customer cancellations of certain ECS data services — — (0.04) — Employment litigation matter, net of recoveries — — 0.03 (0.06) Other wildfire claims and expenses, net of recoveries 2 (0.02) — (0.02) — Upstream Lighting Program decision — (0.21) — (0.21) Impairments — — — (0.16) Organizational realignment charge — — — (0.04) Income tax benefit3 0.37 0.70 0.56 1.14 Subtotal SCE (0.98) (1.84) (1.43) (3.00) EIX Parent & Other Customer revenues for EIS insurance contract, net of claims — 0.04 0.11 0.04 Income tax expense3 — (0.01) (0.02) (0.01) Subtotal EIX Parent & Other — 0.03 0.09 0.03 Less: Total non-core items (0.98) (1.81) (1.34) (2.97) Core EPS $ 1.38 $ 1.48 $ 3.48 $ 3.49 EIX Core EPS Non-GAAP Reconciliations 1. 2023 EPS drivers are presented based on weighted-average share counts of 383.4 million and 383.0 million for Q3 and YTD, respectively; 2022 EPS drivers are presented based on weighted-average share counts of 381.6 million and 381.2 million for Q3 and YTD, respectively 2. Beginning in Q3 2023 management no longer believes that wildfire-related claims are representative of ongoing earnings, due to the implementation of the customer-funded self-insurance 3. SCE non-core items are tax-effected at an estimated statutory rate of approximately 28%; customer revenues for EIS insurance contract are tax-effected at an estimated statutory rate of approximately 20% Reconciliation of EIX Basic Earnings Per Share to EIX Core Earnings Per Share EPS Attributable to Edison International1 |
|
Edison International | Third Quarter 2023 Earnings Call 26 Low High Basic EIX EPS $3.21 $3.51 Total Non-Core Items1 (1.34) (1.34) Core EIX EPS $4.55 $4.85 1. Non-core items are presented as they are recorded Earnings Per Share Non-GAAP Reconciliations Reconciliation of EIX Basic Earnings Per Share Guidance to EIX Core Earnings Per Share Guidance 2023 EPS Attributable to Edison International |
|
Edison International | Third Quarter 2023 Earnings Call 27 Use of Non-GAAP Financial Measures Edison International's earnings are prepared in accordance with generally accepted accounting principles used in the United States. Management uses core earnings (losses) internally for financial planning and for analysis of performance. Core earnings (losses) are also used when communicating with investors and analysts regarding Edison International's earnings results to facilitate comparisons of the company's performance from period to period. Core earnings (losses) are a non-GAAP financial measure and may not be comparable to those of other companies. Core earnings (losses) are defined as earnings attributable to Edison International shareholders less non-core items. Non-core items include income or loss from discontinued operations and income or loss from significant discrete items that management does not consider representative of ongoing earnings, such as write downs, asset impairments, wildfire-related claims, and other income and expense related to changes in law, outcomes in tax, regulatory or legal proceedings, and exit activities, including sale of certain assets and other activities that are no longer continuing. A reconciliation of Non-GAAP information to GAAP information is included either on the slide where the information appears or on another slide referenced in this presentation. EIX Investor Relations Contact Sam Ramraj, Vice President Derek Matsushima, Principal Manager (626) 302-2540 (626) 302-3625 Sam.Ramraj@edisonintl.com Derek.Matsushima@edisonintl.com |