| Delaware | 0-14112 | 43-1128385 | ||||||
(State or other jurisdiction of incorporation) |
(Commission File Number) | (IRS Employer Identification No.) |
||||||
| Title of each class | Ticker symbol(s) | Name of each exchange on which registered | ||||||
| Common Stock, $0.01 par value | JKHY | Nasdaq Global Select Market | ||||||
JACK HENRY & ASSOCIATES, INC. |
|||||||||||
| (Registrant) | |||||||||||
| Date: | August 16, 2022 | /s/ Kevin D. Williams | |||||||||
| Kevin D. Williams | |||||||||||
| Chief Financial Officer and Treasurer | |||||||||||

 |
|||||
| Press Release | |||||
Kevin D. Williams | Chief Financial Officer | (417) 235-6652 | |||||
| Fiscal Year 2022 Revenue | Fiscal Year 2022 Operating Income | Fiscal Year 20223 |
||||||||||||||||||
|
|
|
||||||||||||||||||
| GAAP | Non-GAAP1 |
GAAP | Non-GAAP1 |
GAAP Net Income | ||||||||||||||||
increased |
increased | increased |
increased | increased |
||||||||||||||||
11% |
9% |
19% |
13% |
17% |
||||||||||||||||
| Fourth Quarter Revenue | Fourth Quarter Operating Income | Fiscal Year 20223 |
||||||||||||||||||
|
|
|
||||||||||||||||||
| GAAP | Non-GAAP1 |
GAAP | Non-GAAP1 |
Non-GAAP EBITDA1 |
||||||||||||||||
increased |
increased | increased |
increased | increased |
||||||||||||||||
7% |
8% |
8% |
13% |
10% |
||||||||||||||||
According to David Foss, Board Chair and CEO, “We are very pleased to report another quarter of record revenue, operating income, and total sales bookings. Among many other successes, our sales teams secured 17 new core clients and sold 48 new digital banking systems in the quarter. Additionally, we have recently announced the addition of a new CFO to our team, a refreshed brand for our company, and the pending acquisition of Payrailz. As we begin the new fiscal year, our sales pipeline remains strong, and we see significant opportunities to continue growing our company through the successful execution of our technology modernization and One Jack Henry operational strategies. As a well-rounded financial technology provider, we remain optimistic about the strength of our innovative technology solutions around digital, lending, payments, core solutions and open banking as well as our ability to deliver outstanding service in a market that is widely expected to continue to increase technology and digital investments in the future.” | |||||||||||||||||
 |
1 |
|||||||
| Revenue (Unaudited) | |||||||||||||||||||||||||||||||||||
| (In Thousands) | Three Months Ended June 30, |
% Change | Year Ended June 30, |
% Change | |||||||||||||||||||||||||||||||
| 2022 | 2021 | 2022 | 2021 | ||||||||||||||||||||||||||||||||
| Revenue | |||||||||||||||||||||||||||||||||||
| Services and Support | $ | 279,740 | $ | 261,697 | 7 | % | $ | 1,156,365 | $ | 1,048,206 | 10 | % | |||||||||||||||||||||||
| Percentage of Total Revenue | 58 | % | 58 | % | 60 | % | 60 | % | |||||||||||||||||||||||||||
| Processing | 202,932 | 188,590 | 8 | % | 786,519 | 710,019 | 11 | % | |||||||||||||||||||||||||||
| Percentage of Total Revenue | 42 | % | 42 | % | 40 | % | 40 | % | |||||||||||||||||||||||||||
| REVENUE | $ | 482,672 | $ | 450,287 | 7 | % | $ | 1,942,884 | $ | 1,758,225 | 11 | % | |||||||||||||||||||||||
|
2 |
|||||||
| (Unaudited, In Thousands) | Three Months Ended June 30, |
% Change | Year Ended June 30, |
% Change | ||||||||||||||||||||||||||||||||||
| 2022 | 2021 | 2022 | 2021 | |||||||||||||||||||||||||||||||||||
| Cost of Revenue | $ | 286,815 | $ | 274,918 | 4 | % | $ | 1,128,614 | $ | 1,063,399 | 6 | % | ||||||||||||||||||||||||||
| Percentage of Total Revenue | 59 | % | 61 | % | 58 | % | 60 | % | ||||||||||||||||||||||||||||||
| Research and Development | 33,961 | 28,814 | 18 | % | 121,355 | 109,047 | 11 | % | ||||||||||||||||||||||||||||||
| Percentage of Total Revenue | 7 | % | 6 | % | 6 | % | 6 | % | ||||||||||||||||||||||||||||||
| Selling, General, and Administrative | 58,124 | 50,259 | 16 | % | 218,296 | 187,060 | 17 | % | ||||||||||||||||||||||||||||||
| Percentage of Total Revenue | 12 | % | 11 | % | 11 | % | 11 | % | ||||||||||||||||||||||||||||||
| OPERATING EXPENSES | 378,900 | 353,991 | 7 | % | 1,468,265 | 1,359,506 | 8 | % | ||||||||||||||||||||||||||||||
| OPERATING INCOME | $ | 103,772 | $ | 96,296 | 8 | % | $ | 474,619 | $ | 398,719 | 19 | % | ||||||||||||||||||||||||||
Operating Margin4 |
22 | % | 21 | % | 24 | % | 23 | % | ||||||||||||||||||||||||||||||
| (Unaudited, In Thousands, Except Per Share Data) |
Three Months Ended June 30, |
% Change | Year Ended June 30, |
% Change | |||||||||||||||||||||||||||||||
| 2022 | 2021 | 2022 | 2021 | ||||||||||||||||||||||||||||||||
| Income Before Income Taxes | $ | 102,792 | $ | 95,683 | 7 | % | $ | 472,267 | $ | 397,725 | 19 | % | |||||||||||||||||||||||
| Provision for Income Taxes | 22,366 | 18,821 | 19 | % | 109,351 | 86,256 | 27 | % | |||||||||||||||||||||||||||
| NET INCOME | $ | 80,426 | $ | 76,862 | 5 | % | $ | 362,916 | $ | 311,469 | 17 | % | |||||||||||||||||||||||
| Diluted earnings per share | $ | 1.10 | $ | 1.04 | 6 | % | $ | 4.94 | $ | 4.12 | 20 | % | |||||||||||||||||||||||
|
3 |
|||||||
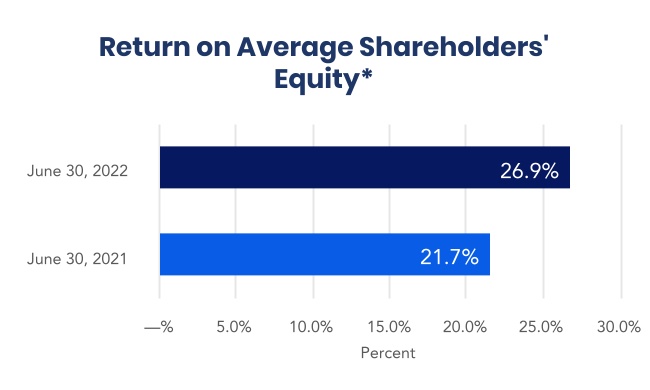
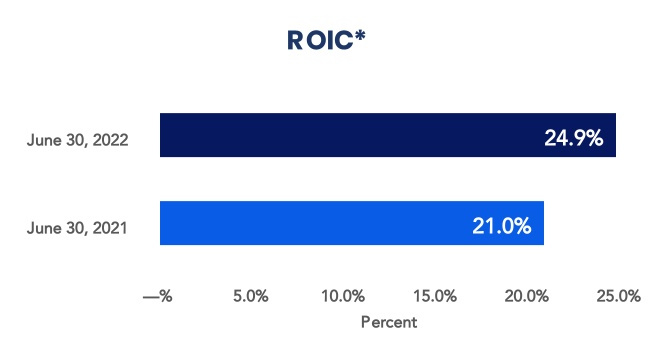
According to Kevin Williams, CFO and Treasurer, “For the fourth quarter of the fiscal year, our private cloud and processing services continue to drive revenue growth. As we guided in May our deconversion fees decreased in our fourth fiscal quarter compared to a year ago. We reported solid 7% GAAP and 8% non-GAAP revenue growth compared to the prior year quarter. Operating margins were flat on a GAAP basis due to lower deconversion revenue in the quarter, but nice margin expansion on a non-GAAP basis compared to the prior year. We continue to be pleased to report our Return on Average Shareholders’ Equity and Return on Invested Capital (ROIC) of 26.9% and 24.9%, for the trailing twelve months, respectively, which improved nicely from 21.7% and 21.0%, respectively, for those same financial performance metrics a year ago. Our dedicated team continues to follow the company motto of do the right thing and do whatever it takes to ensure the continued success of our customers.” | |||||||||||||||||
| (Unaudited, In Thousands) | Three Months Ended June 30, | % Change | Year Ended June 30, | % Change | |||||||||||||||||||||||||||||||
| 2022 | 2021 | 2022 | 2021 | ||||||||||||||||||||||||||||||||
| Revenue (GAAP) | $ | 482,672 | $ | 450,287 | 7 | % | $ | 1,942,884 | $ | 1,758,225 | 11 | % | |||||||||||||||||||||||
| Adjustments: | |||||||||||||||||||||||||||||||||||
| Deconversion fee revenue | (5,222) | (8,231) | (53,279) | (20,635) | |||||||||||||||||||||||||||||||
| Revenue from acquisitions and divestitures | — | — | (274) | (1,182) | |||||||||||||||||||||||||||||||
| NON-GAAP ADJUSTED REVENUE | $ | 477,450 | $ | 442,056 | 8 | % | $ | 1,889,331 | $ | 1,736,408 | 9 | % | |||||||||||||||||||||||
| Operating Income (GAAP) | $ | 103,772 | $ | 96,296 | 8 | % | $ | 474,619 | $ | 398,719 | 19 | % | |||||||||||||||||||||||
| Adjustments: | |||||||||||||||||||||||||||||||||||
| Operating income from deconversion fees | (3,980) | (7,617) | (47,002) | (18,721) | |||||||||||||||||||||||||||||||
| Operating (income)/loss from acquisitions, divestitures, and gain/loss | — | — | 371 | (2,409) | |||||||||||||||||||||||||||||||
| NON-GAAP ADJUSTED OPERATING INCOME | $ | 99,792 | $ | 88,679 | 13 | % | $ | 427,988 | $ | 377,589 | 13 | % | |||||||||||||||||||||||
|
4 |
|||||||
| (Unaudited, In Thousands) | Three Months Ended June 30, 2022 | ||||||||||||||||||||||||||||
| Core | Payments | Complementary | Corporate and Other | Total | |||||||||||||||||||||||||
| REVENUE | $ | 151,480 | $ | 177,323 | $ | 140,296 | $ | 13,573 | $ | 482,672 | |||||||||||||||||||
| Non-GAAP adjustments | (1,872) | (1,236) | (2,035) | (79) | (5,222) | ||||||||||||||||||||||||
| NON-GAAP ADJUSTED REVENUE | 149,608 | 176,087 | 138,261 | 13,494 | 477,450 | ||||||||||||||||||||||||
| COST OF REVENUE | 63,553 | 97,531 | 59,495 | 66,236 | 286,815 | ||||||||||||||||||||||||
| Non-GAAP adjustments | (341) | (122) | (260) | (3) | (726) | ||||||||||||||||||||||||
| NON-GAAP ADJUSTED COST OF REVENUE | 63,212 | 97,409 | 59,235 | 66,233 | 286,089 | ||||||||||||||||||||||||
| NON-GAAP ADJUSTED SEGMENT INCOME | $ | 86,396 | $ | 78,678 | $ | 79,026 | $ | (52,739) | |||||||||||||||||||||
| Research and Development | 33,961 | ||||||||||||||||||||||||||||
| Selling, General, and Administrative | 58,124 | ||||||||||||||||||||||||||||
| Non-GAAP adjustments unassigned to a segment | (516) | ||||||||||||||||||||||||||||
| NON-GAAP TOTAL ADJUSTED OPERATING EXPENSES | 377,658 | ||||||||||||||||||||||||||||
| NON-GAAP ADJUSTED OPERATING INCOME | $ | 99,792 | |||||||||||||||||||||||||||
| (Unaudited, In Thousands) | Three Months Ended June 30, 2021 | ||||||||||||||||||||||||||||
| Core | Payments | Complementary | Corporate and Other | Total | |||||||||||||||||||||||||
| REVENUE (GAAP) | $ | 140,843 | $ | 169,551 | $ | 128,735 | $ | 11,158 | $ | 450,287 | |||||||||||||||||||
| Non-GAAP adjustments | (3,162) | (1,852) | (3,189) | (28) | (8,231) | ||||||||||||||||||||||||
| NON-GAAP ADJUSTED REVENUE | 137,681 | 167,699 | 125,546 | 11,130 | 442,056 | ||||||||||||||||||||||||
| COST OF REVENUE | 61,579 | 93,170 | 53,990 | 66,179 | 274,918 | ||||||||||||||||||||||||
| Non-GAAP adjustments | (129) | (107) | (189) | — | (425) | ||||||||||||||||||||||||
| NON-GAAP ADJUSTED COST OF REVENUE | 61,450 | 93,063 | 53,801 | 66,179 | 274,493 | ||||||||||||||||||||||||
| NON-GAAP ADJUSTED SEGMENT INCOME | $ | 76,231 | $ | 74,636 | $ | 71,745 | $ | (55,049) | |||||||||||||||||||||
| Research and Development | 28,814 | ||||||||||||||||||||||||||||
| Selling, General, and Administrative | 50,259 | ||||||||||||||||||||||||||||
| Non-GAAP adjustments unassigned to a segment | (189) | ||||||||||||||||||||||||||||
| NON-GAAP TOTAL ADJUSTED OPERATING EXPENSES | 353,377 | ||||||||||||||||||||||||||||
| NON-GAAP ADJUSTED OPERATING INCOME | $ | 88,679 | |||||||||||||||||||||||||||
|
5 |
|||||||
| (Unaudited, In Thousands) | Year Ended June 30, 2022 | ||||||||||||||||||||||||||||
| Core | Payments | Complementary | Corporate and Other | Total | |||||||||||||||||||||||||
| Revenue | $ | 622,442 | $ | 707,019 | $ | 561,211 | $ | 52,212 | $ | 1,942,884 | |||||||||||||||||||
| Non-GAAP adjustments | (23,048) | (14,319) | (15,863) | (323) | (53,553) | ||||||||||||||||||||||||
| Non-GAAP Adjusted Revenue | 599,394 | 692,700 | 545,348 | 51,889 | 1,889,331 | ||||||||||||||||||||||||
| Cost of Revenue | 261,585 | 380,954 | 232,088 | 253,987 | 1,128,614 | ||||||||||||||||||||||||
| Non-GAAP adjustments | (1,719) | (439) | (1,510) | (327) | (3,995) | ||||||||||||||||||||||||
| Non-GAAP Adjusted Cost of Revenue | 259,866 | 380,515 | 230,578 | 253,660 | 1,124,619 | ||||||||||||||||||||||||
| Non-GAAP Adjusted Segment Income | $ | 339,528 | $ | 312,185 | $ | 314,770 | $ | (201,771) | |||||||||||||||||||||
| Research and Development | 121,355 | ||||||||||||||||||||||||||||
| Selling, General, and Administrative | 218,296 | ||||||||||||||||||||||||||||
| Non-GAAP adjustments unassigned to a segment | (2,927) | ||||||||||||||||||||||||||||
| Non-GAAP Total Adjusted Operating Expenses | 1,461,343 | ||||||||||||||||||||||||||||
| Non-GAAP Adjusted Operating Income | $ | 427,988 | |||||||||||||||||||||||||||
| (Unaudited, In Thousands) | Year Ended June 30, 2021 | ||||||||||||||||||||||||||||
| Core | Payments | Complementary | Corporate and Other | Total | |||||||||||||||||||||||||
| Revenue | $ | 564,096 | $ | 642,308 | $ | 505,928 | $ | 45,893 | $ | 1,758,225 | |||||||||||||||||||
| Non-GAAP adjustments | (8,638) | (6,285) | (6,777) | (117) | (21,817) | ||||||||||||||||||||||||
| Non-GAAP Adjusted Revenue | 555,458 | 636,023 | 499,151 | 45,776 | 1,736,408 | ||||||||||||||||||||||||
| Cost of Revenue | 247,150 | 353,581 | 212,627 | 250,041 | 1,063,399 | ||||||||||||||||||||||||
| Non-GAAP adjustments | (1,178) | (215) | (617) | (52) | (2,062) | ||||||||||||||||||||||||
| Non-GAAP Adjusted Cost of Revenue | 245,972 | 353,366 | 212,010 | 249,989 | 1,061,337 | ||||||||||||||||||||||||
| Non- GAAP Adjusted Segment Income | $ | 309,486 | $ | 282,657 | $ | 287,141 | $ | (204,213) | |||||||||||||||||||||
| Research and Development | 109,047 | ||||||||||||||||||||||||||||
| Selling, General, and Administrative | 187,060 | ||||||||||||||||||||||||||||
| Non-GAAP adjustments unassigned to a segment | 1,375 | ||||||||||||||||||||||||||||
| Non-GAAP Total Adjusted Operating Expenses | 1,358,819 | ||||||||||||||||||||||||||||
| Non-GAAP Adjusted Operating Income | $ | 377,589 | |||||||||||||||||||||||||||
|
6 |
|||||||
| GAAP to Non-GAAP GUIDANCE (In Millions, except per share data) | Annual FY23 | ||||||||||||||||
| Low | High | ||||||||||||||||
| REVENUE (GAAP) | $ | 2,080 | $ | 2,087 | |||||||||||||
| Growth | 7.1 | % | 7.4 | % | |||||||||||||
| Deconversion Fee Revenue | 35 | 35 | |||||||||||||||
| NON-GAAP ADJUSTED REVENUE | $ | 2,045 | $ | 2,052 | |||||||||||||
Non-GAAP Adjusted Growth* |
8.2 | % | 8.6 | % | |||||||||||||
| EPS (GAAP) | $ | 5.05 | $ | 5.09 | |||||||||||||
| Growth | 2.1 | % | 3.1 | % | |||||||||||||
|
7 |
|||||||
| (Unaudited, In Thousands) | Year Ended June 30, | ||||||||||
| 2022 | 2021 | ||||||||||
| Net income | $ | 362,916 | $ | 311,469 | |||||||
| Depreciation | 50,789 | 52,515 | |||||||||
| Amortization | 126,835 | 123,233 | |||||||||
| Change in deferred income taxes | 31,872 | 16,760 | |||||||||
| Other non-cash expenses | 25,180 | 18,758 | |||||||||
| Change in receivables | (41,508) | (6,112) | |||||||||
| Change in deferred revenue | 6,572 | 6,541 | |||||||||
| Change in other assets and liabilities | (58,025) | (61,035) | |||||||||
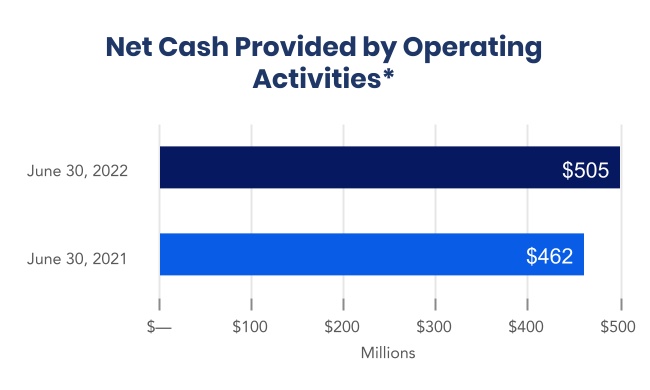
| NET CASH PROVIDED BY OPERATING ACTIVITIES | $ | 504,631 | $ | 462,129 | |||||||
| (Unaudited, In Thousands) | Year Ended June 30, | ||||||||||
| 2022 | 2021 | ||||||||||
| Payment for acquisitions, net of cash acquired | $ | — | $ | (2,300) | |||||||
| Capital expenditures | (34,659) | (22,988) | |||||||||
| Proceeds from dispositions | 45 | 6,187 | |||||||||
| Purchased software | (8,491) | (6,506) | |||||||||
| Computer software developed | (148,239) | (128,343) | |||||||||
| Purchase of investments | (5,000) | (13,300) | |||||||||
| Proceeds from investments | — | 5,000 | |||||||||
| NET CASH FROM INVESTING ACTIVITIES | $ | (196,344) | $ | (162,250) | |||||||
| (Unaudited, In Thousands) | Year Ended June 30, | ||||||||||
| 2022 | 2021 | ||||||||||
| Borrowings on credit facilities* | $ | 332,000 | $ | 200,000 | |||||||
| Repayments on credit facilities and financing leases | (317,127) | (100,114) | |||||||||
| Purchase of treasury stock* | (193,916) | (431,529) | |||||||||
| Dividends paid | (139,070) | (133,800) | |||||||||
| Net cash from issuance of stock and tax related to stock-based compensation | 7,621 | 3,211 | |||||||||
| NET CASH FROM FINANCING ACTIVITIES | $ | (310,492) | $ | (462,232) | |||||||
|
8 |
|||||||
|
9 |
|||||||
About Jack Henry & Associates, Inc.® |
 |
Quarterly Conference Call | ||||||||||||
Jack Henry (NASDAQ: JKHY) is a well-rounded leading provider of technology solutions primarily for the financial services industry. We are an S&P 500 company that serves approximately 7,850 clients nationwide. We provide core innovative solutions to community and regional banks; core industry-leading solutions to credit unions of all sizes; and non-core highly specialized solutions to financial institutions of every asset size, as well as diverse corporate entities outside of the financial services industry. With a heritage that has been dedicated to openness, partnership, and user centricity for more than 40 years, we are well-positioned as a driving market force in future-ready digital solutions and payment processing services. We empower our clients and consumers with the human-centered, tech-forward, and insights-driven solutions that will get them where they want to go. Are you future ready? Additional information is available at www.jackhenry.com. |
The Company will hold a conference call on August 17, 2022; at 7:45 a.m. Central Time and investors are invited to listen at www.jackhenry.com. A webcast replay will be available approximately one hour after the event at ir.jackhenry.com/events-and-presentations and will remain available for one year. |
|||||||||||||
Statements made in this news release that are not historical facts are "forward-looking statements" within the meaning of the Private Securities Litigation Reform Act of 1995, Section 27A of the Securities Act of 1933 and Section 21E of the Securities Exchange Act of 1934. Because forward-looking statements relate to the future, they are subject to inherent risks and uncertainties that could cause actual results to differ materially from those expressed or implied by such statements. Such risks and uncertainties include, but are not limited to, those discussed in the Company's Securities and Exchange Commission filings, including the Company's most recent reports on Form 10-K and Form 10-Q, particularly under the heading Risk Factors. Any forward-looking statement made in this news release speaks only as of the date of the news release, and the Company expressly disclaims any obligation to publicly update or revise any forward-looking statement, whether because of new information, future events or otherwise. |
 |
MEDIA CONTACT | ||||||||||||
| Mark Folk | ||||||||||||||
| Corporate Communications | ||||||||||||||
| Jack Henry & Associates, Inc. | ||||||||||||||
| 704-890-5323 | ||||||||||||||
| MFolk@jackhenry.com | ||||||||||||||
| ANALYST CONTACT | ||||||||||||||
| Vance Sherard, CFA | ||||||||||||||
| Investor Relations | ||||||||||||||
| Jack Henry & Associates, Inc. | ||||||||||||||
| 417-235-6652 | ||||||||||||||
| VSherard@jackhenry.com | ||||||||||||||
|
10 |
|||||||
| Condensed Consolidated Statements of Income (Unaudited) | |||||||||||||||||||||||||||||||||||
| (In Thousands, except per share data) | Three Months Ended June 30, | % Change | Year Ended June 30, | % Change | |||||||||||||||||||||||||||||||
| 2022 | 2021 | 2022 | 2021 | ||||||||||||||||||||||||||||||||
| REVENUE | $ | 482,672 | $ | 450,287 | 7 | % | $ | 1,942,884 | $ | 1,758,225 | 11 | % | |||||||||||||||||||||||
| Cost of Revenue | 286,815 | 274,918 | 4 | % | 1,128,614 | 1,063,399 | 6 | % | |||||||||||||||||||||||||||
| Research and Development | 33,961 | 28,814 | 18 | % | 121,355 | 109,047 | 11 | % | |||||||||||||||||||||||||||
| Selling, General, and Administrative | 58,124 | 50,259 | 16 | % | 218,296 | 187,060 | 17 | % | |||||||||||||||||||||||||||
| EXPENSES | 378,900 | 353,991 | 7 | % | 1,468,265 | 1,359,506 | 8 | % | |||||||||||||||||||||||||||
| OPERATING INCOME | 103,772 | 96,296 | 8 | % | 474,619 | 398,719 | 19 | % | |||||||||||||||||||||||||||
| Interest income | 17 | 6 | 183 | % | 32 | 150 | (79) | % | |||||||||||||||||||||||||||
| Interest expense | (997) | (619) | 61 | % | (2,384) | (1,144) | 108 | % | |||||||||||||||||||||||||||
| Interest Income (Expense) | (980) | (613) | 60 | % | (2,352) | (994) | 137 | % | |||||||||||||||||||||||||||
| INCOME BEFORE INCOME TAXES | 102,792 | 95,683 | 7 | % | 472,267 | 397,725 | 19 | % | |||||||||||||||||||||||||||
| Provision for Income Taxes | 22,366 | 18,821 | 19 | % | 109,351 | 86,256 | 27 | % | |||||||||||||||||||||||||||
| NET INCOME | $ | 80,426 | $ | 76,862 | 5 | % | $ | 362,916 | $ | 311,469 | 17 | % | |||||||||||||||||||||||
| Diluted net income per share | $ | 1.10 | $ | 1.04 | $ | 4.94 | $ | 4.12 | |||||||||||||||||||||||||||
| Diluted weighted average shares outstanding | 73,086 | 74,211 | 73,486 | 75,658 | |||||||||||||||||||||||||||||||
| Consolidated Balance Sheet Highlights (Unaudited) | |||||||||||||||||||||||||||||||||||
| (In Thousands) | June 30, | % Change | |||||||||||||||||||||||||||||||||
| 2022 | 2021 | ||||||||||||||||||||||||||||||||||
| Cash and cash equivalents | $ | 48,787 | $ | 50,992 | (4) | % | |||||||||||||||||||||||||||||
| Receivables | 348,072 | 306,564 | 14 | % | |||||||||||||||||||||||||||||||
| Total assets | 2,455,564 | 2,336,156 | 5 | % | |||||||||||||||||||||||||||||||
| Accounts payable and accrued expenses | $ | 213,076 | $ | 201,002 | 6 | % | |||||||||||||||||||||||||||||
| Current and long-term debt | 115,067 | 100,193 | 15 | % | |||||||||||||||||||||||||||||||
| Deferred revenue | 402,172 | 395,600 | 2 | % | |||||||||||||||||||||||||||||||
| Stockholders' equity | 1,381,623 | 1,319,292 | 5 | % | |||||||||||||||||||||||||||||||
|
11 |
|||||||
| Calculation of Non-GAAP Earnings Before Income Taxes, Depreciation and Amortization (Non-GAAP EBITDA) | |||||||||||||||||||||||||||||||||||
| Three Months Ended June 30, | % Change | Year Ended June 30, | % Change | ||||||||||||||||||||||||||||||||
| (in thousands) | 2022 | 2021 | 2022 | 2021 | |||||||||||||||||||||||||||||||
| Net income | $ | 80,426 | $ | 76,862 | $ | 362,916 | $ | 311,469 | |||||||||||||||||||||||||||
| Interest expense | 997 | 619 | 2,384 | 1,144 | |||||||||||||||||||||||||||||||
| Taxes | 22,366 | 18,821 | 109,351 | 86,256 | |||||||||||||||||||||||||||||||
| Depreciation and amortization | 44,722 | 43,743 | 177,624 | 175,748 | |||||||||||||||||||||||||||||||
| Less: Net income before interest expense, taxes, depreciation and amortization attributable to eliminated one-time deconversions, acquisitions and divestitures, and gain/loss | (3,980) | (7,616) | (46,677) | (21,488) | |||||||||||||||||||||||||||||||
| NON-GAAP EBITDA | $ | 144,531 | $ | 132,429 | 9 | % | $ | 605,598 | $ | 553,129 | 10 | % | |||||||||||||||||||||||
| Calculation of Free Cash Flow (Non-GAAP) | |||||||||||||||||||||||||||||||||||
| Year Ended June 30, | |||||||||||||||||||||||||||||||||||
| (in thousands) | 2022 | 2021 | |||||||||||||||||||||||||||||||||
| Net cash from operating activities | $ | 504,631 | $ | 462,129 | |||||||||||||||||||||||||||||||
| Capitalized expenditures | (34,659) | (22,988) | |||||||||||||||||||||||||||||||||
| Internal use software | (8,491) | (6,506) | |||||||||||||||||||||||||||||||||
| Proceeds from sale of assets | 45 | 6,187 | |||||||||||||||||||||||||||||||||
| Capitalized software | (148,239) | (128,343) | |||||||||||||||||||||||||||||||||
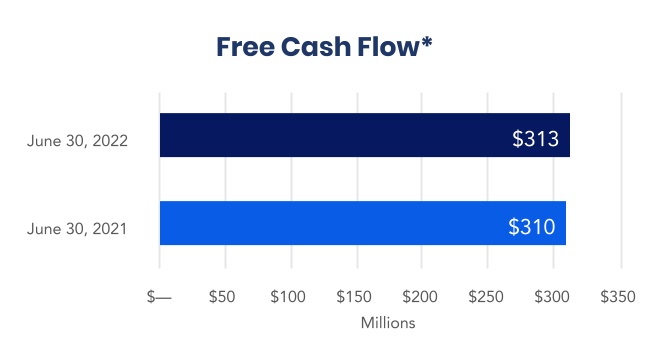
| FREE CASH FLOW | $ | 313,287 | $ | 310,479 | |||||||||||||||||||||||||||||||
| Calculation of the Return on Average Shareholders’ Equity | |||||||||||||||||||||||||||||||||||
| June 30, | |||||||||||||||||||||||||||||||||||
| ( in thousands) | 2022 | 2021 | |||||||||||||||||||||||||||||||||
| Net income (trailing four quarters) | $ | 362,916 | $ | 311,469 | |||||||||||||||||||||||||||||||
| Average stockholder's equity (period ending balances) | 1,350,457 | 1,434,490 | |||||||||||||||||||||||||||||||||
| RETURN ON AVERAGE SHAREHOLDERS’ EQUITY | 26.9% | 21.7% | |||||||||||||||||||||||||||||||||
| Calculation of Return on Invested Capital (ROIC) (Non-GAAP) | |||||||||||||||||||||||||||||||||||
| June 30, | |||||||||||||||||||||||||||||||||||
| (in thousands) | 2022 | 2021 | |||||||||||||||||||||||||||||||||
| Net income (trailing four quarters) | $ | 362,916 | $ | 311,469 | |||||||||||||||||||||||||||||||
| Average stockholder's equity (period ending balances) | 1,350,457 | 1,434,490 | |||||||||||||||||||||||||||||||||
| Average current maturities of long-term debt (period ending balances) | 89 | 113 | |||||||||||||||||||||||||||||||||
| Average long-term debt (period ending balances) | 107,542 | 50,146 | |||||||||||||||||||||||||||||||||
| Average invested capital | $ | 1,458,088 | $ | 1,484,749 | |||||||||||||||||||||||||||||||
| ROIC | 24.9% | 21.0% | |||||||||||||||||||||||||||||||||
|
12 |
|||||||