| Indiana | 000-10792 | 35-1562417 | ||||||
| (State or other jurisdiction of incorporation) | (Commission File Number) | (IRS Employer Identification No.) | ||||||
| Title of Each Class | Trading Symbol(s) | Name of each exchange on which registered | ||||||
| Common stock, no par value | HBNC | The NASDAQ Stock Market, LLC | ||||||
| (d) Exhibits | |||||||||||
| EXHIBIT INDEX | |||||||||||
| Exhibit No. | Description | Location | |||||||||
| 99.1 | Attached | ||||||||||
| 99.2 | |||||||||||
| 104 | Cover Page Interactive Data File (Embedded within the Inline XBRL document) | Within the Inline XBRL document | |||||||||
| Date: | January 25, 2023 | HORIZON BANCORP, INC. | |||||||||
| By: | /s/ Mark E. Secor | ||||||||||
| Mark E. Secor, | |||||||||||
| Executive Vice President & Chief Financial Officer | |||||||||||

| Contact: | Mark E. Secor | ||||
| Chief Financial Officer | |||||
| Phone: | (219) 873-2611 | ||||
| Fax: | (219) 874-9280 | ||||
| Date: | January 25, 2023 | ||||
| For the Three Months Ended | ||||||||||||||||||||
| December 31, | September 30, | December 31, | ||||||||||||||||||
| Net Interest Income and Net Interest Margin | 2022 | 2022 | 2021 | |||||||||||||||||
| Net interest income | $ | 48,782 | $ | 51,861 | $ | 48,477 | ||||||||||||||
| Net interest margin | 2.85 | % | 3.04 | % | 2.87 | % | ||||||||||||||
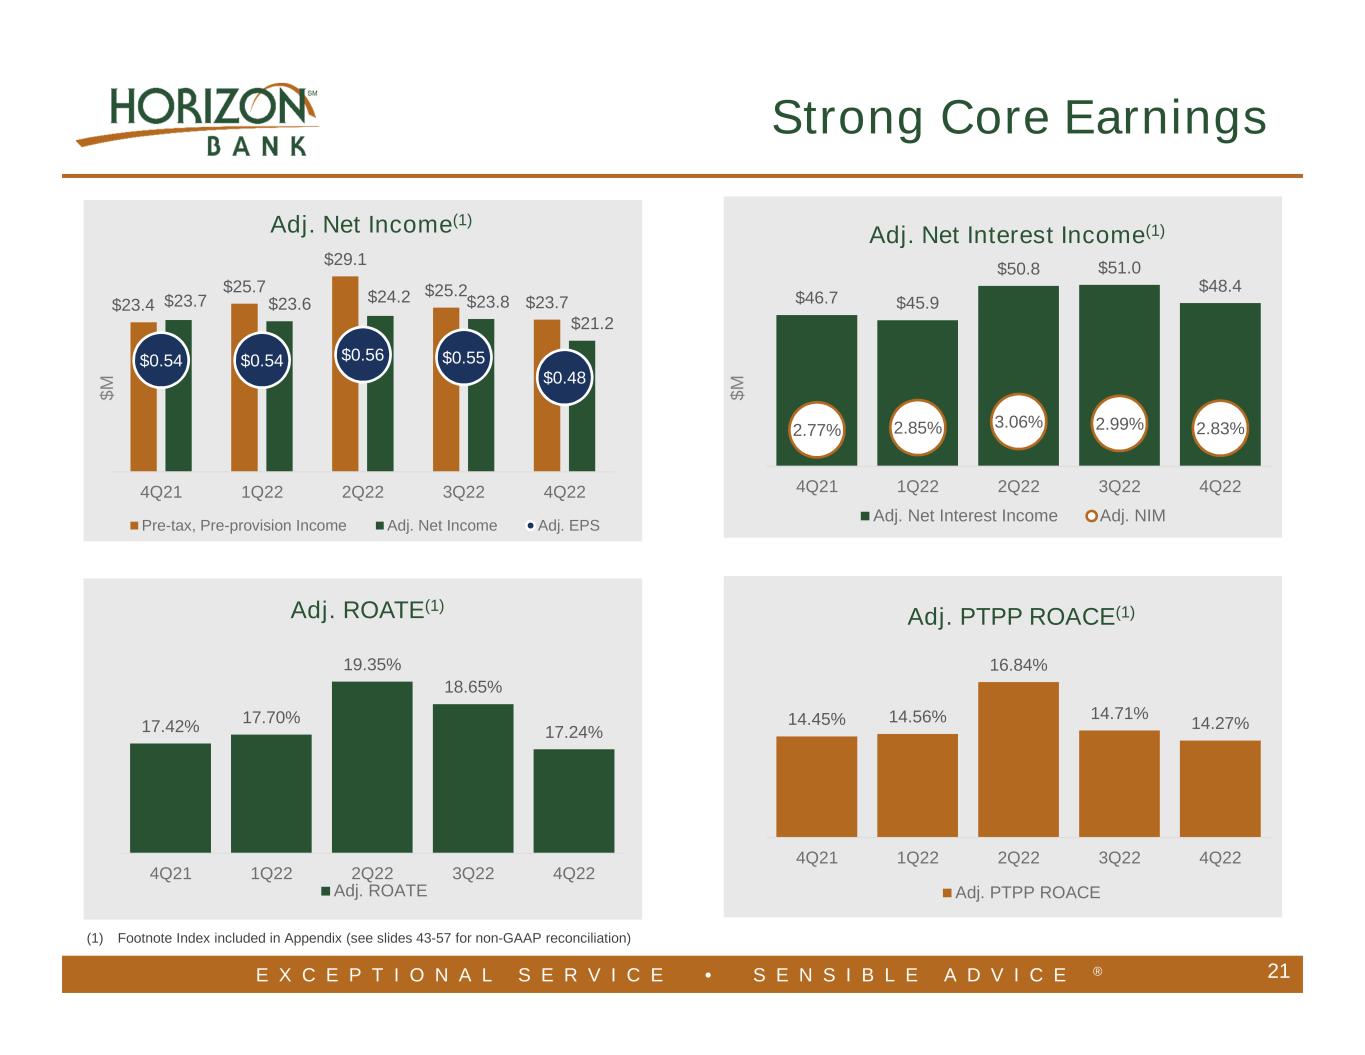
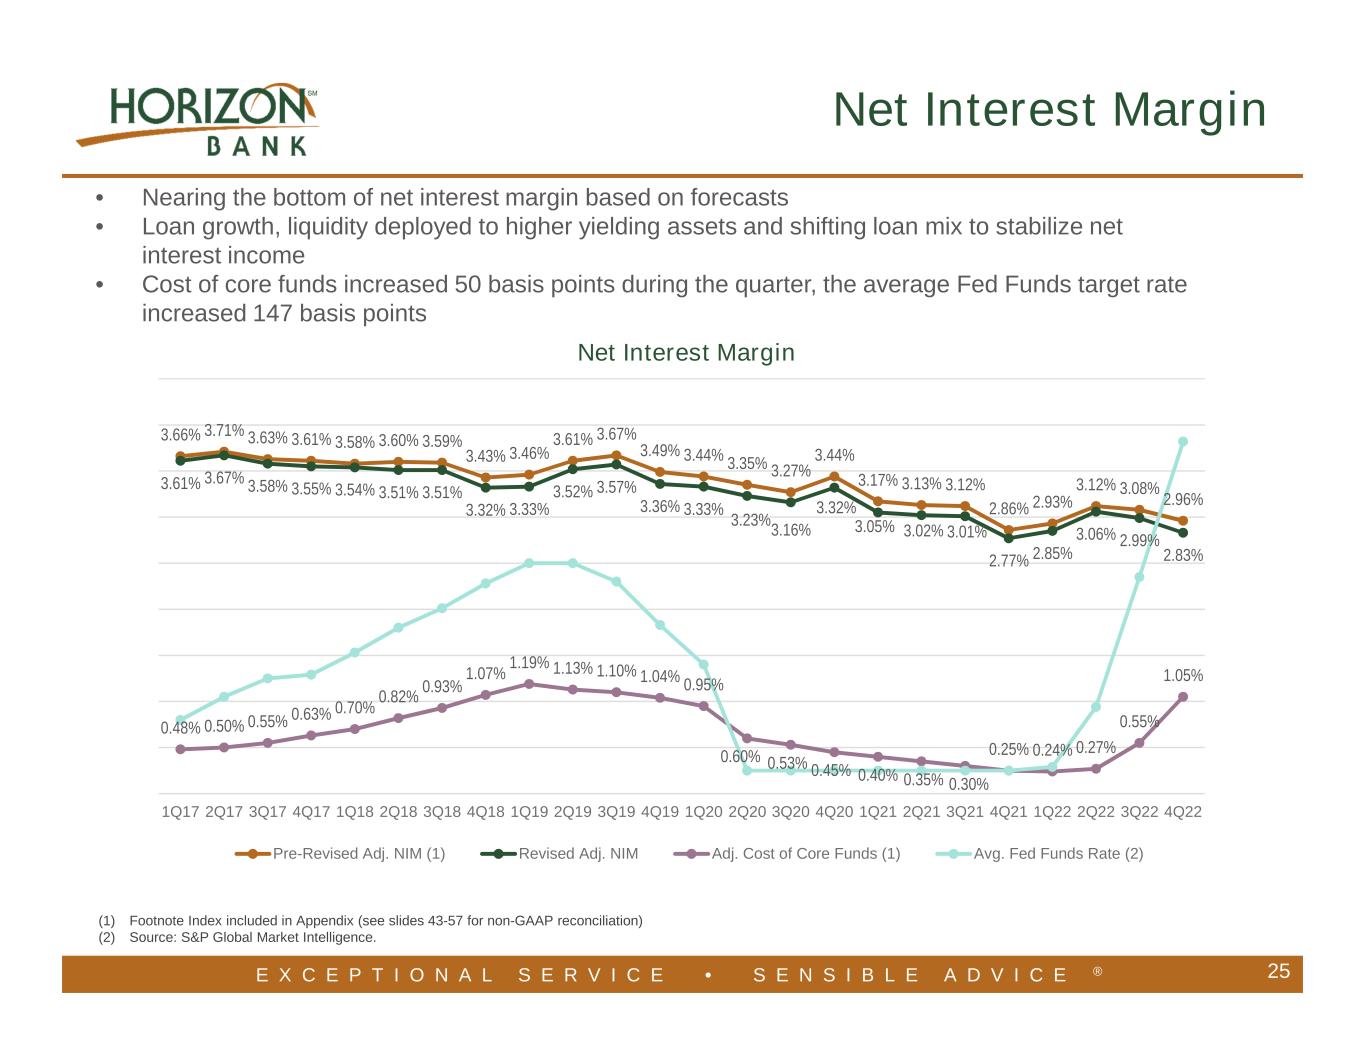
| Adjusted net interest margin | 2.83 | % | 2.99 | % | 2.77 | % | ||||||||||||||
| For the Three Months Ended | ||||||||||||||||||||
| December 31, | September 30, | December 31, | ||||||||||||||||||
| Asset Yields and Funding Costs | 2022 | 2022 | 2021 | |||||||||||||||||
| Interest earning assets | 3.88 | % | 3.58 | % | 3.11 | % | ||||||||||||||
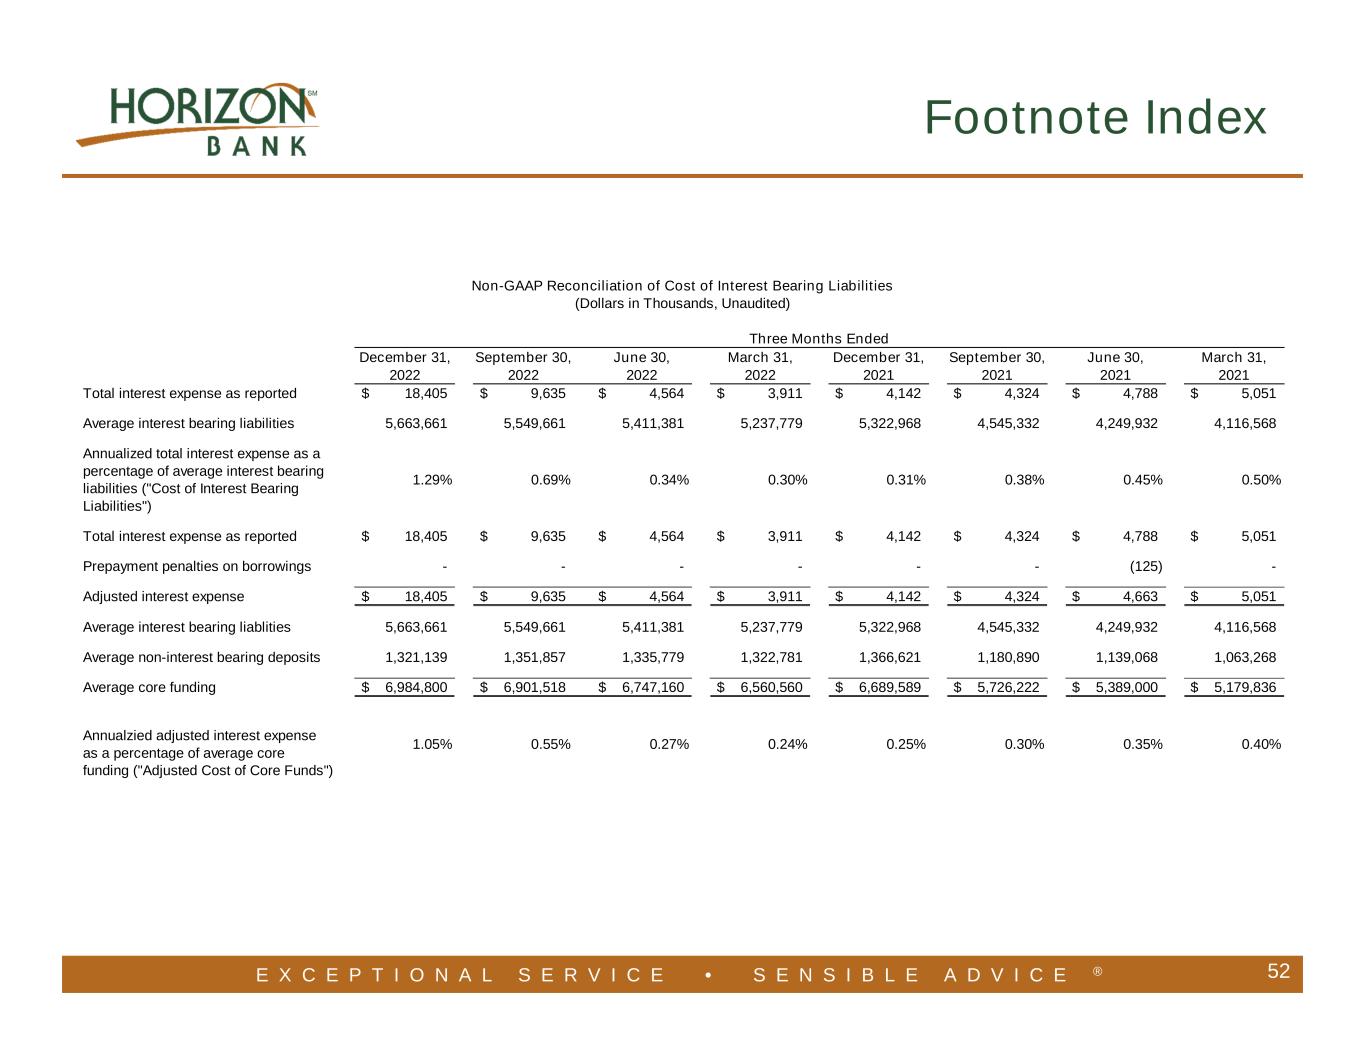
| Interest bearing liabilities | 1.29 | % | 0.69 | % | 0.31 | % | ||||||||||||||
| For the Three Months Ended | ||||||||||||||||||||
| Non–interest Income and | December 31, | September 30, | December 31, | |||||||||||||||||
| Mortgage Banking Income | 2022 | 2022 | 2021 | |||||||||||||||||
| Total non–interest income | $ | 10,674 | $ | 10,188 | $ | 12,828 | ||||||||||||||
| Gain on sale of mortgage loans | 1,196 | 1,441 | 4,167 | |||||||||||||||||
| Mortgage servicing income net of impairment | 637 | 355 | 300 | |||||||||||||||||
| For the Three Months Ended | ||||||||||||||||||||
| December 31, | September 30, | December 31, | ||||||||||||||||||
| Non–interest Expense | 2022 | 2022 | 2021 | |||||||||||||||||
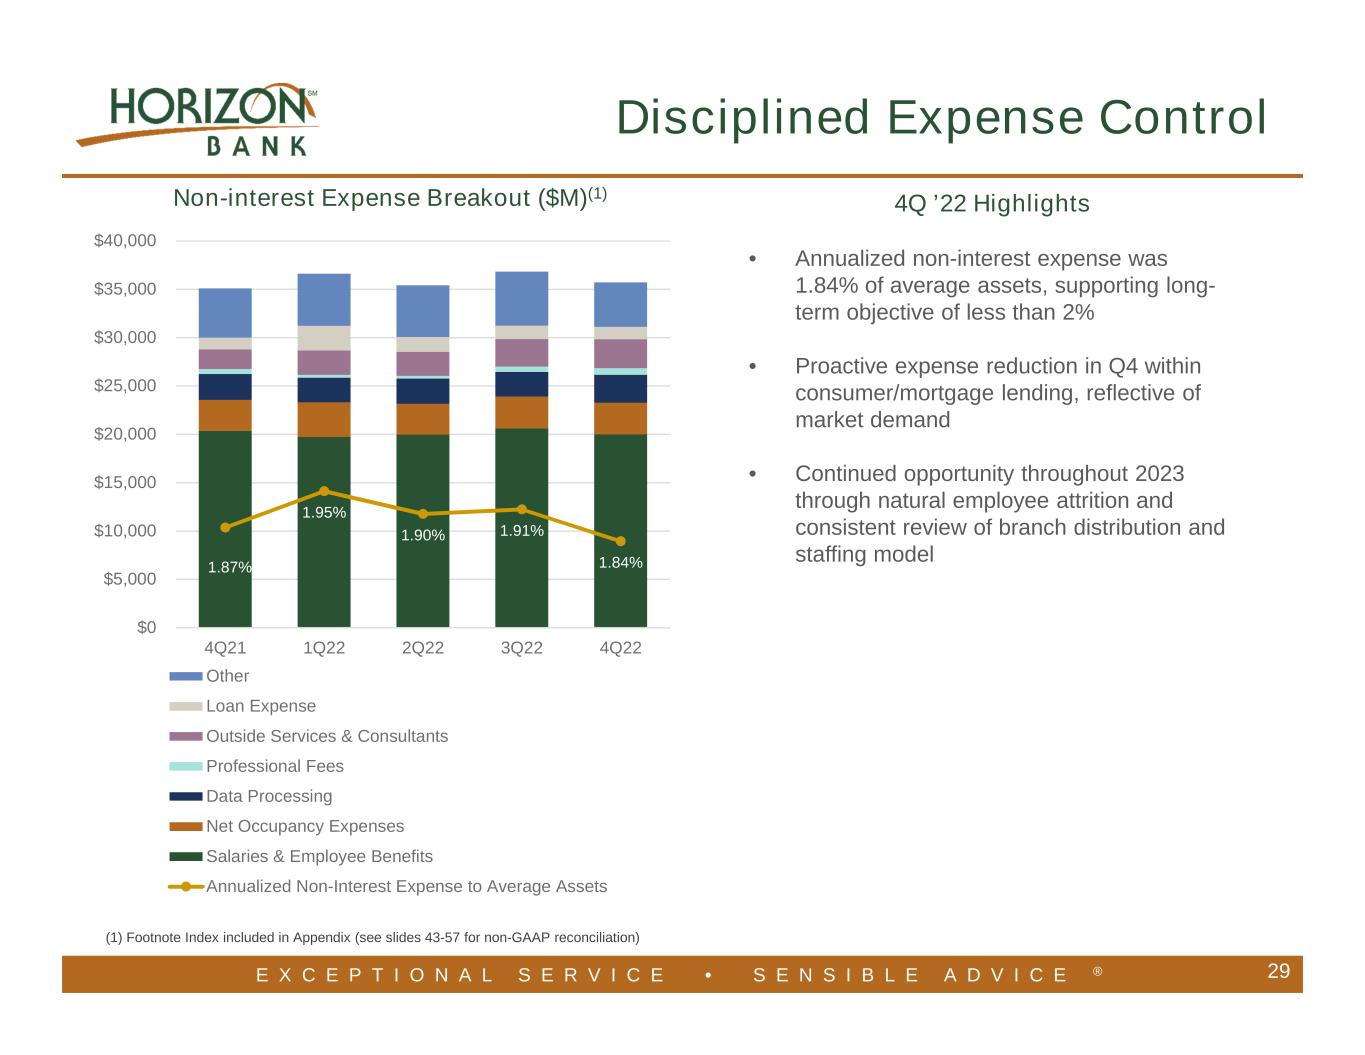
| Total non–interest expense | $ | 35,711 | $ | 36,816 | $ | 37,871 | ||||||||||||||
| Annualized non–interest expense to average assets | 1.84 | % | 1.91 | % | 2.01 | % | ||||||||||||||
| For the Three Months Ended | ||||||||||||||||||||
| December 31, | September 30, | December 31, | ||||||||||||||||||
| Credit Quality | 2022 | 2022 | 2021 | |||||||||||||||||
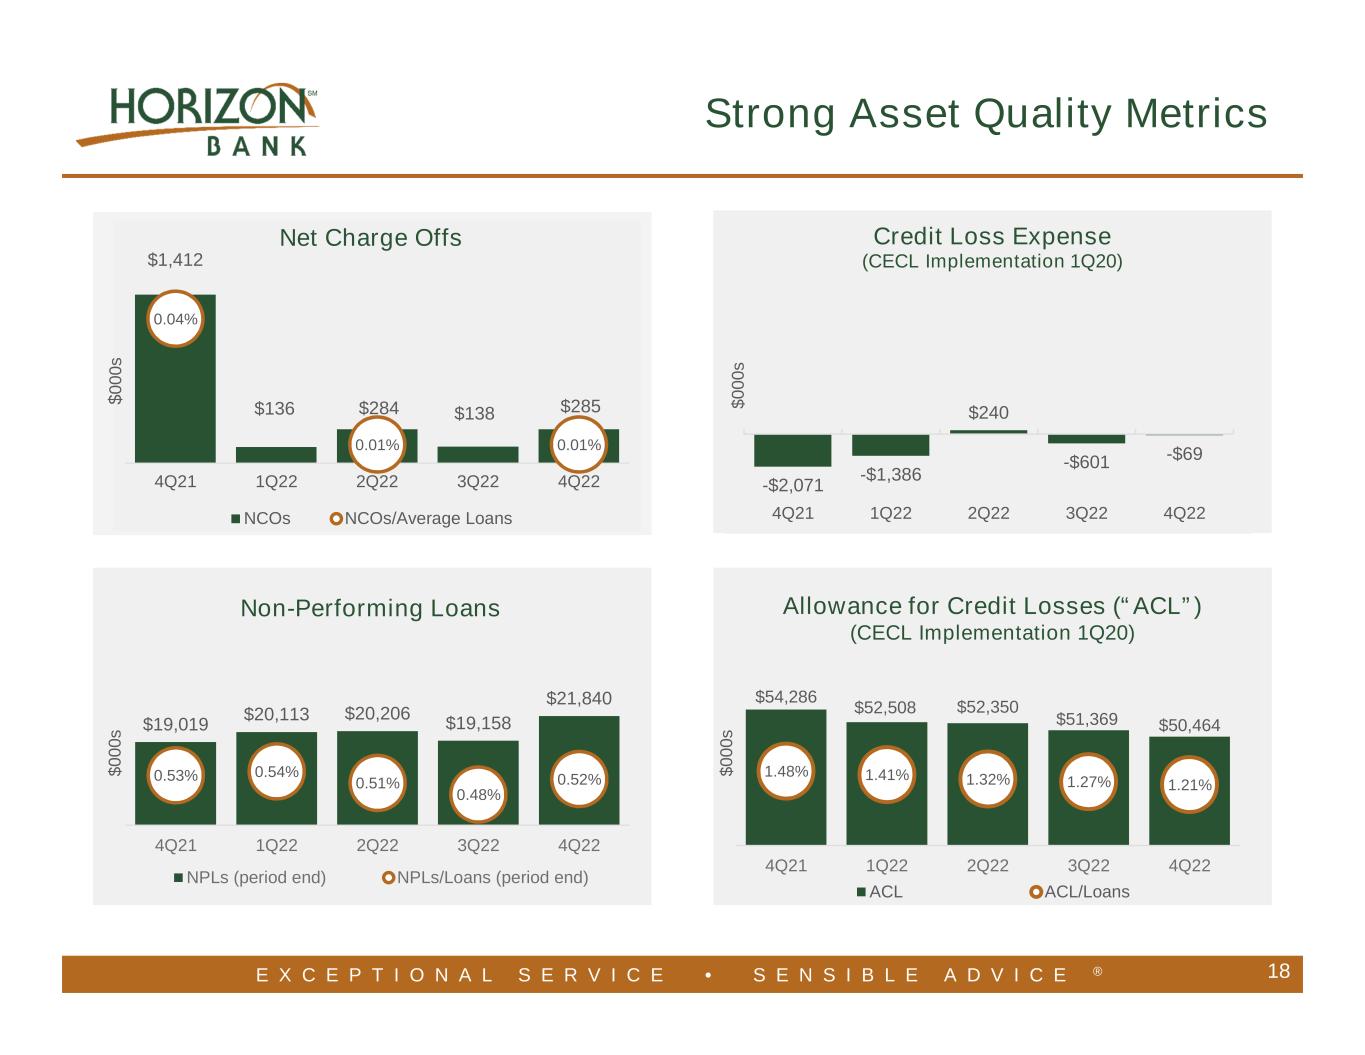
| Allowance for credit losses to total loans | 1.21 | % | 1.27 | % | 1.48 | % | ||||||||||||||
| Non–performing loans to total loans | 0.52 | % | 0.47 | % | 0.52 | % | ||||||||||||||
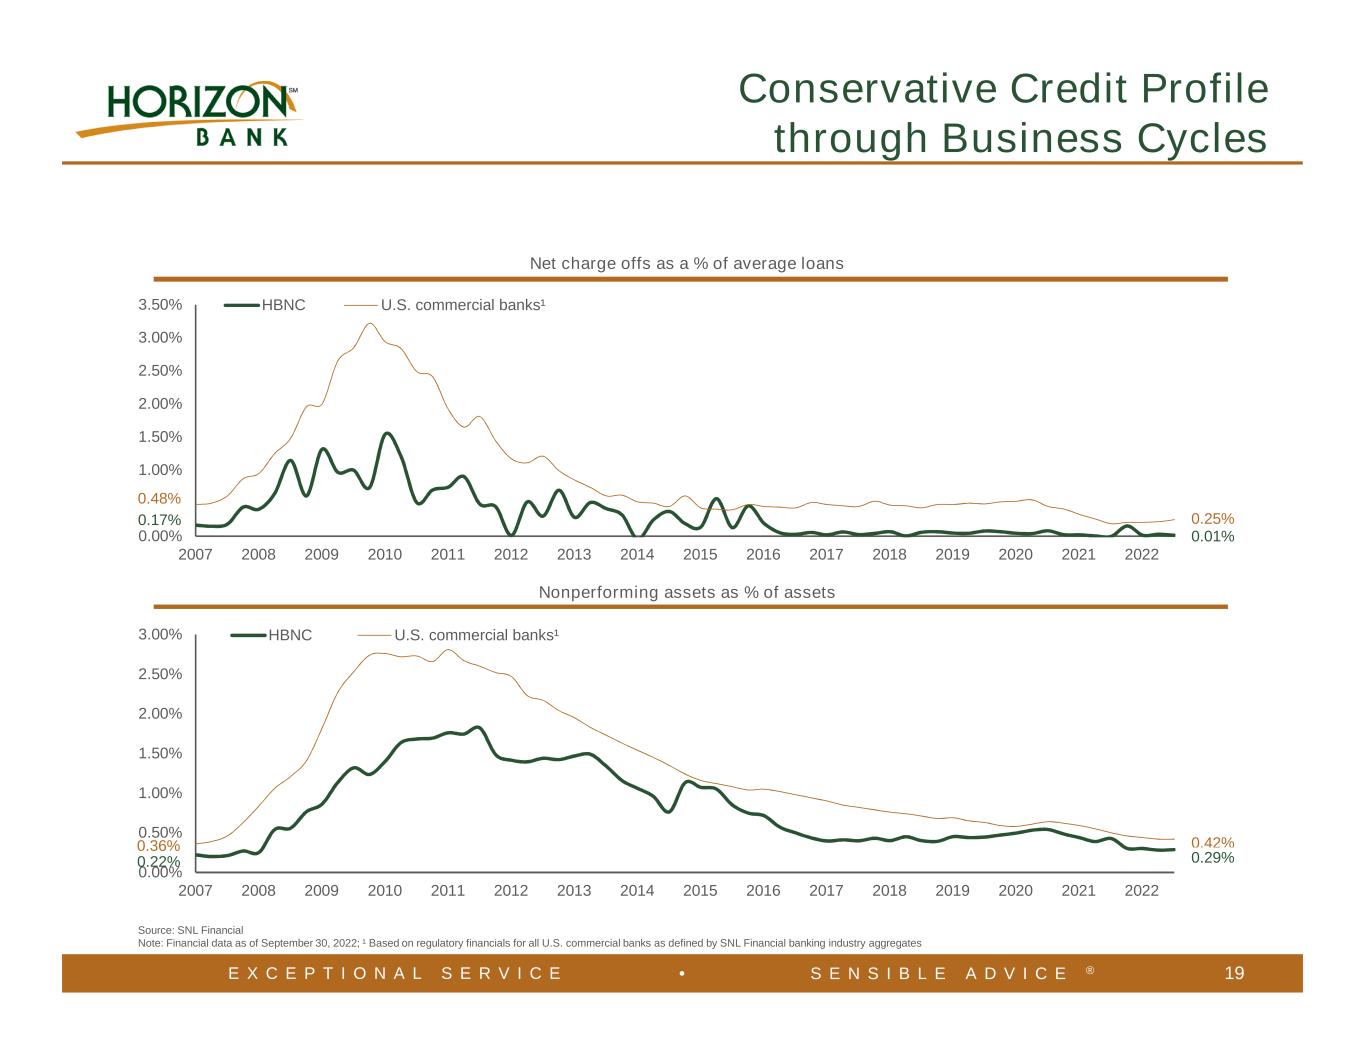
| Percent of net charge–offs to average loans outstanding for the period | 0.01 | % | 0.00 | % | 0.04 | % | ||||||||||||||
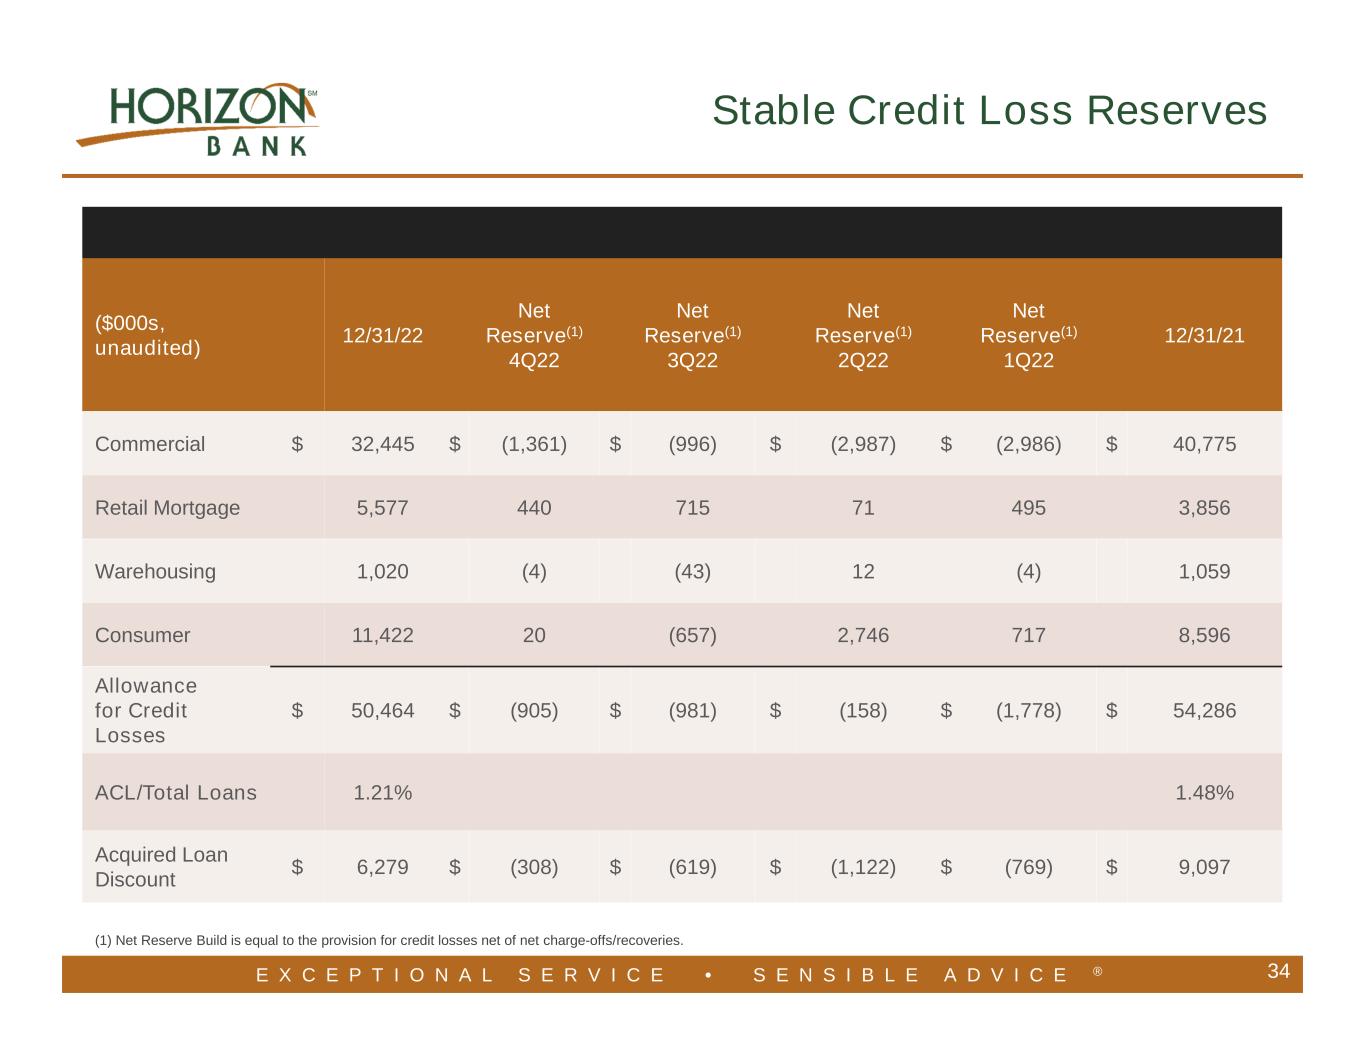
| Allowance for | December 31, | Net Reserve | December 31, | |||||||||||||||||||||||||||||||||||
| Credit Losses | 2022 | 4Q22 | 3Q22 | 2Q22 | 1Q22 | 2021 | ||||||||||||||||||||||||||||||||
| Commercial | $ | 32,445 | $ | (1,361) | $ | (996) | $ | (2,987) | $ | (2,986) | $ | 40,775 | ||||||||||||||||||||||||||
| Retail Mortgage | 5,577 | 440 | 715 | 71 | 495 | 3,856 | ||||||||||||||||||||||||||||||||
| Warehouse | 1,020 | (4) | (43) | 12 | (4) | 1,059 | ||||||||||||||||||||||||||||||||
| Consumer | 11,422 | 20 | (657) | 2,746 | 717 | 8,596 | ||||||||||||||||||||||||||||||||
| Allowance for Credit Losses (“ACL”) | $ | 50,464 | $ | (905) | $ | (981) | $ | (158) | $ | (1,778) | $ | 54,286 | ||||||||||||||||||||||||||
| ACL / Total Loans | 1.21 | % | 1.48 | % | ||||||||||||||||||||||||||||||||||
| Acquired Loan Discount (“ALD”) | $ | 6,279 | $ | (308) | $ | (619) | $ | (1,122) | $ | (769) | $ | 9,097 | ||||||||||||||||||||||||||
| Three Months Ended | ||||||||||||||||||||||||||||||||||||||
| December 31, | December 31, | |||||||||||||||||||||||||||||||||||||
| 2022 | 2021 | |||||||||||||||||||||||||||||||||||||
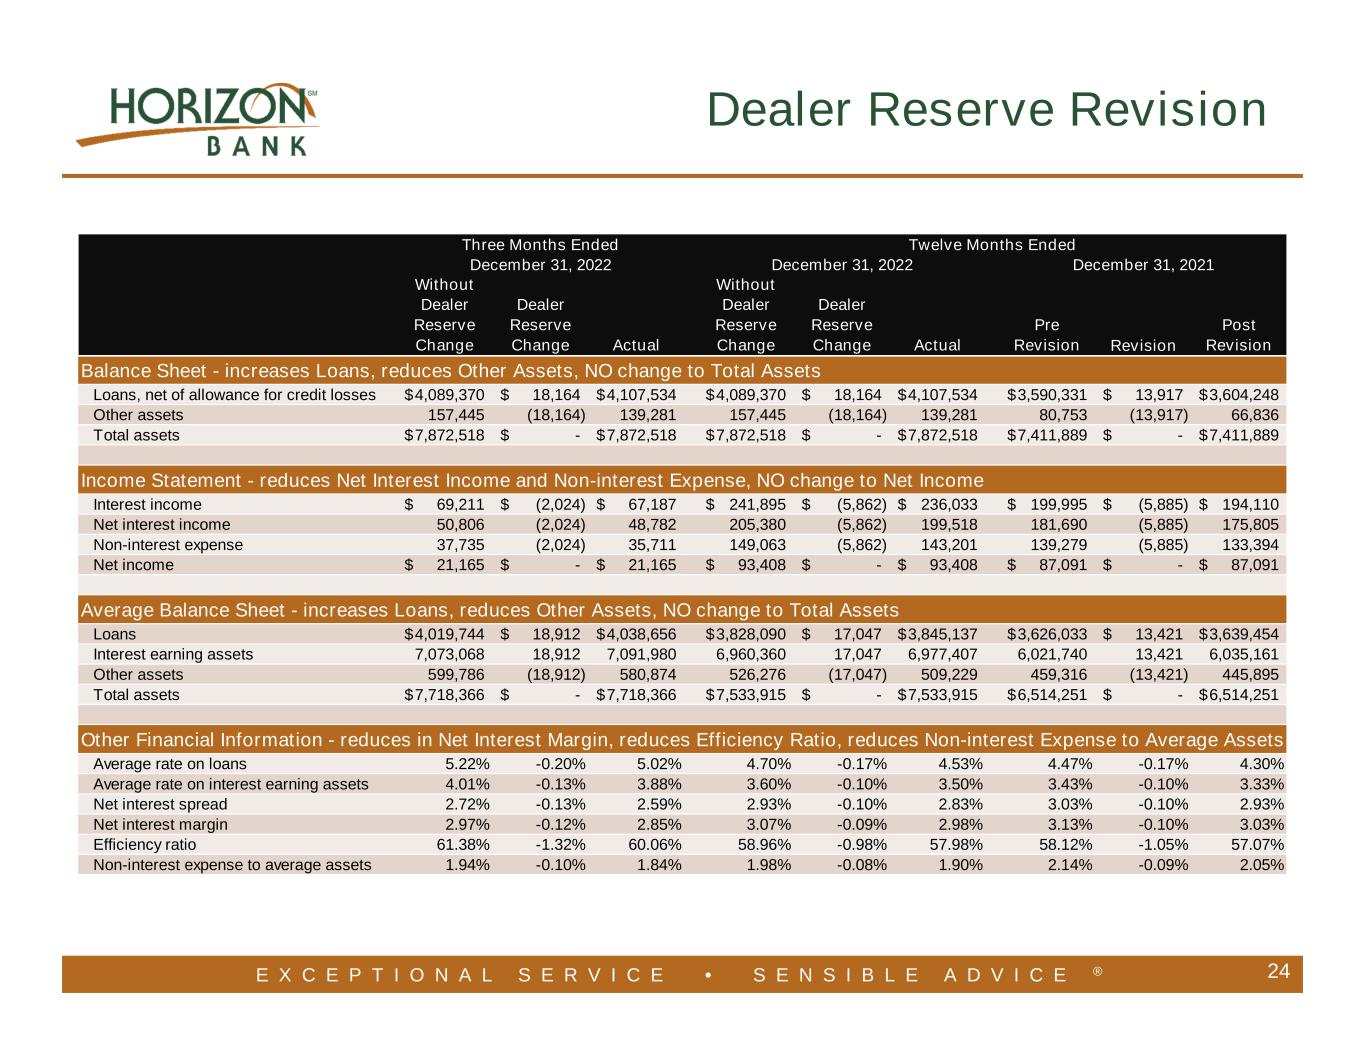
| Without Dealer Reserve Change |
Dealer Reserve Change |
Actual | Pre Revision |
Revision | Post Revision |
|||||||||||||||||||||||||||||||||
| Balance Sheet | ||||||||||||||||||||||||||||||||||||||
| Loans, net of allowance for credit losses | $ | 4,089,370 | $ | 18,164 | $ | 4,107,534 | $ | 3,590,331 | $ | 13,917 | $ | 3,604,248 | ||||||||||||||||||||||||||
| Other assets | 157,445 | (18,164) | 139,281 | 80,753 | (13,917) | 66,836 | ||||||||||||||||||||||||||||||||
| Total assets | 7,872,518 | — | 7,872,518 | 7,411,889 | — | 7,411,889 | ||||||||||||||||||||||||||||||||
| Income Statement | ||||||||||||||||||||||||||||||||||||||
| Interest income | 69,211 | (2,024) | 67,187 | 54,118 | (1,499) | 52,619 | ||||||||||||||||||||||||||||||||
| Net interest income | 50,806 | (2,024) | 48,782 | 49,976 | (1,499) | 48,477 | ||||||||||||||||||||||||||||||||
| Non–interest expense | 37,735 | (2,024) | 35,711 | 39,370 | (1,499) | 37,871 | ||||||||||||||||||||||||||||||||
| Net income | 21,165 | — | 21,165 | 21,425 | — | 21,425 | ||||||||||||||||||||||||||||||||
| Average Balance Sheet | ||||||||||||||||||||||||||||||||||||||
| Loans | 4,019,744 | 18,912 | 4,038,656 | 3,630,896 | 13,792 | 3,644,688 | ||||||||||||||||||||||||||||||||
| Interest earning assets | 7,073,068 | 18,912 | 7,091,980 | 6,938,258 | 13,792 | 6,952,050 | ||||||||||||||||||||||||||||||||
| Other assets | 599,786 | (18,912) | 580,874 | 477,352 | (13,792) | 463,560 | ||||||||||||||||||||||||||||||||
| Total assets | $ | 7,718,366 | $ | — | $ | 7,718,366 | $ | 7,461,343 | $ | — | $ | 7,461,343 | ||||||||||||||||||||||||||
| Other Financial Information | ||||||||||||||||||||||||||||||||||||||
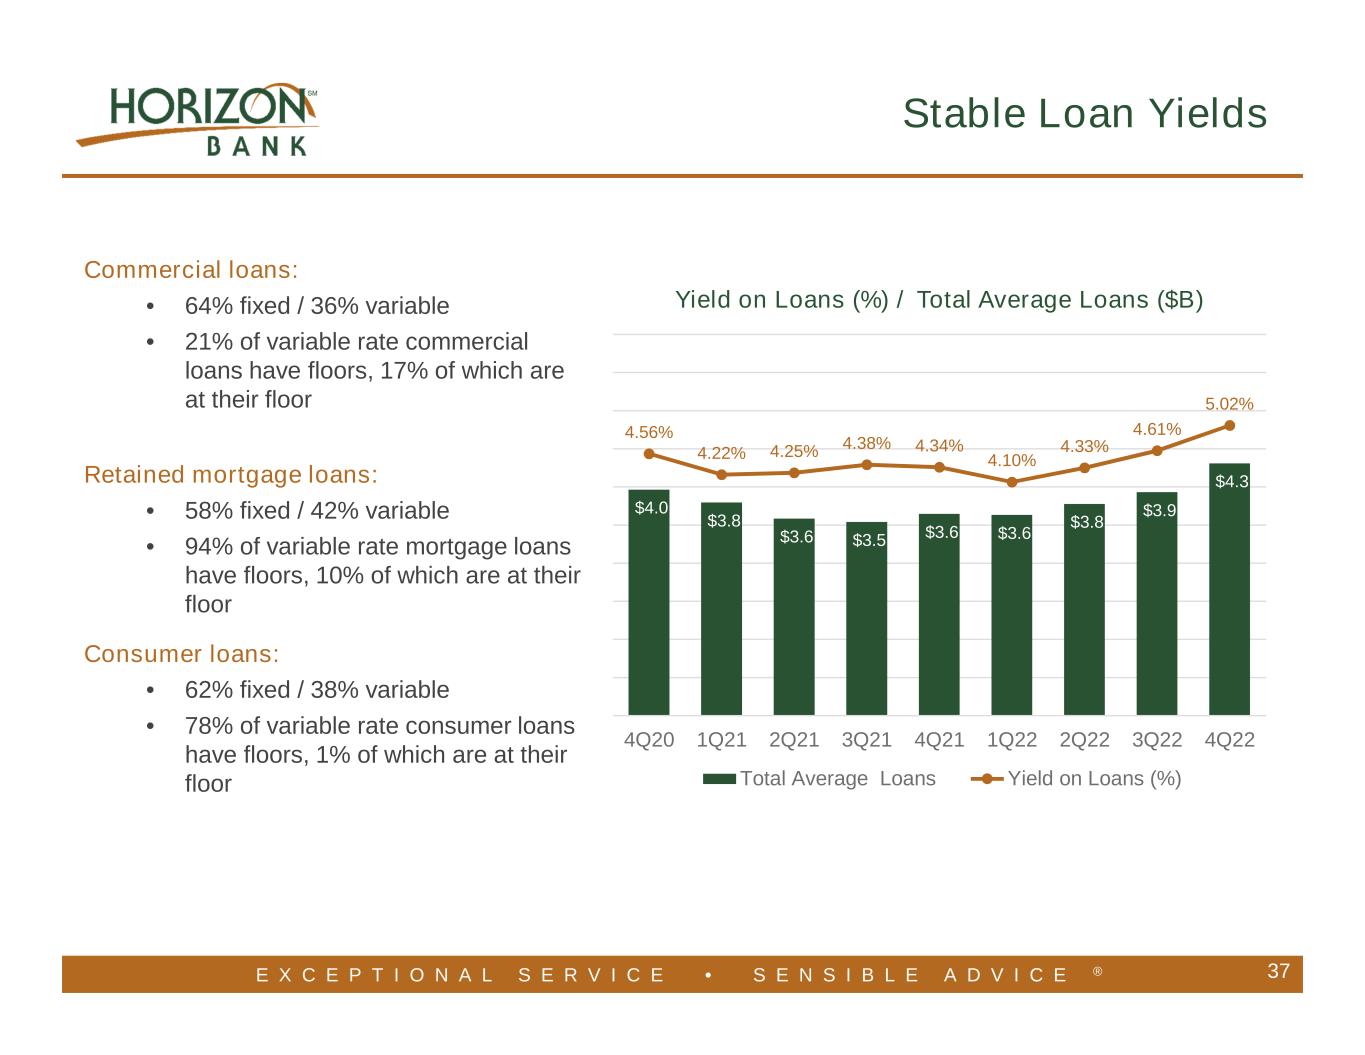
| Average rate on loans | 5.22 | % | (0.20) | % | 5.02 | % | 4.52 | % | (0.18) | % | 4.34 | % | ||||||||||||||||||||||||||
| Average rate on interest earning assets | 4.01 | (0.13) | 3.88 | 3.20 | (0.09) | 3.11 | ||||||||||||||||||||||||||||||||
| Net interest spread | 2.72 | (0.13) | 2.59 | 2.89 | (0.09) | 2.80 | ||||||||||||||||||||||||||||||||
| Net interest margin | 2.97 | (0.12) | 2.85 | 2.97 | (0.10) | 2.87 | ||||||||||||||||||||||||||||||||
| Efficiency ratio | 61.38 | (1.32) | 60.06 | 62.69 | (0.92) | 61.77 | ||||||||||||||||||||||||||||||||
| Non–interest expense to average assets | 1.94 | % | (0.10) | % | 1.84 | % | 2.09 | % | (0.08) | % | 2.01 | % | ||||||||||||||||||||||||||
| Twelve Months Ended | ||||||||||||||||||||||||||||||||||||||
| December 31, | December 31, | |||||||||||||||||||||||||||||||||||||
| 2022 | 2021 | |||||||||||||||||||||||||||||||||||||
| Without Dealer Reserve Change |
Dealer Reserve Change |
Actual | Pre Revision |
Revision | Post Revision |
|||||||||||||||||||||||||||||||||
| Balance Sheet | ||||||||||||||||||||||||||||||||||||||
| Loans, net of allowance for credit losses | $ | 4,089,370 | $ | 18,164 | $ | 4,107,534 | $ | 3,590,331 | $ | 13,917 | $ | 3,604,248 | ||||||||||||||||||||||||||
| Other assets | 157,445 | (18,164) | 139,281 | 80,753 | (13,917) | 66,836 | ||||||||||||||||||||||||||||||||
| Total assets | 7,872,518 | — | 7,872,518 | 7,411,889 | — | 7,411,889 | ||||||||||||||||||||||||||||||||
| Income Statement | ||||||||||||||||||||||||||||||||||||||
| Interest income | 241,895 | (5,862) | 236,033 | 199,995 | (5,885) | 194,110 | ||||||||||||||||||||||||||||||||
| Net interest income | 205,380 | (5,862) | 199,518 | 181,690 | (5,885) | 175,805 | ||||||||||||||||||||||||||||||||
| Non–interest expense | 149,063 | (5,862) | 143,201 | 139,279 | (5,885) | 133,394 | ||||||||||||||||||||||||||||||||
| Net income | 93,408 | — | 93,408 | 87,091 | — | 87,091 | ||||||||||||||||||||||||||||||||
| Average Balance Sheet | ||||||||||||||||||||||||||||||||||||||
| Loans | 3,828,090 | 17,047 | 3,845,137 | 3,626,033 | 13,421 | 3,639,454 | ||||||||||||||||||||||||||||||||
| Interest earning assets | 6,960,360 | 17,047 | 6,977,407 | 6,021,740 | 13,421 | 6,035,161 | ||||||||||||||||||||||||||||||||
| Other assets | 526,276 | (17,047) | 509,229 | 459,316 | (13,421) | 445,895 | ||||||||||||||||||||||||||||||||
| Total assets | $ | 7,533,915 | $ | — | $ | 7,533,915 | $ | 6,514,251 | $ | 6,514,251 | ||||||||||||||||||||||||||||
| Other Financial Information | ||||||||||||||||||||||||||||||||||||||
| Average rate on loans | 4.70 | % | (0.17) | % | 4.53 | % | 4.47 | % | (0.17) | % | 4.30 | % | ||||||||||||||||||||||||||
| Average rate on interest earning assets | 3.60 | (0.10) | 3.50 | 3.43 | (0.10) | 3.33 | ||||||||||||||||||||||||||||||||
| Net interest spread | 2.93 | (0.10) | 2.83 | 3.03 | (0.10) | 2.93 | ||||||||||||||||||||||||||||||||
| Net interest margin | 3.07 | (0.09) | 2.98 | 3.13 | (0.10) | 3.03 | ||||||||||||||||||||||||||||||||
| Efficiency ratio | 58.96 | (0.98) | 57.98 | 58.12 | (1.05) | 57.07 | ||||||||||||||||||||||||||||||||
| Non–interest expense to average assets | 1.98 | % | (0.08) | % | 1.90 | % | 2.14 | % | (0.09) | % | 2.05 | % | ||||||||||||||||||||||||||
| Loan Growth by Type | ||||||||||||||||||||||||||||||||
| (Dollars in Thousands, Unaudited) | ||||||||||||||||||||||||||||||||
| December 31, | September 30, | QTD | QTD | Annualized | ||||||||||||||||||||||||||||
| 2022 | 2022 | $ Change | % Change | % Change | ||||||||||||||||||||||||||||
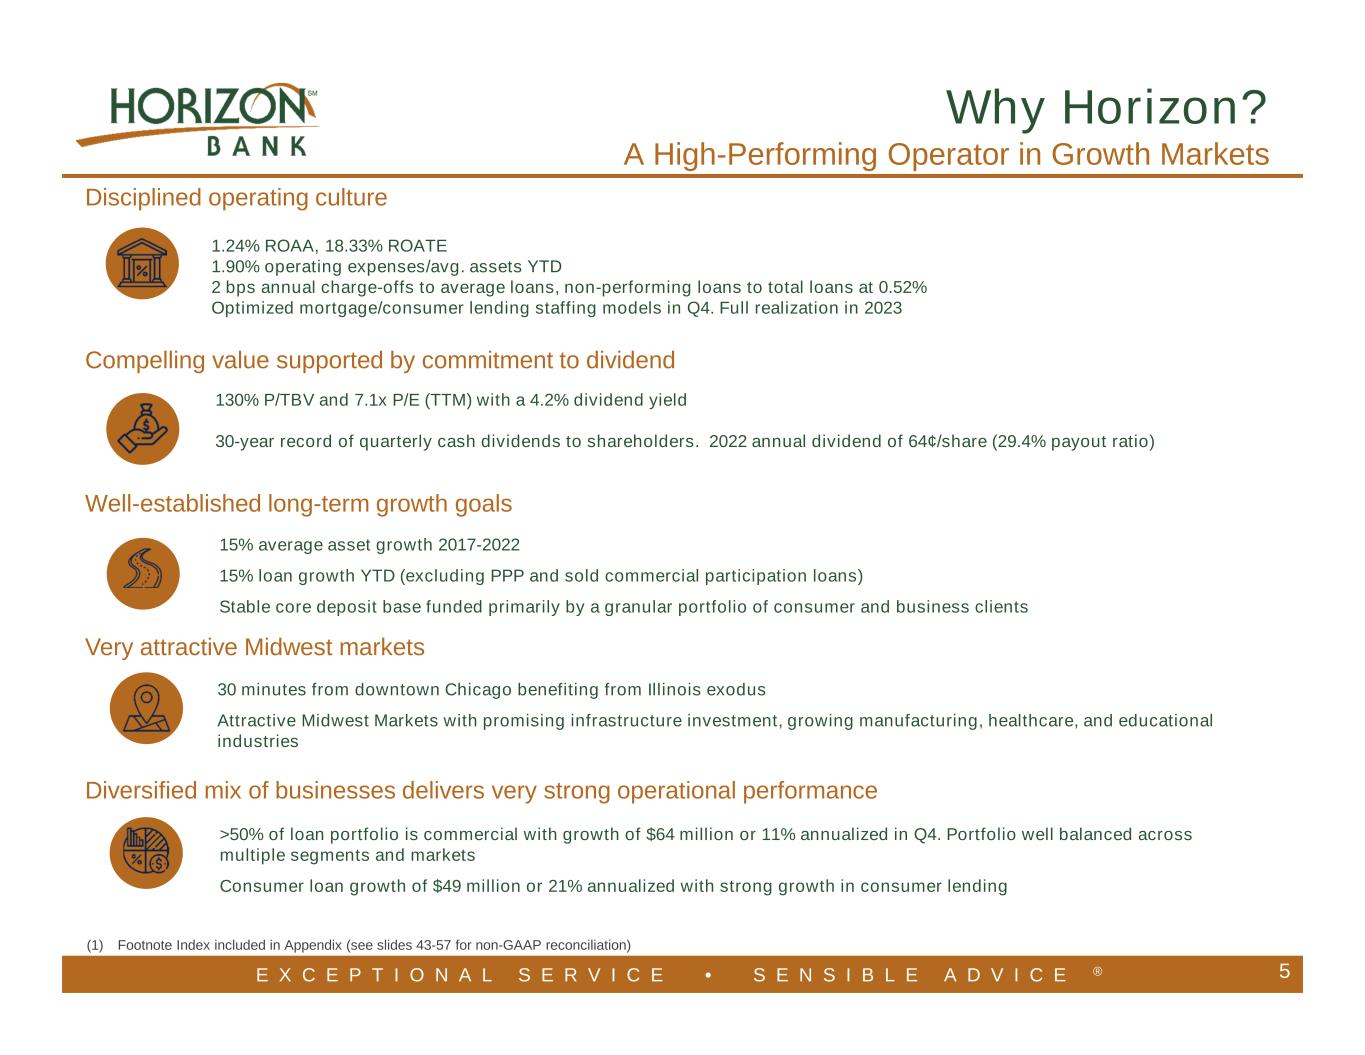
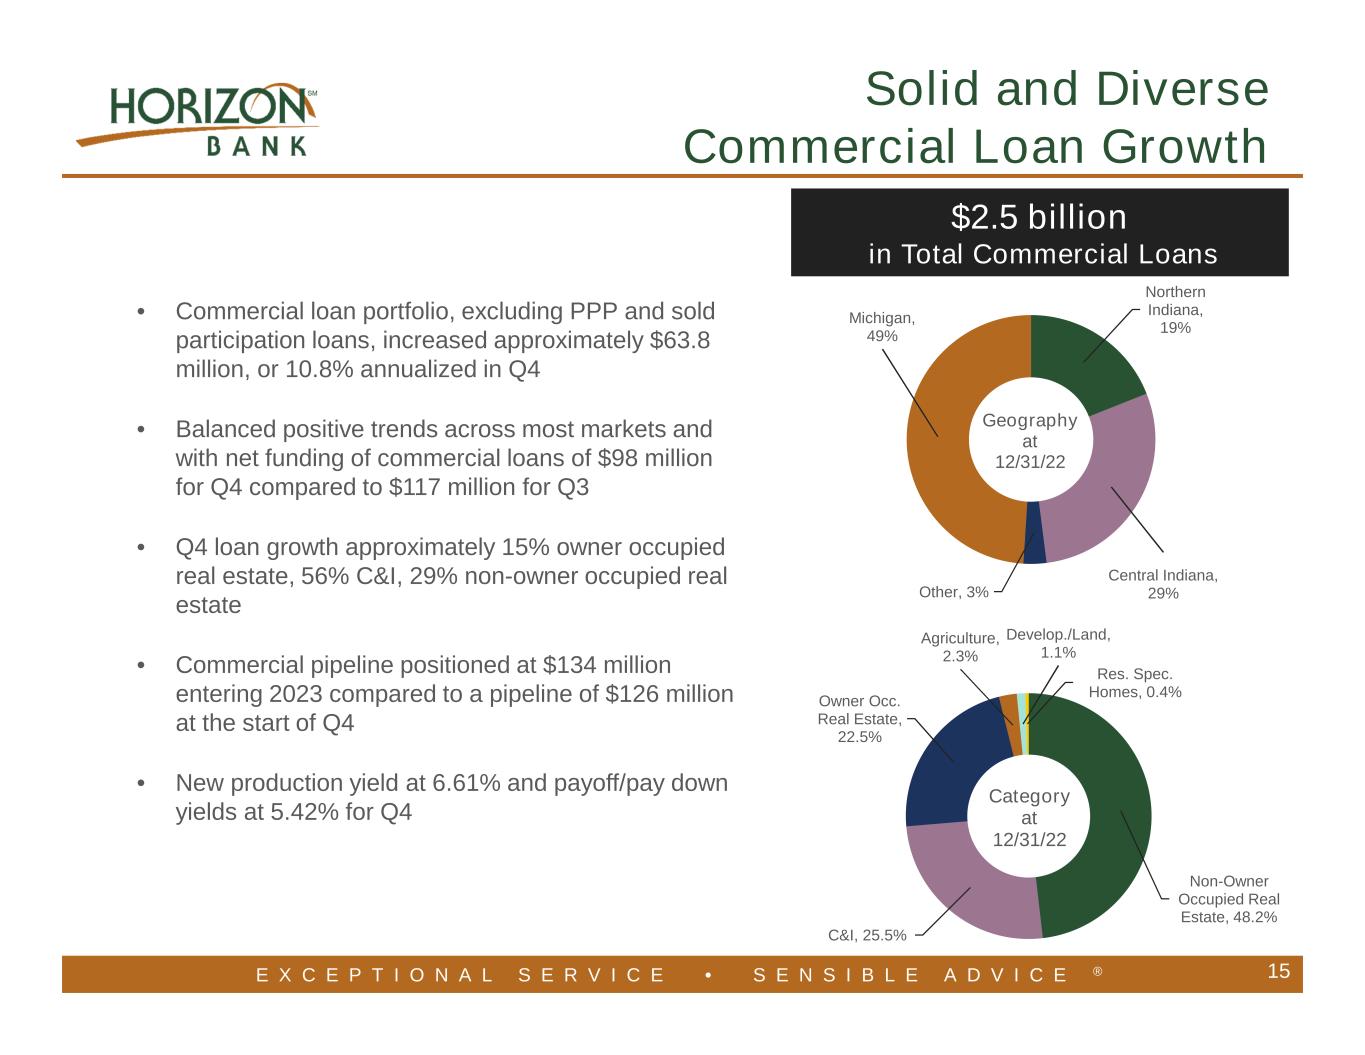
| Commercial, excluding PPP loans and sold commercial participation loans | $ | 2,416,249 | $ | 2,352,446 | $ | 63,803 | 2.7% | 10.8% | ||||||||||||||||||||||||
| PPP loans | 217 | 315 | (98) | (31.1)% | (123.4)% | |||||||||||||||||||||||||||
| Sold commercial participation loans | 50,956 | 50,982 | (26) | (0.1)% | (0.2)% | |||||||||||||||||||||||||||
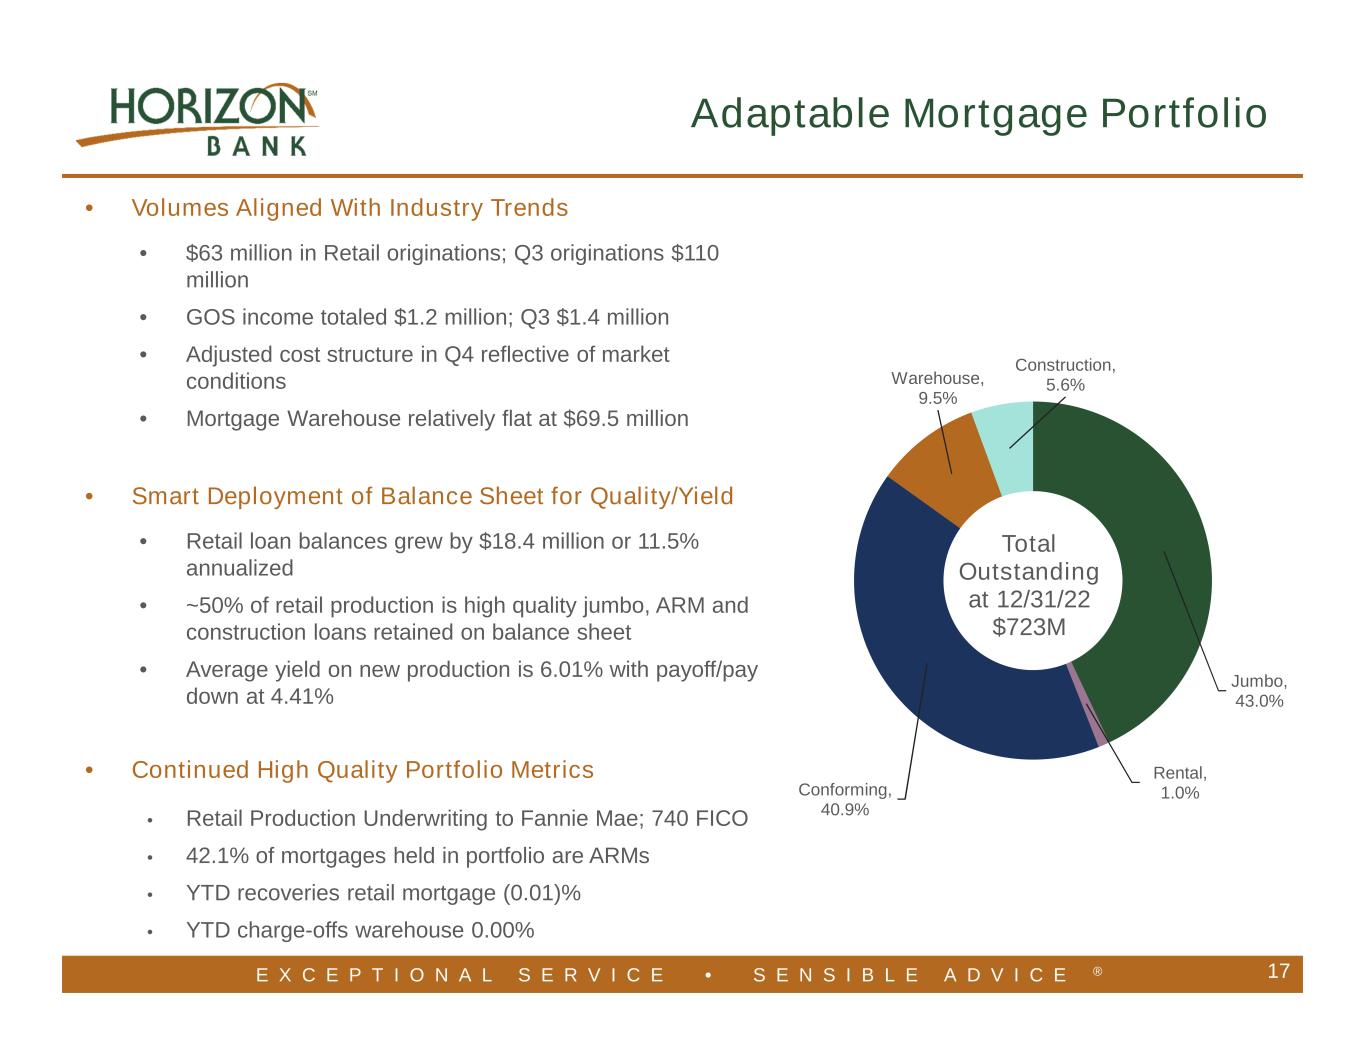
| Residential mortgage | 653,292 | 634,901 | 18,391 | 2.9% | 11.5% | |||||||||||||||||||||||||||
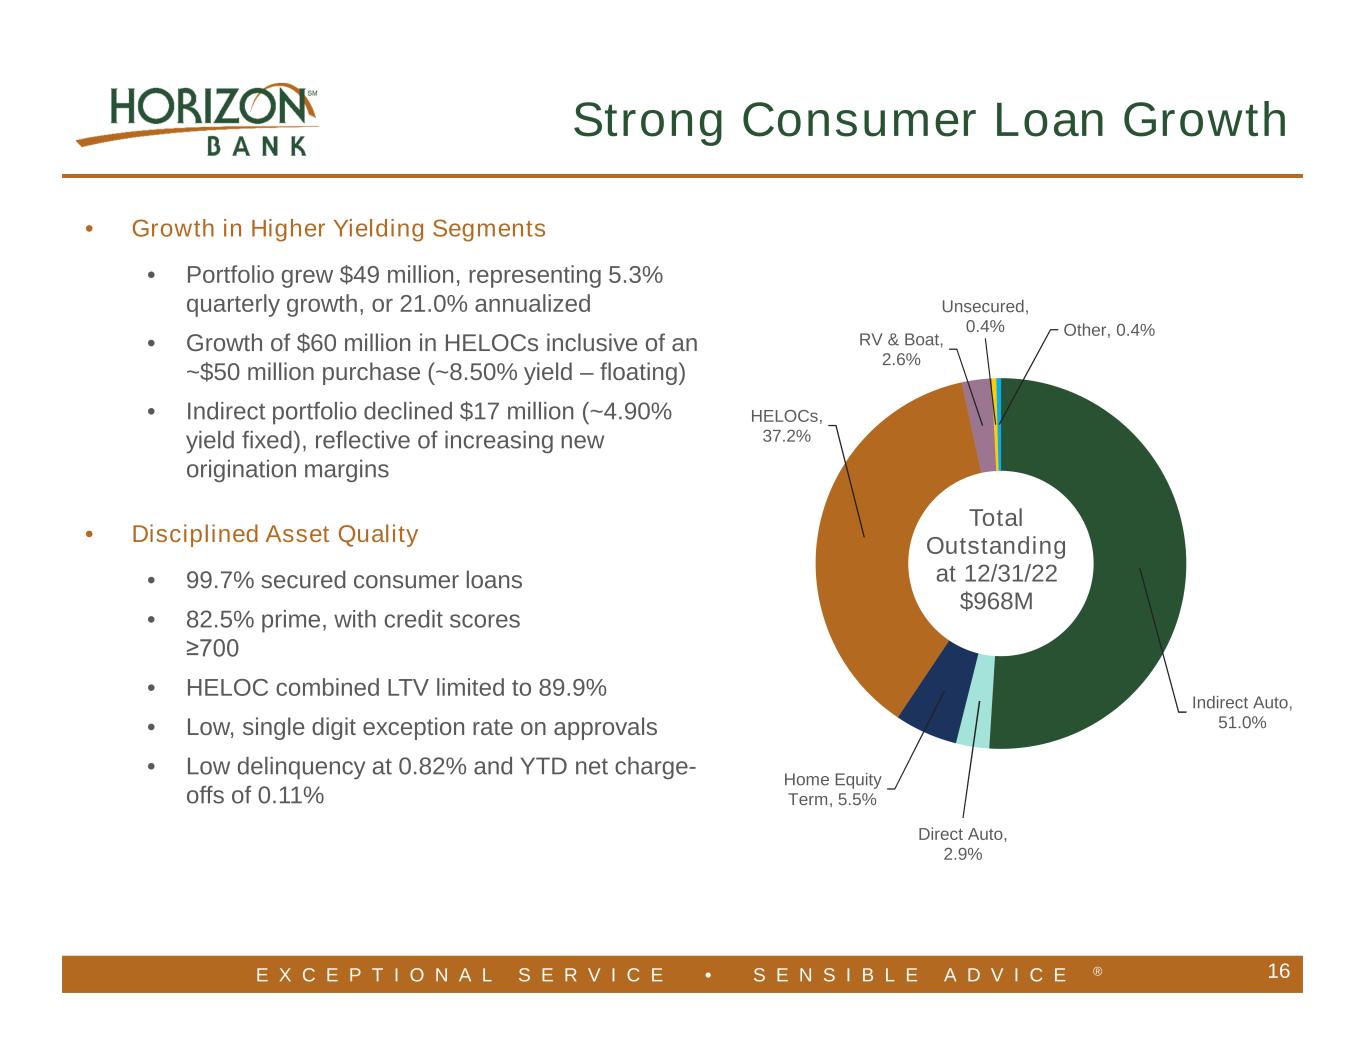
| Consumer | 967,755 | 919,198 | 48,557 | 5.3% | 21.0% | |||||||||||||||||||||||||||
| Subtotal | 4,088,469 | 3,957,842 | 130,627 | 3.3% | 13.1% | |||||||||||||||||||||||||||
| Loans held for sale | 5,807 | 1,852 | 3,955 | 213.6% | 847.2% | |||||||||||||||||||||||||||
| Mortgage warehouse | 69,529 | 73,690 | (4,161) | (5.6)% | (22.4)% | |||||||||||||||||||||||||||
| Total loans | $ | 4,163,805 | $ | 4,033,384 | $ | 130,421 | 3.2% | 12.8% | ||||||||||||||||||||||||
| Total loans, excluding PPP loans and sold commercial participation loans | $ | 4,112,632 | $ | 3,982,087 | $ | 130,545 | 3.3% | 13.0% | ||||||||||||||||||||||||
| Loan Growth by Type | ||||||||||||||||||||||||||
| (Dollars in Thousands, Unaudited) | ||||||||||||||||||||||||||
| December 31, | December 31, | YTD | YTD | |||||||||||||||||||||||
| 2022 | 2021 | $ Change | % Change | |||||||||||||||||||||||
| Commercial, excluding PPP loans and sold commercial participation loans | $ | 2,416,249 | $ | 2,131,644 | $ | 284,605 | 13.4% | |||||||||||||||||||
| PPP loans | 217 | 25,844 | (25,627) | (99.2)% | ||||||||||||||||||||||
| Sold commercial participation loans | 50,956 | 56,457 | (5,501) | (9.7)% | ||||||||||||||||||||||
| Residential mortgage | 653,292 | 594,382 | 58,910 | 9.9% | ||||||||||||||||||||||
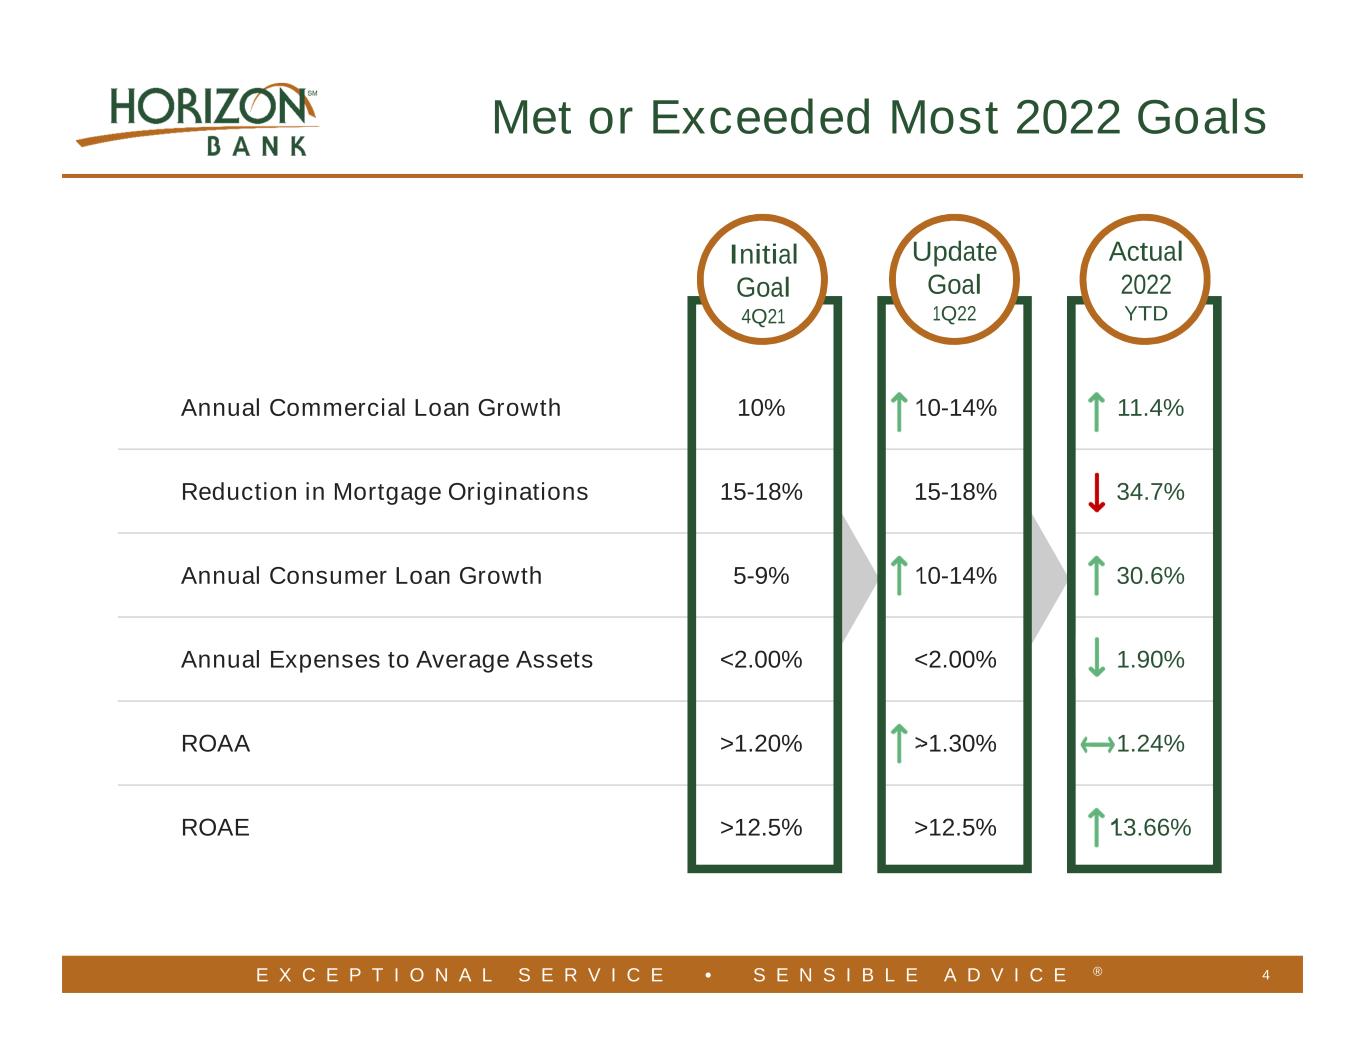
| Consumer | 967,755 | 741,176 | 226,579 | 30.6% | ||||||||||||||||||||||
| Subtotal | 4,088,469 | 3,549,503 | 538,966 | 15.2% | ||||||||||||||||||||||
| Loans held for sale | 5,807 | 12,579 | (6,772) | (53.8)% | ||||||||||||||||||||||
| Mortgage warehouse | 69,529 | 109,031 | (39,502) | (36.2)% | ||||||||||||||||||||||
| Total loans | $ | 4,163,805 | $ | 3,671,113 | $ | 492,692 | 13.4% | |||||||||||||||||||
| Total loans, excluding PPP loans and sold commercial participation loans | $ | 4,112,632 | $ | 3,588,812 | $ | 523,820 | 14.6% | |||||||||||||||||||
| Deposit Growth by Type | |||||||||||||||||||||||||||||
| (Dollars in Thousands, Unaudited) | |||||||||||||||||||||||||||||
| December 31, | September 30, | QTD | QTD | Annualized | |||||||||||||||||||||||||
| 2022 | 2022 | $ Change | % Change | % Change | |||||||||||||||||||||||||
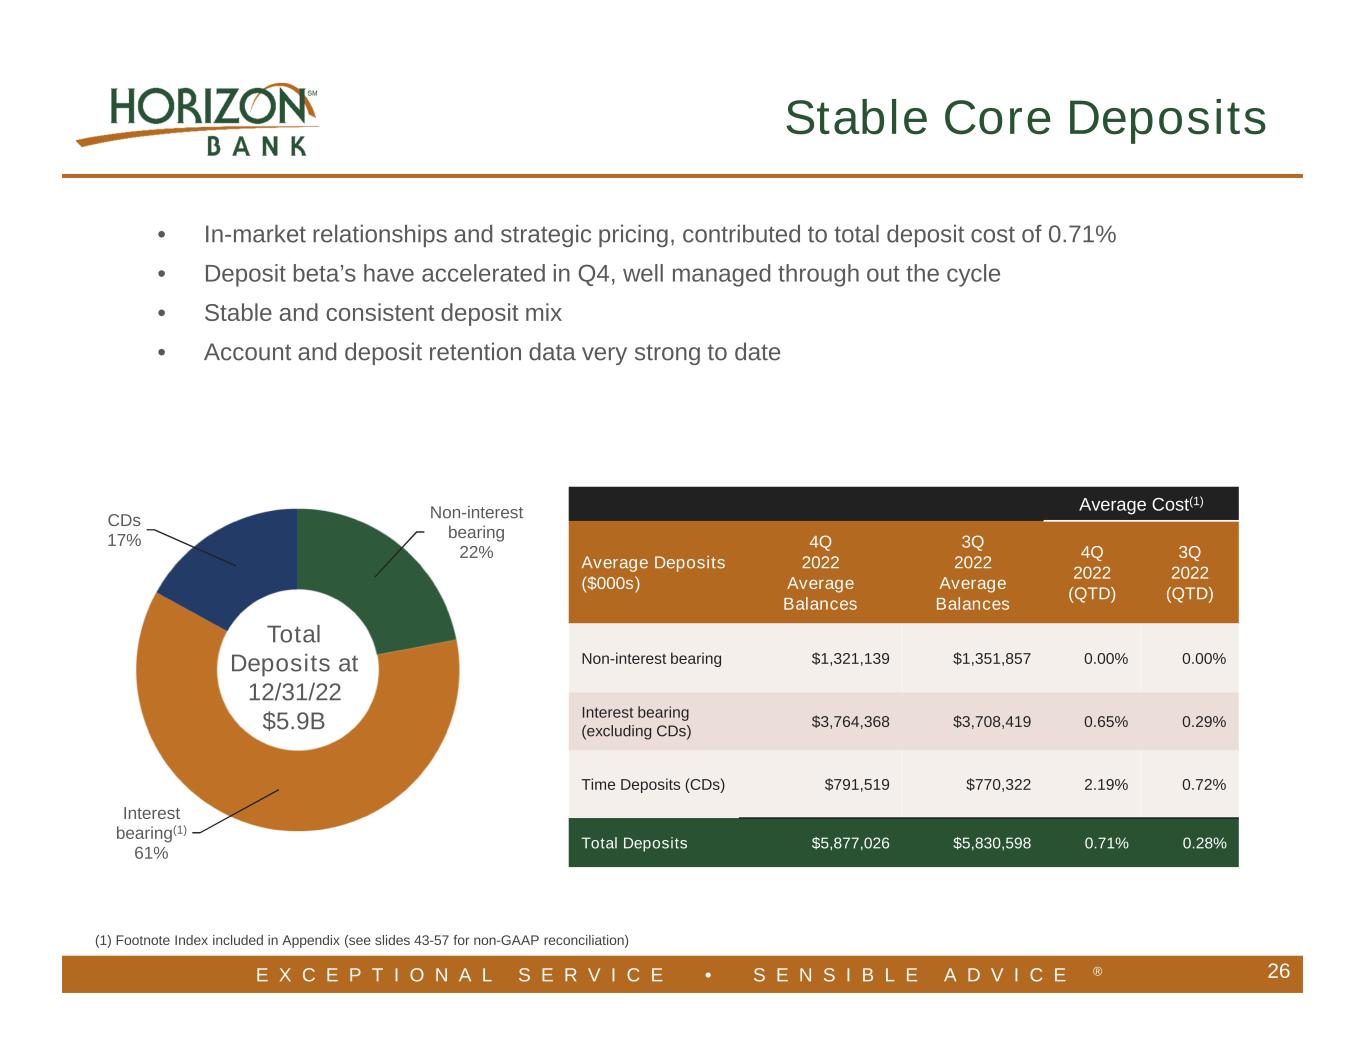
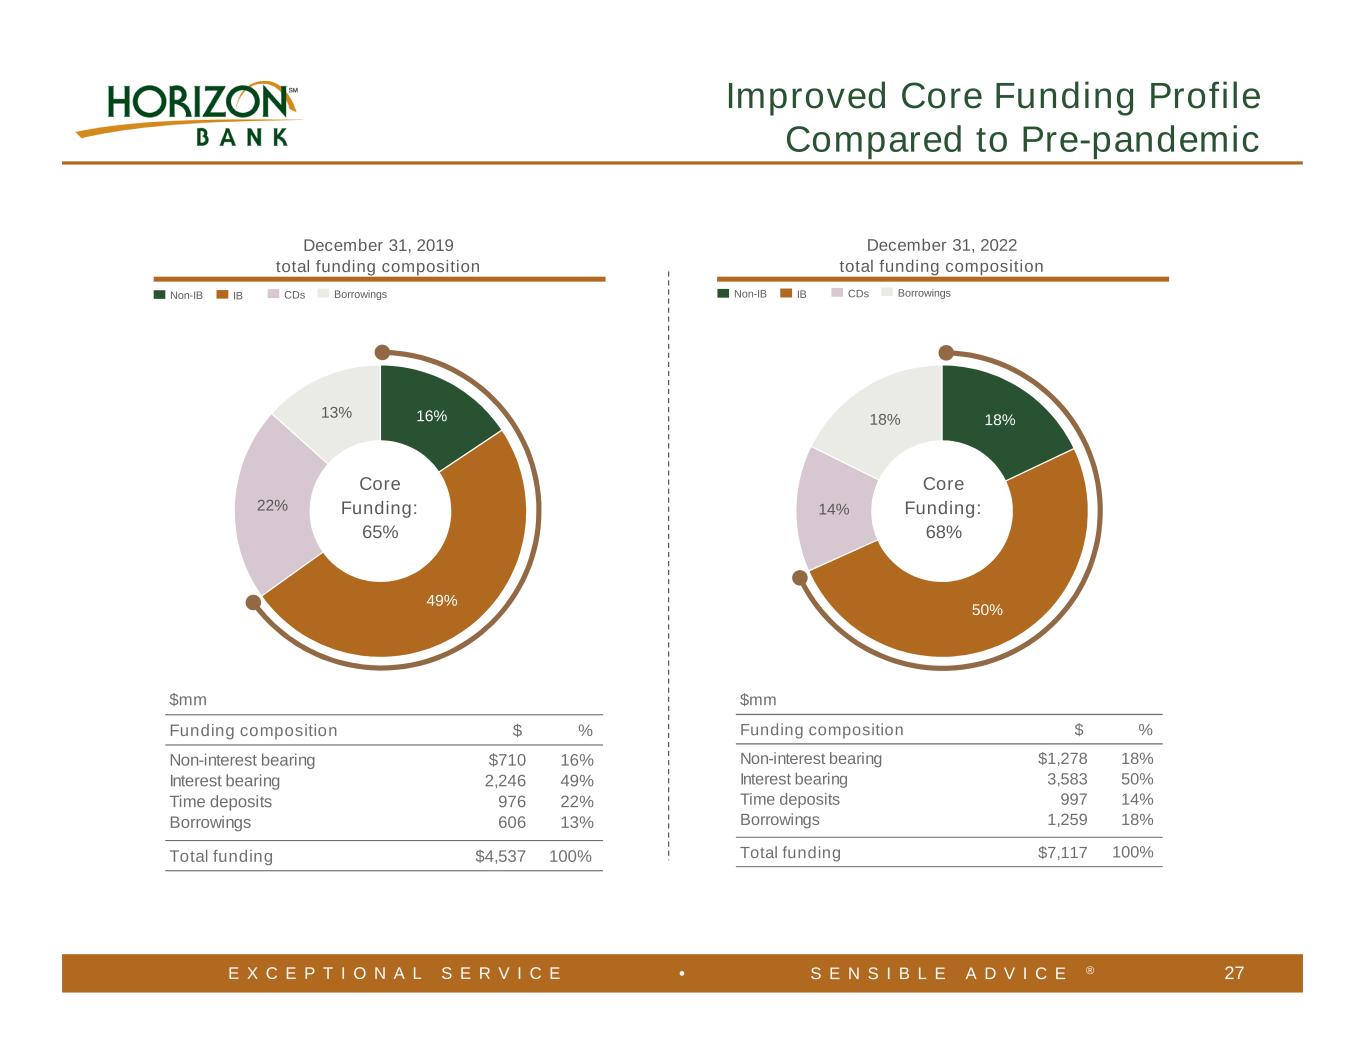
| Non–interest bearing | $ | 1,277,768 | $ | 1,315,155 | $ | (37,387) | (2.8)% | (11.3)% | |||||||||||||||||||||
| Interest bearing | 3,582,891 | 3,736,798 | (153,907) | (4.1)% | (16.3)% | ||||||||||||||||||||||||
| Time deposits | 997,115 | 778,885 | 218,230 | 28.0% | 111.2% | ||||||||||||||||||||||||
| Total deposits | $ | 5,857,774 | $ | 5,830,838 | $ | 26,936 | 0.5% | 1.8% | |||||||||||||||||||||
| Deposit Growth by Type | |||||||||||||||||||||||
| (Dollars in Thousands, Unaudited) | |||||||||||||||||||||||
| December 31, | December 31, | YTD | YTD | ||||||||||||||||||||
| 2022 | 2021 | $ Change | % Change | ||||||||||||||||||||
| Non–interest bearing | $ | 1,277,768 | $ | 1,360,338 | $ | (82,570) | (6.1)% | ||||||||||||||||
| Interest bearing | 3,582,891 | 3,711,767 | (128,876) | (3.5)% | |||||||||||||||||||
| Time deposits | 997,115 | 730,886 | 266,229 | 36.4% | |||||||||||||||||||
| Total deposits | $ | 5,857,774 | $ | 5,802,991 | $ | 54,783 | 0.9% | ||||||||||||||||
| Non–Interest Expense | ||||||||||||||||||||||||||
| (Dollars in Thousands, Unaudited) | ||||||||||||||||||||||||||
| Three Months Ended | ||||||||||||||||||||||||||
| December 31, | September 30, | QTD | QTD | |||||||||||||||||||||||
| Non–interest Expense | 2022 | 2022 | $ Change | % Change | ||||||||||||||||||||||
| Salaries and employee benefits | $ | 19,978 | $ | 20,613 | $ | (635) | (3.1)% | |||||||||||||||||||
| Net occupancy expenses | 3,279 | 3,293 | (14) | (0.4)% | ||||||||||||||||||||||
| Data processing | 2,884 | 2,539 | 345 | 13.6% | ||||||||||||||||||||||
| Professional fees | 694 | 552 | 142 | 25.7% | ||||||||||||||||||||||
| Outside services and consultants | 2,985 | 2,855 | 130 | 4.6% | ||||||||||||||||||||||
| Loan expense | 1,281 | 1,392 | (111) | (8.0)% | ||||||||||||||||||||||
| FDIC insurance expense | 388 | 670 | (282) | (42.1)% | ||||||||||||||||||||||
| Other losses | 118 | 398 | (280) | (70.4)% | ||||||||||||||||||||||
| Other expense | 4,104 | 4,504 | (400) | (8.9)% | ||||||||||||||||||||||
| Total non–interest expense | $ | 35,711 | $ | 36,816 | $ | (1,105) | (3.0)% | |||||||||||||||||||
| Annualized non–interest expense to average assets | 1.84 | % | 1.91 | % | ||||||||||||||||||||||
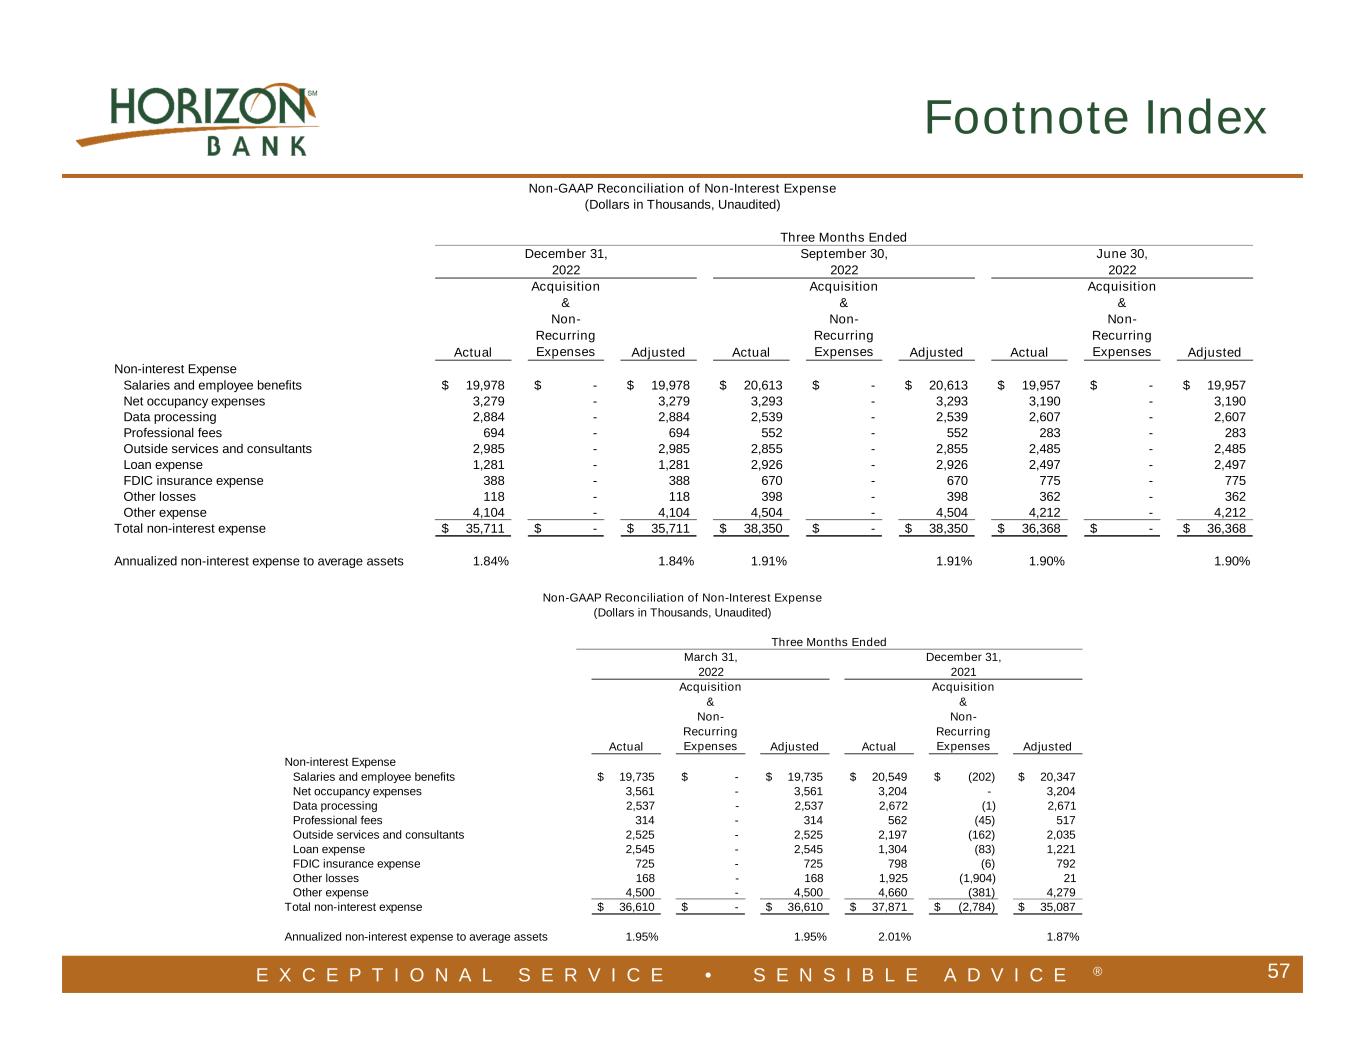
| Non–GAAP Reconciliation of Non–Interest Expense | ||||||||||||||||||||||||||||||||||||||||||||||||||
| (Dollars in Thousands, Unaudited) | ||||||||||||||||||||||||||||||||||||||||||||||||||
| Three Months Ended | ||||||||||||||||||||||||||||||||||||||||||||||||||
| December 31, | December 31, | |||||||||||||||||||||||||||||||||||||||||||||||||
| 2022 | 2021 | Adjusted | ||||||||||||||||||||||||||||||||||||||||||||||||
| Non–interest Expense | Actual | Acquisition & Non–Recurring Expenses |
Adjusted | Actual | Acquisition & Non–Recurring Expenses |
Adjusted | Amount Change |
Percent Change |
||||||||||||||||||||||||||||||||||||||||||
| Salaries and employee benefits | $ | 19,978 | $ | — | $ | 19,978 | $ | 20,549 | $ | (202) | $ | 20,347 | $ | (369) | (1.8)% | |||||||||||||||||||||||||||||||||||
| Net occupancy expenses | 3,279 | — | 3,279 | 3,204 | — | 3,204 | 75 | 2.3% | ||||||||||||||||||||||||||||||||||||||||||
| Data processing | 2,884 | — | 2,884 | 2,672 | (1) | 2,671 | 213 | 8.0% | ||||||||||||||||||||||||||||||||||||||||||
| Professional fees | 694 | — | 694 | 562 | (45) | 517 | 177 | 34.2% | ||||||||||||||||||||||||||||||||||||||||||
| Outside services and consultants | 2,985 | — | 2,985 | 2,197 | (162) | 2,035 | 950 | 46.7% | ||||||||||||||||||||||||||||||||||||||||||
| Loan expense | 1,281 | — | 1,281 | 1,304 | (83) | 1,221 | 60 | 4.9% | ||||||||||||||||||||||||||||||||||||||||||
| FDIC insurance expense | 388 | — | 388 | 798 | (6) | 792 | (404) | (51.0)% | ||||||||||||||||||||||||||||||||||||||||||
| Other losses | 118 | — | 118 | 1,925 | (1,904) | 21 | 97 | 461.9% | ||||||||||||||||||||||||||||||||||||||||||
| Other expense | 4,104 | — | 4,104 | 4,660 | (381) | 4,279 | (175) | (4.1)% | ||||||||||||||||||||||||||||||||||||||||||
| Total non–interest expense | $ | 35,711 | $ | — | $ | 35,711 | $ | 37,871 | $ | (2,784) | $ | 35,087 | $ | 624 | 1.8% | |||||||||||||||||||||||||||||||||||
| Annualized non–interest expense to average assets | 1.84 | % | 1.84 | % | 2.01 | % | 1.87 | % | ||||||||||||||||||||||||||||||||||||||||||
| Non–GAAP Reconciliation of Non–Interest Expense | ||||||||||||||||||||||||||||||||||||||||||||||||||
| (Dollars in Thousands, Unaudited) | ||||||||||||||||||||||||||||||||||||||||||||||||||
| Twelve Months Ended | ||||||||||||||||||||||||||||||||||||||||||||||||||
| December 31, | December 31, | |||||||||||||||||||||||||||||||||||||||||||||||||
| 2022 | 2021 | Adjusted | ||||||||||||||||||||||||||||||||||||||||||||||||
| Non–interest Expense | Actual | Acquisition & Non–Recurring Expenses |
Adjusted | Actual | Acquisition & Non–Recurring Expenses |
Adjusted | Amount Change |
Percent Change |
||||||||||||||||||||||||||||||||||||||||||
| Salaries and employee benefits | $ | 80,283 | $ | — | $ | 80,283 | $ | 74,051 | $ | (227) | $ | 73,824 | $ | 6,459 | 8.7% | |||||||||||||||||||||||||||||||||||
| Net occupancy expenses | 13,323 | — | 13,323 | 12,541 | (13) | 12,528 | 795 | 6.3% | ||||||||||||||||||||||||||||||||||||||||||
| Data processing | 10,567 | — | 10,567 | 9,962 | (18) | 9,944 | 623 | 6.3% | ||||||||||||||||||||||||||||||||||||||||||
| Professional fees | 1,843 | — | 1,843 | 2,216 | (149) | 2,067 | (224) | (10.8)% | ||||||||||||||||||||||||||||||||||||||||||
| Outside services and consultants | 10,850 | — | 10,850 | 8,449 | (750) | 7,699 | 3,151 | 40.9% | ||||||||||||||||||||||||||||||||||||||||||
| Loan expense | 5,411 | — | 5,411 | 5,492 | (83) | 5,409 | 2 | —% | ||||||||||||||||||||||||||||||||||||||||||
| FDIC insurance expense | 2,558 | — | 2,558 | 2,377 | (6) | 2,371 | 187 | 7.9% | ||||||||||||||||||||||||||||||||||||||||||
| Other losses | 1,046 | — | 1,046 | 2,283 | (5) | 2,278 | (1,232) | (54.1)% | ||||||||||||||||||||||||||||||||||||||||||
| Other expense | 17,320 | — | 17,320 | 16,023 | (2,574) | 13,449 | 3,871 | 28.8% | ||||||||||||||||||||||||||||||||||||||||||
| Total non–interest expense | $ | 143,201 | $ | — | $ | 143,201 | $ | 133,394 | $ | (3,825) | $ | 129,569 | $ | 13,632 | 10.5% | |||||||||||||||||||||||||||||||||||
| Annualized non–interest expense to average assets | 1.90 | % | 1.90 | % | 2.05 | % | 1.99 | % | ||||||||||||||||||||||||||||||||||||||||||
| Actual | Required for Capital Adequacy Purposes | Required for Capital Adequacy Purposes with Capital Buffer | Well Capitalized Under Prompt Corrective Action Provisions |
|||||||||||||||||||||||||||||||||||||||||||||||
| Amount | Ratio | Amount | Ratio | Amount | Ratio | Amount | Ratio | |||||||||||||||||||||||||||||||||||||||||||
| Total capital (to risk–weighted assets) | ||||||||||||||||||||||||||||||||||||||||||||||||||
| Consolidated | $ | 782,705 | 14.48 | % | $ | 432,525 | 8.00 | % | $ | 567,688 | 10.50 | % | N/A | N/A | ||||||||||||||||||||||||||||||||||||
| Bank | 734,578 | 13.59 | % | 432,413 | 8.00 | % | 567,542 | 10.50 | % | $ | 540,516 | 10.00 | % | |||||||||||||||||||||||||||||||||||||
| Tier 1 capital (to risk–weighted assets) | ||||||||||||||||||||||||||||||||||||||||||||||||||
| Consolidated | 736,150 | 13.62 | % | 324,393 | 6.00 | % | 459,557 | 8.50 | % | N/A | N/A | |||||||||||||||||||||||||||||||||||||||
| Bank | 686,069 | 12.69 | % | 324,310 | 6.00 | % | 459,439 | 8.50 | % | 432,413 | 8.00 | % | ||||||||||||||||||||||||||||||||||||||
| Common equity tier 1 capital (to risk–weighted assets) | ||||||||||||||||||||||||||||||||||||||||||||||||||
| Consolidated | 616,231 | 11.40 | % | 243,295 | 4.50 | % | 378,459 | 7.00 | % | N/A | N/A | |||||||||||||||||||||||||||||||||||||||
| Bank | 686,069 | 12.69 | % | 243,232 | 4.50 | % | 378,361 | 7.00 | % | 351,336 | 6.50 | % | ||||||||||||||||||||||||||||||||||||||
| Tier 1 capital (to average assets) | ||||||||||||||||||||||||||||||||||||||||||||||||||
| Consolidated | 736,150 | 10.23 | % | 287,867 | 4.00 | % | 287,867 | 4.00 | % | N/A | N/A | |||||||||||||||||||||||||||||||||||||||
| Bank | 686,069 | 9.55 | % | 287,262 | 4.00 | % | 287,262 | 4.00 | % | 359,077 | 5.00 | % | ||||||||||||||||||||||||||||||||||||||
| Financial Highlights | ||||||||||||||||||||||||||||||||
| (Dollars in Thousands, Unaudited) | ||||||||||||||||||||||||||||||||
| December 31, | September 30, | June 30, | March 31, | December 31, | ||||||||||||||||||||||||||||
| 2022 | 2022 | 2022 | 2022 | 2021 | ||||||||||||||||||||||||||||
| Balance sheet: | ||||||||||||||||||||||||||||||||
| Total assets | $ | 7,872,518 | $ | 7,718,695 | $ | 7,640,936 | $ | 7,420,328 | $ | 7,374,903 | ||||||||||||||||||||||
| Interest earning deposits & federal funds sold | 12,233 | 7,302 | 5,646 | 20,827 | 502,364 | |||||||||||||||||||||||||||
| Interest earning time deposits | 2,812 | 2,814 | 3,799 | 4,046 | 4,782 | |||||||||||||||||||||||||||
| Investment securities | 3,020,306 | 3,017,191 | 3,093,792 | 3,118,641 | 2,713,255 | |||||||||||||||||||||||||||
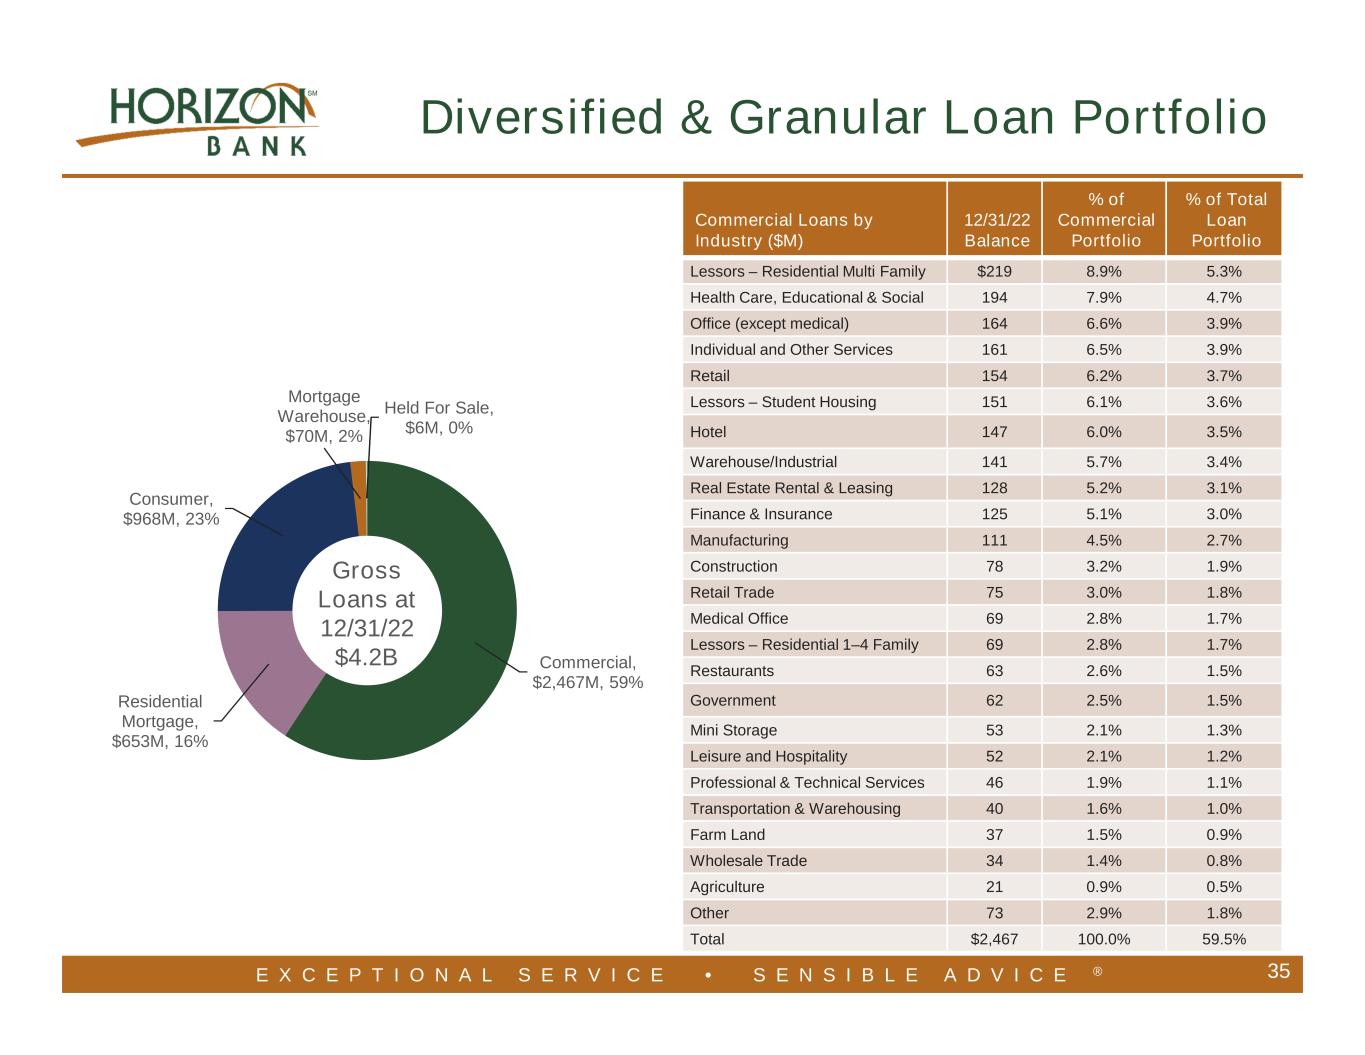
| Commercial loans | 2,467,422 | 2,403,743 | 2,363,991 | 2,259,327 | 2,213,945 | |||||||||||||||||||||||||||
| Mortgage warehouse loans | 69,529 | 73,690 | 116,488 | 105,118 | 109,031 | |||||||||||||||||||||||||||
| Residential mortgage loans | 653,292 | 634,901 | 608,582 | 593,372 | 594,382 | |||||||||||||||||||||||||||
| Consumer loans | 967,755 | 919,198 | 866,819 | 768,854 | 741,176 | |||||||||||||||||||||||||||
| Total loans | 4,157,998 | 4,031,532 | 3,955,880 | 3,726,671 | 3,658,534 | |||||||||||||||||||||||||||
| Earning assets | 7,225,833 | 7,087,368 | 7,088,737 | 6,898,208 | 6,878,968 | |||||||||||||||||||||||||||
| Non–interest bearing deposit accounts | 1,277,768 | 1,315,155 | 1,328,213 | 1,325,570 | 1,360,338 | |||||||||||||||||||||||||||
| Interest bearing transaction accounts | 3,582,891 | 3,736,798 | 3,760,890 | 3,782,644 | 3,711,767 | |||||||||||||||||||||||||||
| Time deposits | 997,115 | 778,885 | 756,482 | 743,283 | 730,886 | |||||||||||||||||||||||||||
| Total deposits | 5,857,774 | 5,830,838 | 5,845,585 | 5,851,497 | 5,802,991 | |||||||||||||||||||||||||||
| Borrowings | 1,142,949 | 1,048,091 | 959,222 | 728,664 | 712,739 | |||||||||||||||||||||||||||
| Subordinated notes | 58,896 | 58,860 | 58,823 | 58,786 | 58,750 | |||||||||||||||||||||||||||
| Junior subordinated debentures issued to capital trusts | 57,027 | 56,966 | 56,907 | 56,850 | 56,785 | |||||||||||||||||||||||||||
| Total stockholders’ equity | 677,375 | 644,993 | 657,865 | 677,450 | 723,209 | |||||||||||||||||||||||||||
| Financial Highlights | ||||||||||||||||||||||||||||||||
| (Dollars in Thousands Except Share and Per Share Data and Ratios, Unaudited) | ||||||||||||||||||||||||||||||||
| Three Months Ended | ||||||||||||||||||||||||||||||||
| December 31, | September 30, | June 30, | March 31, | December 31, | ||||||||||||||||||||||||||||
| 2022 | 2022 | 2022 | 2022 | 2021 | ||||||||||||||||||||||||||||
| Income statement: | ||||||||||||||||||||||||||||||||
| Net interest income | $ | 48,782 | $ | 51,861 | $ | 52,044 | $ | 46,831 | $ | 48,477 | ||||||||||||||||||||||
| Credit loss expense (recovery) | (69) | (601) | 240 | (1,386) | (2,071) | |||||||||||||||||||||||||||
| Non–interest income | 10,674 | 10,188 | 12,434 | 14,155 | 12,828 | |||||||||||||||||||||||||||
| Non–interest expense | 35,711 | 36,816 | 35,404 | 35,270 | 37,871 | |||||||||||||||||||||||||||
| Income tax expense | 2,649 | 2,013 | 3,975 | 3,539 | 4,080 | |||||||||||||||||||||||||||
| Net income | $ | 21,165 | $ | 23,821 | $ | 24,859 | $ | 23,563 | $ | 21,425 | ||||||||||||||||||||||
| Per share data: | ||||||||||||||||||||||||||||||||
| Basic earnings per share | $ | 0.49 | $ | 0.55 | $ | 0.57 | $ | 0.54 | $ | 0.49 | ||||||||||||||||||||||
| Diluted earnings per share | 0.48 | 0.55 | 0.57 | 0.54 | 0.49 | |||||||||||||||||||||||||||
| Cash dividends declared per common share | 0.16 | 0.16 | 0.16 | 0.15 | 0.15 | |||||||||||||||||||||||||||
| Book value per common share | 15.55 | 14.80 | 15.10 | 15.55 | 16.61 | |||||||||||||||||||||||||||
| Tangible book value per common share | 11.59 | 10.82 | 11.11 | 11.54 | 12.58 | |||||||||||||||||||||||||||
| Market value – high | 20.00 | 20.59 | 19.21 | 23.45 | 21.14 | |||||||||||||||||||||||||||
| Market value – low | $ | 14.51 | $ | 16.74 | $ | 16.72 | $ | 18.67 | $ | 18.01 | ||||||||||||||||||||||
| Weighted average shares outstanding – Basis | 43,574,151 | 43,573,370 | 43,572,796 | 43,554,713 | 43,534,298 | |||||||||||||||||||||||||||
| Weighted average shares outstanding – Diluted | 43,667,954 | 43,703,793 | 43,684,691 | 43,734,556 | 43,733,416 | |||||||||||||||||||||||||||
| Key ratios: | ||||||||||||||||||||||||||||||||
| Return on average assets | 1.09 | % | 1.24 | % | 1.33 | % | 1.31 | % | 1.14 | % | ||||||||||||||||||||||
| Return on average common stockholders’ equity | 12.72 | 13.89 | 14.72 | 13.34 | 11.81 | |||||||||||||||||||||||||||
| Net interest margin | 2.85 | 3.04 | 3.13 | 2.90 | 2.87 | |||||||||||||||||||||||||||
| Allowance for credit losses to total loans | 1.21 | 1.27 | 1.32 | 1.41 | 1.48 | |||||||||||||||||||||||||||
| Average equity to average assets | 8.55 | 8.91 | 9.06 | 9.79 | 9.64 | |||||||||||||||||||||||||||
| Efficiency ratio | 60.06 | 59.33 | 54.91 | 57.83 | 61.77 | |||||||||||||||||||||||||||
| Annualized non–interest expense to average assets | 1.84 | 1.91 | 1.90 | 1.95 | 2.01 | |||||||||||||||||||||||||||
| Bank only capital ratios: | ||||||||||||||||||||||||||||||||
| Tier 1 capital to average assets | 9.55 | 8.84 | 8.85 | 8.83 | 8.50 | |||||||||||||||||||||||||||
| Tier 1 capital to risk weighted assets | 12.69 | 12.74 | 12.87 | 13.23 | 13.69 | |||||||||||||||||||||||||||
| Total capital to risk weighted assets | 13.59 | 13.65 | 13.83 | 14.25 | 14.72 | |||||||||||||||||||||||||||
| Financial Highlights | ||||||||||||||
| (Dollars in Thousands Except Share and Per Share Data and Ratios, Unaudited) | ||||||||||||||
| Twelve Months Ended | ||||||||||||||
| December 31, | December 31, | |||||||||||||
| 2022 | 2021 | |||||||||||||
| Income statement: | ||||||||||||||
| Net interest income | $ | 199,518 | $ | 175,805 | ||||||||||
| Credit loss expense (recovery) | (1,816) | (2,084) | ||||||||||||
| Non–interest income | 47,451 | 57,952 | ||||||||||||
| Non–interest expense | 143,201 | 133,394 | ||||||||||||
| Income tax expense | 12,176 | 15,356 | ||||||||||||
| Net income | $ | 93,408 | $ | 87,091 | ||||||||||
| Per share data: | ||||||||||||||
| Basic earnings per share | $ | 2.14 | $ | 1.99 | ||||||||||
| Diluted earnings per share | 2.14 | 1.98 | ||||||||||||
| Cash dividends declared per common share | 0.63 | 0.56 | ||||||||||||
| Book value per common share | 15.55 | 16.61 | ||||||||||||
| Tangible book value per common share | 11.59 | 12.58 | ||||||||||||
| Market value – high | 23.45 | 21.14 | ||||||||||||
| Market value – low | $ | 14.51 | $ | 15.43 | ||||||||||
| Weighted average shares outstanding – Basis | 43,568,823 | 43,802,733 | ||||||||||||
| Weighted average shares outstanding – Diluted | 43,699,734 | 43,955,280 | ||||||||||||
| Key ratios: | ||||||||||||||
| Return on average assets | 1.24 | % | 1.34 | % | ||||||||||
| Return on average common stockholders’ equity | 13.66 | 12.23 | ||||||||||||
| Net interest margin | 2.98 | 3.03 | ||||||||||||
| Allowance for credit losses to total loans | 1.21 | 1.48 | ||||||||||||
| Average equity to average assets | 9.07 | 10.93 | ||||||||||||
| Efficiency ratio | 57.98 | 57.07 | ||||||||||||
| Annualized non–interest expense to average assets | 1.90 | 2.05 | ||||||||||||
| Bank only capital ratios: | ||||||||||||||
| Tier 1 capital to average assets | 9.55 | 8.50 | ||||||||||||
| Tier 1 capital to risk weighted assets | 12.69 | 13.69 | ||||||||||||
| Total capital to risk weighted assets | 13.59 | 14.72 | ||||||||||||
| Financial Highlights | ||||||||||||||||||||||||||||||||
| (Dollars in Thousands Except Ratios, Unaudited) | ||||||||||||||||||||||||||||||||
| December 31, | September 30, | June 30, | March 31, | December 31, | ||||||||||||||||||||||||||||
| 2022 | 2022 | 2022 | 2022 | 2021 | ||||||||||||||||||||||||||||
| Loan data: | ||||||||||||||||||||||||||||||||
| Substandard loans | $ | 56,194 | $ | 57,932 | $ | 59,377 | $ | 57,928 | $ | 56,968 | ||||||||||||||||||||||
| 30 to 89 days delinquent | 10,709 | 6,970 | 6,739 | 6,358 | 8,536 | |||||||||||||||||||||||||||
| Non–performing loans: | ||||||||||||||||||||||||||||||||
| 90 days and greater delinquent – accruing interest | 92 | 193 | 210 | 107 | 145 | |||||||||||||||||||||||||||
| Trouble debt restructures – accruing interest | 2,570 | 2,529 | 2,535 | 2,372 | 2,391 | |||||||||||||||||||||||||||
| Trouble debt restructures – non–accrual | 1,548 | 1,665 | 1,345 | 1,501 | 1,521 | |||||||||||||||||||||||||||
| Non–accrual loans | 17,630 | 14,771 | 16,116 | 16,133 | 14,962 | |||||||||||||||||||||||||||
| Total non–performing loans | $ | 21,840 | $ | 19,158 | $ | 20,206 | $ | 20,113 | $ | 19,019 | ||||||||||||||||||||||
| Non–performing loans to total loans | 0.52 | % | 0.47 | % | 0.51 | % | 0.54 | % | 0.52 | % | ||||||||||||||||||||||
| Allocation of the Allowance for Credit Losses | ||||||||||||||||||||||||||||||||
| (Dollars in Thousands, Unaudited) | ||||||||||||||||||||||||||||||||
| December 31, | September 30, | June 30, | March 31, | December 31, | ||||||||||||||||||||||||||||
| 2022 | 2022 | 2022 | 2022 | 2021 | ||||||||||||||||||||||||||||
| Commercial | $ | 32,445 | $ | 33,806 | $ | 34,802 | $ | 37,789 | $ | 40,775 | ||||||||||||||||||||||
| Residential mortgage | 5,577 | 5,137 | 4,422 | 4,351 | 3,856 | |||||||||||||||||||||||||||
| Mortgage warehouse | 1,020 | 1,024 | 1,067 | 1,055 | 1,059 | |||||||||||||||||||||||||||
| Consumer | 11,422 | 11,402 | 12,059 | 9,313 | 8,596 | |||||||||||||||||||||||||||
| Total | $ | 50,464 | $ | 51,369 | $ | 52,350 | $ | 52,508 | $ | 54,286 | ||||||||||||||||||||||
| Net Charge–offs (Recoveries) | ||||||||||||||||||||||||||||||||
| (Dollars in Thousands Except Ratios, Unaudited) | ||||||||||||||||||||||||||||||||
| December 31, | September 30, | June 30, | March 31, | December 31, | ||||||||||||||||||||||||||||
| 2022 | 2022 | 2022 | 2022 | 2021 | ||||||||||||||||||||||||||||
| Commercial | $ | (94) | $ | 51 | $ | (75) | $ | 38 | $ | 926 | ||||||||||||||||||||||
| Residential mortgage | (8) | (75) | 40 | (10) | 126 | |||||||||||||||||||||||||||
| Mortgage warehouse | — | — | — | — | — | |||||||||||||||||||||||||||
| Consumer | 387 | 162 | 319 | 108 | 360 | |||||||||||||||||||||||||||
| Total | $ | 285 | $ | 138 | $ | 284 | $ | 136 | $ | 1,412 | ||||||||||||||||||||||
| Percent of net charge–offs (recoveries) to average loans outstanding for the period | 0.01 | % | 0.00 | % | 0.01 | % | 0.00 | % | 0.04 | % | ||||||||||||||||||||||
| Total Non–performing Loans | ||||||||||||||||||||||||||||||||
| (Dollars in Thousands Except Ratios, Unaudited) | ||||||||||||||||||||||||||||||||
| December 31, | September 30, | June 30, | March 31, | December 31, | ||||||||||||||||||||||||||||
| 2022 | 2022 | 2022 | 2022 | 2021 | ||||||||||||||||||||||||||||
| Commercial | $ | 9,330 | $ | 7,199 | $ | 8,008 | $ | 7,844 | $ | 7,509 | ||||||||||||||||||||||
| Residential mortgage | 8,123 | 8,047 | 8,469 | 8,584 | 8,005 | |||||||||||||||||||||||||||
| Mortgage warehouse | — | — | — | — | — | |||||||||||||||||||||||||||
| Consumer | 4,387 | 3,912 | 3,729 | 3,685 | 3,505 | |||||||||||||||||||||||||||
| Total | $ | 21,840 | $ | 19,158 | $ | 20,206 | $ | 20,113 | $ | 19,019 | ||||||||||||||||||||||
| Non–performing loans to total loans | 0.52 | % | 0.47 | % | 0.51 | % | 0.54 | % | 0.52 | % | ||||||||||||||||||||||
| Other Real Estate Owned and Repossessed Assets | ||||||||||||||||||||||||||||||||
| (Dollars in Thousands, Unaudited) | ||||||||||||||||||||||||||||||||
| December 31, | September 30, | June 30, | March 31, | December 31, | ||||||||||||||||||||||||||||
| 2022 | 2022 | 2022 | 2022 | 2021 | ||||||||||||||||||||||||||||
| Commercial | $ | 1,881 | $ | 3,206 | $ | 1,414 | $ | 2,245 | $ | 2,861 | ||||||||||||||||||||||
| Residential mortgage | 107 | 22 | — | 170 | 695 | |||||||||||||||||||||||||||
| Mortgage warehouse | — | — | — | — | — | |||||||||||||||||||||||||||
| Consumer | 152 | 14 | 58 | 5 | 5 | |||||||||||||||||||||||||||
| Total | $ | 2,140 | $ | 3,242 | $ | 1,472 | $ | 2,420 | $ | 3,561 | ||||||||||||||||||||||
| Average Balance Sheets | ||||||||||||||||||||||||||||||||||||||
| (Dollars in Thousands, Unaudited) | ||||||||||||||||||||||||||||||||||||||
| Three Months Ended | Three Months Ended | |||||||||||||||||||||||||||||||||||||
| December 31, 2022 | December 31, 2021 | |||||||||||||||||||||||||||||||||||||
| Average Balance |
Interest | Average Rate |
Average Balance |
Interest | Average Rate |
|||||||||||||||||||||||||||||||||
| Assets | ||||||||||||||||||||||||||||||||||||||
| Interest earning assets | ||||||||||||||||||||||||||||||||||||||
| Federal funds sold | $ | 4,023 | $ | 34 | 3.35 | % | $ | 654,225 | $ | 251 | 0.15 | % | ||||||||||||||||||||||||||
| Interest earning deposits | 8,233 | 48 | 2.31 | % | 22,537 | 32 | 0.56 | % | ||||||||||||||||||||||||||||||
| Investment securities – taxable | 1,655,728 | 8,703 | 2.09 | % | 1,405,689 | 6,208 | 1.75 | % | ||||||||||||||||||||||||||||||
Investment securities – non–taxable (1) |
1,385,340 | 7,543 | 2.73 | % | 1,224,911 | 6,456 | 2.65 | % | ||||||||||||||||||||||||||||||
Loans receivable (2) (3) |
4,038,656 | 50,859 | 5.02 | % | 3,644,688 | 39,672 | 4.34 | % | ||||||||||||||||||||||||||||||
| Total interest earning assets | 7,091,980 | 67,187 | 3.88 | % | 6,952,050 | 52,619 | 3.11 | % | ||||||||||||||||||||||||||||||
| Non–interest earning assets | ||||||||||||||||||||||||||||||||||||||
| Cash and due from banks | 96,835 | 102,273 | ||||||||||||||||||||||||||||||||||||
| Allowance for credit losses | (51,323) | (56,540) | ||||||||||||||||||||||||||||||||||||
| Other assets | 580,874 | 463,560 | ||||||||||||||||||||||||||||||||||||
| Total average assets | $ | 7,718,366 | $ | 7,461,343 | ||||||||||||||||||||||||||||||||||
| Liabilities and Stockholders’ Equity | ||||||||||||||||||||||||||||||||||||||
| Interest bearing liabilities | ||||||||||||||||||||||||||||||||||||||
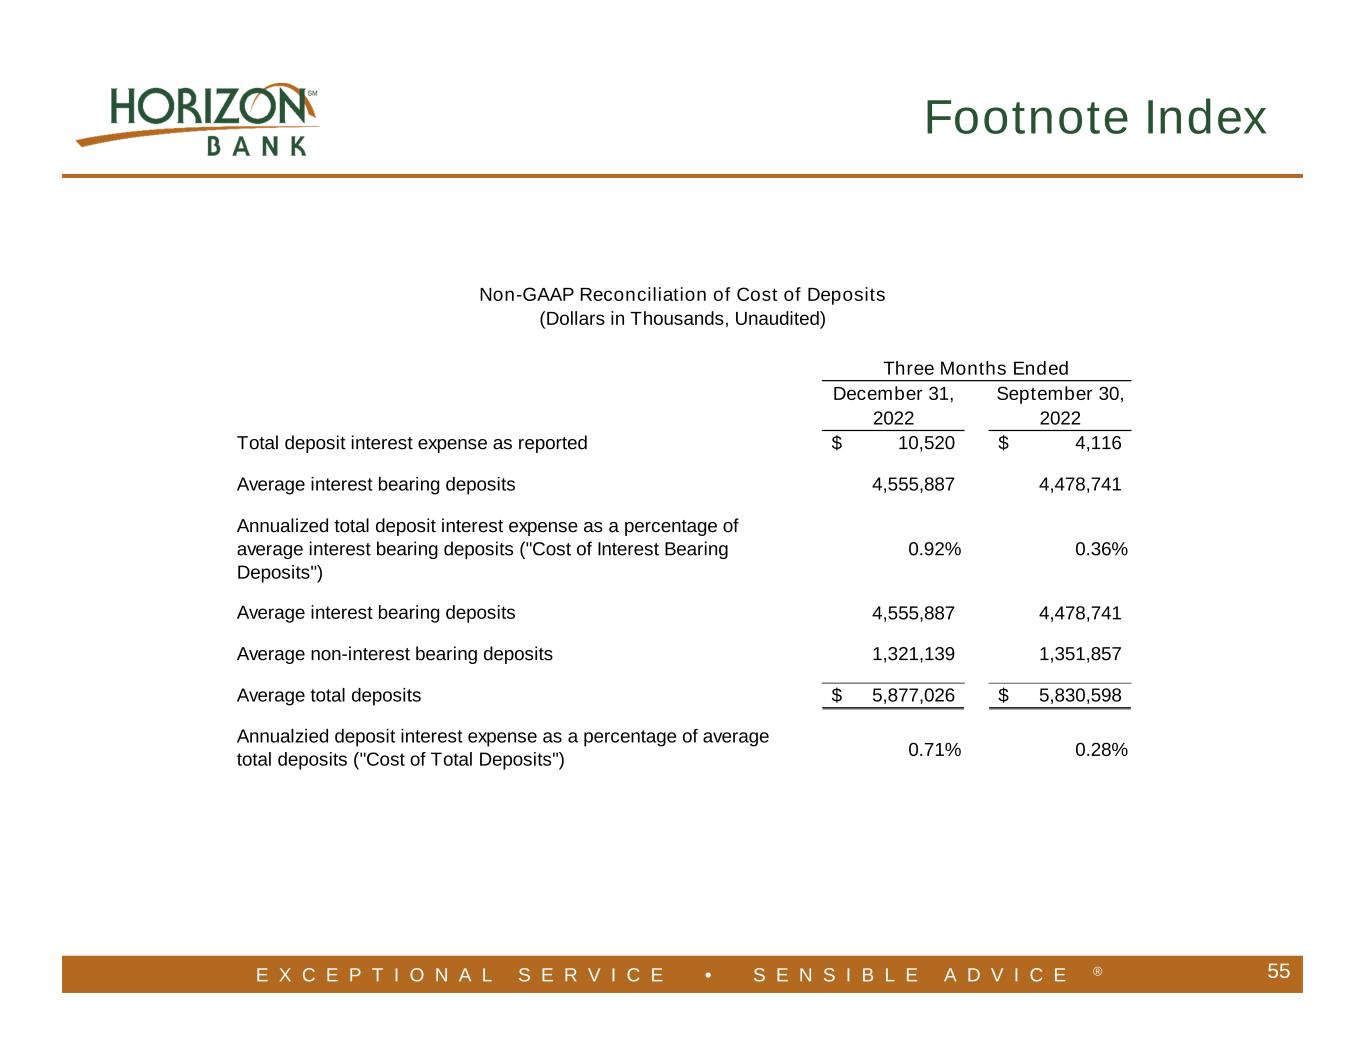
| Interest bearing deposits | $ | 4,555,887 | $ | 10,520 | 0.92 | % | $ | 4,543,989 | $ | 1,663 | 0.15 | % | ||||||||||||||||||||||||||
| Borrowings | 850,236 | 5,729 | 2.67 | % | 525,638 | 1,025 | 0.77 | % | ||||||||||||||||||||||||||||||
| Repurchase agreements | 141,676 | 311 | 0.87 | % | 137,868 | 36 | 0.10 | % | ||||||||||||||||||||||||||||||
| Subordinated notes | 58,874 | 881 | 5.94 | % | 58,728 | 881 | 5.95 | % | ||||||||||||||||||||||||||||||
| Junior subordinated debentures issued to capital trusts | 56,988 | 964 | 6.71 | % | 56,745 | 537 | 3.75 | % | ||||||||||||||||||||||||||||||
| Total interest bearing liabilities | 5,663,661 | 18,405 | 1.29 | % | 5,322,968 | 4,142 | 0.31 | % | ||||||||||||||||||||||||||||||
| Non–interest bearing liabilities | ||||||||||||||||||||||||||||||||||||||
| Demand deposits | 1,321,139 | 1,366,621 | ||||||||||||||||||||||||||||||||||||
| Accrued interest payable and other liabilities | 73,378 | 52,111 | ||||||||||||||||||||||||||||||||||||
| Stockholders’ equity | 660,188 | 719,643 | ||||||||||||||||||||||||||||||||||||
| Total average liabilities and stockholders’ equity | $ | 7,718,366 | $ | 7,461,343 | ||||||||||||||||||||||||||||||||||
| Net interest income / spread | $ | 48,782 | 2.59 | % | $ | 48,477 | 2.80 | % | ||||||||||||||||||||||||||||||
Net interest income as a percent of average interest earning assets (1) |
2.85 | % | 2.87 | % | ||||||||||||||||||||||||||||||||||
(1) Securities balances represent daily average balances for the fair value of securities. The average rate is calculated based on the daily average balance for the amortized cost of securities. The average rate is presented on a tax equivalent basis. | ||||||||||||||||||||||||||||||||||||||
(2) Includes fees on loans. The inclusion of loan fees does not have a material effect on the average interest rate. | ||||||||||||||||||||||||||||||||||||||
(3) Non–accruing loans for the purpose of the computation above are included in the daily average loan amounts outstanding. Loan totals are shown net of unearned income and deferred loan fees. The average rate is presented on a tax equivalent basis. | ||||||||||||||||||||||||||||||||||||||
| Average Balance Sheets | ||||||||||||||||||||||||||||||||||||||
| (Dollars in Thousands, Unaudited) | ||||||||||||||||||||||||||||||||||||||
| Twelve Months Ended | Twelve Months Ended | |||||||||||||||||||||||||||||||||||||
| December 31, 2022 | December 31, 2021 | |||||||||||||||||||||||||||||||||||||
| Average Balance |
Interest | Average Rate |
Average Balance |
Interest | Average Rate |
|||||||||||||||||||||||||||||||||
| Assets | ||||||||||||||||||||||||||||||||||||||
| Interest earning assets | ||||||||||||||||||||||||||||||||||||||
| Federal funds sold | $ | 62,211 | $ | 165 | 0.27 | % | $ | 398,528 | $ | 535 | 0.13 | % | ||||||||||||||||||||||||||
| Interest earning deposits | 13,596 | 141 | 1.04 | % | 25,993 | 160 | 0.62 | % | ||||||||||||||||||||||||||||||
| Investment securities – taxable | 1,700,418 | 33,202 | 1.95 | % | 884,244 | 14,437 | 1.63 | % | ||||||||||||||||||||||||||||||
Investment securities – non–taxable (1) |
1,356,045 | 29,025 | 2.71 | % | 1,086,942 | 23,246 | 2.71 | % | ||||||||||||||||||||||||||||||
Loans receivable (2) (3) |
3,845,137 | 173,500 | 4.53 | % | 3,639,454 | 155,732 | 4.30 | % | ||||||||||||||||||||||||||||||
| Total interest earning assets | 6,977,407 | 236,033 | 3.50 | % | 6,035,161 | 194,110 | 3.33 | % | ||||||||||||||||||||||||||||||
| Non–interest earning assets | ||||||||||||||||||||||||||||||||||||||
| Cash and due from banks | 99,885 | 89,993 | ||||||||||||||||||||||||||||||||||||
| Allowance for credit losses | (52,606) | (56,798) | ||||||||||||||||||||||||||||||||||||
| Other assets | 509,229 | 445,895 | ||||||||||||||||||||||||||||||||||||
| Total average assets | $ | 7,533,915 | $ | 6,514,251 | ||||||||||||||||||||||||||||||||||
| Liabilities and Stockholders’ Equity | ||||||||||||||||||||||||||||||||||||||
| Interest bearing liabilities | ||||||||||||||||||||||||||||||||||||||
| Interest bearing deposits | $ | 4,513,668 | $ | 17,809 | 0.39 | % | $ | 3,897,750 | $ | 7,867 | 0.20 | % | ||||||||||||||||||||||||||
| Borrowings | 696,584 | 11,938 | 1.71 | % | 425,214 | 4,546 | 1.07 | % | ||||||||||||||||||||||||||||||
| Repurchase agreements | 141,048 | 527 | 0.37 | % | 123,675 | 155 | 0.13 | % | ||||||||||||||||||||||||||||||
| Subordinated notes | 58,819 | 3,522 | 5.99 | % | 58,672 | 3,522 | 6.00 | % | ||||||||||||||||||||||||||||||
| Junior subordinated debentures issued to capital trusts | 56,899 | 2,719 | 4.78 | % | 56,657 | 2,215 | 3.91 | % | ||||||||||||||||||||||||||||||
| Total interest bearing liabilities | 5,467,018 | 36,515 | 0.67 | % | 4,561,968 | 18,305 | 0.40 | % | ||||||||||||||||||||||||||||||
| Non–interest bearing liabilities | ||||||||||||||||||||||||||||||||||||||
| Demand deposits | 1,332,937 | 1,188,275 | ||||||||||||||||||||||||||||||||||||
| Accrued interest payable and other liabilities | 50,330 | 51,886 | ||||||||||||||||||||||||||||||||||||
| Stockholders’ equity | 683,630 | 712,122 | ||||||||||||||||||||||||||||||||||||
| Total average liabilities and stockholders’ equity | $ | 7,533,915 | $ | 6,514,251 | ||||||||||||||||||||||||||||||||||
| Net interest income / spread | $ | 199,518 | 2.83 | % | $ | 175,805 | 2.93 | % | ||||||||||||||||||||||||||||||
Net interest income as a percent of average interest earning assets (1) |
2.98 | % | 3.03 | % | ||||||||||||||||||||||||||||||||||
(1) Securities balances represent daily average balances for the fair value of securities. The average rate is calculated based on the daily average balance for the amortized cost of securities. The average rate is presented on a tax equivalent basis. | ||||||||||||||||||||||||||||||||||||||
(2) Includes fees on loans. The inclusion of loan fees does not have a material effect on the average interest rate. | ||||||||||||||||||||||||||||||||||||||
(3) Non–accruing loans for the purpose of the computation above are included in the daily average loan amounts outstanding. Loan totals are shown net of unearned income and deferred loan fees. The average rate is presented on a tax equivalent basis. | ||||||||||||||||||||||||||||||||||||||
| Condensed Consolidated Balance Sheets | ||||||||||||||
| (Dollars in Thousands) | ||||||||||||||
| December 31, 2022 |
December 31, 2021 |
|||||||||||||
| (Unaudited) | ||||||||||||||
| Assets | ||||||||||||||
| Cash and due from banks | $ | 123,505 | $ | 593,508 | ||||||||||
| Interest earning time deposits | 2,812 | 4,782 | ||||||||||||
| Investment securities, available for sale | 997,558 | 1,160,812 | ||||||||||||
Investment securities, held to maturity (fair value $1,681,309 and $1,559,991) |
2,022,748 | 1,552,443 | ||||||||||||
| Loans held for sale | 5,807 | 12,579 | ||||||||||||
Loans, net of allowance for credit losses of $50,464 and $54,286 |
4,107,534 | 3,604,248 | ||||||||||||
| Premises and equipment, net | 92,677 | 93,441 | ||||||||||||
| Federal Home Loan Bank stock | 26,677 | 24,440 | ||||||||||||
| Goodwill | 155,211 | 154,572 | ||||||||||||
| Other intangible assets | 17,239 | 20,941 | ||||||||||||
| Interest receivable | 35,294 | 26,137 | ||||||||||||
| Cash value of life insurance | 146,175 | 97,150 | ||||||||||||
| Other assets | 139,281 | 66,836 | ||||||||||||
| Total assets | $ | 7,872,518 | $ | 7,411,889 | ||||||||||
| Liabilities | ||||||||||||||
| Deposits | ||||||||||||||
| Non–interest bearing | $ | 1,277,768 | $ | 1,360,338 | ||||||||||
| Interest bearing | 4,580,006 | 4,442,653 | ||||||||||||
| Total deposits | 5,857,774 | 5,802,991 | ||||||||||||
| Borrowings | 1,142,949 | 712,739 | ||||||||||||
| Subordinated notes | 58,896 | 58,750 | ||||||||||||
| Junior subordinated debentures issued to capital trusts | 57,027 | 56,785 | ||||||||||||
| Interest payable | 5,380 | 2,235 | ||||||||||||
| Other liabilities | 73,117 | 55,180 | ||||||||||||
| Total liabilities | 7,195,143 | 6,688,680 | ||||||||||||
| Commitments and contingent liabilities | ||||||||||||||
| Stockholders’ equity | ||||||||||||||
Preferred stock, Authorized, 1,000,000 shares, Issued 0 shares |
— | — | ||||||||||||
|
Common stock, no par value, Authorized 99,000,000 shares
Issued and Outstanding 43,937,889 and 43,811,421 shares
|
— | — | ||||||||||||
| Additional paid–in capital | 354,188 | 352,122 | ||||||||||||
| Retained earnings | 429,385 | 363,742 | ||||||||||||
| Accumulated other comprehensive income | (106,198) | 7,345 | ||||||||||||
| Total stockholders’ equity | 677,375 | 723,209 | ||||||||||||
| Total liabilities and stockholders’ equity | $ | 7,872,518 | $ | 7,411,889 | ||||||||||
| Condensed Consolidated Statements of Income | ||||||||||||||||||||||||||||||||
| (Dollars in Thousands Except Per Share Data, Unaudited) | ||||||||||||||||||||||||||||||||
| Three Months Ended | ||||||||||||||||||||||||||||||||
| December 31, | September 30, | June 30, | March 31, | December 31, | ||||||||||||||||||||||||||||
| 2022 | 2022 | 2022 | 2022 | 2021 | ||||||||||||||||||||||||||||
| Interest income | ||||||||||||||||||||||||||||||||
| Loans receivable | $ | 50,859 | $ | 45,517 | $ | 40,585 | $ | 36,539 | $ | 39,672 | ||||||||||||||||||||||
| Investment securities – taxable | 8,785 | 8,501 | 8,716 | 7,506 | 6,491 | |||||||||||||||||||||||||||
| Investment securities – non–taxable | 7,543 | 7,478 | 7,307 | 6,697 | 6,456 | |||||||||||||||||||||||||||
| Total interest income | 67,187 | 61,496 | 56,608 | 50,742 | 52,619 | |||||||||||||||||||||||||||
| Interest expense | ||||||||||||||||||||||||||||||||
| Deposits | 10,520 | 4,116 | 1,677 | 1,496 | 1,663 | |||||||||||||||||||||||||||
| Borrowed funds | 6,040 | 3,895 | 1,450 | 1,080 | 1,061 | |||||||||||||||||||||||||||
| Subordinated notes | 881 | 880 | 881 | 880 | 881 | |||||||||||||||||||||||||||
| Junior subordinated debentures issued to capital trusts | 964 | 744 | 556 | 455 | 537 | |||||||||||||||||||||||||||
| Total interest expense | 18,405 | 9,635 | 4,564 | 3,911 | 4,142 | |||||||||||||||||||||||||||
| Net interest income | 48,782 | 51,861 | 52,044 | 46,831 | 48,477 | |||||||||||||||||||||||||||
| Credit loss expense (recovery) | (69) | (601) | 240 | (1,386) | (2,071) | |||||||||||||||||||||||||||
| Net interest income after credit loss expense (recovery) | 48,851 | 52,462 | 51,804 | 48,217 | 50,548 | |||||||||||||||||||||||||||
| Non–interest Income | ||||||||||||||||||||||||||||||||
| Service charges on deposit accounts | 2,947 | 3,023 | 2,833 | 2,795 | 2,510 | |||||||||||||||||||||||||||
| Wire transfer fees | 118 | 148 | 170 | 159 | 205 | |||||||||||||||||||||||||||
| Interchange fees | 2,951 | 3,089 | 3,582 | 2,780 | 3,082 | |||||||||||||||||||||||||||
| Fiduciary activities | 1,270 | 1,203 | 1,405 | 1,503 | 1,591 | |||||||||||||||||||||||||||
| Gain on sale of mortgage loans | 1,196 | 1,441 | 2,501 | 2,027 | 4,167 | |||||||||||||||||||||||||||
| Mortgage servicing income net of impairment | 637 | 355 | 319 | 3,489 | 300 | |||||||||||||||||||||||||||
| Increase in cash value of bank owned life insurance | 751 | 814 | 519 | 510 | 547 | |||||||||||||||||||||||||||
| Death benefit on bank owned life insurance | — | — | 644 | — | — | |||||||||||||||||||||||||||
| Other income | 804 | 115 | 461 | 892 | 426 | |||||||||||||||||||||||||||
| Total non–interest income | 10,674 | 10,188 | 12,434 | 14,155 | 12,828 | |||||||||||||||||||||||||||
| Non–interest expense | ||||||||||||||||||||||||||||||||
| Salaries and employee benefits | 19,978 | 20,613 | 19,957 | 19,735 | 20,549 | |||||||||||||||||||||||||||
| Net occupancy expenses | 3,279 | 3,293 | 3,190 | 3,561 | 3,204 | |||||||||||||||||||||||||||
| Data processing | 2,884 | 2,539 | 2,607 | 2,537 | 2,672 | |||||||||||||||||||||||||||
| Professional fees | 694 | 552 | 283 | 314 | 562 | |||||||||||||||||||||||||||
| Outside services and consultants | 2,985 | 2,855 | 2,485 | 2,525 | 2,197 | |||||||||||||||||||||||||||
| Loan expense | 1,281 | 1,392 | 1,533 | 1,205 | 1,304 | |||||||||||||||||||||||||||
| FDIC insurance expense | 388 | 670 | 775 | 725 | 798 | |||||||||||||||||||||||||||
| Other losses | 118 | 398 | 362 | 168 | 1,925 | |||||||||||||||||||||||||||
| Other expenses | 4,104 | 4,504 | 4,212 | 4,500 | 4,660 | |||||||||||||||||||||||||||
| Total non–interest expense | 35,711 | 36,816 | 35,404 | 35,270 | 37,871 | |||||||||||||||||||||||||||
| Income before income taxes | 23,814 | 25,834 | 28,834 | 27,102 | 25,505 | |||||||||||||||||||||||||||
| Income tax expense | 2,649 | 2,013 | 3,975 | 3,539 | 4,080 | |||||||||||||||||||||||||||
| Net income | $ | 21,165 | $ | 23,821 | $ | 24,859 | $ | 23,563 | $ | 21,425 | ||||||||||||||||||||||
| Basic earnings per share | $ | 0.49 | $ | 0.55 | $ | 0.57 | $ | 0.54 | $ | 0.49 | ||||||||||||||||||||||
| Diluted earnings per share | 0.48 | 0.55 | 0.57 | 0.54 | 0.49 | |||||||||||||||||||||||||||
| Condensed Consolidated Statements of Income | ||||||||||||||
| (Dollars in Thousands Except Per Share Data, Unaudited) | ||||||||||||||
| Twelve Months Ended | ||||||||||||||
| December 31, | December 31, | |||||||||||||
| 2022 | 2021 | |||||||||||||
| Interest income | ||||||||||||||
| Loans receivable | $ | 173,500 | $ | 155,732 | ||||||||||
| Investment securities – taxable | 33,508 | 15,132 | ||||||||||||
| Investment securities – non–taxable | 29,025 | 23,246 | ||||||||||||
| Total interest income | 236,033 | 194,110 | ||||||||||||
| Interest expense | ||||||||||||||
| Deposits | 17,809 | 7,867 | ||||||||||||
| Borrowed funds | 12,465 | 4,701 | ||||||||||||
| Subordinated notes | 3,522 | 3,522 | ||||||||||||
| Junior subordinated debentures issued to capital trusts | 2,719 | 2,215 | ||||||||||||
| Total interest expense | 36,515 | 18,305 | ||||||||||||
| Net interest income | 199,518 | 175,805 | ||||||||||||
| Credit loss expense (recovery) | (1,816) | (2,084) | ||||||||||||
| Net interest income after credit loss expense (recovery) | 201,334 | 177,889 | ||||||||||||
| Non–interest Income | ||||||||||||||
| Service charges on deposit accounts | 11,598 | 9,192 | ||||||||||||
| Wire transfer fees | 595 | 892 | ||||||||||||
| Interchange fees | 12,402 | 10,901 | ||||||||||||
| Fiduciary activities | 5,381 | 7,419 | ||||||||||||
| Gains / (losses) on sale of investment securities | — | 914 | ||||||||||||
| Gain on sale of mortgage loans | 7,165 | 19,163 | ||||||||||||
| Mortgage servicing income net of impairment | 4,800 | 2,352 | ||||||||||||
| Increase in cash value of bank owned life insurance | 2,594 | 2,094 | ||||||||||||
| Death benefit on bank owned life insurance | 644 | 783 | ||||||||||||
| Other income | 2,272 | 4,242 | ||||||||||||
| Total non–interest income | 47,451 | 57,952 | ||||||||||||
| Non–interest expense | ||||||||||||||
| Salaries and employee benefits | 80,283 | 74,051 | ||||||||||||
| Net occupancy expenses | 13,323 | 12,541 | ||||||||||||
| Data processing | 10,567 | 9,962 | ||||||||||||
| Professional fees | 1,843 | 2,216 | ||||||||||||
| Outside services and consultants | 10,850 | 8,449 | ||||||||||||
| Loan expense | 5,411 | 5,492 | ||||||||||||
| FDIC insurance expense | 2,558 | 2,377 | ||||||||||||
| Other losses | 1,046 | 2,283 | ||||||||||||
| Other expenses | 17,320 | 16,023 | ||||||||||||
| Total non–interest expense | 143,201 | 133,394 | ||||||||||||
| Income before income taxes | 105,584 | 102,447 | ||||||||||||
| Income tax expense | 12,176 | 15,356 | ||||||||||||
| Net income | $ | 93,408 | $ | 87,091 | ||||||||||
| Basic earnings per share | $ | 2.14 | $ | 1.99 | ||||||||||
| Diluted earnings per share | 2.14 | 1.98 | ||||||||||||
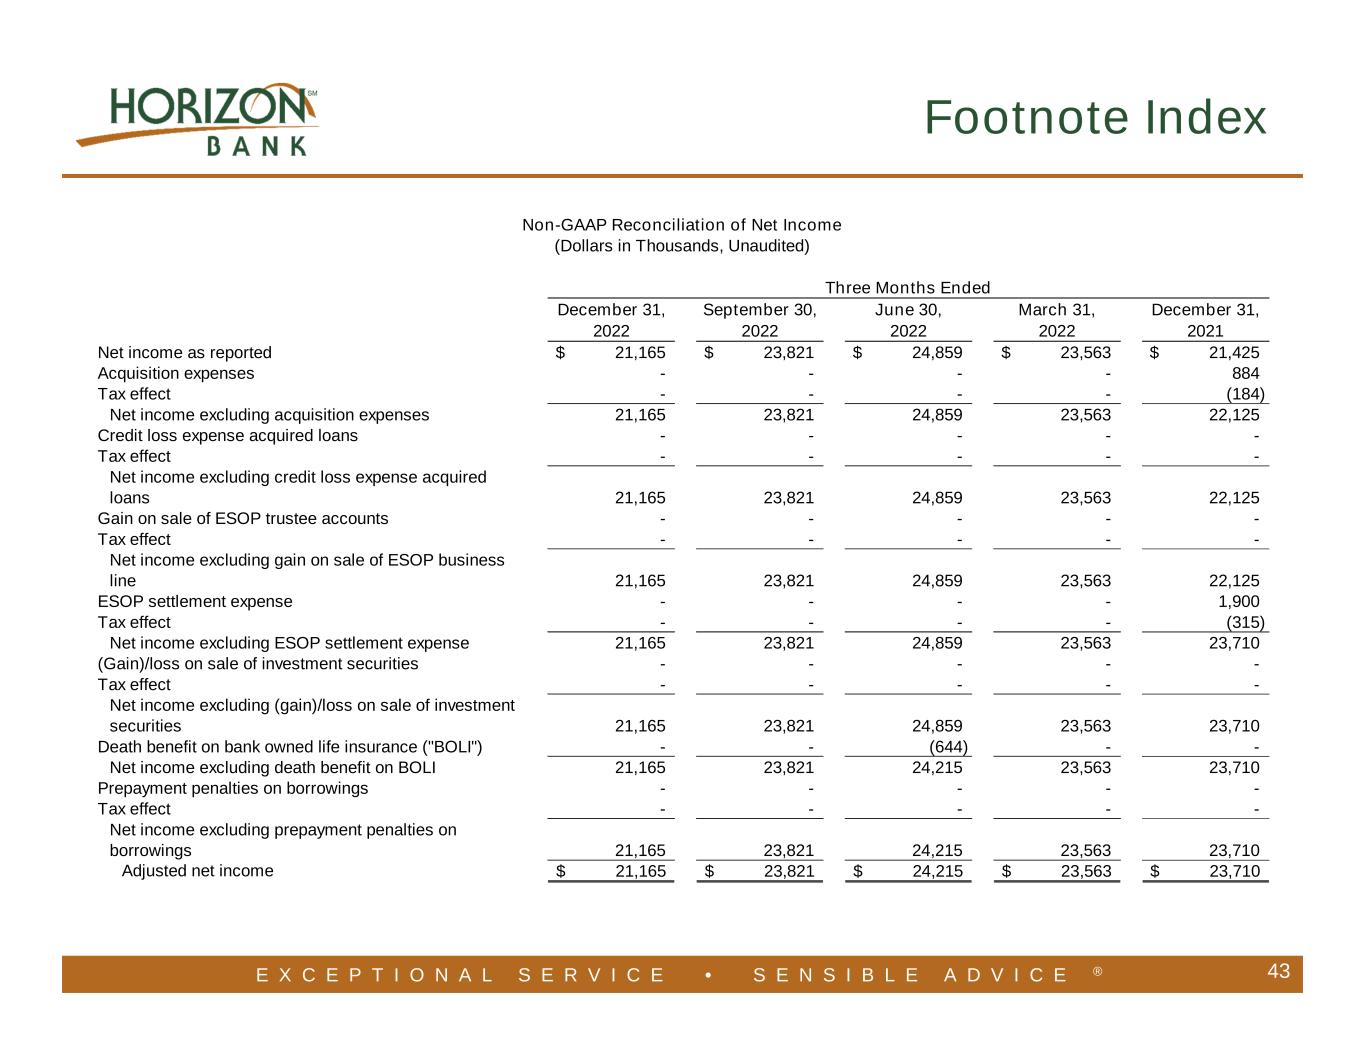
| Non–GAAP Reconciliation of Net Income | ||||||||||||||||||||||||||||||||||||||||||||
| (Dollars in Thousands, Unaudited) | ||||||||||||||||||||||||||||||||||||||||||||
| Three Months Ended | Twelve Months Ended | |||||||||||||||||||||||||||||||||||||||||||
| December 31, | September 30, | June 30, | March 31, | December 31, | December 31, | December 31, | ||||||||||||||||||||||||||||||||||||||
| 2022 | 2022 | 2022 | 2022 | 2021 | 2022 | 2021 | ||||||||||||||||||||||||||||||||||||||
| Net income as reported | $ | 21,165 | $ | 23,821 | $ | 24,859 | $ | 23,563 | $ | 21,425 | $ | 93,408 | $ | 87,091 | ||||||||||||||||||||||||||||||
| Acquisition expenses | — | — | — | — | 884 | — | 1,925 | |||||||||||||||||||||||||||||||||||||
| Tax effect | — | — | — | — | (184) | — | (401) | |||||||||||||||||||||||||||||||||||||
| Net income excluding acquisition expenses | 21,165 | 23,821 | 24,859 | 23,563 | 22,125 | 93,408 | 88,615 | |||||||||||||||||||||||||||||||||||||
| Credit loss expense acquired loans | — | — | — | — | — | — | 2,034 | |||||||||||||||||||||||||||||||||||||
| Tax effect | — | — | — | — | — | — | (427) | |||||||||||||||||||||||||||||||||||||
| Net income excluding credit loss expense acquired loans | 21,165 | 23,821 | 24,859 | 23,563 | 22,125 | 93,408 | 90,222 | |||||||||||||||||||||||||||||||||||||
| Gain on sale of ESOP trustee accounts | — | — | — | — | — | — | (2,329) | |||||||||||||||||||||||||||||||||||||
| Tax effect | — | — | — | — | — | — | 489 | |||||||||||||||||||||||||||||||||||||
| Net income excluding gain on sale of ESOP trustee accounts | 21,165 | 23,821 | 24,859 | 23,563 | 22,125 | 93,408 | 88,382 | |||||||||||||||||||||||||||||||||||||
| ESOP settlement expenses | — | — | — | — | 1,900 | — | 1,900 | |||||||||||||||||||||||||||||||||||||
| Tax effect | — | — | — | — | (315) | — | (315) | |||||||||||||||||||||||||||||||||||||
| Net income excluding ESOP settlement expenses | 21,165 | 23,821 | 24,859 | 23,563 | 23,710 | 93,408 | 89,967 | |||||||||||||||||||||||||||||||||||||
| (Gain) / loss on sale of investment securities | — | — | — | — | — | — | (914) | |||||||||||||||||||||||||||||||||||||
| Tax effect | — | — | — | — | — | — | 192 | |||||||||||||||||||||||||||||||||||||
| Net income excluding (gain) / loss on sale of investment securities | 21,165 | 23,821 | 24,859 | 23,563 | 23,710 | 93,408 | 89,245 | |||||||||||||||||||||||||||||||||||||
| Death benefit on bank owned life insurance (“BOLI”) | — | — | (644) | — | — | (644) | (783) | |||||||||||||||||||||||||||||||||||||
| Net income excluding death benefit on BOLI | 21,165 | 23,821 | 24,215 | 23,563 | 23,710 | 92,764 | 88,462 | |||||||||||||||||||||||||||||||||||||
| Prepayment penalties on borrowings | — | — | — | — | — | — | 125 | |||||||||||||||||||||||||||||||||||||
| Tax effect | — | — | — | — | — | — | (26) | |||||||||||||||||||||||||||||||||||||
| Net income excluding prepayment penalties on borrowings | 21,165 | 23,821 | 24,215 | 23,563 | 23,710 | 92,764 | 88,561 | |||||||||||||||||||||||||||||||||||||
| Adjusted net income | $ | 21,165 | $ | 23,821 | $ | 24,215 | $ | 23,563 | $ | 23,710 | $ | 92,764 | $ | 88,561 | ||||||||||||||||||||||||||||||
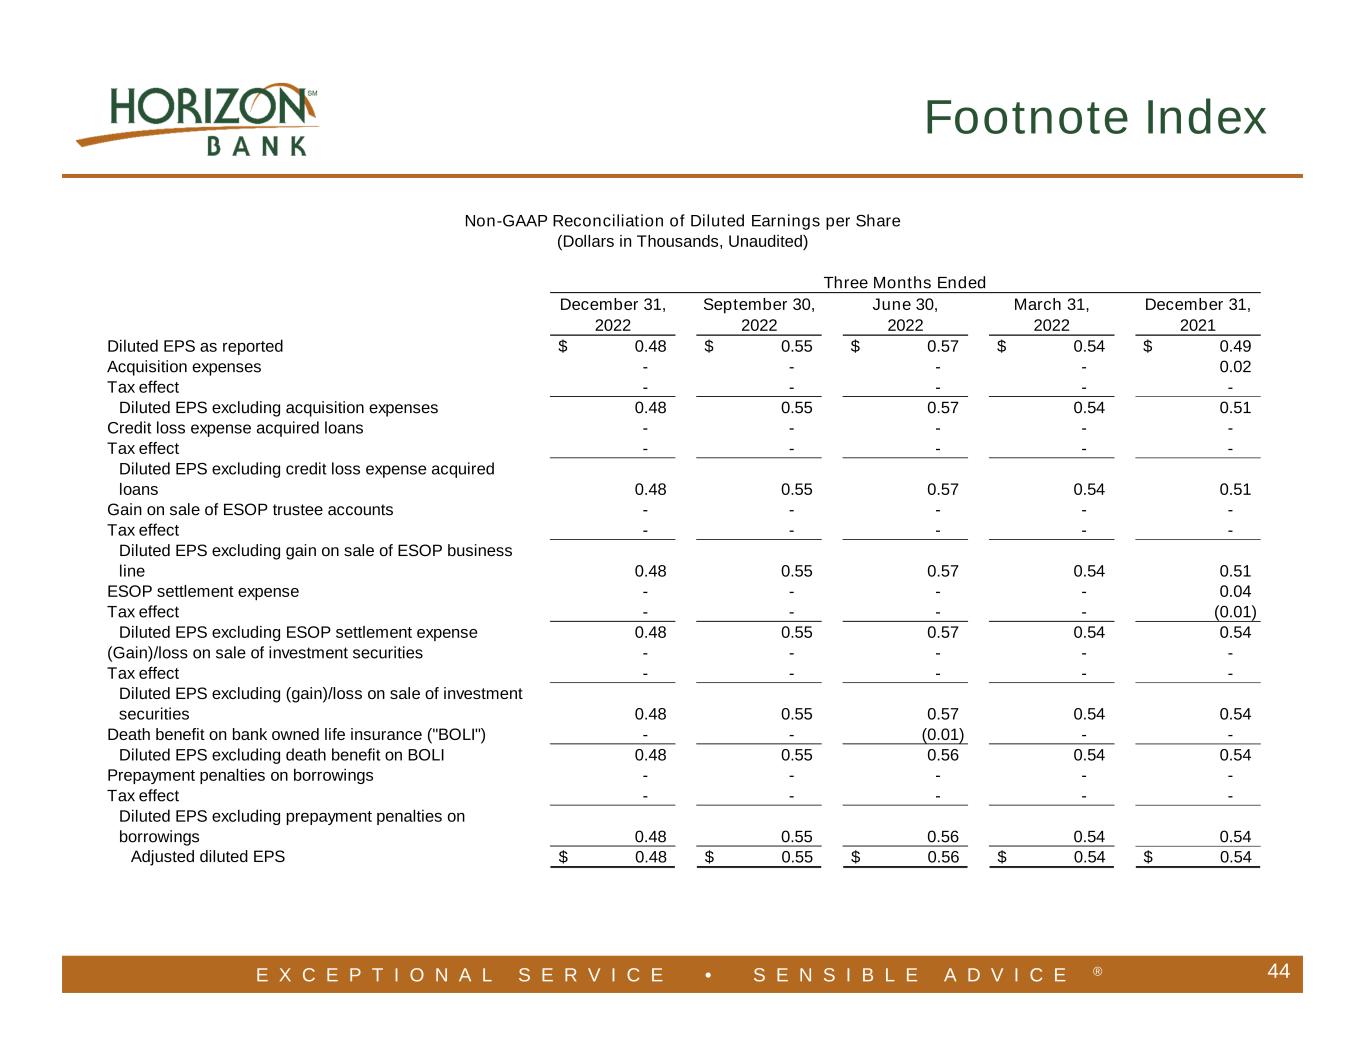
| Non–GAAP Reconciliation of Diluted Earnings per Share | ||||||||||||||||||||||||||||||||||||||||||||
| (Dollars in Thousands, Unaudited) | ||||||||||||||||||||||||||||||||||||||||||||
| Three Months Ended | Twelve Months Ended | |||||||||||||||||||||||||||||||||||||||||||
| December 31, | September 30, | June 30, | March 31, | December 31, | December 31, | December 31, | ||||||||||||||||||||||||||||||||||||||
| 2022 | 2022 | 2022 | 2022 | 2021 | 2022 | 2021 | ||||||||||||||||||||||||||||||||||||||
| Diluted earnings per share (“EPS”) as reported | $ | 0.48 | $ | 0.55 | $ | 0.57 | $ | 0.54 | $ | 0.49 | $ | 2.14 | $ | 1.98 | ||||||||||||||||||||||||||||||
| Acquisition expenses | — | — | — | — | 0.02 | — | 0.04 | |||||||||||||||||||||||||||||||||||||
| Tax effect | — | — | — | — | — | — | — | |||||||||||||||||||||||||||||||||||||
| Diluted EPS excluding acquisition expenses | 0.48 | 0.55 | 0.57 | 0.54 | 0.51 | 2.14 | 2.02 | |||||||||||||||||||||||||||||||||||||
| Credit loss expense acquired loans | — | — | — | — | — | — | 0.05 | |||||||||||||||||||||||||||||||||||||
| Tax effect | — | — | — | — | — | — | (0.01) | |||||||||||||||||||||||||||||||||||||
| Diluted EPS excluding credit loss expense acquired loans | 0.48 | 0.55 | 0.57 | 0.54 | 0.51 | 2.14 | 2.06 | |||||||||||||||||||||||||||||||||||||
| Gain on sale of ESOP trustee accounts | — | — | — | — | — | — | (0.05) | |||||||||||||||||||||||||||||||||||||
| Tax effect | — | — | — | — | — | — | 0.01 | |||||||||||||||||||||||||||||||||||||
| Diluted EPS excluding gain on sale of ESOP trustee accounts | 0.48 | 0.55 | 0.57 | 0.54 | 0.51 | 2.14 | 2.02 | |||||||||||||||||||||||||||||||||||||
| ESOP settlement expenses | — | — | — | — | 0.04 | — | 0.04 | |||||||||||||||||||||||||||||||||||||
| Tax effect | — | — | — | — | (0.01) | — | (0.01) | |||||||||||||||||||||||||||||||||||||
| Diluted EPS excluding ESOP settlement expenses | 0.48 | 0.55 | 0.57 | 0.54 | 0.54 | 2.14 | 2.05 | |||||||||||||||||||||||||||||||||||||
| (Gain) / loss on sale of investment securities | — | — | — | — | — | — | (0.02) | |||||||||||||||||||||||||||||||||||||
| Tax effect | — | — | — | — | — | — | — | |||||||||||||||||||||||||||||||||||||
| Diluted EPS excluding (gain) / loss on sale of investment securities | 0.48 | 0.55 | 0.57 | 0.54 | 0.54 | 2.14 | 2.03 | |||||||||||||||||||||||||||||||||||||
| Death benefit on bank owned life insurance (“BOLI”) | — | — | (0.01) | — | — | (0.01) | (0.03) | |||||||||||||||||||||||||||||||||||||
| Diluted EPS excluding death benefit on BOLI | 0.48 | 0.55 | 0.56 | 0.54 | 0.54 | 2.13 | 2.00 | |||||||||||||||||||||||||||||||||||||
| Prepayment penalties on borrowings | — | — | — | — | — | — | — | |||||||||||||||||||||||||||||||||||||
| Tax effect | — | — | — | — | — | — | — | |||||||||||||||||||||||||||||||||||||
| Diluted EPS excluding prepayment penalties on borrowings | 0.48 | 0.55 | 0.56 | 0.54 | 0.54 | 2.13 | 2.00 | |||||||||||||||||||||||||||||||||||||
| Adjusted diluted EPS | $ | 0.48 | $ | 0.55 | $ | 0.56 | $ | 0.54 | $ | 0.54 | $ | 2.13 | $ | 2.00 | ||||||||||||||||||||||||||||||
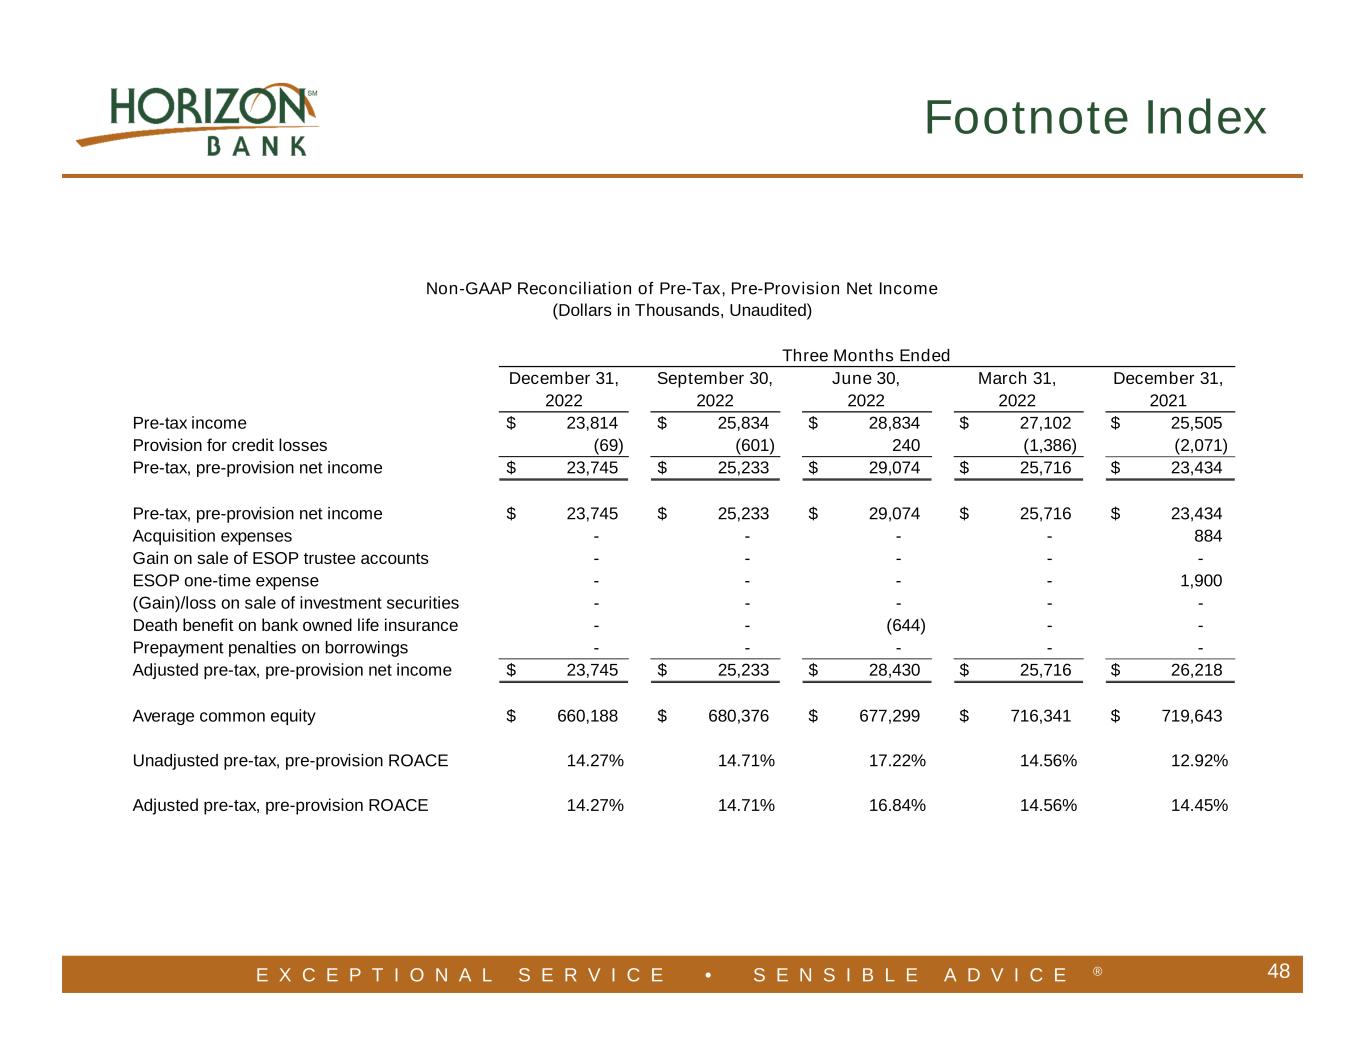
| Non–GAAP Reconciliation of Pre–Tax, Pre–Provision Income | ||||||||||||||||||||||||||||||||||||||||||||
| (Dollars in Thousands, Unaudited) | ||||||||||||||||||||||||||||||||||||||||||||
| Three Months Ended | Twelve Months Ended | |||||||||||||||||||||||||||||||||||||||||||
| December 31, | September 30, | June 30, | March 31, | December 31, | December 31, | December 31, | ||||||||||||||||||||||||||||||||||||||
| 2022 | 2022 | 2022 | 2022 | 2021 | 2022 | 2021 | ||||||||||||||||||||||||||||||||||||||
| Pre–tax income | $ | 23,814 | $ | 25,834 | $ | 28,834 | $ | 27,102 | $ | 25,505 | $ | 105,584 | $ | 102,447 | ||||||||||||||||||||||||||||||
| Credit loss expense | (69) | (601) | 240 | (1,386) | (2,071) | (1,816) | (2,084) | |||||||||||||||||||||||||||||||||||||
| Pre–tax, pre–provision income | $ | 23,745 | $ | 25,233 | $ | 29,074 | $ | 25,716 | $ | 23,434 | $ | 103,768 | $ | 100,363 | ||||||||||||||||||||||||||||||
| Pre–tax, pre–provision income | $ | 23,745 | $ | 25,233 | $ | 29,074 | $ | 25,716 | $ | 23,434 | $ | 103,768 | $ | 100,363 | ||||||||||||||||||||||||||||||
| Acquisition expenses | — | — | — | — | 884 | — | 1,925 | |||||||||||||||||||||||||||||||||||||
| Gain on sale of ESOP trustee accounts | — | — | — | — | — | — | (2,329) | |||||||||||||||||||||||||||||||||||||
| ESOP settlement expenses | — | — | — | — | 1,900 | — | 1,900 | |||||||||||||||||||||||||||||||||||||
| (Gain) / loss on sale of investment securities | — | — | — | — | — | — | (914) | |||||||||||||||||||||||||||||||||||||
| Death benefit on BOLI | — | — | (644) | — | — | (644) | (783) | |||||||||||||||||||||||||||||||||||||
| Prepayment penalties on borrowings | — | — | — | — | — | — | 125 | |||||||||||||||||||||||||||||||||||||
| Adjusted pre–tax, pre–provision income | $ | 23,745 | $ | 25,233 | $ | 28,430 | $ | 25,716 | $ | 26,218 | $ | 103,124 | $ | 100,162 | ||||||||||||||||||||||||||||||
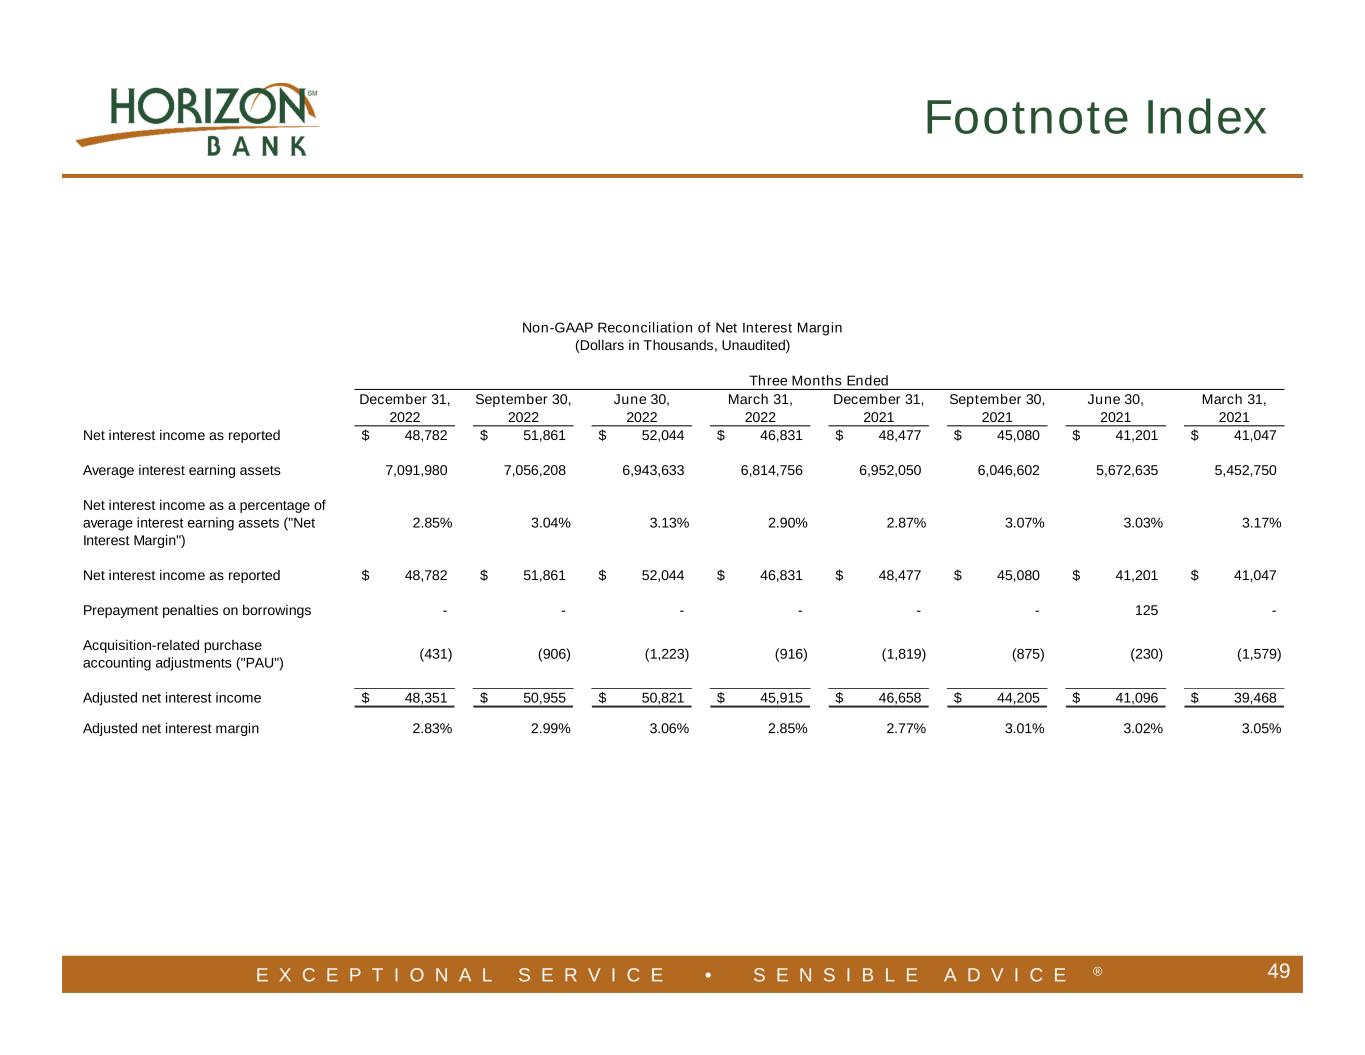
| Non–GAAP Reconciliation of Net Interest Margin | ||||||||||||||||||||||||||||||||||||||||||||
| (Dollars in Thousands, Unaudited) | ||||||||||||||||||||||||||||||||||||||||||||
| Three Months Ended | Twelve Months Ended | |||||||||||||||||||||||||||||||||||||||||||
| December 31, | September 30, | June 30, | March 31, | December 31, | December 31, | December 31, | ||||||||||||||||||||||||||||||||||||||
| 2022 | 2022 | 2022 | 2022 | 2021 | 2022 | 2021 | ||||||||||||||||||||||||||||||||||||||
| Net interest income as reported | $ | 48,782 | $ | 51,861 | $ | 52,044 | $ | 46,831 | $ | 48,477 | $ | 199,518 | $ | 175,805 | ||||||||||||||||||||||||||||||
| Average interest earning assets | 7,091,980 | 7,056,208 | 6,943,633 | 6,814,756 | 6,952,050 | 6,977,407 | 6,035,161 | |||||||||||||||||||||||||||||||||||||
| Net interest income as a percentage of average interest earning assets (“Net Interest Margin”) | 2.85 | % | 3.04 | % | 3.13 | % | 2.90 | % | 2.87 | % | 2.98 | % | 3.03 | % | ||||||||||||||||||||||||||||||
| Net interest income as reported | $ | 48,782 | $ | 51,861 | $ | 52,044 | $ | 46,831 | $ | 48,477 | $ | 199,518 | $ | 175,805 | ||||||||||||||||||||||||||||||
| Acquisition–related purchase accounting adjustments (“PAUs”) | (431) | (906) | (1,223) | (916) | (1,819) | (3,476) | (4,503) | |||||||||||||||||||||||||||||||||||||
| Prepayment penalties on borrowings | — | — | — | — | — | — | 125 | |||||||||||||||||||||||||||||||||||||
| Adjusted net interest income | $ | 48,351 | $ | 50,955 | $ | 50,821 | $ | 45,915 | $ | 46,658 | $ | 196,042 | $ | 171,302 | ||||||||||||||||||||||||||||||
| Adjusted net interest margin | 2.83 | % | 2.99 | % | 3.06 | % | 2.85 | % | 2.77 | % | 2.93 | % | 2.96 | % | ||||||||||||||||||||||||||||||
| Non–GAAP Reconciliation of Tangible Stockholders’ Equity and Tangible Book Value per Share | ||||||||||||||||||||||||||||||||
| (Dollars in Thousands, Unaudited) | ||||||||||||||||||||||||||||||||
| December 31, | September 30, | June 30, | March 31, | December 31, | ||||||||||||||||||||||||||||
| 2022 | 2022 | 2022 | 2022 | 2021 | ||||||||||||||||||||||||||||
| Total stockholders’ equity | $ | 677,375 | $ | 644,993 | $ | 657,865 | $ | 677,450 | $ | 723,209 | ||||||||||||||||||||||
| Less: Intangible assets | 172,450 | 173,375 | 173,662 | 174,588 | 175,513 | |||||||||||||||||||||||||||
| Total tangible stockholders’ equity | $ | 504,925 | $ | 471,618 | $ | 484,203 | $ | 502,862 | $ | 547,696 | ||||||||||||||||||||||
| Common shares outstanding | 43,574,151 | 43,574,151 | 43,572,796 | 43,572,796 | 43,547,942 | |||||||||||||||||||||||||||
| Book value per common share | $ | 15.55 | $ | 14.80 | $ | 15.10 | $ | 15.55 | $ | 16.61 | ||||||||||||||||||||||
| Tangible book value per common share | $ | 11.59 | $ | 10.82 | $ | 11.11 | $ | 11.54 | $ | 12.58 | ||||||||||||||||||||||
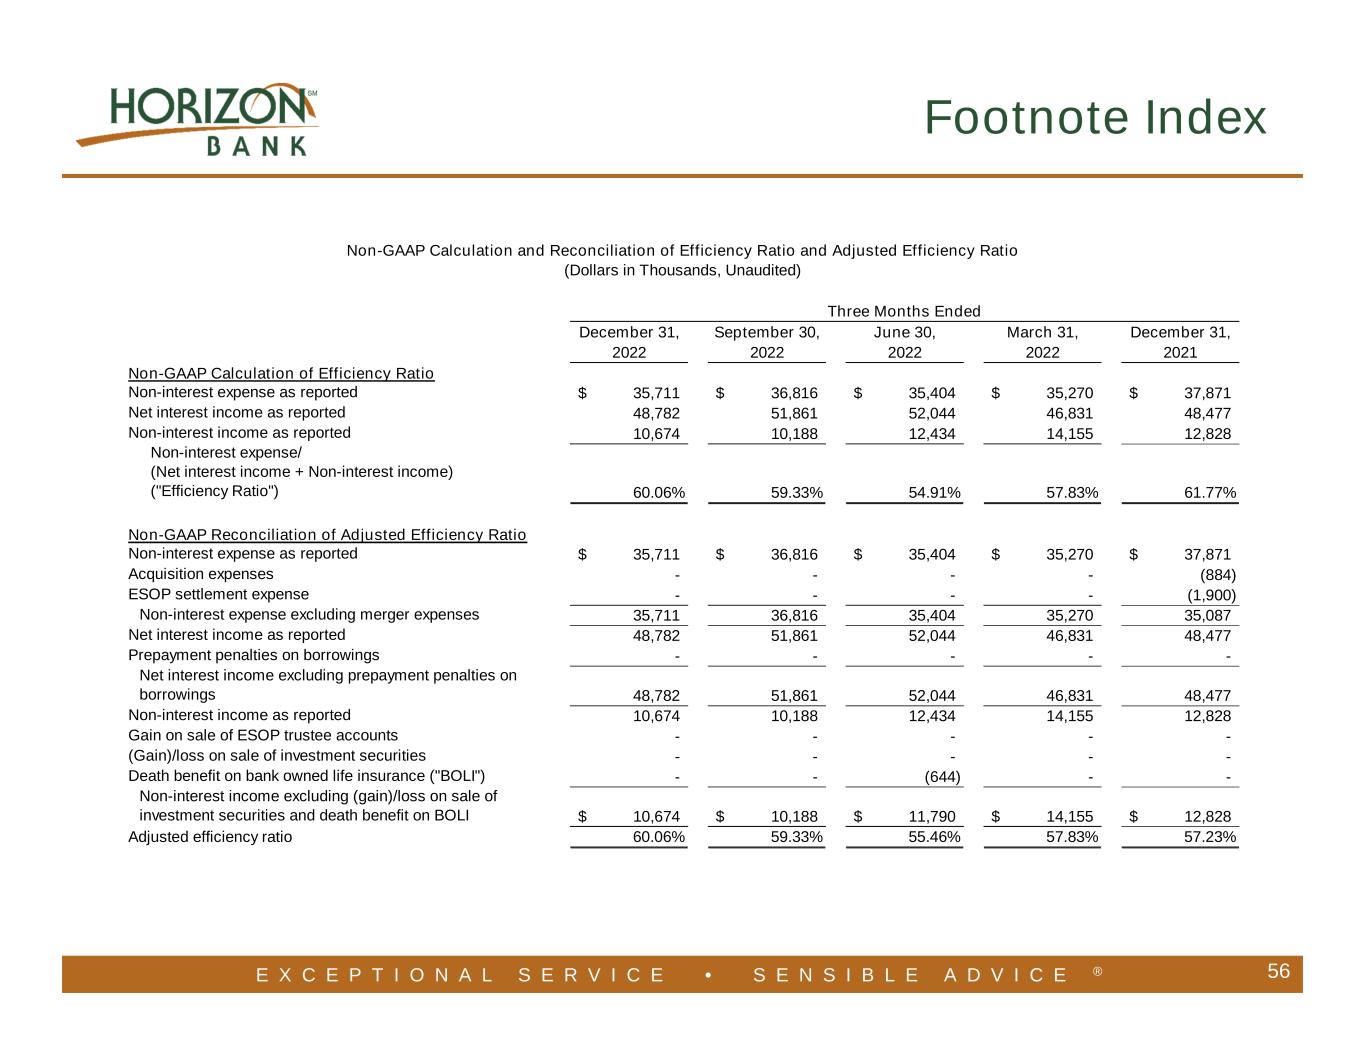
| Non–GAAP Calculation and Reconciliation of Efficiency Ratio and Adjusted Efficiency Ratio | ||||||||||||||||||||||||||||||||||||||||||||
| (Dollars in Thousands, Unaudited) | ||||||||||||||||||||||||||||||||||||||||||||
| Three Months Ended | Twelve Months Ended | |||||||||||||||||||||||||||||||||||||||||||
| December 31, | September 30, | June 30, | March 31, | December 31, | December 31, | December 31, | ||||||||||||||||||||||||||||||||||||||
| 2022 | 2022 | 2022 | 2022 | 2021 | 2022 | 2021 | ||||||||||||||||||||||||||||||||||||||
| Non–interest expense as reported | $ | 35,711 | $ | 36,816 | $ | 35,404 | $ | 35,270 | $ | 37,871 | $ | 143,201 | $ | 133,394 | ||||||||||||||||||||||||||||||
| Net interest income as reported | 48,782 | 51,861 | 52,044 | 46,831 | 48,477 | 199,518 | 175,805 | |||||||||||||||||||||||||||||||||||||
| Non–interest income as reported | $ | 10,674 | $ | 10,188 | $ | 12,434 | $ | 14,155 | $ | 12,828 | $ | 47,451 | $ | 57,952 | ||||||||||||||||||||||||||||||
| Non–interest expense / (Net interest income + Non–interest income) (“Efficiency Ratio”) |
60.06 | % | 59.33 | % | 54.91 | % | 57.83 | % | 61.77 | % | 57.98 | % | 57.07 | % | ||||||||||||||||||||||||||||||
| Non–interest expense as reported | $ | 35,711 | $ | 36,816 | $ | 35,404 | $ | 35,270 | $ | 37,871 | $ | 143,201 | $ | 133,394 | ||||||||||||||||||||||||||||||
| Acquisition expenses | — | — | — | — | (884) | — | (1,925) | |||||||||||||||||||||||||||||||||||||
| ESOP settlement expenses | — | — | — | — | (1,900) | — | (1,900) | |||||||||||||||||||||||||||||||||||||
| Non–interest expense excluding acquisition expenses and ESOP settlement expenses | 35,711 | 36,816 | 35,404 | 35,270 | 35,087 | 143,201 | 129,569 | |||||||||||||||||||||||||||||||||||||
| Net interest income as reported | 48,782 | 51,861 | 52,044 | 46,831 | 48,477 | 199,518 | 175,805 | |||||||||||||||||||||||||||||||||||||
| Prepayment penalties on borrowings | — | — | — | — | — | — | 125 | |||||||||||||||||||||||||||||||||||||
| Net interest income excluding prepayment penalties on borrowings | 48,782 | 51,861 | 52,044 | 46,831 | 48,477 | 199,518 | 175,930 | |||||||||||||||||||||||||||||||||||||
| Non–interest income as reported | 10,674 | 10,188 | 12,434 | 14,155 | 12,828 | 47,451 | 57,952 | |||||||||||||||||||||||||||||||||||||
| Gain on sale of ESOP trustee accounts | — | — | — | — | — | — | (2,329) | |||||||||||||||||||||||||||||||||||||
| (Gain) / loss on sale of investment securities | — | — | — | — | — | — | (914) | |||||||||||||||||||||||||||||||||||||
| Death benefit on BOLI | — | — | (644) | — | — | (644) | (783) | |||||||||||||||||||||||||||||||||||||
| Non–interest income excluding (gain) / loss on sale of investment securities and death benefit on BOLI | $ | 10,674 | $ | 10,188 | $ | 11,790 | $ | 14,155 | $ | 12,828 | $ | 46,807 | $ | 53,926 | ||||||||||||||||||||||||||||||
| Adjusted efficiency ratio | 60.06 | % | 59.33 | % | 55.46 | % | 57.83 | % | 57.23 | % | 58.13 | % | 56.37 | % | ||||||||||||||||||||||||||||||
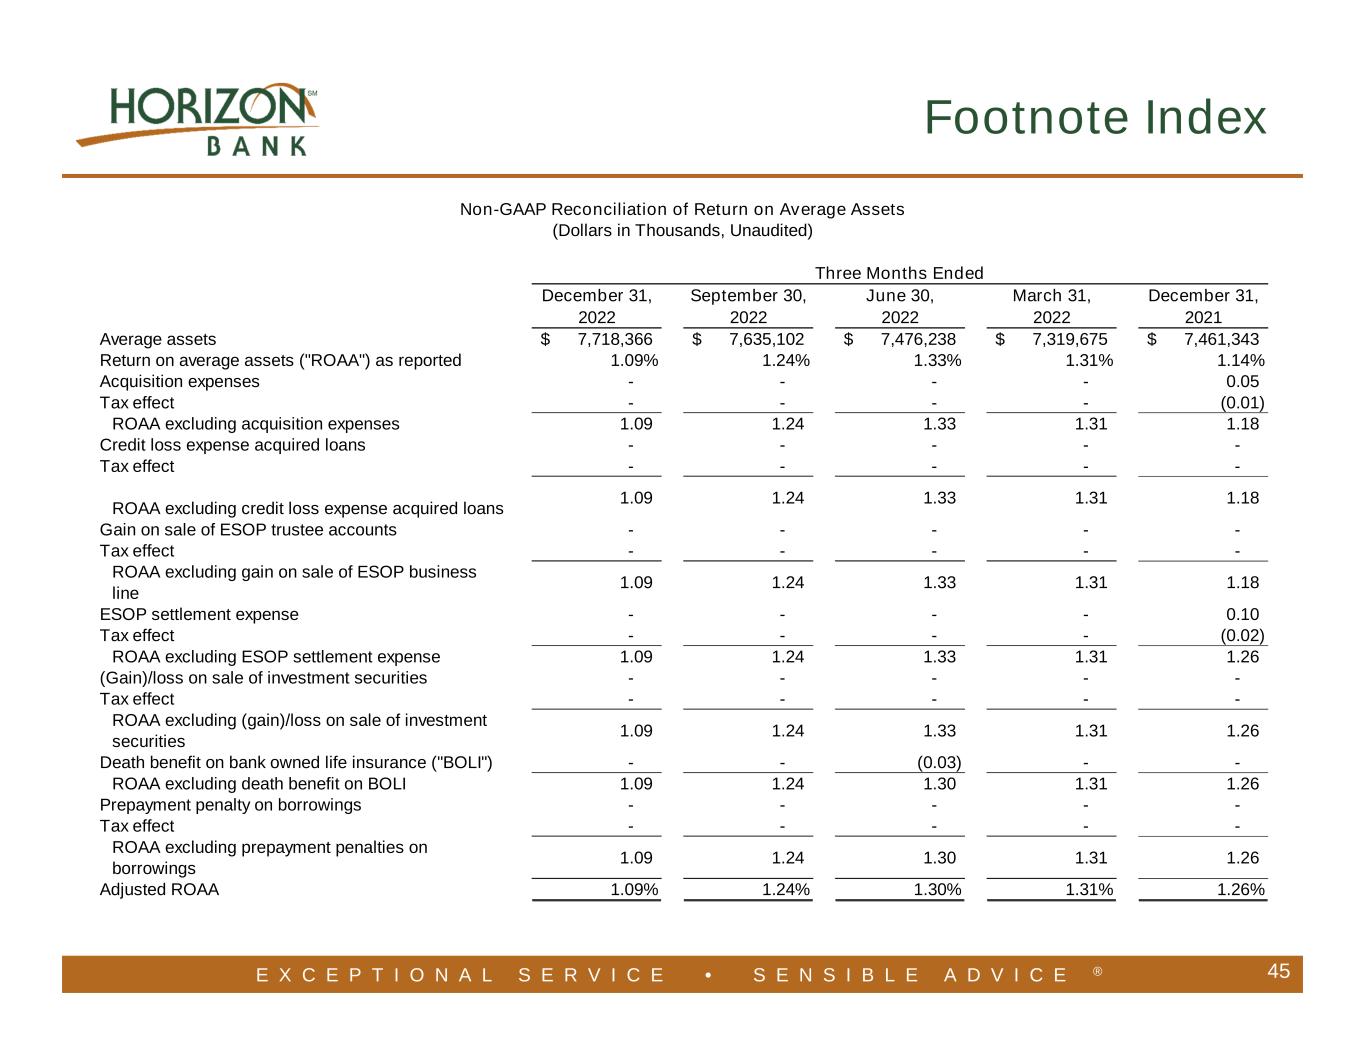
| Non–GAAP Reconciliation of Return on Average Assets | ||||||||||||||||||||||||||||||||||||||||||||
| (Dollars in Thousands, Unaudited) | ||||||||||||||||||||||||||||||||||||||||||||
| Three Months Ended | Twelve Months Ended | |||||||||||||||||||||||||||||||||||||||||||
| December 31, | September 30, | June 30, | March 31, | December 31, | December 31, | December 31, | ||||||||||||||||||||||||||||||||||||||
| 2022 | 2022 | 2022 | 2022 | 2021 | 2022 | 2021 | ||||||||||||||||||||||||||||||||||||||
| Average assets | $ | 7,718,366 | $ | 7,635,102 | $ | 7,476,238 | $ | 7,319,675 | $ | 7,461,343 | $ | 7,533,915 | $ | 6,514,251 | ||||||||||||||||||||||||||||||
| Return on average assets (“ROAA”) as reported | 1.09 | % | 1.24 | % | 1.33 | % | 1.31 | % | 1.14 | % | 1.24 | % | 1.34 | % | ||||||||||||||||||||||||||||||
| Acquisition expenses | — | — | — | — | 0.05 | — | 0.03 | |||||||||||||||||||||||||||||||||||||
| Tax effect | — | — | — | — | (0.01) | — | (0.01) | |||||||||||||||||||||||||||||||||||||
| ROAA excluding acquisition expenses | 1.09 | 1.24 | 1.33 | 1.31 | 1.18 | 1.24 | 1.36 | |||||||||||||||||||||||||||||||||||||
| Credit loss expense acquired loans | — | — | — | — | — | — | 0.03 | |||||||||||||||||||||||||||||||||||||
| Tax effect | — | — | — | — | — | — | (0.01) | |||||||||||||||||||||||||||||||||||||
| ROAA excluding credit loss expense on acquired loans | 1.09 | 1.24 | 1.33 | 1.31 | 1.18 | 1.24 | 1.38 | |||||||||||||||||||||||||||||||||||||
| Gain on sale of ESOP trustee accounts | — | — | — | — | — | — | (0.04) | |||||||||||||||||||||||||||||||||||||
| Tax effect | — | — | — | — | — | — | 0.01 | |||||||||||||||||||||||||||||||||||||
| ROAA excluding gain on sale of ESOP trustee accounts | 1.09 | 1.24 | 1.33 | 1.31 | 1.18 | 1.24 | 1.35 | |||||||||||||||||||||||||||||||||||||
| ESOP settlement expenses | — | — | — | — | 0.10 | — | 0.03 | |||||||||||||||||||||||||||||||||||||
| Tax effect | — | — | — | — | (0.02) | — | — | |||||||||||||||||||||||||||||||||||||
| ROAA excluding ESOP settlement expenses | 1.09 | 1.24 | 1.33 | 1.31 | 1.26 | 1.24 | 1.38 | |||||||||||||||||||||||||||||||||||||
| (Gain) / loss on sale of investment securities | — | — | — | — | — | — | (0.01) | |||||||||||||||||||||||||||||||||||||
| Tax effect | — | — | — | — | — | — | — | |||||||||||||||||||||||||||||||||||||
| ROAA excluding (gain) / loss on sale of investment securities | 1.09 | 1.24 | 1.33 | 1.31 | 1.26 | 1.24 | 1.37 | |||||||||||||||||||||||||||||||||||||
| Death benefit on BOLI | — | — | (0.03) | — | — | (0.01) | (0.01) | |||||||||||||||||||||||||||||||||||||
| ROAA excluding death benefit on BOLI | 1.09 | 1.24 | 1.30 | 1.31 | 1.26 | 1.23 | 1.36 | |||||||||||||||||||||||||||||||||||||
| Prepayment penalties on borrowings | — | — | — | — | — | — | — | |||||||||||||||||||||||||||||||||||||
| Tax effect | — | — | — | — | — | — | — | |||||||||||||||||||||||||||||||||||||
| ROAA excluding prepayment penalties on borrowings | 1.09 | 1.24 | 1.30 | 1.31 | 1.26 | 1.23 | 1.36 | |||||||||||||||||||||||||||||||||||||
| Adjusted ROAA | 1.09 | % | 1.24 | % | 1.30 | % | 1.31 | % | 1.26 | % | 1.23 | % | 1.36 | % | ||||||||||||||||||||||||||||||
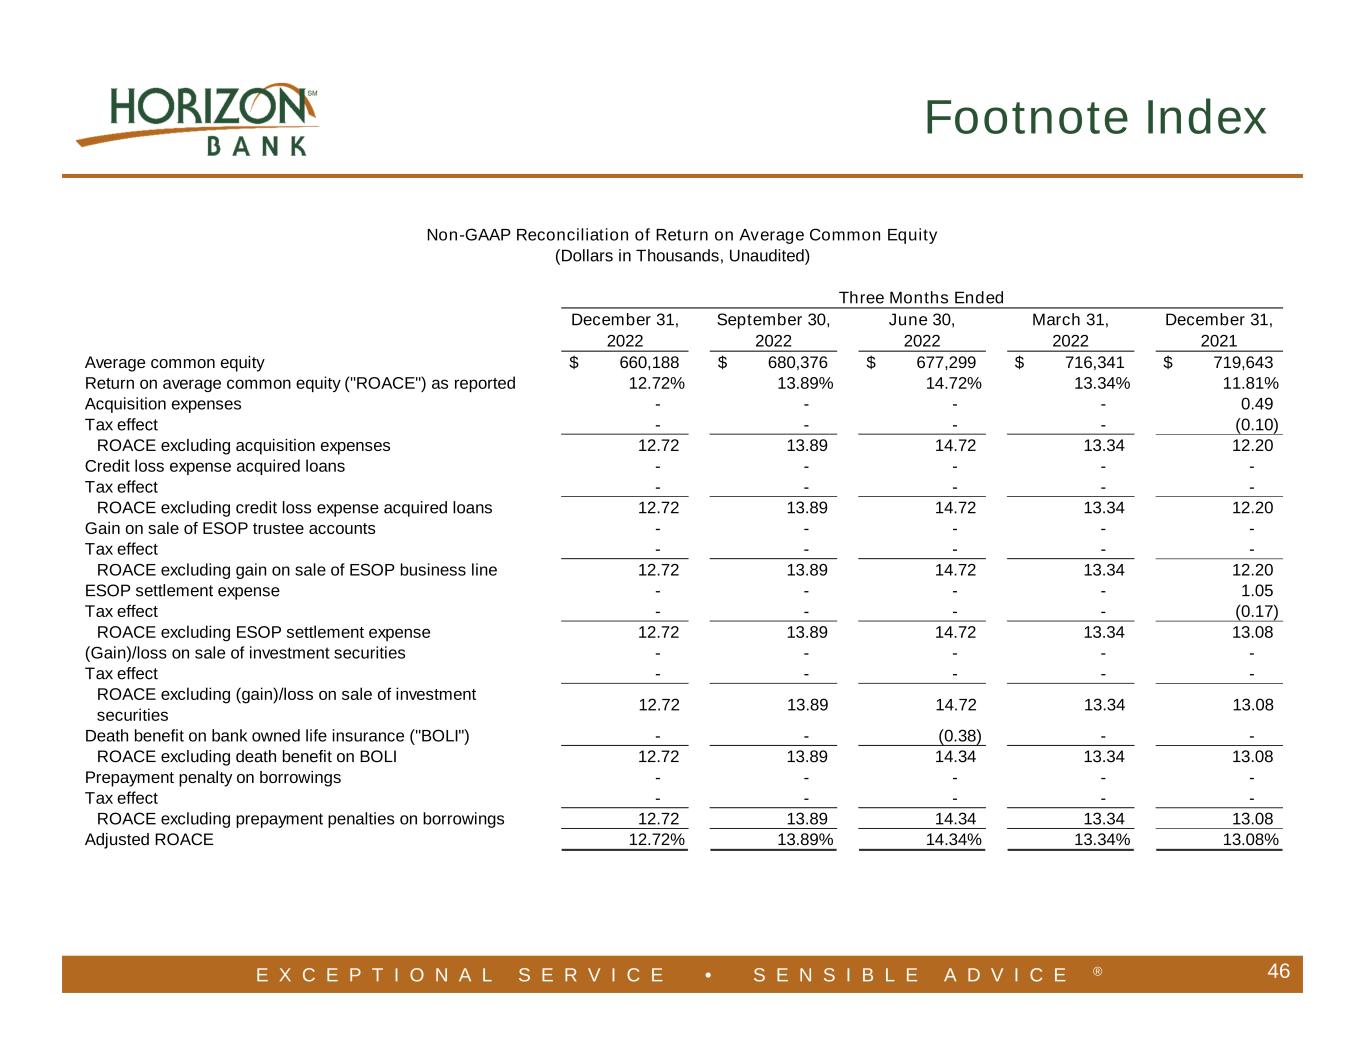
| Non–GAAP Reconciliation of Return on Average Common Equity | ||||||||||||||||||||||||||||||||||||||||||||
| (Dollars in Thousands, Unaudited) | ||||||||||||||||||||||||||||||||||||||||||||
| Three Months Ended | Twelve Months Ended | |||||||||||||||||||||||||||||||||||||||||||
| December 31, | September 30, | June 30, | March 31, | December 31, | December 31, | December 31, | ||||||||||||||||||||||||||||||||||||||
| 2022 | 2022 | 2022 | 2022 | 2021 | 2022 | 2021 | ||||||||||||||||||||||||||||||||||||||
| Average common equity | $ | 660,188 | $ | 680,376 | $ | 677,299 | $ | 716,341 | $ | 719,643 | $ | 683,630 | $ | 712,122 | ||||||||||||||||||||||||||||||
| Return on average common equity (“ROACE”) as reported | 12.72 | % | 13.89 | % | 14.72 | % | 13.34 | % | 11.81 | % | 13.66 | % | 12.23 | % | ||||||||||||||||||||||||||||||
| Acquisition expenses | — | — | — | — | 0.49 | — | 0.27 | |||||||||||||||||||||||||||||||||||||
| Tax effect | — | — | — | — | (0.10) | — | (0.06) | |||||||||||||||||||||||||||||||||||||
| ROACE excluding acquisition expenses | 12.72 | 13.89 | 14.72 | 13.34 | 12.20 | 13.66 | 12.44 | |||||||||||||||||||||||||||||||||||||
| Credit loss expense acquired loans | — | — | — | — | — | — | 0.29 | |||||||||||||||||||||||||||||||||||||
| Tax effect | — | — | — | — | — | — | (0.06) | |||||||||||||||||||||||||||||||||||||
| ROACE excluding credit loss expense acquired loans | 12.72 | 13.89 | 14.72 | 13.34 | 12.20 | 13.66 | 12.67 | |||||||||||||||||||||||||||||||||||||
| Gain on sale of ESOP trustee accounts | — | — | — | — | — | — | (0.33) | |||||||||||||||||||||||||||||||||||||
| Tax effect | — | — | — | — | — | — | 0.07 | |||||||||||||||||||||||||||||||||||||
| ROACE excluding gain on sale of ESOP trustee accounts | 12.72 | 13.89 | 14.72 | 13.34 | 12.20 | 13.66 | 12.41 | |||||||||||||||||||||||||||||||||||||
| ESOP settlement expenses | — | — | — | — | 1.05 | — | 0.27 | |||||||||||||||||||||||||||||||||||||
| Tax effect | — | — | — | — | (0.17) | — | (0.04) | |||||||||||||||||||||||||||||||||||||
| ROACE excluding ESOP settlement expenses | 12.72 | 13.89 | 14.72 | 13.34 | 13.08 | 13.66 | 12.64 | |||||||||||||||||||||||||||||||||||||
| (Gain) / loss on sale of investment securities | — | — | — | — | — | — | (0.13) | |||||||||||||||||||||||||||||||||||||
| Tax effect | — | — | — | — | — | — | 0.03 | |||||||||||||||||||||||||||||||||||||
| ROACE excluding (gain) / loss on sale of investment securities | 12.72 | 13.89 | 14.72 | 13.34 | 13.08 | 13.66 | 12.54 | |||||||||||||||||||||||||||||||||||||
| Death benefit on BOLI | — | — | (0.38) | — | — | (0.09) | (0.11) | |||||||||||||||||||||||||||||||||||||
| ROACE excluding death benefit on BOLI | 12.72 | 13.89 | 14.34 | 13.34 | 13.08 | 13.57 | 12.43 | |||||||||||||||||||||||||||||||||||||
| Prepayment penalties on borrowings | — | — | — | — | — | — | 0.02 | |||||||||||||||||||||||||||||||||||||
| Tax effect | — | — | — | — | — | — | — | |||||||||||||||||||||||||||||||||||||
| ROACE excluding prepayment penalties on borrowings | 12.72 | % | 13.89 | % | 14.34 | % | 13.34 | % | 13.08 | % | 13.57 | % | 12.45 | % | ||||||||||||||||||||||||||||||
| Adjusted ROACE | 12.72 | % | 13.89 | % | 14.34 | % | 13.34 | % | 13.08 | % | 13.57 | % | 12.45 | % | ||||||||||||||||||||||||||||||
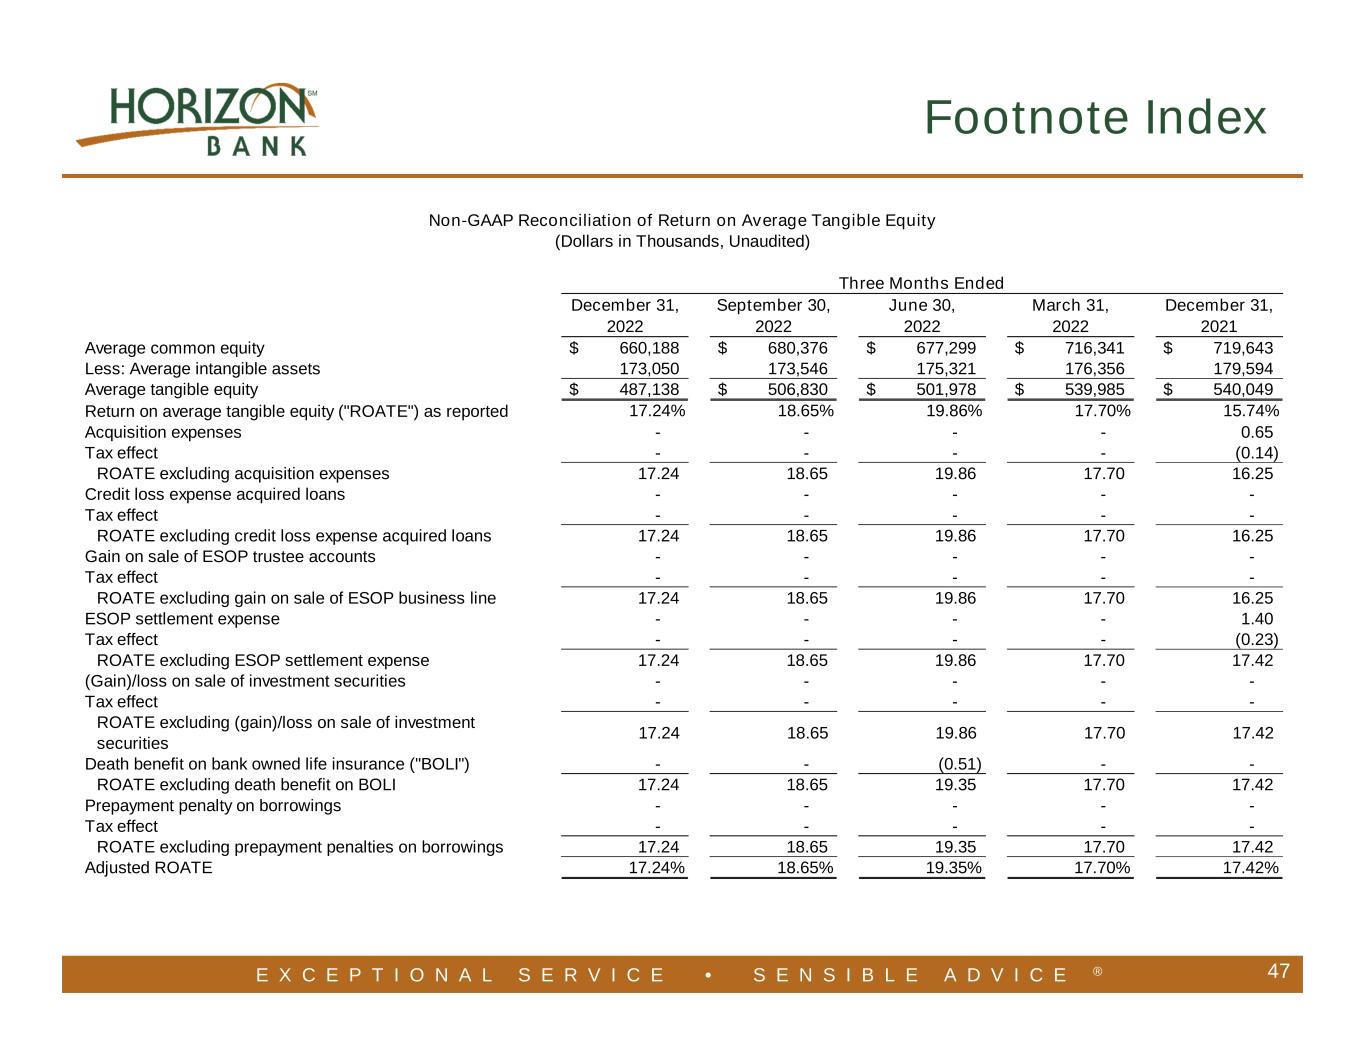
| Non–GAAP Reconciliation of Return on Average Tangible Equity | ||||||||||||||||||||||||||||||||||||||||||||
| (Dollars in Thousands, Unaudited) | ||||||||||||||||||||||||||||||||||||||||||||
| Three Months Ended | Twelve Months Ended | |||||||||||||||||||||||||||||||||||||||||||
| December 31, | September 30, | June 30, | March 31, | December 31, | December 31, | December 31, | ||||||||||||||||||||||||||||||||||||||
| 2022 | 2022 | 2022 | 2022 | 2021 | 2022 | 2021 | ||||||||||||||||||||||||||||||||||||||
| Average tangible equity | $ | 660,188 | $ | 680,376 | $ | 677,299 | $ | 716,341 | $ | 719,643 | $ | 683,630 | $ | 712,122 | ||||||||||||||||||||||||||||||
| Less: Average intangible assets | 173,050 | 173,546 | 175,321 | 176,356 | 179,594 | 174,003 | 175,811 | |||||||||||||||||||||||||||||||||||||
| Average tangible equity | $ | 487,138 | $ | 506,830 | $ | 501,978 | $ | 539,985 | $ | 540,049 | $ | 509,627 | $ | 536,311 | ||||||||||||||||||||||||||||||
| Return on average tangible equity (“ROATE”) as reported | 17.24 | % | 18.65 | % | 19.86 | % | 17.70 | % | 15.74 | % | 18.33 | % | 16.24 | % | ||||||||||||||||||||||||||||||
| Acquisition expenses | — | — | — | — | 0.65 | — | 0.36 | |||||||||||||||||||||||||||||||||||||
| Tax effect | — | — | — | — | (0.14) | — | (0.08) | |||||||||||||||||||||||||||||||||||||
| ROATE excluding acquisition expenses | 17.24 | 18.65 | 19.86 | 17.70 | 16.25 | 18.33 | 16.52 | |||||||||||||||||||||||||||||||||||||
| Credit loss expense acquired loans | — | — | — | — | — | — | 0.38 | |||||||||||||||||||||||||||||||||||||
| Tax effect | — | — | — | — | — | — | (0.08) | |||||||||||||||||||||||||||||||||||||
| ROATE excluding credit loss expense acquired loans | 17.24 | 18.65 | 19.86 | 17.70 | 16.25 | 18.33 | 16.82 | |||||||||||||||||||||||||||||||||||||
| Gain on sale of ESOP trustee accounts | — | — | — | — | — | — | (0.43) | |||||||||||||||||||||||||||||||||||||
| Tax effect | — | — | — | — | — | — | 0.10 | |||||||||||||||||||||||||||||||||||||
| ROATE excluding gain on sale of ESOP trustee accounts | 17.24 | 18.65 | 19.86 | 17.70 | 16.25 | 18.33 | 16.49 | |||||||||||||||||||||||||||||||||||||
| ESOP settlement expenses | — | — | — | — | 1.40 | — | 0.35 | |||||||||||||||||||||||||||||||||||||
| Tax effect | — | — | — | — | (0.23) | — | (0.06) | |||||||||||||||||||||||||||||||||||||
| ROATE excluding ESOP settlement expenses | 17.24 | 18.65 | 19.86 | 17.70 | 17.42 | 18.33 | 16.78 | |||||||||||||||||||||||||||||||||||||
| (Gain) / loss on sale of investment securities | — | — | — | — | — | — | (0.17) | |||||||||||||||||||||||||||||||||||||
| Tax effect | — | — | — | — | — | — | 0.04 | |||||||||||||||||||||||||||||||||||||
| ROATE excluding (gain) / loss on sale of investment securities | 17.24 | 18.65 | 19.86 | 17.70 | 17.42 | 18.33 | 16.65 | |||||||||||||||||||||||||||||||||||||
| Death benefit on BOLI | — | — | (0.51) | — | — | (0.13) | (0.15) | |||||||||||||||||||||||||||||||||||||
| ROATE excluding death benefit on BOLI | 17.24 | 18.65 | 19.35 | 17.70 | 17.42 | 18.20 | 16.50 | |||||||||||||||||||||||||||||||||||||
| Prepayment penalties on borrowings | — | — | — | — | — | — | 0.02 | |||||||||||||||||||||||||||||||||||||
| Tax effect | — | — | — | — | — | — | (0.01) | |||||||||||||||||||||||||||||||||||||
| ROATE excluding prepayment penalties on borrowings | 17.24 | % | 18.65 | % | 19.35 | % | 17.70 | % | 17.42 | % | 18.20 | % | 16.51 | % | ||||||||||||||||||||||||||||||
| Adjusted ROATE | 17.24 | % | 18.65 | % | 19.35 | % | 17.70 | % | 17.42 | % | 18.20 | % | 16.51 | % | ||||||||||||||||||||||||||||||
